the Creative Commons Attribution 4.0 License.
the Creative Commons Attribution 4.0 License.
 | 31 Aug 2021
Recent observations of superimposed ice and snow ice on sea ice in the northwestern Weddell Sea
Christian Haas
Hanno Meyer
Ilka Peeken
Thomas Krumpen
Recent low summer sea ice extent in the Weddell Sea raises questions about the contributions of dynamic and thermodynamic atmospheric and oceanic energy fluxes. The roles of snow, superimposed ice, and snow ice are particularly intriguing, as they are sensitive indicators of changes in atmospheric forcing and as they could trigger snow–albedo feedbacks that could accelerate ice melt. Here we present snow depth data and ice core observations of superimposed ice and snow ice collected in the northwestern Weddell Sea in late austral summer 2019, supplemented by airborne ice thickness measurements. Texture, salinity, and oxygen isotope analyses showed mean thicknesses of superimposed and snow ice of 0.11±0.11 and 0.22±0.22 m, respectively, or 3 % to 54 % of total ice thickness. Mean snow depths ranged between 0.46±0.29 m in the south to 0.05±0.06 m in the north, with mean and modal total ice thicknesses of 4.12±1.87 to 1.62±1.05 m and 3.9 to 0.9 m, respectively. These snow and ice properties are similar to results from previous studies, suggesting that the ice's summer surface energy balance and related seasonal transition of snow properties have changed little in past decades. This is supported by our additional analyses of the summer energy balance using atmospheric reanalysis data and by melt onset observations from satellite scatterometry showing few recent changes.
- Article
(4965 KB) - Full-text XML
- BibTeX
- EndNote


After more than 3 decades of highly variable, but slowly increasing, Antarctic summer sea ice coverage, ice extent has strongly declined between austral summer 2016/17 and 2018/19, most notably in the Weddell Sea (Parkinson, 2019; Turner et al., 2020). In the northwestern Weddell Sea, a minimum for the last decade was observed in February 2019 (see Fig. 5a below). A number of studies have related these negative ice extent anomalies to various atmospheric and oceanic processes, often related to large, negative anomalies of the Southern Annular Mode (SAM), corresponding increases in cyclonic activity, and warm anomalies of several degrees Celsius at the Antarctic Peninsula and over the Weddell Sea (e.g., Francis et al., 2020; Schlosser et al., 2018; Turner et al., 2020; Wang et al., 2019). Together, these studies concluded that these processes contributed to warmer air, increased cloud–radiation feedbacks, increased liquid precipitation, and increased turbulent heat fluxes into the ice (e.g., Francis et al., 2020). In addition, earlier seasonal sea ice retreat, anomalous surface winds, and strong atmosphere–ocean coupling caused stronger heat absorption by the upper ocean, more southward Ekman transport of warmer surface waters, and thus the warming of the ocean mixed layer, amplifying the sea ice loss (Meehl et al., 2019; Turner et al., 2020). Although these studies suggest a significant change in the coupled atmosphere–ice–ocean system in the Weddell Sea, the quantitative contribution of the individual components is not yet clear, nor is it clear how they might affect seasonal dynamic and thermodynamic sea ice properties.
The observed sea ice retreat could be caused by changes in atmospheric or oceanic thermodynamic forcing or by wind- and current-related dynamic changes in ice advection and deformation, and the processes are difficult to distinguish remotely. However, Antarctic sea ice is characterized by the occurrence of two types of snow-derived ice, namely superimposed ice and snow ice, whose presence and amounts are closely linked to the surface energy balance and ice and snow thicknesses and which are therefore sensitive to changes in atmospheric heat flux towards the ice.
Superimposed ice forms during austral spring and summer when the snow cover becomes highly metamorphic during extensive thaw–refreeze cycles and when internal snowmelt water percolates to the colder snow–ice interface where it refreezes (Haas et al., 2001; Ackley et al., 2008; Kawamura et al., 2004; Nicolaus et al., 2003). Superimposed ice therefore forms on top of the sea ice and is characterized by large-grained, polygonal crystals; negligible salinity; and low-δ18O oxygen isotope composition. In contrast to the Arctic, where summer snowmelt is rapid and triggers snow–albedo feedbacks and melt pond formation (e.g., Webster et al., 2015), in the Southern Ocean, thaw–refreeze cycles have so far been the dominant form of surface melt (Arndt and Haas, 2019). This is due to the effects of drier and cooler air which reduces the influence of clouds and leads to more heat loss by stronger sensible heat fluxes and longwave radiation cooling (Andreas and Ackley, 1982; Nicolaus et al., 2006, 2009; Vihma et al., 2009). The absence of strong surface melt allows survival of a year-round snow cover. It is unclear if the reported increases in atmospheric heat flux since 2016 (see above) have also increased snowmelt and superimposed ice formation or have even led to the appearance of melt ponds on sea ice in the northwestern Weddell Sea.
In contrast, snow ice mostly forms during winter when seawater flooding of the snow–ice interface occurs where the ice has negative freeboard, i.e., when its surface is below the water level. This occurs when the snow depth approaches or exceeds approximately one-third of the ice thickness, which is frequently observed on Antarctic sea ice due to its relatively thin ice and typically thick snow cover (Eicken et al., 1994; Jeffries et al., 1997, 2001; Tian et al., 2020). Snow ice thus forms from the refreezing of seawater-soaked snow, is therefore fine-grained and saline, and has δ18O oxygen isotope concentrations between those of superimposed ice and sea ice (e.g., Eicken, 1998; Granskog et al., 2017). Given the dependence of snow ice on ice thickness and snow depth, long-term changes in its amount could indicate increases in snow accumulation, causing more frequent flooding and less ice growth, thinner ice from warmer air or increased ocean heat flux, or both (Ledley, 1991; Eicken et al., 1995; Powell et al., 2005).
Based on the above, observations of the amounts of superimposed ice and snow ice and their long-term changes can provide invaluable information on the underlying processes. Thus, the question arises whether there are indications of increased atmospheric heat fluxes leading to changes in Antarctic sea ice mass balance and extent. Therefore, in order to evaluate changes in the amounts of superimposed ice and snow ice compared to previous studies in the same region, we conducted an intensive snow and ice sampling campaign in the northwestern Weddell Sea in late summer 2019. In this study we present results based on ice core texture, salinity, and oxygen isotope analyses and place them into a broader context by means of ice thickness and snow depth measurements, thermodynamic modeling, and backtracking of sampled floes to retrieve their age and origin. We support our ensuing discussion of decadal changes by means of analyses of the surface energy balance from reanalysis data and melt onset dates from satellite scatterometry.
2.1 Study area and on-site measurements
The data and samples of this study were collected during the interdisciplinary Weddell Sea Ice (WedIce) project on board the German icebreaker R/V Polarstern cruise PS118 (Haas et al., 2019) in the northwestern Weddell Sea in February and March 2019, i.e., at the end of the summer ablation period. Here, 14 ice floes were visited by helicopter and sampled for several hours (Fig. 1, left). At level, apparently representative locations of each floe, physical and biogeochemical ice properties were studied by comprehensive sampling of up to 10 ice cores while snow properties were measured in vertical profiles by traditional snow pits (as described in Arndt and Paul, 2018). In order to better characterize the sampled floes and their significant variability, total (snow plus ice) thickness and snow depth were measured along 400 to 1200 m long transects across all the floes with a ground-based multifrequency electromagnetic induction instrument (GEM-2, Geophex Ltd.; Hunkeler et al., 2016) and a GPS-equipped Magna Probe (Snow-Hydro, Fairbanks, AK, USA). Finally, observations were placed into a regional context by means of helicopter-borne electromagnetic (HEM) ice thickness surveys (Haas et al., 2008, 2009) with a total length of more than 2400 km covering the entire study region (Fig. 1, left). An overview of all ice stations is provided in the Appendix Table B1.
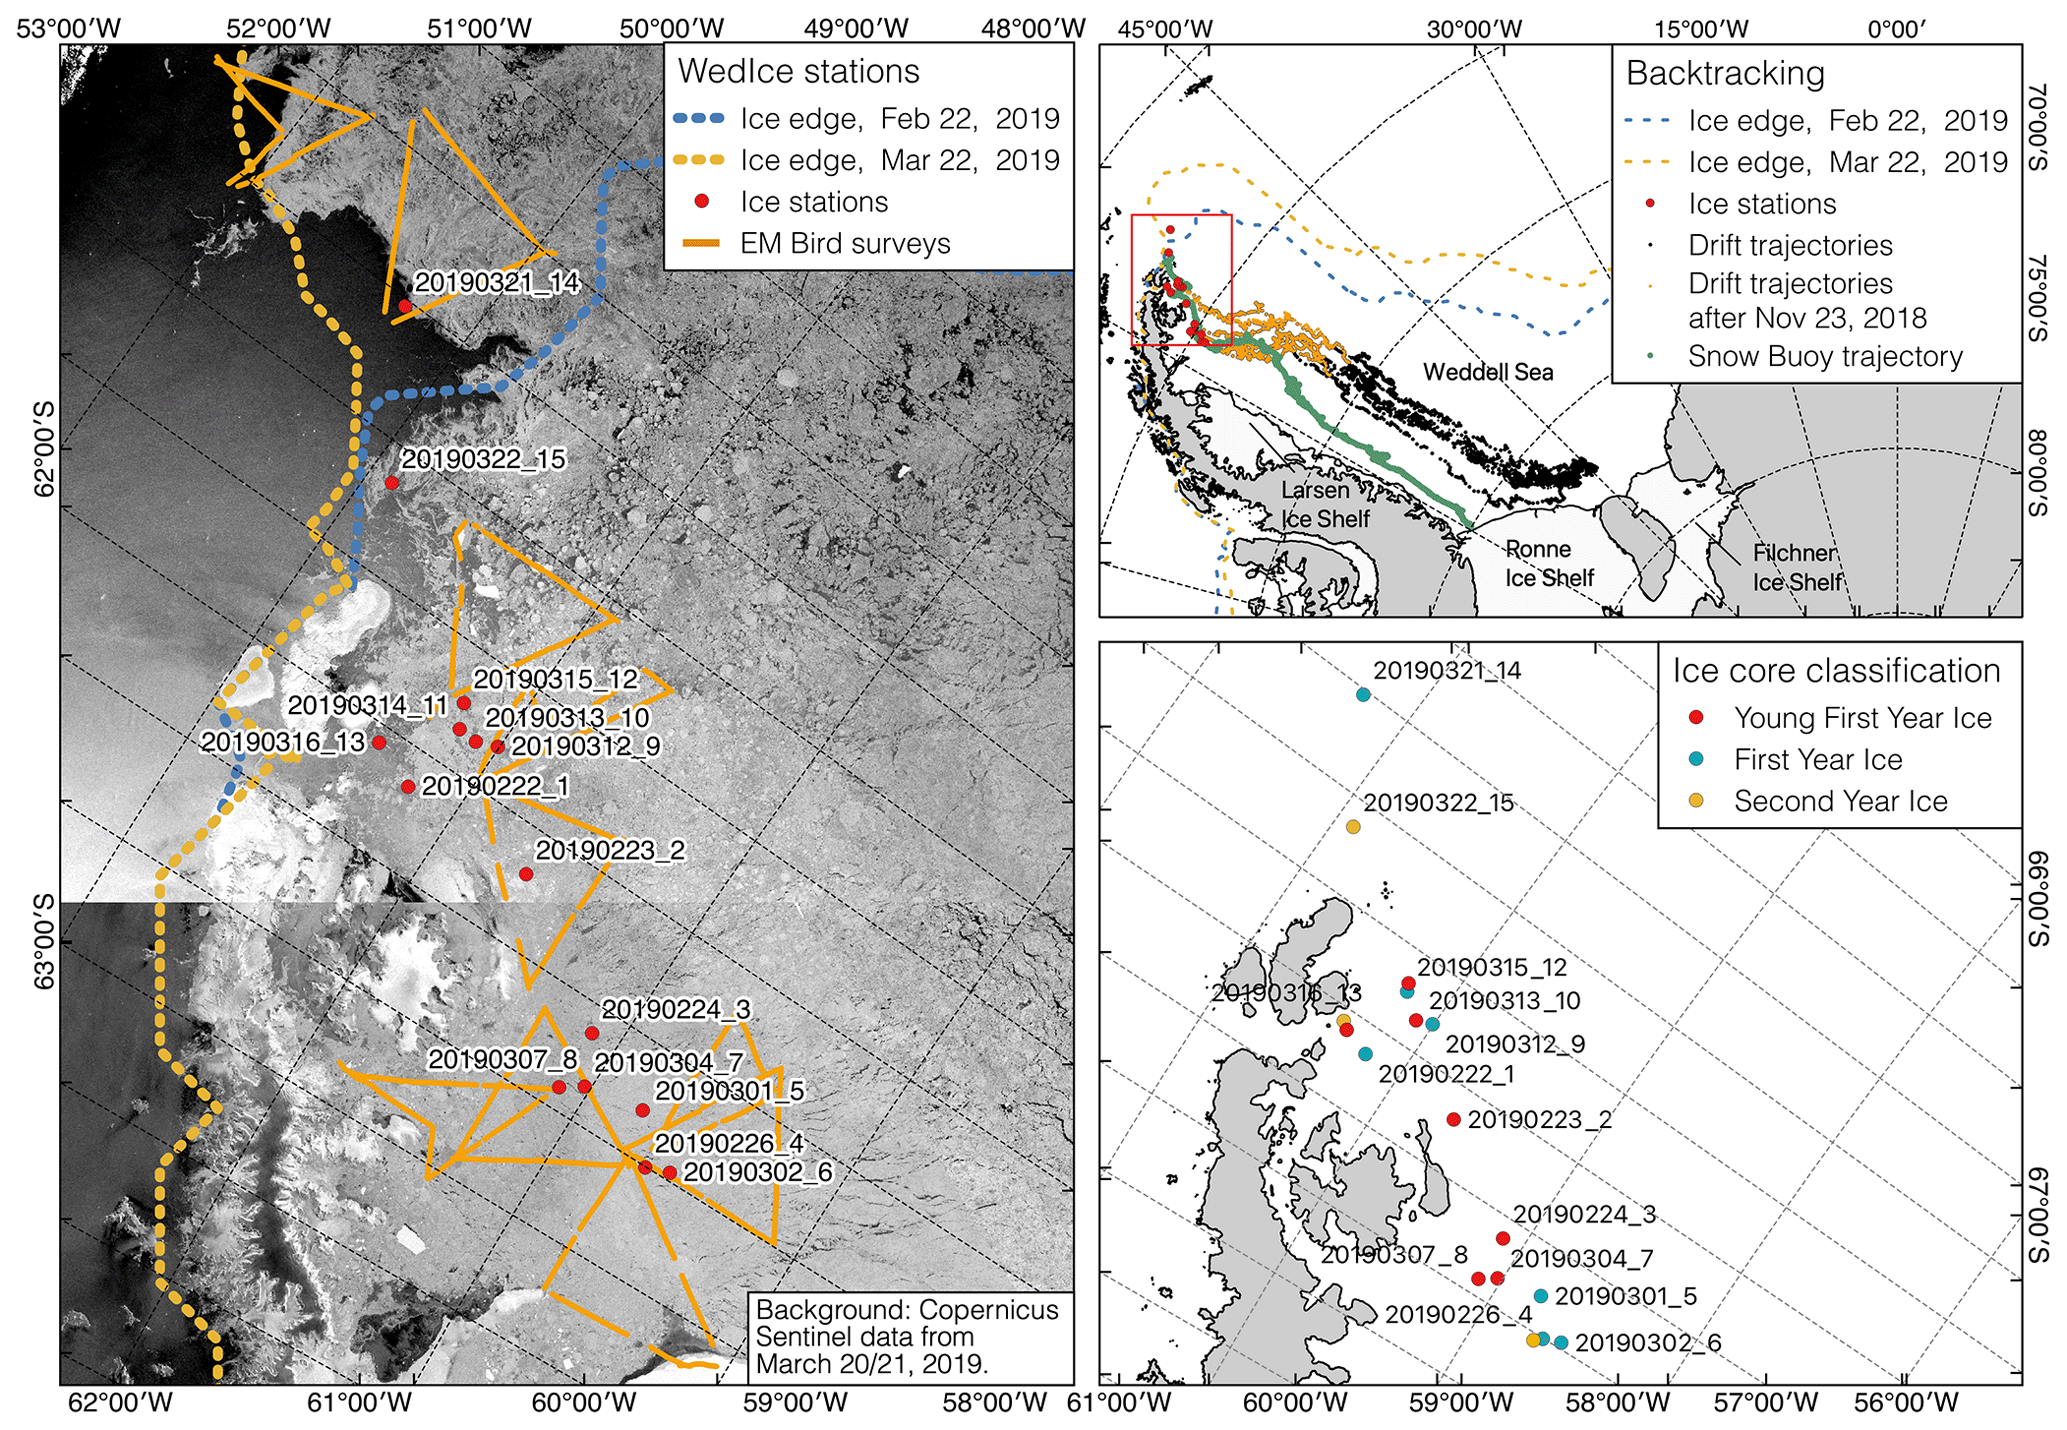
Figure 1Left: overview map of all sampled ice stations (red dots) and helicopter-borne electromagnetic (HEM) induction sounding surveys (yellow lines). The ice station names are composed of the respective date and a consecutive station number. The dashed lines indicate the ice edge on the first day (22 February 2019, blue) and last day (22 March 2019, yellow) of our study. Background: Copernicus Sentinel-1 synthetic-aperture radar (SAR) images from 20 and 21 March 2019. Upper right: back trajectories (black dots) of the sampled ice stations (red dots) during WedIce. The green line denotes the drift trajectory of Snow Buoy 2018S59 deployed in February 2018 off the Ronne Ice Shelf. Lower right: ice age classification of all sampled ice cores – second-year ice (yellow), first-year ice (blue), young first-year ice (red).
2.2 Ice core sampling and analysis
For this study, a total of 21 ice cores with a diameter of 0.09 m were taken from 14 ice stations, with 5 cores covering the entire ice column and the remaining ones just surface cores of at least the upper 50 cm of the ice. In the cold laboratory on board, detailed analyses of the ice crystal texture were performed on vertical thick sections between crossed polarizers (Lange, 1988). Based on the ice texture, all sampled ice cores were sliced into sections of up to 15 cm and melted for the following analysis of vertical salt (on board) and isotope profiles (in laboratory back home). Salinities were determined with a conductivity meter (pocket conductivity meter WTW 3110) with a stated accuracy of 0.5 % for each measurement. The melted samples were poured into sampling vials that were filled completely and tightly sealed. The vials were shipped at +4 ∘C to the AWI ISOLAB Facility in Potsdam, where they were analyzed for stable water isotopes with Finnigan MAT Delta-S mass spectrometers using equilibration techniques. The oxygen isotope composition is given as per mil difference relative to VSMOW (‰, Vienna Standard Mean Ocean Water), with an internal 1σ error better than 0.1 ‰ for δ18O (Meyer et al., 2000).
The correlation in the co-isotope plot (Fig. C1) suggests that the isotope data could be explained by a simple two-component mixture of snow and seawater, with little variation in the isotope fractionation during freezing. Snow/firn from the Union Glacier region in the Weddell Sea sector has the respective endmember specifications (low δ18O of −30‰ to 35‰ clearly under the global meteoric water line (GMWL); Hoffmann et al., 2020).
Here we used the combination of salinity and oxygen isotopic composition to determine the respective fractions of superimposed ice and snow ice: all salt-free ice with an oxygen isotope composition smaller than 0.35 ‰ was classified as superimposed ice and all salty ice with an oxygen isotope concentration δ18O of up to 0.35 ‰ as snow ice following Eicken et al. (1994) and Schlosser et al. (1990) (Fig. 4).

Figure 2Ice and snow properties versus latitude: (a) total sea ice thickness (SIT, sea ice thickness plus snow depth) derived from airborne electromagnetic induction sounding (AEM, grey), ground-based EM sounding (GEM-2, black), and ice cores (light blue); (b) snow depth measured with the Magna Probe along GEM transects (dark blue) and measured at the ice-coring sites (light blue); (c) freeboard measured at the ice-coring sites (light blue); and (d) thicknesses of superimposed ice (dark blue triangles) and snow ice (light blue triangles) from all ice cores. Boxes are the first and third quartiles and whiskers the 10th and 90th percentiles. Circles indicate means and vertical lines in the boxes medians.
2.3 Ice age classification
In order to interpret our results, it is important to know the type and age of the sampled ice which cannot easily be retrieved from the salinity or δ18O profiles or other ice properties. Therefore we reconstructed the previous drift tracks of all sampled floes by means of Lagrangian sea ice backtracking based on satellite-derived sea ice motion fields (Krumpen et al., 2019). As the backtracking algorithm only works for ice concentrations above 20 %, the drift tracks could only be determined for ice stations 2–11, all showing very similar tracks over their drift period of longer than 1 year since their initial formation near the Ronne Ice Shelf (Fig. 1, upper right). We have high confidence in this result as the drift tracks also closely agree with the drift of a buoy deployed in February 2018 off the Ronne Ice Shelf (Fig. 1, upper right; Haas et al., 2019). To further constrain the age of the ice, we calculated the potential ice growth along these drift tracks with a simple one-dimensional thermodynamic sea ice model. The model was forced by surface temperature, heat fluxes, and snowfall from ERA5 reanalysis data (Copernicus Climate Change Service, 2017) (Appendix A). The resulting mean potential ice thickness (Ipot) along all drift tracks was 1.53±0.07 m overlain by 0.32±0.01 m of snow. Based on these results, ice cores with a length of 1.53±0.07 m were classified as first-year ice, thicker ice cores as second-year ice, and thinner ice cores as young first-year ice (Fig. 1, lower right). The classification considers the co-existence of different ice types in the study region which typically form by the refreezing of leads in the predominantly divergent ice conditions in the Weddell Sea (Haas et al., 2008).
2.4 Decadal time series of sea ice extent, melt onset, and surface energy balance
In order to support our discussion of long-term changes in superimposed ice and snow ice, we computed time series of February sea ice extent since 1979 from sea ice concentration data derived from the Nimbus-7 SMMR and DMSP SSM/I-SSMIS passive microwave sensors provided by the US National Snow and Ice Data Center (Cavalieri et al., 1996). Ice extent was calculated for the complete Southern Ocean as well as for the western Weddell Sea west of 30∘ W (Fig. 5).
In addition, we updated our time series of snowmelt onset dates since 1993 from satellite radar scatterometer data (Arndt and Haas, 2019) provided by the Scatterometer Climate Record Pathfinder (SCP) project at Brigham Young University (Long et al., 1993). Melt onset is detected from sudden changes and eventually increases in radar backscatter due to the appearance of thaw–freeze cycles and associated snow metamorphism and superimposed ice formation during the spring–summer transition (Arndt and Haas, 2019; Haas, 2001). For this study we have computed the average melt onset for the available positions north of 69∘ S (locations 1–3 in Arndt and Haas, 2019), representing the average position of the surveyed ice between the beginning of the melt season in late November and our sampling in February and March.
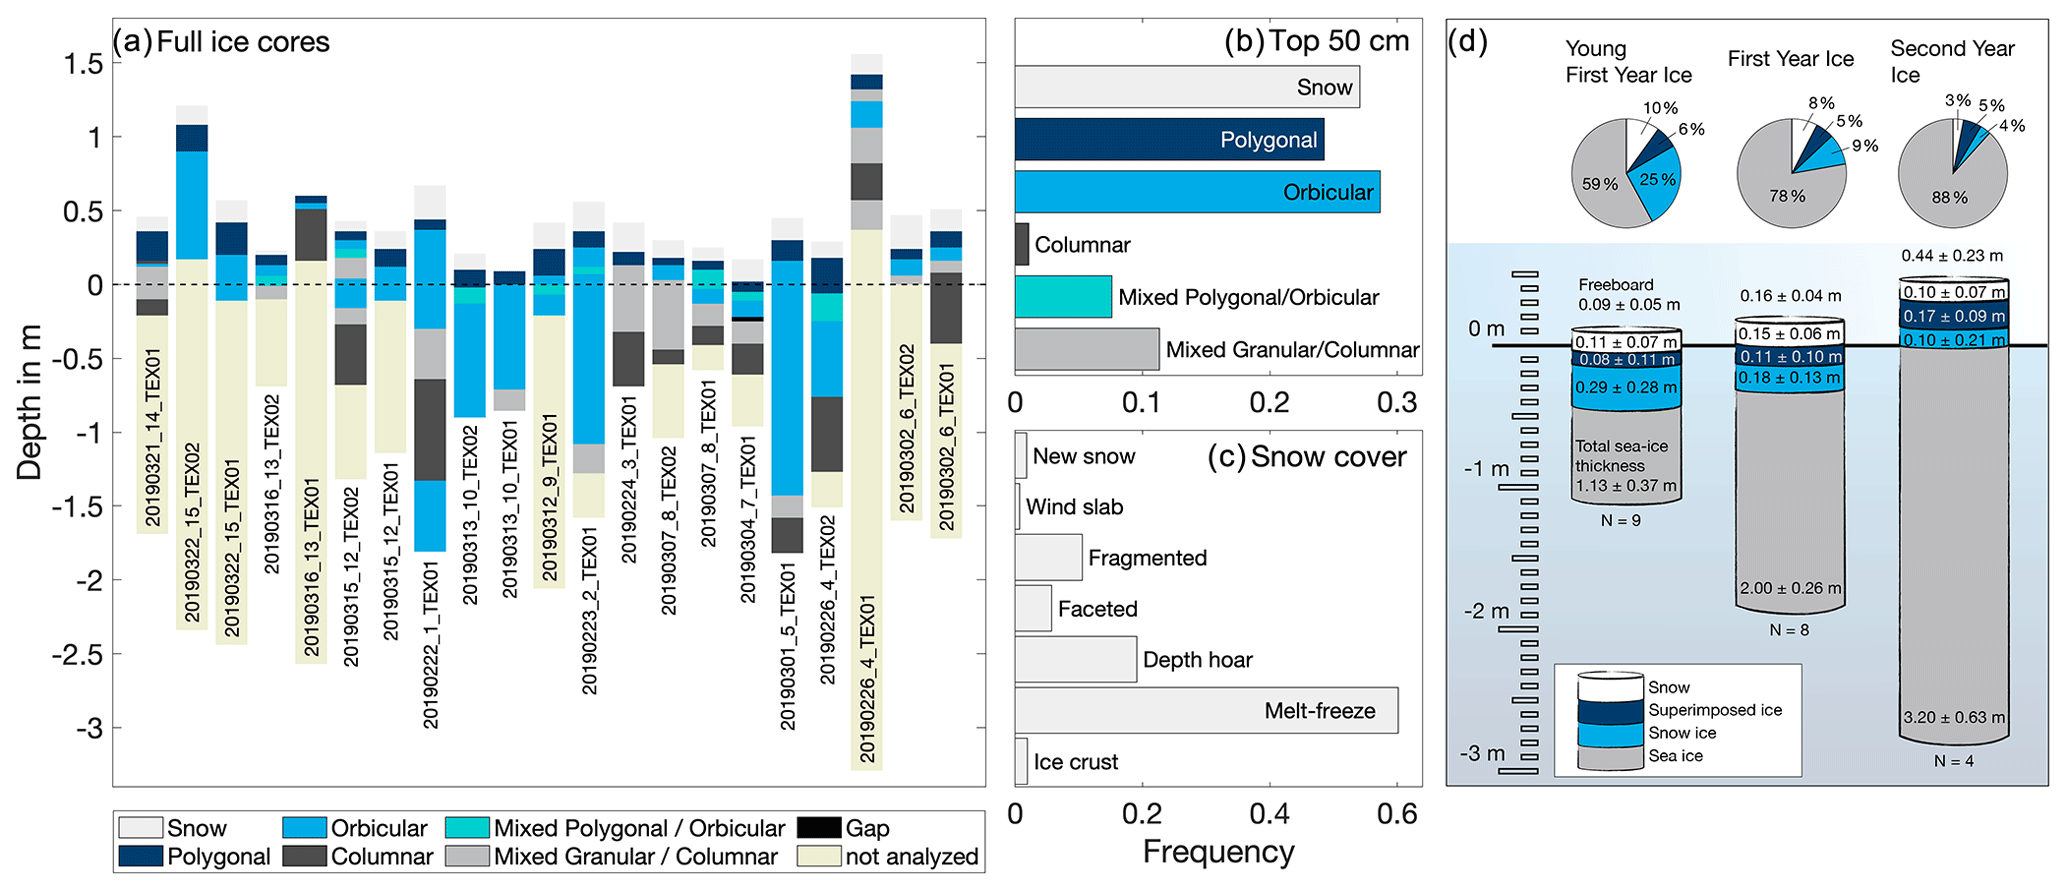
Figure 3(a) Overview of all sampled ice cores colored with the respective crystal texture. Ice cores are ordered according to their sampling location from north (left) to south (right; see Fig. 1). Ice core tags are composed of the respective ice station and the ice texture (TEX) core number. Beige-colored parts were not analyzed for texture. Ice core freeboard and draft are plotted relative to the water level (z=0 cm, dotted black line). (b) Relative frequency distribution of ice texture classes of the surface ice cores – including only cores with more than 50 cm of ice texture information (15 out of 21 ice cores). (c) Relative frequency distribution of snow grain types in all snow pits. (d) Summary of average relative and absolute proportions of snow, superimposed ice, and snow ice in total sea ice thickness (sea ice thickness plus snow depth) of all sampled young first-year, first-year, and second-year ice cores. Averaged ice cores are plotted relative to the water level (z=0 cm, black line).
Finally, as superimposed ice formation and the survival of snow strongly depend on the surface energy balance, we computed time series of monthly net short- and longwave radiation as well as sensible and latent heat flux since 1979 from ERA5 reanalysis data (Copernicus Climate Change Service, 2017), the same data that were used to force the thermodynamic model in Sect. 2.3. The different energy flux components were added to derive the surface energy budget. We integrated the energy budget for the months December to February to obtain the surface energy budget during the summers of each year. Like melt onset, energy budget was computed for a region north of 69∘ S which approximately corresponds to the region the ice drifted through between December and February.
3.1 Sea ice and snow conditions
In February and March 2019, the northwestern Weddell Sea was characterized by the presence of at least three different ice regimes known from previous studies (Haas et al., 2008) and visible in satellite synthetic-aperture radar (SAR) imagery (Fig. 1): (i) heavily deformed ice near the coast of the Antarctic Peninsula and along the Larsen Ice Shelf; (ii) east of that, a band of younger, thinner, and less deformed ice originating from the Ronne Ice Shelf; and (iii) in the very east, older, strongly deformed, thick ice originating from the southeastern Weddell Sea (Filchner Ice Shelf). These general ice regimes were interspersed with patches of thinner first-year ice originating from refrozen leads or sheltered areas at the Antarctic Peninsula. Based on visual interpretation of SAR images and the results of the thermodynamic model (Sect. 2.3), only one ice station was classified as pure second-year ice, five were classified as first-year ice, and six ice stations were classified as young first-year ice. For another three stations, sampled cores were quite variable and classified with different ice ages. Independent of ice age, all ice core holes possessed a positive freeboard between 0.01 and 0.71 m (Fig. 2c). Airborne sea ice thickness measurements revealed strong latitudinal gradients, with modal total thicknesses between 3.9 m in the south and 0.9 m in the north and mean values ranging from 4.12±1.87 to 1.62±1.05 m, respectively (Fig. 2a). Similar results were obtained by the GEM measurements with a mean total ice thickness of 4.08±2.03 m at the southernmost ice station (PS118_20190226_4) and 1.50±0.48 m in the north (PS118_20190313_10; Fig. 2a). Similarly, mean snow depth ranged from 0.46±0.29 m in the south to 0.05±0.06 m in the north (Fig. 2b). Although we occasionally observed floes with patches of bluish bare ice probably originating from coastal fast ice in the Larsen region, we did not observe any melt ponds with characteristics known from the Arctic.
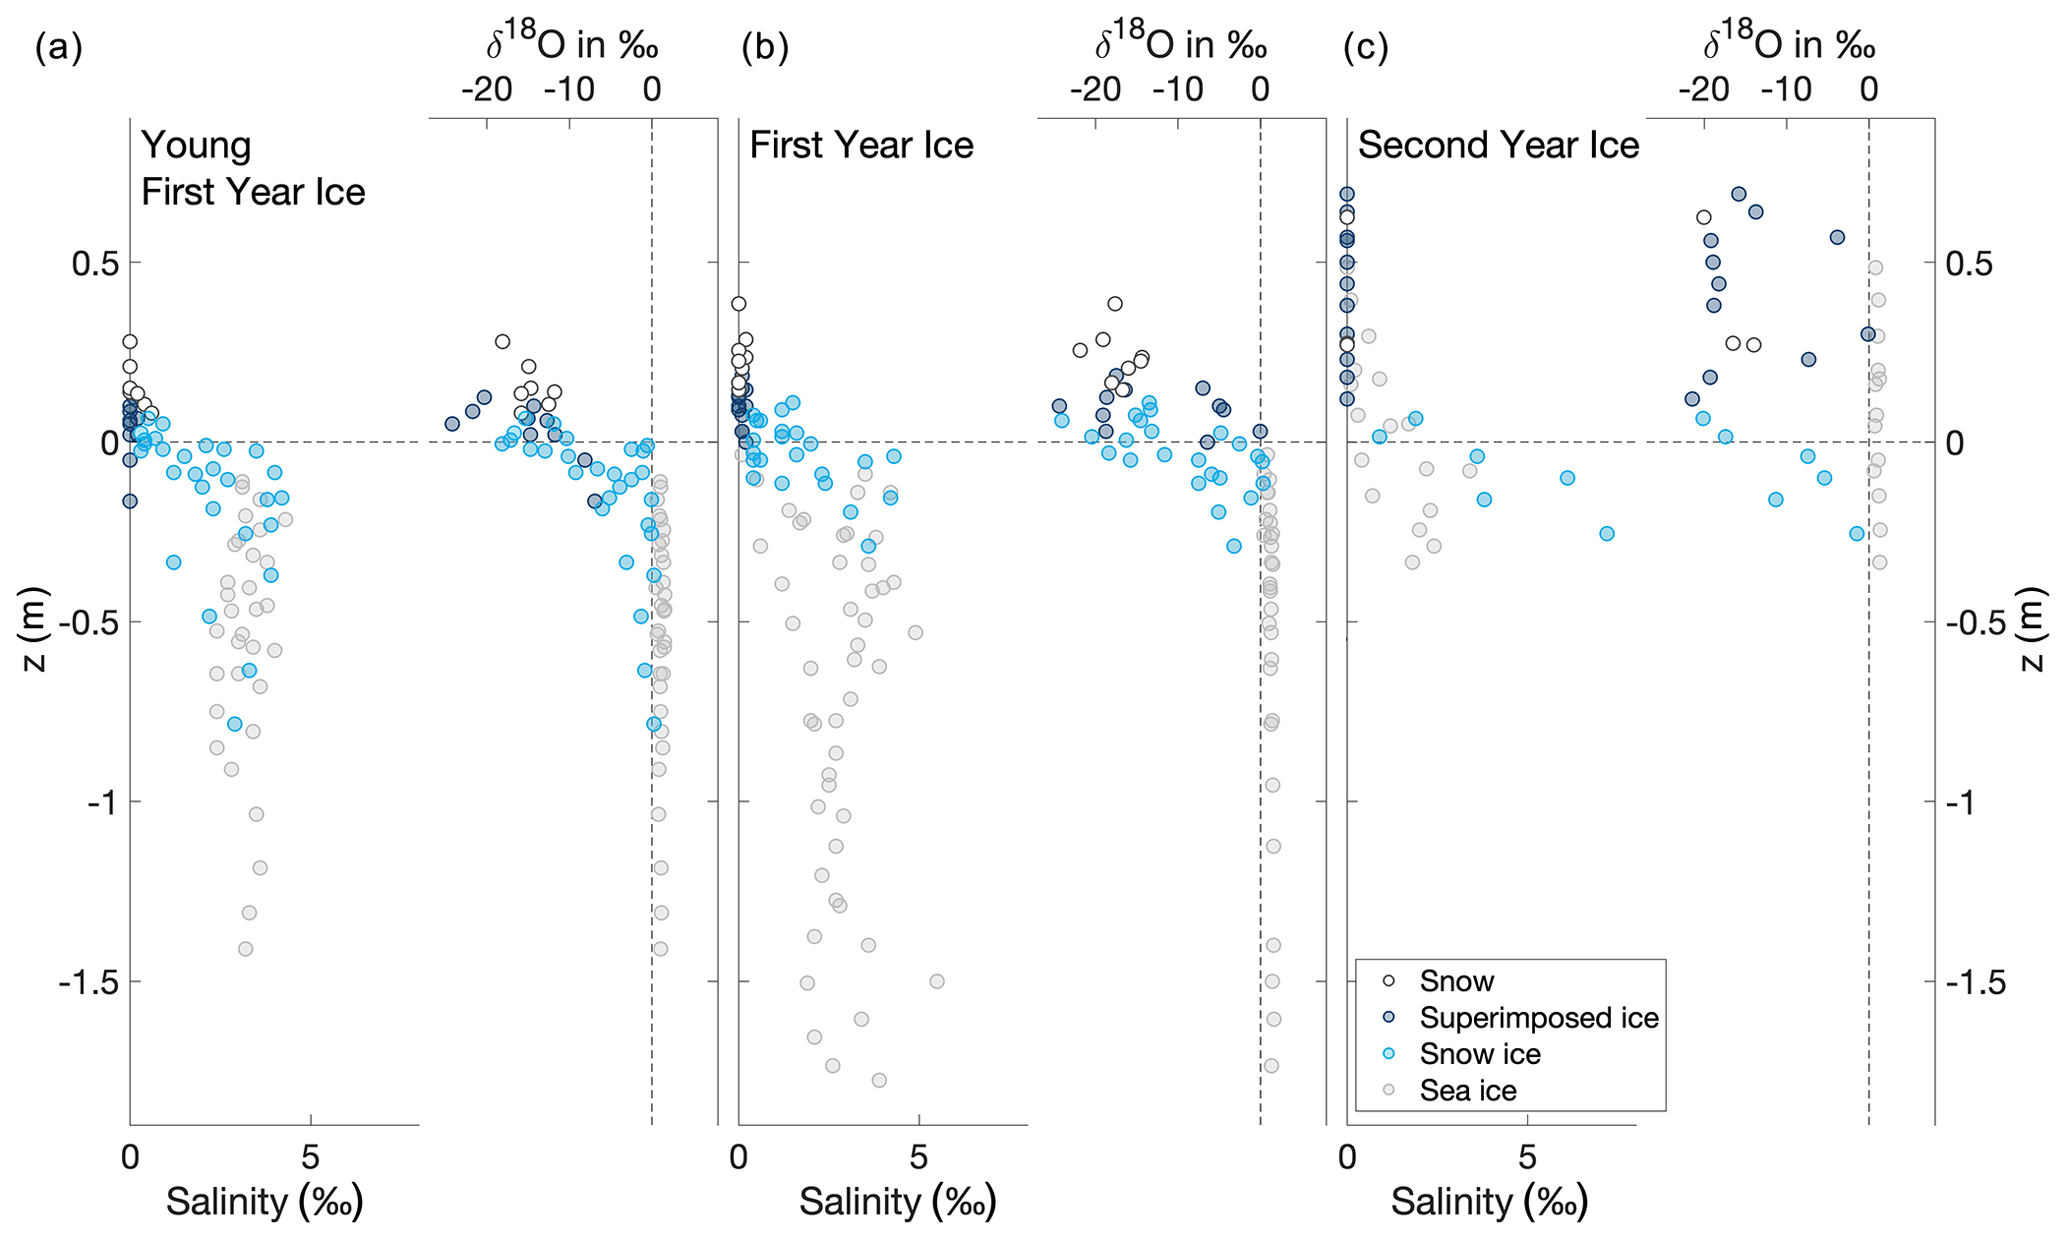
Figure 4Vertical profiles of salinity and δ18O of all sampled ice cores from (a) young first-year ice, (b) first-year ice, and (c) second-year ice. Markers are plotted at the center position of the individual core segment, relative to the water level (z=0 cm). Colored circles mark snow (filled white circles), superimposed ice (filled dark blue circles), snow ice (filled light blue circles), and sea ice (filled light grey circles).
3.2 Snowmelt forms and superimposed ice
Based on detailed analyses of 24 snow pits, melt–freeze forms (Fierz et al., 2009) were identified as the dominant snow grain type with an average relative proportion of 60 % (Fig. 3c). These are typically caused by an early beginning and frequent recurrence of thaw–freeze cycles in the northwestern Weddell Sea (Arndt et al., 2016; Arndt and Haas, 2019). At all sites, the large-grained granular texture of snow often transitioned into the polygonal granular texture of underlying superimposed ice, ranging from 0.05 to 0.24 m in thickness (Fig. 3a). Within the superimposed ice, the grain size of polygonal grains often decreased downwards and transitioned into an underlying layer of finer-grained orbicular granular ice, which could have led to underestimation of the actual thickness and fraction of the superimposed ice. We therefore used the additional combined analysis of salinity and oxygen isotopes of all ice cores to clearly obtain superimposed ice thickness (Fig. 4). The fraction of superimposed ice in the total ice core length is about the same at 5 %–6 %, independent of the ice age (Fig. 3d). The thickness of superimposed ice increased northwards, exceeding 0.3 m for the northernmost ice stations, while stations further south tended to have superimposed ice less than 0.1 m thick (Fig. 2d). Also, the median δ18O of superimposed ice gradually decreased with increasing ice age from −14.9 ‰ for young first-year ice (yFYI) to −16.2 ‰ for first-year ice (FYI) to −17.4 ‰ for second-year ice (SYI), supporting our classification approach as older ice is expected to originate from farther south with δ18O values of snow decreasing with increasing latitude (Eicken et al., 1994). Thus, the variability in the δ18O values is less ice-type-specific but is subject to the ice floe origin and drift pattern.
3.3 Fraction of snow ice
Beneath the salt-free layer of superimposed ice, most cores possessed a salty layer of fine-grained, orbicular, granular ice with salinities of up to 7.2 ‰. In accordance with salinity, δ18O values also increased to a median of −6.0 ‰ (Fig. 4). The excellent correlation in the co-isotope plot (see Fig. C1) suggests that the isotope data could be explained by a simple two-component mixture of snow and seawater, with little variation in the isotope fractionation during freezing. Therefore, we interpreted these layers as snow ice. While the fraction of snow ice showed no latitudinal gradient, its contribution to the total ice core length varied considerably for yFYI (25 %), FYI (9 %), and SYI (4 %) (Fig. 3d). The fraction of both snow ice and superimposed ice, i.e., meteoric ice, adds up to 3 % to 54 % of total ice thickness.
Note that the spread of δ18O values of saline ice classified as snow ice was quite large, occasionally as low as −20 ‰, particularly near the snow–ice interface. Such low values suggest that meltwater may have contributed to the snow ice formation, e.g., during the period of melt onset. On the other hand, relatively high values near 0.35 ‰ may result from redistribution of δ18O isotopes by post-genetic changes in the ice, e.g., due to brine migration (Maksym and Jeffries, 2001). These processes can bias the interpretation of snow ice fraction in the cores and lead to a mean uncertainty in the relative proportion of snow ice of 14 %. An analysis of the snow fraction of snow ice is beyond the scope of our study (e.g., Eicken et al., 1994).
The observed sudden sea ice retreat in the Weddell Sea in summer (Fig. 5a) raises questions about the underlying causes and how they are related to other changes in ice and snow properties. Did atmospheric and oceanic processes also change the ice surface energy balance, cause increased snowmelt and superimposed ice formation, and lead to changed proportions of snow ice? Given the small number of 21 ice cores from 14 stations and the large regional variability and latitudinal gradients observed by us, this question is difficult to answer with certainty. However, our results are still the best recent observations available from the northwestern Weddell Sea to date, and other previous studies have been subject to similar limitations.
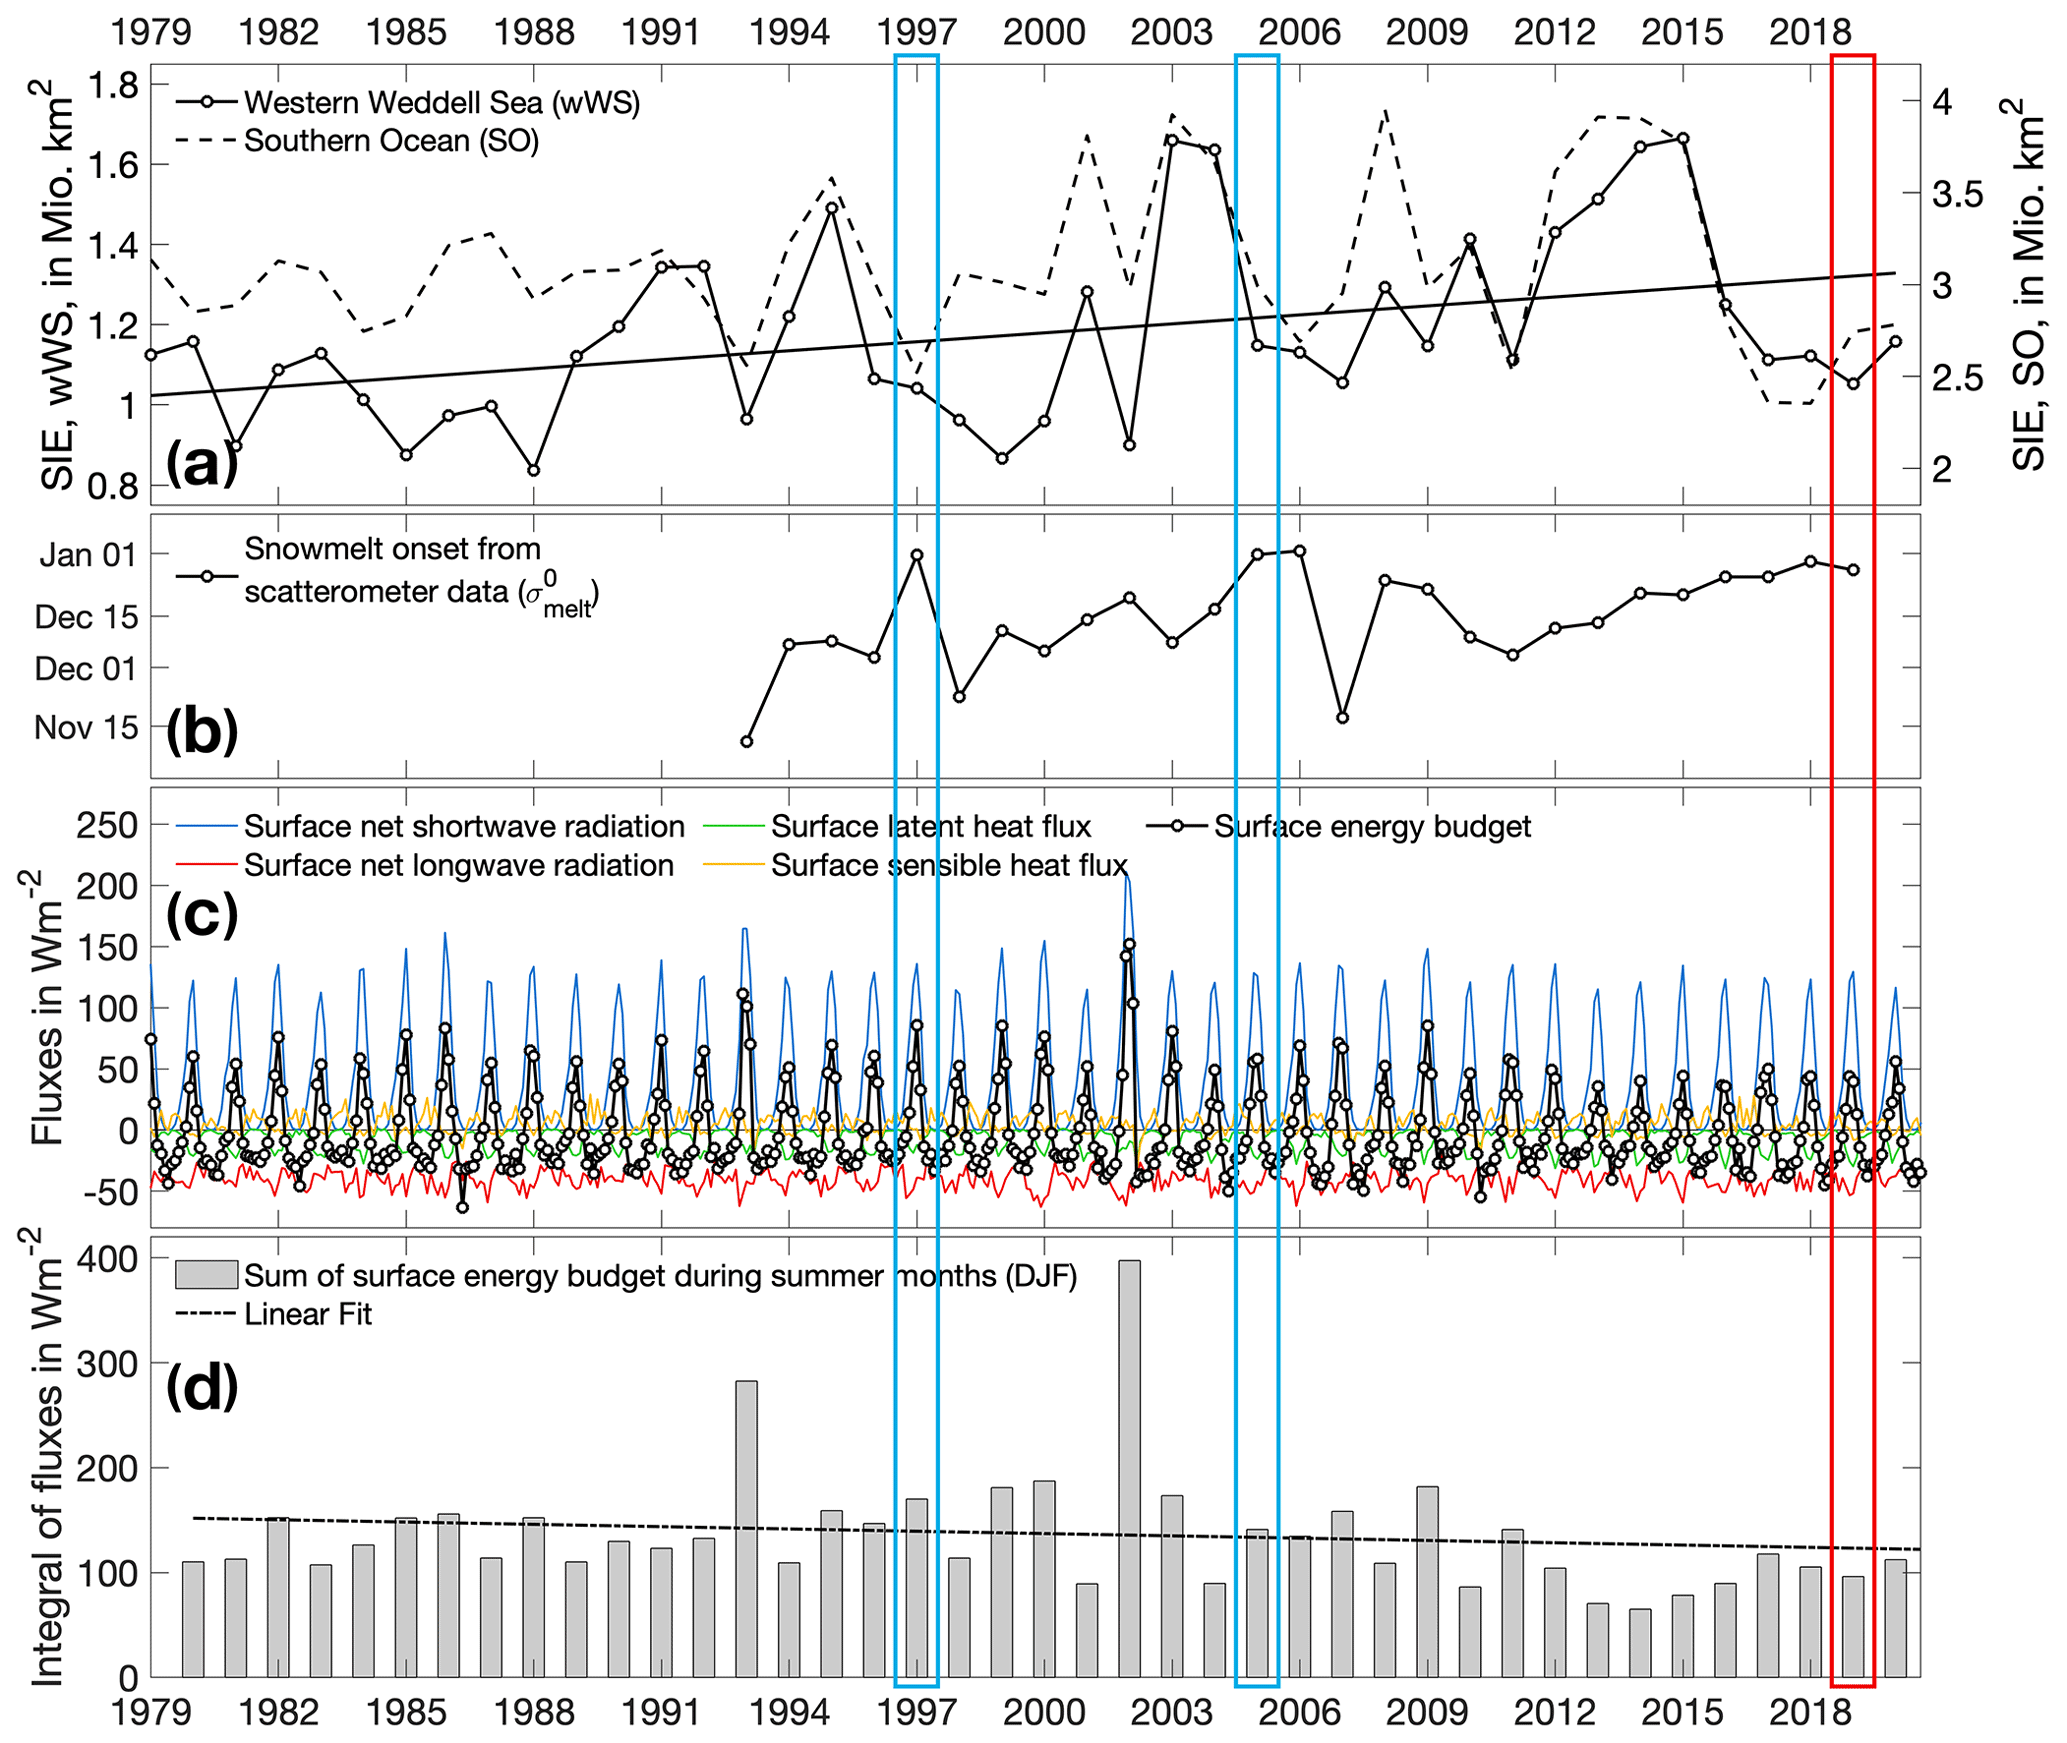
Figure 5Time series of ice extent, melt onset, and surface energy balance in the northwestern Weddell Sea (Sect. 2.4). (a) Sea ice extent (SIE) in the western Weddell Sea west of 30∘ W (wWS, solid line), and in the whole Southern Ocean (SO, dashed line), for February 1979–2020. Line shows linear fit to Weddell Sea data with a slope of +7000 km2 yr−1. (b) Snowmelt onset north of 69∘ S from scatterometer data. (c) Surface energy budget north of 69∘ S (black line) and its individual components (colored lines). (d) Annual total summer surface energy budget (sum from December to February). The dashed line shows the linear fit with a slope of −0.7 . The red box highlights the year of the WedIce expedition, 2019; blue boxes show years of field observations in 1997 and 2004/05 (ISPOL). Note that the year markers on the x axis represent 1 January of the respective year.
Our ice thickness observations are similar to results from the Ice Station POLarstern (ISPOL) carried out in December 2004 in a region about 400 km farther south, where mean ice thicknesses of 3.01±1.09 m were observed, with modal thicknesses of FYI and SYI of 1.2–1.3 and 2.4–2.9 m, respectively (Haas et al., 2008). Similarly, Lange and Eicken (1991) found mean total ice thicknesses from 0.9±0.47 to 3.11±0.59 m for different ice classes in the northwestern Weddell Sea by the end of the 1980s. These results suggest that ice thicknesses in the northwestern Weddell Sea have changed little since then. The same applies to the snow depth distribution, as, e.g., Lange and Eicken (1991) have previously measured snow depths from 0.15±0.59 to 0.58±0.07 m, which is in the same range as our results in 2019 (Fig. 2).
Corresponding to little-changed ice and snow thicknesses, we did not observe unusual amounts of snow ice either, given that Eicken et al. (1994) reported similar proportions of 5 % in sea ice in the northwestern Weddell Sea in 1989 and 1992. As our coring and thickness drilling did not observe any negative freeboard, it is unlikely that much snow ice will form in the northwestern Weddell Sea at all, and a very high snow accumulation is required to suppress the ice below the water level in this region. However, the snow ice observed in the northwestern Weddell Sea has formed in the preceding winter in regions farther to the south (Fig. 1, upper right), and therefore our results also provide some evidence of little-changed ice growth and precipitation conditions there. Overall, the amount of snow ice on second-year ice is comparably low. This relates to the fact that the ice spent the first year mainly in the southern Weddell Sea, where only limited snowfall occurs due to the strong continental high-pressure influence (Van Den Broeke and Van Lipzig, 2004).
More importantly, via the frequency, intensity, and duration of snowmelt events, the amounts of superimposed ice are closely related to atmospheric energy fluxes. However, the mean superimposed ice thickness of 0.11±0.11 m observed in February and March 2019 is similar to the 0.08±0.06 m found by Haas et al. (2001) in February 1997 in the same region. It is slightly larger than the 0.05 to 0.10 m found by Nicolaus et al. (2009) and Tison et al. (2008) in December 2004 in the ISPOL region slightly earlier and further south and in a year with no exceptional February ice extent (Fig. 5a).
In order to interpret the similar amounts of superimposed ice observed in 1997, 2004/05, and 2019, Fig. 5b–d show time series of melt onset and atmospheric energy fluxes. Melt onset occurred on 31 December in 1996/97 and 2004/05 and 27 December in 2018/19. Overall, there is no trend towards earlier melt onset, and there has been little difference since 2016/17 when sea ice extent in the Southern Ocean plummeted. However, the total summer energy budget (Fig. 5d) is a more relevant figure as it represents the accumulated energy that would have been available for snow thawing. It amounted to 170 W m−2 in 1996/97, 141 W m−2 in 2004/05, and 96 W m−2 in 2018/19, small differences which may explain why the amounts of superimposed ice changed little. We also note that air temperatures near the Antarctic Peninsula and the northwestern Weddell Sea were below average in January and February 2019 (Clem et al., 2020). Note that a more thorough analysis and modeling of energy fluxes and their impact on interannual variations in snowmelt and superimposed ice formation (e.g., Nicolaus et al., 2006) is beyond the scope of this study. This does not mean, however, that there are no changes in surface melting. If we look at the entire time span from the early 1990s to today, it appears that sea ice extent in the Weddell Sea is increasing slightly and melt onset tends to start later, whereas surface fluxes show little change. Furthermore, the observational data shown from 1996/97, 2004/05, and 2019 do not represent extremes in the variables mentioned. This is different for years without observational data: for example, for 1992 a very early melt onset, high surface fluxes, and low sea ice extent are shown, whereas in 2015 a comparatively late melt onset, low surface fluxes, and the highest sea ice extent for the Weddell Sea are shown in the reanalysis and satellite remote sensing data. This suggests that the amount of superimposed ice might have decreased over time. However, there are not enough data to formulate any quantitative correlations between the given parameters and the meteoric ice fraction.
In addition, Fig. 5d shows that the surface energy balance in the northwestern Weddell Sea has decreased, by −0.7 since 1979. While there is some correlation between low sea ice extent and high surface energy flux in extreme years like 1992/93 and 2001/02, there are few changes before and after 2016/17. However, the exact link between extremes in sea ice extent and the corresponding inverse extremes in surface energy fluxes is not yet fully understood.
Based on these results, we conclude that we did not find any clear evidence for significantly increased atmospheric heat fluxes that would have changed the intensity of snow thaw and superimposed ice formation at the top of the sea ice. It is unlikely that increased melt from the top has contributed to the low sea ice extent in the northwestern Weddell Sea in the summer of 2019. This supports other studies which attribute the low sea ice extents to dynamic or oceanic processes rather than to thermodynamic atmospheric effects (Meehl et al., 2019; Reid and Massom, 2014; Reid et al., 2018, 2019).
Our conclusions are based on the assumption that atmospheric processes affecting sea ice melt and disappearance in the northwestern Weddell Sea also impact the surface of the surviving ice farther south. Obviously, it is impossible to assess melting processes in the open-water regions that were formerly ice covered when observations during the melting season for this area are not available. However, as gradients of most atmospheric properties typically have scales of variability of many hundreds of kilometers, one can expect that extreme conditions in the regions that were formerly ice covered would also have affected neighboring regions farther south. In order to account for larger scales of atmospheric variability and for the conditions experienced by the ice observed by us, we have therefore carried out our analyses of melt and energy fluxes over the full regions through which that ice has drifted since the onset of melt in late November (Sect. 2.4).
Interpretation of changes in snow and superimposed ice thicknesses is complicated by the fact that the latter forms from the former. Increasing thicknesses of superimposed ice in summer will lead to simultaneous reductions in snow depth. For example, assuming densities of snow and superimposed ice of 330 and 850 kg m−3 (Cheng et al., 2003), the 0.11±0.11 m of superimposed ice found here correspond to an original snow depth of 0.27±0.27 m. This conversion has an interesting side effect: given the thermal conductivity of snow of ≈0.3 and of superimposed ice of ≈2.2 , the conversion of insulating snow to more conductive superimposed ice leads to a doubling of the effective thermal conductivity (Appendix A, Eq. A4). This also doubles the potential conductive heat flux through the sea ice and snow and therefore the potential sea ice growth at the bottom of the ice in the following fall and winter (Appendix A, Eq. A7). Thus, increased bottom growth in winter may partially compensate for increased surface melt during summer, as long as the superimposed ice remains intact. In contrast, formation of superimposed ice in summer constitutes a downward heat flux where the latent heat released through meltwater refreezing contributes to the internal melting of the sea ice below and the formation of porous gap layers (Ackley et al., 2008; Haas et al., 2001). The effects of gap layer formation on increased turbulent seawater flow through the ice and potential increased absorption of shortwave radiation by increased numbers of photosynthesizing microorganisms are difficult to predict.
In February and March 2019 we carried out extensive snow depth and ice thickness measurements and sea ice core analyses in the northwestern Weddell Sea to gain more insights into the possible impact of atmospheric and oceanic changes related to the strong sea ice retreat observed between 2016/17 and 2018/19. Our results showed similar sea ice properties to those found in the few previous studies that have been carried out since the 1980s and 1990s, and in particular we did not find unusual amounts of meteoric ice, i.e., of superimposed ice or snow ice which are sensitive indicators of the sea ice surface energy balance and the relation between snow depth and ice thickness, respectively. In fact, we showed that melt onset dates and the surface energy balance between 2016/17 and 2018/19 were similar to in previous years; however, data on extreme years as well as, e.g., minimum/maximum sea ice extent or surface energy fluxes are lacking. These results support other studies showing that the low sea ice coverage in the northwestern Weddell Sea in February 2019 must have been the consequence of dynamic or oceanic processes rather than of thermodynamic atmospheric effects, i.e., of advection by winds and currents and increased ocean heat rather than of increased air temperatures, turbulent fluxes, or longwave radiation.
We suggest that snowmelt and metamorphism and superimposed ice formation are sensitive indicators of changes in the surface energy balance and together with snow ice allow for the distinguishing between atmospheric and oceanic contributions to increased sea ice melt and retreat. Based on observations of Arctic snow ice, Granskog et al. (2017) suggested that with thinner sea ice and more snow ice there might be an “antarctification” of Arctic sea ice. Here we suggest that the potential “arctification” of Antarctic sea ice would imply an increase in surface melt, reduction in albedo due to metamorphic and wet snow, and the eventual ice–albedo feedback supporting the appearance of melt ponds caused by more Arctic-like atmospheric conditions with warmer and moister air and increased surface heat and radiation fluxes. In this regard, superimposed ice plays an intermediate role, as initially more superimposed ice indicates more snowmelt and snow-to-ice conversion. However, this could also contribute to more rapid sea ice melt underneath as its formation constitutes a downward heat flux (Haas et al., 2001; Ackley et al., 2008). In addition, once surface melt would reach Arctic levels, the eventual disappearance of snow would continue with the melting and disappearance of the underlying superimposed ice (Nicolaus et al., 2003).
When discussing the potential future arctification of Antarctic sea ice, one also has to take into account the fundamentally different solar radiation conditions experienced by Arctic and Antarctic sea ice in summer due to their different latitudinal occurrence, with Arctic sea ice mostly residing at latitudes above 80∘ and Antarctic sea ice below 80∘ (e.g., Haas, 2003). This implies that Antarctic sea ice is subject to stronger diurnal cycles where nighttime longwave radiation cooling favors superimposed ice formation (Arndt and Haas, 2019) and may reduce the effectiveness of the ice–albedo feedback in leading to melt pond formation.
However, our results and the absence of melt ponds show no evidence for strong arctification of sea ice in the northwestern Weddell Sea in 2019. This and the large thickness of the sea ice in the region suggest that more substantial atmospheric and oceanic changes are required before perennial sea ice will completely disappear from the Weddell Sea. We strongly encourage future sea ice studies in the northwestern Weddell Sea to include extensive observations of superimposed and snow ice and the processes of their formation to better document the ongoing, if subtle, changes in atmosphere–ice–ocean processes in the region. In addition, satellite methods to derive snow and ice thawing and melt remotely should be improved and expanded (e.g., Arndt and Haas, 2019; Arndt et al., 2016).
In order to calculate potential sea ice growth rates along the drift trajectories of the sampled ice floes, we used a simple one-dimensional thermodynamical ice growth model based on the number of freezing degree days (Leppäranta, 1993), forced by surface heat fluxes and temperature as well as snowfall rates from ERA5 data (Copernicus Climate Change Service, 2017). The model is simplified by using constant salinity profiles and a constant oceanic heat flux of 3 W m−2 (Robertson et al., 1995). For the surface energy balance, it is assumed that the sea ice surface is in thermal equilibrium with the atmosphere, requiring that the heat fluxes into the ice and out of the ice (FS,net) are balanced, as given in the following equation:
Here, the individual heat flux terms are defined as
-
α, surface albedo of snow/ice, given by ERA5 data;
-
FR, surface solar radiation downwards, given by ERA5 data;
-
, surface thermal radiation (longwave) downwards, given by ERA5 data;
-
, outgoing longwave radiation, calculated by the Stefan–Boltzmann law
with Tsurf being sea surface temperature, given by ERA5 data;
-
Fsens, surface sensible heat flux, given by ERA5;
-
Flat, surface latent heat flux, given by ERA5; and
-
FC, conductive heat flux through snow and ice,
The net heat flux at the bottom of the ice, FB,net, is simply given as the difference between the conductive heat flux, FC, and the constant ocean heat flux, FO=3 W m−2:
The resulting growth/melt rates at the surface and bottom of the ice floe dh/dt are finally calculated as a function of time. Assuming a vertical heat transfer only leads to a surface melt/growth rate dhsurf/dt of
and bottom melt/growth dhbot/dt of
with
-
ρice being density of ice, ρice=910 kg m−3;
-
ρsnow density of snow, ρsnow=330 kg m−3; and
-
L latent heat of fusion (freezing of water), L = 334 kJ kg−1.
Table B1List of all sea ice stations within the WedIce project during PS118. The ice station names are composed of the respective date and a consecutive station number. Abbreviations for the gear used at each station are given as follows: SIT – manual sea ice thickness drillings, SPIT – snow pit, SMP – SnowMicroPen, SDMP – snow depth measured with Magna Probe, GEM – sea ice thickness measured with ground electromagnetic sounding device, CORE – physical and biological ice coring, and WATER – surface water sampling.
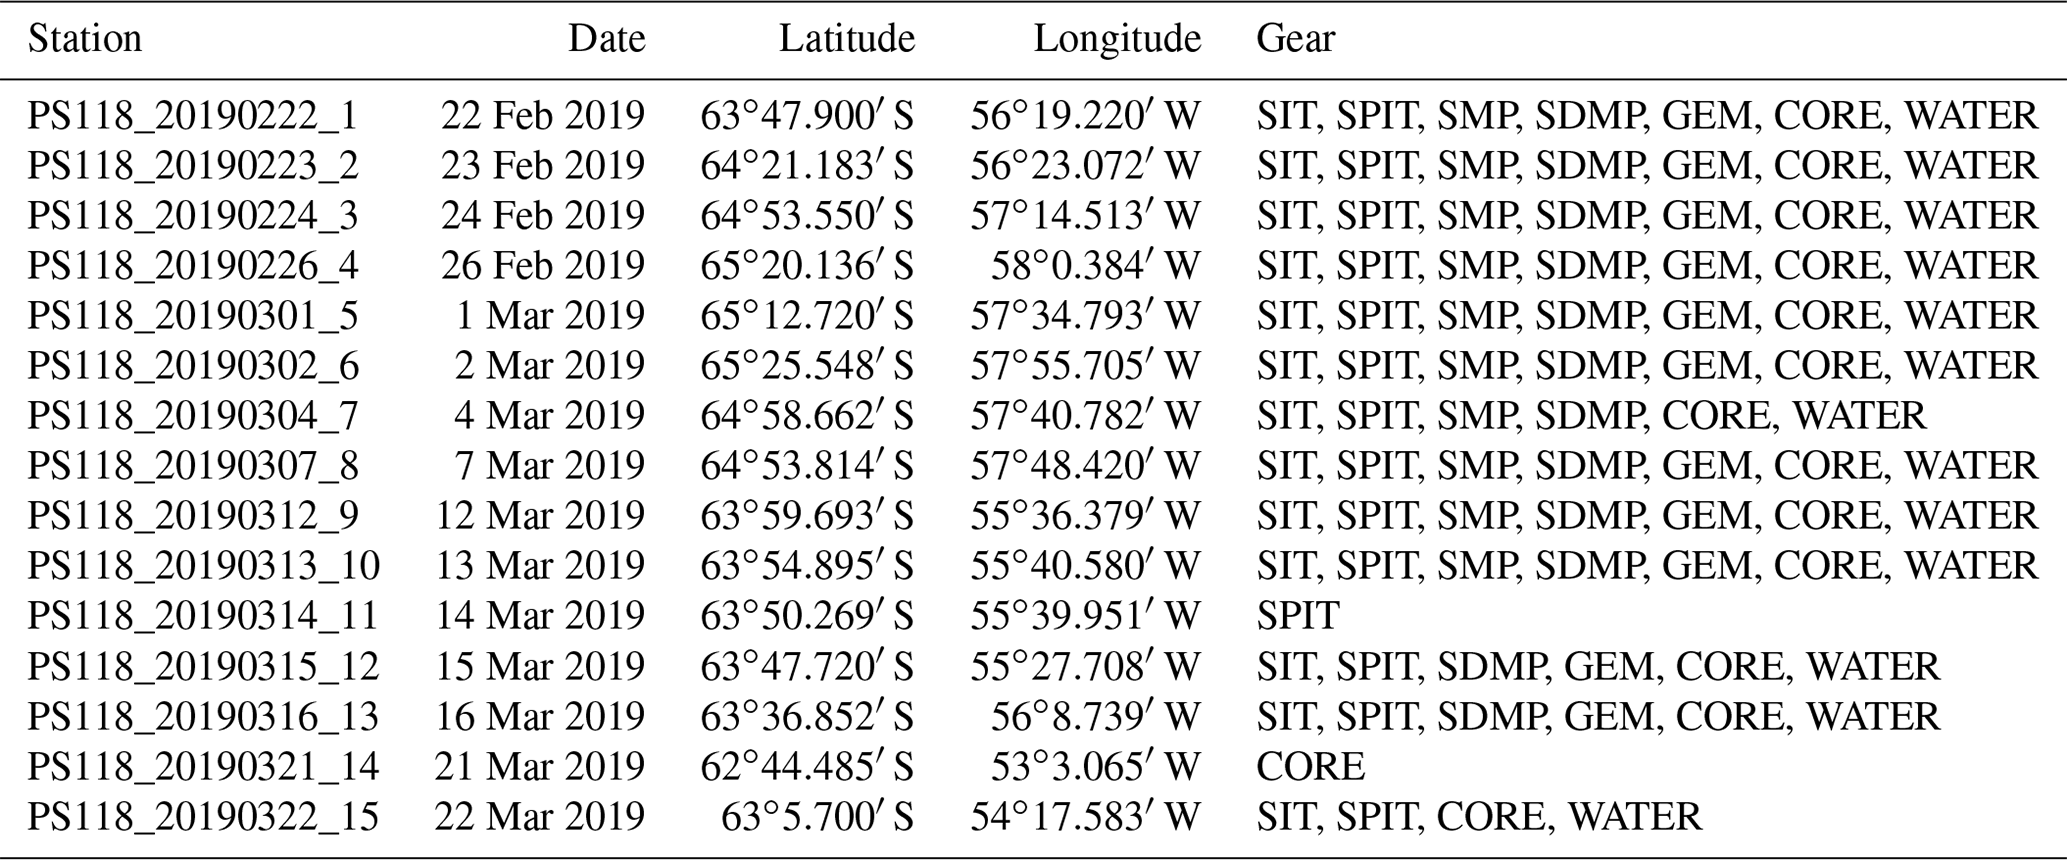
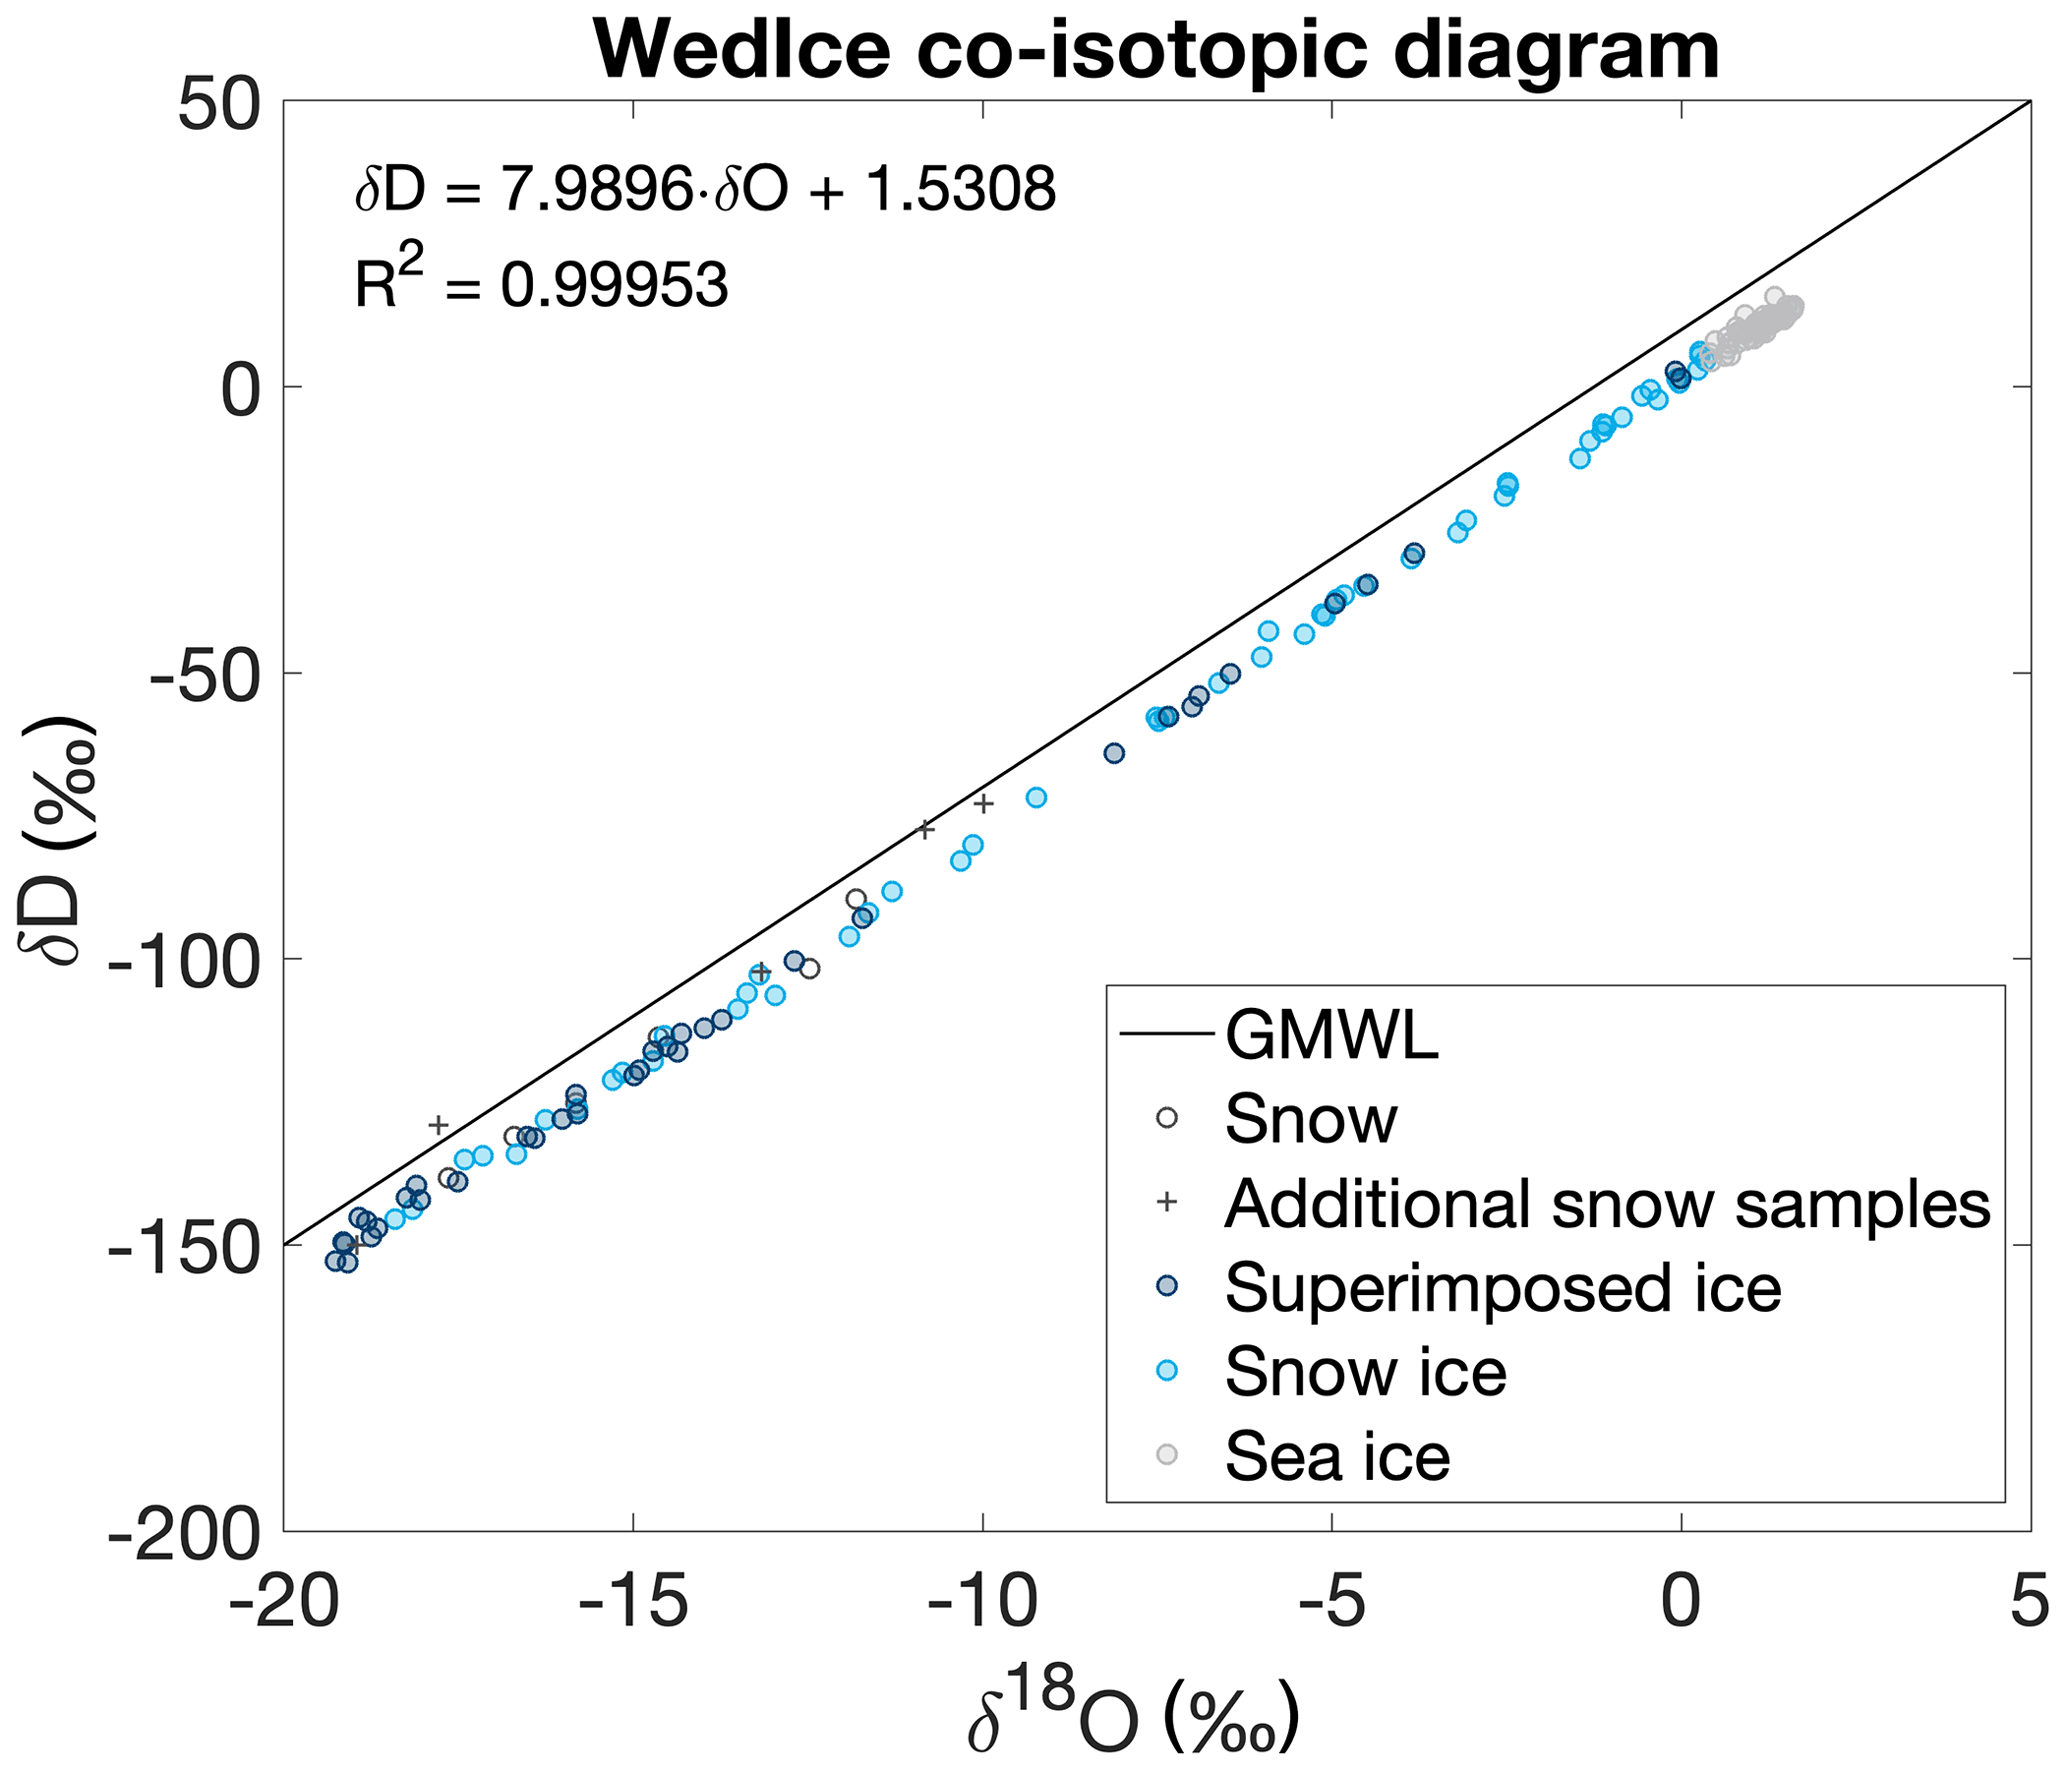
Figure C1Oxygen isotope (δ18O)–hydrogen isotope (δD) diagram for all WedIce samples differentiated by ice type. The global meteoric water line (GMWL; Craig, 1961) is given for comparison. At some ice stations additional snow samples have been taken next to the ice core sampling sites which were also analyzed for isotopes and are added here with crosses (+).
All ERA5 data from ECMWF are accessed and downloaded from the Copernicus Climate Change Service (last access: 12 April 2021). Sea ice concentration data are from the NASA National Snow and Ice Data Center Distributed Active Archive Center, Boulder, Colorado, USA (last access: 30 January 2021). Satellite data of radar backscatter were kindly provided by the Scatterometer Climate Record Pathfinder (SCP) project, sponsored by NASA (http://www.scp.byu.edu/, last access: 28 January 2021). All presented field data are archived at PANGAEA: https://doi.org/10.1594/PANGAEA.928948 (Arndt et al., 2021), https://doi.org/10.1594/PANGAEA.928966 (Arndt and Haas, 2021), and https://doi.org/10.1594/PANGAEA.929010 (Arndt, 2021).
SA, CH, and IP conducted the fieldwork for the WedIce project. HM performed the isotope analysis in the laboratory in Potsdam. TK contributed the backtracked trajectories for the sampled ice floes. SA conducted all analysis for the paper and wrote it with contributions of all co-authors to the discussion and actual writing.
The authors have the following competing interests: Christian Haas is co-editor-in-chief and editor of The Cryosphere.
Publisher's note: Copernicus Publications remains neutral with regard to jurisdictional claims in published maps and institutional affiliations.
This article is part of the special issue “The Weddell Sea and the ocean off Dronning Maud Land: unique oceanographic conditions shape circumpolar and global processes – a multi-disciplinary study (OS/BG/TC inter-journal SI)”. It is not associated with a conference.
We gratefully acknowledge the support of the cruise leader Boris Dorschel, all involved scientists, the helicopter team on board, and the captain and crew of R/V Polarstern during expedition PS118 (grant number AWI_PS118_11). Special thanks go to Erika Allhusen and Kerstin Jerosch for fantastic teamwork on the ice and in the laboratory. Also, we thank Mikaela Weiner for carrying out the stable isotope analyses in the AWI ISOLAB Facility and Martin Werner for fruitful discussions on the isotope data.
This work was supported by the German Research Council (DFG) in the framework of the priority program “Antarctic Research with comparative investigations in the Arctic ice areas” (grant nos. SPP1158 and AR1236/1) and by the Alfred-Wegener-Institut, Helmholtz-Zentrum für Polar- und Meeresforschung.
The article processing charges for this open-access publication were covered by the Alfred Wegener Institute, Helmholtz Centre for Polar and Marine Research (AWI).
This paper was edited by Laura de Steur and reviewed by two anonymous referees.
Ackley, S., Lewis, M., Fritsen, C., and Xie, H.: Internal melting in Antarctic sea ice: Development of “gap layers”, Geophys. Res. Lett., 35, https://doi.org/10.1029/2008GL033644, 2008.
Andreas, E. L. and Ackley, S. F.: On the differences in ablation seasons of Arctic and Antarctic sea ice, J. Atmos. Sci., 39, 440–447, https://doi.org/10.1175/1520-0469(1982)039<0440:OTDIAS>2.0.CO;2, 1982.
Arndt, S.: Snow stratigraphy measurements at ice stations during POLARSTERN cruise PS118, PANGAEA [data set], https://doi.org/10.1594/PANGAEA.929010, 2021.
Arndt, S. and Haas, C.: Spatiotemporal variability and decadal trends of snowmelt processes on Antarctic sea ice observed by satellite scatterometers, The Cryosphere, 13, 1943–1958, https://doi.org/10.5194/tc-13-1943-2019, 2019.
Arndt, S. and Haas, C.: Snow thickness measurements at ice stations during POLARSTERN cruise PS118, PANGAEA [data set], https://doi.org/10.1594/PANGAEA.928966, 2021.
Arndt, S. and Paul, S.: Variability of winter snow properties on different spatial scales in the Weddell Sea, J. Geophys. Res.-Oceans, 123, 8862–8876, https://doi.org/10.1029/2018JC014447, 2018.
Arndt, S., Willmes, S., Dierking, W., and Nicolaus, M.: Timing and regional patterns of snowmelt on Antarctic sea ice from passive microwave satellite observations, J. Geophys. Res.-Oceans, 121, 5916–5930, https://doi.org/10.1002/2015JC011504, 2016.
Arndt, S., Haas, C., Peeken, I., Allhusen, E., and Meyer, H.: Physical ice core properties from ice stations during POLARSTERN cruise PS118, PANGAEA [data set], https://doi.org/10.1594/PANGAEA.928948, 2021.
Cavalieri, D. J., Parkinson, C. L., Gloersen, P., and Zwally, H. J.: Sea Ice Concentrations from Nimbus-7 SMMR and DMSP SSM/I-SSMIS Passive Microwave Data, Version 1., https://doi.org/10.5067/8GQ8LZQVL0VL, 1996, updated yearly.
Cheng, B., Vihma, T., and Launiainen, J.: Modelling of superimposed ice formation and subsurface melting in the Baltic Sea, Geophysica, 39, 31–50, 2003.
Clem, K., Barreira, S., Fogt, R., Colwell, S., Keller, L., Lazzara, M., and Mikolajczyk, D.: Atmospheric circulation and surface observations [in “State of the Climate in 2019”], B. Am. Meteorol. Soc., 101, S304–S306, https://doi.org/10.1175/BAMS-D-20-0090.1, 2020.
Copernicus Climate Change Service: ERA5: Fifth generation of ECMWF atmospheric reanalyses of the global climate, available at: https://cds.climate.copernicus.eu/cdsapp{#}!/home (last access: 12 April 2021), 2017.
Craig, H.: Isotopic variations in meteoric waters, Science, 133, 1702–1703, 1961.
Eicken, H.: Deriving modes and rates of ice growth in the Weddell Sea from microstructural, salinity and stable-isotope data, Antarctic Sea Ice: Physical Processes, Interactions and Variability, Antarct. Res. Ser., 74, 89–122, 1998.
Eicken, H., Lange, M. A., Hubberten, H. W., and Wadhams, P.: Characteristics and distribution patterns of snow and meteoric ice in the Weddell Sea and their contribution to the mass balance of sea ice, Ann. Geophys., 12, 80–93, https://doi.org/10.1007/s00585-994-0080-x, 1994.
Eicken, H., Fischer, H., and Lemke, P.: Effects of the snow cover on Antarctic sea ice and potential modulation of its response to climate change, Ann. Glaciol., 21, 369–376, https://doi.org/10.3189/S0260305500016086, 1995.
Fierz, C., Armstrong, R. L., and Durand, Y.: International Classification for Seasonal Snow on the Ground, Technical Documents in Hydrology, International Association of Cryospheric Sciences/UNESCO, Paris, 2009.
Francis, D., Mattingly, K. S., Temimi, M., Massom, R., and Heil, P.: On the crucial role of atmospheric rivers in the two major Weddell Polynya events in 1973 and 2017 in Antarctica, Science Advances, 6, eabc2695, https://doi.org/10.1126/sciadv.abc2695, 2020.
Granskog, M. A., Rösel, A., Dodd, P. A., Divine, D., Gerland, S., Martma, T., and Leng, M. J.: Snow contribution to first-year and second-year Arctic sea ice mass balance north of Svalbard, J. Geophys. Res.-Oceans, 122, 2539–2549, 2017.
Haas, C.: The seasonal cycle of ERS scatterometer signatures over perennial Antarctic sea ice and associated surface ice properties and processes, Ann Glaciol, 33, 69–73, https://doi.org/10.3189/172756401781818301, 2001.
Haas, C.: Dynamics versus thermodynamics: The sea ice thickness distribution, in: Sea ice: An introduction to its physics, chemistry, biology and geology, Blackwell Science Ltd, Oxford, 1, 82–111, 2003.
Haas, C., Thomas, D. N., and Bareiss, J.: Surface properties and processes of perennial Antarctic sea ice in summer, J. Glaciol., 47, 613–625, https://doi.org/10.3189/172756501781831864, 2001.
Haas, C., Nicolaus, M., Willmes, S., Worby, A., and Flinspach, D.: Sea ice and snow thickness and physical properties of an ice floe in the western Weddell Sea and their changes during spring warming, Deep-Sea Res. Pt. II, 55, 963–974, https://doi.org/10.1016/J.Dsr2.2007.12.020, 2008.
Haas, C., Lobach, J., Hendricks, S., Rabenstein, L., and Pfaffling, A.: Helicopter-borne measurements of sea ice thickness, using a small and lightweight, digital EM system, J. Appl. Geophys., 67, 234–241, 2009.
Haas, C., Arndt, S., Peeken, I., and Allhusen, E.: Chapter Sea Ice in: The Expedition PS118 of the Research Vessel POLARSTERN to the Weddell Sea in 2019, Berichte zur Polar- und Meeresforschung (Reports on polar and marine research), 735, 97–123, https://doi.org/10.2312/BzPM_0735_2019, 2019.
Hoffmann, K., Fernandoy, F., Meyer, H., Thomas, E. R., Aliaga, M., Tetzner, D., Freitag, J., Opel, T., Arigony-Neto, J., Göbel, C. F., Jaña, R., Rodríguez Oroz, D., Tuckwell, R., Ludlow, E., McConnell, J. R., and Schneider, C.: Stable water isotopes and accumulation rates in the Union Glacier region, Ellsworth Mountains, West Antarctica, over the last 35 years, The Cryosphere, 14, 881–904, https://doi.org/10.5194/tc-14-881-2020, 2020.
Hunkeler, P. A., Hendricks, S., Hoppmann, M., Farquharson, C. G., Kalscheuer, T., Grab, M., Kaufmann, M. S., Rabenstein, L., and Gerdes, R.: Improved 1D inversions for sea ice thickness and conductivity from electromagnetic induction data: Inclusion of nonlinearities caused by passive bucking, Geophysics, 81, Wa45–Wa58, https://doi.org/10.1190/Geo2015-0130.1, 2016.
Jeffries, M. O., Worby, A. P., Morris, K., and Weeks, W. F.: Seasonal variations in the properties and structural composition of sea ice and snow cover in the Bellingshausen and Amundsen Seas, Antarctica, J. Glaciol., 43, 138–151, https://doi.org/10.3189/S0022143000002902, 1997.
Jeffries, M. O., Krouse, H. R., Hurst-Cushing, B., and Maksym, T.: Snow-ice accretion and snow-cover depletion on Antarctic first-year sea-ice floes, Ann. Glaciol., 33, 51–60, 2001.
Kawamura, T., Jeffries, M. O., Tison, J.-L., and Krouse, H. R.: Superimposed-ice formation in summer on Ross Sea pack-ice floes, Ann. Glaciol., 39, 563–568, 2004.
Krumpen, T., Belter, H. J., Boetius, A., Damm, E., Haas, C., Hendricks, S., Nicolaus, M., Nöthig, E.-M., Paul, S., and Peeken, I.: Arctic warming interrupts the Transpolar Drift and affects long-range transport of sea ice and ice-rafted matter, Sci. Rep., 9, 1–9, 2019.
Lange, M. A.: Basic properties of Antarctic sea ice as revealed by textural analysis of ice cores, Ann. Glaciol., 10, 95–101, https://doi.org/10.3189/S0260305500004249, 1988.
Lange, M. A. and Eicken, H.: The sea ice thickness distribution in the northwestern Weddell Sea, J. Geophys. Res.-Oceans, 96, 4821–4837, 1991.
Ledley, T. S.: Snow on sea ice: Competing effects in shaping climate, J. Geophys. Res.-Atmos., 96, 17195–17208, 1991.
Leppäranta, M.: A review of analytical models of sea-ice growth, Atmos. Ocean, 31, 123–138, 1993.
Long, D. G., Hardin, P. J., and Whiting, P. T.: Resolution Enhancement of Spaceborne Scatterometer Data, IEEE T. Geosci. Remote, 31, 700–715, https://doi.org/10.1109/36.225536, 1993.
Maksym, T. and Jeffries, M. O.: Phase and compositional evolution of the flooded layer during snow-ice formation on Antarctic sea ice, Ann. Glaciol., 33, 37–44, 2001.
Meehl, G. A., Arblaster, J. M., Chung, C. T., Holland, M. M., DuVivier, A., Thompson, L., Yang, D., and Bitz, C. M.: Sustained ocean changes contributed to sudden Antarctic sea ice retreat in late 2016, Nat. Commun., 10, 1–9, 2019.
Meyer, H., Schönicke, L., Wand, U., Hubberten, H.-W., and Friedrichsen, H.: Isotope studies of hydrogen and oxygen in ground ice-experiences with the equilibration technique, Isot. Environ. Healt. S., 36, 133–149, 2000.
Nicolaus, M., Haas, C., and Bareiss, J.: Observations of superimposed ice formation at melt-onset on fast ice on Kongsfjorden, Svalbard, Phys. Chem. Earth, 28, 1241–1248, https://doi.org/10.1016/j.pce.2003.08.048, 2003.
Nicolaus, M., Haas, C., Bareiss, J., and Willmes, S.: A model study of differences of snow thinning on Arctic and Antarctic first-year sea ice during spring and summer, Ann. Glaciol., 44, 147–153, 2006.
Nicolaus, M., Haas, C., and Willmes, S.: Evolution of first-year and second-year snow properties on sea ice in the Weddell Sea during spring-summer transition, J. Geophys. Res., 114, D17109, https://doi.org/10.1029/2008JD011227, 2009.
Parkinson, C. L.: A 40-y record reveals gradual Antarctic sea ice increases followed by decreases at rates far exceeding the rates seen in the Arctic, P. Natl. Acad. Sci. USA, 116, 201906556, https://doi.org/10.1073/pnas.1906556116, 2019.
Powell, D. C., Markus, T., and Stössel, A.: Effects of snow depth forcing on Southern Ocean sea ice simulations, J. Geophys. Res.-Oceans, 110, https://doi.org/10.1029/2003JC002212, 2005.
Reid, P. and Massom, R.: Successive Antarctic sea ice extent records during 2012, 2013 and 2014 [State of the Climate in 2014.], B. Am. Meteorol. Soc., 96, 163–164, https://doi.org/10.1175/2015BAMSStateoftheClimate.1, 2014.
Reid, P., Stammerjohn, S., Massom, R., Lieser, J., Barreira, S., and Scambos, T.: Sea ice extent, concentration, and seasonality, in: State of the Climate in 2017, B. Am. Meteorol. Soc., 99, 183–185, https://doi.org/10.1175/2018BAMSStateoftheClimate.1, 2018.
Reid, P., Stammerjohn, S., Massom, R., Barreira, S., Scambos, T., and Lieser, J.: Sea ice extent, concentration, and seasonality, in: State of the Climate in 2018, B. Am. Meteorol. Soc., 100, 178–181, https://doi.org/10.1175/2019BAMSStateoftheClimate.1, 2019.
Robertson, R., Padman, L., and Levine, M. D.: Fine structure, microstructure, and vertical mixing processes in the upper ocean in the western Weddell Sea, J. Geophys. Res.-Oceans, 100, 18517–18535, 1995.
Schlosser, P., Bayer, R., Foldvik, A., Gammelsrød, T., Rohardt, G., and Münnich, K. O.: Oxygen 18 and helium as tracers of ice shelf water and water/ice interaction in the Weddell Sea, J. Geophys. Res.-Oceans, 95, 3253–3263, 1990.
Schlosser, E., Haumann, F. A., and Raphael, M. N.: Atmospheric influences on the anomalous 2016 Antarctic sea ice decay, The Cryosphere, 12, 1103–1119, https://doi.org/10.5194/tc-12-1103-2018, 2018.
Tian, L., Gao, Y., Weissling, B., and Ackley, S. F.: Snow-ice contribution to the structure of sea ice in the Amundsen Sea, Antarctica, Ann. Glaciol., 61, 369–378, https://doi.org/10.1017/aog.2020.55, 2020.
Tison, J.-L., Worby, A., Delille, B., Brabant, F., Papadimitriou, S., Thomas, D., De Jong, J., Lannuzel, D., and Haas, C.: Temporal evolution of decaying summer first-year sea ice in the Western Weddell Sea, Antarctica, Deep-Sea Res. Pt. II, 55, 975–987, 2008.
Turner, J., Guarino, M. V., Arnatt, J., Jena, B., Marshall, G. J., Phillips, T., Bajish, C., Clem, K., Wang, Z., and Andersson, T.: Recent decrease of summer sea ice in the Weddell Sea, Antarctica, Geophys. Res. Lett., 47, 1–11, https://doi.org/10.1029/2020GL087127, 2020.
Van Den Broeke, M. R. and Van Lipzig, N. P.: Changes in Antarctic temperature, wind and precipitation in response to the Antarctic Oscillation, Ann. Glaciol., 39, 119–126, 2004.
Vihma, T., Johansson, M. M., and Launiainen, J.: Radiative and turbulent surface heat fluxes over sea ice in the western Weddell Sea in early summer, J. Geophys. Res.-Oceans, 114, C04019, https://doi.org/10.1029/2008JC004995, 2009.
Wang, G., Hendon, H. H., Arblaster, J. M., Lim, E.-P., Abhik, S., and van Rensch, P.: Compounding tropical and stratospheric forcing of the record low Antarctic sea-ice in 2016, Nat. Commun., 10, 1–9, 2019.
Webster, M. A., Rigor, I. G., Perovich, D. K., Richter-Menge, J. A., Polashenski, C. M., and Light, B.: Seasonal evolution of melt ponds on Arctic sea ice, J. Geophys. Res.-Oceans, 120, 5968–5982, https://doi.org/10.1002/2015JC011030, 2015.
- Abstract
- Introduction
- Materials and methods
- Results
- Discussion
- Conclusions
- Appendix A: One-dimensional thermodynamic sea ice model
- Appendix B: Overview of all sampled ice stations
- Appendix C: Co-isotopic diagram
- Data availability
- Author contributions
- Competing interests
- Disclaimer
- Special issue statement
- Acknowledgements
- Financial support
- Review statement
- References