the Creative Commons Attribution 4.0 License.
the Creative Commons Attribution 4.0 License.
 | 28 Jun 2021
The flexural strength of bonded ice
Andrii Murdza
Arttu Polojärvi
Erland M. Schulson
Carl E. Renshaw
The flexural strength of ice surfaces bonded by freezing, termed freeze bond, was studied by performing four-point bending tests of bonded freshwater S2 columnar-grained ice samples in the laboratory. The samples were prepared by milling the surfaces of two ice pieces, wetting two of the surfaces with water of varying salinity, bringing these surfaces together, and then letting them freeze under a compressive stress of about 4 kPa. The salinity of the water used for wetting the surfaces to generate the bond varied from 0 to 35 ppt (parts per thousand). Freezing occurred in air under temperatures varying from −25 to −3 ∘C over periods that varied from 0.5 to ∼ 100 h. Results show that an increase in bond salinity or temperature leads to a decrease in bond strength. The trend for the bond strength as a function of salinity is similar to that presented in Timco and O'Brien (1994) for saline ice. No freezing occurs at −3 ∘C once the salinity of the water used to generate the bond exceeds ∼ 25 ppt. The strength of the saline ice bonds levels off (i.e., saturates) within 6–12 h of freezing; bonds formed from freshwater reach strengths that are comparable or higher than that of the parent material in less than 0.5 h.
- Article
(2285 KB) - Full-text XML
- BibTeX
- EndNote


Freeze bonds form when distinct ice features, such as floating ice floes or ice blocks of a rubble pile, become and remain in contact over a period of time at low enough temperature. Insight into the strength of the bonds is important when, for example, the strength of an ice cover formed of refrozen floes or the strength of an ice rubble pile is estimated. There are several factors that affect the failure of a cover of sea ice, surface waves being a major one that has gained an increasing amount of interest recently (Shen, 2017; Squire, 2020). Under the action of waves, ice covers bend and may undergo flexural failure (Ardhuin et al., 2020; Asplin et al., 2012; Collins et al., 2015; Hwang et al., 2017; Kohout et al., 2014, 2016; Shackleton, 1982). It is relevant to ask if the freeze bonds forming into vertical cracks within a broken and refrozen ice cover form the weakest link at which wave-induced cracks initiate and propagate. During the wave–ice interaction, the freeze bonds deform, and failure occurs under a tensile state of stress arising from flexural deformation. Szabo and Schneebeli (2007) performed tensile tests on sintered ice grains on a scale of ∼ 10−3 m, but to our knowledge, no data on freeze-bond strength under tensile loading at time and length scales relevant to geophysical or ice engineering problems have been published.
The strength of freeze bonds has been tested only under combined compressive and shear loading. Such tests have been related to continuum modeling of ice rubble using material models having yield surfaces resembling that of a Mohr–Coulomb material model (Ettema and Urroz, 1989; Heinonen, 2004; Liferov et al., 2002, 2003; Serré, 2011b, a). The critical shear stress of a Mohr–Coulomb material is given by , where c is the cohesion, σ the compressive stress and φ the internal friction angle of the material. The underlying assumption in testing has been that the failure of the individual freeze bonds within the rubble occurs through the same mode as the failure of the rubble itself. No evidence of this type of similarity between the two scales exists. Instead, the numerical simulations (Polojärvi and Tuhkuri, 2013) suggest that the individual freeze bonds within deforming rubble do not fail due to shear but rather under tensile stresses as the bonded ice blocks move relative to each other. This implies that data on the shear strength of the freeze bonds may not lead to reliable estimates of the shear strength of ice rubble.
In this paper, the strength of freeze bonds under tensile loading is studied. For this purpose, we conducted four-point bending tests using the apparatus described and used by Murzda et al. (2020b). All procedures for testing were designed with the aim of reducing the number of variables for reliable analysis: bonds were formed between milled surfaces of freshwater ice specimens (termed the parent material) and bond freezing and testing were performed in air under a small compressive stress of about 4 kPa. The experimental variables were the freezing time (0.5–∼ 100 h), the sample temperature (−3–−25 ∘C) and the salinity of the water used to form the bond (0–35 ppt, parts per thousand). Bond strength initially increases with freezing time but then appears to level off and to reach a plateau (i.e., to saturate) over several hours. Depending on the salinity of the water from which the bond is formed, the saturation time for bond strength ranges from 0.5 to 12 h. The “saturated strength” of freshwater bonds with finer microstructure appears to reach levels higher than the strength of the parent material with a larger grain size. The results from these experiments, presented below, represent the first set of results on the failure of freeze bonds under tension.
Freshwater ice, used here as the parent material for the freeze-bonded samples, was produced in the laboratory as described in Smith and Schulson (1993) and Golding et al. (2010). Tap water was frozen unidirectionally from top to bottom in a cylindrical 800 L polycarbonate tank, forming pucks of ∼ 1 m in diameter and ∼ 25 cm in thickness. The ice was generally bubble-free and columnar-grained. Thin-section analysis showed that the average column diameter, as measured in the horizontal plane normal to the direction of ice growth using the linear intercept method, was 5.5 ± 1.3 mm. The c axes were randomly oriented within, and confined to, the horizontal plane, suggesting that the ice had an S2 growth texture (in the terminology of Michel and Ramseier, 1971). The ice density was 914.1 ± 1.6 kg m−3 (Golding et al., 2010); Young's modulus in the horizontal plane was 9.52 GPa (Snyder et al., 2016). Once grown, the ice was cut into blocks and stored in plastic cooler boxes in a cold room at −10 ∘C. Specimen preparation is described in detail elsewhere (Iliescu et al., 2017; Murdza et al., 2018, 2019, 2020b, 2021a).
Samples to be freeze-bonded were prepared from the ice blocks by milling them into thin plates. The plates had dimensions of h ∼ 15 mm in thickness (parallel to the long axis of the grains), b ∼ 85 mm in width and l ∼ 300 mm in length. Specimens were allowed to equilibrate to the test temperature for at least 24 h prior to testing.
The plates were then cut perpendicular to their long axis into two parts. In most samples the sawn surfaces were milled after cutting (more below). The two parts of the specimen were then placed in a cold room with a temperature of +2 ∘C for a few minutes. To initiate freeze-bond growth, the sawn and milled surfaces were sprayed with a fine mist of water at a temperature of +2 ∘C and quickly brought into contact by setting the two pieces into a freeze-bonding rig (Fig. 1). The surfaces were wet when brought into contact, but in addition, a syringe was used to inject about 0.1 mL of water to the bond to ensure uniform wetting of the surfaces. Excess water, if any was observed around the bond, was wiped with a tissue. All of the above steps were performed at +2 ∘C to prevent freezing from occurring before setting the sample into the rig. Afterwards, the freeze-bonding rig was moved to another cold room with a desired test temperature.

Figure 1Sketch (a) and photograph (b) of the freeze-bonding rig with an ice sample having the shape of a thin plate: 1 – acrylic plate; 2 – ice specimen; 3 – plastic bar; 4 – spring; 5 – bolt; 6 – fixation plate.
To investigate whether the roughness of the faces in contact affects the bond strength, a few samples had their faces produced by cutting the parent plate with either a coarse (12.7 mm in width, 0.635 mm in thickness and 24 teeth per 100 mm) or a fine (5.16 mm in width, 0.4 mm in thickness and 96 teeth per 100 mm) band saw. Although few in number, results from these initial experiments suggested that surface roughness of the kind we explored had no significant effect on flexural strength. Thus, for all further tests (that led to the results reported below) sawn surfaces were milled for consistency and reproducibility (more in Discussion).
Figure 1 shows a sketch (a) and photograph (b) of the freeze-bonding rig. The rig had a system consisting of two plastic bars and two springs for applying a desired pressure (i.e., compressive stress) to the bond during freezing. In the present experiments, a confining pressure of ∼ 4 kPa was chosen which is in accordance with the maximum hydrostatic pressure within submerged 10 m thick ice rubble mass (Ettema and Schaefer, 1986). The rig was kept in a cold room of the desired temperature (i.e., from −25 to −3 ∘C) during freezing. The base of the rig was made from an acrylic plate having low heat conductivity, ensuring the heat flux in the bond area was mainly along the long axis of the sample. Wax paper was placed between the ice and the acrylic to prevent the freezing of ice onto the rig. All materials of the rig were such that the frictional resistance between them and ice was low. This enabled good control of the confining pressure and sample alignment.
To investigate the effect of the salinity on the bond strength, freshwater and saline water of salinity ranging from 2 to 35 ppt (parts per thousand) were used in spraying. Saline water was prepared in the manner described by Golding et al. (2010, 2014) by adding the commercially available salt mixture Instant Ocean® to tap water. Salinity was measured using a calibrated YSI Pro30 conductivity salinity meter.
After a desired time of freezing, varying from 0.5 to ∼ 100 h, the freeze-bonded sample was removed from the rig, and its flexural strength under four-point bending was measured. For this purpose, a servo-hydraulic loading system (MTS model 810.14) with a custom-built four-point loading frame was utilized. The sketch of the apparatus is shown in Fig. 2 of Murdza et al. (2020b), the photograph of the apparatus is shown in Fig. 5a of this paper, and the apparatus is described in detail elsewhere (Iliescu et al., 2017; Murdza et al., 2018, 2019, 2020b). The outer loading rollers are immobile during testing while the inner loading rollers are attached to the actuator. The hydraulic actuator was driven under displacement control, and loading was controlled using a FlexTest 40 controller. A calibrated load cell was used to measure the load.
The experiments were performed at an outer-fiber center-point displacement rate of 0.1 mm s−1 (or outer-fiber strain rate of about 1.4 × 10⁻⁴ s−1 according to linear-elastic first-order beam theory). This displacement rate resulted in an outer-fiber stress rate of about 1 MPa s−1. As was indicated earlier (Murdza et al., 2020b), the 0.1 mm s−1 displacement rate in cycling results in a period of ∼ 20 s, which is approximately the frequency of ocean swells (Collins et al., 2015). The major outer-fiber stress σf was calculated as follows:
where P is the applied load and L is the distance between the outer pair of loading cylinders and is set by the geometry of the apparatus to be L=254 mm. The flexural strength that we refer to throughout this paper is the maximum major outer-fiber stress that the ice plate can withstand before breaking (assuming the material is linear-elastic and brittle). It is important to note that in all experiments described in this paper the bond formation and breaking of bonded ice occurred at the same temperature. Owing to the confining impact of the loading cylinders of the four-point flexing apparatus (see Fig. 5a in this paper and Fig. 2 of Murdza et al., 2020b) and to the Poisson effect, a biaxial state of tension developed in the ice.
3.1 Flexural strength of parent material
Two measurements on the flexural strength of pristine ice plates, that is, plate-like samples of parent material without a freeze bond, were conducted at −10 ∘C. The strength values obtained were 1.51 and 1.63 MPa. Only two experiments were performed as these values compare favorably with the earlier measurements (Murdza et al., 2020b) on the same kind of ice using the same loading system. Murdza et al. (2020b) reported that the average and the standard deviation of the flexural strength at −3, −10 and −25 ∘C were 1.42 ± 0.16, 1.67 ± 0.22 and 1.89 ± 0.01 MPa, respectively. Further, the measured values are in agreement with the data that are reviewed in Timco and O'Brien (1994), in which the average and standard deviation of 1.73 ± 0.25 MPa is reported for the flexural strength of freshwater ice at temperatures below −4.5 ∘C.
3.2 Flexural strength of bonded ice
3.2.1 Freshwater bond
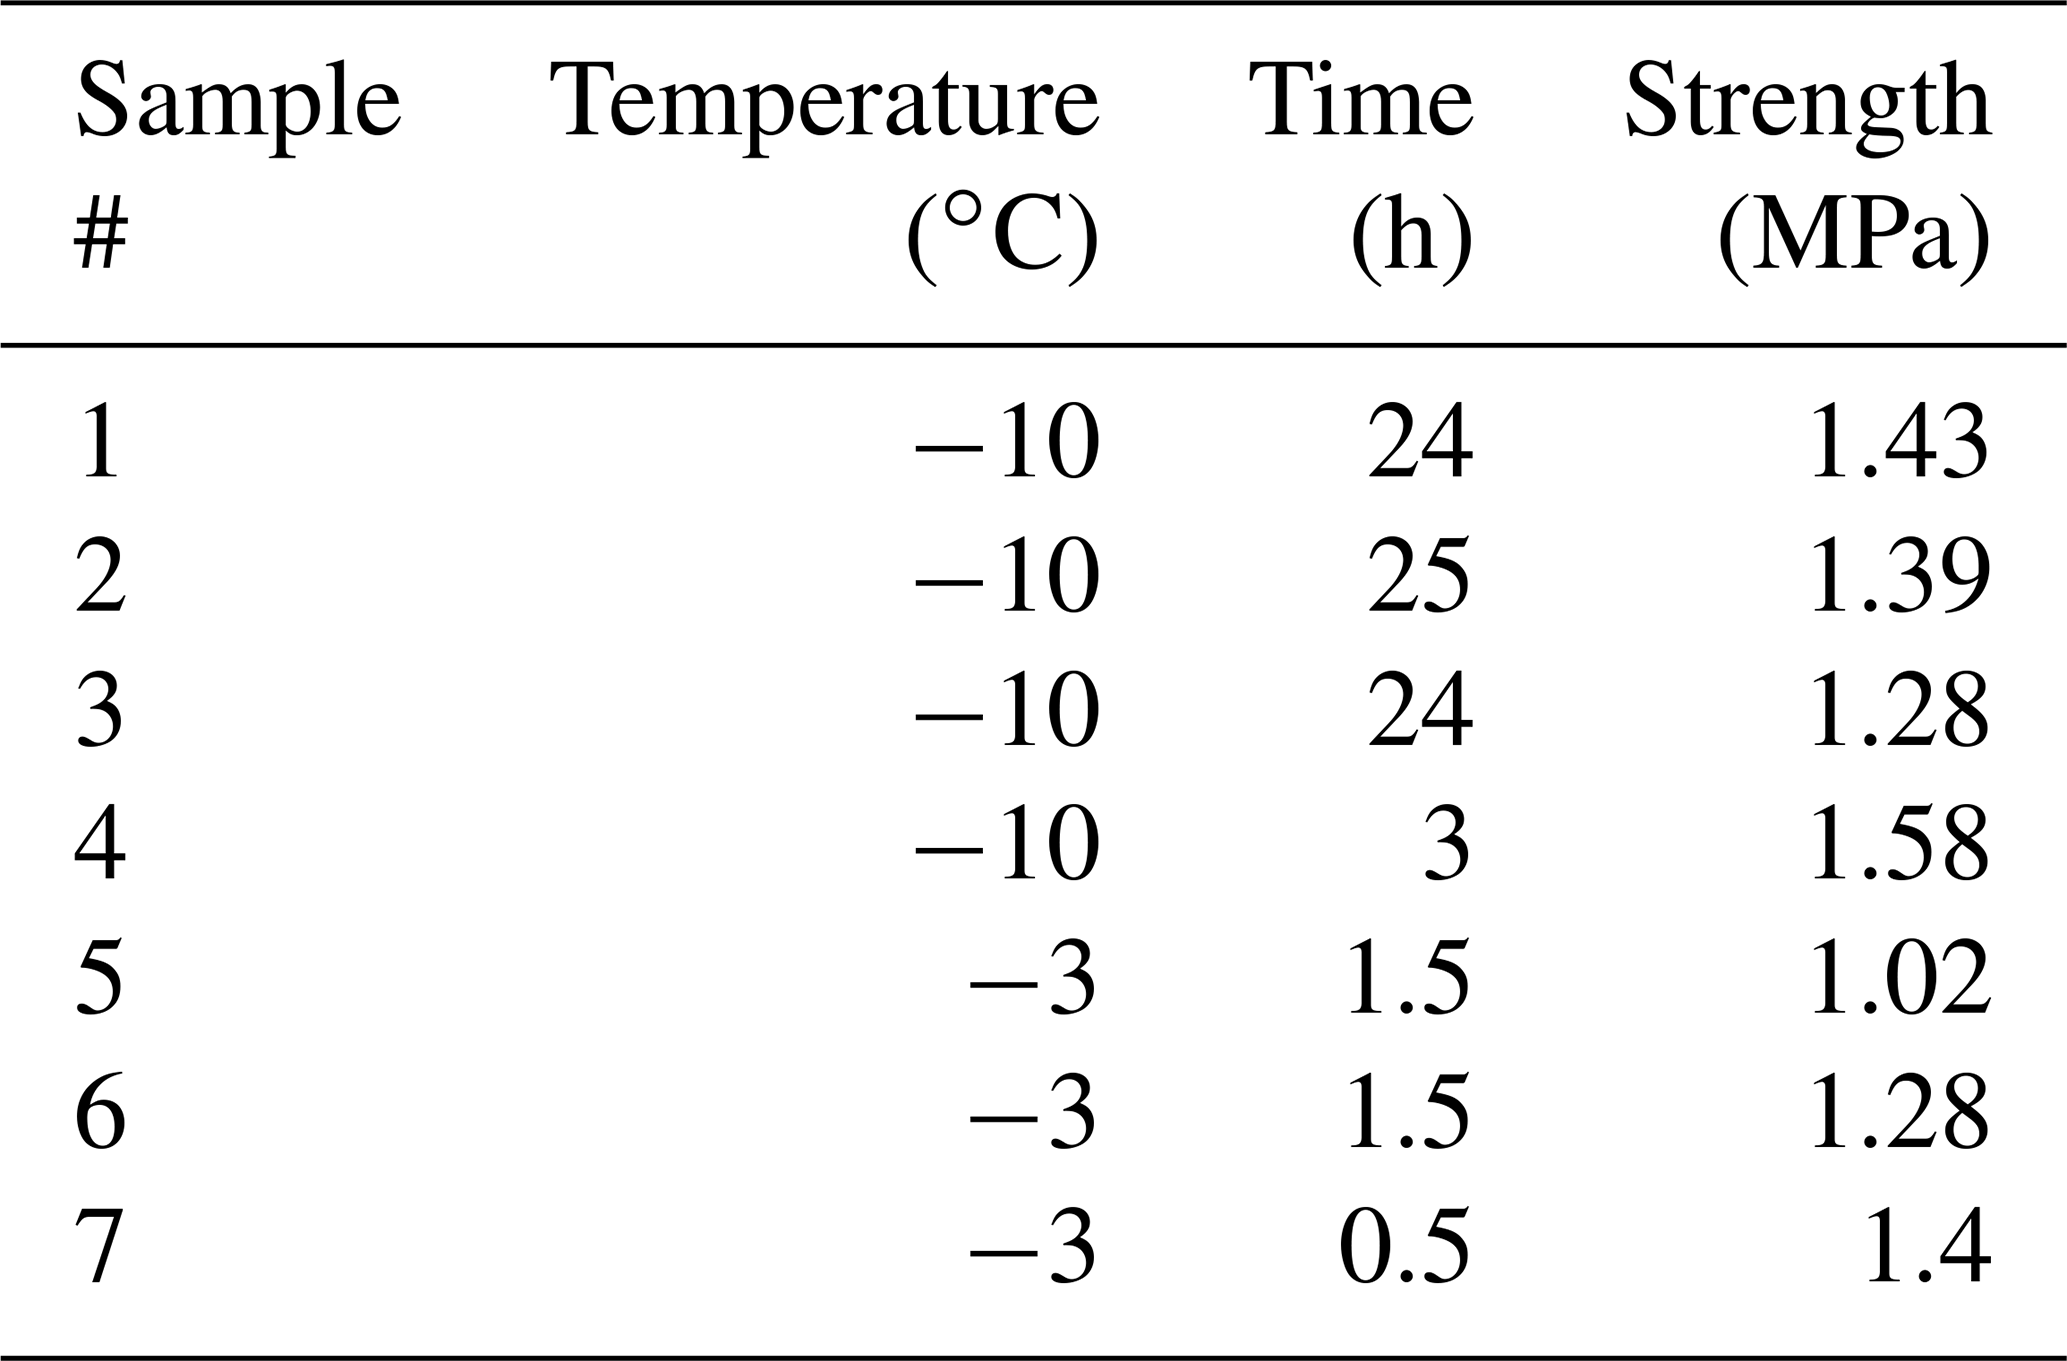
The experiments with a freshwater bond were conducted at −3 and −10 ∘C. The results are listed in Table 1. The shortest time of 0.5 h used here for the bond formation implies that the bond formed in less time. Surprisingly, in all of these experiments, the failure occurred outside of the bond. This suggests that even after only a relatively short period of freezing, the strength of the freshwater bond reaches and exceeds that of the parent material. Even though the results listed in Table 1 show scatter, at −10 ∘C a comparison of the measured flexural strengths to those described in Sect. 3.1 showed that they are not statistically different from the flexural strength of pristine freshwater ice samples (p value = 0.21 and 0.08 for tests at −3 and −10 ∘C, respectively). This is important because it indicates that the above-described bond generation procedure did not hamper the samples by, for example, leading to geometrical misalignments in them.
Table 1Results from testing freshwater bond experiments. The time here is the bond formation time, and the strength is the flexural strength (temperature during flexural testing and bond formation was the same). The reader should notice that in all of these experiments the failure occurred outside of the bond and within the parent material.
3.2.2 Saline bond
Figures 2 and 3 show the results from the experiments performed to investigate the effect on bond strength of the salinity of the water used to create the freeze bond. The data are given in Tables 2 to 4. The tables indicate the experiments in which no freezing occurred (“No”) and the experiments in which bonding occurred, but the bond was too weak to be tested (“Low”). These data are excluded in the figures below.
Table 2Results from testing saline bond experiments at −10 ∘C and 35 ppt.
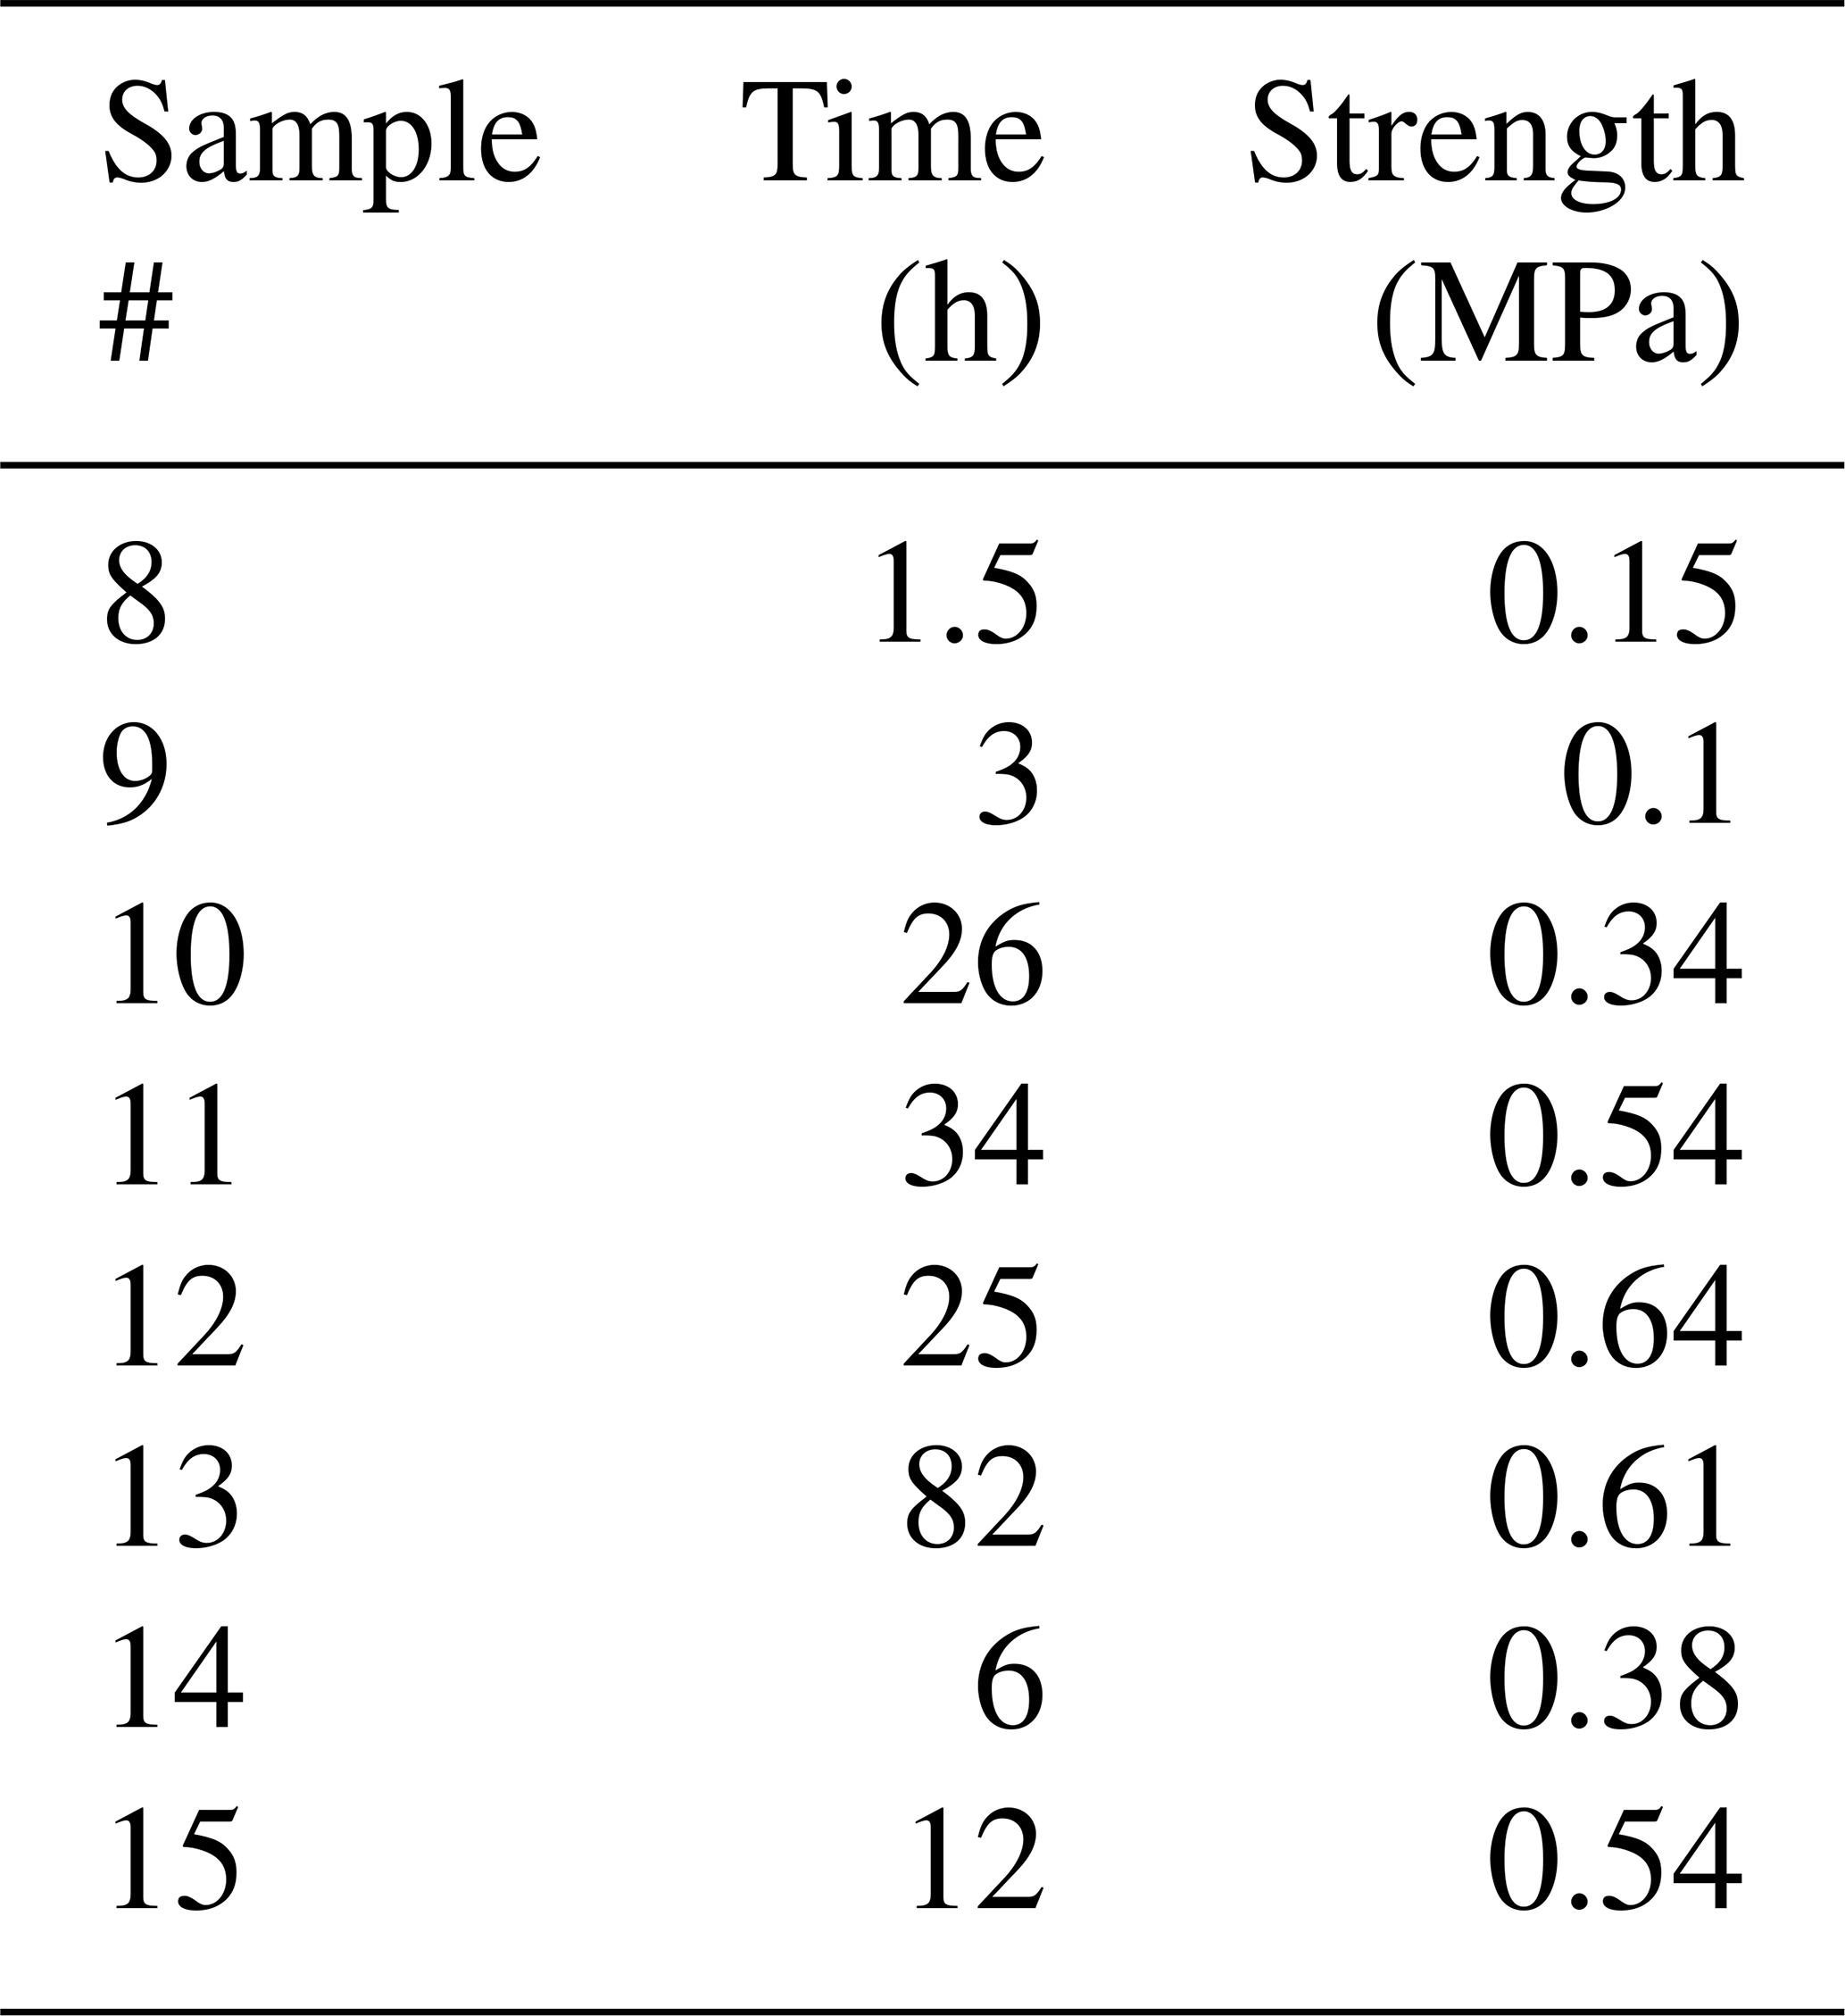
Table 3Results from testing saline bond experiments at −3 ∘C and 12 ppt.
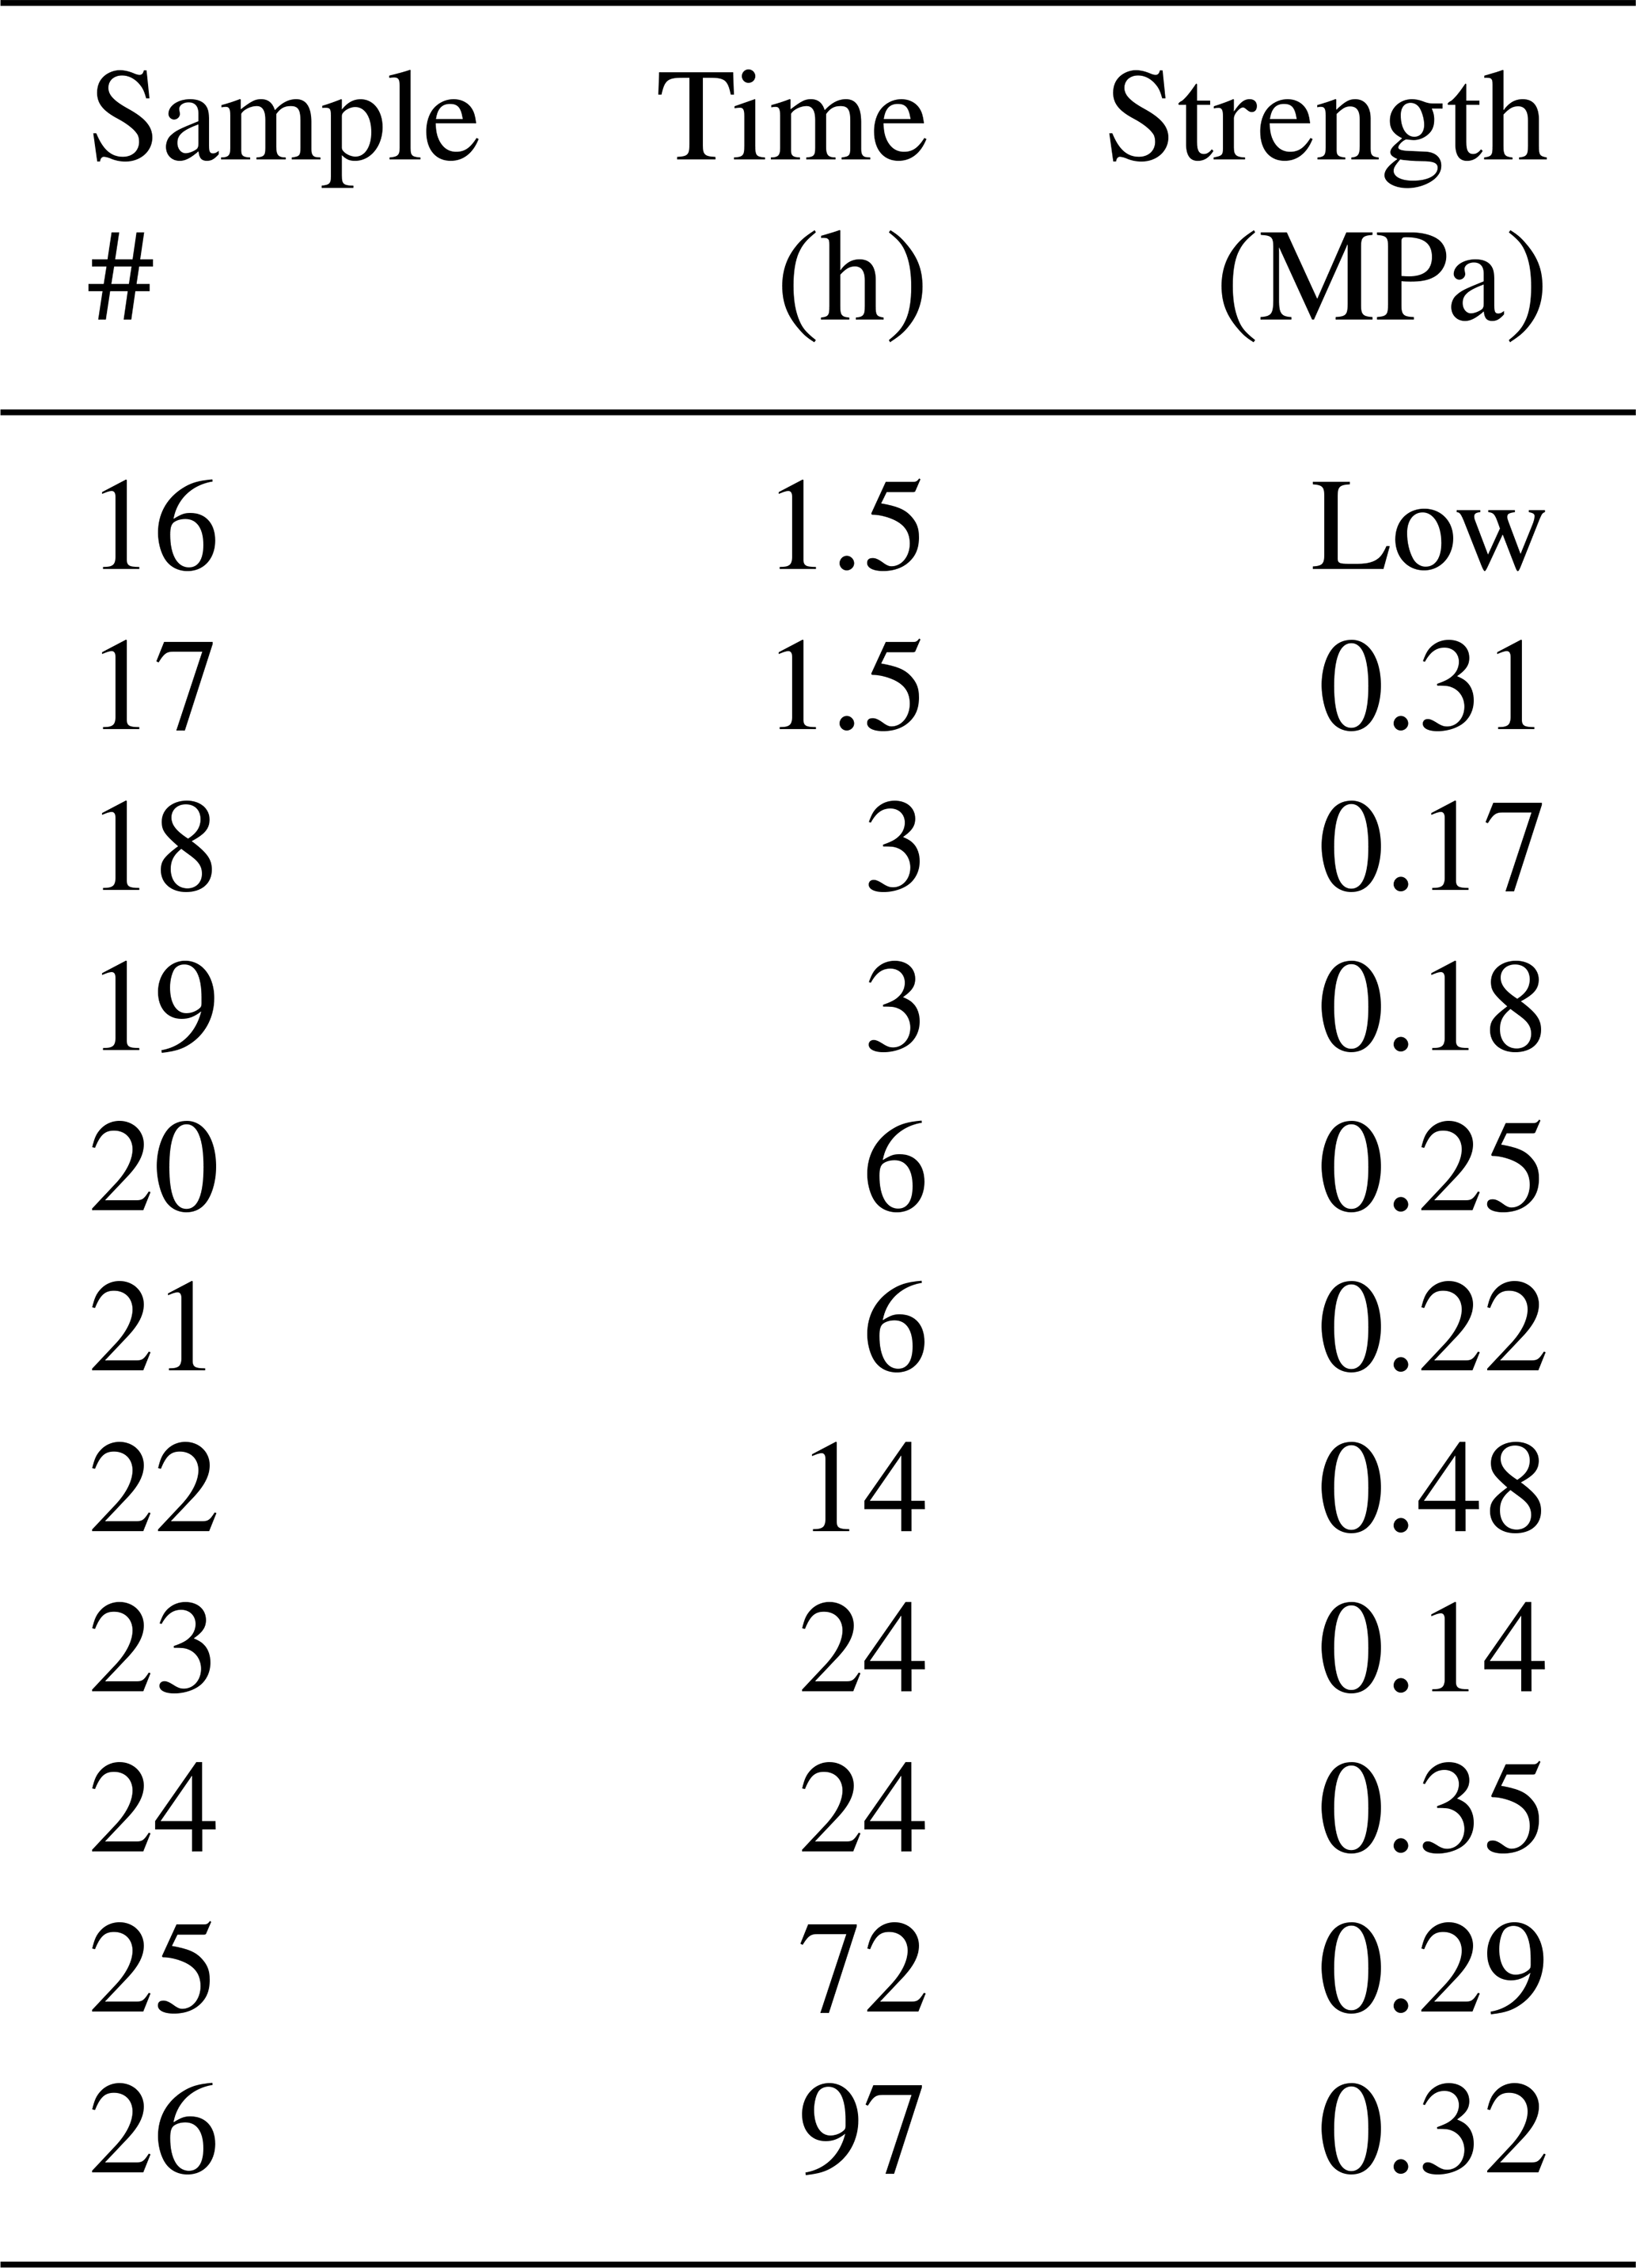
Table 4Results from testing saline bond experiments at −3 ∘C.
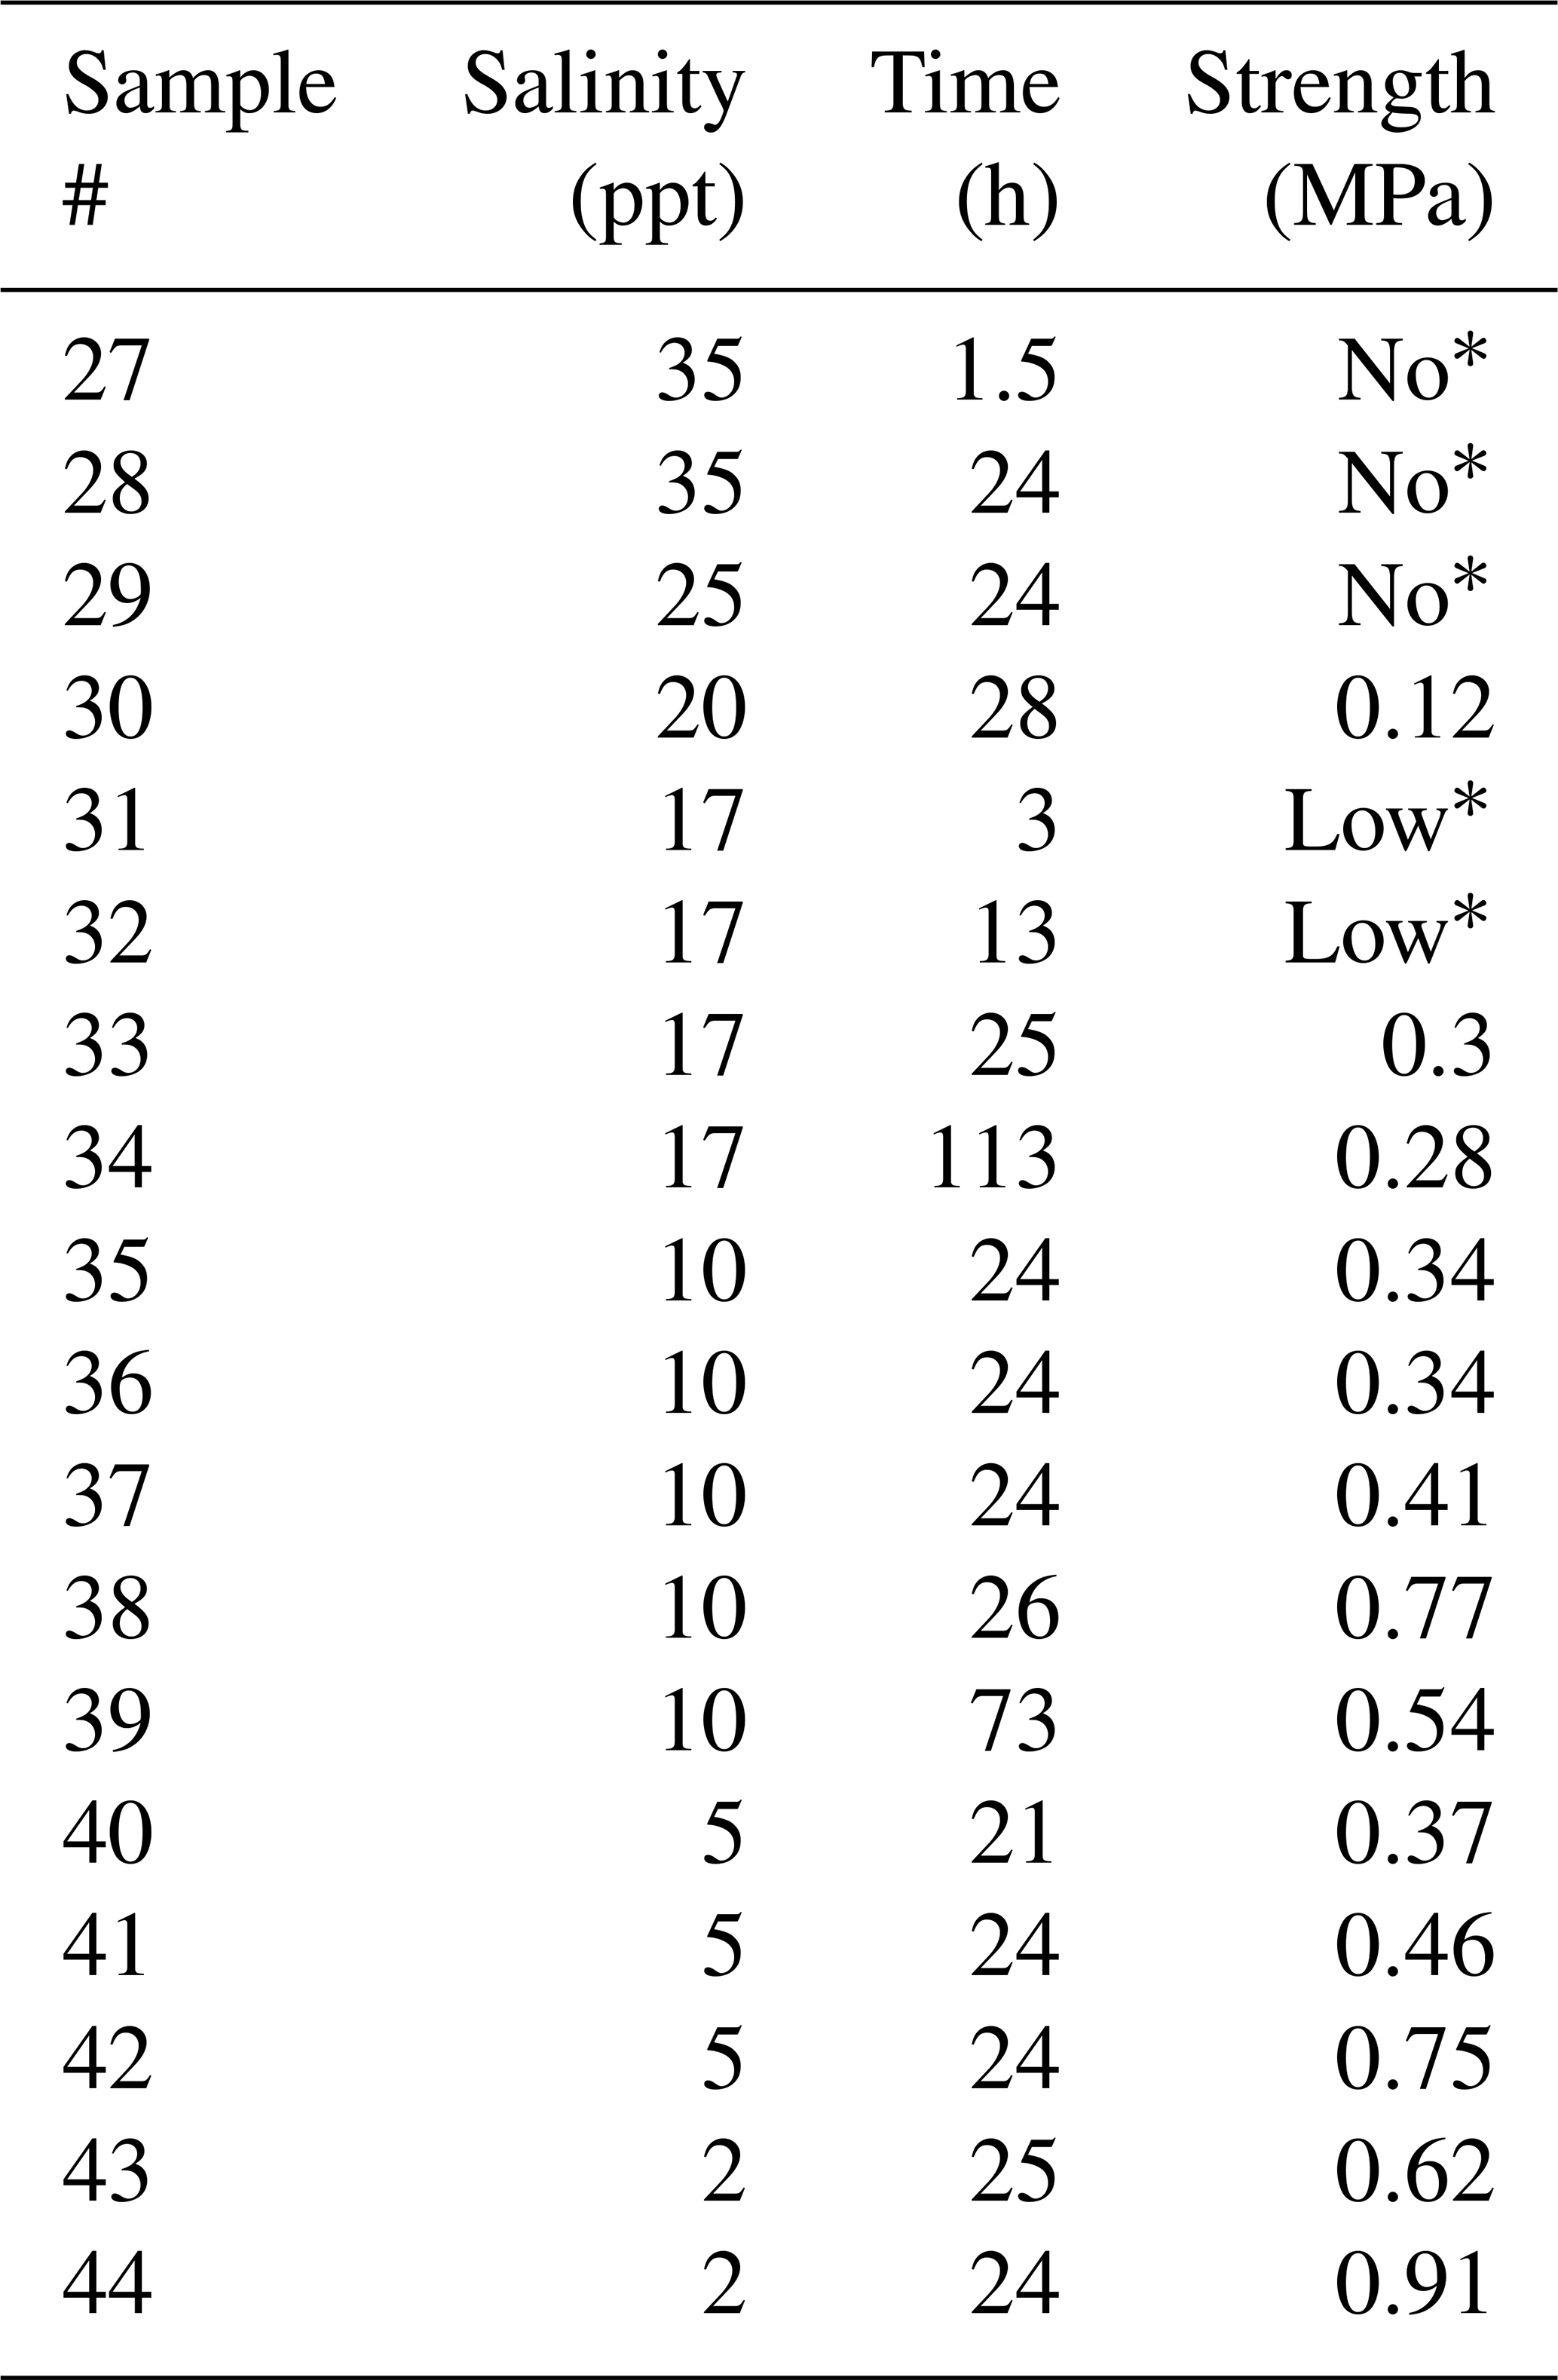
* “No” and “Low” correspond to “no freezing occurred” and “strength was too small to be measured”, respectively.
Figure 2 shows that the strength of the saline bonds increases over time and levels off, or saturates, after about 6–12 h. Thus, the strength of the saline bonds increases at a considerably lower rate than that of the freshwater bonds. A comparison of these results to those in Sect. 3.1 shows that the strength of the saline bonds is well below the strength of the freshwater ice used as the parent material. A comparison of the two data sets in Fig. 2 shows that the saturated strength of the bonds made from water of higher salinity but at lower temperature (35 ppt and −10 ∘C) is about twice that of the bonds with lower salinity but higher temperature (12 ppt and −3 ∘C).
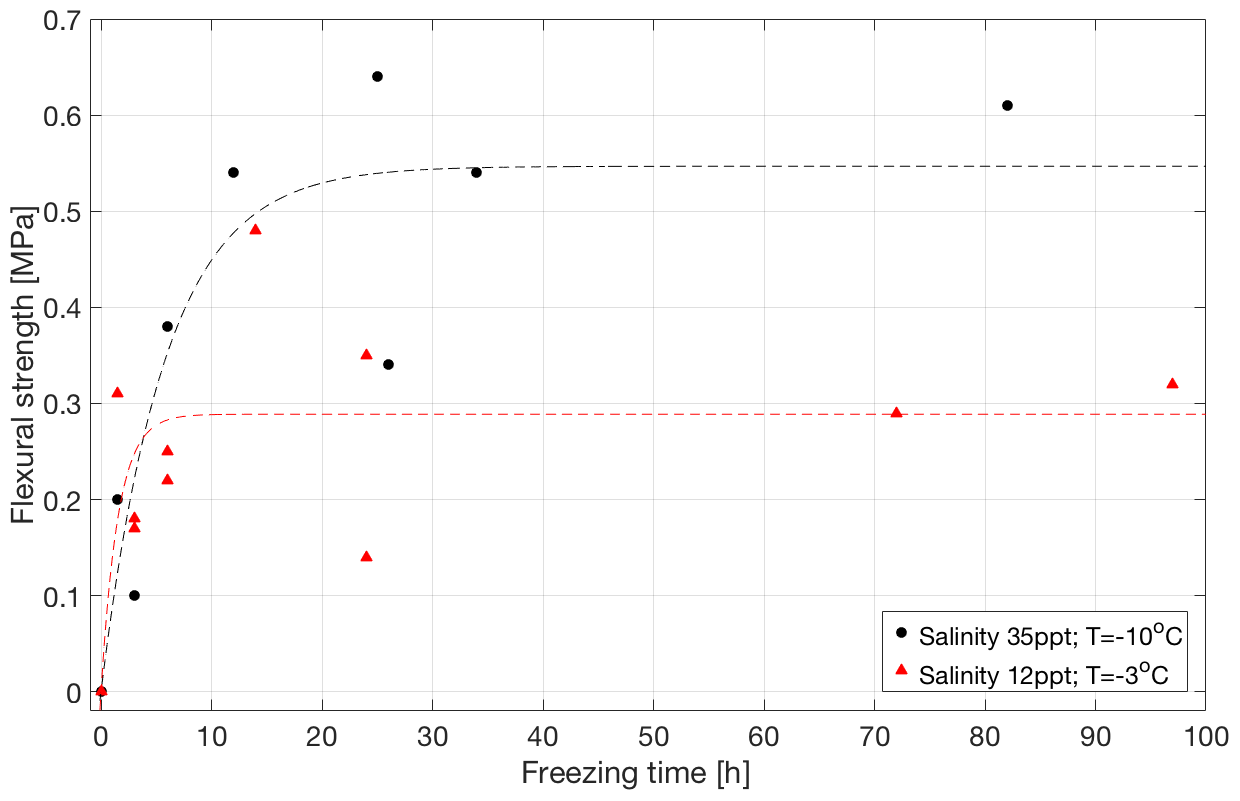
Figure 2Flexural strength as a function of freezing time for bonded ice prepared from salt water of 35 ppt salinity at −10 ∘C (in black) and from salt water of 12 ppt salinity at −3 ∘C (in red).
Figure 3 illustrates how the salinity of the water used to generate the freeze bond at −3 ∘C affects its saturated strength at −3 ∘C. While the measured strength values for low salinities are close to those measured for freshwater ice, the bond strength decreases rapidly with an increase in salinity, and no freezing occurs once the salinity of the salt water used to generate the bond reaches ∼ 25 ppt; even at 17 ppt some bonds were too weak to be tested. This agrees reasonably well with analytical estimates, Appendix A, where formulas that relate strength to volume fraction of solid phase suggest that at salinities of 30 ppt and above at −3 ∘C no freezing occurs. Figure 3 additionally shows two exponential fits, one directly fitted to our data and one by Timco and O'Brien (1994) for the flexural strength of saline ice (equations for these fits provided in Appendix B, where σb is flexural strength, in MPa, and νb is liquid brine content, in parts per thousand). It is important to notice that the fit by Timco and O'Brien (1994) yields lower values than the measured bond strength in the present study for the whole range of salinities used. Likewise, the actual strength values for the freshwater bonds are greater than the ones suggested by Fig. 3 since the failure in these cases occurred outside the bond, indicating that the bond is stronger than the parent material. Both saline and freshwater bonds that develop through freezing appear to reach strengths higher than that of S2 type parent material of the same salinity (strength of saline parent material is assumed to be the same as in Timco and O'Brien, 1994).
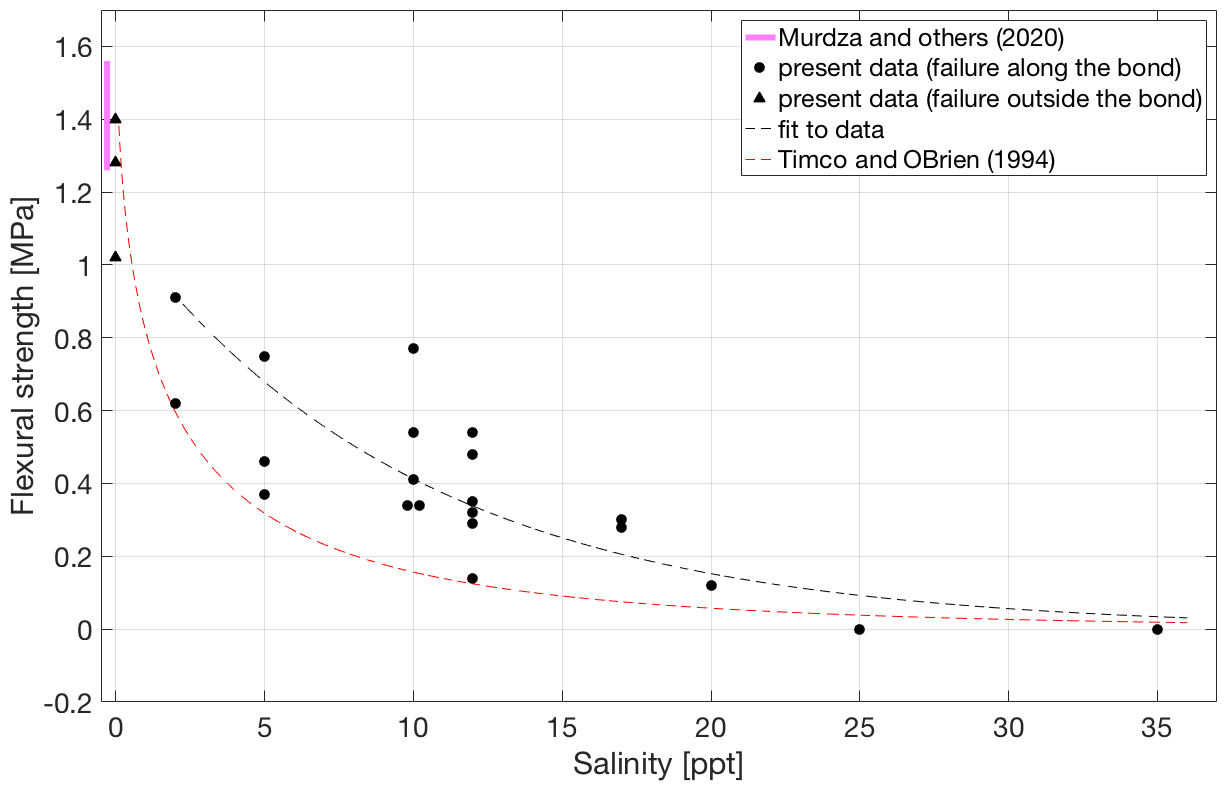
Figure 3Flexural strength at −3 ∘C of bonded ice as a function of the salinity of the salt water from which the bond was formed. The solid pink line indicates the flexural strength 1.42 ± 0.16 MPa of parent freshwater ice at −3 ∘C (Murdza et al., 2020b). A dashed red line is taken from Timco and O'Brien (1994) for the ice at −3 ∘C. A dashed black line is a fit to the present data.
Temperature has a strong effect on the saturated strength of the freeze bonds. Figure 4 and Table 5 summarize the data from experiments on specimens having bonds made from water of 20 ppt salinity at temperatures from −3 to −25 ∘C. Three out of the four specimens at −25 ∘C failed outside of the bond with a measured strength of 1.61 ± 0.12 MPa, which is close to 1.89 MPa measured earlier at −25 ∘C on the same type of freshwater ice (Murdza et al., 2020b). Figure 4 also suggests that no freezing occurs at temperatures above about −3 ∘C, which is in fair agreement with analytical estimates of no strength at T = −2 ∘C in Appendix A. Though the analytical equation from Appendix A predicts well when no freezing occurs, it does not yield a trend that describes most of the data in Fig. 4. The reason may be that for the microstructure of bonds in the present study, strength may not be directly proportional to the volume fraction of the solid phase as the model in Appendix A assumes but rather a non-linear function of the volume fraction of the solid phase.

Figure 4Flexural strength of bonded ice as a function of temperature for bonds formed from water of 20 ppt salinity. Triangular-shaped points at −25 ∘C indicate that actual bond strength is greater than that of the parent material as the failure occurred outside the bond. The dotted line is drawn according to the model in Appendix A.
Table 5Results from testing of ice with bond salinity of 20 ppt after ∼ 24 h of freezing.
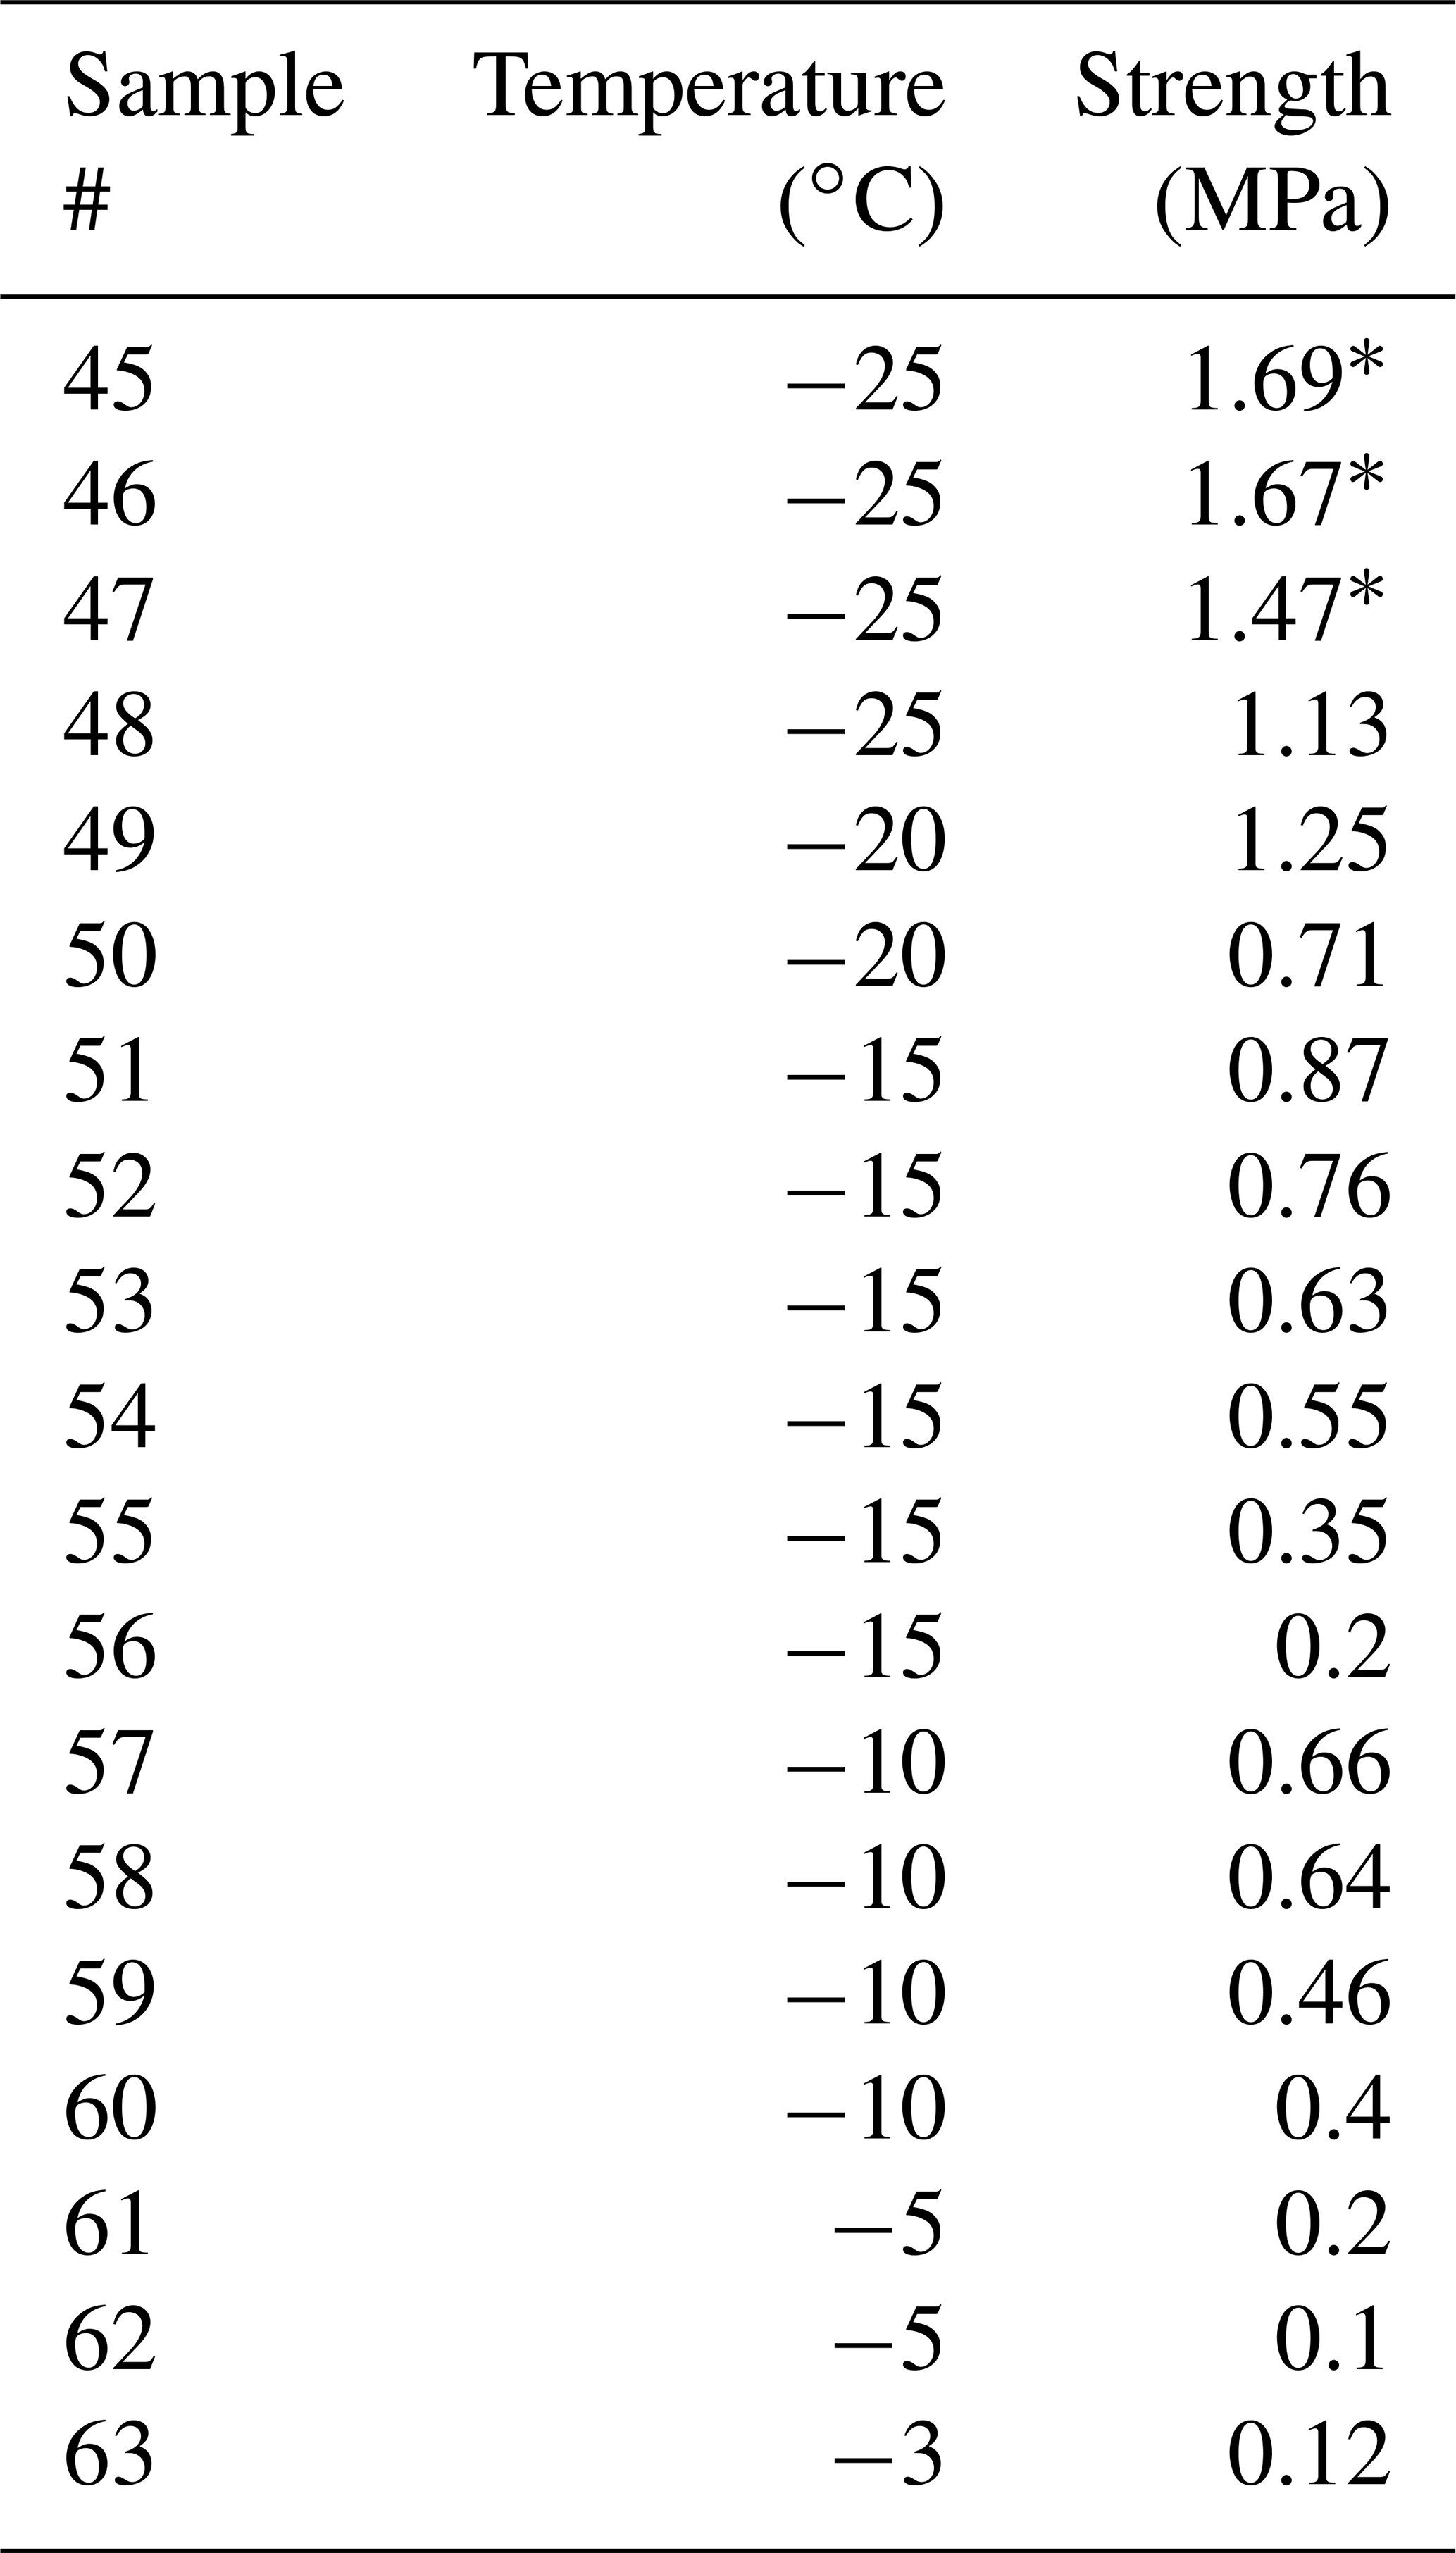
* Failure occurred outside the bond.
Figure 5a–c show an example of the typical samples after failure. Figure 5a shows a case where the crack had initiated at the bond and started to propagate along it but then deviated from it and continued to grow through the parent material. Figure 5b shows a close-up of a bond face-on after the most common type of failure, which occurred along the bond. In this case, both surfaces of the failed freeze bond had a fairly uniform “blurry” appearance which indicates that failure occurred through the ice of the bond. It was also fairly usual for the samples having low salinities, low temperatures and long freezing times that the crack is initiated and starts to propagate along the bond and then slightly deviates and moves parallel to the bond but inside the parent material, as shown in Fig. 5c.
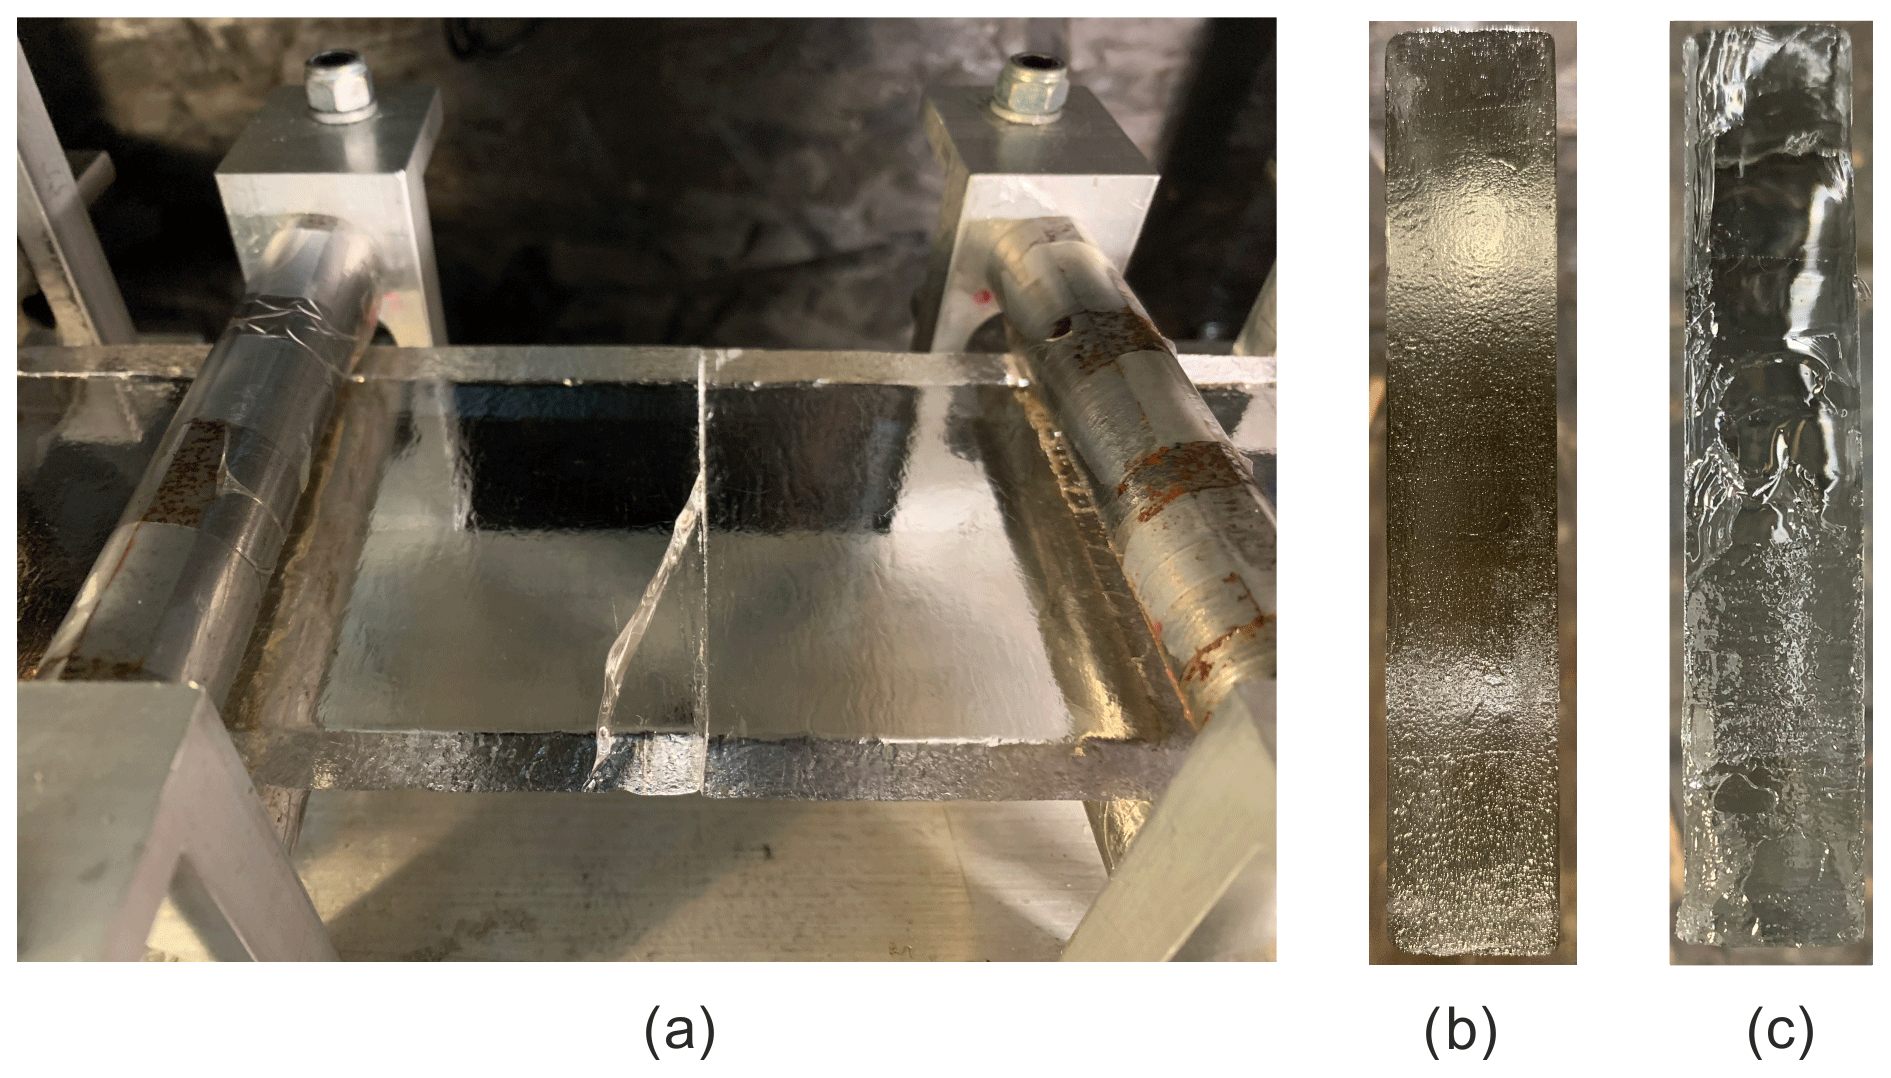
Figure 5Photographs of ice sample #38 right after forced failure (a); the saline bond surface of 10 ppt after a crack propagated fully through the bond, sample #19 (b), and partially through the parent material, sample #47 (c).
The above results are the first measurements to be reported for the strength of freeze bonds under tensile loading. Although the experiments were performed under flexural loading, they provide unique data on the tensile strength of the freeze bonds. Under the loading conditions, the flexural strength of ice is governed by tensile strength (assuming the material is linear-elastic and brittle), although measured strengths are greater by a factor of about 1.7 than strengths measured under pure tensile loading (Ashby and Jones, 2012). The reason is that in bending only a thin layer close to one surface of the sample (and thus a relatively small volume) carries the peak tensile stress, and it is less likely that this volume contains larger flaws, while in tension the entire sample carries the tensile stress, and it is more likely that it will contain larger flaws. Murdza et al. (2020b) showed that the flexural strength of freshwater S2 ice tested on the same loading system as used here compares well with direct measurements of the tensile strength of the same type of ice at the same conditions (Carter, 1971) when divided by 1.7. Murdza et al. (2020a, 2021b) showed that the flexural strength of lake Arctic ice tested under three-point bending is also similar to the one obtained in Murdza et al. (2020b). By using this 1.7 factor to scale the values for saturated bond strengths shown in Fig. 2 leads to tensile strength values of about 0.3 and 0.18 MPa for bonds at −10 and −3 ∘C, respectively.
While there are no other data on the tensile strength of freeze bonds, the results can be compared to the relatively large amount of earlier work on the shear strength of freeze bonds (Bailey et al., 2012; Boroojerdi et al., 2020a, b; Bueide and Høyland, 2015; Ettema and Schaefer, 1986; Helgøy et al., 2013b, a; Høyland and Møllegaard, 2014; Marchenko and Chenot, 2009; Repetto-Llamazares et al., 2011b, a; Serré et al., 2011; Shafrova and Høyland, 2008; Szabo and Schneebeli, 2007). Common values for the shear strength in those studies ranged from 0.01 to 0.1 MPa, which are considerably lower than the flexural strength values measured here. Usually, these strengths have been measured for bonds grown underwater over periods that have not been long enough to reach saturated bond strengths. On the other hand, the highest reported shear strength values of ∼ 0.3–0.7 MPa (Bailey et al., 2012; Boroojerdi et al., 2020b; Shafrova and Høyland, 2008) are within the same range as the flexural strength values measured here. Given that the tensile strength of ice is, on average, lower than the shear strength (Timco and Weeks, 2010), the strength values measured here are perhaps surprisingly high. The high strength values here likely relate to the well-controlled bond growing procedure and possibly to a finer microstructure of the material that comprises the bond.
Work on the shear strength of freeze bonds has led to a conclusion that the evolution of the bond strength has three phases (Boroojerdi et al., 2020b; Repetto-Llamazares et al., 2011b, a): (1) an initial period of a few minutes of increasing strength due to heat flux from the bond to the parent material; (2) a period of some hours of weakening as the temperature of the bond increases due to water surrounding it; and (3) a period of several days of strengthening due to sintering. The evolution of the flexural strength of the bonds in the present experiments is likely similar to that of phases (1) and (3). The initial bond strengthening can be related to the transfer of heat along the long axis of the specimen and the accompanying advance of the ice–water interface. Given that the water layer after wetting the contact surfaces is very thin, the bond strength would be expected to saturate quickly; it is suggested that the process, similar to the above-described phase (1), takes fewer than 30 min at −10 ∘C and a greater amount of time at −3 ∘C, aligning with earlier studies and the result here. This means that for saline bonds, phase (3) has a duration of about 6–12 h, whereas earlier experiments have occasionally had relatively long freezing times, varying from 60 h to 12 d (Bailey et al., 2012; Shafrova and Høyland, 2008).
As part of the studies on the evolution of bond strength, it has been fairly common to investigate the ratio of the bond strength values to that of the parent material (Bailey et al., 2012; Boroojerdi et al., 2020b; Shafrova and Høyland, 2008). Shafrova and Høyland (2008) found that specimens with bonds grown in the field had the strength ratio varying from 0.008 to 0.082 (with a mean of 0.03 after 48 h of bonding). For laboratory-grown bonds, they measured ratios in the range 0.06 to 0.69 (0.21 ± 0.12). The latter values are in line with values reported by Bailey et al. (2012) and Boroojerdi et al. (2020b), who reported ratios up to about 0.70 and 0.85, respectively. Boroojerdi et al. (2020b) suggested an empirical formula to describe the strengthening of a freeze bond during the above-described phase (3). The formula was based on curve fitting and an assumption that the shear strength of the bond approaches asymptotically that of the parent material with increasing sintering time. The experiments here indicate that such an assumption may not be always justified as at least the flexural strength of the freeze bonds can reach values that are above that of the parent material. Aligning with our observations, the results of Høyland and Møllegaard (2014) provide an indication of the shear strength of freeze bonds reaching strengths comparable to that of the parent material. In their uniaxial compression tests on bonded cylindrical samples having an inclined freeze bond, the failure changed from shearing (along the plane of the bond) to axial splitting of the sample in some of the cases.
Ettema and Schaefer (1986) and Repetto-Llamazares et al. (2011b) studied whether freezing in the presence of water has an effect on the shear strength of the freeze bond. The results indicate that shear strength was higher when bonds froze underwater. While Ettema and Schaefer (1986) let the bonding occur with samples submerged in freshwater, Repetto-Llamazares et al. (2011b) used 7 ppt saline water for submerging. Earlier studies on the effect of freezing conditions have not had the opposing surfaces wetted before bringing them together when generating bonds in air. This effectively removes the above-described phase (1) from the bond strength evolution if the result of the heat transfer during the initial period of bond strengthening is assumed to simply be freezing of the liquid at the bond interface. In addition, in these earlier studies, the maximum freezing times for the bonds grown in air varied only from 0.5 to 3 min. As phase (3) takes at least several hours, it seems likely that the mentioned studies have not yielded data on saturated bond strengths for bonds grown in air.
While the new data from the present tests yielded clear trends for the strength of the freeze bonds, they also showed significant scatter. This scatter, even when bond generation was performed in a simplified manner using carefully prepared milled samples (Sect. 2), is an indication that the strength of freeze bonds is a parameter that inherently shows wide scatter. One reason for this, amongst others perhaps, is the detailed microstructure/phase distribution of the bond. The microstructure probably varies somewhat from specimen to specimen, thereby leading to variations in bond strength. The variation is actually of similar magnitude to that observed in experiments on the flexural strength of pristine ice samples made with the same apparatus (Murdza et al., 2020b). The other reason, perhaps, can be attributed to the fact that a small volume of material is tested in bending, and, hence, the variation in tensile strength if measured using a traditional methodology would likely be smaller, given the correlation coefficient between tensile and flexural strength is 1.7.
The fact that in samples with freshwater bonds failure initiated and propagated outside of the bond suggests that the strength of the freshwater bond is greater than the strength of pristine freshwater S2 ice. This may indicate a difference in microstructure between the ice in the freeze bond and the ice of the parent plates. A finer grain size within the bonds may be due to the initial water layer, which was produced by spraying a very fine mist, creating small water droplets working as nucleation sites for the ice grains in the bond. Our argument is supported by the work of Schulson et al. (1984) who showed that tensile strength strongly depends on the grain size, increasing as grain size decreases. A difference in grain size could also explain the fact that the strength versus salinity curve from Timco and O'Brien (1994) is below the trend obtained in the present study (Fig. 3). Concerning of the microstructure of the bonds, one may think that because one phase is dominant it should form the matrix; however, there is at least one class of materials, namely high-temperature nickel-based superalloys (Sims, 1984), in which the minor component forms the matrix. Since we do not know the structure of the bonds in the present study, we cannot be conclusive in this regard.
As expected, both temperature and salinity affect the flexural strength of bonded ice samples. The strength of both freshwater and saline ice increases over time and saturates, although saturation occurs significantly slower in the case of saline bonds. The reason is likely related to the rejected salts and entrapped air at the ice–water interface that slows the rate of the interface advance. The trend of saturated strength versus salinity (Fig. 3) has an exponential functionality similar to what has been suggested by Timco and O'Brien (1994), while the trend of saturated strength versus temperature for saline bonds (Fig. 4) appears, to a first approximation, to be roughly linear. It is important to mention here that the salinities provided in this paper are salinities of the spray and not of meltwater from the bond itself, and this begs the following question: is the bond salinity the same or lower than the salinity of the spray solution? In the formation of a natural floating sea ice cover, of course, the rejection of salts from ice results in meltwater salinities lower than bulk water salinity (Weeks and Ackley, 1986). Given that in our experiments the bond thickness is very small (< 1 mm) and freezing time is relatively short, it is unlikely that all the salt is expelled from the freeze bond, resulting in the bond salinity similar to the spray salinity. Therefore, while the resulting bonds might have salinities slightly lower than the sprayed water, the results yield a reasonably reliable trend of strength as a function of salinity which is very similar to the relationship proposed by Timco and O'Brien (1994).
The effect of surface roughness at the freezing interface was also briefly addressed when performing the experiments. In addition to the milled surfaces with a roughness of 0.43 ± 0.24 × 10⁻⁶ m in the direction of milling and 2.01 ± 0.47 × 10⁻⁶ m in the orthogonal direction (Schulson and Fortt, 2012), experiments were performed on samples with surfaces produced by using a fine and coarse band saw blade, which resulted in ice surface roughness of up to ∼ 1 mm. The results from the experiments with differently produced surfaces showed no significant difference on the strength of freshwater and saline bonds (1.39 MPa vs 1.43 ± 0.15 MPa for freshwater bonds and 0.39 ± 0.13 MPa vs 0.34 ± 0.16 MPa for saline bonds of 12 ppt salinity). As milling could be performed with the highest accuracy from the aspect of sample dimensions and alignment, it was chosen as the technique we used here. Unlike what was observed in the present study, Helgøy et al. (2013a) observed that the surface roughness does affect freeze bond shear strengths, with rougher surfaces leading to bonds having higher strength. The discrepancy between their results and results in the present study suggests that there may exist a threshold value for the surface roughness, after which it affects the bond strength; it is likely that both milled and sawn surfaces used in the present study are too smooth for the effect of surface roughness to be observed. On the other hand, experiments on shear strength usually involve sliding motion between the blocks of the parent material. This motion may become restricted by rough surfaces, which could lead to higher shear loads interpreted to be due to an increase in freeze-bond strength. In tests under tensile loading, such kinematic restrictions do not exist.
Finally, it is worth noting that while this is the first study on the flexural strength of freeze bonds, it is not the complete story. Further work is needed to investigate the effects of other factors such as bond pressure, the character of the parent ice plate, bond microstructure, the width of the opening to be bonded, etc.
Systematic experiments on the flexural strength of freeze bonds were conducted for the first time. The bonds were grown in the air under 4 kPa confining pressure. The parent material was S2 columnar-grained freshwater ice. The salinity of the bond varied from 0 to 35 ppt and freezing temperatures from −3 to −25 ∘C. It is concluded that
- i.
freshwater bond strength exceeds the strength of parent ice in less than 0.5 h upon freezing
- ii.
the saline bonds reach their saturated strength within about 6–12 h of freezing
- iii.
an increase in bond salinity and in freezing temperature leads to a decrease in bond strength
- iv.
the relationship between bond strength and its salinity is similar to the one suggested by Timco and O'Brien (1994)
- v.
no freezing occurs once the salinity of the water used to generate the bond reaches values of about ∼ 25 ppt at −3 ∘C.
Principle
The freeze bond is comprised of essentially two phases, solid (ice) plus liquid (water), barring entrapped air. To a first approximation, we assume that its strength, σfb, is proportional to the volume fraction, fs, of the solid phase. The constant of proportionality, σf0, is the strength of freshwater ice. The relationship is
The volume fraction of the solid phase is obtained from the lever rule:
where Xl and Xs denote the limit of solubility of salt in the liquid (water) and in the solid (ice) phases, respectively, and X0 is the concentration of salt in the water before freezing is initiated. Over the temperature range of interest, the phase diagram for the H20–NaCl system (i.e., thermodynamics) dictates that both Xl and Xs increase with decreasing temperature, T, according to the following relationships:
where T0 denotes the melting point of “pure” ice (273 K) and ml and ms, respectively, denote the slope of the liquidus and the solidus in the phase diagram; both slopes are negative. The solubility of salt in ice is very low and so for practical purposes Xs∼0. Writing the temperature difference as , the volume fraction of ice within the freeze bond from Eq. (A4) is given by
Thus, upon equating X0 to salinity, S, the strength of the freeze bond is given by
Taking ml to be independent of concentration, its value is K psu−1, giving
where ΔT<0.
The model thus dictates that once freezing is complete the strength of the freeze bond decreases linearly with increasing salinity, reaching the limit of zero strength when .
Both dictates are in reasonable agreement with observations.
The red trend in Fig. 3 is taken from Timco and O'Brien (1994) in which the authors report values for flexural strength of saline ice over the range of salinities used in the present study and for temperatures above −4.5 ∘C (σf in MPa), i.e.,
To calculate salinity S (in ppt) based on the liquid brine content νb (brine volume fraction) in Timco and O'Brien (1994), we used the following relationship suggested by Frankenstein and Garner (1967):
where T is the ice temperature in degrees Celsius between −0.5 and −22.9 ∘C. The fit to our data in Fig. 3 (black curve) was made according to the least square method which resulted in the following equation (σf in MPa):
All data points plotted in this work and not provided in tables and more detailed information on the experimental procedure and results are available from the authors upon request.
The code used for data plotting was written in MATLAB. Scripts used for plotting are available from the authors upon request.
AM, AP, EMS and CER designed the experiments, and AM carried them out. AM and AP prepared the manuscript with contributions from all co-authors.
The authors declare that they have no conflict of interest.
Publisher's note: Copernicus Publications remains neutral with regard to jurisdictional claims in published maps and institutional affiliations.
Arttu Polojärvi worked on the article while visiting the Thayer School of Engineering at Dartmouth College (Hanover, NH, USA) during spring 2020, and thanks are extended to Erland Schulson for hosting. The Finnish Maritime Foundation is acknowledged for partial funding of the visit.
This research has been supported by the Academy of Finland (Ice Block Breakage: Experiments and Simulations – ICEBES (grant no. 309830)) and the National Science Foundation (grant no. FAIN 1947-107).
This paper was edited by Jürg Schweizer and reviewed by Robert Ettema and one anonymous referee.
Ardhuin, F., Otero, M., Merrifield, S., Grouazel, A., and Terrill, E.: Ice Breakup Controls Dissipation of Wind Waves Across Southern Ocean Sea Ice, Geophys. Res. Lett., 47, e2020GL087699, https://doi.org/10.1029/2020GL087699, 2020.
Ashby, M. M. and Jones, D. R. H.: Engineering Materials 1: An Introduction to Properties, Applications and Design, 4th Edn., Elsevier/Butterworth-Heinemann, Oxford, UK, 2012.
Asplin, M. G., Galley, R., Barber, D. G., and Prinsenberg, S.: Fracture of summer perennial sea ice by ocean swell as a result of Arctic storms, J. Geophys. Res.-Ocean., 117, 1–12, https://doi.org/10.1029/2011JC007221, 2012.
Bailey, E., Sammonds, P. R., and Feltham, D. L.: The consolidation and bond strength of rafted sea ice, Cold Reg. Sci. Technol., 83–84, 37–48, https://doi.org/10.1016/j.coldregions.2012.06.002, 2012.
Boroojerdi, M. T., Bailey, E., and Taylor, R.: Experimental investigation of rate dependency of freeze bond strength, Cold Reg. Sci. Technol., 178, 1–12, https://doi.org/10.1016/j.coldregions.2020.103120, 2020a.
Boroojerdi, M. T., Bailey, E., and Taylor, R.: Experimental study of the effect of submersion time on the strength development of freeze bonds, Cold Reg. Sci. Technol., 172, 1–16, https://doi.org/10.1016/j.coldregions.2019.102986, 2020b.
Bueide, I. M. and Høyland, K. V.: Confined compression tests on saline and fresh freeze-bonds, in: Proceedings of the 23rd International Conference on Port and Ocean Engineering under Arctic Conditions, Trondheim, Norway, 2015.
Carter, D.: Lois et mechanisms de l'apparente fracture fragile de la glace de riviere et de lac, PhD Thesis, University of Laval, 1971.
Collins, C. O., Rogers, W. E., Marchenko, A., and Babanin, A. V.: In situ measurements of an energetic wave event in the Arctic marginal ice zone, Geophys. Res. Lett., 42, 1863–1870, https://doi.org/10.1002/2015GL063063, 2015.
Ettema, R. and Schaefer, J. A.: Experiments on Freeze-Bonding Between Ice Blocks in Floating Ice rubble, J. Glaciol., 32, 397–403, https://doi.org/10.3189/S0022143000012107, 1986.
Ettema, R. and Urroz, G. E.: On internal friction and cohesion in unconsolidated ice rubble, Cold Reg. Sci. Technol., 16, 237–247, https://doi.org/10.1016/0165-232X(89)90025-6, 1989.
Frankenstein, G. and Garner, R.: Equations for Determining the Brine Volume of Sea Ice from −0.5∘ to −22.9 ∘C, J. Glaciol., 6, 943–944, https://doi.org/10.3189/S0022143000020244, 1967.
Golding, N., Schulson, E. M., and Renshaw, C. E.: Shear faulting and localized heating in ice: The influence of confinement, Acta Mater., 58, 5043–5056, https://doi.org/10.1016/j.actamat.2010.05.040, 2010.
Golding, N., Snyder, S. A., Schulson, E. M., and Renshaw, C. E.: Plastic faulting in saltwater ice, J. Glaciol., 60, 447–452, https://doi.org/10.3189/2014JoG13J178, 2014.
Heinonen, J.: Constitutive modeling of ice rubble in first-year ridge keel, Aalto University, Department of Mechanical Engineering, ISBN: 951-38-6391-3, VTT publications, Dissertation, 142 pp., 2004.
Helgøy, H., Astrup, O. S., and Høyland, K. V.: Laboratory work on freeze-bonds in ice rubble, Part I: Experimental set-up, Ice-properties and freeze-bond texture, in: Proceedings of the 22nd International Conference on Port and Ocean Engineering under Arctic Conditions, Espoo, Finland, 2013a.
Helgøy, H., Astrup, O. S., and Høyland, K. V.: Laboratory work on freeze-bonds in ice rubble, Part II – Results from individual freeze bond experiments, in: Proceedings of the 22nd International Conference on Port and Ocean Engineering under Arctic Conditions, Espoo, Finland, 2013b.
Høyland, K. V. and Møllegaard, A.: Mechanical behaviour of laboratory made freeze-bonds as a function of submersion time, initial ice temperature and sample size, in: 22nd IAHR International Symposium on Ice, 265–273, Singapore, 2014.
Hwang, B., Wilkinson, J., Maksym, E., Graber, H. C., Schweiger, A., Horvat, C., Perovich, D. K., Arntsen, A. E., Stanton, T. P., Ren, J., and Wadhams, P.: Winter-to-summer transition of Arctic sea ice breakup and floe size distribution in the Beaufort Sea, Elem. Sci. Anth., 5, 1–25, https://doi.org/10.1525/elementa.232, 2017.
Iliescu, D., Murdza, A., Schulson, E. M., and Renshaw, C. E.: Strengthening ice through cyclic loading, J. Glaciol., 63, 663–669, https://doi.org/10.1017/jog.2017.32, 2017.
Kohout, A. L., Williams, M. J. M., Dean, S. M., and Meylan, M. H.: Storm-induced sea-ice breakup and the implications for ice extent, Nature, 509, 604–607, https://doi.org/10.1038/nature13262, 2014.
Kohout, A. L., Williams, M. J. M., Toyota, T., Lieser, J., and Hutchings, J.: In situ observations of wave-induced sea ice breakup, Deep-Sea Res. Pt. II, 131, 22–27, https://doi.org/10.1016/j.dsr2.2015.06.010, 2016.
Liferov, P., Jensen, A., and Høyland, K. V.: On analysis of punch tests on ice rubble, in: Proceedings of the 16th International Symposium on Ice, volume 2, Dunedin, New Zealand, 101–110, 2002.
Liferov, P., Jensen, A., and Høyland, K. V.: 3D finite element analysis of laboratory punch tests on ice rubble, in: Proceedings of the 17th International Conference on Port and Ocean Engineering under Arctic Conditions, POAC'03, volume 2, Trondheim, Norway, 611–621, 2003.
Marchenko, A. and Chenot, C.: Regelation of ice blocks in the water and on the air, in: Proceedings of the 20th International Conference on Port and Ocean Engineering under Arctic Conditions, Luleå, Sweden, 2009.
Michel, B. and Ramseier, R. O.: Classification of river and lake ice, Can. Geotech. J., 8, 36–45, https://doi.org/10.1139/t71-004, 1971.
Murdza, A., Schulson, E. M., and Renshaw, C. E.: Hysteretic behavior of freshwater ice under cyclic loading: preliminary results, in: 24th IAHR International Symposium on Ice, Vladivostok, 185–192, 2018.
Murdza, A., Schulson, E. M., and Renshaw, C. E.: The effect of cyclic loading on the flexural strength of columnar freshwater ice, in: Proceedings of the International Conference on Port and Ocean Engineering under Arctic Conditions, POAC, vol. 2019, June 2019.
Murdza, A., Marchenko, A., Schulson, E., Renshaw, C., Sakharov, A., Karulin, E., and Chistyakov, P.: Results of preliminary cyclic loading experiments on natural lake ice and sea ice, in: 25th IAHR International Symposium on Ice, Trondheim, Norway, 1–10, 2020a.
Murdza, A., Schulson, E. M., and Renshaw, C. E.: Strengthening of columnar-grained freshwater ice through cyclic flexural loading, J. Glaciol., 66, 556–566, https://doi.org/10.1017/jog.2020.31, 2020b.
Murdza, A., Schulson, E. M., and Renshaw, C. E.: Behavior of saline ice under cyclic flexural loading, The Cryosphere, 15, 2415–2428, https://doi.org/10.5194/tc-15-2415-2021, 2021a.
Murdza, A., Marchenko, A., Schulson, E. M., and Renshaw, C. E.: Cyclic strengthening of lake ice, J. Glaciol., 67, 182–185, https://doi.org/10.1017/jog.2020.86, 2021b.
Polojärvi, A. and Tuhkuri, J.: On modeling cohesive ridge keel punch through tests with a combined finite-discrete element method, Cold Reg. Sci. Technol., 85, 191–205, https://doi.org/10.1016/j.coldregions.2012.09.013, 2013.
Repetto-Llamazares, A. H. V., Høyland, K. V., and Kim, E.: Experimental studies on shear failure of freeze-bonds in saline ice:. Part II: Ice-ice friction after failure and failure energy, Cold Reg. Sci. Technol., 65, 298–307, https://doi.org/10.1016/j.coldregions.2010.12.002, 2011a.
Repetto-Llamazares, A. H. V., Høyland, K. V., and Evers, K. U.: Experimental studies on shear failure of freeze-bonds in saline ice: Part I. Set-up, failure mode and freeze-bond strength, Cold Reg. Sci. Technol., 65, 286–297, https://doi.org/10.1016/j.coldregions.2010.12.001, 2011b.
Schulson, E. M. and Fortt, A. L.: Friction of ice on ice, J. Geophys. Res.-Sol. Ea., 117, B12204, https://doi.org/10.1029/2012JB009219, 2012.
Schulson, E. M., Lim, P. N., and Lee, R. W.: A brittle to ductile transition in ice under tension, Philos. Mag. A, 49, 353–363, https://doi.org/10.1080/01418618408233279, 1984.
Serré, N.: Mechanical properties of model ice ridge keels, Cold Reg. Sci. Technol., 67, 89–106, https://doi.org/10.1016/j.coldregions.2011.02.007, 2011a.
Serré, N.: Numerical modelling of ice ridge keel action on subsea structures, Cold Reg. Sci. Technol., 67, 107–119, https://doi.org/10.1016/j.coldregions.2011.02.011, 2011b.
Serré, N., Repetto-Llamazares, A. H. V., and Høyland, K.: Experiments on the relation between freezebond and ice rubble strength, part I: shear box experiments, in: Proceedings of the 21st International Conference on Port and Ocean Engineering under Arctic Conditions, Montreal, Canada, 1–18, 2011.
Shackleton, E. H.: South: The Story of Shackleton's Last Expedition, 1914–17, Macmillian, USA, 1982.
Shafrova, S. and Høyland, K. V.: The freeze-bond strength in first-year ice ridges. Small-scale field and laboratory experiments, Cold Reg. Sci. Technol., 54, 54–71, https://doi.org/10.1016/j.coldregions.2007.11.005, 2008.
Shen, H. H.: Wave-Ice Interactions, in: Encyclopedia of Maritime and Offshore Engineering, John Wiley & Sons, Ltd, Chichester, UK, 2017.
Sims, C. T.: A History of Superalloy Metallurgy for Superalloy Metallurgists, in: Superalloys 1984 (Fifth International Symposium), The Minerals, Metals and Materials Society, Warrendale, PA, 399–419, 1984.
Smith, T. R. and Schulson, E. M.: The brittle compressive failure of fresh-water columnar ice under biaxial loading, Acta Metall. Mater., 41, 153–163, https://doi.org/10.1016/0956-7151(93)90347-U, 1993.
Snyder, S. A., Schulson, E. M., and Renshaw, C. E.: Effects of prestrain on the ductile-to-brittle transition of ice, Acta Mater., 108, 110–127, https://doi.org/10.1016/j.actamat.2016.01.062, 2016.
Squire, V. A.: Ocean Wave Interactions with Sea Ice: A Reappraisal, Annu. Rev. Fluid Mech., 52, 37–60, https://doi.org/10.1146/annurev-fluid-010719-060301, 2020.
Szabo, D. and Schneebeli, M.: Subsecond sintering of ice, Appl. Phys. Lett., 90, 1–3, https://doi.org/10.1063/1.2721391, 2007.
Timco, G. W. and O'Brien, S.: Flexural strength equation for sea ice, Cold Reg. Sci. Technol., 22, 285–298, https://doi.org/10.1016/0165-232X(94)90006-X, 1994.
Timco, G. W. and Weeks, W. F.: A review of the engineering properties of sea ice, Cold Reg. Sci. Technol., 60, 107–129, https://doi.org/10.1016/J.COLDREGIONS.2009.10.003, 2010.
Weeks, W. F. and Ackley, S. F.: The Growth, Structure, and Properties of Sea Ice, in: The Geophysics of Sea Ice, Springer US, Boston, MA, 9–164, 1986.
- Abstract
- Introduction
- Experimental procedure
- Results and observations
- Discussion
- Conclusions
- Appendix A: The strength of freeze bonds as a function of salinity and temperature
- Appendix B: Trends in Fig. 3
- Data availability
- Code availability
- Author contributions
- Competing interests
- Disclaimer
- Acknowledgements
- Financial support
- Review statement
- References