the Creative Commons Attribution 4.0 License.
the Creative Commons Attribution 4.0 License.
 | 17 Jun 2021
Sensitivity of subglacial drainage to water supply distribution at the Kongsfjord basin, Svalbard
Thomas V. Schuler
Adrien Gilbert
By regulating the amount, the timing, and the location of meltwater supply to the glacier bed, supraglacial hydrology potentially exerts a major control on the evolution of the subglacial drainage system, which in turn modulates ice velocity. Yet the configuration of the supraglacial hydrological system has received only little attention in numerical models of subglacial hydrology so far. Here we apply the two-dimensional subglacial hydrology model GlaDS (Glacier Drainage System model) to a Svalbard glacier basin with the aim of investigating how the spatial distribution of meltwater recharge affects the characteristics of the basal drainage system. We design four experiments with various degrees of complexity in the way that meltwater is delivered to the subglacial drainage model. Our results show significant differences between experiments in the early summer transition from distributed to channelized drainage, with discrete recharge at moulins favouring channelization at higher elevations and driving overall lower water pressures. Otherwise, we find that water input configuration only poorly influences subglacial hydrology, which instead is controlled primarily by subglacial topography. All experiments fail to develop channels of sufficient efficiency to substantially reduce summertime water pressures, which we attribute to small surface gradients and short melt seasons. The findings of our study are potentially applicable to most Svalbard tidewater glaciers with similar topography and low meltwater recharge. The absence of efficient channelization implies that the dynamics of tidewater glaciers in the Svalbard archipelago may be sensitive to future long-term trends in meltwater supply.
- Article
(8213 KB) - Full-text XML
- BibTeX
- EndNote


Land-based ice masses, as they undergo rapid change due to climate warming, are one of the largest potential contributors to global sea level rise (AMAP, 2017; Pörtner et al., 2019; Wouters et al., 2019). Regional glacier change also affects surface albedo and coastal ecology, as well as hydrological management in terms of flood hazards, hydropower, and freshwater supply (Vincent et al., 2011; Fountain et al., 2012; Carey et al., 2017; Milner et al., 2017). As such, predicting and adapting to future alterations in the glacial landscape relies on better understanding glacier response to changing climate. Field observations and modelling experiments suggest that, besides increasing mass loss, higher meltwater production may also alter ice dynamics (Hewitt, 2013; Gagliardini and Werder, 2018; Davison et al., 2019). Seasonal ice flow accelerations following periods of enhanced surface melt have been reported for glaciers worldwide (e.g. Iken et al., 1983; Mair et al., 2001; Zwally et al., 2002; Copland et al., 2003), including polythermal glaciers in Svalbard (Dunse et al., 2012, 2015; Schellenberger et al., 2015). On shorter timescales (i.e. hourly or daily), episodic speed-ups have been found to be concurrent with intense melting, heavy rainfall, and supraglacial lake drainage (e.g. Joughin et al., 2013; Horgan et al., 2015).
Both theoretical and observational studies have long established that meltwater reaching the glacier bed modulates basal water pressure, which in turn affects ice motion through basal sliding (e.g. Lliboutry, 1968; Bindschadler, 1983; Iken and Bindschadler, 1986; Sugiyama and Gudmundsson, 2004). The relationship between water input and sliding is nevertheless complicated by the morphology of the subglacial hydrological system (Bartholomew et al., 2010; Sole et al., 2011; Sundal et al., 2011; Cowton et al., 2013). High basal water pressures and acceleration are typically related to subglacial flow in distributed linked cavities (inefficient drainage) (Kamb, 1987; Iken and Truffe, 1997), whereas lower water pressures and ice flow deceleration are imputed to channelization (efficient drainage) (Röthlisberger, 1972; Nienow et al., 1998; Schoof, 2010).
Hydrological processes taking place inside and below glaciers are of substantial complexity and remain poorly understood due to the sparsity of direct observations. To address this lack of knowledge, numerous modelling approaches have been developed in the past decades, with much of the recent effort directed at the coupling between glacier dynamics and basal water pressure (e.g. Schoof, 2010; Hewitt, 2013; de Fleurian et al., 2014; Hoffman and Price, 2014; Bueler and Van Pelt, 2015). However, so far only a handful of these studies have focused on the role of supraglacial hydrology in the evolution of the subglacial drainage system (Clason et al., 2015; Wyatt et al., 2015; Banwell et al., 2016; Koziol et al., 2017; Decaux et al., 2019). As pointed out by Flowers (2015), most conceptual models of subglacial hydrology implicitly assume that recharge of surface water to the glacier bed is homogeneous (e.g. Flowers and Clarke, 2002; Hewitt, 2011; Pimentel and Flowers, 2011). In reality, water supply to the subglacial environment is rarely uniform and usually is a result of water accumulation over a catchment on the glacier surface. In the accumulation zone, recharge to the bed is delayed as the surface-generated water percolates through the snow and firn pack, where some fraction may be temporarily retained as slush or may refreeze if subsurface temperatures are below melting point (Pfeffer et al., 1991; Van Pelt et al., 2016). The water that escapes the firn is conveyed by fractures and englacial conduits to the subglacial system (Gulley et al., 2009a, b; Benn and Evans, 2010). In the bare-ice zone, surface meltwater collects in supraglacial streams and is routed downglacier over hundreds of metres to several kilometres. Within one melt season, surface meltwater either enters a crevasse, a moulin, or a supraglacial lake or leaves the glacier by running off the glacier edge. Both crevasses and moulins are important surface-to-bed hydrological connections as they can be found over the entire glacier. Moulins are near-vertical conduits that result from water pouring into a crevasse and melt-enlarging it through frictional heating. As they are typically fed by supraglacial streams, moulins capture run-off from upstream watersheds. By transferring significant volumes of water to the glacier bed at discrete points, moulins can initiate channels in subglacial regions that may not be predicted by simple hydrological models which use the minimum hydraulic potential pathway to determine channel locations (Gulley et al., 2012). Moulins persist over multiple years if they receive frequent water delivery from the supraglacial system, and they therefore may have a long-lived impact on the subglacial hydrology (Catania and Neumann, 2010). Consequently, explicit representation of water recharge to the base of glaciers may be crucial to accurately simulate how the subglacial hydrological system and hence ice dynamics respond to increased meltwater production and variability in a warming climate.
Here we apply a two-dimensional model of subglacial hydrology (GlaDS, Glacier Drainage System model) (Werder et al., 2013) to a Svalbard polythermal glacier basin. The model, which couples distributed and channelized drainage, is forced with supply rates from a gridded surface-energy-balance–snow model (Van Pelt et al., 2019). We define different water input configurations that include spatially continuous and/or discrete subglacial water recharge with aims to (a) investigate how approximations about water supply to the bed affect the development of the modelled subglacial hydrological system and (b) describe the basal drainage system at the Kongsfjord basin, with special focus on basal water pressure distribution, drainage efficiency, and its implications for glacier sliding.
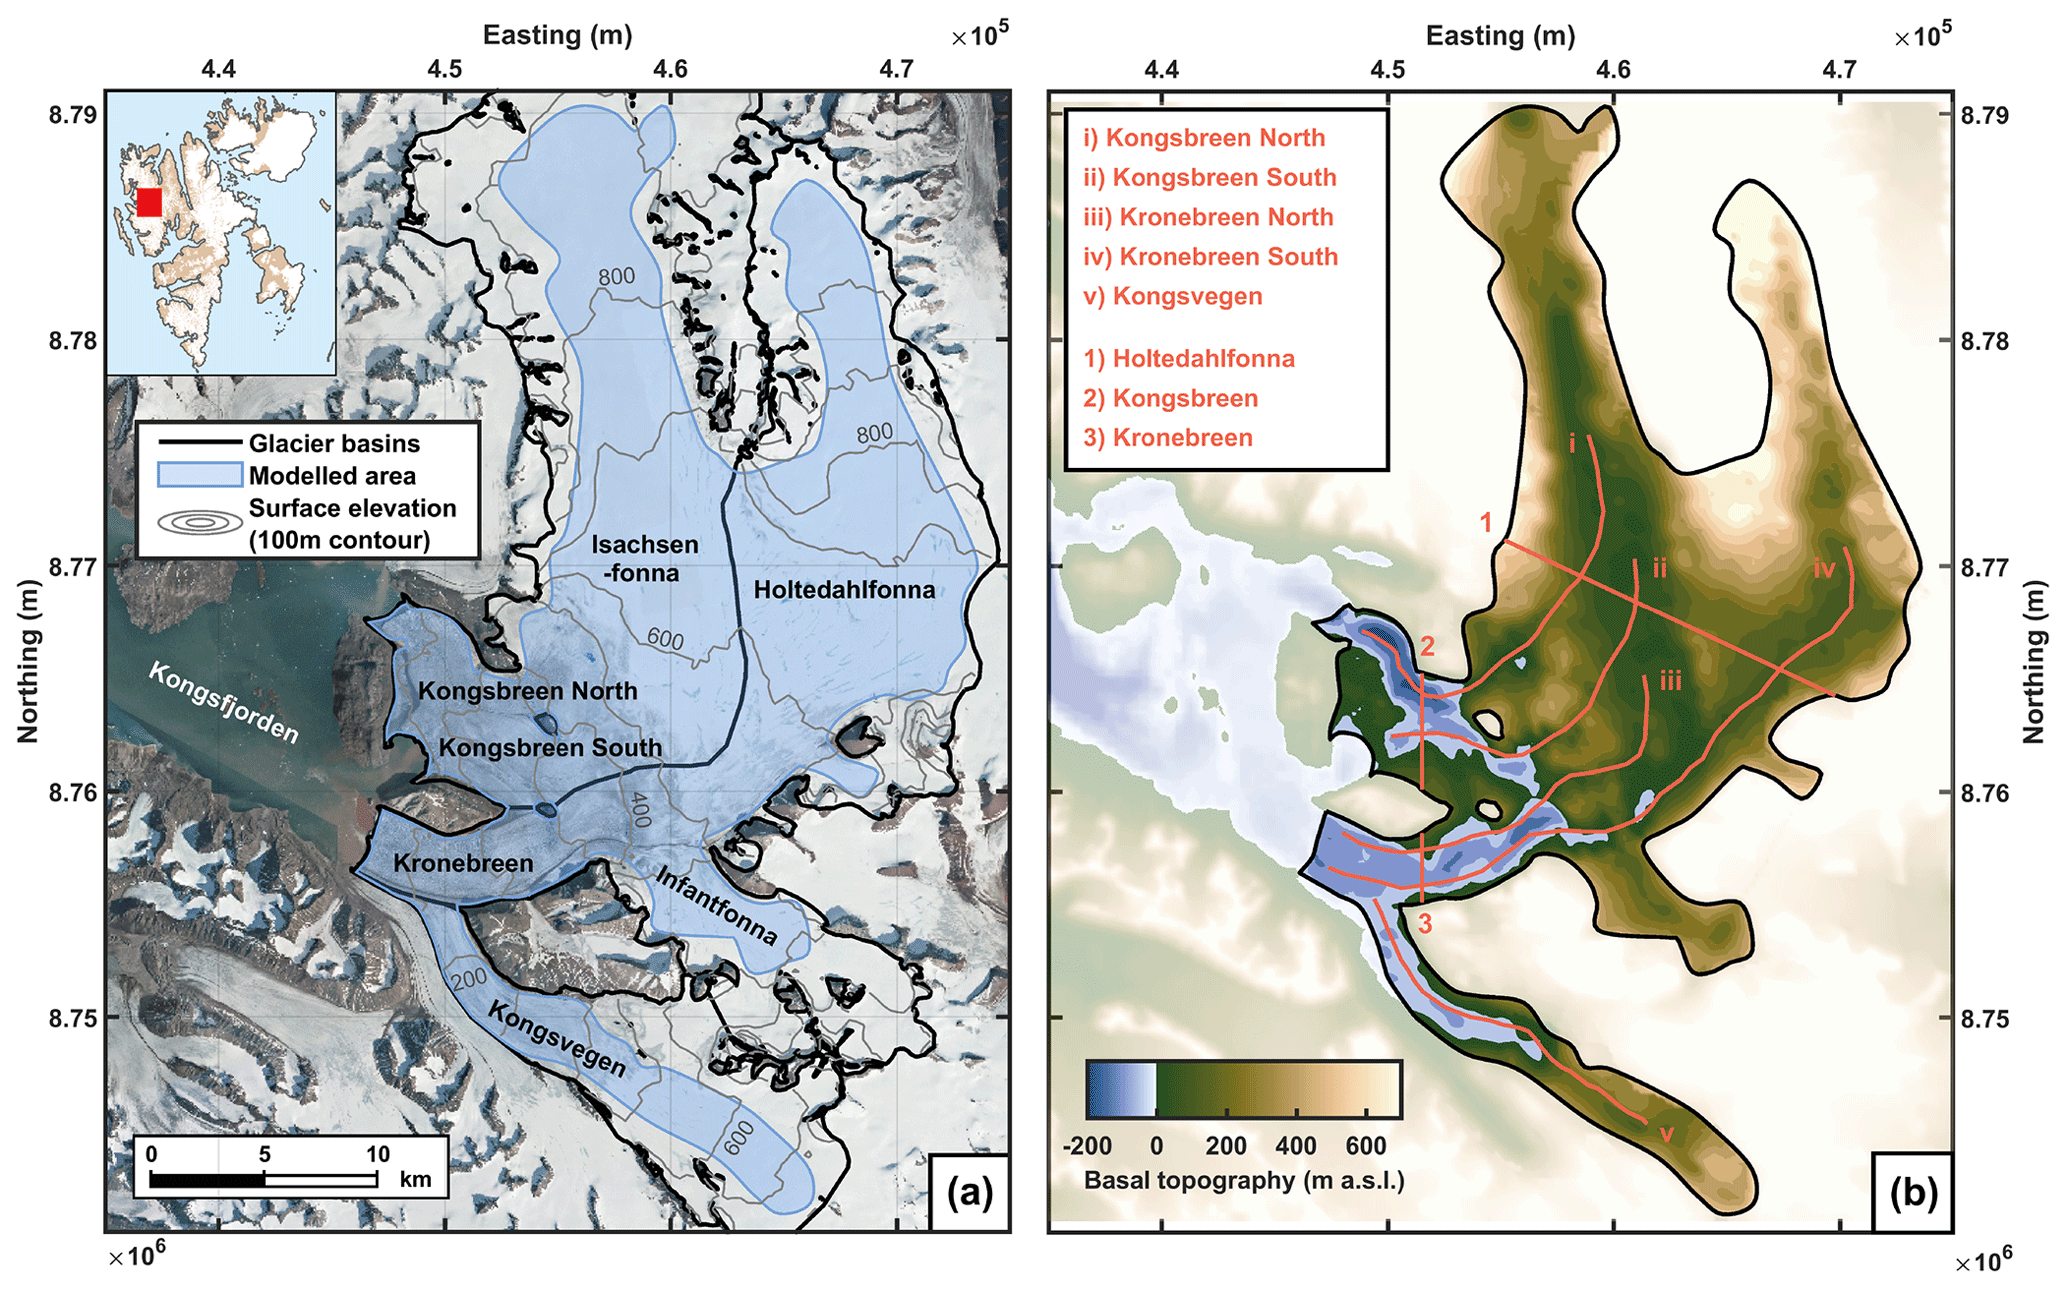
Figure 1Kongsfjord basin with black line outlining the model domain. (a) Surface topography (Lindbäck et al., 2018) (background image: https://toposvalbard.npolar.no/ (last access: 27 March 2020), Norwegian Polar Institute). (b) Basal topography (Lindbäck et al., 2018) with (i–v) subglacial flow lines and (1–3) cross-glacier transects defined for analysing the model outputs.
2.1 Glaciers and topography
The Kongsfjord basin, located in northwestern Svalbard, covers a total land area of approximately 1430 km2, of which about 75 % is currently glacier-covered. The basin surrounds Kongsfjorden, which stretches over ∼ 20 km towards the Arctic Ocean to the west. This study centres on three adjacent glacier systems that terminate in the inner part of Kongsfjorden (Fig. 1a): Isachsenfonna–Kongsbreen, Holtedahlfonna–Infantfonna–Kronebreen, and Kongsvegen.
At the northeastern fjord head, the ice field Isachsenfonna drains through the outlet glacier Kongsbreen (together 378 km2), which splits due to a bedrock ridge into two branches, Kongsbreen North and Kongsbreen South. To the east, the terminal glacier Kronebreen is fed by two contributory catchments: the larger ice field Holtedahlfonna and the smaller Infantfonna (together 373 km2). Roughly 5 km from its front, Kronebreen is confluent with Kongsvegen (108 km2), and the two glacier tongues share a common terminus which is currently dominated by Kronebreen (Sund et al., 2011).
Surface elevation (Fig. 1a), basal topography (Fig. 1b), and ice thickness of the Kongsfjord basin were recently mapped by airborne and ground-based ice-penetrating radar (Lindbäck et al., 2018). Together with their accumulation areas, the Kongsfjord glaciers span an altitudinal range from sea level to 1400 m a.s.l. (above sea level) in the northern parts of their catchments (Fig. 1a). Below the equilibrium line altitude, which for Holtedahlfonna–Kronebreen was estimated around 610 m a.s.l. for the period 1961–2012 (Van Pelt and Kohler, 2015), Kronebreen is heavily crevassed, and its slope is disrupted by several ice falls. In the ablation area, the subglacial topography is characterized by extended troughs as deep as −180 m a.s.l. under Kongsbreen North, −130 m a.s.l. under Kronebreen, and −70 m a.s.l. under Kongsvegen (Fig. 1b). Both Kronebreen and Kongsvegen are fully grounded below sea level over their lowermost 10 and 9 km, respectively, whereas Kongsbreen South is mostly resting on bedrock above the water line. A few nunataks are present in the lower parts of the glaciers at approximately 500–600 m a.s.l. Further inland, the subglacial topography smoothens into wide, flat valleys around 200 m a.s.l., and ice thickens to a maximum of 740 m in the middle of Isachsenfonna.
2.2 Mass balance and dynamics
Like most tidewater glaciers in Svalbard, the Kongsfjord glaciers have a negative mass balance dominated by calving, a finding that both in situ measurements and modelling experiments have corroborated over the last decades (e.g. Lefauconnier et al., 1994b; Nuth et al., 2012). More recently, Van Pelt and Kohler (2015) used a coupled surface-energy-balance–snow model to include superimposed ice and internal accumulation in their surface mass balance calculations. For Kronebreen and Kongsvegen, they found that surface mass balance is controlled by mass gain through precipitation (0.87 m w.e. a−1) and mass loss through run-off (0.79 m w.e. a−1) and that the refreezing of water in the firn layer (0.30 m w.e. a−1) provides a strong buffer for run-off. Their results also reveal a 31 % increase in run-off since 2000, coinciding with higher surface melt rates and lower refreezing rates in response to recent warming and firn line retreat.
Kronebreen is one of the fastest-flowing glaciers in Svalbard (Liestøl, 1988; Sund et al., 2011). Near the terminus, mean annual surface velocities are persistently high (1.6–2.15 to m d−1) (Lefauconnier, 1987; Lefauconnier et al., 1994a; Kääb et al., 2005), and summer velocities peak up to 3.2 m d−1 (Schellenberger et al., 2015). Such high velocities can only be achieved through basal sliding, which is consistent with the finding of widespread temperate basal conditions at several glaciers in the region (Björnsson et al., 1996; Sevestre et al., 2015). Kongsbreen has a more complex velocity pattern due to its split into two separate terminal branches: the northern, marine-terminating branch of the glacier is fast-flowing, with a maximal speed of 2.7 m d−1 (measured in 2012, Schellenberger et al., 2015), whereas the southern, partially land-terminating branch is slow-moving. Both Kronebreen and Kongsbreen North exhibit clear seasonal flow variability, characterized by relatively stable and low velocities in autumn and winter and an acceleration synchronous with the melt season. Schellenberger et al. (2015) observed that, at both glaciers, a large part of the ice flow variability followed fluctuations in surface meltwater production and rainfall, a correlation that they attributed to variations in basal lubrication. Evidence from later studies also strongly suggest that multi-annual changes in ice flow at Kronebreen are controlled by changes in the subglacial hydrology (How et al., 2017; Vallot et al., 2017). Inter-annual variability in ice velocity and upglacier propagation of seasonal speed-up were both found to be higher at Kronebreen than at Kongsbreen North (Schellenberger et al., 2015), indicating different basal conditions at the two glaciers. Kongsvegen, a surge-type glacier that is currently in its quiescent phase, contrasts with the other Kongsfjord glaciers in its dynamics. Since its last surge in 1948 (Melvold and Hagen, 1998), the glacier has experienced very little motion (2–8 m a−1), negligible calving, and significant surface steepening (Hagen et al., 1999, 2005; Nuth et al., 2012).
2.3 Subglacial hydrology
Glaciers in Kongsfjord are polythermal, usually with basal temperatures at or close to the pressure melting point, meaning that water drains at their base all year through (Björnsson et al., 1996; Sevestre et al., 2015; Nuth et al., 2019). Glacial run-off is periodically released into the fjord, where it produces sediment-rich freshwater plumes that are of great importance for the glacio-marine dynamics and the ecosystem of Kongsfjorden (Svendsen et al., 2002; Everett et al., 2018).
In recent years, several locations of subglacial discharge have been identified at the Kronebreen–Kongsvegen terminal complex: one main outlet in the northern half of the glacier tongue and several secondary outlets near the Kronebreen–Kongsvegen junction (Trusel et al., 2010; Kehrl et al., 2011; Everett et al., 2018). Contrasts in plume timing and duration have been suggested to reflect local differences in subglacial drainage efficiency across glacier termini (Schild et al., 2016; Slater et al., 2017). How et al. (2017) monitored plumes at Kronebreen and combined the data with observations of borehole water pressure, supraglacial lake drainage, and surface velocities, as well as modelling of meltwater routing, to infer the morphology of the subglacial hydrological system during summer 2014. Their results indicated that meltwater was largely drained to the northern part of the terminus through a channelized system connected to the upper catchment area (Holtedahlfonna), hence the broader and more persistent plume on the northern side. By contrast, the intermittent activity of the southern plume during the 2014 melt season was attributed to distributed drainage of a smaller catchment area.
Spatio-temporal variations in basal properties at Kronebreen were also investigated by Vallot et al. (2017) through inverting surface velocities for 2013–2015 to determine a basal friction coefficient. Their modelling results supported conclusions drawn by the earlier studies, i.e. that subglacial hydrology organization is as much a key factor to basal sliding as are local characteristics such as bed topography and summer melt.
While the relationship between meltwater supply, subglacial hydrology, and ice velocity is well documented at Kronebreen (Schellenberger et al., 2015; How et al., 2017), similar knowledge is lacking at the neighbouring outlet glaciers (Kongsvegen, Kongsbreen North, and Kongsbreen South), and the subglacial hydrology at the upper ice fields (Isachsenfonna, Holtedahlfonna, and Infantfonna) remains to be examined.
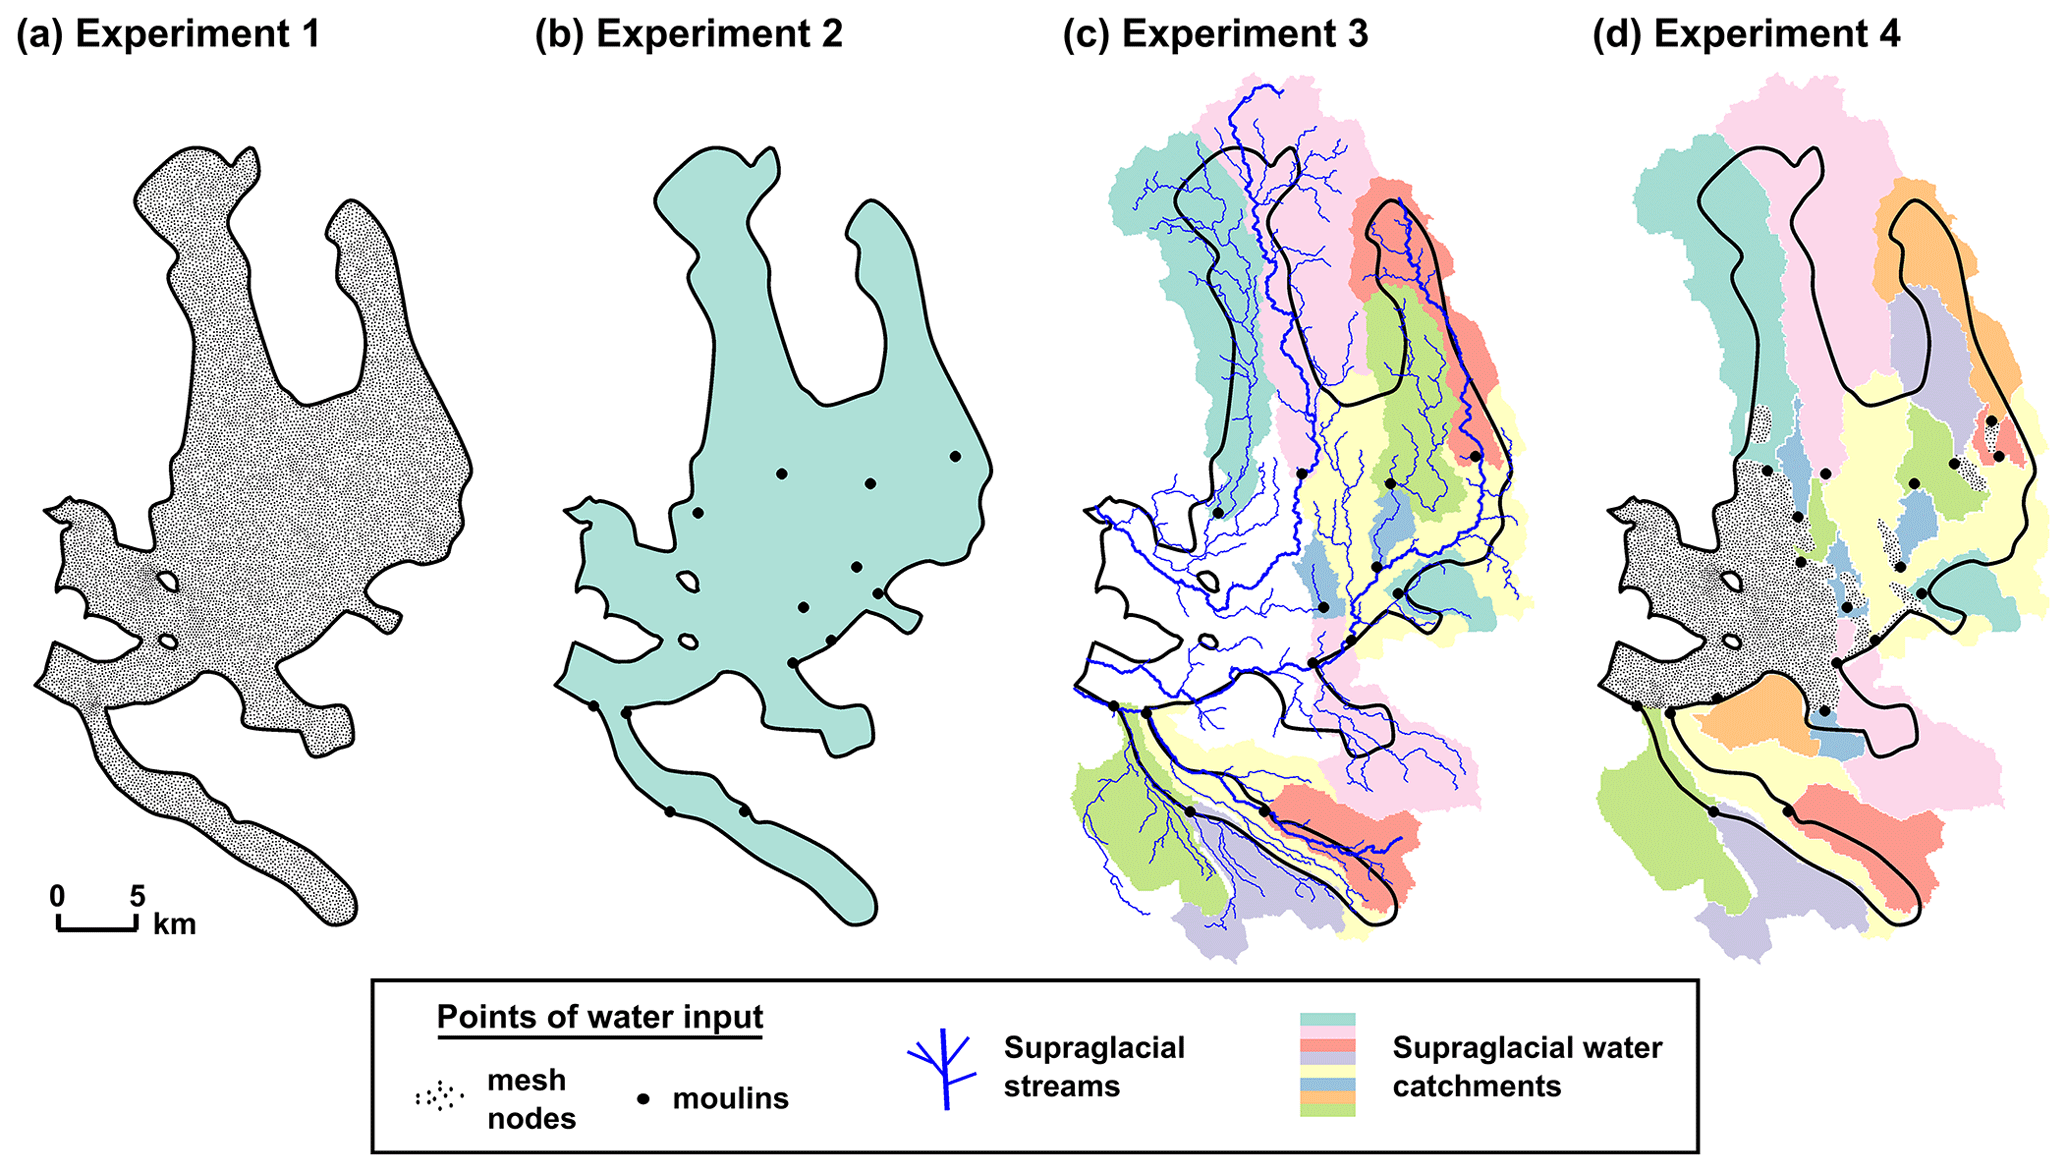
Figure 2Water input distribution at the Kongsfjord basin for each experiment. Shown in black are the points of water recharge to the subglacial hydrological system, i.e. mesh nodes for (a, d) and moulins for (b–d). The coloured areas are the supraglacial water catchments associated with the moulins. Subplot (c) also shows the TopoToolbox-generated supraglacial stream network in blue.
3.1 Mapping of supraglacial hydrology
Mapping of Kongsfjord's supraglacial drainage system was achieved using TopoToolbox, a collection of scripts to analyse flow pattern in digital elevation models (DEMs) (Schwanghart and Scherler 2014). TopoToolbox first seeks to determine surficial water movement within the DEM. Flow direction calculation is based on a single flow direction algorithm that examines elevation gradients between grid cells. Next, information on flow direction is used to derive (1) flow accumulation, i.e. the number of cells draining in each grid cell, (2) the drainage network, i.e. the estimated flow paths in the DEM, and (3) drainage basins, i.e. the upslope areas contributing to each grid cell in the drainage network. We generated a map of the supraglacial stream network, shown in Fig. 2c, and the watersheds associated with each moulin (Fig. 2c, d). The selection of the moulin locations is described in Sect. 3.3.2.
3.2 Modelling of subglacial hydrology
To simulate the subglacial hydrology of the Kongsfjord basin, we apply the Glacier Drainage System model (GlaDS) (Werder et al., 2013), a two-dimensional model developed to describe subglacial water drainage and which participated in the Subglacial Hydrology Model Intercomparison Project (SHMIP) (de Fleurian et al., 2018). GlaDS has been implemented in Elmer/Ice, an open source, finite-element model (Gagliardini et al., 2013), which in this study serves only as platform for the subglacial hydrology model. The implementation of GlaDS in Elmer/Ice is detailed in Gagliardini and Werder (2018).
The subglacial hydrology model GlaDS accounts for both inefficient distributed drainage and efficient channelized drainage to compute the evolution of the hydraulic potential at the glacier base. The distributed network of linked cavities is featured in the form of a continuous water sheet across the model domain which is fed by a source term at each node on the mesh. We define the source term from the sum of a space and time varying surface water input, as described in Sect. 3.4.2, and a uniform, steady basal melting of 10−3 m a−1 (∼ 3.17 × 10⁻¹¹ m s−1). Discrete channels that form on the edges of the mesh elements constitute the efficient drainage system. Between each pair of nodes, channel segments develop from water exchange with the adjacent sheet, as well as from water input at moulins, which act as local sources. Moulins are shaped as vertical cylinders at some of the mesh nodes (see Sect. 3.3.2), and deliver water directly from the glacier surface to the basal channel network. Depending on their cross-sectional area and on the subglacial water pressure, moulins can store a certain volume of water, as revealed by tracer-experiments (Werder and Schuler, 2010). For a complete description of the equations solved by the GlaDS model, we direct readers to Werder et al. (2013).
The problem is solved on a mesh constructed by discretizing the domain using irregular triangulation with a mean edge length of 250 m, which yields 11 824 nodes in total. The mesh resolution is a compromise between numerical computation time and spatial precision of the model outputs. To ensure computational stability, the simulation time step does not exceed 1 d, and adaptive time stepping down to ∼ 1.5 min is applied. An additional gain of computation time is achieved through partitioning and parallel simulation of each model run.
As boundary conditions, channels are not allowed to develop along the outer limits of the model domain, and the hydraulic potential is set to zero at the glacier fronts because we consider that all three termini (Kongsbreen North, Kongsbreen South, and Kronebreen–Kongsvegen) are freely connected to the fjord. Indeed, by imposing the water pressure to be equal to sea pressure at the depth of the outlets, we have
where φ is the hydraulic potential, φm the elevation potential, pw the sea water pressure, zb the bed elevation, and zsl the sea level elevation (= 0 m a.s.l.).
Table 1Parameters and values used in GlaDS for all model runs in this study. Parameter values in bold are those that are not taken from literature. Literature values are taken from Werder et al. (2013).
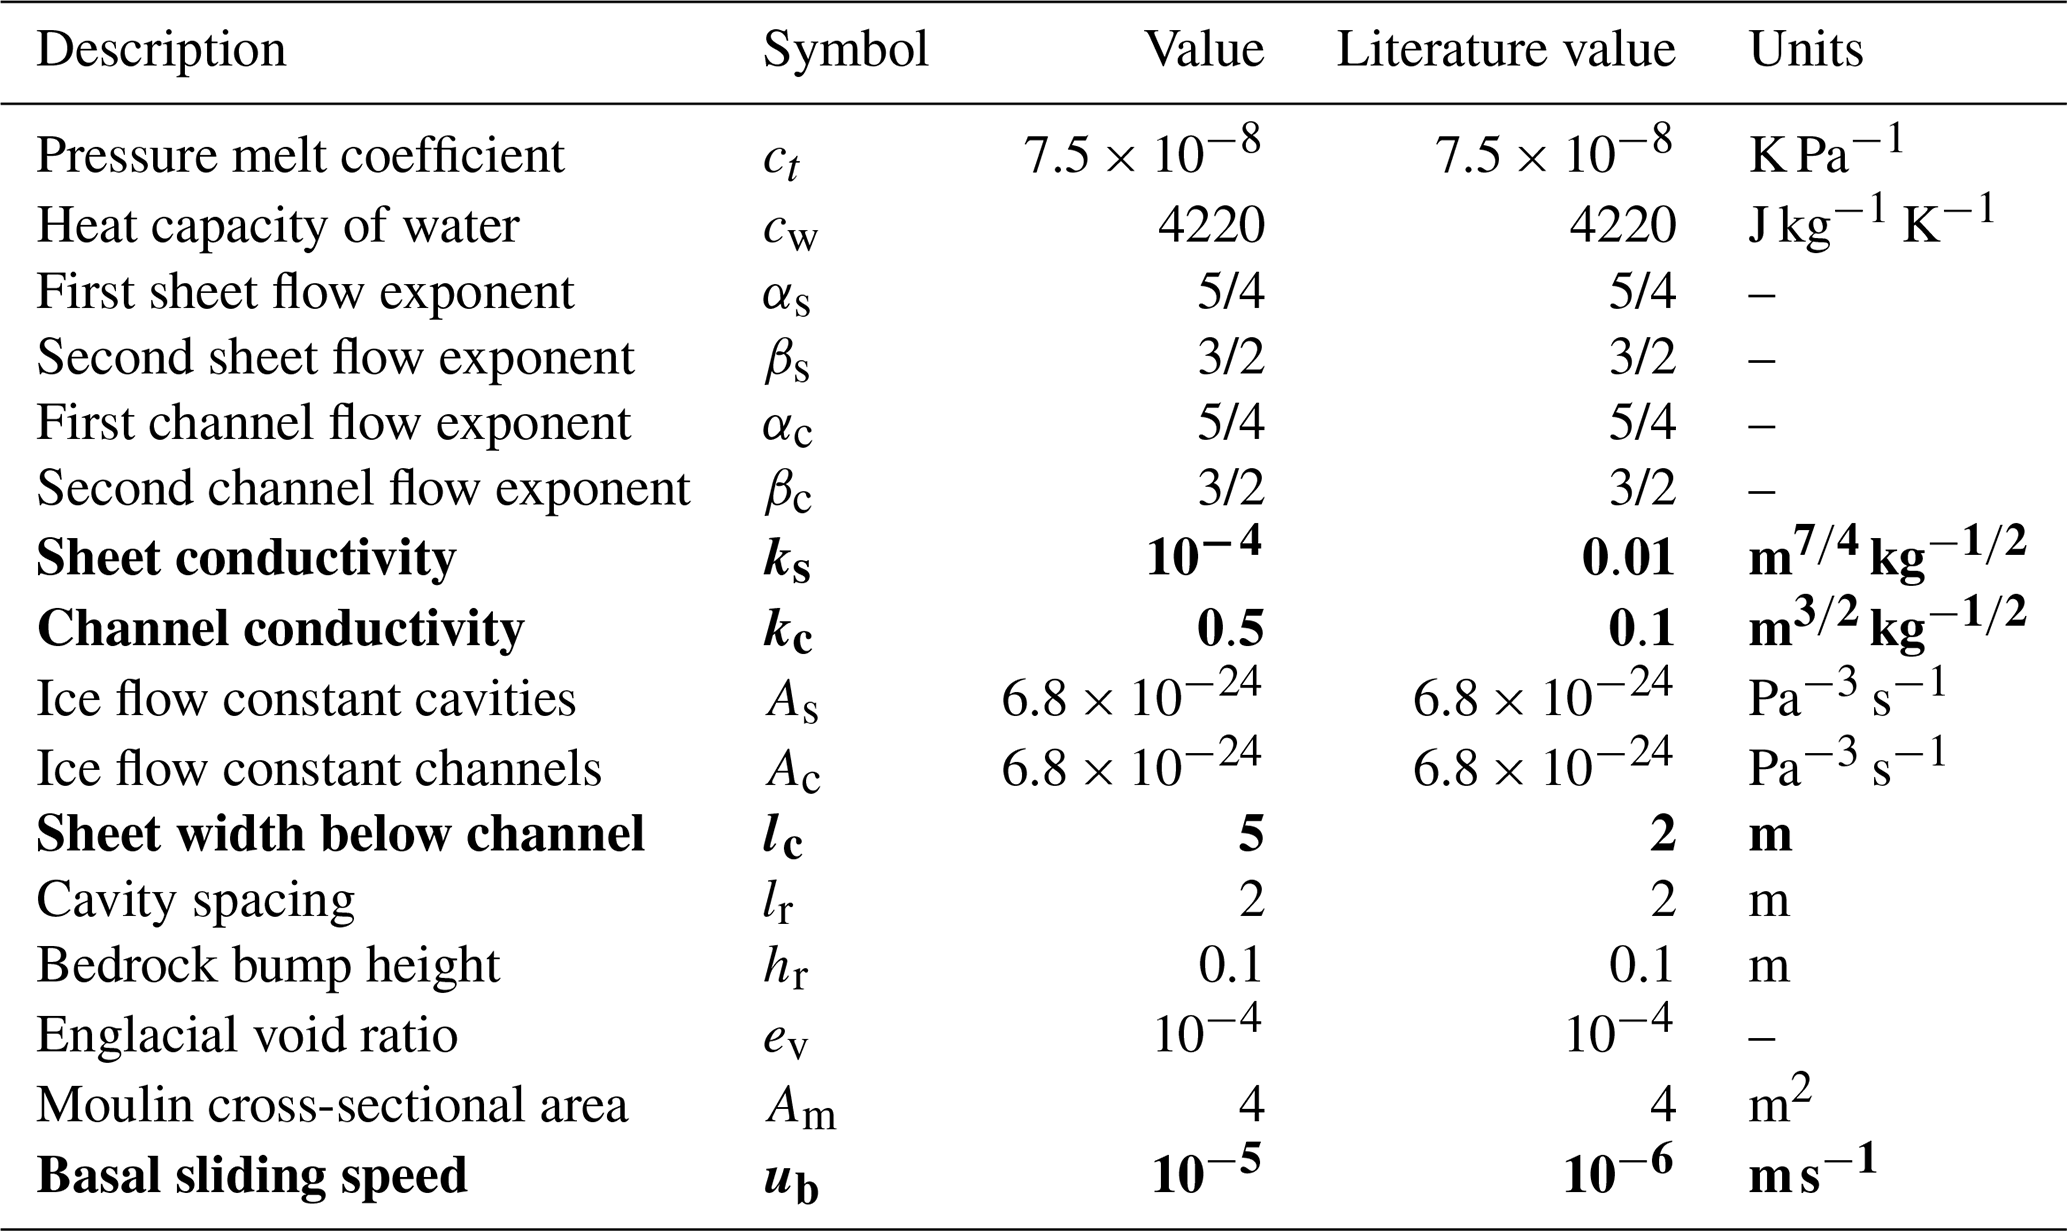
The values for the model parameters are set out in Table 1. Parameters in bold are those to which we assigned values different from Werder et al. (2013). We adapted values for conductivity parameters, as well as for sheet width below the channel, to facilitate channelization and to maximize the influence of meltwater input on the subglacial drainage efficiency. More specifically, our value for the sheet conductivity is lower than the one originally proposed by Werder et al. (2013), but inspection of current literature revealed that others find better agreement to observations by using lower values (e.g. Dow et al., 2018, 2020) or even suggest a seasonally variable conductivity (Downs et al., 2018). We performed sensitivity tests and found that lower sheet conductivities lead to higher water pressures all year round, whereas the original value from Werder et al. (2013) yields unrealistically low water pressures in winter. We also found our model results to be largely insensitive to changes in channel conductivity. In addition, we set a uniform basal sliding speed of ∼ 315 m a−1 (10−5 m s−1) for the entire domain, which corresponds roughly to the glacier-averaged surface speed measured by satellite imagery in the Kongsfjord basin (Schellenberger et al., 2015).
3.3 Water supply to the subglacial drainage system
In order to investigate the sensitivity of our subglacial hydrology model to water recharge distribution, we design four model experiments with various degrees of complexity in the way that water is delivered to the glacier beds. The control experiment is the simplest scenario, in which basal water supply is spatially continuous and identical to surface meltwater production. The next two experiments assume discrete water recharge to the basal drainage system through moulins, with the latter including only water that is drained in moulin catchments. Finally, the fourth and most realistic scenario builds upon local knowledge of glacial hydrology at Kongsfjord. This experiment accounts for immediate surface-to-base water transfer via crevasses in the ablation zone, as well as for catchment-wide water collection into moulins in the accumulation zone. Water input is taken from a raster of modelled recharge values, as described in Sect. 3.4.2 below.
3.3.1 Experiment 1
In the first experiment, the gridded water input is interpolated to every mesh node of the GlaDS model and is directly injected into the distributed sheet layer regardless of the supraglacial drainage network (Fig. 2a). This approximation is still commonly made in subglacial hydrology models, based on the assumption that glaciers are perfectly “permeable” in that they allow meltwater to travel straight from their surface to their beds (e.g. Cook et al., 2020). We use this experiment as a reference against which we compare the other experiments with the aim of assessing the effect of adding complexity to water supply distribution.
3.3.2 Experiment 2
In this scenario, water input is restricted to only a few moulins that act as individual sinkholes at the glacier surface. We evenly redistribute the total recharge between the moulins so that at each time step every moulin receives the same amount of water. We consider 13 moulins in total, five of which have been previously identified as active supraglacial lakes that drained to the glacier base at least once between 2014 and 2017. The other eight moulins are manually detected on high-resolution aerial images derived from TopoSvalbard (https://toposvalbard.npolar.no/, last access: 27 March 2020, Norwegian Polar Institute). Each moulin is then defined at the closest mesh node of the model domain. All 13 moulins are located between approximately 3 and 35 km from the glacier termini and at surface elevations between 400 and 700 m a.s.l. (Fig. 2b). Except for Kongsvegen, we do not detect any moulin in the lower parts of the other glaciers since these areas are highly crevassed. Both the location and the cross-sectional area (see Table 1) of the moulins are assumed constant over the study period.
3.3.3 Experiment 3
Here we impose discrete water input at the same 13 moulins as in Experiment 2, with the difference that water recharge is calculated from the upstream catchment area that is associated with each moulin (Fig. 2c). Meltwater produced downstream of moulins is not taken into account in this scenario. Using the TopoToolbox programme (described in Sect. 3.1 above), we delineate the supraglacial watersheds and retrieve the meltwater volume in each of them. The moulin catchments are assumed to remain stationary over the study period. The total water amount involved here is slightly higher than in experiments 1–2 because this scenario accounts for meltwater in watersheds that extend beyond the glacier boundaries.
3.3.4 Experiment 4
Finally, we develop an experiment in which we attempt to describe as realistically as possible the spatial distribution of water supply to the glacier beds. Here, we combine continuous and discrete recharge to the subglacial hydrological system. In crevassed areas of the Kongsfjord basin, we apply direct surface-to-bed transfer of meltwater into the sheet layer, in the same fashion as for Experiment 1. The crevassed zones are manually mapped on 1 m resolution satellite images from Pleiades (© CNES, 2014, and Airbus DS, 2014, all rights reserved. Commercial uses forbidden). It should be noted that, whilst some minor cracks are also detected in Holtedahlfonna and Isachsenfonna, the extent of these crevassed areas is probably underestimated because of the snow cover. In the higher parts of the domain, we adapt the configuration of Experiment 3 by including only the moulins that are located in non-crevassed areas. In addition, we consider six new moulins, which raises the total number of moulins to 19. These moulins were identified from the modelled supraglacial drainage network (Fig. 2c) and the observed crevasses (Fig. 2d); more specifically, we added a moulin wherever a supraglacial stream crosses the upper boundary of a crevassed area. The moulin catchments are also adjusted in order to accommodate the additional moulins and to exclude the crevassed areas where water drains directly into the subglacial system and does not contribute to the moulin discharge (Fig. 2d).
3.4 Datasets
3.4.1 Study area outline and topography
The TopoToolbox analysis was carried out on a 40 m resolution DEM acquired in 2007 from the SPOT-5 satellite sensor (Bouillon et al., 2006; Korona et al., 2009). Kongsfjord's glacier outlines of 2007 were retrieved from the Randolph Glacier Inventory (König et al., 2013) and were used to shape the model domain. Basal topography was taken from a 150 m resolution DEM produced by Lindbäck et al. (2018). The glacier outlines were adjusted to avoid zero (and occasionally occurring negative) ice thickness, which would compromise model calculations. Inside the modelled glacier basin, nunataks were also cut out. This model domain, which covers a total surface area of 519 km2, was used for all model runs in this study.
3.4.2 Water input
Water supply to the subglacial hydrological system is derived from a surface run-off time series generated by a coupled surface-energy-balance–snow model that uses downscaled output from the regional climate model HIRLAM (High-resolution Limited Area Model) as atmospheric forcing (Van Pelt and Kohler, 2015; Van Pelt et al., 2019). The model accounts for subsurface processes such as water storage in the porous firn layer, as well as refreezing/melting of water in the snowpack. Here recharge is the liquid water volume that effectively reaches the glacier bed. More specifically, in the accumulation zone recharge is the amount of liquid water available at the firn–ice transition, which is the sum of percolated rain and surface-generated meltwater minus the water that is retained in the snow and firn pack (Van Pelt et al., 2016). In the case of bare-ice exposure, such as in the ablation zone during summertime, recharge is the sum of rain and meltwater at the ice surface. The time series covers the period 2004 to 2017 with a 3 hourly time step (subsequently averaged to the 1 d simulation time step) and a 1 km grid resolution.
Each glacier drainage system model run consisted of a 1-year spin-up and a 14-year simulation period with one of the four water input configurations described in the previous section. For each model run, we examine the subglacial water pressure (expressed as a fraction of the ice overburden pressure), the water flux in the distributed drainage system (sheet flux), as well as in the channelized drainage system (channel flux), and the absolute value of hydraulic head. We explore the mean seasonal variation in these variables both over the entire glacier basin and at three cross-glacier transects (indicated in Fig. 1b). We also study the spatial distribution of these variables over the whole model domain, as well as along five subglacial flow lines (indicated in Fig. 1b). To investigate differences in the subglacial hydrology between the model experiments, we use the simplest scenario (Experiment 1) as a reference against which we compare the other three water input configurations. Finally, we use the most realistic scenario (Experiment 4) to describe the mean spatio-temporal evolution of the subglacial hydrology at the Kongsfjord basin over the study period.
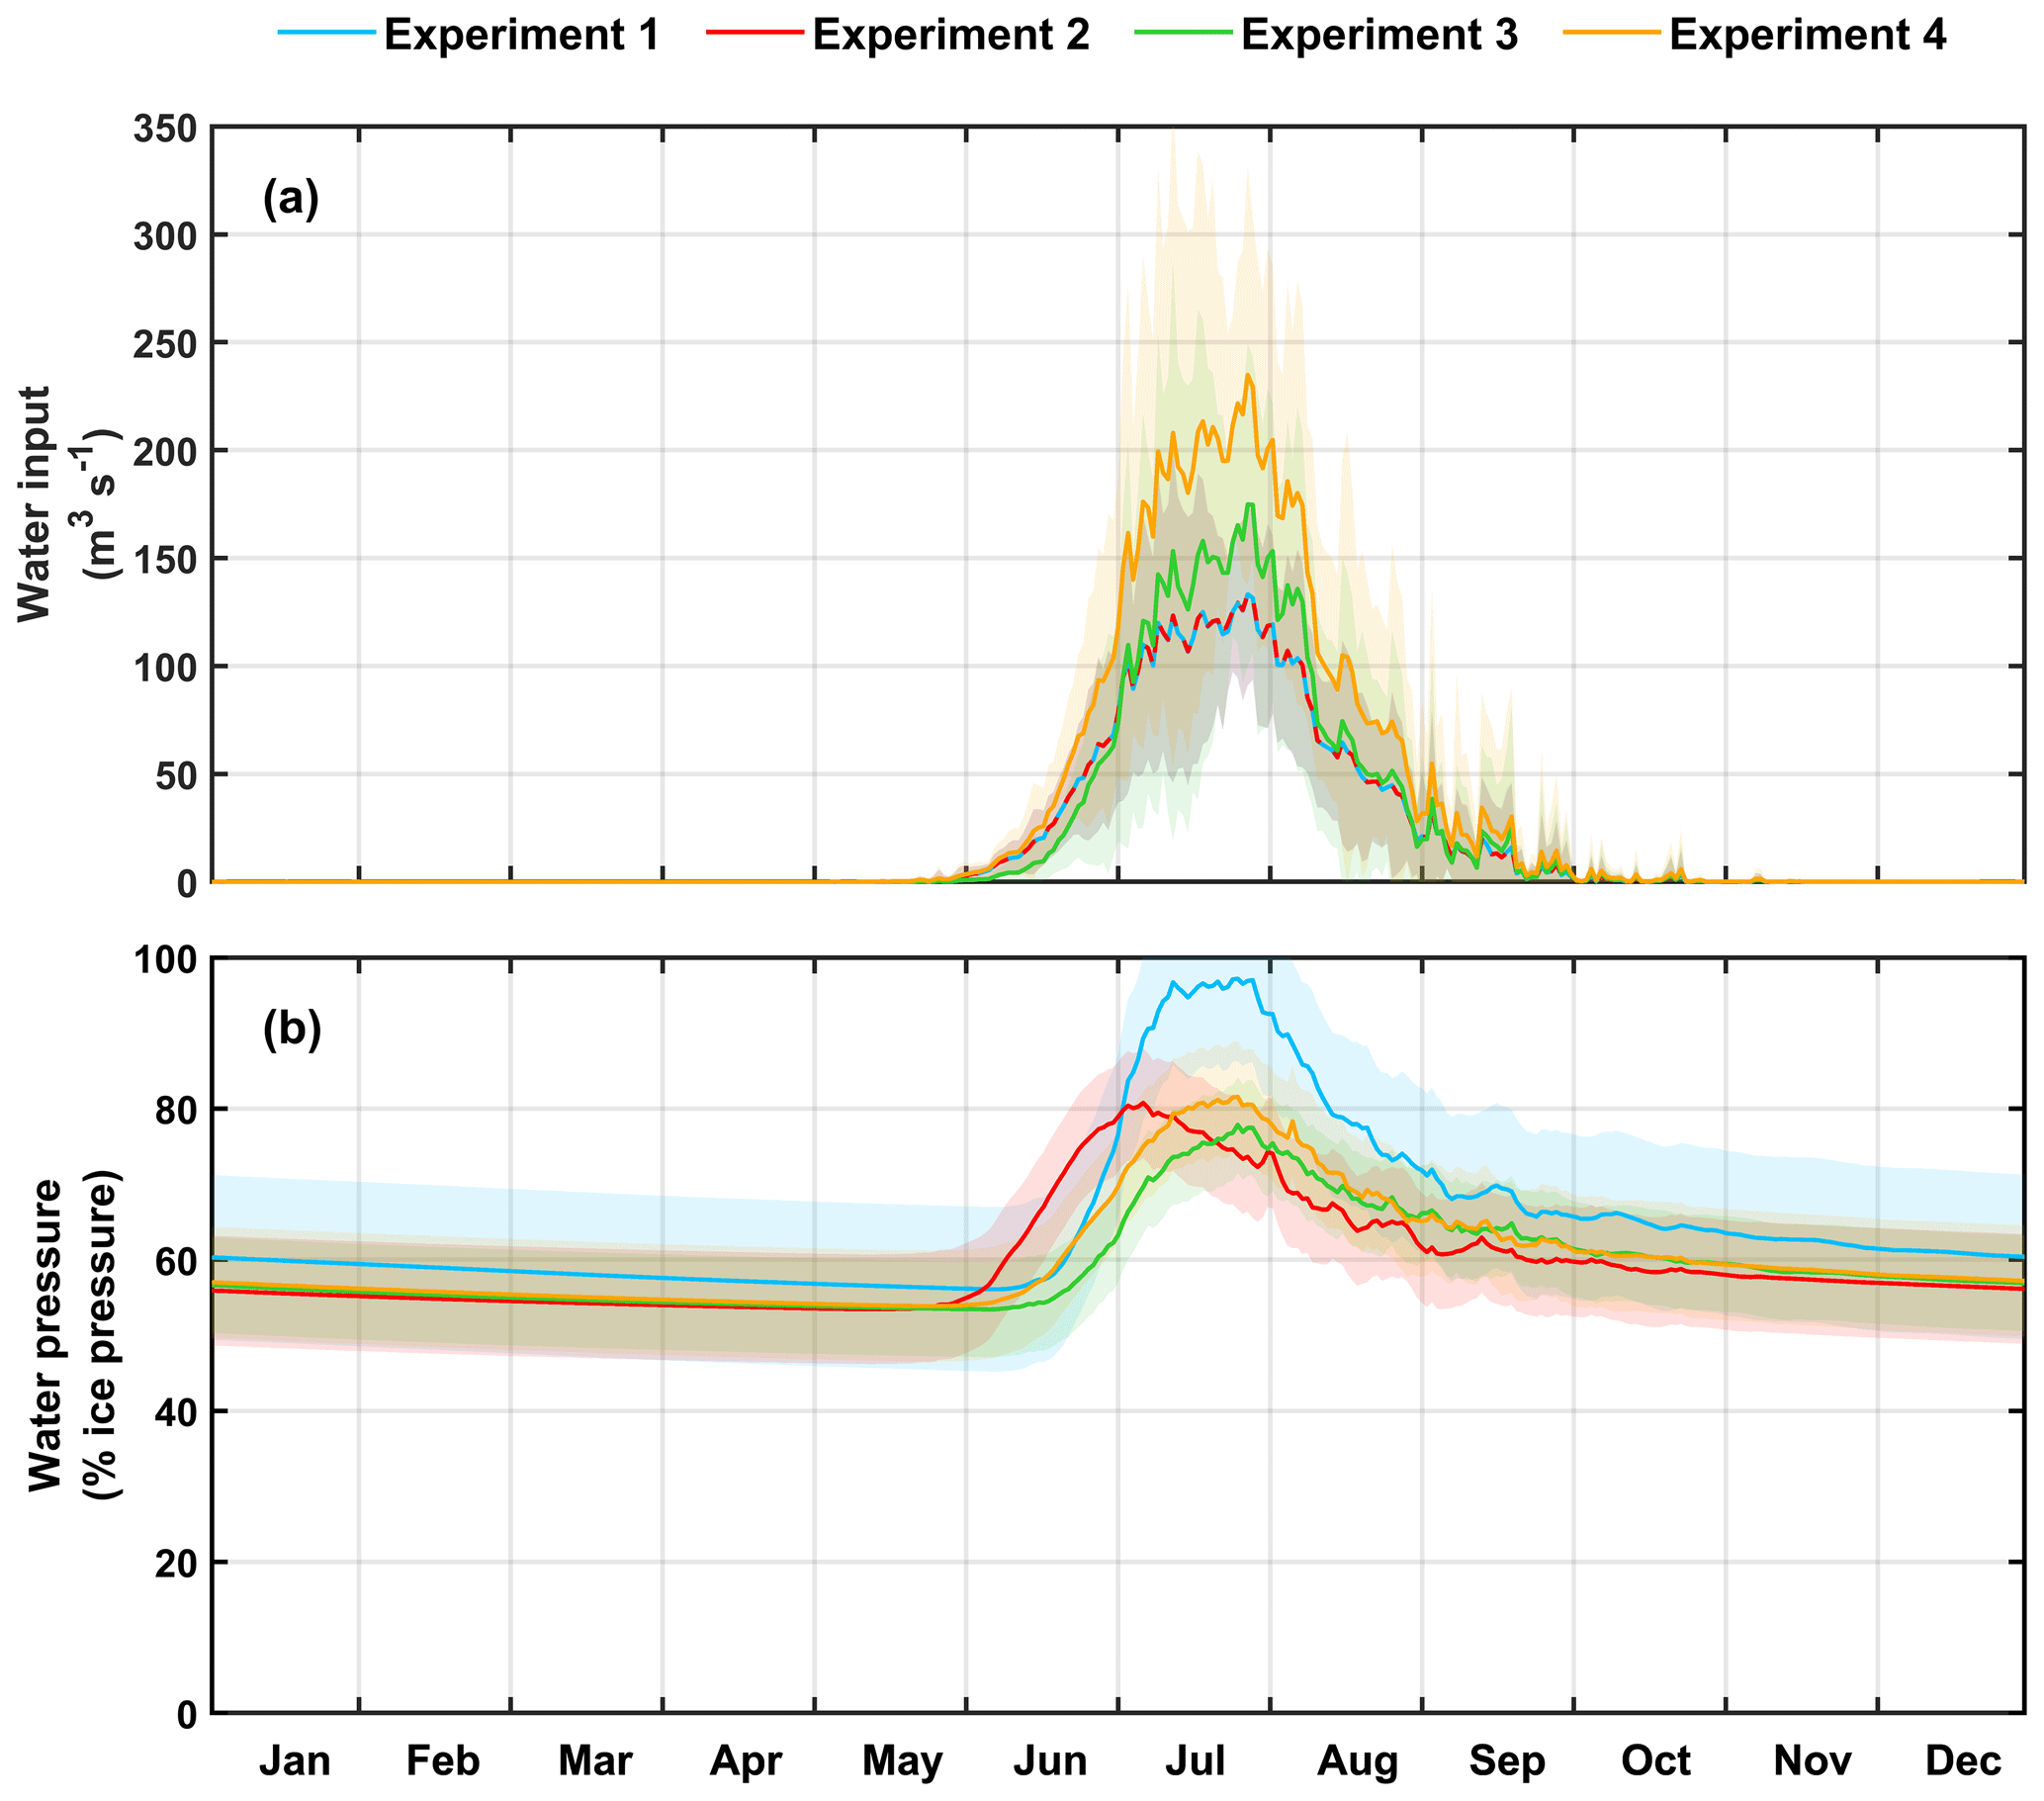
Figure 3Mean (2004–2017) annual (a) water input and (b) basal water pressure averaged over the whole model domain for each experiment. The shaded area is the standard deviation showing the inter-annual variability in water input and water pressure for each experiment.
4.1 Comparison between experiments
4.1.1 Water input
Between 2004 and 2017, the modelled average melt season lasts approximately from 1 June to 30 September in all experiments (Fig. 3a). In general, despite strong inter-annual variability, the mean peak in water supply occurs at the end of July. However, input water volumes vary among the four experiments due to different sizes of surface area contributing water. In experiments 1–2, the same total water volume (2.96×10³ km3 over 2004–2017) is supplied to the bed because recharge is calculated from the same surface area in both configurations (Fig. 2a, b). Experiments 3–4 deliver overall larger water volumes to the bed (3.32 × 10³ km3 and 3.44 × 10³ km3, respectively, over 2004–2017) than experiments 1–2 since these scenarios include supraglacial catchments that extend beyond the glacier boundaries (Fig. 2c, d). In Experiment 3, the early summer increase in water input is slightly delayed compared to the other configurations because this scenario accounts for meltwater only in the higher parts of the glaciers (as described in Sect. 3.3.3 above) where surface melting starts later than at lower elevations.
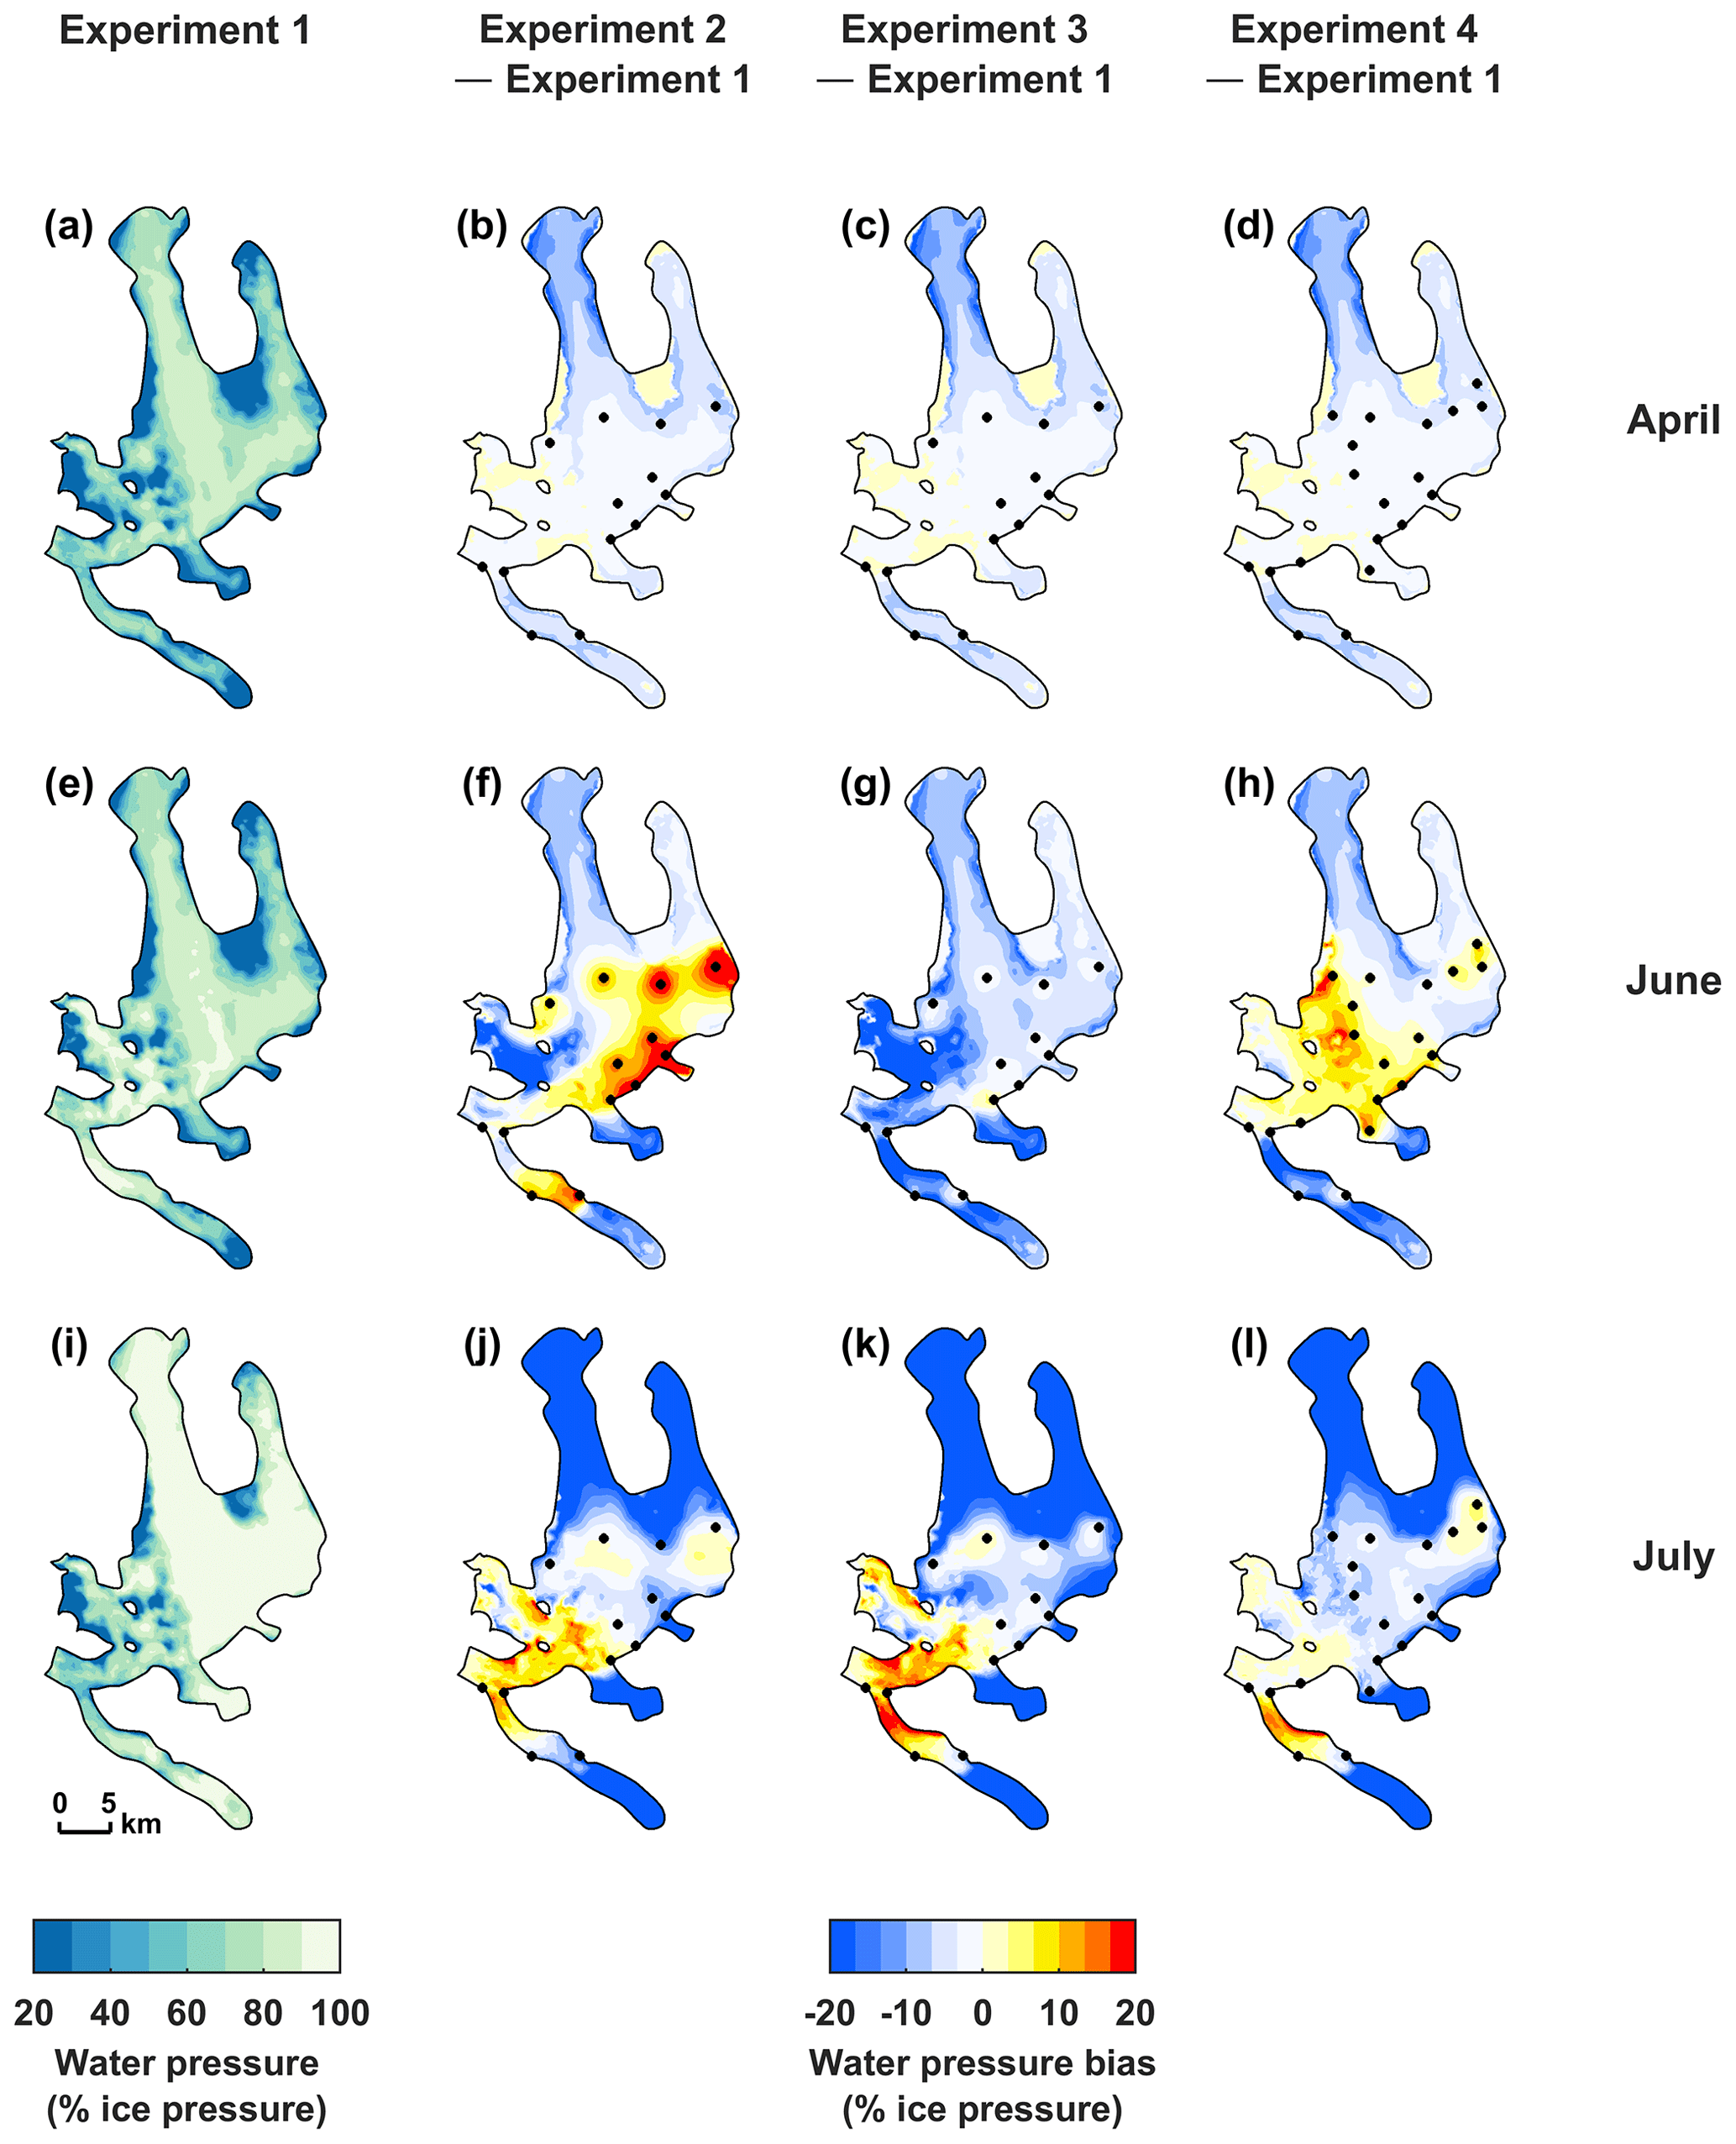
Figure 4Mean (2004–2017) basal water pressure modelled by Experiment 1 in (a) late winter (April), (e) early summer (June), and (i) midsummer (July). Biases (differences to reference Experiment 1) in mean (2004–2017) basal water pressure in (b, c, d) late winter (April), (f, g, h) early summer (June), and (j, k, l) midsummer (July). Basal water pressure is expressed as a fraction of the ice overburden pressure. The black dots mark the moulin locations.
4.1.2 Subglacial water pressure
All model experiments exhibit a similar seasonality in responses of the subglacial hydrology (Fig. 3b). Each water supply scenario rapidly raises the domain-averaged basal water pressure in the early melt season (June–July), followed by a much slower decline lasting through the subsequent winter (Fig. 3b). The minimum in water pressure occurs just before the onset of the next melt season. Despite the positive relation between water input and basal pressure on the seasonal scale, the water pressure signal appears smoother than that of the water input on the daily timescale, showing less short-term variability.
Varying the water input configuration has minimal impact on the wintertime subglacial water pressure (Fig. 4a–d) since surface meltwater production outside of the melt season is close to zero. In all four scenarios, mean wintertime water pressure settles between ∼ 55 % and 60 % of the ice overburden pressure, with only Experiment 1 reaching up to 60 %. Sensitivity to the water input configuration is highest during the first half of the melt season (June–July) when meltwater inputs differ most between the scenarios and pressure builds up from lower winter levels. Experiment 2 drives the earliest increase in basal pressure, followed by experiments 4, 1, and 3, but peaks lower (∼ 80 % of overburden pressure) than Experiment 1, which nearly tops at 95 % of the ice pressure (Fig. 3b). Early summer excursions of pressure in Experiment 2 encompass all except the lowermost moulins of the Kongsfjord glaciers (Fig. 4f), while in Experiment 1 the early summer pressurization of the subglacial system is highest in the lower ablation zones of Kongsbreen and Kronebreen (Fig. 4e). Experiment 4 drives higher pressurization of the upper ablation zones of Isachsenfonna–Kongsbreen and Holtedahlfonna–Kronebreen (Fig. 4h), while Experiment 3 creates lower pressures almost everywhere (Fig. 4g) despite feeding higher water volumes to the subglacial system than Experiment 1. In July, all three of experiments 2–4 drive higher water pressures in the ablation zone and lower water pressures in the upper accumulation zone compared to Experiment 1 (Fig. 4i–l).
Early summer (June) hydraulic head profiles at each terminal glacier of the Kongsfjord basin represent the height at which water would rise in boreholes drilled to the bed (Fig. 5). This figure shows that, at all glaciers except Kongsbreen North, pressure differences between the experiments are minimal at the fronts but increase slightly in the upglacier direction, with experiments 2 and 4 generally being the highest and Experiment 3 always the lowest. At Kronebreen, water pressure typically approaches overburden pressure upstream of bedrock bumps (Fig. 5c, d).
Over the annual period, the largest discrepancies are found between Experiment 1 and Experiment 3, showing the highest (65.0 %) and lowest (59.4 %) mean annual water pressures, respectively (Fig. 3b). A recurrent pattern in all seasons is that experiments 2–4 have systematically lower mean water pressures than Experiment 1 in the upper accumulation zones (Fig. 4). This is because in these configurations, meltwater from the upper reaches is supraglacially routed downstream before entering the subglacial system at moulins.
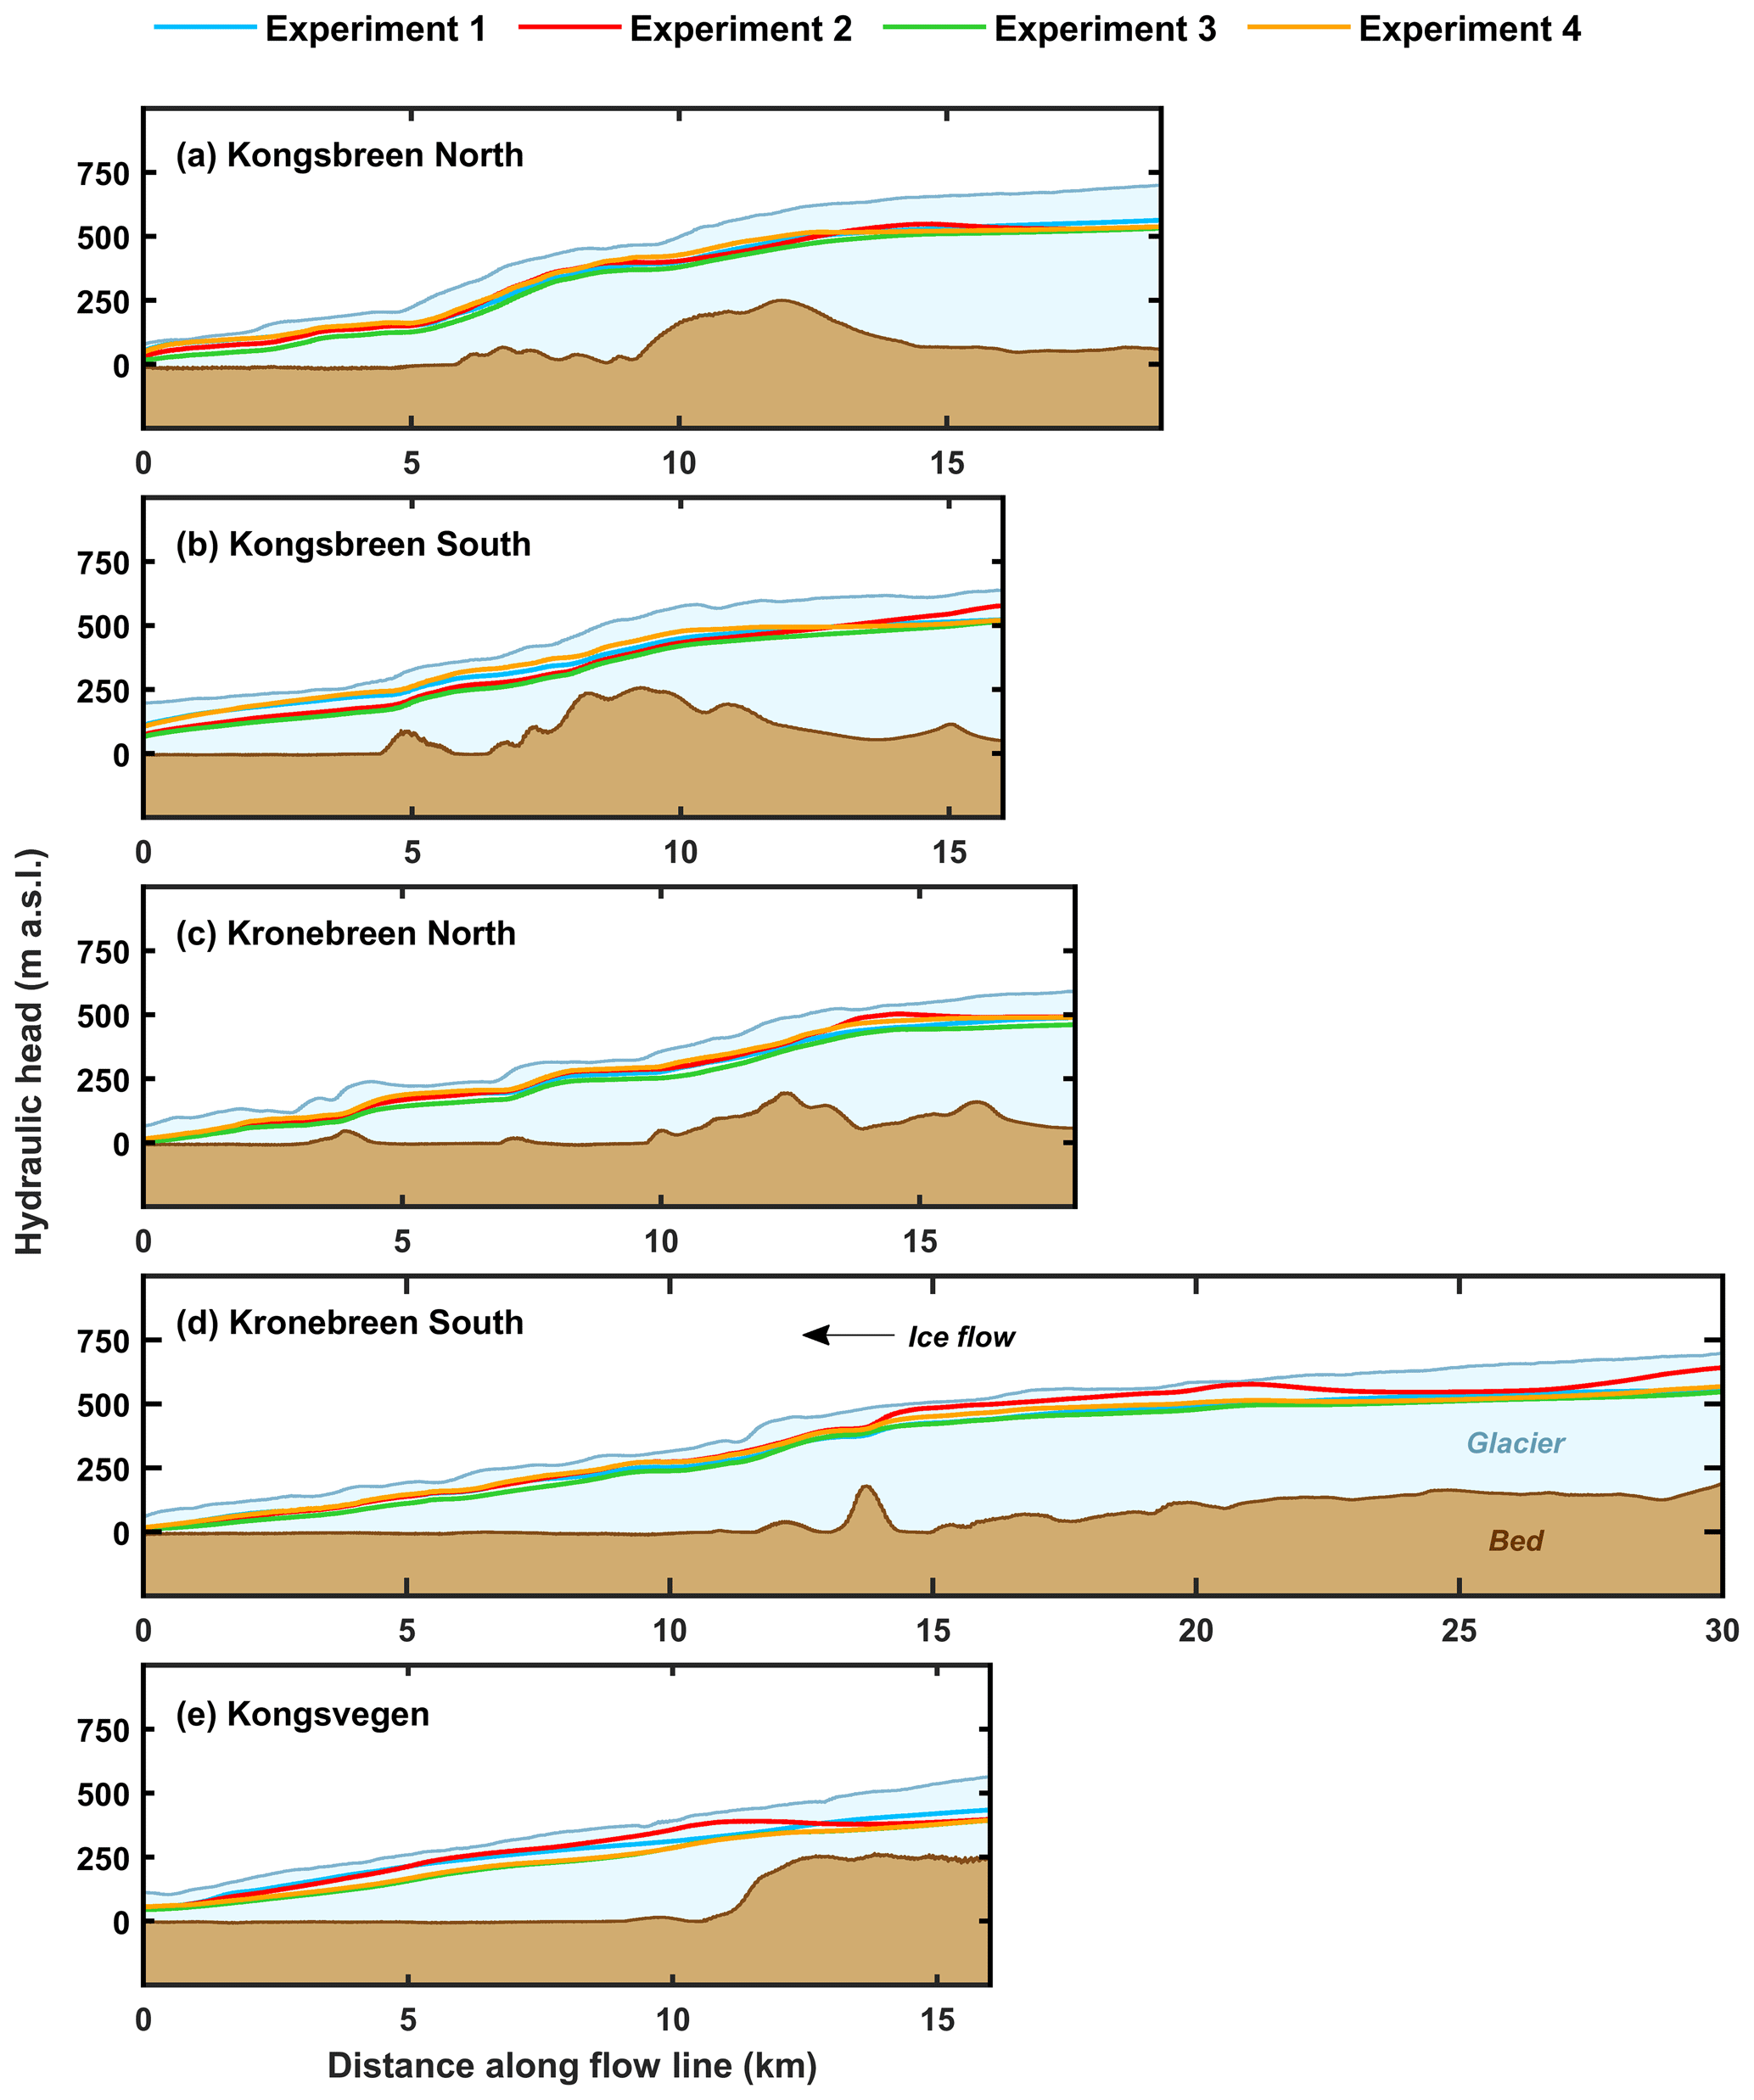
Figure 5Mean (2004–2017) early melt season (June) hydraulic head modelled by each experiment at (a) Kongsbreen North, (b) Kongsbreen South, (c) Kronebreen North, (d) Kronebreen South, and (e) Kongsvegen. Hydraulic head is expressed in absolute values (m a.s.l.). Flow line locations are shown in Fig. 1b.
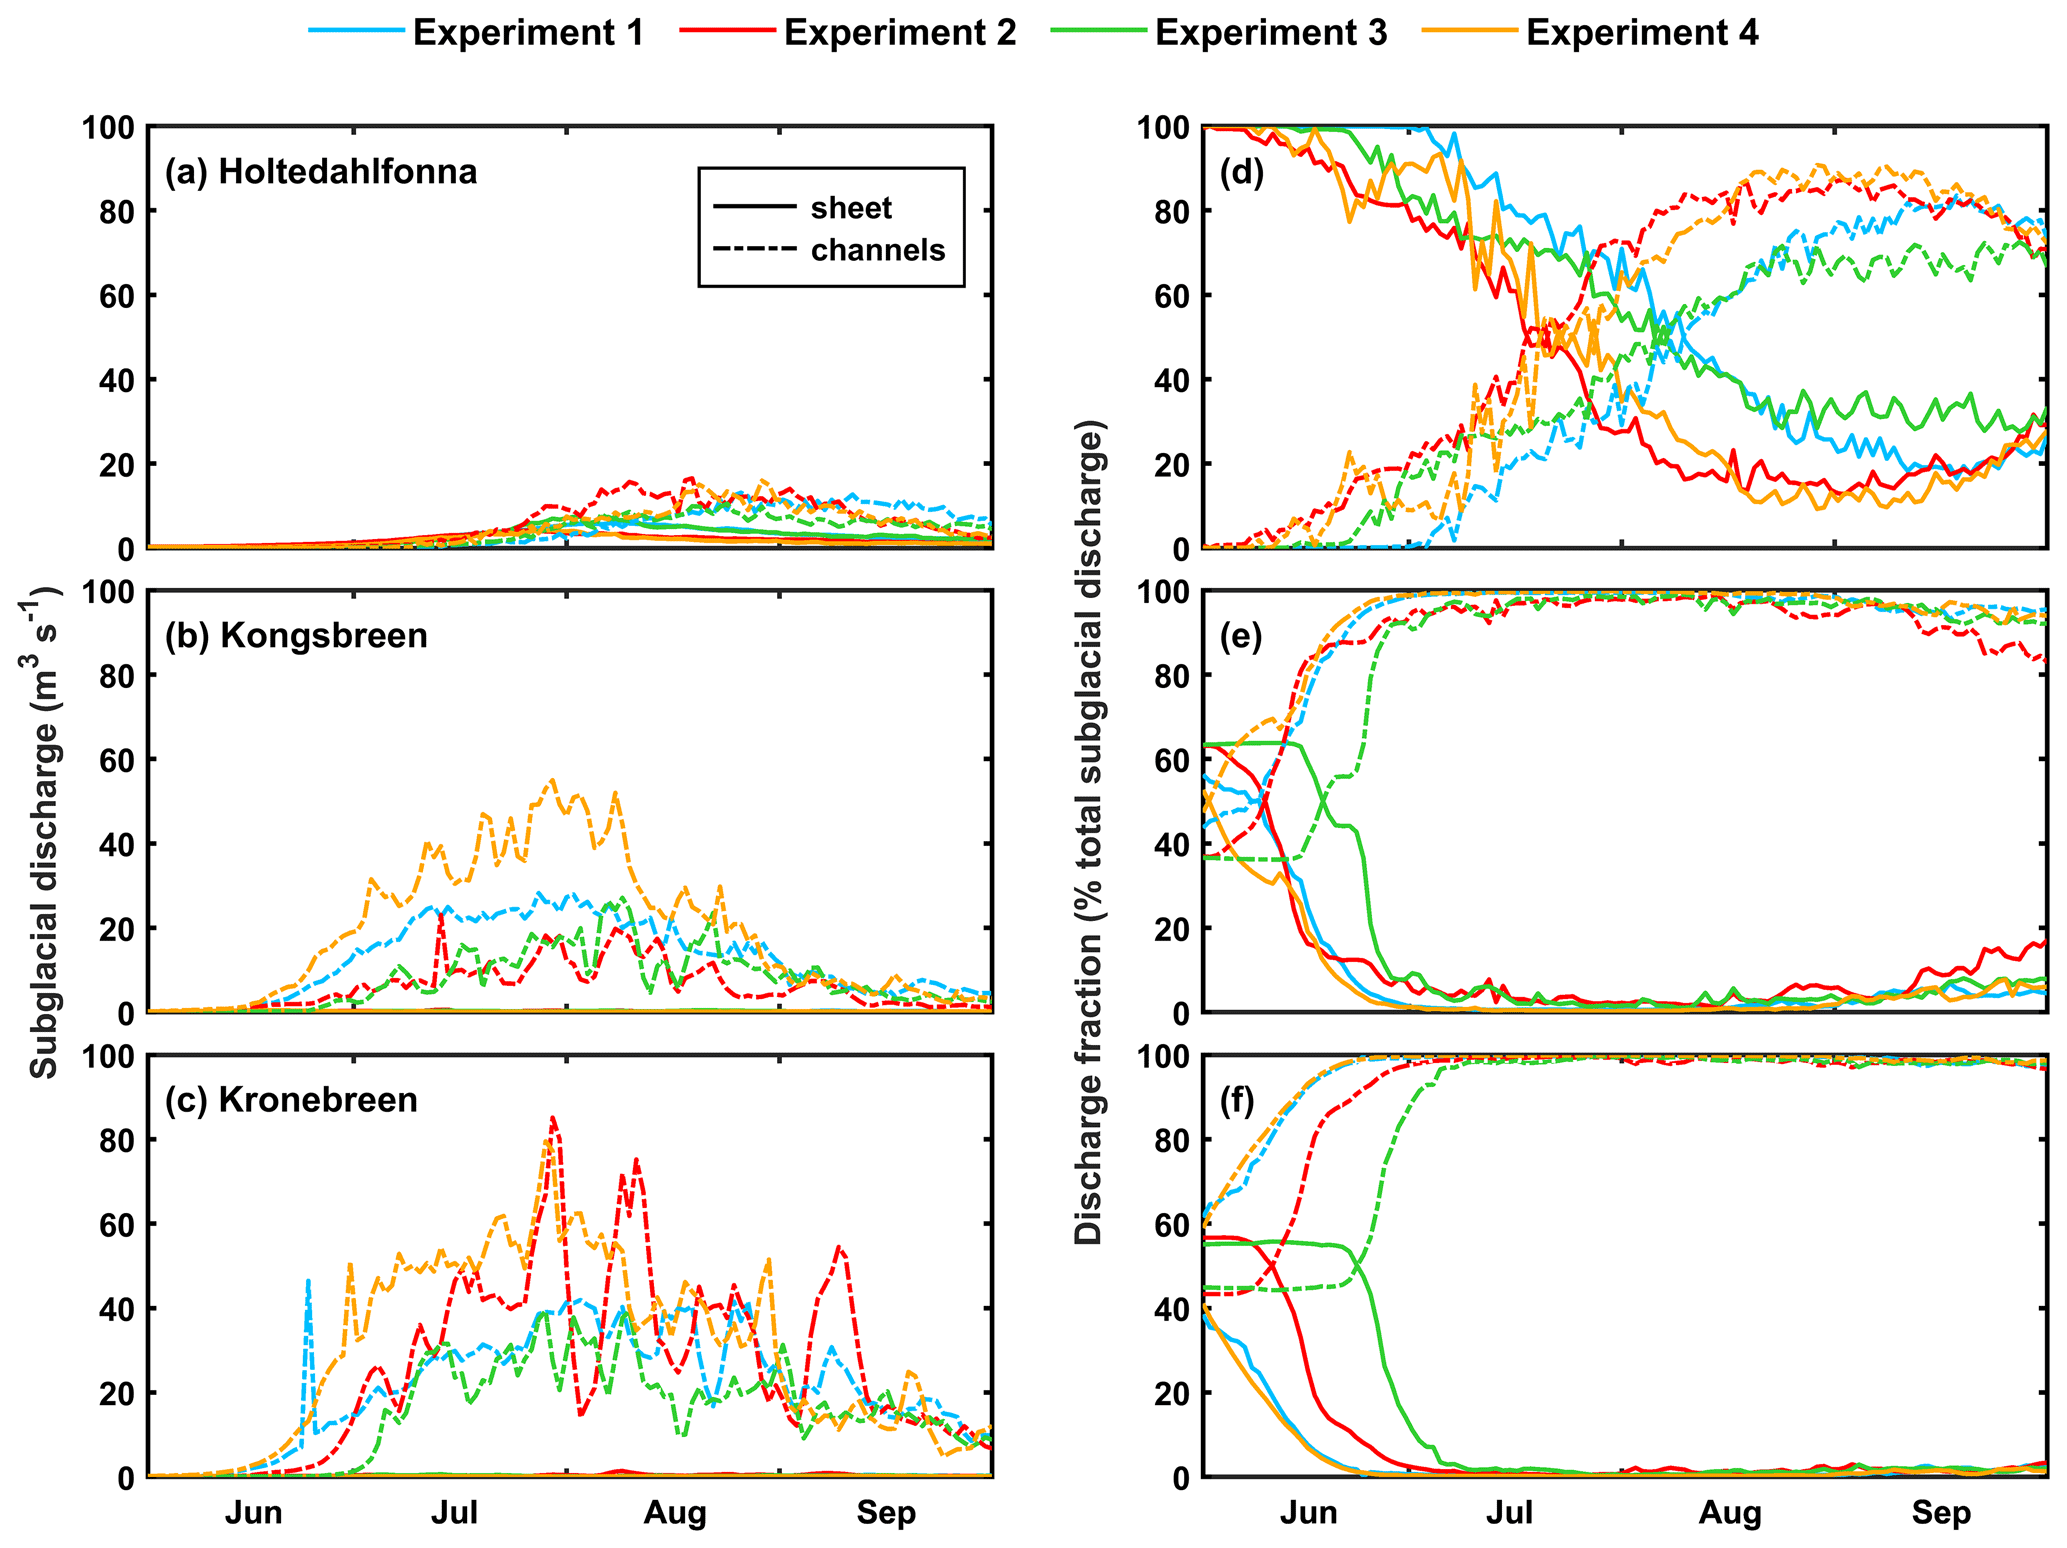
Figure 6(a–c) Mean (2004–2017) summertime (June–September) sheet discharge and channel discharge modelled by each experiment across (a) Holtedahlfonna, (b) Kongsbreen, and (c) Kronebreen. Sheet discharge is the cross-glacier width integral of the x component of the nodal sheet discharge. Channel discharge is the sum of discharge from all channel edges intersecting the cross-glacier section. Discharge is expressed in absolute values (m3 s−1). (d–f) Mean (2004–2017) summertime (June–September) sheet discharge and channel discharge modelled by each experiment across (d) Holtedahlfonna, (e) Kongsbreen, and (f) Kronebreen. Here, discharge in the sheet and in the channels is expressed as a fraction of the total discharge (the sum of the discharge in the sheet and in the channels). Cross-glacier transect locations are shown in Fig. 1b.
4.1.3 Subglacial discharge
We first investigate the partitioning of the subglacial drainage between the distributed sheet and the channels (Fig. 6). In all experiments, summertime subglacial drainage is dominated by the efficient system. In the accumulation zone, discharge is initially focused in the distributed sheet before channels take over in late July (Fig. 6a, d). In these upper reaches, the time of switching from inefficient to efficient drainage differs significantly between the water input configurations. With the largest water supply at high-elevation moulins and the fastest response in subglacial discharge (Fig. 3b), Experiment 2 leads, followed by experiments 4, 3, and 1. In the ablation zone (Fig. 6b, c), channels develop more rapidly than in the upper regions so that water drains primarily through the efficient system for most of the melt season (Fig. 6e, f). The hydrological switch in the subglacial drainage regime occurs earlier in experiments 1 and 4 than in experiments 2 and 3 (Fig. 6e, f) since the latter supply less or no meltwater at lower elevations (Fig. 2b, c). In contrast to the distributed sheet, discharge in the channel system varies considerably depending on the water input scenario, with the highest values driven by experiments 2 and 4 at both Holtedahlfonna and Kronebreen (Fig. 6a, c), whereas at Kongsbreen, experiments 4 and 1 yield the highest channel discharge (Fig. 6b). Moreover, short-lived pulses in channel discharge are not always concurrent in all experiments; however, we focus our analysis away from these features because they likely originate from numerical artefacts. Indeed, as GlaDS is built under the assumption of water-saturated channels, local numerical instabilities leading to short channel segments growing disproportionally large can cause unrealistically high local discharge.
Next, we compare the distribution of subglacial flow paths in the model domain at the peak of channelization for each water supply scenario. As shown in Fig. 7, the water input configuration has little influence on the main structure of the channelized system. By the end of August, all experiments produce an arborescent channel network in the lower 30–35 km of the glaciers. Subglacial water is released into the fjord by three major channel trunks that connect the glacier fronts to the upper ablation areas of Kongsbreen North, Kronebreen, and Kongsvegen. The Kronebreen main channel merges with the Kongsvegen channel at the confluence of the two glaciers and shares the same subglacial outlet on the southern side of their common front. While subglacial discharge flows in the general downglacier direction, channels do not align with the glacier centrelines but instead follow the deeper parts of the bed. The complex basal topography of Kongsfjord causes ample meandering in the subglacial flow paths regardless of the water input configuration. For instance, as highlighted in Fig. 7a, a nunatak and a bedrock spur split the main channels of Kongsbreen North and Kronebreen, respectively. Regions of shallow ice and adverse slopes in the glacier beds impede channel formation, and thus discontinuities occur, in particular in Experiment 2 (Fig. 7b).
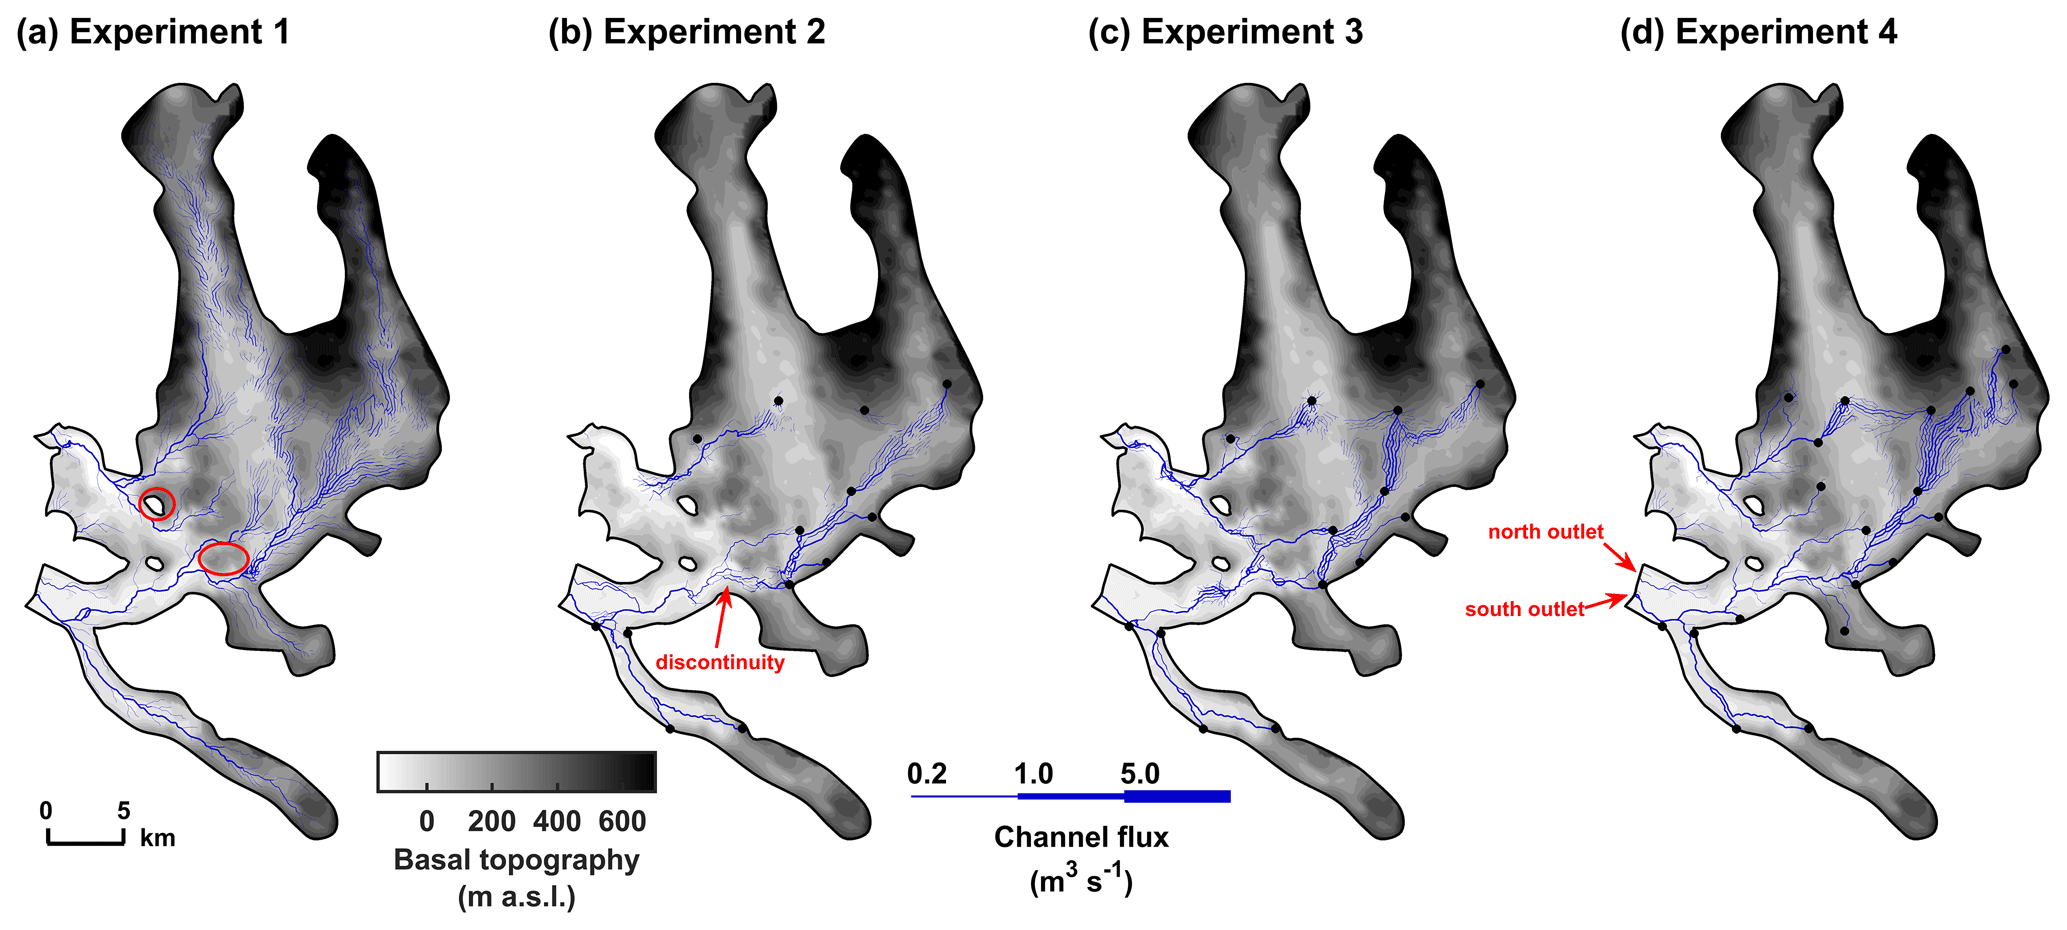
Figure 7Summer snapshot (20 August 2013) of subglacial channel distribution modelled by each experiment with subglacial topography in greyscale. The year (2013) is chosen arbitrarily but is representative of the entire period. We use 1 m3 s−1 as an arbitrary threshold flux to discriminate regions of significant channel size. Nunatak and bedrock spur splitting subglacial channels are circled in Experiment 1 (a). Discontinuity in the channel network due to basal adverse slopes is marked in red in Experiment 2 (b). Frontal outlets to subglacial run-off at Kronebreen–Kongsvegen are marked in red in Experiment 4 (d). The black dots mark the moulin locations.
In the ablation zone, channels are better developed (higher connectivity and discharge) in experiments 1 and 4 because these configurations both assume direct surface-to-bed meltwater transfer in the lower part of the domain (Fig. 7a, d). In both scenarios, subglacial run-off at Kronebreen exits primarily through the south-side frontal outlet, while discharge at the north-side frontal outlet is sustained only by a short, solitary channel (Fig. 7a, d). This is in disagreement with observations that suggest the north-side outlet has larger and more temporally stable plume activity than the south-side outlet (How et al., 2017; Everett et al., 2018). While there are geometrical challenges with reliably measuring the south-side plume area from time-lapse photography (How et al., 2017), the observed stability of the north-side plumes clearly indicates the existence of a persistent drainage pathway that is not captured by our model. This subglacial pathway could presumably exist in the form of a permanent canal incised into the sediment (Walder and Fowler, 1994), a mechanism that is not included in GlaDS (as described in Sect. 5.4). The absence of meltwater recharge in the lower domain of Experiment 3 leads to reduced and later channel development in the ablation zone (Fig. 6b, c, e, f), thus limiting the subglacial pathways at Kronebreen to the main south-side channel and frontal outlet (Fig. 7c). In late August, channelized discharge in experiments 1, 3, and 4 reaches its peak, whereas in Experiment 2 the channel network is already collapsing in the regions that receive less water input. Therefore, Experiment 2 yields shorter channels and lower discharge in the upper ablation zone of Kronebreen, as well as no channels in the lower part of Kongsbreen (Fig. 7b).
In the accumulation zone, discrete water recharge at moulins focuses subglacial discharge in channels initiated directly downstream of moulins, thereby limiting the inland extension of channels to moulin locations. This is particularly visible at Kongsvegen, where the subglacial channel extends significantly further upstream in Experiment 1 (Fig. 7a) compared to experiments 2–4, which split the channel between two moulins (Fig. 7b–d). In contrast to the moulin experiments, sheet-only Experiment 1 produces a large number of minor channels (0.2–1.0 m3 s−1) in the upper model domain (Fig. 7a), which points to the predominance of a distributed drainage system rather than a true channelized system. These channels seem topographically induced as they lie across steep bedrock slopes and terminate in the subglacial valleys below Isachsenfonna and Holtedahlfonna.

Figure 8Mean (2004–2017) basal water pressure and channel discharge modelled by Experiment 4 in (a) early summer (June), (b) midsummer (July), and (c) late summer (August). Snapshots of channel discharge are taken on (a) 20 June 2013, (b) 20 July 2013, and (c) 20 August 2013. The year (2013) is chosen arbitrarily but is representative of the entire period. Basal water pressure is expressed as a fraction of the ice overburden pressure. We use 1 m3 s−1 as an arbitrary threshold flux to discriminate regions of significant channel size. The black dots mark the moulins locations.
4.2 Seasonal evolution of the subglacial drainage system
Here we use the results of Experiment 4, the most realistic water supply configuration, to describe the subglacial hydrology of Kongsfjord. At the beginning of each melt season (early June), the subglacial hydrological system starts to evolve from its channel-free winter configuration. As rising amounts of surface-generated meltwater penetrate to the glacier beds, the inefficient subglacial drainage system rapidly becomes highly pressurized. Pressure first increases in the ablation zone where surface melting is highest and crevasses allow immediate transfer of meltwater to the bed (Fig. 8a). Water flow at the ice-bed interface dissipates energy through the melting of ice, thereby opening small channels where melt-opening exceeds creep closure. The first channels (0.2–1.0 m3 s−1) appear in late June, at the front of Kongsbreen North and Kronebreen–Kongsvegen, before rapidly extending to the upper ablation zone.
By mid-July, channels have grown to accommodate larger water fluxes (> 5.0 m3 s−1). In the lower half of the model domain, moulins have generated channels that connect to the main channel trunks, thereby forming an arborescent network (Fig. 8b). At the peak of the melt season (July–August), subglacial water pressure varies considerably (0 %–100 % of the ice overburden pressure) across the Kongsfjord basin, with a domain-wide mean peak value of 81.5 % of the ice overburden pressure. There is a strong inverse correlation between basal water pressure and bedrock topography, the most pressurized regions being the low-lying valleys below the accumulation basins and the subglacial overdeepenings in the ablation area.
By late August, large channels (> 5.0 m3 s−1) have formed as far as 30–35 km from the glacier fronts (Fig. 8c). There are no channels upstream of the highest moulins, which indicates that, in the absence of moulins, the efficient drainage system would extend no further than the lower part of the accumulation zone. Although the broad-scale structure of the channelized system remains stable throughout the melt season, channels constantly rearrange to accommodate the short-lived variations in meltwater supply. Most noticeably, the subglacial system remains highly pressurized despite channelization even during the second half of the melting period. In most of the upper part of the glacier basin, basal water pressures in August (Fig. 8c) are up to 20 % higher than in June (Fig. 8a) for comparable water inputs.
Finally, towards the end of the melt season, the decrease in water supply leads to the gradual closure of the subglacial channels, and the residual water drains through the distributed system. Channels in the upper reaches are the first to recede, whereas at the glacier termini channels persist until late October.
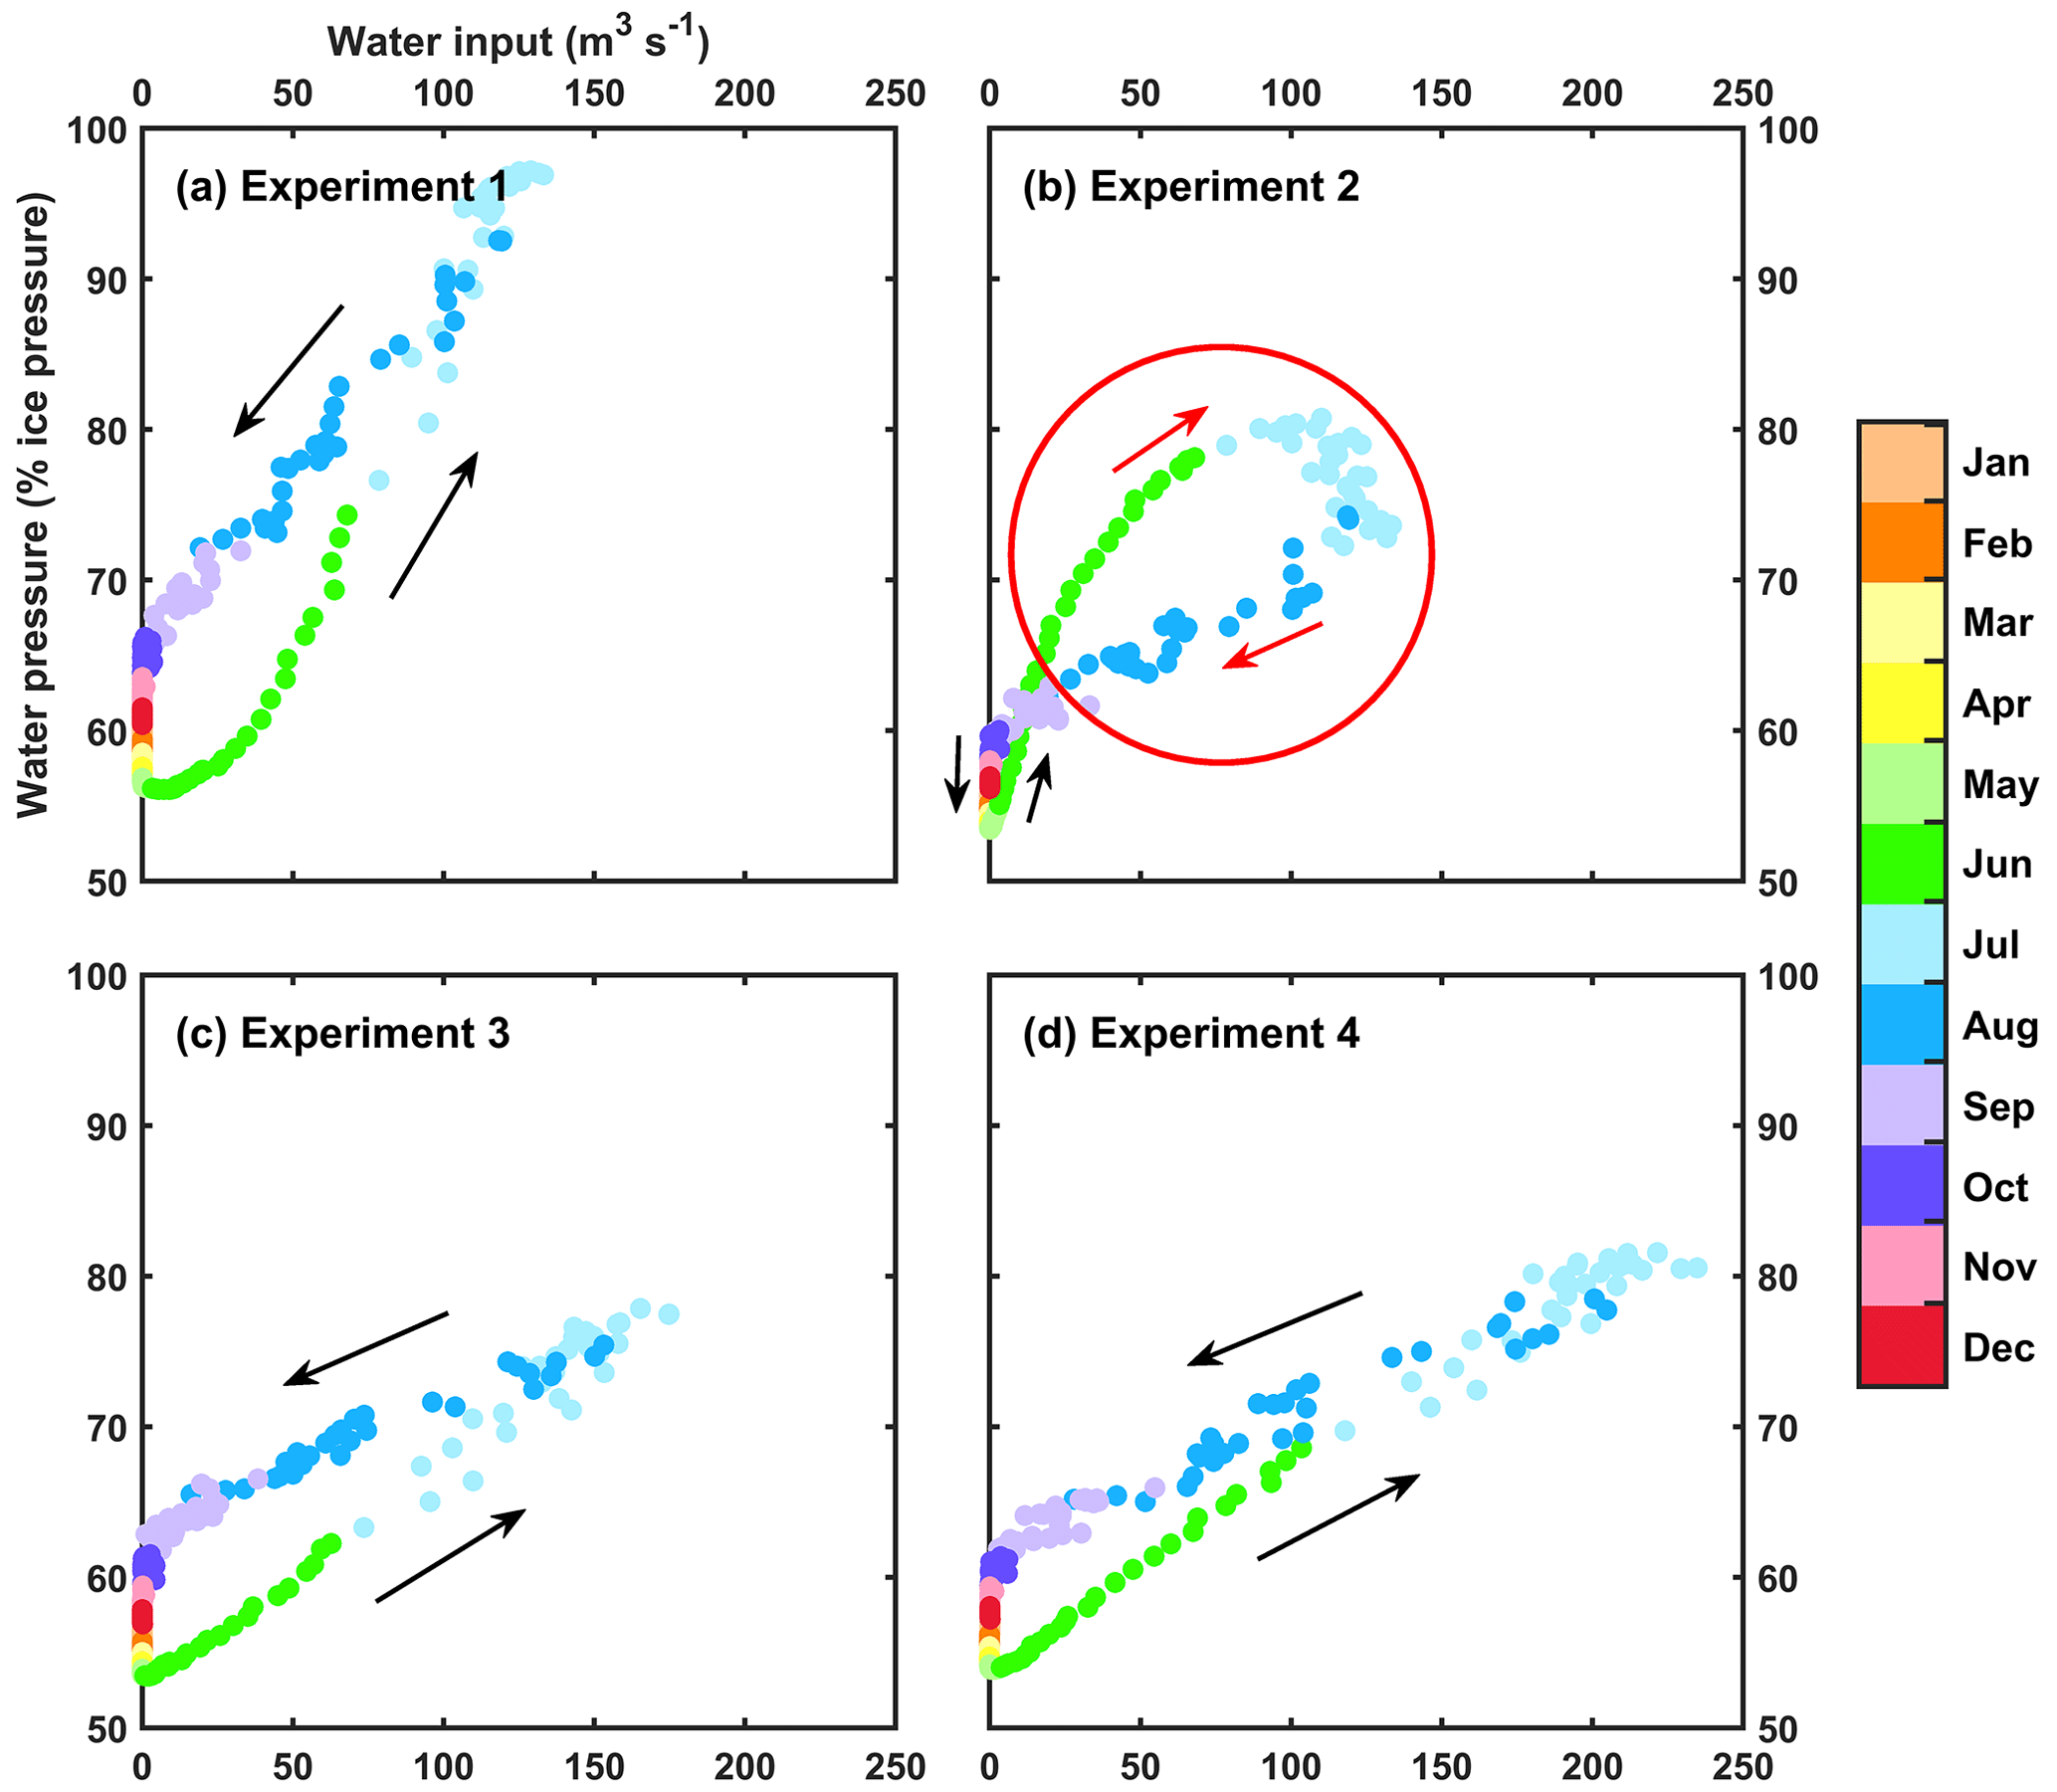
Figure 9Relationship between water input and basal water pressure averaged over the whole model domain for each experiment during the mean (2004–2017) annual period. Clockwise hysteresis loop in Experiment 2 (b) between mid-June and early September is marked in red. Water pressure is expressed as a fraction of the ice overburden pressure (%).
5.1 Model sensitivity to water supply distribution
In this study, we made various assumptions about how meltwater is delivered to the glacier beds. Here we discuss each of these approximations and how they impact the development of the subglacial drainage system in Kongsfjord.
Our reference experiment (Experiment 1) assumes direct and immediate surface-to-bed water transfer over the entire model domain by considering each node of the mesh as a sink for the local meltwater. Despite still being used in models of subglacial hydrology (e.g. Cook et al., 2020), the assumption of perfect vertical permeability may only be appropriate in heavily crevassed glacier zones, such as the terminal part of Kronebreen. This approximation overestimates the amount of water supply to large parts of the glacier bed, in particular at the highest elevations, but underestimates input in areas where recharge is concentrated at moulins. Accordingly, Experiment 1 drives higher water pressures and less channelization in the upper accumulation zone (Fig. 4) and hence the highest mean annual pressures overall compared to the other scenarios (Fig. 3b).
In Experiment 2, the domain-wide total recharge is evenly distributed among 13 moulins instead of being directly fed to the subglacial hydrological system. The assumption of equal recharge at moulins is unrealistic as it implies that meltwater produced at lower elevations is injected into moulins at higher elevations. However, results from this experiment can be easily compared with those of Experiment 1 since both scenarios apply the same water volume to the subglacial system (Fig. 3a). Experiment 2 drives the highest water pressures at the onset of the melt season (Fig. 3b), as well as earliest and largest channel discharge in the accumulation zone (Fig. 6a, d), but the lowest pressures in middle and late summer (Fig. 3b). This indicates that local recharge favours faster channelization in areas where moulins receive large volumes of water (Fig. 4f) and that more efficient drainage at higher regions of the glacier in early summer leads to lower pressurization of the subglacial system during the rest of the melt season.
In Experiment 3, the input to each moulin is collected from their upstream catchments (some of them extending beyond the model domain), generating a slightly larger total volume of water supply than in experiments 1–2 (Fig. 3a). Yet paradoxically, Experiment 3 produces overall lower water pressures than Experiment 1 (Figs. 3b, 4g) and less channelization in the ablation zone (Fig. 6b, c, e, f) compared to the other scenarios. We attribute this counterintuitive result to the water supply configuration that does not account for recharge in the ablation zone where meltwater production is highest.
Experiment 4 aims at the most realistic representation of the actual surface hydrology of the Kongsfjord basin by considering supraglacial streams, supraglacial lakes, moulins, and crevasses. The total water volume delivered to the bed is higher than in the other experiments (Fig. 3a) due to the different drainage catchment definition (Fig. 2d). Similar to Experiment 1, this scenario leads to both earlier and higher subglacial discharge in the ablation zone compared to experiments 2 and 3 (Fig. 6b, c, e, f), thus opening larger channels in the lower half of the model domain (Fig. 7d). However, unlike Experiment 1, Experiment 4 produces a more efficient drainage in the upper half of the glacier basin as well and therefore yields lower water pressures both in summer and in winter despite feeding larger volumes of meltwater to the subglacial system than the reference scenario. This is in line with findings by Koziol and Arnold (2018), which suggested that a more efficient drainage system in summer leads to lower water pressures in winter. This result also shows how a more upward-extended channelized drainage system, maintained by higher recharge at higher elevations, can lower glacier-wide basal pressure.
Notwithstanding these differences between the water input configurations, water pressure remains high (roughly around 70 %) during the entire melt season in all experiments (although less in Experiment 2), suggesting that channels are not very efficient at depressurizing the subglacial hydrological system. As depicted in Fig. 9, the subglacial water pressure displays annual hysteresis under variations in water input. Experiments 1, 3, and 4 exhibit counter-clockwise hysteresis (Fig. 9a, c, d), meaning that for comparable water inputs, water pressure is significantly higher during falling recharge at the end of the melt season than during rising recharge at the start of the melt season. This indicates that water pressure continuously builds up during the melt season and only slowly decreases afterwards. This supports our interpretation that, in experiments 1, 3, and 4, channels contribute only very little to the modulation of subglacial water pressure in our study area. For Experiment 2, however, the relationship between water input and water pressure is more complex (Fig. 9b). For higher water inputs (above 60 m3 s−1), the hysteresis loop turns clockwise, indicating that the subglacial drainage system becomes more efficient with increasing recharge. This change in direction in hysteresis between mid-June and early September indicates that subglacial channels are able to exert some control, although limited, on basal water pressure, which explains why Experiment 2 yields the lowest pressures in midsummer and late summer (Fig. 3b).
5.2 Low efficiency of the subglacial drainage system
In contrast to some previous studies (e.g. Schoof, 2010; Chandler et al., 2013), we find no support that channels are able to substantially increase the efficiency of the subglacial drainage system as water pressures remain high during the entire melting period in all of our experiments (Fig. 3b). Moreover, in our most realistic water supply scenario (Experiment 4), high water pressures (> 90 % of the ice overburden pressure) until late summer over large parts of the model domain (Fig. 8c) suggest that channelization coincides with high pressurization of the subglacial drainage system. We identify two factors behind the low efficiency of the channels in our study area.
First, the small surface gradients that characterize our model domain drive high pressurization of the channels. Subglacial channels open through the melting of the overlying ice driven by turbulent heat dissipation, which requires steeper downglacier bed and surface slopes than those in our study area. Hence, higher water pressures are required to counteract creep closure and keep the channels open even in areas that receive high water input from moulins. The finding that subglacial channels do not play an important role in regulating subglacial water pressure at such low sloping glaciers has been reported in other studies applied to the Greenland Ice Sheet (Meierbachtol et al., 2013; Moon et al., 2014; Dow et al., 2015).
Second, Arctic glaciers such as those of the Kongsfjord basin experience shorter melt seasons than mid- and low-latitude glaciers, and they thus receive overall less water supply from the surface, which also inhibits channelization. In particular, minimal wintertime water input due to generally low temperatures in the Arctic and limited recharge from episodic warm spells is unable to sustain year-round subglacial channels. Compared to overwintered channels that more readily grow to accommodate meltwater input, first season channels lack the capacity to evacuate large volumes of water injected to glacier beds. Poinar et al. (2019) suggested that high-elevation firn aquifers can provide steady water input to the subglacial system outside of the melt season, thereby facilitating subglacial channel formation and winter-persistence even in low sloping areas. Evidence of a perennial firn aquifer was revealed by ice-penetrating radar and GPS observations in the upper reaches of Holtedahlfonna (Christianson et al., 2015). This aquifer is recharged by downward percolation of summertime meltwater, and discharge occurs through downhill flow in the winter. Deep firn water storage is accounted for in the model that provided the input time series to our subglacial hydrology model (Van Pelt et al., 2019) but does not permit considerable wintertime contribution to recharge in the absence of supply from the surface.
5.3 Implications for glacier sliding
Studies of glacier motion suggest that ice acceleration typically occurs after the onset of the melt season when water input to the ice-bed interface is rising faster than the subglacial drainage system can accommodate, driving an increase in basal water pressure, ice-bed separation, and sliding. The sensitivity of ice motion to water input usually decreases over the melt season as the subglacial drainage system evolves from an inefficient distributed to efficient channelized configuration, thereby gradually lowering basal water pressures despite increasing surface melt and thus causing ice deceleration in late summer (Davison et al., 2019). We found that varying the water input configuration introduces differences in the way the subglacial drainage system copes with the early summer increase in water supply, which may be crucial for glacier sliding. In an ice flow model forced by a subglacial hydrology model such as that used in this study, Experiment 1 would cause unrealistically high sliding in the upper accumulation zone as these regions receive too much water. Conversely, the absence of water recharge in the ablation zone (Experiment 3), in driving only moderate pressurization of the subglacial system, would underestimate the rate of sliding at lower elevations. Our results also suggest that limited efficiency of the channelized system, which we attribute to low hydraulic gradients, further enhances sensitivity of sliding to basal recharge variability by maintaining high water pressures and faster sliding speed during the entire summer. We thence deduce that substantial sliding likely occurs at most of the Kongsfjord glaciers over the entire melt season and that sliding rates remain high even in the late summer, which is consistent with observations by Schellenberger et al. (2015) for Kronebreen. For Kongsbreen North, however, Schellenberger et al. (2015) show that surface velocities tend to decrease over the melt season, which is not in accordance with our findings. Their results suggest that subglacial drainage efficiency increases during summer and is able to lower water pressure in that part of the glacier system. Such behaviour is not captured by our model and may be due to the existence of permanent canals carved in the subglacial sediment (Walder and Fowler, 1994) which are not accounted for in the GlaDS model.
5.4 Model limitations and future work
One limitation of this study is the lack of coupling between subglacial hydrology and ice dynamics. Given the regional scale of our experiments, running the model in an uncoupled version allowed us to keep the computational cost of our study at a reasonable level. Therefore, we have primarily focused our discussion on the behaviour of the subglacial hydrological system under different melt input configurations and have only cautiously discussed its likely impacts on sliding. Implementing a two-way coupled model would be relevant for future studies seeking to investigate in more detail the feedbacks between subglacial hydrology and ice dynamics.
Another limitation is that our modelling approach ignores some aspects of the glacial hydrological system. We assume that the location of surface-to-bed connections such as moulins and crevasses remains unchanged during the 14-year period of our simulations. In reality, supraglacial hydrology is a dynamic system that is governed by variations in ice velocity and in surface mass balance. Glacier acceleration enhances crevassing, thus increasing the area of direct meltwater transfer to the ice-bed interface. Intense melt events not only promote opening of new moulins through melt-enlargement of existing crevasses but also drive hydrofracturing, a mechanism through which water-filled crevasses or supraglacial meltwater ponds abruptly propagate downwards (Alley et al., 2005; van der Veen, 2007; Das et al., 2008). Supraglacial lake drainage is a widespread mechanism for moulin activation in the upper ablation zone and hence may contribute significantly to subglacial reorganization (Bingham et al., 2003; Andrews et al., 2018; Hoffman et al., 2018). Firn aquifers lying upstream of crevasse fields can also drive hydrofracturing (Poinar et al., 2017). Consequently, neglecting the spatio-temporal evolution of crevasses, moulins, and lake drainage events in our model is definitely a limiting factor to the accurate simulation of water recharge to glacier beds. This limitation could be overcome by using a spatially distributed model of supraglacial hydrology that would predict both the location and the timing of new surface-to-bed hydrological connections for given surface melt scenarios (e.g. Clason et al., 2012, 2015; Koziol et al., 2017).
Finally, the GlaDS model is built on hard-bed physics that may not be relevant everywhere in our study area. The presence of abundant sediment alters water drainage at the glacier base as water can also flow through porous sediment or canals carved in the sediment (Walder and Fowler, 1994), for instance. While GlaDS includes the presence of porous sediment through the parameter of water sheet conductivity, the model does not account for formation of canals within the sediment. Canals could locally increase drainage efficiency compared to the prediction obtained from the Röthlisberger (1972) theory alone as implemented in GlaDS.
The results of our modelling indicate that discrete basal water recharge at moulins (Experiment 2) leads to higher water pressures at the beginning of the melt season, exceeding those simulated when assuming spatially continuous, direct surface-to-bed transfer (Experiment 1). However, the more localized recharge also favours a faster evolution of subglacial channels, with an opposite effect that quickly dominates such that the moulin configurations (experiments 2, 3, and 4) result in overall lower water pressures during the remainder of the melt season and the subsequent winter. The modelled timing at which sliding would accelerate is therefore sensitive to moulin distribution and total basal recharge. In this regard, we conclude that there is value in the mapping of supraglacial hydrology features such as streams, crevasses, lakes and moulins in order to appropriately represent recharge to the subglacial drainage system.
Despite differences in the subglacial hydrological response to early summer rise in meltwater supply, all of our experiments agree that the modelled subglacial hydrology in our study area has limited sensitivity to water input configuration. We find that both the location and the size of subglacial channels are governed largely by basal topography regardless of how and where water enters the glacier beds and that channels remain highly pressurized during the entire melt season. We attribute this to the gentle slopes of the glaciers that do not support strong hydraulic gradients and to the short duration of the high Arctic melt season with limited amounts of meltwater injected to the subglacial hydrological system. Therefore, subglacial channels are unable to substantially decrease the summertime overall basal pressure, implying that sliding is directly linked to spatio-temporal variability in meltwater recharge and that sliding likely occurs at the Kongsfjord basin during the entire melting period.
The outcomes of our study raise implications for the future of ice dynamics in a warming climate and can be generalized to most Svalbard tidewater glaciers, which have relatively flat surfaces and which experience typically less water supply to their beds compared to lower latitude glaciers. The current inability of these glaciers to build an efficient drainage system implies that they are likely sensitive to long-term trends in meltwater supply variability, contrary to what would be expected in Greenland outlet or Alpine glaciers.
The digital elevation model can be accessed at https://doi.org/10.21334/npolar.2014.dce53a47 (Norwegian Polar Institute, 2014). The glacier and land masks were constructed from glacier outlines, which are available at https://doi.org/10.21334/npolar.2013.89f430f8 (König et al., 2013). The subglacial topography and bathymetry of Kongsfjorden is available at https://doi.org/10.21334/npolar.2017.702ca4a7 (Lindbäck et al., 2018). The modelled water recharge dataset has been prepared and shared by Ward Van Pelt and can also be accessed in the following repository: https://doi.org/10.6084/m9.figshare.7836530.v1 (Van Pelt et al., 2019). Crevasse zones and moulin locations have been mapped from commercially available, licensed satellite imagery (CNES, 2014, and Airbus DS, 2014, all rights reserved. Commercial uses forbidden). The TopoToolbox is available at https://github.com/wschwanghart/topotoolbox (Schwanghart and Scherler, 2014). The subglacial hydrology model GlaDS is freely available as part of the Elmer/Ice model (Gagliardini and Werder, 2018). The underlying model outputs for the figures presented in this paper can be accessed at https://doi.org/10.5281/zenodo.4680908 (Scholzen, 2021).
All three authors designed the research idea. CS performed the simulations and the main analysis. CS wrote the paper with contributions from all co-authors.
The authors declare that they have no conflict of interest.
The authors would like to thank Ward Van Pelt for providing the input data. We are grateful to Jack Kohler and Chris Nuth for their support in obtaining and processing digital elevation models and satellite imagery. Chloé Scholzen would like to thank Olivier Gagliardini for fruitful discussions and assistance during her research stay at IGE, CNRS.
This research has been supported by the Norwegian Ministry of Education and Research who granted a PhD fellowship to Chloé Scholzen and by the Norges Forskningsråd (grant no. 301837).
This paper was edited by Valentina Radic and reviewed by Christine Dow and one anonymous referee.
AMAP: Snow, Water, Ice and Permafrost in the Arctic (SWIPA), Summary for Policy-makers, Arctic Monitoring & Assessment Programme, available at: https://www.amap.no/documents/download/2888/inline (last access: 10 August 2020), 2017.
Alley, R. B., Dupont, T. K., Parizek, B. R., and Anandakrishnan, S.: Access of surface meltwater to beds of sub-freezing glaciers: preliminary insights, Ann. Glaciol., 40, 8–14, 2005.
Andrews, L. C., Hoffman, M. J., Neumann, T. A., Catania, G. A., Lüthi, M. P., Hawley, R. L., Schild, K. M., Ryser, C., and Morriss, B. F.: Seasonal evolution of the subglacial hydrologic system modified by supraglacial lake drainage in western Greenland, J. Geophys. Res.-Earth Surf., 123, 1479–1496, 2018.
Banwell, A., Hewitt, I., Willis, I., and Arnold, N.: Moulin density controls drainage development beneath the Greenland ice sheet, J. Geophys. Res.-Earth Surf., 121, 2248–2269, 2016.
Bartholomew, I., Nienow, P., Mair, D., Hubbard, A., King, M. A., and Sole, A.: Seasonal evolution of subglacial drainage and acceleration in a Greenland outlet glacier, Nat. Geosci., 3, 408–411, 2010.
Benn, D. I. and Evans, D. J. A.: Glaciers and Glaciation, 2nd edn., Hodder Education, London, UK, 802 pp., 2010.
Bindschadler, R.: The importance of pressurized subglacial water in separation and sliding at the glacier bed, J. Glaciol., 29, 3–19, 1983.
Bingham, R. G., Nienow, P. W., and Sharp, M. J.: Intra-annual and intra-seasonal flow dynamics of a High Arctic polythermal valley glacier, Ann. Glaciol., 37, 181–188, 2003.
Björnsson, H., Gjessing, Y., Hamran, S.-E., Hagen, J. O., LiestøL, O., Pálsson, F., and Erlingsson, B.: The thermal regime of sub-polar glaciers mapped by multi-frequency radio-echo sounding, J. Glaciol., 42, 23–32, 1996.
Bouillon, A., Bernard, M., Gigord, P., Orsoni, A., Rudowski, V., and Baudoin, A.: SPOT 5 HRS geometric performances: Using block adjustment as a key issue to improve quality of DEM generation, ISPRS J. Photogramm., 60, 134–146, 2006.
Bueler, E. and van Pelt, W.: Mass-conserving subglacial hydrology in the Parallel Ice Sheet Model version 0.6, Geosci. Model Dev., 8, 1613–1635, https://doi.org/10.5194/gmd-8-1613-2015, 2015.
Carey, M., Molden, O. C., Rasmussen, M. B., Jackson, M., Nolin, A. W., and Mark, B. G.: Impacts of glacier recession and declining meltwater on mountain societies, Ann. Am. Assoc. Geogr., 107, 350–359, 2017.
Catania, G. A. and Neumann, T.: Persistent englacial drainage features in the Greenland Ice Sheet, Geophys. Res. Lett., 37, L02501, https://doi.org/10.1029/2009GL041108, 2010.
Chandler, D., Wadham, J., Lis, G., Cowton, T., Sole, A., Bartholomew, I., Telling, J., Nienow, P., Bagshaw, E., and Mair, D.: Evolution of the subglacial drainage system beneath the Greenland Ice Sheet revealed by tracers, Nat. Geosci., 6, 195–198, 2013.
Christianson, K., Kohler, J., Alley, R. B., Nuth, C., and Van Pelt, W. J.: Dynamic perennial firn aquifer on an Arctic glacier, Geophys. Res. Lett., 42, 1418–1426, 2015.
Clason, C., Mair, D., Burgess, D., and Nienow, P.: Modelling the delivery of supraglacial meltwater to the ice/bed interface: application to southwest Devon Ice Cap, Nunavut, Canada, J. Glaciol., 58, 361–374, 2012.
Clason, C. C., Mair, D. W. F., Nienow, P. W., Bartholomew, I. D., Sole, A., Palmer, S., and Schwanghart, W.: Modelling the transfer of supraglacial meltwater to the bed of Leverett Glacier, Southwest Greenland, The Cryosphere, 9, 123–138, https://doi.org/10.5194/tc-9-123-2015, 2015.
Cook, S. J., Christoffersen, P., Todd, J., Slater, D., and Chauché, N.: Coupled modelling of subglacial hydrology and calving-front melting at Store Glacier, West Greenland , The Cryosphere, 14, 905–924, https://doi.org/10.5194/tc-14-905-2020, 2020.
Copland, L., Sharp, M. J., and Nienow, P. W.: Links between short-term velocity variations and the subglacial hydrology of a predominantly cold polythermal glacier, J. Glaciol., 49, 337–348, 2003.
Cowton, T., Nienow, P., Sole, A., Wadham, J., Lis, G., Bartholomew, I., Mair, D., and Chandler, D.: Evolution of drainage system morphology at a land-terminating Greenlandic outlet glacier, J. Geophys. Res.-Earth Surf., 118, 29–41, 2013.
Das, S. B., Joughin, I., Behn, M. D., Howat, I. M., King, M. A., Lizarralde, D., and Bhatia, M. P.: Fracture propagation to the base of the Greenland Ice Sheet during supraglacial lake drainage, Science, 320, 778–781, 2008.
Davison, B. J., Sole, A. J., Livingstone, S. J., Cowton, T. R., and Nienow, P. W.: The influence of hydrology on the dynamics of land-terminating sectors of the Greenland Ice Sheet, Front. Earth Sci., 7, 10, https://doi.org/10.3389/feart.2019.00010, 2019.
de Fleurian, B., Gagliardini, O., Zwinger, T., Durand, G., Le Meur, E., Mair, D., and Råback, P.: A double continuum hydrological model for glacier applications, The Cryosphere, 8, 137–153, https://doi.org/10.5194/tc-8-137-2014, 2014.
de Fleurian, B., Werder, M. A., Beyer, S., Brinkerhoff, D. J., Delaney, I., Dow, C. F., Downs, J., Gagliardini, O., Hoffman, M. J., and Hooke, R. L.: SHMIP The subglacial hydrology model intercomparison Project, J. Glaciol., 64, 897–916, 2018.
Decaux, L., Grabiec, M., Ignatiuk, D., and Jania, J.: Role of discrete water recharge from supraglacial drainage systems in modeling patterns of subglacial conduits in Svalbard glaciers, The Cryosphere, 13, 735–752, https://doi.org/10.5194/tc-13-735-2019, 2019.
Dow, C. F., Kulessa, B., Rutt, I., Tsai, V., Pimentel, S., Doyle, S., Van As, D., Lindbäck, K., Pettersson, R., and Jones, G.: Modeling of subglacial hydrological development following rapid supraglacial lake drainage, J. Geophys. Res.-Earth Surf., 120, 1127–1147, 2015.
Dow, C. F., Werder, M., Babonis, G., Nowicki, S., Walker, R. T., Csathó, B., and Morlighem, M.: Dynamics of active subglacial lakes in Recovery Ice Stream, J. Geophys. Res.-Earth Surf., 123, 837–850, 2018.
Dow, C. F., McCormack, F., Young, D., Greenbaum, J., Roberts, J., and Blankenship, D.: Totten Glacier subglacial hydrology determined from geophysics and modeling, Earth Planet. Sc. Lett., 531, 115961, https://doi.org/10.1016/j.epsl.2019.115961, 2020.
Downs, J. Z., Johnson, J. V., Harper, J. T., Meierbachtol, T., and Werder, M. A.: Dynamic hydraulic conductivity reconciles mismatch between modeled and observed winter subglacial water pressure, J. Geophys. Res.-Earth Surf., 123, 818–836, 2018.
Dunse, T., Schuler, T. V., Hagen, J. O., and Reijmer, C. H.: Seasonal speed-up of two outlet glaciers of Austfonna, Svalbard, inferred from continuous GPS measurements, The Cryosphere, 6, 453–466, https://doi.org/10.5194/tc-6-453-2012, 2012.
Dunse, T., Schellenberger, T., Hagen, J. O., Kääb, A., Schuler, T. V., and Reijmer, C. H.: Glacier-surge mechanisms promoted by a hydro-thermodynamic feedback to summer melt, The Cryosphere, 9, 197–215, https://doi.org/10.5194/tc-9-197-2015, 2015.
Everett, A., Kohler, J., Sundfjord, A., Kovacs, K. M., Torsvik, T., Pramanik, A., Boehme, L., and Lydersen, C.: Subglacial discharge plume behaviour revealed by CTD-instrumented ringed seals, Sci. Rep., 8, 1–10, 2018.
Flowers, G. E. and Clarke, G. K.: A multicomponent coupled model of glacier hydrology 1. Theory and synthetic examples, J. Geophys. Res.-Sol. Ea., 107, 2287, https://doi.org/10.1029/2001JB001122, 2002.
Flowers, G. E.: Modelling water flow under glaciers and ice sheets, P. Roy. Soc. A-Math. Phy., 471, 20140907, https://doi.org/10.1098/rspa.2014.0907, 2015.
Fountain, A. G., Campbell, J. L., Schuur, E. A., Stammerjohn, S. E., Williams, M. W., and Ducklow, H. W.: The disappearing cryosphere: impacts and ecosystem responses to rapid cryosphere loss, BioScience, 62, 405–415, 2012.
Gagliardini, O., Zwinger, T., Gillet-Chaulet, F., Durand, G., Favier, L., de Fleurian, B., Greve, R., Malinen, M., Martín, C., Råback, P., Ruokolainen, J., Sacchettini, M., Schäfer, M., Seddik, H., and Thies, J.: Capabilities and performance of Elmer/Ice, a new-generation ice sheet model, Geosci. Model Dev., 6, 1299–1318, https://doi.org/10.5194/gmd-6-1299-2013, 2013.
Gagliardini, O. and Werder, M. A.: Influence of increasing surface melt over decadal timescales on land-terminating Greenland-type outlet glaciers, J. Glaciol., 64, 700–710, 2018.
Gulley, J., Benn, D., Müller, D., and Luckman, A.: A cut-and-closure origin for englacial conduits in uncrevassed regions of polythermal glaciers, J. Glaciol., 55, 66–80, 2009a.
Gulley, J., Benn, D., Screaton, E., and Martin, J.: Mechanisms of englacial conduit formation and their implications for subglacial recharge, Quatern. Sci. Rev., 28, 1984–1999, 2009b.
Gulley, J., Grabiec, M., Martin, J., Jania, J., Catania, G., and Glowacki, P.: The effect of discrete recharge by moulins and heterogeneity in flow-path efficiency at glacier beds on subglacial hydrology, J. Glaciol., 58, 926–940, 2012.
Hagen, J., Melvold, K., Eiken, T., Isaksson, E., and Lefauconnier, B.: Mass balance methods on Kongsvegen, Svalbard, Geogr. Ann. A, 81, 593–601, 1999.
Hagen, J. O., Eiken, T., Kohler, J., and Melvold, K.: Geometry changes on Svalbard glaciers: mass-balance or dynamic response?, Ann. Glaciol., 42, 255–261, 2005.
Hewitt, I. J.: Modelling distributed and channelized subglacial drainage: the spacing of channels, J. Glaciol., 57, 302–314, 2011.
Hewitt, I. J.: Seasonal changes in ice sheet motion due to melt water lubrication, Earth Planet. Sc. Lett., 371, 16–25, 2013.
Hoffman, M. and Price, S.: Feedbacks between coupled subglacial hydrology and glacier dynamics, J. Geophys. Res.-Earth Surf., 119, 414–436, 2014.
Hoffman, M., Perego, M., Andrews, L. C., Price, S. F., Neumann, T. A., Johnson, J. V., Catania, G., and Lüthi, M. P.: Widespread moulin formation during supraglacial lake drainages in Greenland, Geophys. Res. Lett., 45, 778–788, 2018.
Horgan, H. J., Anderson, B., Alley, R. B., Chamberlain, C. J., Dykes, R., Kehrl, L. M., and Townend, J.: Glacier velocity variability due to rain-induced sliding and cavity formation, Earth Planet. Sc. Lett., 432, 273–282, 2015.
How, P., Benn, D. I., Hulton, N. R. J., Hubbard, B., Luckman, A., Sevestre, H., van Pelt, W. J. J., Lindbäck, K., Kohler, J., and Boot, W.: Rapidly changing subglacial hydrological pathways at a tidewater glacier revealed through simultaneous observations of water pressure, supraglacial lakes, meltwater plumes and surface velocities, The Cryosphere, 11, 2691–2710, https://doi.org/10.5194/tc-11-2691-2017, 2017.
Iken, A. and Bindschadler, R. A.: Combined measurements of subglacial water pressure and surface velocity of Findelengletscher, Switzerland: conclusions about drainage system and sliding mechanism, J. Glaciol., 32, 101–119, 1986.
Iken, A. and Truffe, M.: The relationship between subglacial water pressure and velocity of Findelengletscher, Switzerland, during its advance and retreat, J. Glaciol., 43, 328–338, 1997.
Iken, A., Röthlisberger, H., Flotron, A., and Haeberli, W.: The uplift of Unteraargletscher at the beginning of the melt season – a consequence of water storage at the bed?, J. Glaciol., 29, 28–47, 1983.
Joughin, I., Das, S. B., Flowers, G. E., Behn, M. D., Alley, R. B., King, M. A., Smith, B. E., Bamber, J. L., van den Broeke, M. R., and van Angelen, J. H.: Influence of ice-sheet geometry and supraglacial lakes on seasonal ice-flow variability, The Cryosphere, 7, 1185–1192, https://doi.org/10.5194/tc-7-1185-2013, 2013.
Kääb, A., Lefauconnier, B., and Melvold, K.: Flow field of Kronebreen, Svalbard, using repeated Landsat 7 and ASTER data, Ann. Glaciol., 42, 7–13, 2005.
Kamb, B.: Glacier surge mechanism based on linked cavity configuration of the basal water conduit system, J. Geophys. Res.-Sol. Ea., 92, 9083–9100, 1987.
Kehrl, L. M., Hawley, R. L., Powell, R. D., and Brigham-Grette, J.: Glacimarine sedimentation processes at Kronebreen and Kongsvegen, Svalbard, J. Glaciol., 57, 841–847, 2011.
König, M., Kohler, J., and Nuth, C.: Glacier area outlines–Svalbard [Data set], Norwegian Polar Institute, https://doi.org/10.21334/npolar.2013.89f430f8, 2013.
Korona, J., Berthier, E., Bernard, M., Rémy, F., and Thouvenot, E.: SPIRIT. SPOT 5 stereoscopic survey of polar ice: reference images and topographies during the fourth International Polar Year (2007–2009), ISPRS J. Photogramm., 64, 204–212, 2009.
Koziol, C., Arnold, N., Pope, A., and Colgan, W.: Quantifying supraglacial meltwater pathways in the Paakitsoq region, West Greenland, J. Glaciol., 63, 464–476, 2017.
Koziol, C. P. and Arnold, N.: Modelling seasonal meltwater forcing of the velocity of land-terminating margins of the Greenland Ice Sheet, The Cryosphere, 12, 971–991, https://doi.org/10.5194/tc-12-971-2018, 2018.
Lefauconnier, B.: Fluctuations glaciaires dans le Kongsfjord, bai du Roi, 79 N, Spitsbergen, analyses et conseqences (Glacier fluctuations in Kongsfjorden, 79 N, Spitsbergen, analyses and consequences), Unpublished thesis, Universite de Grenoble, 1987.
Lefauconnier, B., Hagen, J. O., and Rudant, J. P.: Flow speed and calving rate of Kongsbreen glacier, Svalbard, using SPOT images, Polar Res., 13, 59–65, 1994a.
Lefauconnier, B., Hagen, J. O., Pinglot, J. F., and Pourchet, M.: Mass-balance estimates on the glacier complex Kongsvegen and Sveabreen, Spitsbergen, Svalbard, using radioactive layers, J. Glaciol., 40, 368–376, 1994b.
Liestøl, O.: The glaciers in the Kongsfjorden area, Spitsbergen, Norsk Geogr. Tidsskr., 42, 231–238, 1988.
Lindbäck, K., Kohler, J., Pettersson, R., Nuth, C., Langley, K., Messerli, A., Vallot, D., Matsuoka, K., and Brandt, O.: Subglacial topography, ice thickness, and bathymetry of Kongsfjorden, northwestern Svalbard, Earth Syst. Sci. Data, 10, 1769–1781, https://doi.org/10.5194/essd-10-1769-2018, 2018a.
Lliboutry, L.: General theory of subglacial cavitation and sliding of temperate glaciers, J. Glaciol., 7, 21–58, 1968.
Mair, D., Nienow, P., Willis, I., and Sharp, M.: Spatial patterns of glacier motion during a high-velocity event: Haut Glacier d'Arolla, Switzerland, J. Glaciol., 47, 9–20, 2001.
Meierbachtol, T., Harper, J., and Humphrey, N.: Basal drainage system response to increasing surface melt on the Greenland ice sheet, Science, 341, 777–779, 2013.
Melvold, K. and Hagen, J. O.: Evolution of a surge-type glacier in its quiescent phase: Kongsvegen, Spitsbergen, 1964–95, J. Glaciol., 44, 394–404, 1998.
Milner, A. M., Khamis, K., Battin, T. J., Brittain, J. E., Barrand, N. E., Füreder, L., Cauvy-Fraunié, S., Gíslason, G. M., Jacobsen, D., and Hannah, D. M.: Glacier shrinkage driving global changes in downstream systems, P. Natl. Acade. Sci., 114, 9770–9778, 2017.
Moon, T., Joughin, I., Smith, B., Van Den Broeke, M. R., Van De Berg, W. J., Noël, B., and Usher, M.: Distinct patterns of seasonal Greenland glacier velocity, Geophys. Res. Lett., 41, 7209–7216, 2014.
Nienow, P., Sharp, M., and Willis, I.: Seasonal changes in the morphology of the subglacial drainage system, Haut Glacier d'Arolla, Switzerland, Earth Surf. Proc. Landf., 23, 825–843, 1998.
Nuth, C., Schuler, T. V., Kohler, J., Altena, B., and Hagen, J. O.: Estimating the long-term calving flux of Kronebreen, Svalbard, from geodetic elevation changes and mass-balance modeling, J. Glaciol., 58, 119–133, 2012.
Nuth, C., Gilbert, A., Köhler, A., McNabb, R., Schellenberger, T., Sevestre, H., Weidle, C., Girod, L., Luckman, A., and Kääb, A.: Dynamic vulnerability revealed in the collapse of an Arctic tidewater glacier, Sci. Rep., 9, 1–13, 2019.
Pfeffer, W. T., Meier, M. F., and Illangasekare, T. H.: Retention of Greenland runoff by refreezing: implications for projected future sea level change, J. Geophys. Res.-Oceans, 96, 22117–22124, 1991.
Pimentel, S. and Flowers, G. E.: A numerical study of hydrologically driven glacier dynamics and subglacial flooding, P. Roy. Soc. A-Math. Phy., 467, 537–558, 2011.
Poinar, K., Joughin, I., Lilien, D., Brucker, L., Kehrl, L., and Nowicki, S.: Drainage of Southeast Greenland firn aquifer water through crevasses to the bed, Front. Earth Sci., 5, 5, https://doi.org/10.3389/feart.2017.00005, 2017.
Poinar, K., Dow, C. F., and Andrews, L. C.: Long-Term Support of an Active Subglacial Hydrologic System in Southeast Greenland by Firn Aquifers, Geophys. Res. Lett., 46, 4772–4781, 2019.
Pörtner, H., Roberts, D., Masson-Delmotte, V., Zhai, P., Tignor, M., Poloczanska, E., Mintenbeck, K., Nicolai, M., Okem, A., and Petzold, J.: IPCC Special Report on the Ocean and Cryosphere in a Changing Climate, IPCC, 2019.
Röthlisberger, H.: Water pressure in intra-and subglacial channels, J. Glaciol., 11, 177–203, 1972.
Schellenberger, T., Dunse, T., Kääb, A., Kohler, J., and Reijmer, C. H.: Surface speed and frontal ablation of Kronebreen and Kongsbreen, NW Svalbard, from SAR offset tracking, The Cryosphere, 9, 2339–2355, https://doi.org/10.5194/tc-9-2339-2015, 2015.
Schild, K. M., Hawley, R. L., and Morriss, B. F.: Subglacial hydrology at Rink Isbræ, West Greenland inferred from sediment plume appearance, Ann. Glaciol., 57, 118–127, 2016.
Scholzen, C.: Model output supporting “Sensitivity of subglacial drainage to water supply distribution at the Kongsfjord basin, Svalbard” [Data set], Zenodo, https://doi.org/10.5281/zenodo.4680908, 2021.
Schoof, C.: Ice-sheet acceleration driven by melt supply variability, Nature, 468, 803–806, 2010.
Schwanghart, W. and Scherler, D.: Short Communication: TopoToolbox 2 – MATLAB-based software for topographic analysis and modeling in Earth surface sciences, Earth Surf. Dynam., 2, 1–7, https://doi.org/10.5194/esurf-2-1-2014, 2014.
Sevestre, H., Benn, D. I., Hulton, N. R., and Bælum, K.: Thermal structure of Svalbard glaciers and implications for thermal switch models of glacier surging, J. Geophys. Res.-Earth Surf., 120, 2220–2236, 2015.
Slater, D., Nienow, P., Sole, A., Cowton, T., Mottram, R., Langen, P., and Mair, D.: Spatially distributed runoff at the grounding line of a large Greenlandic tidewater glacier inferred from plume modelling, J. Glaciol., 63, 309–323, 2017.
Sole, A. J., Mair, D. W. F., Nienow, P. W., Bartholomew, I., King, M., Burke, M. J., and Joughin, I.: Seasonal speedup of a Greenland marine-terminating outlet glacier forced by surface melt–induced changes in subglacial hydrology, J. Geophys. Res.-Earth Surf., 116, F03014, https://doi.org/10.1029/2010JF001948, 2011.
Sugiyama, S. and Gudmundsson, G. H.: Short-term variations in glacier flow controlled by subglacial water pressure at Lauteraargletscher, Bernese Alps, Switzerland, J. Glaciol., 50, 353–362, 2004.
Sund, M., Eiken, T., and Rolstad Denby, C.: Velocity structure, front position changes and calving of the tidewater glacier Kronebreen, Svalbard, The Cryosphere Discuss., 5, 41–73, https://doi.org/10.5194/tcd-5-41-2011, 2011.
Sundal, A. V., Shepherd, A., Nienow, P., Hanna, E., Palmer, S., and Huybrechts, P.: Melt-induced speed-up of Greenland ice sheet offset by efficient subglacial drainage, Nature, 469, 521–524, 2011.
Svendsen, H., Beszczynska-Møller, A., Hagen, J. O., Lefauconnier, B., Tverberg, V., Gerland, S., Børre Ørbæk, J., Bischof, K., Papucci, C., and Zajaczkowski, M.: The physical environment of Kongsfjorden–Krossfjorden, an Arctic fjord system in Svalbard, Polar Res., 21, 133–166, 2002.
Trusel, L. D., Powell, R., Cumpston, R., and Brigham-Grette, J.: Modern glacimarine processes and potential future behaviour of Kronebreen and Kongsvegen polythermal tidewater glaciers, Kongsfjorden, Svalbard, Geol. Soc. Sp., 344, 89–102, 2010.
Vallot, D., Pettersson, R., Luckman, A., Benn, D. I., Zwinger, T., Van Pelt, W. J., Kohler, J., Schäfer, M., Claremar, B., and Hulton, N. R.: Basal dynamics of Kronebreen, a fast-flowing tidewater glacier in Svalbard: non-local spatio-temporal response to water input, J. Glaciol., 63, 1012–1024, 2017.
van der Veen, C. J.: Fracture propagation as means of rapidly transferring surface meltwater to the base of glaciers, Geophys. Res. Lett., 34, L01501, https://doi.org/10.1029/2006GL028385, 2007.
Van Pelt, W. and Kohler, J.: Modelling the long-term mass balance and firn evolution of glaciers around Kongsfjorden, Svalbard, J. Glaciol., 61, 731–744, 2015.
van Pelt, W., Pohjola, V., Pettersson, R., Marchenko, S., Kohler, J., Luks, B., Hagen, J. O., Schuler, T. V., Dunse, T., Noël, B., and Reijmer, C.: A long-term dataset of climatic mass balance, snow conditions, and runoff in Svalbard (1957–2018), The Cryosphere, 13, 2259–2280, https://doi.org/10.5194/tc-13-2259-2019, 2019.
Van Pelt, W. J., Pohjola, V. A., and Reijmer, C. H.: The changing impact of snow conditions and refreezing on the mass balance of an idealized Svalbard glacier, Front. Earth Science, 4, 102, https://doi.org/10.3389/feart.2016.00102, 2016.
Vincent, W. F., Callaghan, T. V., Dahl-Jensen, D., Johansson, M., Kovacs, K. M., Michel, C., Prowse, T., Reist, J. D., and Sharp, M.: Ecological implications of changes in the Arctic cryosphere, Ambio, 40, 87–99, 2011.
Walder, J. S. and Fowler, A.: Channelized subglacial drainage over a deformable bed, J. Glaciol., 40, 3–15, 1994.
Werder, M. A., Schuler, T. V., and Funk, M.: Short term variations of tracer transit speed on alpine glaciers, The Cryosphere, 4, 381–396, https://doi.org/10.5194/tc-4-381-2010, 2010.
Werder, M. A., Hewitt, I. J., Schoof, C. G., and Flowers, G. E.: Modeling channelized and distributed subglacial drainage in two dimensions, J. Geophys. Res.-Earth Surf., 118, 2140–2158, 2013.
Wouters, B., Gardner, A. S., and Moholdt, G.: Global glacier mass loss during the GRACE satellite mission (2002–2016), Front. Earth Sci., 7, 96, https://doi.org/10.3389/feart.2019.00096, 2019.
Wyatt, F. R. and Sharp, M. J.: Linking surface hydrology to flow regimes and patterns of velocity variability on Devon Ice Cap, Nunavut, J. Glaciol., 61, 387–399, 2015.
Zwally, H. J., Abdalati, W., Herring, T., Larson, K., Saba, J., and Steffen, K.: Surface melt-induced acceleration of Greenland ice-sheet flow, Science, 297, 218–222, 2002.