the Creative Commons Attribution 4.0 License.
the Creative Commons Attribution 4.0 License.
 | 15 Jun 2021
Brief communication: Do 1.0, 1.5, or 2.0 °C matter for the future evolution of Alpine glaciers?
Sarah Eggs
Matthias Huss
Harry Zekollari
Daniel Farinotti
With the Paris Agreement, the urgency of limiting ongoing anthropogenic climate change has been recognised. More recent discussions have focused on the difference of limiting the increase in global average temperatures below 1.0, 1.5, or 2.0 ∘C compared to preindustrial levels. Here, we assess the impacts that such different scenarios would have on both the future evolution of glaciers in the European Alps and the water resources they provide. Our results show that even half-degree differences in global temperature targets have important implications for the changes predicted until 2100, and that – for the most optimistic scenarios – glaciers might start to partially recover, owing to possibly decreasing temperatures after the end of the 21st century.
- Article
(1423 KB) - Full-text XML
-
Supplement
(8847 KB) - BibTeX
- EndNote


Climate change is one of the largest challenges that society will face during this century. There is overwhelming consensus that limiting the increase of global average temperatures below a certain threshold is essential if adverse effects are to be avoided. Put forward in 2015 and adopted by 196 parties, the Paris Agreement concurred that such a threshold is “well below 2 ∘C above preindustrial levels”, and that efforts should be pursued to “limit the temperature increase to 1.5 ∘C” (UN, 2015). Even under these ambitious climate targets, important environmental changes, such as changes in water availability, migration of species, or glacier loss, are expected to occur. The Special Report on Global Warming of 1.5 ∘C (IPCC, 2018), for example, focused on the effects that would result if the 1.5 ∘C target was to be met and highlighted that, even under such conditions, important and mostly negative changes would occur. A mere 5 years after the Paris Agreement, there is compelling evidence that any reduction in anthropogenic climate change will pay off in the longer term, both from an ecological (IPBES, 2019) and economical (WEF, 2020) perspective. Discussions in preparation for the renewed pledges by signatory parties have, thus, focused on the differences between scenarios close to the original targets. For the upcoming 26th United Nations Climate Change Conference of the Parties, for example, emphasis is put on separating the impacts occurring under scenarios of 1.0, 1.5, and 2.0 ∘C of warming above preindustrial levels. In this brief communication, we focus on the differing impacts that such scenarios would have on glaciers and related water resources in the European Alps. Across the world, glaciers are amongst the most prominent indicators of climatic change, providing visual evidence for climatic changes occurring over decades. Previous work estimated that every kilogram of additionally emitted CO2 would result in a long-term global glacier mass loss of ca. 16 kg (Marzeion et al., 2018) – with important implications for the corresponding landscapes, downstream ecosystems, and water supplies (IPCC, 2018, 2019). While future projections for the glacier evolution of the European Alps already exist under different representative concentration pathways (RCPs) (e.g. Zekollari et al., 2019; Marzeion et al., 2020), targeted information on policy-relevant climate targets, such as the difference between 1.5 and 2.0 ∘C, is not readily available. Here we analyse glacier evolution under low global warming scenarios by re-running the mass balance ice flow model, GloGEMflow (Huss and Hock, 2015; Zekollari et al., 2019), with updated climate projections from the sixth phase of the Coupled Model Intercomparison Project (CMIP6). In particular, we focus on Shared Socioeconomic Pathways (SSPs) that would result in global mean temperature changes of +1.0, +1.5, and +2.0 ∘C by 2100 compared to preindustrial conditions (1850–1900) and provide projections for both future glacier geometries and glacier runoff until the end of the century. In an explorative analysis, we also consider projections until the year 2300, albeit acknowledging that large uncertainties exist when doing so.
We simulate the evolution of all 3927 glaciers in the Alps independently based on (i) outlines provided by the Randolph Glacier Inventory version 6 (RGI 6.0) (RGI Consortium, 2017) and (ii) the consensus ice thickness estimate (Farinotti et al., 2019).
Glacier evolution is modelled with the combined mass balance ice flow model GloGEMflow (Huss and Hock, 2015; Zekollari et al., 2019), a model that showed robust performance in recent model intercomparison projects (e.g. Marzeion et al., 2020). Accumulation is computed based on precipitation and temperature, with a linear transition between solid and liquid precipitation occurring for temperatures between 0.5 and 2.5 ∘C. Ablation is calculated with a temperature index model (Hock, 2003), and refreezing is determined based on heat conduction. The mass balance module runs at a monthly resolution, including a parameterisation for day-to-day temperature variability. It is calibrated to reproduce glacier-specific geodetic volume changes (Zemp et al., 2019) spanning approximatively the period 1959–2013 and covering 57 % of the Alpine glacier area. For more details on the mass balance module and its calibration, refer to Huss and Hock (2015).
For all glaciers with a >1 km length in RGI 6.0 (i.e. 795 glaciers accounting for 95 % of the Alpine glacier volume), we compute ice flow based on the shallow ice approximation. The computations follow Zekollari et al. (2019), including the iterative initialisation procedure used to generate a transient glacier geometry for the RGI inventory year (i.e. 2003 for the majority of Alpine glaciers). For all glaciers with a < 1 km length, glacier evolution is modelled with an elevation-dependent parameterisation that has shown to be in good agreement with higher order ice flow modelling results (Huss et al., 2010). For more information on GloGEMflow's glacier evolution modelling, please refer to Zekollari et al. (2019).
For each glacier, water runoff is calculated at a monthly resolution by summing rain and melt (from ice, snow, and firn) and by subtracting refreezing. Throughout the simulations, runoff is computed for the area comprised within the RGI 6.0 outlines, implying that, after glacier retreat, runoff contributions from rain and snow melt are still accounted for (in line with Huss and Hock, 2018).
For the past (1950–2020), GloGEMflow is forced with monthly 2 m air temperature and precipitation taken from the ensemble daily gridded observational data set (E-OBS v.21.0) at 0.1∘ (11 km) horizontal resolution (Cornes et al., 2018). For the future (2020–2100), we rely on 128 CMIP6 global circulation model (GCM) members. We use direct GCM output since CMIP6 GCM results have not yet been downscaled by regional climate models and since the spatial resolution of the climate data was recently shown to only marginally affect model results if suitable model calibration at the glacier-specific scale is performed (Compagno et al., 2021). Consistence between past and future climate is ensured by applying the de-biasing procedure proposed by Huss and Hock (2015). In a nutshell, the procedure uses a set of additive and multiplicative correction factors to adjust both the long-term mean and the long-term variability in the coarse resolution GCMs (100 km) to the level of the high-resolution E-OBS data (see Huss and Hock, 2015, for more details).
To evaluate model performance, we compare modelled mass balances with observations provided by the World Glacier Monitoring Service (WGMS, 2020) for 72 glaciers in the European Alps. For glacier-wide annual mass balance, we find a bias of 0.07 m water equivalent (w.e. a−1), a root mean square error (RMSE) of 1.07 m w.e. a−1, and a squared correlation coefficient (r2) of 0.29 (see Fig. S1 in the Supplement). Observations aggregated to elevation bands yield a bias of −0.01 m w.e. a−1, a RMSE of 1.47 m w.e. a−1, and a r2 of 0.52. For glacier-wide winter balance, a bias of 0.20 m w.e. a−1, a RMSE of 0.74 m w.e. a−1, and a r2 of 0.26 is found (see Fig. S2). Although correlation coefficients are rather low, the small biases provide confidence in the regional results, which neither indicate overestimation nor underestimation. The latter is also confirmed by the comparison of the total glacier volume change in Switzerland (comprising almost 60 % of the Alpine glacier volume at present) during the period 2000–2020. Our modelled loss is of 24.9 km3, which is very close to the observation-based estimate of 23.6 km3 (Grab et al., 2021). Similarly, the modelled rate of glacier area loss (1.4 % per annum for the period 2003–2016) is in very good agreement with the rate of 1.3 % per annum, which was derived by Paul et al. (2020) using Landsat images.
Finally, for our main analysis, we only select those GCM members that yield a 21st century global warming of +1.0, +1.5, and +2.0 ∘C compared to the preindustrial levels. The selected members correspond to SSPs that assume low emissions, i.e. SSP119, SSP126, and SSP245, and are used to force GloGEMflow for the period 2020–2100. This selection is performed by computing the mean global 2 m air temperature change over both the land and ocean between the period 2071–2100 and preindustrial (1850–1900) levels and by selecting members that are within a given range of temperature increase, namely +1 ± 0.25 ∘C (three model members), +1.5 ± 0.25 ∘C (11 model members), and +2 ± 0.25 ∘C (14 model members). To determine the corresponding warming in the European Alps (see Figs. 1 and S3), we extract all GCM grid cells that are within latitudes of 42.5–49.5∘N, longitudes of 4–16∘E, and at elevations above 500 m.
The GCMs selected within the three temperature change targets (i.e. +1.0, +1.5, and +2.0 ∘C) show a global mean warming between 1850–1900 and 2071–2100 of +1.00 ± 0.11, +1.49 ± 0.17, and +2.07 ± 0.18 ∘C. For the European Alps, this corresponds to a temperature change of +0.98 ± 0.56, +1.80 ± 0.72, and +2.51 ± 0.73 ∘C, respectively (Fig. 1a). During the summer months (June–August; JJA), the temperature increase in the Alps for the two warmer climate targets is even stronger, and is of 0.96 ± 0.88, 2.09 ± 1.24, and 2.81 ± 1.23 ∘C, respectively. These differences agree well with previous assessments (Vautard et al., 2014) and are attributed to stronger warming over land than over the ocean, to enhanced warming at high latitudes compared to low latitudes, and to amplified warming at higher elevations (Vautard et al., 2014). For a global warming of +1.0, +1.5, and +2 ∘C, global-scale annual precipitation sums for 2071–2100 are projected to increase by 18 ± 8, 29 ± 9, and 42 ± 10 mm a−1, respectively, up from 1141 mm a−1 in the preindustrial baseline (Fig. 1b). For the Alps, the annual precipitation increase is anticipated to be 37 ± 94, 29 ± 135, and 46 ± 145 mm a−1, respectively (the preindustrial baseline is 1210 mm a−1), with slightly higher precipitation changes over the winter season.
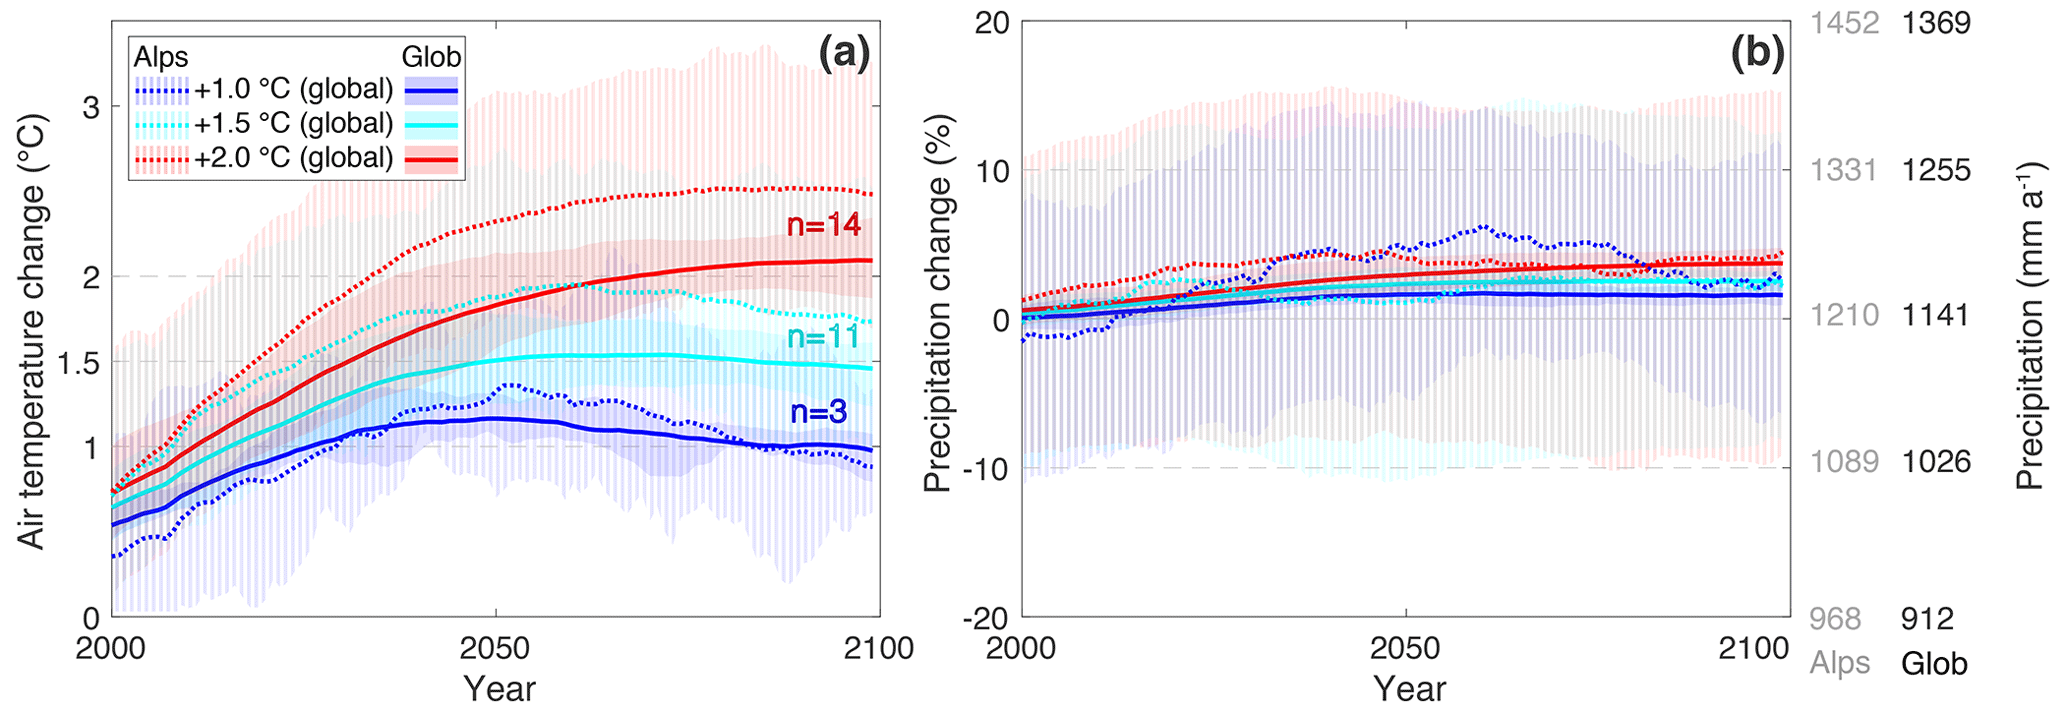
Figure 1Evolution of annual global and Alpine (a) average air temperature and (b) precipitation total compared to the preindustrial (1850–1900) baseline. Series are smoothed with a 30-year running mean. The coloured bands show the standard deviation of the projection given by individual GCM members. n is the considered number of GCM members.
In all three considered warming scenarios, glaciers will be drastically affected. By 2100, glaciers in the European Alps are projected to lose 44 ± 21 % (+1.0 ∘C), 68 ± 12 % (+1.5 ∘C), and 81 ± 8 % (+2.0 ∘C) of their 2020 ice volume (see Fig. 2a). The evolution of the glacier area will be on par (Fig. 2b). By 2100, Alpine glaciers are projected to lose 47 ± 16 % (+1.0 ∘C), 65 ± 10 % (+1.5 ∘C), and 77 ± 8 % (+2.0 ∘C) of their 2020 area (Fig. 2b). Note that, for the +1.0 ∘C temperature target, the projected volume and area losses are only slightly higher than the committed loss, i.e. the loss obtained by assuming the climatic conditions to stabilise at the 1988–2017 levels. Indeed, Zekollari et al. (2019) estimated such a committed loss to be of 37 ± 6 % for glacier volume and 35 ± 7 % for the glacier area.
Figure 3a–c show the regional distribution of the modelled glacier evolution. By 2100, only 1484 ± 324 (+1.0 ∘C), 1033 ± 253 (+1.5 ∘C), and 724 ± 201 (+2.0 ∘C) of today's roughly 4000 glaciers are anticipated to remain, i.e. to have a volume > 0 by then. In the three scenarios, Grosser Aletschgletscher (Fig. 3d), the largest glacier of the Alps, might lose as much as 45 ± 12 %, 64 ± 11 %, and 77 ± 6 % of its 2020 volume, respectively. Rhonegletscher (Fig. 3e), one of the most studied and visited glaciers, is projected to lose 55 ± 24 %, 78 ± 11 %, and 91 ± 7 % of its volume in the same time span, while values for other glaciers are found in Table S1 in the Supplement. Our results confirm that global warming can be significantly amplified at the regional scale and that glaciers in the European Alps sensitively respond to even small levels of global atmospheric warming, such as a global air temperature change of +1.0 ∘C. Most importantly, however, is that our results show significant differences between the future glacier evolution projected for the three warming scenarios, indicating that any effort to further limit warming will have important effects on glaciers and, thus, the Alpine environment.
Future effects notably include the water availability from presently glacierised areas. Our results indicate that, on a yearly basis, glacier runoff for the period 2080–2100 might decrease by as much as 25 ± 6 % (+1.0 ∘C), 32 ± 8 % (+1.5 ∘C), and 36 ± 10 % (+2.0 ∘C) compared to 2000–2020 levels (Fig. 2c). The decrease follows above-average glacier melt during the last decades and indicates that peak glacier discharge already occurred in the past for many glaciers in the European Alps (consistent with the findings of, for example, Huss and Hock, 2018). Our model results also show a transition in the timing of the maximum glacier discharge during the year; while it historically occurred in August (2000–2020), it is expected to occur in July (+1.0 and +1.5 ∘C scenarios) or even June–July (+2.0 ∘C) by 2080–2100 (Fig. 2d). Finally, our simulations project the 2080–2100 August runoff to be 36 ± 15 % (+1.0 ∘C), 44 ± 14 % (+1.5 ∘C), and 55 ± 15 % (+2.0 ∘C) lower on average than it was in 2000–2020. This shift in the magnitude and timing of glacier runoff (i) is similar to what projected in earlier studies (e.g. Huss and Hock, 2018), (ii) is a direct consequence of both the reduced glacier volumes (which cause the annual runoff to decrease) and the increased temperature (which causes snowmelt and ice melt to occur earlier in the year), and (iii) will have important consequences for water availability (Huss and Hock, 2018), particularly during the dry summer months. For the densely populated European Alps and the areas downstream, such changes will not only impact ecosystems but also a number of water users, including agriculture or hydropower operators for instance (Beniston et al., 2018).
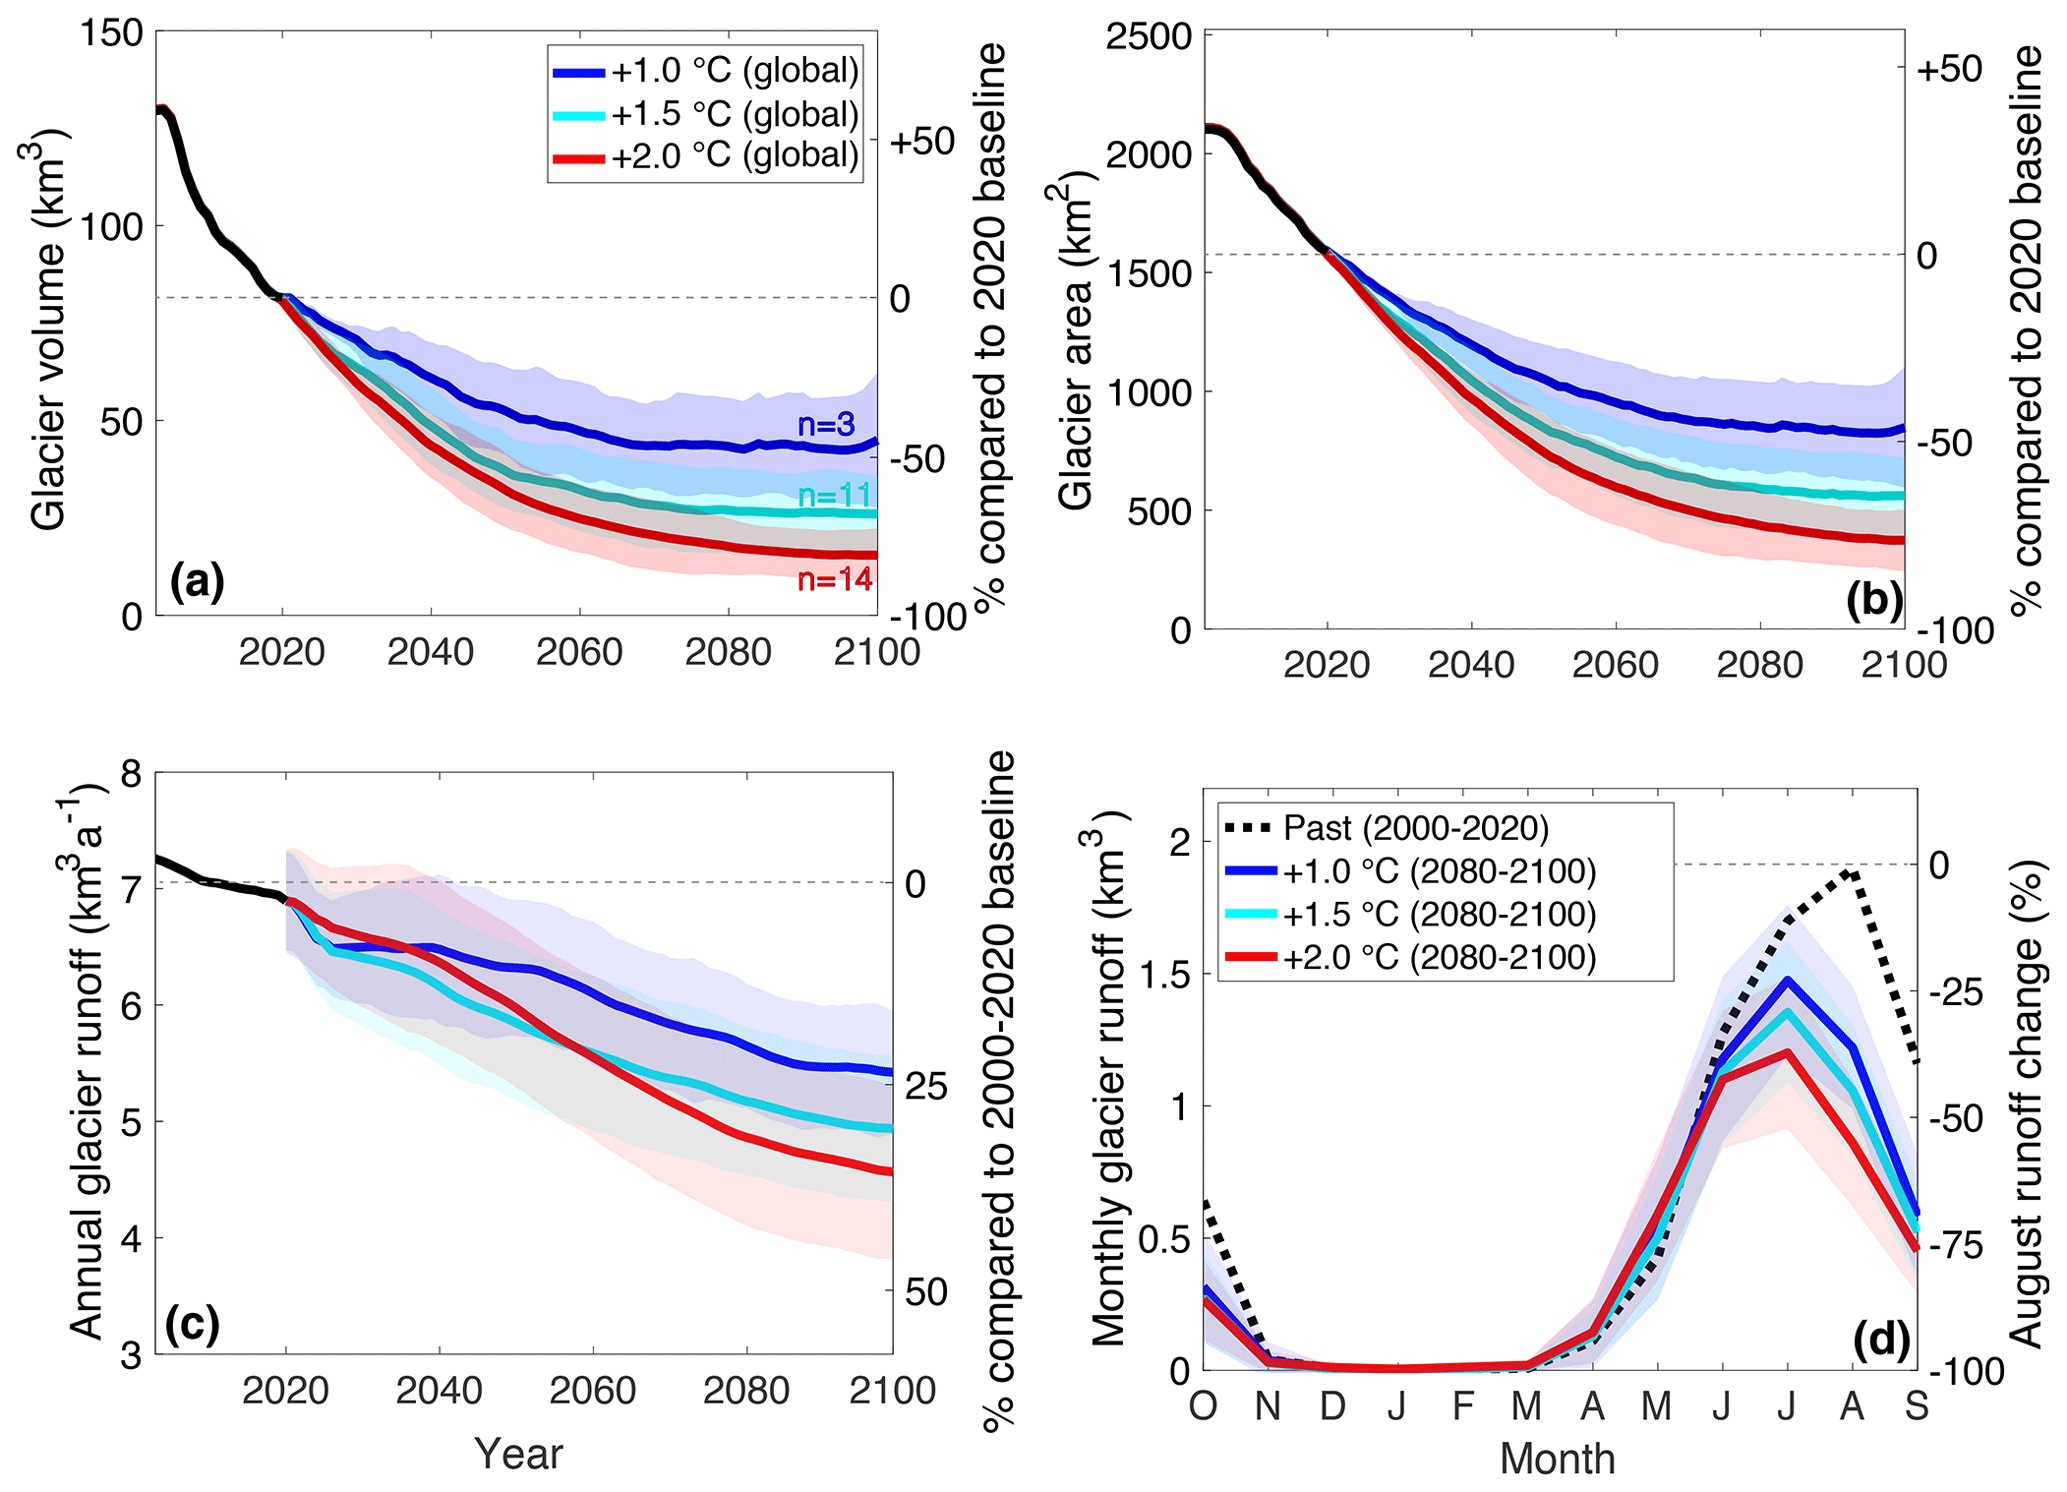
Figure 2Modelled evolution of total glacier (a) volume, (b) area, (c) annual runoff, and (d) monthly runoff. The total refers to all glaciers of the European Alps. The time series in panel (c) are smoothed with a 30-year running mean. In all panels, the thick line represents the mean, and the transparent band corresponds to 1 standard deviation of the results obtained by forcing GloGEMflow with the selected GCM members. The number of GCM members is given (n) in panel (a).
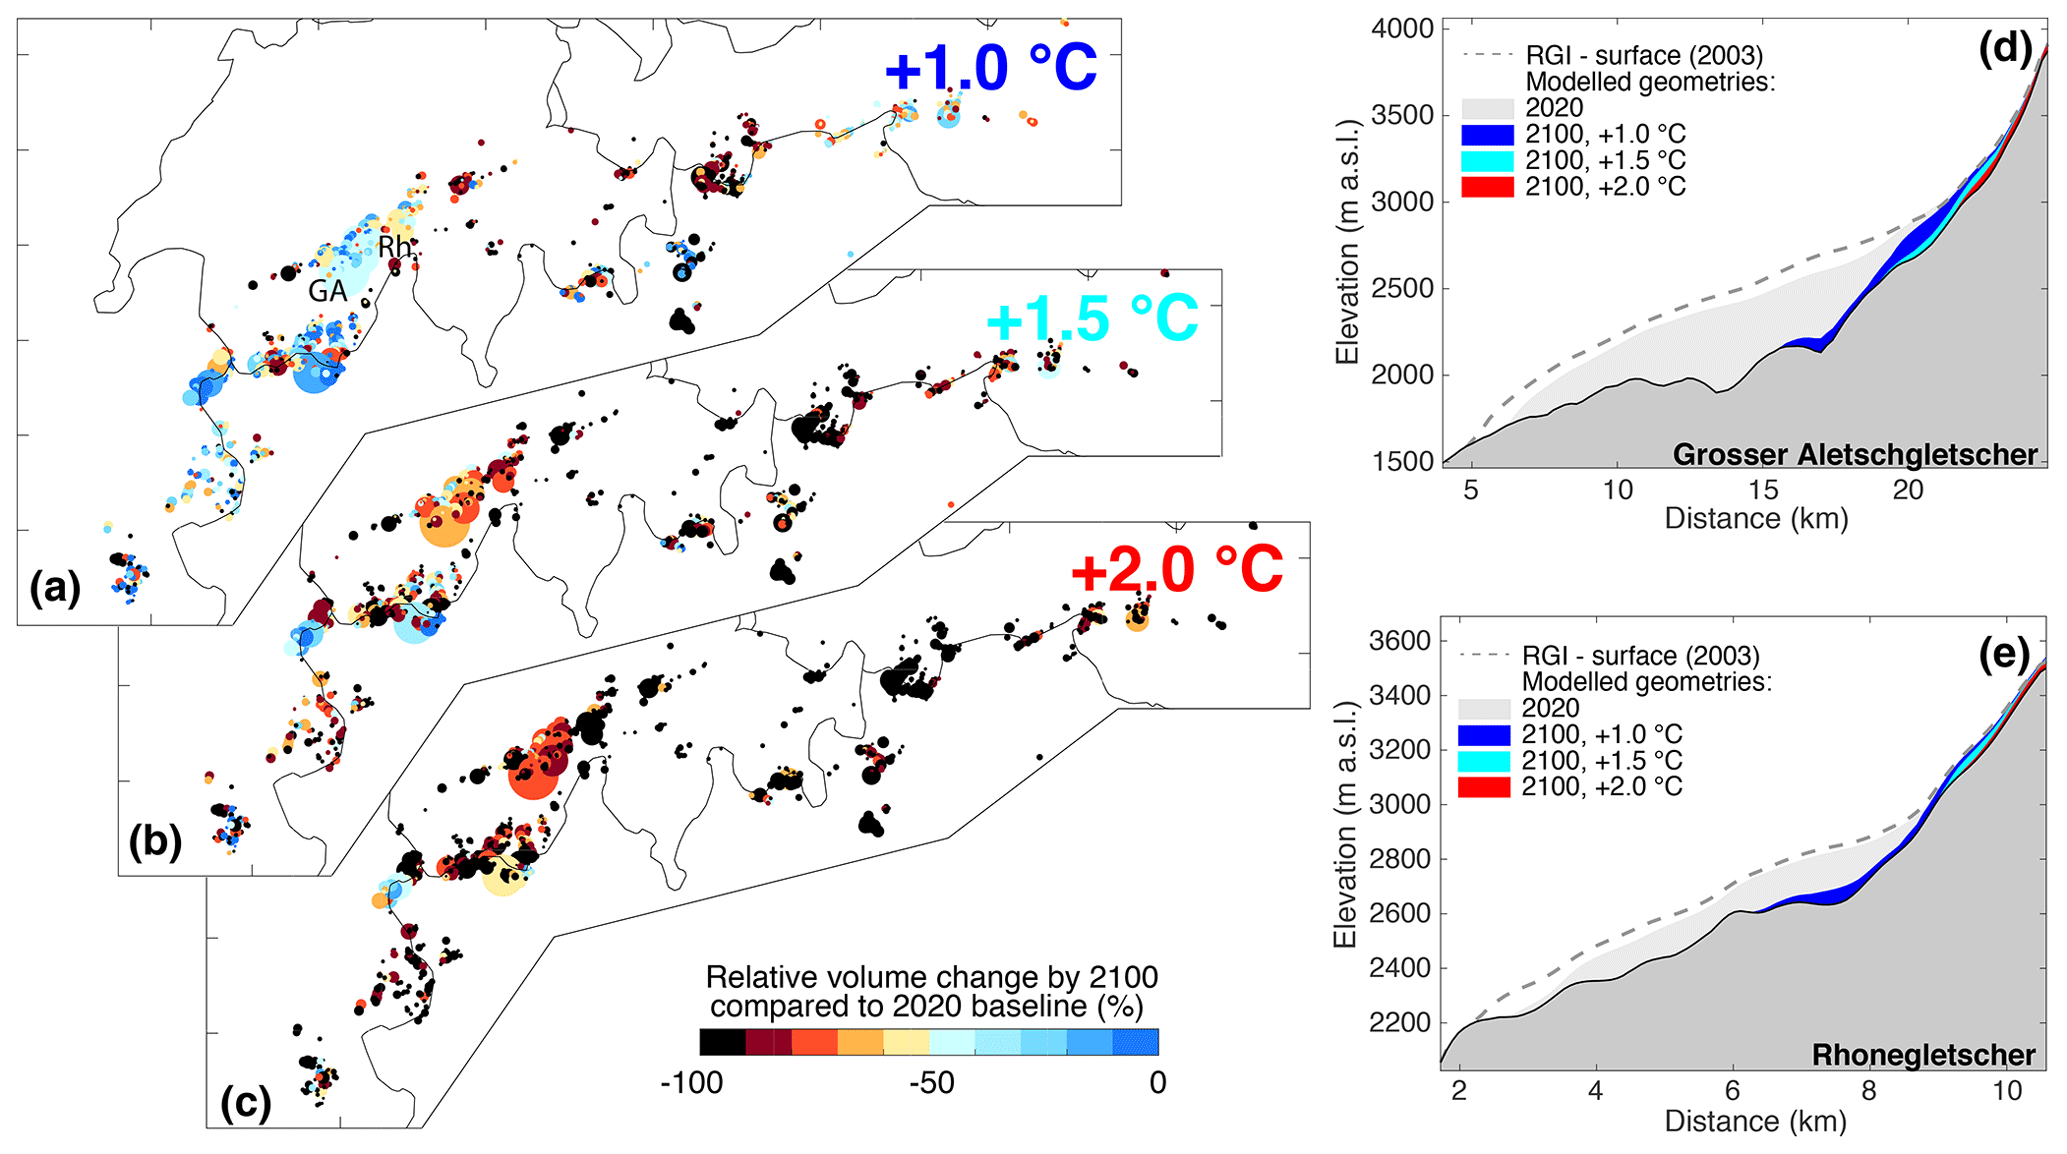
Figure 3Relative change in glacier volume between 2020 and 2100 for scenarios of (a) +1.0 ∘C, (b) +1.5 ∘C, and (c) +2.0 ∘C of the global temperature increase. Each dot represents one glacier, with the dot's size being proportional to the glacier area as given by the Randolph Glacier Inventory. The labels “GA” and “Rh” identify the “Grosser Aletschgletscher” and “Rhonegletscher”, respectively. The modelled geometries of these two glaciers are shown in panels (d) and (e) at the inventory date (dashed) for the year 2020 (grey) and for the year 2100 under the three selected scenarios (colours).
In line with the bulk of the literature, the above results all refer to the time horizon until 2100. To gain insights into glacier evolution beyond this horizon, we run GloGEMflow with three GCM members that provide climate data until 2300 and that project mean global temperature changes below +2.0 ∘C for 2300 (see Fig. S3). Note that one of these GCM members was already considered in the simulations until 2100, whilst the remaining two were not because they show a warming beyond +2.0 ∘C for 2100 (Fig. S3). The three members all come from SSP126 but stem from three different GCMs (see Fig. S3).
These results show that, owing to slow lowering of air temperatures and enhanced precipitation implied by this particular scenario after 2100, slow glacier recovery might happen (Fig. S3). While glacier volume losses of 80 %–85 % are calculated for 2100, the experiment projects that Alpine glaciers will regain a part of this volume, reaching a total volume between 28 % and 53 % of the 2020 level by 2300. Although this result is only based on three GCM members and is, thus, very uncertain, it suggests that considering projections beyond 2100 might change the current perception of a possibly irreversible glacier loss. From the physical point of view, the result that glaciers might regrow after a potential cooling of global temperatures is not surprising. Still, increasing the number of GCM members that consider such longer-term horizons and having different research groups performing similar analyses would help in verifying the robustness of this preliminary finding. We also stress that decisive climate action would be required for steering global temperatures towards such an evolution (i.e. SSP126).
While there is overwhelming consensus that decisive action has to be taken to limit the unwanted consequences of ongoing climatic change (UN, 2015; IPCC, 2018; IPBES, 2019; IPCC, 2019; WEF, 2020), the debate around which temperature targets to pursue is all but settled. In this contribution, we quantified the impact that a global temperature change of +1.0, +1.5, or +2.0 ∘C compared to preindustrial levels would have on glaciers of the European Alps. We show that this would correspond to an Alpine warming slightly above global levels and to a moderate increase in precipitation. Under such conditions, Alpine glaciers are projected to lose 44 ± 21 %, 68 ± 12 %, and 81 ± 8 % of their 2020 ice volume by 2100, indicating that, even in the most moderate scenario (+1.0 ∘C), about half of the present-day glacier volume will be lost by the end of the century. Preliminary results based on a strong mitigation scenario (SSP126) and running until 2300 indicate that slow recovery might happen after that, emphasising the interest in considering projections that reach beyond the 21st century. The changes in glacier volume will strongly impact the water yield from the presently glacierised surface, with 2080–2100 annual average runoff decreasing by 25 ± 6 % (for a global warming of +1.0 ∘C), 32 ± 8 %, (+1.5 ∘C), and 36 ± 10 % (+2.0 ∘C) compared to 2000–2020 levels. Changes in monthly runoff – with a runoff peak projected to occur 1 to 2 months earlier by the end of the century – will be even more pronounced, with August peak runoff reductions of 36 ± 15 %, 44 ± 14 %, and 55 ± 15 %, respectively. For glacierised catchments and the areas downstream, these changes in water availability can be expected to have important consequences, ranging from the functioning of ecosystems to the generation of hydroelectricity. Even if our preliminary results based on a strong mitigation scenario indicate that slow glacier recovery might happen after the 21st century, we hope that the presented results will contribute in making the point that, when it comes to global climate, every half-degree counts.
Code and data are available upon request.
The supplement related to this article is available online at: https://doi.org/10.5194/tc-15-2593-2021-supplement.
DF, LC, and SE conceived the study. LC and SE performed the numerical modelling, with support from MH, HZ, and DF. The original code was developed by MH (mass balance component) and HZ (ice flow component). SE retrieved, homogenised and analysed all CMIP6 GCMs, with the support of LC, MH, and DF. LC and DF wrote the paper and produced the figures, with contributions from all other co-authors.
The authors declare that they have no conflict of interest.
We thank the RGI consortium for the global glacier inventory data. We acknowledge the European Climate Assessment and Dataset (ECA&D), for the E-OBS data set, and CMIP for the GCM outputs. We also thank the World Glacier Monitoring Service (WGMS) for providing mass balance and length change measurements.
This research has been supported by the Swiss National Science Foundation (grant no. 184634) and the H2020 Marie Skłodowska-Curie Actions (grant no. 799904).
This paper was edited by Olivier Gagliardini and reviewed by Nicolas Champollion and one anonymous referee.
Beniston, M., Farinotti, D., Stoffel, M., Andreassen, L. M., Coppola, E., Eckert, N., Fantini, A., Giacona, F., Hauck, C., Huss, M., Huwald, H., Lehning, M., López-Moreno, J.-I., Magnusson, J., Marty, C., Morán-Tejéda, E., Morin, S., Naaim, M., Provenzale, A., Rabatel, A., Six, D., Stötter, J., Strasser, U., Terzago, S., and Vincent, C.: The European mountain cryosphere: a review of its current state, trends, and future challenges, The Cryosphere, 12, 759–794, https://doi.org/10.5194/tc-12-759-2018, 2018. a
Compagno, L., Zekollari, H., Huss, M., and Farinotti, D.: Limited impact of climate forcing products on future glacier evolution in Scandinavia and Iceland, J. Glaciol., 1–17, https://doi.org/10.1017/jog.2021.24, online first, 2021. a
Cornes, R. C., van der Schrier, G., van den Besselaar, E. J. M., and Jones, P. D.: An ensemble version of the E-OBS temperature and precipitation data sets, J. Geophys. Res.-Atmos., 123, 9391–9409, https://doi.org/10.1029/2017JD028200, 2018. a
Farinotti, D., Huss, M., Fürst, J. J., Landmann, J., Machguth, H., Maussion, F., and Pandit, A.: A consensus estimate for the ice thickness distribution of all glaciers on Earth, Nat. Geosci., 12, 168–173, https://doi.org/10.1038/s41561-019-0300-3, 2019. a
Grab, M., Mattea, E., Bauder, A., Huss, M., Rabenstein, L., Hodel, E., Linsbauer A., Langhammer, L., Schmid, L., Church, G., Hellmann, S., Délèze, K., Schaer, P., Lathion, P., Farinotti, D., and Maurer, H.: Ice thickness distribution of all Swiss glaciers based on extended ground-penetrating radar data and glaciological modeling. J. Glaciol., 1–19, https://doi.org/10.1017/jog.2021.55, online first, 2021. a
Hock, R.: Temperature index melt modelling in mountain areas, J. Hydrol., 282, 104–115, https://doi.org/10.1016/S0022-1694(03)00257-9, 2003. a
Huss, M. and Hock, R.: A new model for global glacier change and sea-level rise, Front. Earth Sci., 3, 54, https://doi.org/10.3389/feart.2015.00054, 2015. a, b, c, d, e
Huss, M. and Hock, R.: Global-scale hydrological response to future glacier mass loss, Nat. Clim. Change, 8, 135–140, https://doi.org/10.1038/s41558-017-0049-x, 2018. a, b, c, d
Huss, M., Jouvet, G., Farinotti, D., and Bauder, A.: Future high-mountain hydrology: a new parameterization of glacier retreat, Hydrol. Earth Syst. Sci., 14, 815–829, https://doi.org/10.5194/hess-14-815-2010, 2010. a
IPBES: Global assessment report on biodiversity and ecosystem services of the Intergovernmental Science-Policy Platform on Biodiversity and Ecosystem Services, edited by: Brondizio, E. S., Settele, J., Díaz, S., and Ngo, H. T., IPBES secretariat, Bonn, Germany, available at: https://www.ipcc.ch/srocc/download/ (last access: 15 January 2021), 2019. a, b
IPCC: Global Warming of 1.5∘C, An IPCC Special Report on the impacts of global warming of 1.5∘C above pre-industrial levels and related global greenhouse gas emission pathways, in the context of strengthening the global response to the threat of climate change, sustainable development, and efforts to eradicate poverty, edited by: Masson-Delmotte, V., Zhai, P., Pörtner, H.-O., Roberts, C., Skea, J., Shukla, P. R., Pirani, A., Moufouma-Okia, W., Péan, C., Pidcock, R., Connors, S., Matthews, J. B. R., Chen, Y., Zhou, X., Gomis, M. I., Lonnoy, E., Maycock, T., Tignor, M., and Waterfield, T., Cambridge University Press, available at: https://www.ipcc.ch/sr15/download/ (last access: 15 January 2021), 2018. a, b, c
IPCC: IPCC Special Report on the Ocean and Cryosphere in a Changing Climate, edited by: Pörtner, H.-O., Roberts, D. C., Masson-Delmotte, V., Zhai, P., Tignor, M., Poloczanska, E., Mintenbeck, K., Alegría, A., Nicolai, M., Okem, A., Petzold, J., Rama, B., and Weyer, N. M., 2019. a, b
Marzeion, B., Kaser, G., Maussion, F., and Champollion, N.: Limited influence of climate change mitigation on short-term glacier mass loss, Nat. Clim. Change, 8, 305–308, https://doi.org/10.1038/s41558-018-0093-1, 2018. a
Marzeion, B., Hock, R., Anderson, B., Bliss, A., Champollion, N., Fujita, K., Huss, M., Immerzeel, W. W., Kraaijenbrink, P., Malles, J., Maussion, F., Radić, V., Rounce, D. R., Sakai, A., Shannon, S., Wal, R., and Zekollari, H.: Partitioning the Uncertainty of Ensemble Projections of Global Glacier Mass Change, Earth's Future, 8, https://doi.org/10.1029/2019EF001470, 2020. a, b
Paul, F., Rastner, P., Azzoni, R. S., Diolaiuti, G., Fugazza, D., Le Bris, R., Nemec, J., Rabatel, A., Ramusovic, M., Schwaizer, G., and Smiraglia, C.: Glacier shrinkage in the Alps continues unabated as revealed by a new glacier inventory from Sentinel-2, Earth Syst. Sci. Data, 12, 1805–1821, https://doi.org/10.5194/essd-12-1805-2020, 2020. a
RGI Consortium: Randolph Glacier Inventory 6.0, https://doi.org/10.7265/N5-RGI-60, 2017. a
UN: United nations Paris agreement, United nations framework convention on climate change, Rio de Janeiro, Brazil, and New York, United States, available at: https://unfccc.int/sites/default/files/english_paris_agreement.pdf (last access: 15 January 2021), 2015. a, b
Vautard, R., Gobiet, A., Sobolowski, S., Kjellström, E., Stegehuis, A., Watkiss, P., Mendlik, T., Landgren, O., Nikulin, G., Teichmann, C., and Jacob, D.: The European climate under a 2∘C global warming, Environ. Res. Lett., 9, 034006, https://doi.org/10.1088/1748-9326/9/3/034006, 2014. a, b
WEF: The Global Risks Report 2020, 15th Edn., Tech. rep., World economic forum, Cologny/Geneva, Switzerland, available at: http://www3.weforum.org/docs/WEF_Global_Risk_Report_2020.pdf (last access: 15 January 2021), 2020. a, b
WGMS: Fluctuations of glaciers database, World Glacier Monitoring Service (WGMS), Zurich, Switzerland, https://doi.org/10.5904/wgms-fog-2020-08, 2020. a
Zekollari, H., Huss, M., and Farinotti, D.: Modelling the future evolution of glaciers in the European Alps under the EURO-CORDEX RCM ensemble, The Cryosphere, 13, 1125–1146, https://doi.org/10.5194/tc-13-1125-2019, 2019. a, b, c, d, e, f
Zemp, M., Huss, M., Thibert, E., Eckert, N., McNabb, R., Huber, J., Barandun, M., Machguth, H., Nussbaumer, S. U., Gartner-Roer, I., Thomson, L., Paul, F., Maussion, F., Kutuzov, S., and Cogley, J. G.: Global glacier mass changes and their contributions to sea-level rise from 1961 to 2016, Nature, 568, 382–386, https://doi.org/10.1038/s41586-019-1071-0, 2019. a