the Creative Commons Attribution 4.0 License.
the Creative Commons Attribution 4.0 License.
 | 01 Apr 2021
Heterogeneous CO2 and CH4 content of glacial meltwater from the Greenland Ice Sheet and implications for subglacial carbon processes
Andrea J. Pain
Jonathan B. Martin
Ellen E. Martin
Åsa K. Rennermalm
Shaily Rahman
Accelerated melting of the Greenland Ice Sheet has increased freshwater delivery to the Arctic Ocean and amplified the need to understand the impact of Greenland Ice Sheet meltwater on Arctic greenhouse gas budgets. We evaluate subglacial discharge from the Greenland Ice Sheet for carbon dioxide (CO2) and methane (CH4) concentrations and δ13C values and use geochemical models to evaluate subglacial CH4 and CO2 sources and sinks. We compare discharge from southwest (a sub-catchment of the Isunnguata Glacier, sub-Isunnguata, and the Russell Glacier) and southern Greenland (Kiattut Sermiat). Meltwater CH4 concentrations vary by orders of magnitude between sites and are saturated with respect to atmospheric concentrations at Kiattut Sermiat. In contrast, meltwaters from southwest sites are supersaturated, even though oxidation reduces CH4 concentrations by up to 50 % during periods of low discharge. CO2 concentrations range from supersaturated at sub-Isunnguata to undersaturated at Kiattut Sermiat. CO2 is consumed by mineral weathering throughout the melt season at all sites; however, differences in the magnitude of subglacial CO2 sources result in meltwaters that are either sources or sinks of atmospheric CO2. At the sub-Isunnguata site, the predominant source of CO2 is organic matter (OM) remineralization. However, multiple or heterogeneous subglacial CO2 sources maintain atmospheric CO2 concentrations at Russell but not at Kiattut Sermiat, where CO2 is undersaturated. These results highlight a previously unrecognized degree of heterogeneity in greenhouse gas dynamics under the Greenland Ice Sheet. Future work should constrain the extent and controls of heterogeneity to improve our understanding of the impact of Greenland Ice Sheet melt on Arctic greenhouse gas budgets, as well as the role of continental ice sheets in greenhouse gas variations over glacial–interglacial timescales.
- Article
(7818 KB) - Full-text XML
-
Supplement
(8021 KB) - BibTeX
- EndNote


Glaciers play an important role in global chemical cycles due to the production of fine-grained sediments that participate in carbonate and silicate mineral weathering reactions (Table 1), which are the principal sink of atmospheric CO2 over geologic timescales (Berner et al., 1983; Walker et al., 1981). Variations in the weathering intensity of comminuted sediments may contribute to glacial–interglacial atmospheric CO2 variations as sediments are alternately covered by ice and exposed following ice retreat. However, the importance of CO2 consumption by mineral weathering is poorly understood, including effects from the advance and retreat of continental ice sheets (Ludwig et al., 1999). Recent evaluations of carbon budgets in proglacial environments indicate that mineral weathering results in net sequestration of atmospheric CO2, suggesting that proglacial systems are underrecognized as Arctic CO2 sinks (St Pierre et al., 2019); however, alternate processes could lead to the production of greenhouse gases in glacial systems. For instance, CH4 production in anaerobic subglacial environments driven by the remineralization of organic matter (OM) contained in soils and forests covered during glacial margin fluctuations has been suggested as a potential carbon feedback to drive warming (Sharp et al., 1999; Wadham et al., 2008). Because the global warming potential of CH4 is 25 times greater than CO2, even limited subglacial methanogenesis has the potential to strongly impact the greenhouse gas composition of glacial meltwater. Combined inorganic and organic subglacial processes may therefore produce glacial meltwater that is a source or sink of greenhouse gas. While the net impact of these processes on modern carbon fluxes is poorly constrained, determining these impacts will improve modern carbon budgets as well as depictions of how fluxes may have evolved during the advance and retreat of continental ice sheets.
Table 1Mineral weathering reactions and impacts on dissolved CO2 concentrations.
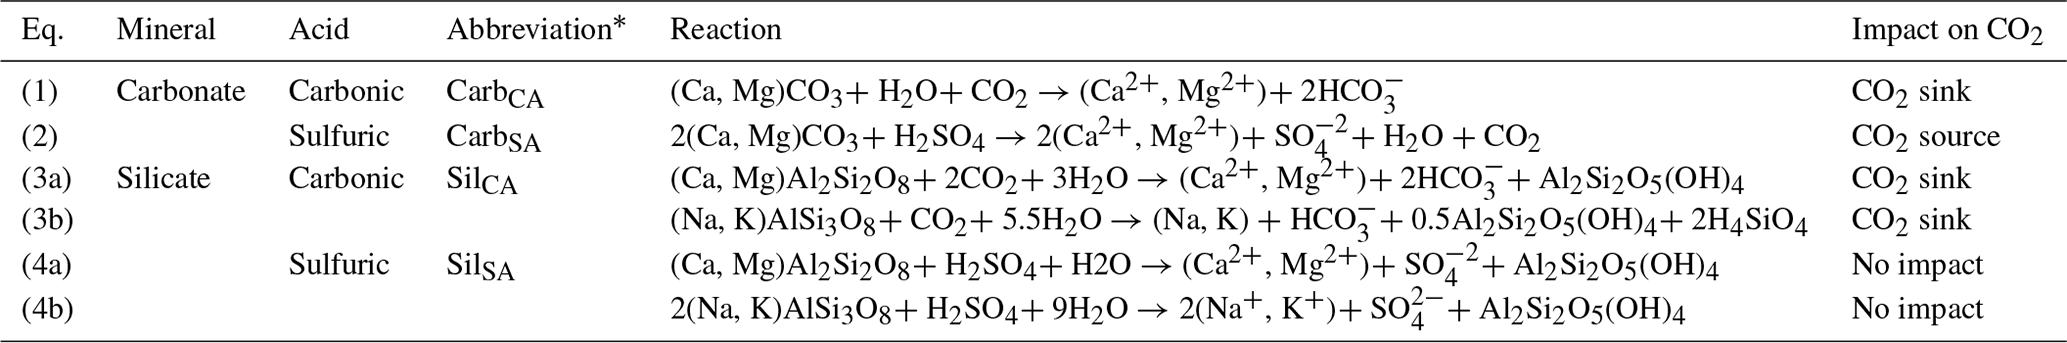
* Abbreviations are based first on the mineral class (carbonate: carb; silicate: sil) and then on the acid (carbonic acid: CA; sulfuric acid: SA).
In subglacial environments where remineralization is limited by low OM availability, the major element solute load of glacial meltwater is typically dominated by products of mineral weathering reactions (Tranter, 2005). The extent of mineral weathering in subglacial environments depends in part on the availability of acids to drive reactions, namely sulfuric and carbonic acids (Table 1). Sulfuric acid is derived from the oxidation of reduced sulfur species, which largely occur as iron sulfide minerals including pyrite (Tranter, 2005). Sulfide oxidation may occur abiotically; however, the kinetics of microbially mediated sulfide oxidation is several orders of magnitude faster and may lead to local depletion of oxygen given a sufficient supply of sulfide minerals (Sharp et al., 1999). In contrast, carbonic acid may be derived from multiple external or in situ sources of CO2 to the system. The dominant external source is supraglacial meltwater that flows to the subglacial system through moulins following equilibration with atmospheric CO2 (Fig. 1). Unlike proglacial environments where free exchange between water and the atmosphere may resupply CO2 consumed by weathering, subglacial environments may be partially or fully isolated from the atmosphere, limiting further atmospheric CO2 invasion and thus the extent of mineral weathering with carbonic acid. However, additional atmospheric CO2 may be delivered in open portions of the subglacial environment though exchange in fractures or moulins along subglacial flow paths or in partially air filled conduits, allowing a much greater magnitude of carbonic acid mineral weathering (Graly et al., 2017). CO2 may also be derived from in situ sources, such as gaseous CO2 contained in ice bubbles of basal ice or fluid inclusions in rocks that release volatiles (including CO2) following mechanical grinding (Macdonald et al., 2018). When OM is available, its remineralization also generates CO2 (and potentially CH4) along with nutrients, but low OM availability in many subglacial systems limits remineralization as a CO2 source (Fig. 1).
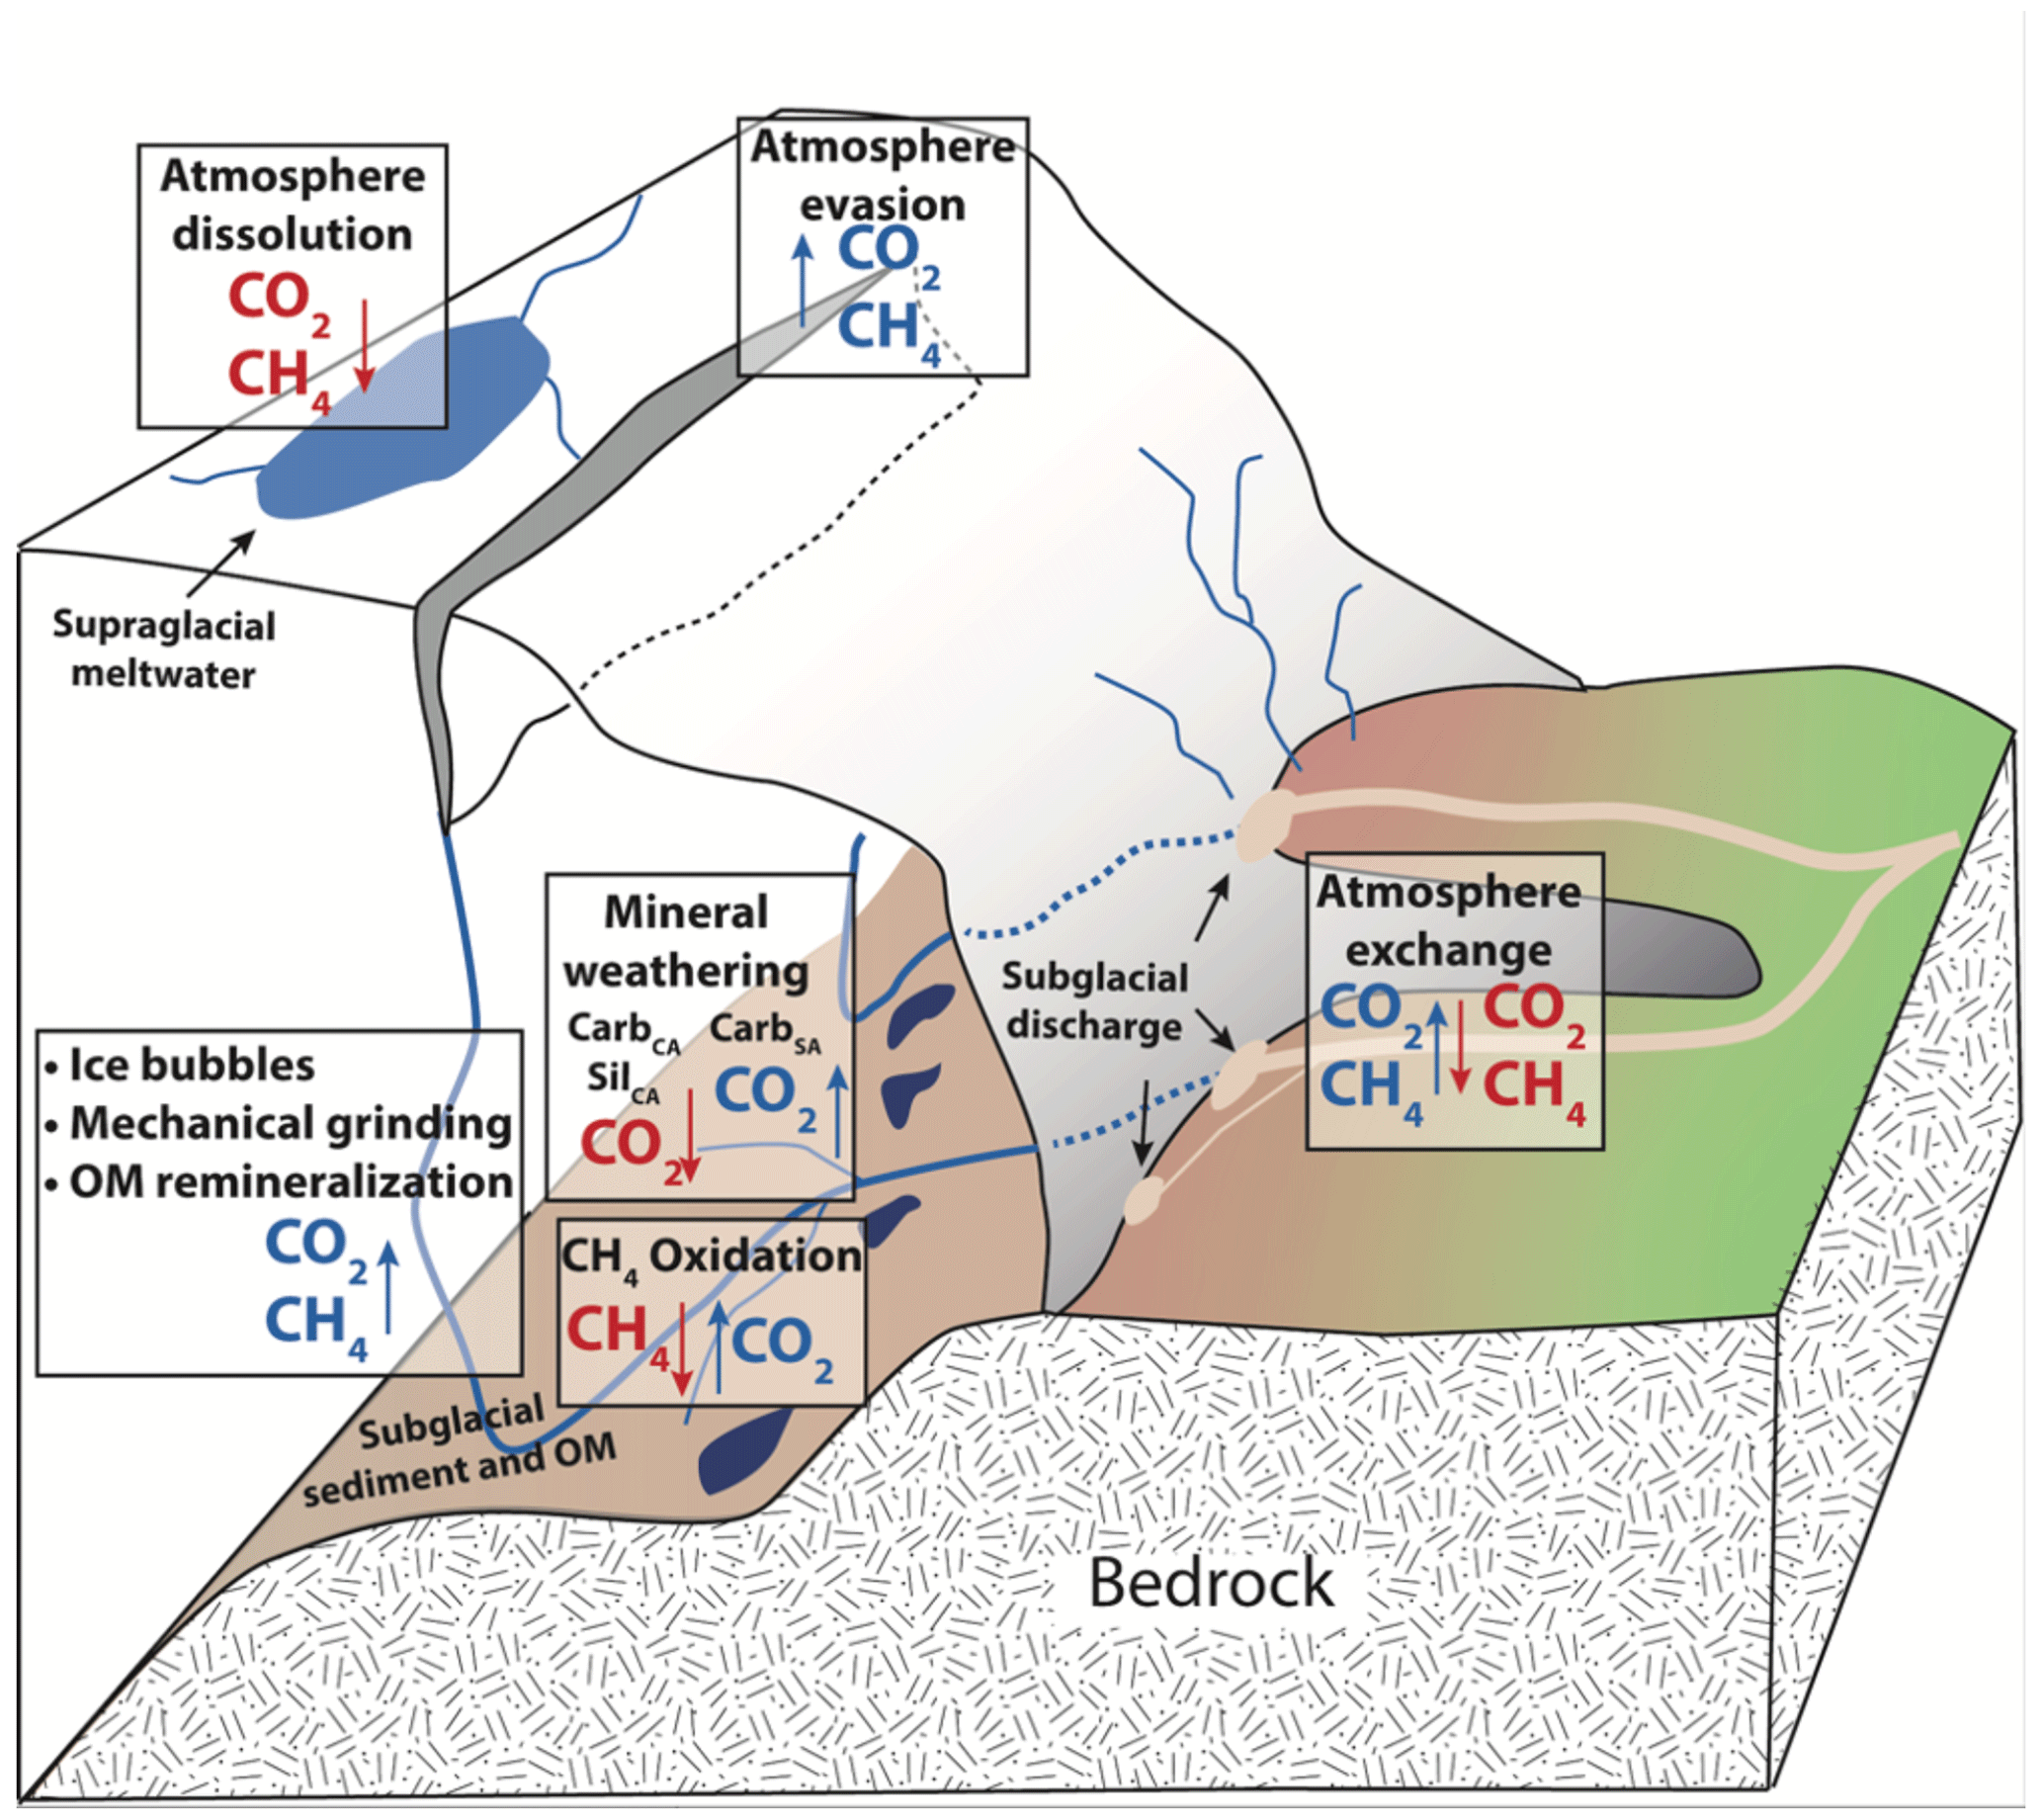
Figure 1Conceptual diagram of subglacial sources and sinks of CO2 and CH4. Arrows indicate the direction of fluxes. Boxes represent processes, and sources of gases to subglacial meltwaters are indicated by blue text, while sinks of gases to subglacial meltwater are indicated by red text. Gas bubbles, mechanical grinding, and OM remineralization are grouped because all are CO2 and CH4 sources.
The role of subglacial carbon processes may play an increasingly important role in modern Arctic carbon budgets as disproportionate warming increases glacial meltwater and sediment fluxes to the ocean, particularly from the Greenland Ice Sheet (Wadham et al., 2019). The is the last remaining ice sheet in the Northern Hemisphere following collapse of other ice sheets since the Last Glacial Maximum (∼ 20 ka). It has been losing mass at increasing rates that averaged 286 ± 20 Gt/yr between 2010–2018, representing a 6-fold increase since the 1980s (Mouginot et al., 2019). While mineral weathering significantly modifies the chemical composition of Greenland Ice Sheet subglacial discharge (e.g., Hindshaw et al., 2014; Deuerling et al., 2018; Urra et al., 2019) and should consume CO2 similar to other glacial and proglacial environments, the recent identification of microbially driven reactions (including methanogenesis) in subglacial environments of the Greenland Ice Sheet indicates that organic processes may also play a role (Dieser et al., 2014; Lamarche-Gagnon et al., 2019). The relative importance of subglacial greenhouse gas sinks (CO2 consumption through mineral weathering) and sources (such as OM remineralization) determines the greenhouse gas composition of subglacial discharge, which may then serve as a source or a sink of atmospheric greenhouse gases. Constraining the relative impacts and variability of these processes underneath the Greenland Ice Sheet will provide important information regarding the current and future impact of Greenland Ice Sheet loss on Arctic carbon budgets, as well the role of continental ice sheets on carbon cycle feedbacks.
To evaluate the net impact of carbon processes on the greenhouse gas composition of subglacial discharge of the Greenland Ice Sheet, we compare water chemistry, dissolved CO2 and CH4 concentrations, and gas stable isotopic compositions between three subglacial discharge sites draining land-terminating glaciers of the Greenland Ice Sheet over the melt seasons of 2017 and 2018 (Fig. 2). We employ mass balance models utilizing the concentrations of major cations and anions to determine the magnitude of the impact on CO2 concentrations from mineral weathering reactions (Table 1). These results are combined with measured gas concentrations and δ13C to determine the relative importance of mineral weathering compared to OM remineralization on the CH4 and CO2 content of subglacial discharge. We also assess the temporal and spatial variability of these processes under the Greenland Ice Sheet to improve our understanding of carbon cycling in Greenland subglacial environments and the implications of Greenland Ice Sheet mass loss on Arctic carbon budgets.
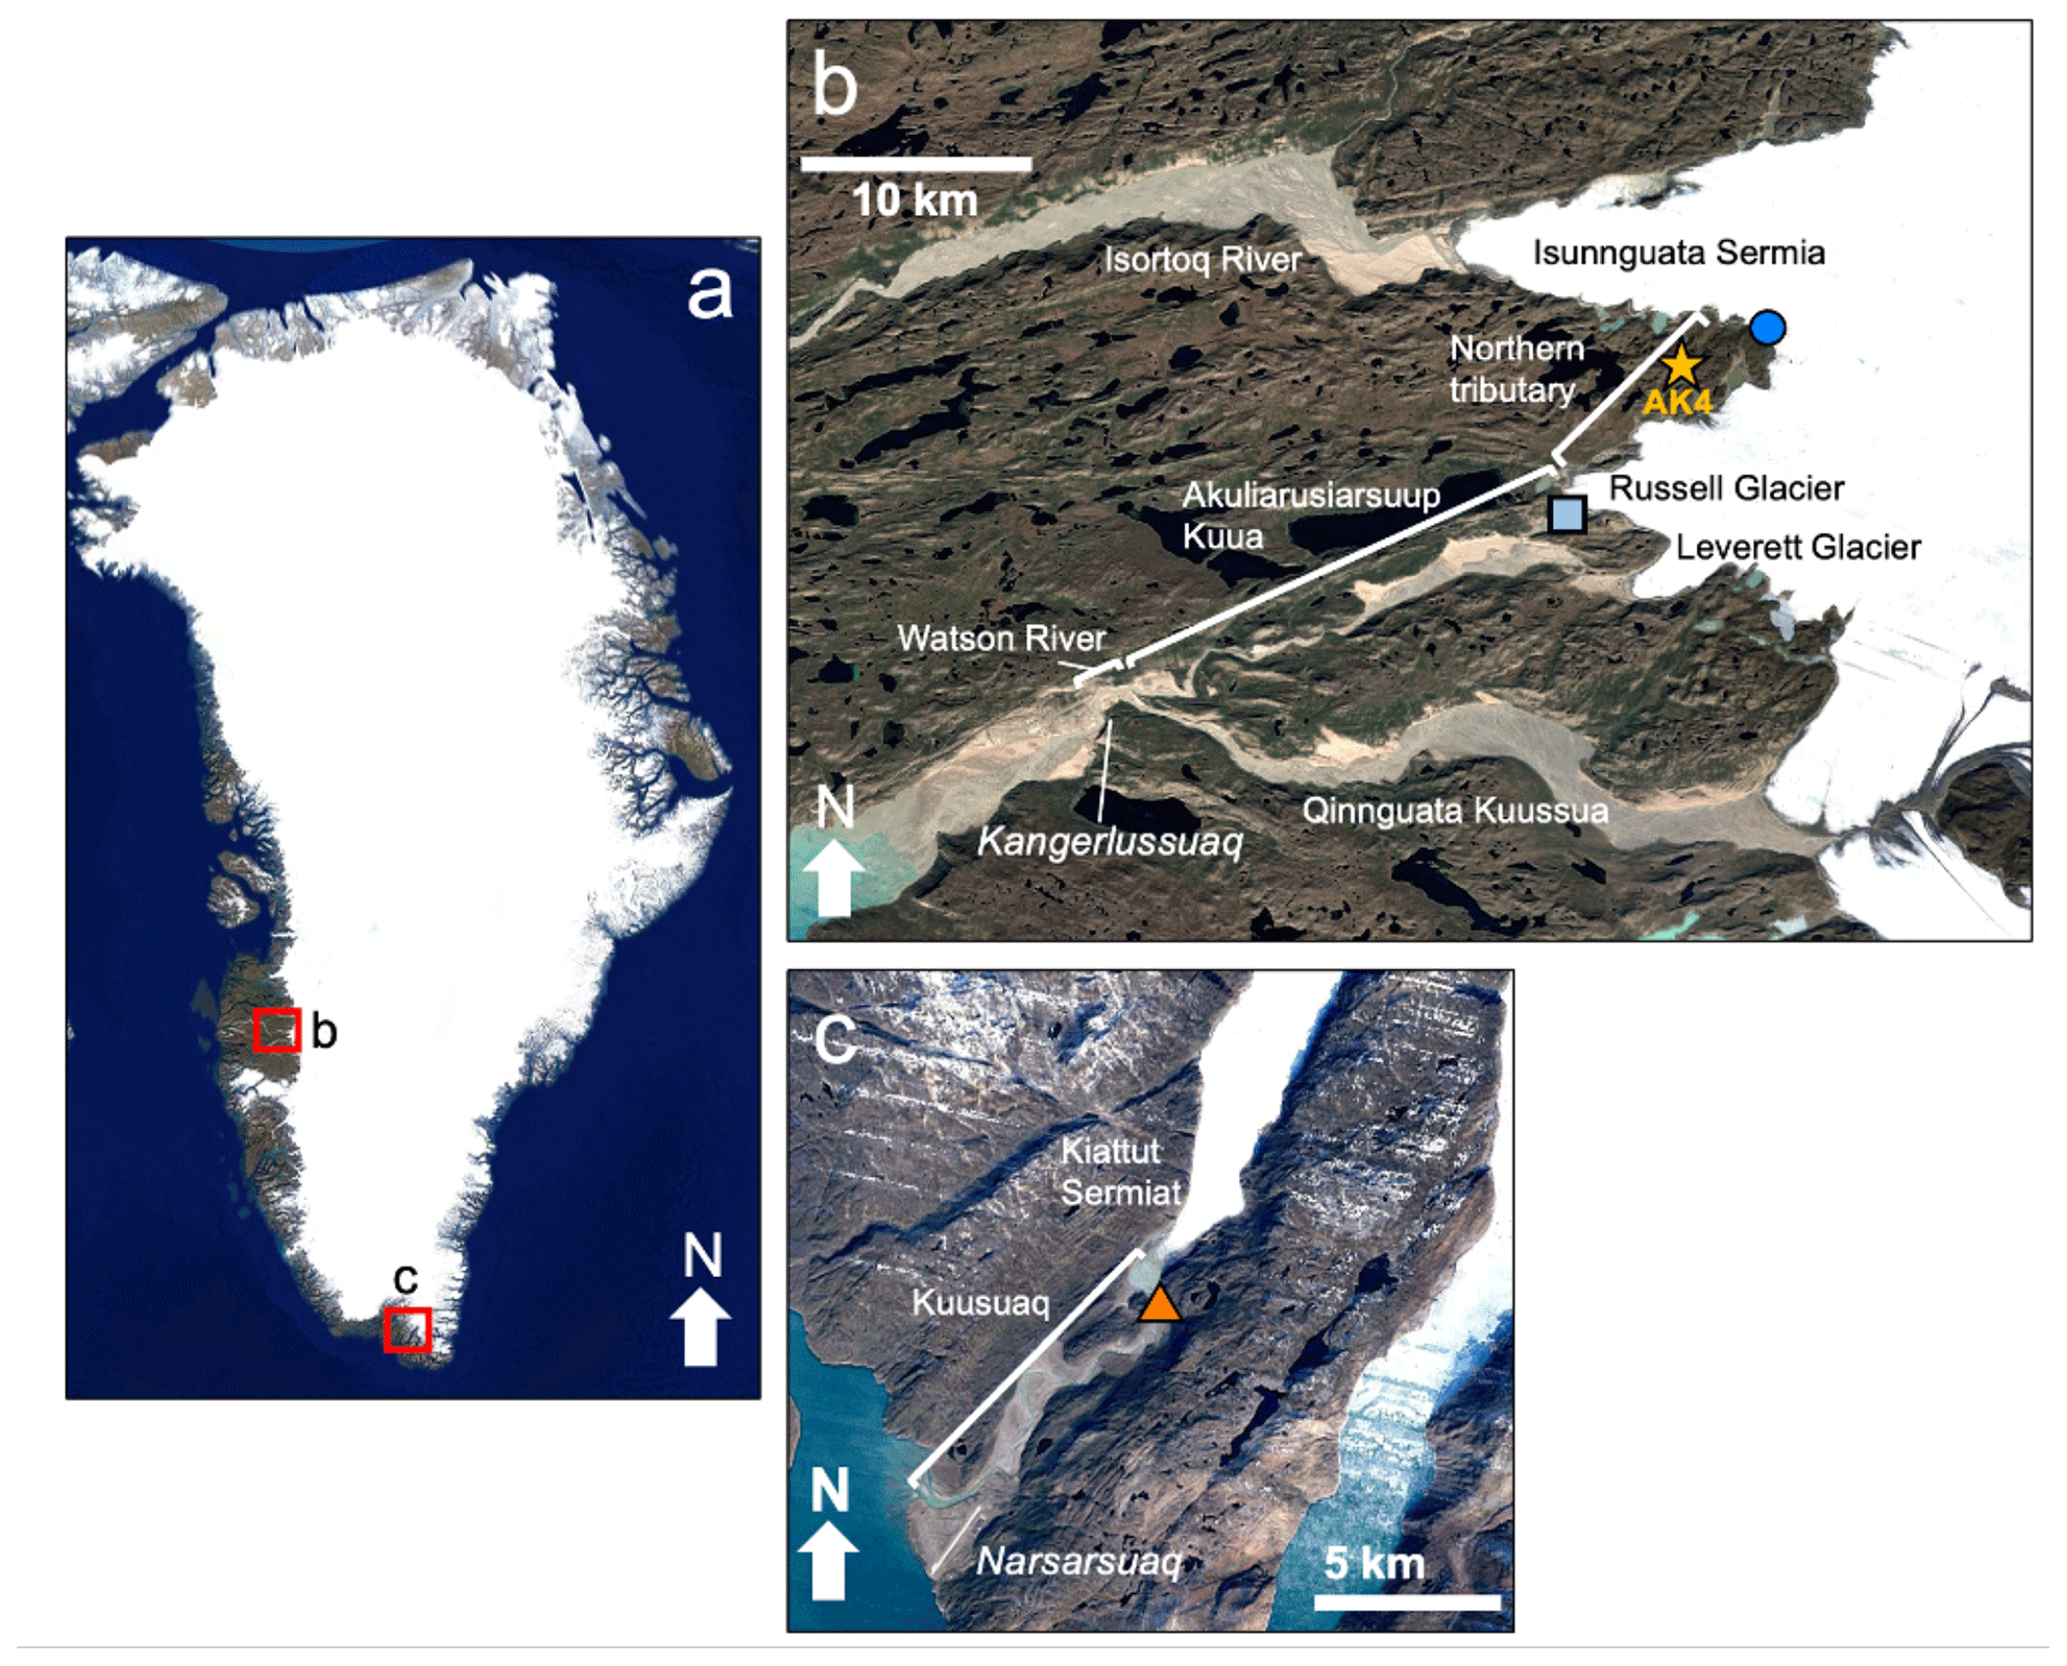
Figure 2Google Earth satellite images of study locations in (a) Greenland including (b) locations near the town of Kangerlussuaq, including the sub-Isunnguata water sampling location (dark blue circle) and Russell water sampling location (light blue square). The gold star represents the location of AK4, where proglacial river discharge records were collected. (c) Location of Kiattut Sermiat site (orange triangle) near the town of Narsarsuaq in southern Greenland where water samples were collected. © Google Earth.
2.1 Study locations
Our three subglacial discharge locations are located in southwest (Fig. 2a, b) and southern (Fig. 2a, c) Greenland (pictures given in the Supplement). Our sub-Isunnguata watershed (IS; N, W) and Russell Glacier watershed (RU; N, W) drain to the Akuliarusiarsuup Kuua, which is a tributary to the Qinnguata Kuussua. The short stretch of river downstream of the confluence of the Akuliarusiarsuup Kuua and the main stem of the Qinnguata Kuussua near the town of Kangerlussuaq is also known as the Watson River (Fig. 2b). The majority of drainage from the Isunnguata Glacier drains to the northern Isortoq River (Fig. 2); however, a sub-catchment of the Isunnguata drains to a stream that directly feeds the Akuliarusiarsuup Kua, which we refer to as the Northern Tributary, while the Akuliarusiarsuup Kuua refers to river that flows between the outlet of the Russell Glacier and the confluence with the Qinnguata Kuussua (Fig. 2b). Watson River discharge is monitored by PROMICE (Programme for Monitoring of the Greenland Ice Sheet; van As et al., 2018), and total discharge was 4.3 and 3.6 km3 of water in 2017 and 2018, respectively (van As et al., 2018). The total catchment size for the Isunnguata is 15 900 km2, though the size of the sub-catchment draining to the Northern Tributary is much smaller with a drainage area of approximately 40 km2 (Lindbäck et al., 2015; Rennermalm et al., 2013); therefore, we hereby refer to this site as the sub-Isunnguata watershed. The total drainage area for the Russell Glacier is not precisely known; however, the catchment draining both the Russell and Leverett glaciers has been estimated at approximately 900 km2 (Lindbäck et al., 2015), while the Leverett drainage area alone is estimated at approximately 600 km2 (Hawkings et al., 2016). We therefore estimate the Russell drainage area at approximately 300 km2, though it may be considerably smaller (van de Wal and Russell, 1994). Discharge from the third site in southern Greenland, Kiattut Sermiat (KS; N, W), drains to the Kuusuaq River near the town of Narsarsuaq. While Kuusuaq discharge is not monitored, a previous study using dye tracing techniques estimated approximately 0.22 km3 of discharge in 2013, and its catchment size was estimated at 36 km2 (Hawkings et al., 2016).
Underlying lithologies differ between sites. Southwest Qinnguata Kuussua sites are located near the boundary between the Archean craton to the south and the southern Nagssugtoqidian Orogen to the north (Henriksen et al., 2009). The Archean block is composed of granites and granulite facies orthogneisses that were intruded by mafic dikes during Paleoproterozoic rifting. These rocks were deformed and modified during subsequent continent-to-continent collision in the Paleoproterozoic to create the amphibolite facies gneisses of the southern Nagssugtoqidian Orogen (van Gool et al., 2002). Kiattut Sermiat lies within the Paleoproterozoic Ketilidian fold belt (Henriksen et al., 2009). Lithologies in this region include the Julianehåb granite and associated basic intrusions and the sedimentary and volcanic rocks of the Mesoproterozoic Gardar Province that include a suite of alkaline igneous rocks and basaltic dikes with interbedded sandstones (Kalsbeek and Taylor, 1985; Upton et al., 2003).
Previous studies have characterized chemical weathering reactions in subglacial discharge to the Akuliarusiarsuup Kua and Qinnguata Kuussua (Deuerling et al., 2018; Hasholt et al., 2018; Yde et al., 2014), in the Kuusuaq that drains Kiattut Sermiat (Hawkings et al., 2016), and in comparison between these two sites (Urra et al., 2019). There has been extensive work regarding ice sheet dynamics and hydrology in the southeast glaciers draining to the Akuliarusiarsuup Kua and Qinnguata Kuussua (Van As et al., 2017, 2018; Lindbäck et al., 2015) as well as southern Kuusuaq catchments (Warren and Glasser, 1992; Winsor et al., 2014). Subglacial permafrost has been identified near the sub-Isunnguata site (Ruskeeniemi et al., 2018) and mostly likely formed during Holocene fluctuations in the ice sheet margin. While a similar Holocene ice retreat and re-advance may have occurred in southern Greenland (Larsen et al., 2016), it is unknown whether this retreat led to the organic deposits below the ice sheet.
2.2 Sample collection
We collected water samples from subglacial discharge sites in spring and fall of 2017 and the summer of 2018 to observe seasonal variations in water chemistry. To minimize atmospheric influence, samples were collected as close as possible to the glacier front where subglacial waters emerge, which was less than 10 m for the sub-Isunnguata site and approximately 100 m for the Russell Glacier site. Subglacial discharge from Kiattut Sermiat site flowed through a glacial meltwater lake prior to arriving at the sampling location, which was approximately 1.1 km from the glacial outlet (Fig. 2) and therefore may experience a more interaction with atmospheric gases during transport from the subglacial discharge site to our sampling location. We collected water samples by pumping water through a 0.5 cm flexible PVC tube that was placed in flowing water as far as possible from shore (approximately 1–2 m). A YSI Pro Plus sensor that was calibrated daily was installed in an overflow cup filled from the bottom to measure specific conductivity (Sp.C), temperature, pH, dissolved oxygen, and oxidation–reduction potential (ORP). These parameters were monitored until stable, between about 10 and 30 min, after which samples were collected and preserved in the field according to the solute to be measured after being filtered through a 0.45 µm trace-metal grade Geotech high-capacity disposable canister filter. Samples for cations and anions were collected in HDPE bottles; cation samples were preserved with Optima-grade ultrapure nitric acid (pH < 2), while no preservative was added to anion samples. Dissolved inorganic carbon (DIC) samples were filtered through 0.2 µm filters directly to the bottom of 20 mL Qorpak glass vials and allowed to overflow until sealed tightly with no headspace.
Gas samples were collected in duplicate via headspace extractions according to methods outlined in Repo et al. (2007) and Pain et al. (2019b). Unfiltered water was pumped into the bottom of 500 mL bottles until they overflowed. Bottles were immediately capped with rubber stoppers fitted with two three-way inlet valves. A total of 60 mL of water was extracted from one inlet and replaced with 60 mL of atmospheric air (for spring and fall 2017 sampling trips) or ultrapure N2 gas in a gas bag (summer 2018 sampling trip). Bottles were shaken for 2 min to equilibrate headspace gas with water, and headspace gas was extracted and immediately injected into 60 mL glass serum bottles that had been evacuated immediately prior to sample introduction. Samples were stored at room temperature until analysis, which occurred within 1 week of collection. Measured headspace concentrations were converted to dissolved concentrations using methods outlined in Pain et al. (2019b). When atmospheric air was used for headspace extractions, atmosphere samples were collected in tandem and analyzed to correct the calculated dissolved CO2 and CH4 concentrations and isotopic compositions for atmospheric CO2 and CH4. This correction altered CH4 concentrations by up to 22 % for one sample from the Russell Glacier, though less than 5 % for all other samples, and resulted in a correction of δ13C-CH4 of up to 1.3 ‰. For CO2, the correction altered concentrations by up to 15 % for one sample collected at Kiattut Sermiat, though less than 10 % for all other samples, and resulted in a correction of δ13C-CO2 of up to 0.4 ‰.
In samples collected in fall 2017 and summer 2018, alkalinity was measured in the field laboratory within 3 d of collection by titration with 0.01 N HCl using the Gran method. Because alkalinity measurements were not available for the spring 2017 sampling trip, we estimate alkalinity with PHREEQC modeling and the phreeqc.dat database (Parkhurst, 1997) using major cations and anions, pH, temperature, and DIC concentrations as model inputs.
2.3 Laboratory analysis
Gas samples were analyzed for CO2 and CH4 concentrations as well as δ13C-CO2 and δ13C-CH4 on a Picarro G2201-i cavity ring-down spectrometer in the field within a few days of collection. Carbon isotopic compositions are reported in reference to Vienna Pee Dee Belemnite (VPDB). Check standards of known CO2 and CH4 concentrations and isotopic compositions were measured during each sample run and were accurate within 10 %. Anion and cation concentrations were measured on an automated Dionex ICS-2100 and ICS-1600 ion chromatograph, respectively. Error on replicate analyses was less than 5 %. DIC concentrations were measured on a UIC (coulometrics) 5011 CO2 coulometer coupled with an AutoMate Preparation Device. Samples were acidified, and the evolved CO2 was carried through a silver nitrate scrubber to the coulometer where total C was measured. Accuracy was calculated to be ±0.1 mg/L based on measurement of check standards.
2.4 Methane modeling
To assess CH4 sources and sinks, we calculate εc, or the carbon isotopic fractionation factor between CO2 and CH4 as defined in Whiticar (1999):
Values of εc reflect methanogenesis pathways (acetoclastic or CO2 reduction) as well as the extent of oxidation. Values of εc between approximately 40 ‰ and 55 ‰ are produced for CH4 generated via acetoclastic methanogenesis, while CO2 reduction produces values between approximately 55 ‰ and 90 ‰. Lower values (εc between 5 and 30) result when CH4 oxidation predominates. Modern atmospheric input without additional alteration of CO2 or CH4 isotopic systematics results in a εc value of approximately 40 (Whiticar, 1999).
We calculated CH4 oxidation using the isotopic method outlined in Mahieu et al. (2008) and Preuss et al. (2013). The fraction of oxidized methane (fox) in an open system is given by
where δE is the measured δ13C-CH4 value for each water sample, δP is δ13C-CH4 of produced methane, αox is the oxidation fractionation factor, and αtrans is a fractionation factor resulting from diffusive transportation of CH4. While the exact value of δP is unknown, diagenetic alteration of δ13C-CH4 values through oxidation or transport only enrich δ13C-CH4 signatures; therefore, the value of δP is taken as the most depleted δ13C-CH4 signature assuming it is the least impacted by diagenetic alteration. Literature-reported values for αox range between 1.003 and 1.049. We calculate the fraction of oxidized methane with the largest fraction factor (αox=1.049; Mahieu et al., 2008), which yields the minimum amount of CH4 oxidation required to explain the observed variations in δ13CH4 and thus is a conservative estimate for CH4 oxidation, and actual oxidation ratios may be higher. Literature-reported values for αtrans vary from 1 for advection-dominated systems to 1.0178 for diffusion-dominated porous media (de Visscher et al., 2004; Mahieu et al., 2008; Preuss et al., 2013). We assume that transport is advection dominated and thus assume αtrans=1; however, diffusive transport of CH4 may result in fractionation of CH4 in the subglacial environment and lead to relatively lower estimates of fox. Because hydrologic connectivity between subglacial methanogenic meltwater pockets and drainage features is not well described, the relative importance of advective compared to diffusive CH4 transport within the subglacial drainage system is not well understood; however, it is presumed to be an advection-dominated system in which expanding drainage networks access and drain methanogenic meltwater pockets throughout the melt season.
2.5 Mineral weathering and carbonate modeling
We used major cation and anion concentrations and alkalinity to partition solutes into the four mineral weathering reactions in Table 1 after correcting solute concentrations for marine aerosol deposition using measured chloride concentrations and standard seawater element ratios. The mass balance model followed the methods of Deuerling et al. (2019). After apportioning solutes to mineral weathering reactions, we used the stoichiometries of reactions to calculate the impact of each reaction on dissolved CO2 concentrations (Table 1). The mineral weathering model apportions solutes to reactions in Table 1 based on the ratios of and in silicate minerals in stream bed load samples, which were taken to be 0.54 and 0.38, respectively, for sub-Isunnguata and Russell Glacier samples (Deuerling et al., 2019; Hindshaw et al., 2014; Wimpenny et al., 2010, 2011) and 0.39 and 0.27, respectively, for Kiattut Sermiat samples (Da Prat and Martin, 2019). Because mineral weathering reactions may both add and remove CO2, we discuss both the net impact of mineral weathering on CO2 concentrations (Net CO2-MW), which may have a positive or negative value,
as well as the total impact of mineral weathering on CO2 concentrations (Total CO2-MW),
where changes in the concentrations of CO2 are defined by their absolute values. To discuss the relative importance of individual reactions, we define proportional contributions of each reaction as follows:
We combine measured CO2 concentrations with Net CO2-MW in order to determine the magnitude of CO2 production or consumption in the subglacial environment due to processes besides mineral weathering. This analysis assumes that the concentration of CO2 measured at the subglacial outlet is equivalent to the net change in CO2 due to mineral weathering plus the sum of all other subglacial CO2 sources and sinks. We refer to the sum of all other subglacial CO2 sources and sinks as CO2-total, which represents the amount of CO2 that must have been supplied to the subglacial environment to balance the mineral weathering CO2 sink:
The sources of CO2 to CO2-total may be evaluated through the use of Keeling plots, which are constructed as the inverse of CO2 concentrations ([CO2]−1) versus stable isotopic composition (δ13C-CO2). If variations in the concentration and isotopic composition of CO2 arise from the mixing of two CO2 reservoirs with constant isotopic compositions and concentrations (Keeling, 1958), a linear relationship is expected between [CO2]−1 and δ13C-CO2. The y intercept of a regression between these variables represents the isotopic composition of the high-CO2 end-member. Because measured CO2 concentrations include both subglacial CO2 sources and sinks, which may include considerable consumption through mineral weathering reactions, the magnitude of the total subglacial CO2 source is taken as CO2-total. We therefore construct Keeling plots between [CO2-total]−1 and measured δ13C-CO2 values because while mineral weathering impacts the concentration of CO2, its isotopic composition is not appreciably altered (Myrttinen et al., 2012) compared to the range of isotopic compositions of potential CO2 end-members, namely OM remineralization, atmospheric CO2, and lithogenic CO2 sources due to mechanical grinding (Fig. 1).
2.6 Discharge relationships
We evaluate the relationship between subglacial CH4 and CO2 dynamics and glacial meltwater river discharge records collected downstream of the sub-Isunnguata and upstream of the Russell sampling sites. Proglacial river discharge was collected in the Akuliarusiarsuup Kuua (AK) River at the AK4 site, 2 km downstream of the sub-Isunnguata sampling site (Fig. 2b). The river discharge dataset is an updated and extended version of Rennermalm et al. (2012) using reference and regression models to correct Solinst level logger drift in water stage (Solinst, 2017) and a total of 57 discharge measurements to convert continuous water stage to discharge. The standard uncertainty (i.e., the 68th percent confidence interval or 1 standard deviation) was determined to be 17 % using methods and recommendations provided by Herschy (1999), ISO Guide 98-3 (2008), and WMO (2010).
Because diurnal fluctuations in river discharge can be large, and differing water travel times from subglacial outlet sites to the discharge monitoring site induces a lag between maximum daily discharge at subglacial discharge sites and the AK4 site outlet, we compare subglacial CH4 and CO2 concentrations to average daily discharge, calculated as the average of hourly discharge estimates over the days on which subglacial discharge water samples were collected. We use the AK4 site discharge records for evaluating concentration–discharge relationships for both sub-Isunnguata and Russell sites. Although this site is upstream of the Russell Glacier, its close proximity to the Russell Glacier suggests it is more likely to reflect local melting patterns similar to those that would be controlling discharge dynamics at the Russell than discharge records collected at the Watson River outlet. While Watson River discharge records are also available through PROMICE (van As et al., 2018), which includes some contributions from the Russell Glacier, the Watson River includes discharge from the Akuliarusiarsuup Kuua (draining sub-Isunnguata, Russell, and Leverett catchments) as well as the much larger Qinnguata Kuussua catchment, and therefore Watson River discharge records are not likely to be representative of the temporal changes in the magnitude and variability of discharge from the much smaller Russell Glacier catchment.
3.1 Temporal variability in water chemistry and gas concentrations
Chemical parameters differ spatially between subglacial discharge sites as well as temporally through the 2017–2018 melt seasons. Comparing the means and standard deviations of water samples collected throughout 2017 and 2018, specific conductivity (Sp.C; Fig. 3a) is typically highest at Kiattut Sermiat (26 ± 8 ), followed by Russell (22 ± 5 ) and sub-Isunnguata sites (13 ± 9 ; Fig. 3a). All sites show variability over time, with lowest values occurring in the summer for sub-Isunnguata and Russell, while Sp.C drops continuously with days of the year for Kiattut Sermiat. Sites differ in pH, and average values at Kiattut Sermiat (8.2 ± 0.4) are higher than both Russell (7.2 ± 0.2) and sub-Isunnguata (6.6 ± 0.6; Fig. 3b), and while values vary over time, no consistent trend is identified between sites. The saturation of dissolved oxygen (D.O.) with respect to atmospheric concentrations is similar between sites, though sub-Isunnguata (98 ± 8 %) values fall below Russell (115 ± 16 %) and Kiattut Sermiat (117 ± 11 %) during all sampling times and exhibit undersaturation in the mid-summer samples, while Russell and Kiattut Sermiat are consistently supersaturated (Fig. 3c). Alkalinity is similar at Russell (93 ± 31 ) and Kiattut Sermiat (93 ± 26 ), which are higher than at sub-Isunnguata (39 ± 25 ), but all reach minimum values in summer (Fig. 3d). CH4 concentrations differ by orders of magnitude between sites (Fig. 3e) and are consistently supersaturated with respect to atmospheric concentrations at sub-Isunnguata (648 ± 411 ppm or 1575 ± 997 nM) and Russell (58 ± 33 ppm or 110 ± 78 nM) sites, while they are close to atmospheric equilibrium at Kiattut Sermiat (4 ± 2 ppm or 9 ± 5 nM). Mean δ13C-CH4 values (Fig. 3f) are similar between sub-Isunnguata (−54.7 ± 7.5 ‰), Russell (−52 ± 7.3 ‰), and Kiattut Sermiat (−57.6 ± 14.2 ‰). Measured CO2 concentrations (Fig. 3g) are consistently supersaturated with respect to atmospheric concentrations for sub-Isunnguata (685 ± 230 ppm or 58 ± 18 µM), near atmospheric equilibrium for Russell (442 ± 31 ppm or 29 ± 4 µM), and undersaturated for Kiattut Sermiat (263 ± 33 ppm or 19 ± 2 µM). Mean δ13C-CO2 values (Fig. 3h) are lower in spring and fall for sub-Isunnguata (−16.6 ± 4.0 ‰) compared to Russell (−13.7 ± 2.3 ‰) and Kiattut Sermiat (−16.1 ± 1.6 ‰) sites, though similar seasonal variation occurs for all sites with relatively more depleted values in the spring and fall compared to summer.
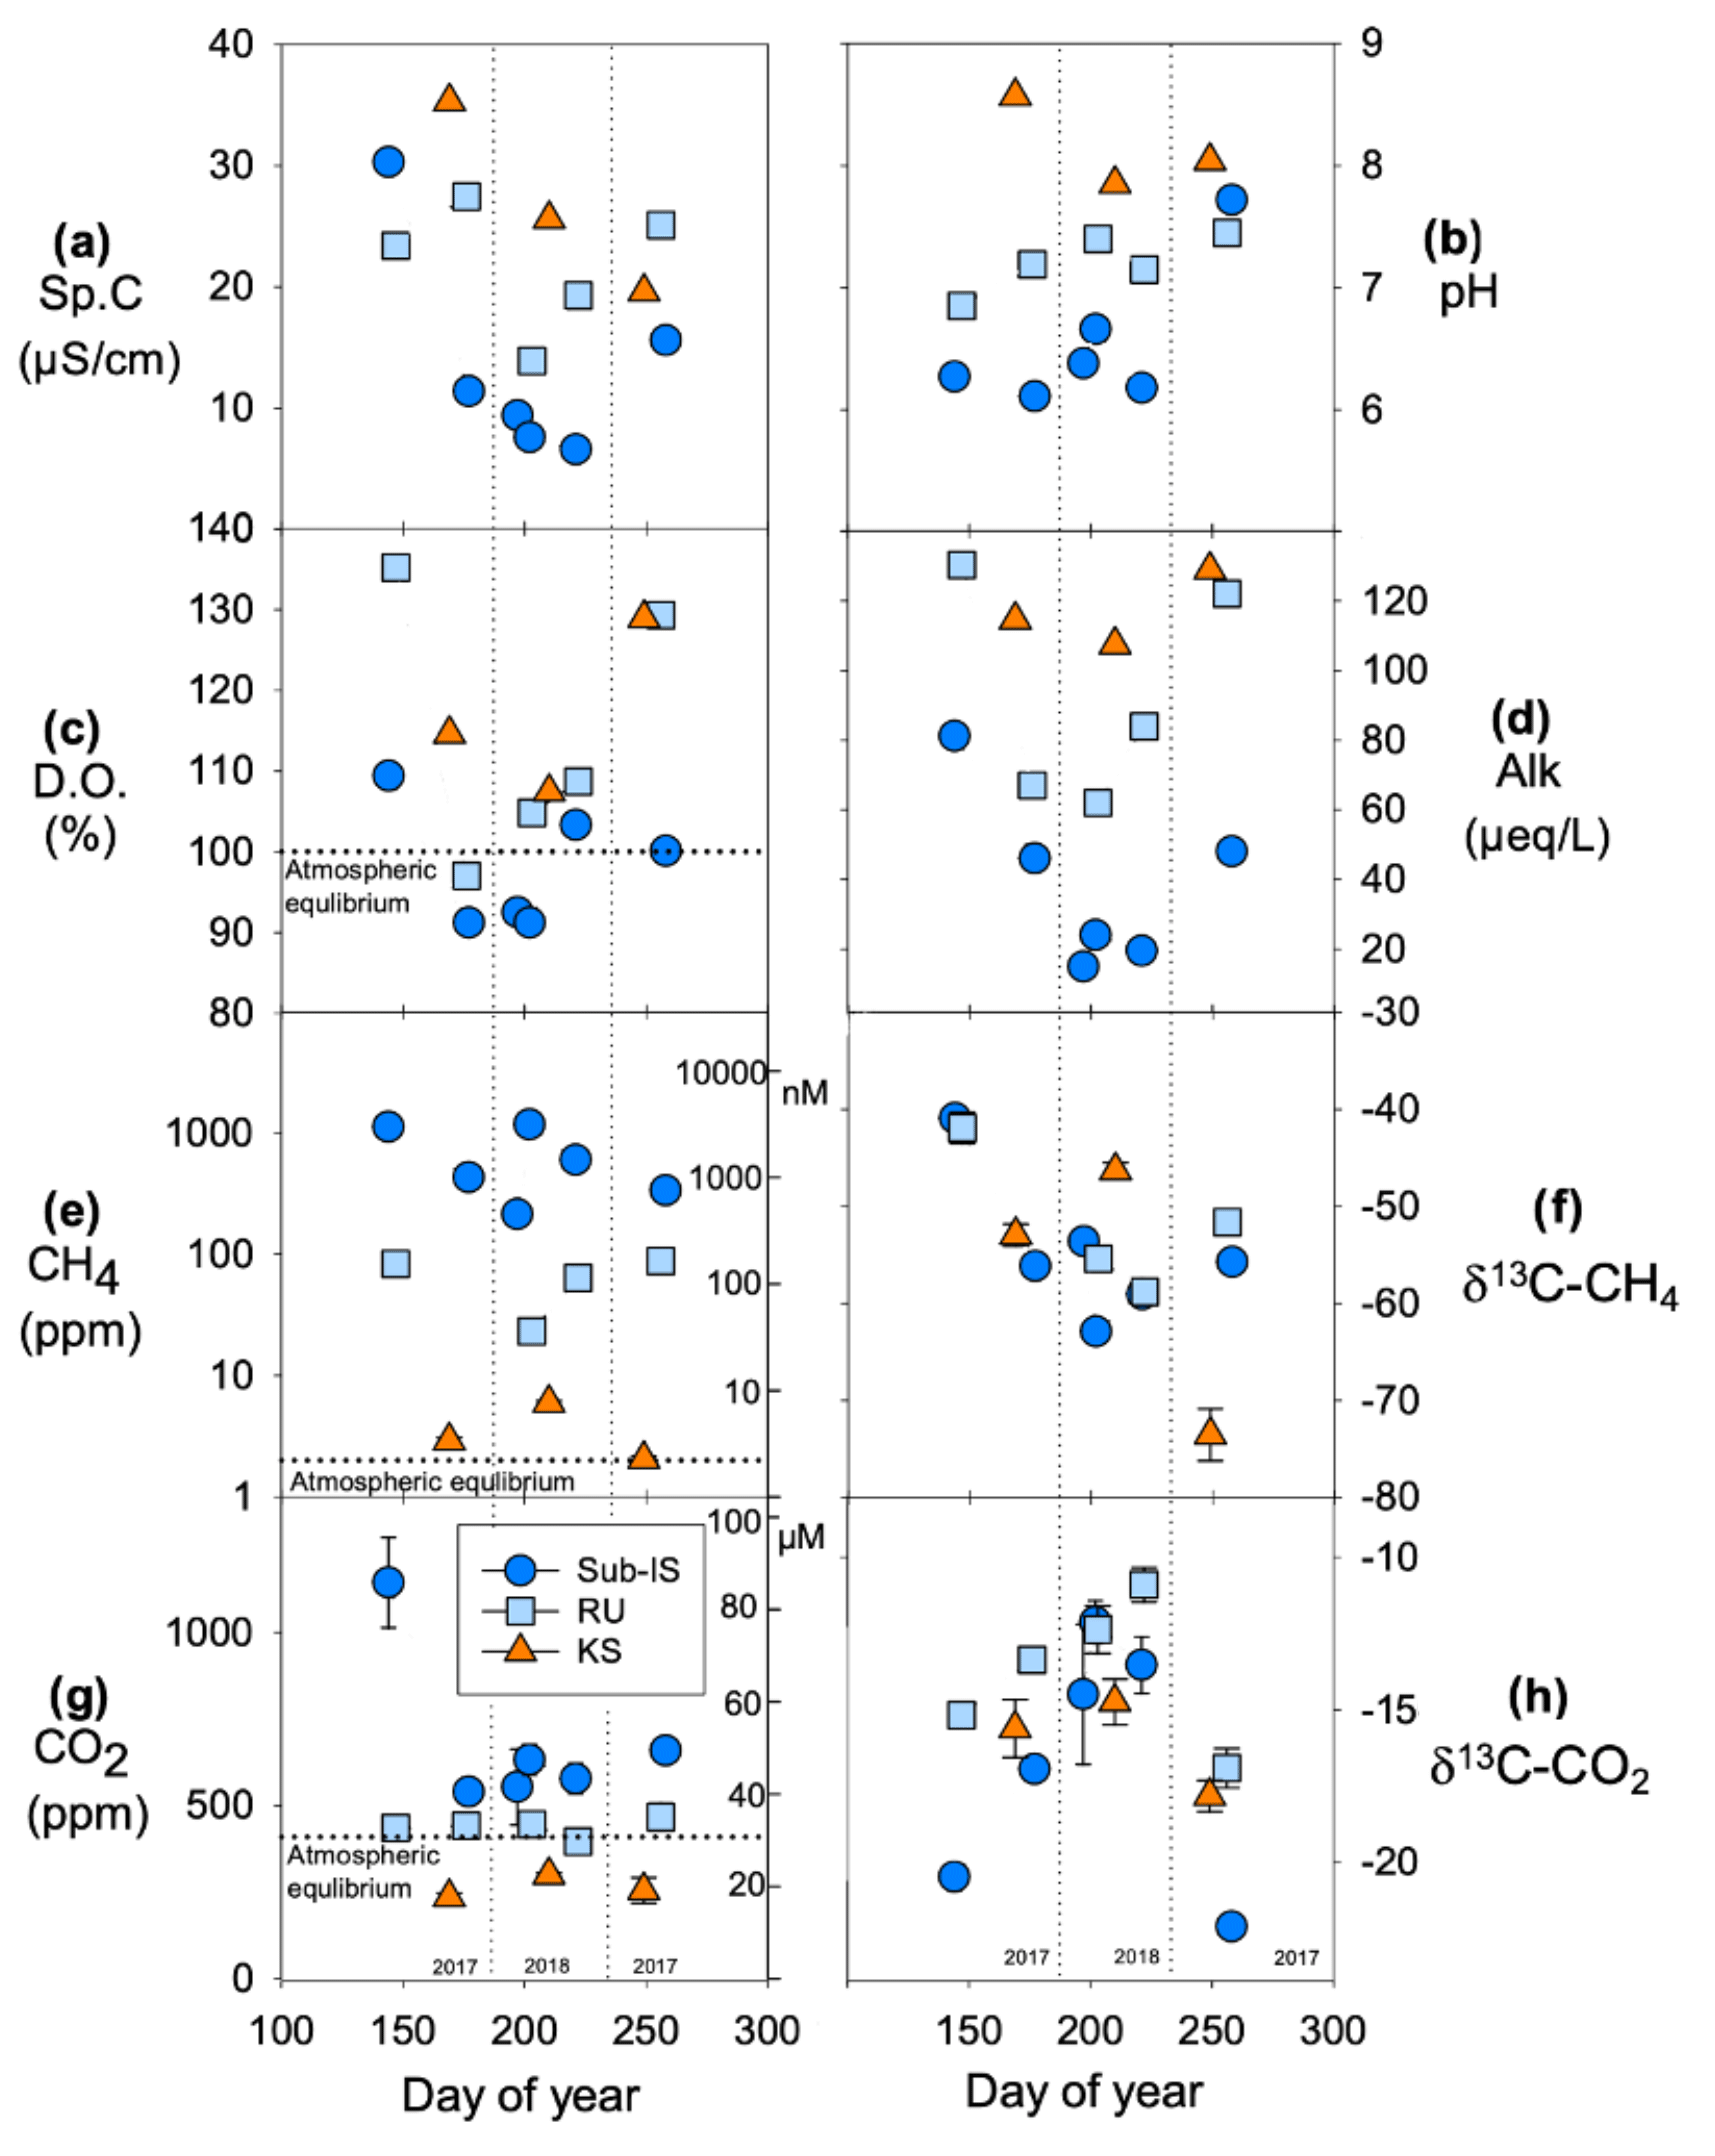
Figure 3Chemical parameters at sub-Isunnguata (sub-IS), Russell (RU), and Kiattut Sermiat (KS) subglacial water sampling sites versus day of year for (a) specific conductivity (Sp.C), (b) pH, (c) dissolved oxygen (D.O.) percent saturation, (d) alkalinity (Alk), (e) measured CH4 concentrations (left y axis in ppm and right y axis in nM), (f) δ13-CH4 values, (g) measured CO2 concentrations (left y axis in ppm and right y axis in µM), and (h) δ13C-CO2 values. Atmospheric equilibrium concentrations are indicated by dashed lines and taken as 1.9 ppm for CH4 and 410 ppm for CO2. Error bars on CH4 and CO2 concentrations and stable isotopic compositions represent the standard deviation of replicates and are smaller than symbols for some data points.
3.2 Methane oxidation and relationship with discharge
Values of εc are similar over time for sub-Isunnguata (38 ± 10 ‰) and Russell (38 ± 9 ‰) and are relatively higher in the summer sampling period, while Kiattut Sermiat εc values are higher on average (42 ± 13 ‰) with lowest values in the summer (Fig. 4a). Estimates of fox are similar between sub-Isunnguata (17 ± 15 %), Russell (23 ± 15 %), and Kiattut Sermiat sites (25 ± 22 %; Fig. 4b). However, fox values are higher in the spring and fall sampling times compared to summer for sub-Isunnguata and Russell and approach 50 % in the spring, while Kiattut Sermiat values decrease throughout the melt season.
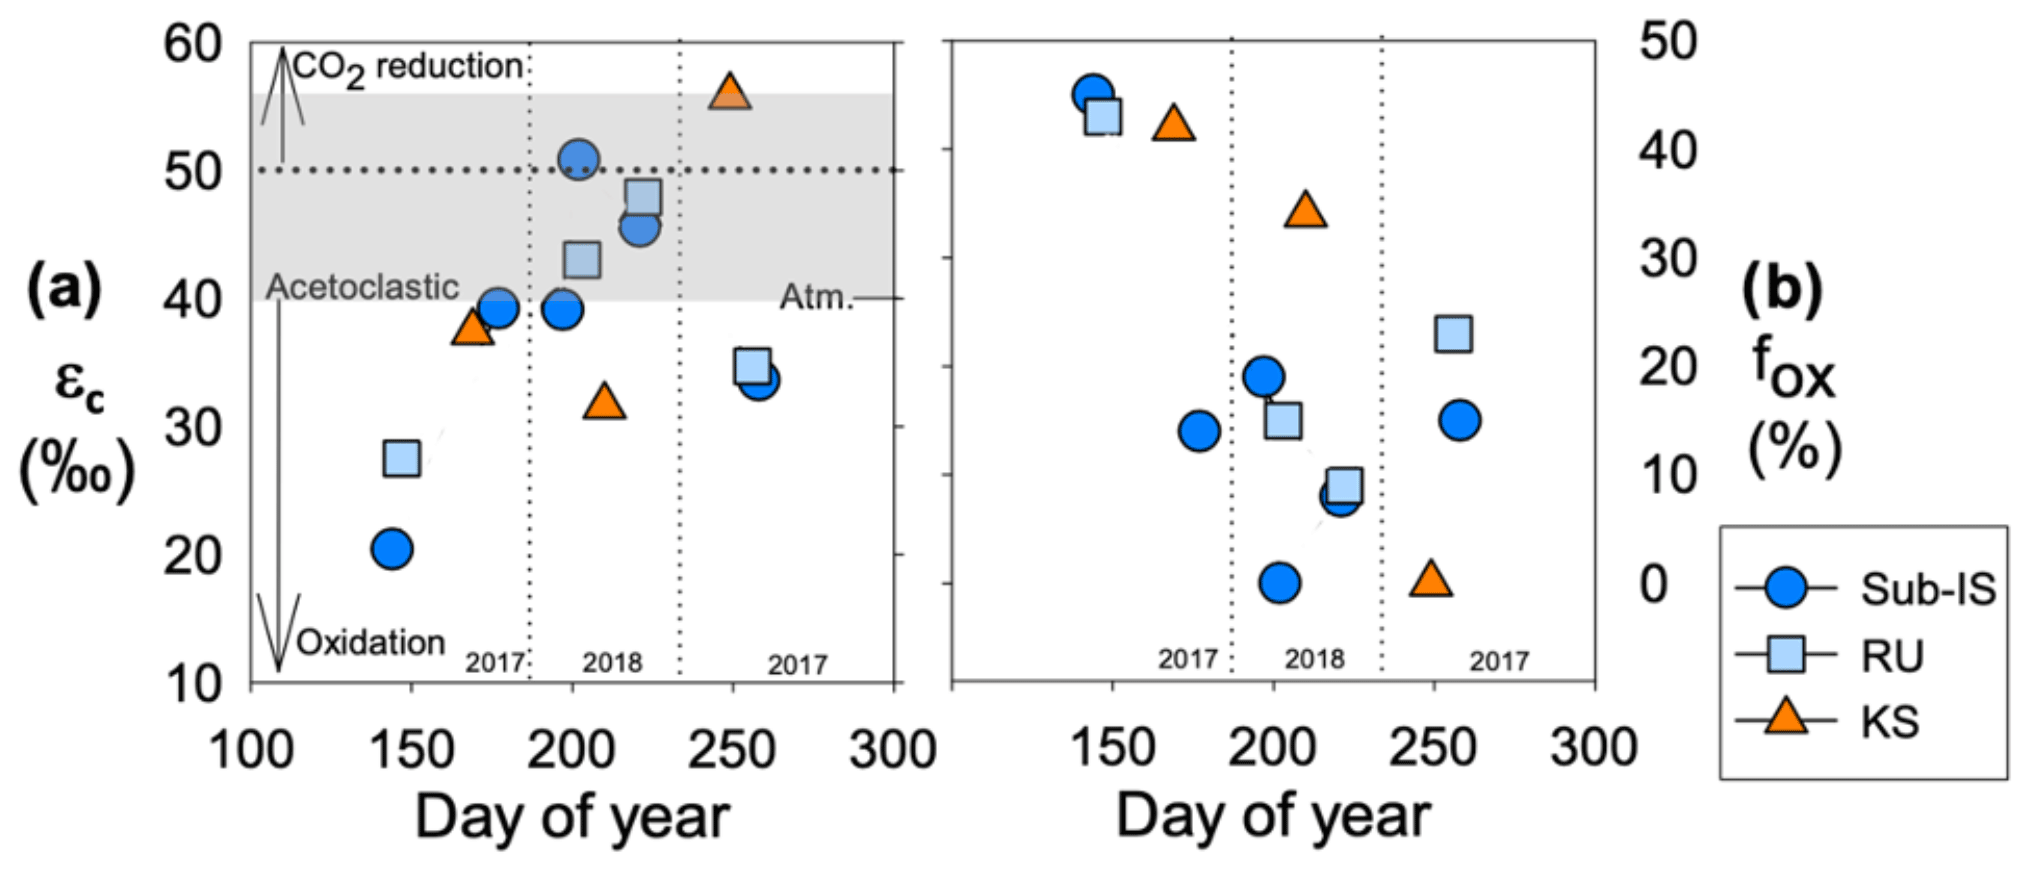
Figure 4CH4 dynamics over the course of the 2017 and 2018 melt seasons including (a) the carbon fractionation factor (εc) between dissolved CO2 and CH4 and (b) the fraction of CH4 oxidized (fox) for sub-Isunnguata (sub-IS), Russell (RU), and Kiattut Sermiat (KS) samples. Fields of εc representing methanogenesis and oxidation values are based on Whiticar (1999). Values of εc between approximately 40 and 55 (gray shaded region in panel a) are produced for methanogenesis via acetate fermentation, while CO2 reduction produces values between approximately 50 and 90. Lower values result from a predominant isotopic signature of CH4 oxidation. Atmospheric input without additional alteration of CO2 or CH4 isotopic systematics results in a εc value of approximately 40.
CH4 concentrations, δ13C-CH4 values, and fox are weakly negatively correlated to average daily discharge for both sub-Isunnguata and Russell sites (Fig. 5a, b and d), while εc is weakly positively correlated with discharge for both sub-Isunnguata and Russell (Fig. 5c).
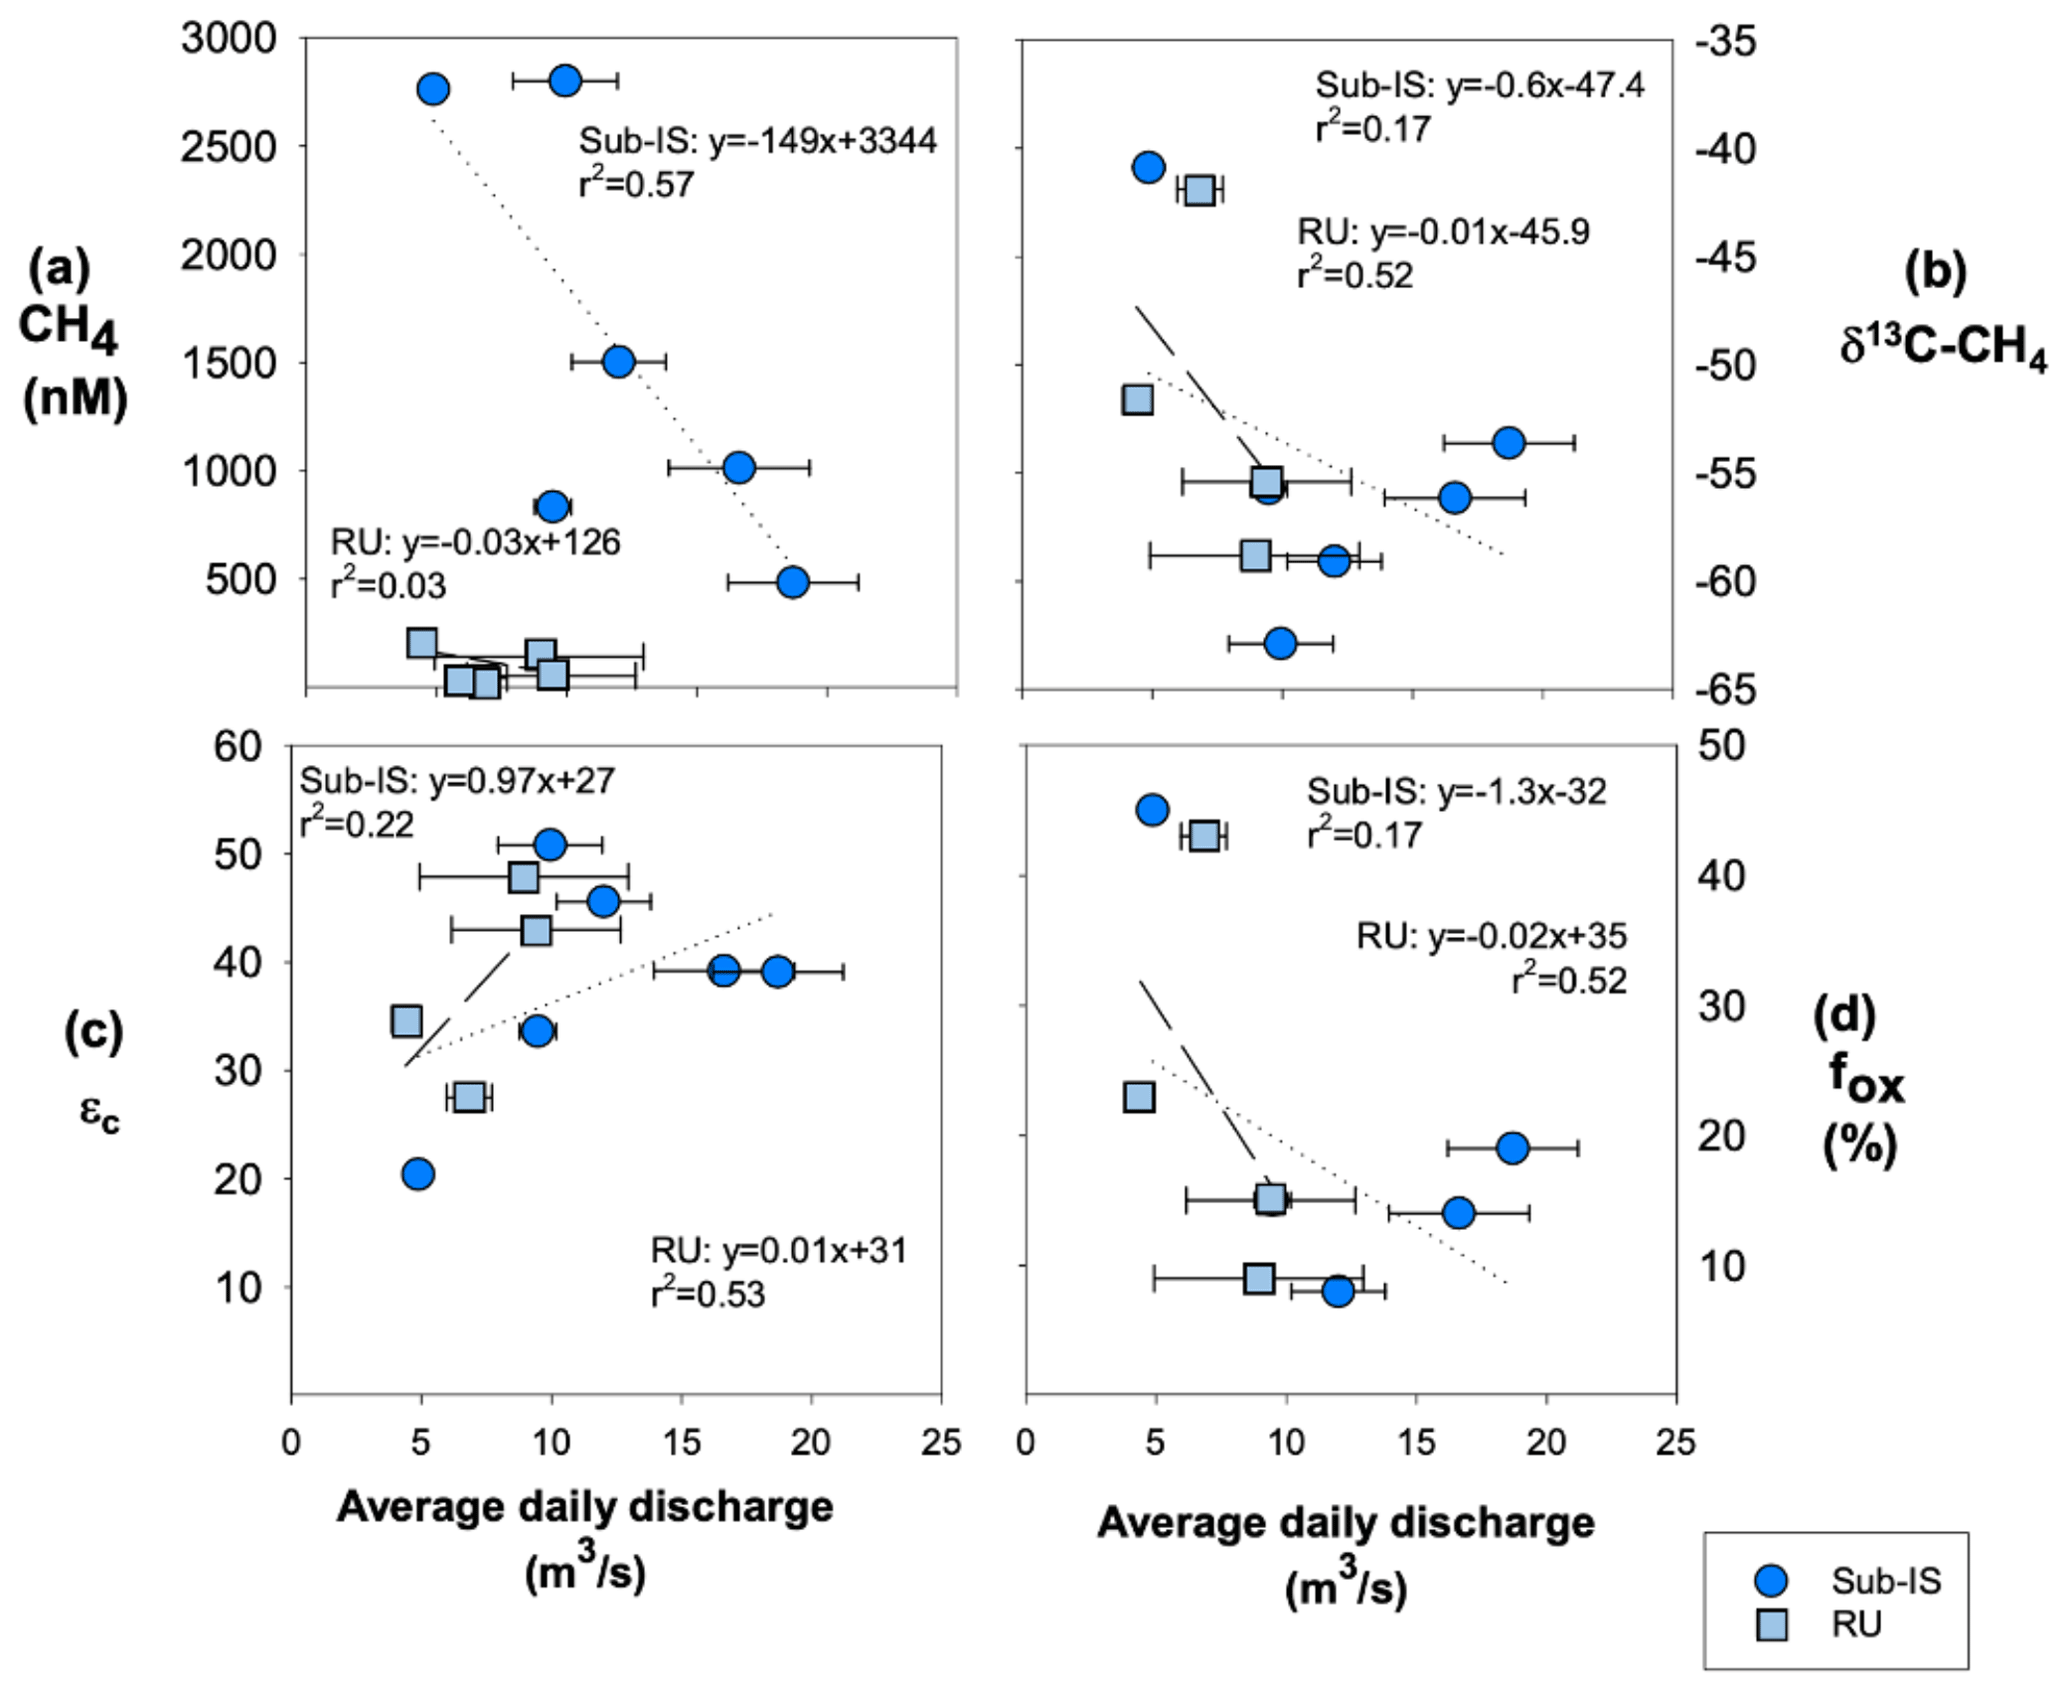
Figure 5Relationships between average daily discharge and CH4 dynamics including (a) CH4 concentrations, (b) δ13C-CH4, (c) fox, and (d) εc for sub-Isunnguata (sub-IS) and Russell (RU) samples. Regressions are shown by dotted lines for Isunnguata and dashed lines for Russell samples. Horizontal error bars represent the standard deviation of average daily discharge for days samples were collected and are smaller than symbols for some data points.
3.3 Mineral weathering impacts on CO2 and relationship with discharge
Mineral weathering leads to net sequestration of CO2 at all three sites (Fig. 6a). The magnitude of net ΔCO2 differs between sites with the lowest average values at sub-Isunnguata (−39 ± 37 µM) followed by Russell (−65 ± 32 µM) and Kiattut Sermiat (−98 ± 17 µM) sites. Individual mineral weathering reactions produce differing contributions between sites and over time, with notable differences between southwest sites (sub-Isunnguata and Russell) and the southern Kiattut Sermiat site (Fig. 6b). For instance, the proportional contribution of CarbSA is similar between sub-Isunnguata (17 ± 11 %) and Russell (15 ± 6 %) but lower at Kiattut Sermiat (8 ± 1 %; Fig. 6b). Kiattut Sermiat has a relatively greater contribution from CarbCA (62 ± 2 %) compared to sub-Isunnguata (41 ± 10 %) and Russell (38 ± 6 %), while SilCA is lower at Kiattut Sermiat (28 ± 1 %) compared to sub-Isunnguata (41 ± 17 %) and Russell (47 ± 11 %). Kiattut Sermiat additionally exhibits low seasonal variability in the proportional contributions of individual mineral weathering reactions compared to sub-Isunnguata and Russell sites.
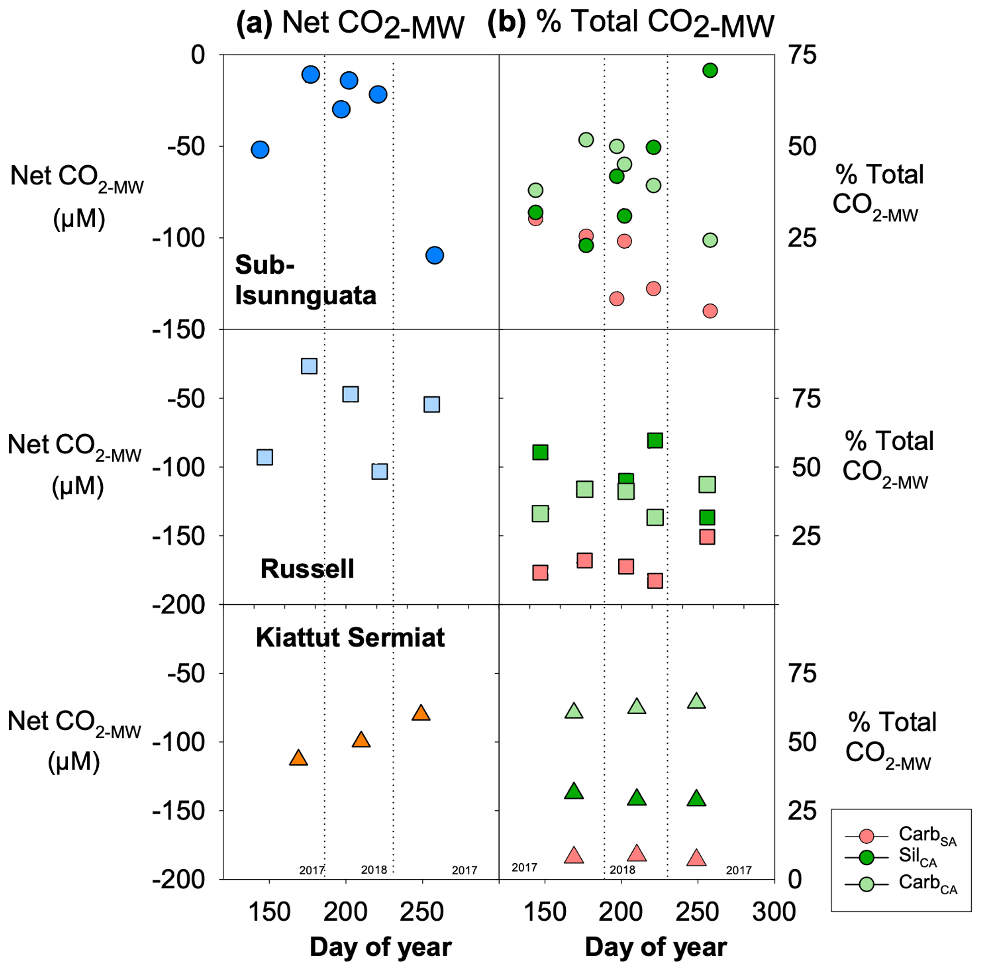
Figure 6Mineral weathering model results in (a) net impact of mineral weathering reactions on CO2 (Net CO2-MW; Eq. 7) for Isunnguata, Russell, and Kiattut Sermiat subglacial discharge sites (where negative values of Net CO2-MW indicate net sequestration of CO2 due to mineral weathering) and (b) the proportional contribution of each mineral weathering reaction to the total change in CO2 (% Total CO2-MW Eqs. 9a–9c).
CO2-total represents CO2 concentrations in the subglacial environment prior to addition and/or consumption of CO2 through mineral weathering (Eq. 10; Fig. 7). Because the Net CO2-MW is always negative (more consumption than production), the value of CO2-total is always greater than measured concentrations (CO2-measured). Regardless of differences in CO2-measured between sites, the average CO2-total values are similar between sites and average 91 ± 47 µM for sub-Isunnguata, 94 ± 33 µM for Russell, and 117 ± 16 µM for Kiattut Sermiat.
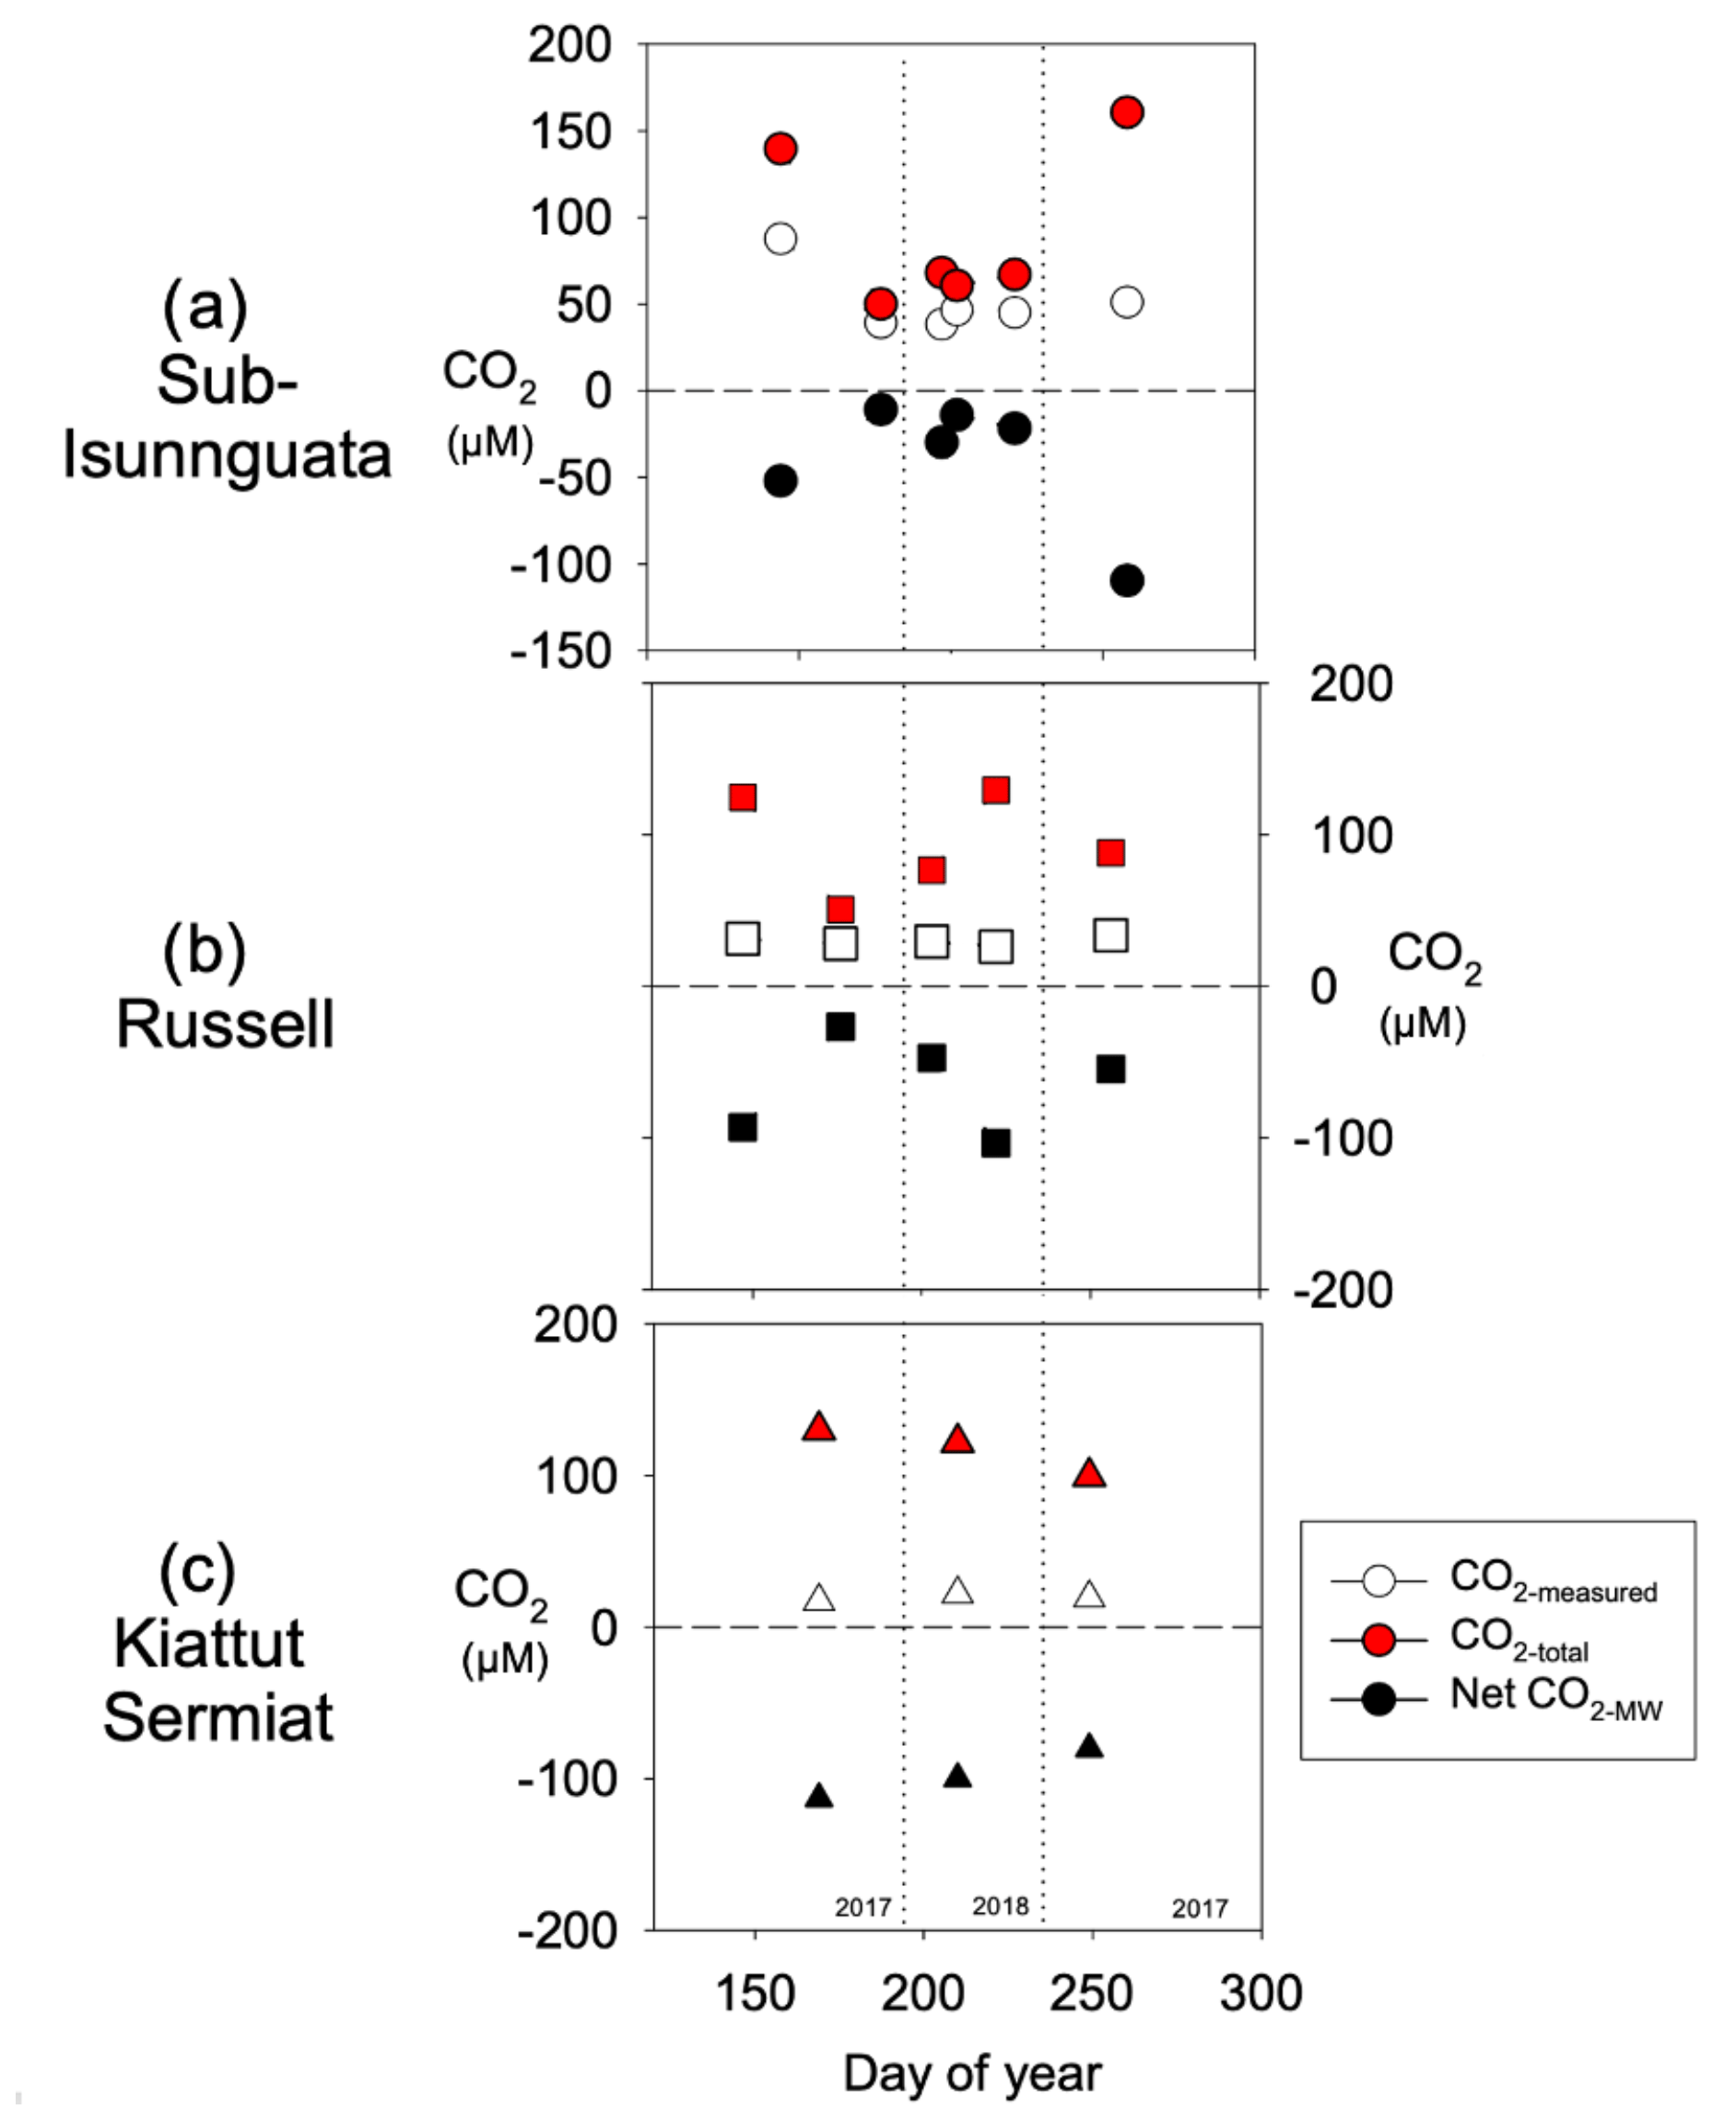
Figure 7Calculated CO2-total values for (a) sub-Isunnguata, (b) Russell, and (c) Kiattut Sermiat subglacial discharge against day of the year.
For both sub-Isunnguata and Russell sites, average daily discharge is negatively correlated with CO2 concentrations (Fig. 8a), while it is positively correlated with δ13C-CO2 (Fig. 8b).
Keeling plots between [CO2-total]−1 and δ13C-CO2 for each site indicate no linear relationship for Russell or Kiattut Sermiat samples; however, a strong linear correlation is observed for sub-Isunnguata (r2=0.99; p<0.001) samples with the removal of one outlier, which also had the lowest CO2-total value (Fig. 9).
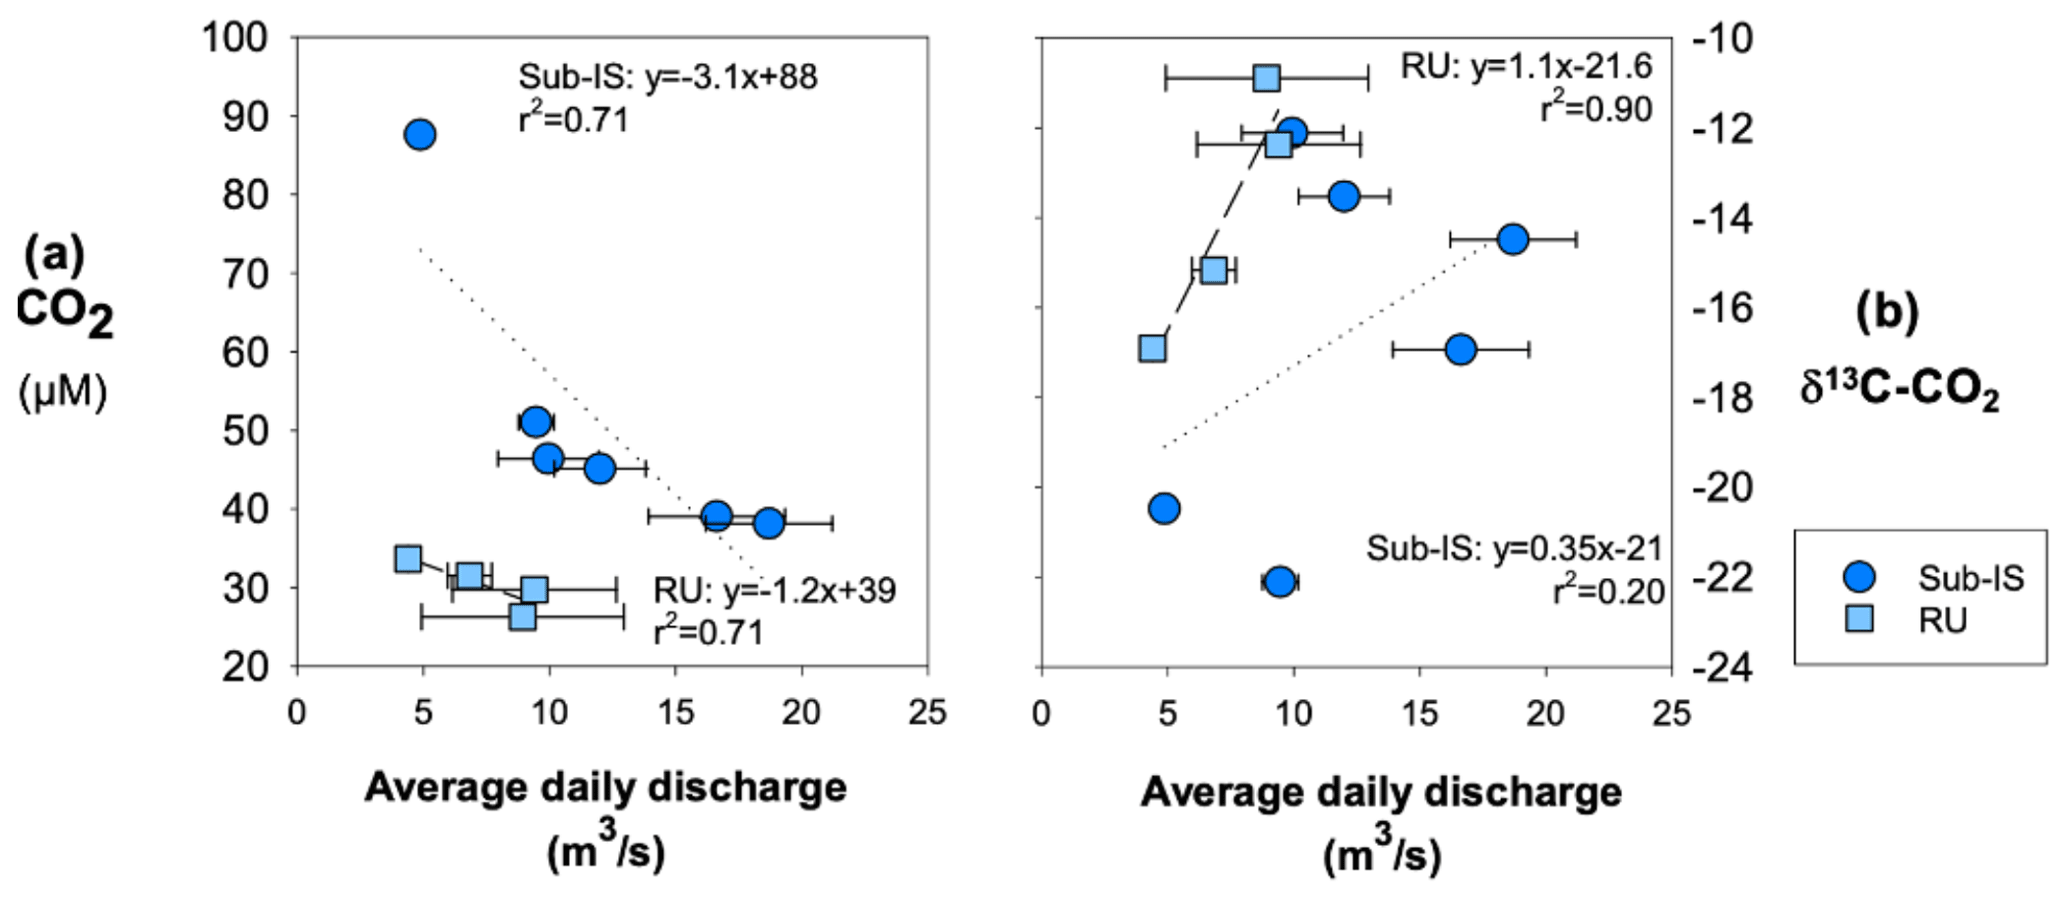
Figure 8Relationships between average daily discharge (a) CO2 concentrations and (b) δ13C-CO2. Regressions are shown by dotted lines for sub-Isunnguata and dashed lines for Russell samples. Horizontal error bars represent the standard deviation of average daily discharge for days samples were collected and are smaller than symbols for some data points.
We observe orders of magnitude variability in dissolved CH4 and CO2 concentrations in subglacial discharge of the Greenland Ice Sheet, indicating significant differences in the magnitudes of the sources and sinks of these gases across time and space. Supersaturation of both CO2 and CH4 with respect to atmospheric concentrations indicates that sub-Isunnguata discharge is a source of both gases to the atmosphere, the neighboring Russell Glacier discharges water that is a source of CH4 but near equilibrium with respect to CO2, and Kiattut Sermiat in southern Greenland is a sink of atmospheric CO2 but near equilibrium with respect to CH4 (Fig. 3e, g). Because CH4 dynamics may be largely microbially driven, while CO2 dynamics include microbial as well as abiotic mineral weathering processes, we first discuss CH4 dynamics including a comparison of concentrations, isotopic compositions, and extent of oxidation between sites and over the melt season. We then discuss CO2 concentrations, impacts of mineral weathering reactions (Table 1), and an assessment of subglacial CO2 sources, including OM remineralization. These assessments will contribute to our understanding of the variability and controls of CH4 and CO2 concentrations in subglacial discharge from the Greenland Ice Sheet and may improve predictions of the impact of future ice melt on Arctic carbon budgets.
4.1 Sources and sinks of CH4
Differences in CH4 concentrations and relationships with discharge between sites imply heterogeneity in both the extent and controls of subglacial methanogenesis under the Greenland Ice Sheet. CH4 supersaturation occurs at the two subglacial discharge sites that flow to the Akuliarusiarsuup Kuua (sub-Isunnguata and Russell), and concentrations are similar to the ranges reported in discharge of the Leverett Glacier (up to 600 nM; Lamarche-Gagnon et al., 2019), located near the Russell Glacier in this study (Fig. 2b). However, CH4 concentrations are near atmospheric equilibrium for the Kiattut Sermiat site (Fig. 3e). Because methanogenesis is an anaerobic OM remineralization pathway, it is more likely to occur in subglacial environments isolated from atmospheric O2 sources. Widespread observations of methanogenesis in glacial meltwater of southwest Greenland from this and other studies (Christiansen and Jørgensen, 2018; Dieser et al., 2014; Lamarche-Gagnon et al., 2019), and limited observations of CH4 in subglacial discharge in southern Greenland, suggests heterogeneity in subglacial conditions that support methanogenesis. Methanogenesis fueled by organic material overridden during ice sheet growth has been suggested as a potential climate feedback over glacial interglacial timescales (Wadham et al., 2008) and may contribute to observed variations in CH4 concentrations.
Subglacial methane concentrations may additionally be controlled by hydrologic factors as the subglacial hydrological network develops throughout the melt season and channelization of meltwater conduits increases subglacial drainage efficiency (Andrews et al., 2015; Cowton et al., 2013). Drainage efficiency impacts both subglacial water residence time as well the transport of aerobic supraglacial meltwater to the ice bed. Both residence time and oxygen delivery may impact subglacial redox status and methanogenesis potential and favor methanogenesis when oxygen supply rates are low compared to OM remineralization rates. This condition is most likely to be met in distributed subglacial systems that are hydrologically isolated with limited inputs from aerobic supraglacial meltwater. Such a hydrologic control on methanogenesis is supported by the negative correlation between CH4 concentrations and average daily discharge at both sites (Fig. 5a). This correlation would suggest that either CH4 production occurs predominantly during periods of low discharge and greater residence time or higher discharge results in the dilution of a CH4-laden subglacial water source. While both mechanisms would lead to a similar relationship between discharge and CH4 concentrations, they carry different implications for subglacial methanogenesis. If limited by residence time, a hydrologic link between glacial hydrology and subglacial biogeochemistry would be established because supraglacial discharges deliver terminal electron acceptors to the ice bed and would limit methanogenesis. If predominantly controlled by dilution, however, active methanogenesis would not be required – only the existence of meltwater pockets containing CH4 that may or may not have been recently produced. Further discussion of these mechanisms is outside the scope of this study. While we have limited data to make further inferences about hydrologic controls of methanogenesis, the presence of several outliers at the sub-Isunnguata site in particular (Fig. 5a) highlights the possibility for additional controls including stochastic drainage events or heterogeneity in subglacial CH4 concentrations that result in variability in the relationship between concentration and discharge, as was observed in Lamarche-Gagnon et al. (2019).
Our results suggest heterogeneity in the extent of methanogenesis between outlet glaciers but homogeneity of the microbial methanogenesis pathway as well as CH4 oxidation dynamics between sites. Methanogenesis pathways may be evaluated by δ13C-CH4 as well as εc values because they impart distinct δ13C signatures to CH4 and CO2 (Whiticar and Schoell, 1986). Dieser et al. (2014) measured a microbial δ13C-CH4 production signal at the Russell Glacier with values between −63 ‰ and −64 ‰, which was interpreted to reflect a possible combination of CH4 produced through both acetoclastic and CO2 reduction pathways. The most depleted δ13C-CH4 value measured at the sub-Isunnguata in this study was −62.7 ‰, close to values measured by Dieser et al. (2014) (Fig. 3f) and similar to values reported by Lamarche-Gagnon et al. (2019) for the Leverett Glacier. The similar isotopic ratio between our samples and that measured in active methanogenic communities could indicate that similar methanogenesis pathways occur across this region or that the δ13C-CH4 of stored subglacial CH4 has not been fractionated by oxidation or transport in the peak melt season when we observe these depleted δ13C-CH4 values.
While the exact contributions from each methanogenesis pathway cannot be inferred from isotopic information alone, the range of εc values at outlet glaciers are consistent with predominantly acetoclastic methanogenesis during the peak melt season (Fig. 4a). However, εc values fall below the expected range from acetoclastic methanogenesis during the early and late melt seasons and may result from variations in the extent of subglacial CH4 oxidation. Seasonal variation in CH4 oxidation is supported by consistency between εc and fox values, which both indicate the greatest impact of oxidation (approaching 50 %) in the early melt season compared to peak melt season (Fig. 4a, b), with additional evidence of elevated CH4 oxidation in the late melt season at both sub-Isunnguata and Russell sites. Because our water sampling locations were slightly downstream of glacial discharge outlets, there is also the possibility that outgassing in between the outlet and our sampling location reduced dissolved CH4 concentrations and led to more enriched isotopic compositions of remaining dissolved CH4. It is likely that some outgassing did occur; however, it is unlikely that the extent of outgassing between the glacial outlet and our sampling location would vary significantly between sampling times, and thus outgassing would not fully explain temporal differences in concentration, δ13C-CH4, fox, or εc. While our measured gas concentrations and isotopic compositions likely reflect some modification of CH4 and CO2 isotopic compositions due to outgassing, the differences over time are more likely due to changes in subglacial CH4 dynamics than outgassing.
The extent of CH4 oxidation may be controlled by multiple factors including oxygen availability, subglacial residences time, and subglacial hydrology, similar to methanogenesis. A hydrologic control of CH4 oxidation is supported by relationships between fox and εc with average daily discharge (collected at site AK4; Fig. 2b) at both sub-Isunnguata and Russell sites: fox is negatively correlated with discharge for both sites (Fig. 5b) while εc is positively correlated with discharge (Fig. 5c). While weak, these correlations suggest that CH4 oxidation is greatest during periods of low flow, which may be associated with longer residence times to allow subglacial CH4 oxidation; however, this relationship could also result from differences in CH4 sources throughout the melt season as the subglacial drainage network expands. Assuming the former, the delivery of oxygen to the subsurface by supraglacial melting does not appear to be a limiting factor in subglacial CH4 oxidation, which should increase fox as more oxygenated supraglacial water is delivered to the subglacial system. Instead, the observed greater CH4 oxidation during periods of low discharge may reflect mixing of methane-rich subglacial meltwater pockets and aerobic subglacial meltwater leading to CH4 oxidation. Longer transit times during periods of low flow may allow more subglacial methane oxidation to occur than during peak discharge, when the development of channelized flow paths reduces meltwater residence time in the subglacial environment.
Our results indicate a high degree of heterogeneity in subglacial methanogenesis under the Greenland Ice Sheet, as well as a significant impact of CH4 oxidation, which serves to reduce atmospheric CH4 fluxes. Given the observed spatial and temporal heterogeneity of CH4 concentrations and processes, further investigation of the spatial variability in outlet glacier CH4 concentrations is needed to determine the impact of Greenland Ice Sheet loss on Arctic and global CH4 budgets, while a better understanding of the controls of these differences will improve models of how CH4 fluxes from subglacial discharge will change with continued warming.
4.2 Sources and sinks of CO2
Dissolved CO2 concentrations in subglacial discharge are consistently supersaturated with respect to atmospheric concentrations at the sub-Isunnguata site, near atmospheric equilibrium at the Russell Glacier, and undersaturated at Kiattut Sermiat, indicating that glacial meltwater from the Greenland Ice Sheet can serve as either a source or sink of CO2 to the atmosphere. Similar to CH4, differences in dissolved CO2 dynamics (Fig. 3g) imply variability in carbon processes under the Greenland Ice Sheet. We first discuss potential subglacial CO2 sources, including OM remineralization, followed by a discussion of CO2 consumption due to mineral weathering.
4.2.1 Subglacial CO2 sources
There are many potential sources of CO2 in the subglacial environment including dissolution of atmospheric gases in air-filled conduits or fractures in ice, CO2 contained in ice bubbles (Fig. 1; Anklin et al., 1995; Graly et al., 2017), mechanical grinding and volatilization of fluid inclusions in bedrock (Macdonald et al., 2018), and OM remineralization. While previous studies have indicated that additional atmospheric CO2 input through fractures and air-filled conduits may supply sufficient CO2 to drive mineral weathering observed in many subglacial environments, including several sites in Greenland (Graly et al., 2017), CO2 is also a product of OM remineralization, which is believed to account for CH4 concentrations elevated above atmospheric equilibrium at the two southwest sites in this study. Both CO2 and CH4 exhibit negative correlations with average daily discharge for both sub-Isunnguata and Russell sites and could suggest a common OM remineralization source (Fig. 8a). While the magnitude of this source and its relative importance compared to other subglacial CO2 sources is currently unknown, differing sources of carbonic acid for mineral weathering reactions carry different implications for subglacial CO2 budgets. For instance, carbonic acid weathering driven by invasion of atmospheric CO2 would represent a sink of atmospheric CO2, but carbonic acid weathering driven by OM remineralization would instead serve to consume CO2 from in situ sources and limit the potential for subglacial meltwater to be an atmospheric CO2 source once discharged from the glacier. Determining the sources of carbonic acid to subglacial weathering reactions is therefore critical to understand the controls of mineral weathering in subglacial environments and its role in atmospheric CO2 sequestration.
Comparisons between measured δ13C-CO2 in subglacial discharge samples and likely δ13C-CO2 values of CO2 sources indicate that CO2 sources differ between sites, with OM remineralization as the most important CO2 source at the sub-Isunnguata but likely not the predominant or sole source at Russell or Kiattut Sermiat glaciers. Keeling plots of [CO2-total]−1 versus δ13C-CO2 indicate that CO2-total may be represented by a two-end-member mixing model for sub-Isunnguata discharge but not for discharge from the Russell and Kiattut Sermiat glaciers (Fig. 9). Mixing model end-members include a 13C-enriched, lower-concentration CO2 source and a 13C-depleted, higher-concentration CO2 source. The y intercept of the regression between [CO2-total]−1 versus δ13C-CO2, which represents the isotopic signature of the high-CO2 end-member, is −27.4 ‰. This value is close to what would be expected from OM remineralization as indicated by remineralized OM in Greenlandic heath soils that produced δ13C-CO2 of approximately −27‰ to −25 ‰ (Ravn et al., 2020) and thawed Alaskan permafrost soils that produced δ13C-CO2 of between −20 ‰ to −30 ‰ (Mauritz et al., 2019), both of which may be similar to subglacial organic matter. The low-CO2 end-member could reflect atmospheric CO2 input, with an associated δ13C-CO2 value of approximately −8 ‰. While the δ13C-CO2 value of the lowest-CO2-total samples in the sub-Isunnguata Keeling plot (e.g., highest [CO2-total]−1 not including the outlier) is slightly depleted compared to atmospheric values at −12.1 ‰, even the lowest CO2 concentrations measured at sub-Isunnguata are supersaturated with respect to atmospheric concentrations (Fig. 3g). Consistent CO2 supersaturation suggests that OM remineralization contributes CO2 even for low-CO2-concentration samples and isotopically depletes the subglacial CO2 reservoir.
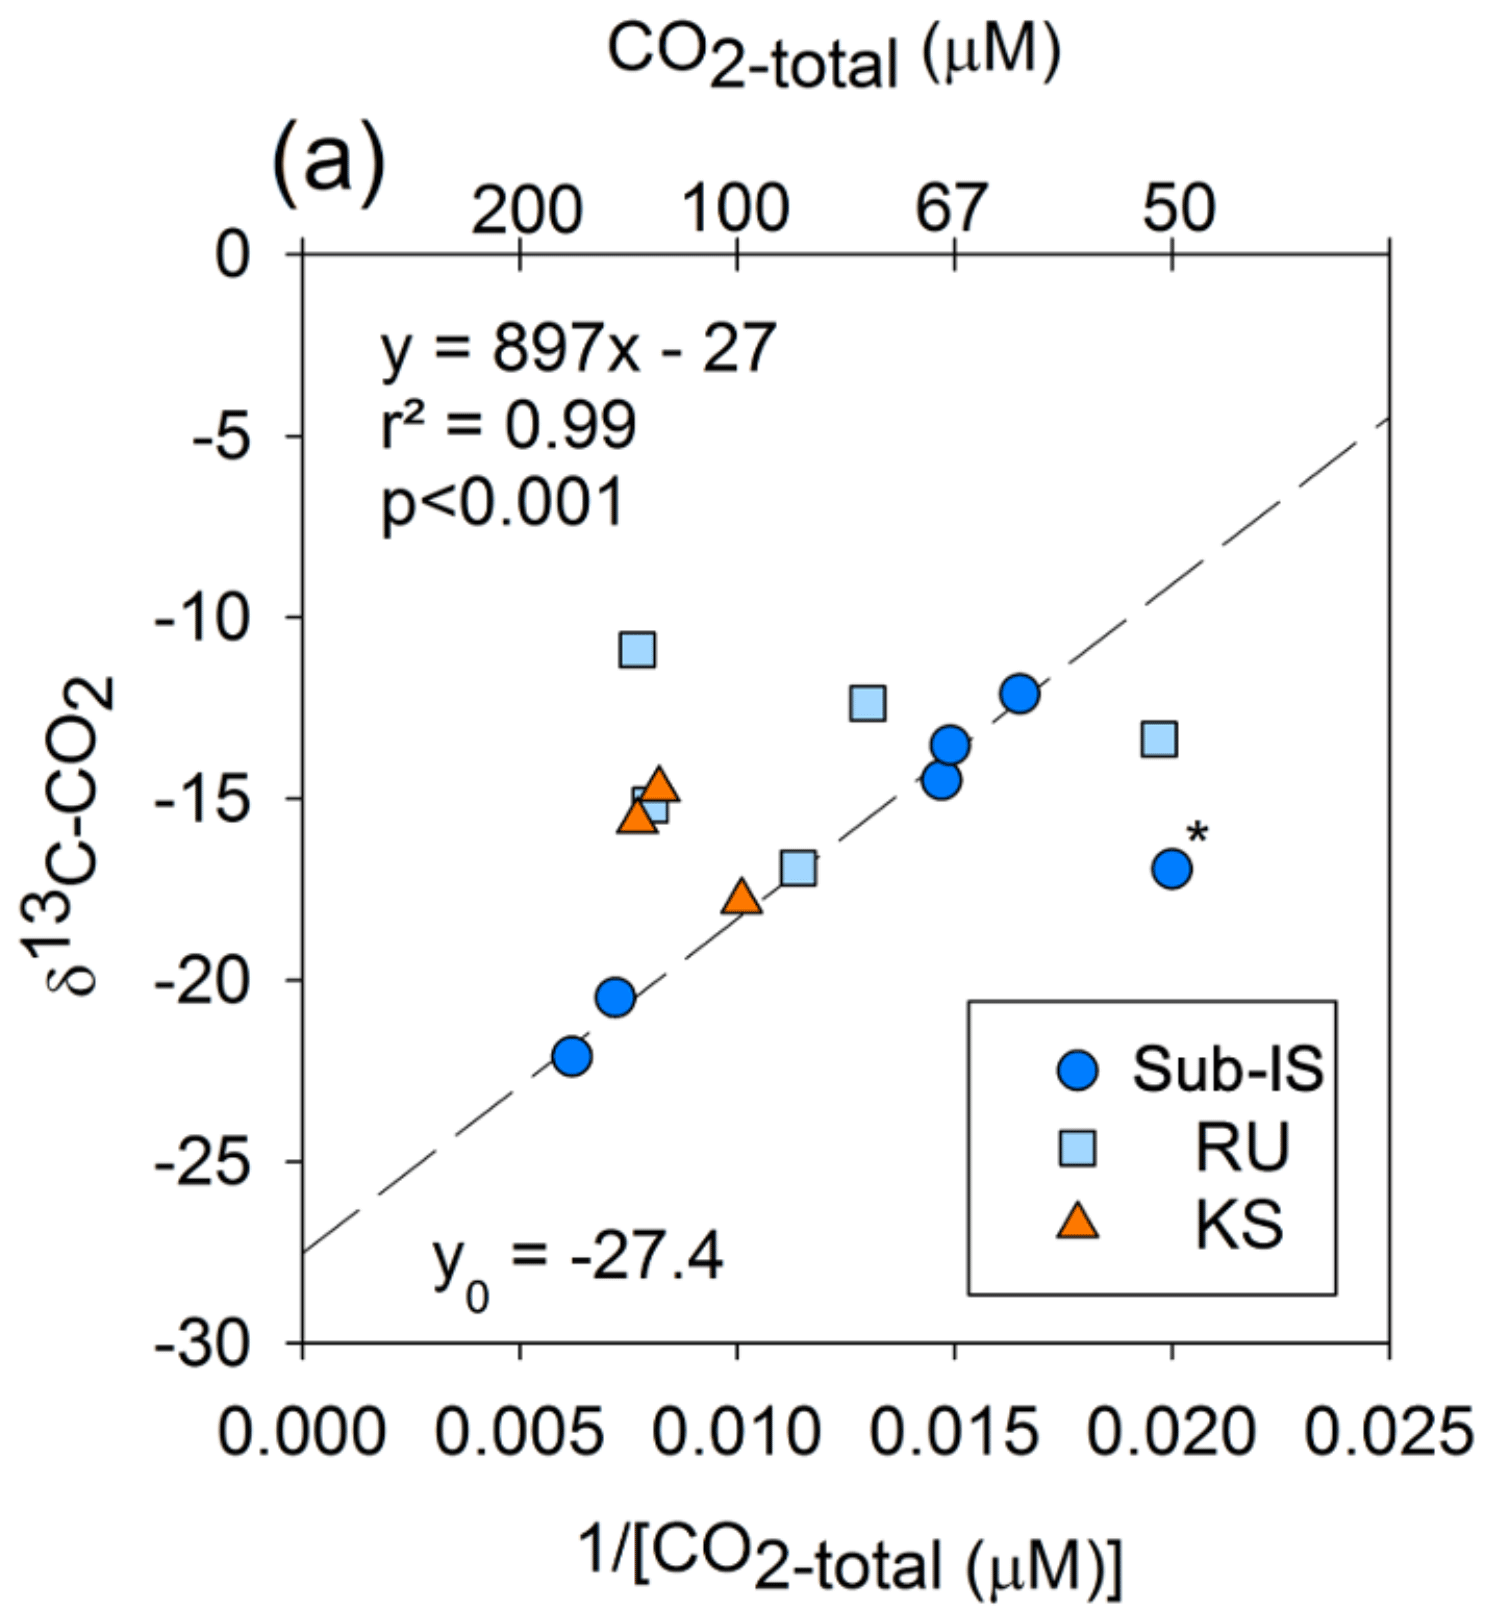
Figure 9Keeling plot indicating correlations between the magnitude of CO2-total and δ13C-CO2 and for sub-Isunnguata (sub-IS), Russell (RU), and Kiattut Sermiat (KS) samples. Asterisk denotes the outlier not included in the regression between CO2-total and δ13C-CO2 for sub-Isunnguata samples. The plotted regression line was constructed using the sub-IS samples only.
While δ13C-CO2 values of Russell and Kiattut Sermiat samples are within the range of sub-Isunnguata samples, suggesting possible contributions of CO2-atm and CO2-OM, scatter in the Keeling plots indicates variability in the CO2 concentration and/or isotopic composition of end-members, or significant contributions of at least one other major subglacial CO2 source. We address both possibilities here. While atmospheric CO2 concentrations and δ13C values should be relatively invariable, CO2-OM may vary both in concentration and isotopic composition, depending on variability in the quantity and composition of organic deposits as well as remineralization rates. For instance, if remineralization largely occurs in hydrologically isolated subglacial meltwater pockets, some variability in the concentration and δ13C-CO2 of CO2-OM is likely. While no data yet exist to characterize the variability in subglacial OM reservoirs, variability in either concentration or isotopic composition of CO2-OM could plausibly result in the scatter shown in Fig. 9. Additional subglacial CO2 sources from ice bubbles, or lithogenic CO2 liberated by mechanical grinding, would be expected to enrich rather than deplete the δ13C-CO2 values of the samples relative to modern atmospheric δ13C-CO2 values. Ice bubbles contain gaseous CO2 at concentrations and isotopic compositions reflecting atmospheric conditions during ice formation. While heterogeneity may result from gas bubbles recording changes in atmospheric CO2, variability in δ13C-CO2 of gas bubble CO2 should be only a few per mill, which is small compared to the variation observed in Russell and Kiattut Sermiat samples (e.g., Tipple et al., 2010; Fig. 9). Gas bubble CO2 should also be 13C-enriched compared to modern atmospheric CO2 due to fossil fuel contributions and thus would be unlikely to cause the observed depletion of 13C in the subglacial water.
Recent work has also highlighted the potential for subglacial mechanical grinding to result in CO2 production through the volatilization of bedrock fluid inclusions (Macdonald et al., 2018). While this process was found to produce sufficient CO2 to drive approximately 20 % of mineral weathering in Svalbard subglacial environments, the expected isotopic composition of lithogenic CO2 is more 13C-enriched than our measured δ13C-CO2 values. For instance, estimates of δ13C for bulk hydrocarbons in fluid inclusions in the Ilímaussaq alkaline complex of South Greenland have values of −4.5 ± 1.5 ‰ (Madsen, 2001), which is close to the δ13C-CO2 of CO2 in fluid inclusions in the Bamble granulite sector of South Norway (6 ‰; Newton et al., 1980). Because mechanical grinding should not fractionate the δ13C-CO2 values (Lüders et al., 2012), our low δ13C-CO2 values suggest this source is small relative to other sources.
One additional source or sink of CO2 to some of our samples is atmospheric exchange as water flows from the subglacial outlet site to our sampling sites. However, atmospheric CO2 exchange after discharge would have the same impact on Keeling plots as atmospheric CO2 exchange prior to discharge. Incorporation of an atmospheric source between the outlet and sample site would be most likely at Kiattut Sermiat, where CO2 concentrations are undersaturated with respect to atmospheric concentrations, which would promote invasion of atmospheric CO2. However, the measured δ13C-CO2 values are more 13C-depleted than modern atmospheric CO2 and are not consistent with atmospheric CO2 as the sole or dominant source of CO2 to these samples (Fig. 9).
While more information is needed to determine all possible sources of CO2 to Russell and Kiattut Sermiat samples, δ13C-CO2 values of samples from both sites imply mixing between a 13C-depleted CO2 source, such as OM remineralization, and one or more 13C-enriched CO2 sources, such as atmospheric or lithogenic CO2. Similar to CH4, concentrations and isotopic compositions of gases may be impacted by atmospheric exchange between the glacial outlet and our sampling locations, which would alter dissolved CO2 concentrations and δ13C-CO2 compositions to values more similar to atmospheric values. Therefore, we are unable to distinguish the impacts of the atmospheric exchange that occurs prior to discharge from the exchange that occurs between discharge and our sampling locations. However, the impact of this exchange should be relatively constant between sampling times and sampling locations; therefore, outgassing would not account for temporal or spatial variability in CO2 concentrations or isotopic compositions between sites.
4.2.2 Subglacial CO2 sink: mineral weathering reactions
Mineral weathering leads to net CO2 consumption in all subglacial discharge samples (Fig. 6), and thus the measured CO2 concentrations at glacial outlets represent only a fraction of the total CO2 that would have been present in the absence of mineral weathering reactions (CO2-total; Eq. 10). Net consumption occurs because the CO2 source from CarbSA is ubiquitously low compared to sinks from either CarbCA or SilCA (Fig. 6b). The range in Net CO2-MW is similar between subglacial discharge sites (between 10–150 µM; Fig. 6a), but average values increase from Kiattut Sermiat to Russell to sub-Isunnguata, likely reflecting the relative weatherability of alkaline igneous rocks, granulite facies gneisses, and amphibolite facies gneisses. Kiattut Sermiat is characterized by a relatively high proportion of CarbCA compared to sub-Isunnguata and Russell sites, which may arise from the presence of trace carbonates in abundant and readily weatherable basaltic intrusions as has been implicated in other studies (Urra et al., 2019). The relatively greater influence of carbonate dissolution compared to silicate dissolution on Total CO2-MW at Kiattut Sermiat may also relate to more rapid dissolution kinetics of carbonates, which allow carbonate dissolution to have a large influence on major cation and anion load even when carbonates are only present in trace amounts (Deuerling et al., 2019; Tranter, 2005). At sub-Isunnguata and Russell sites, SilCA has a greater influence than CarbCA on Total CO2-MW, which could result from either a lower abundance of trace carbonates to participate in weathering reactions or relatively longer subglacial residence times that would allow a greater accumulation of silicate weathering products.
Despite the impact of CarbCA on Total CO2-MW at Kiattut Sermiat compared to sub-Isunnguata and Russell sites, CarbSA is notably lower at Kiattut Sermiat than other sites and suggests a limited role for sulfuric acid weathering that may relate to subglacial sulfide oxidation dynamics. Lower abundances of sulfide minerals in the subglacial environment may limit the production of sulfuric acid and could result from differences in lithology between sites, the depletion of sulfide minerals due to prior weathering (Graly et al., 2014), or weathering occurring in anoxic environments that limit the oxidation of sulfide to sulfuric acid (Deuerling et al., 2019). The kinetics of sulfide oxidation may also significantly differ between sites depending on the relative contributions of abiotic compared to microbially mediated sulfide oxidation, as microbially mediated sulfide oxidation is several orders of magnitude faster than abiotic sulfide oxidation (Boyd et al., 2014; Harrold et al., 2016). Rapid microbially mediated sulfide oxidation has been implicated in the development of anaerobic conditions, which could also support subglacial methanogenesis (Sharp et al., 1999; Stibal et al., 2012; Wadham et al., 2010). Observations of higher CH4 concentrations as well as higher contributions of CarbSA at sub-Isunnguata and Russell compared to Kiattut Sermiat may therefore be linked to subglacial microbial activity, which is known to vary based on factors such as the presence of organic and fine-grained rock flour to serve as growth substrates, insulation from fluctuations in temperature, and delivery of nutrients and organic matter from supraglacial sources (Sharp et al., 1999). If microbially driven, our results suggest possible linkages between microbial processes and subglacial mineral weathering regimes, with significant impacts to both CH4 and CO2 dynamics due to the role of CarbSA as a CO2 source (Table 1).
Whether controlled by geochemical, microbial, or mechanical processes, the relationships between CO2 concentrations and δ13C-CO2 and average daily discharge are similar between sub-Isunnguata and Russell sites (Fig. 8). These similarities suggest that underlying controls in carbonate chemistry may be consistent between sites despite the heterogeneity in measured dissolved CO2 concentrations. For both sub-Isunnguata and Russell sites, mineral weathering reactions consume CO2, which implies contributions from in situ CO2 sources (such as atmospheric CO2 invasion or OM remineralization) to produce measured CO2 concentrations. The different CO2 concentrations observed between sites therefore appear to result from the strength of in situ CO2 sources relative to CO2-MW, both of which impart the greatest chemical change at times of low discharge and high subglacial residence time. At Kiattut Sermiat, where measured CO2 concentrations are lowest, the magnitude of in situ sources is insufficient to maintain atmospheric equilibrium, leading subglacial discharge to be a sink of atmospheric CO2, while CO2-total maintains close to atmospheric equilibrium concentrations at the Russell Glacier. At sub-Isunnguata, however, OM remineralization produces more CO2 than is consumed by mineral weathering and causes meltwater to be a source of CO2 to the atmosphere. This finding implies that subglacial mineral weathering serves to partially or fully consume CO2 produced from in situ sources under the Greenland Ice Sheet but does not always serve to directly consume modern atmospheric CO2.
Subglacial reactions impact the concentrations of CO2 and CH4 in subglacial discharge of the Greenland Ice Sheet, and differences in the relative magnitudes of microbial and geochemical processes result in a high degree of previously unrecognized heterogeneity between glacial discharge sites of the Greenland Ice Sheet. Our results imply a significant role of OM remineralization in driving this heterogeneity and leading to CO2 and CH4 supersaturation at the sub-Isunnguata site and CH4 supersaturation at the Russell site. Heterogeneity may result in significant uncertainty in total greenhouse gas flux estimates from subglacial systems of the Greenland Ice Sheet, which will be an increasingly important carbon flux as the Arctic warms in the coming decades. While heterogeneous, the uncertainty in greenhouse gas fluxes from Greenland Ice Sheet meltwater may be reduced by a better understanding of the controls and variability of the weathering reactions and microbial processes driving heterogeneous gas concentrations. Such a process-based understanding could also improve estimates of the impact of greenhouse gas variability associated with the growth and retreat of continental ice sheets over glacial–interglacial timescales. Subglacial OM remineralization further implies the existence of links between subglacial OM deposits and export of other biogeochemical solutes from the Greenland Ice Sheet, including nutrients as well as redox-sensitive elements. While the export of nutrients from the Greenland Ice Sheet has been the focus of numerous studies (Bhatia et al., 2013; Hawkings et al., 2016; Lawson et al., 2014), little is currently known regarding the role of OM sources in governing these exports. Given the variability in greenhouse gas concentrations observed in this study, constraining the extent of heterogeneity in outlet glaciers of the Greenland Ice Sheet as well as the biogeochemical, hydrologic, and geologic controls of this heterogeneity will be important for upscaling atmospheric fluxes as well as efforts to predict impacts of ice loss on carbon and nutrient budgets due to current and future melting of the Greenland Ice Sheet.
Data are accessible on the Arctic Data Center (https://doi.org/10.18739/A2F76672G, Pain et al., 2019a), including gas and nutrient data (https://cn.dataone.org/cn/v2/resolve/urn:uuid:c1051a07-cbdf-4061-ae44-c1472f61e3fe, last access: 30 March 2021) and major element concentrations used for geochemical modeling (https://cn.dataone.org/cn/v2/resolve/urn:uuid:65d272f6-d280-4fcc-8aaa-4805f12ca6ae, last access: 30 March 2021).
The supplement related to this article is available online at: https://doi.org/10.5194/tc-15-1627-2021-supplement.
JBM and EEM participated in conceptualization, data collection, data interpretation, reviewing and editing the manuscript, and acquired the funding for this project. AR provided the discharge data that were used in analyses of discharge–concentration relationships. SR participated in data collection and early interpretation and presentation of results. AJP participated in conceptualization, data collection, analysis, and interpretation, and took the lead on writing the manuscript with contributions from JBM, EEM, and AR.
The authors declare that they have no conflict of interest.
We acknowledge the members of our field teams: Daniel Fischer, Fabio Da Prat, Hailey Hall, Mark Robbins, Scott Schnur, and Michelle D. Kisbye. Additional invaluable support was provided by Steven DiEgidio, Nini Frydkjær Brandt, Inga Gisladottir, and Jacky Simoud. We are grateful for the excellent field support provided by the Kangerlussuaq International Science Station and Polar Field Services (CH2M Hill). This work was funded by the National Science Foundation grant (ANS-1603452). We are grateful to Marek Stibal and an anonymous reviewer who made suggestions that greatly improved the manuscript, as well as Joseph Graly for assistance in improving the accuracy of presented geographical locations.
This research has been supported by the National Science Foundation (grant no. ANS-1603452).
This paper was edited by Elizabeth Bagshaw and reviewed by Marek Stibal and one anonymous referee.
Andrews, L. C., Catania, G. A., Hoffman, M. J., Gulley, J. D., Lüthi, M. P., Ryser, C., Hawley, R. L., and Neumann, T. A.: Direct observations of evolving subglacial drainage beneath the Greenland Ice Sheet, Nature, 514, 80–83, https://doi.org/10.1038/nature13796, 2015.
Anklin, M., Barnola, J. M., Schwander, J., Stauffer, B., and Raynaud, D.: Processes affecting the CO2 concentrations measured in Greenland ice, Tellus B, 47, 461–470, https://doi.org/10.1034/j.1600-0889.47.issue4.6.x, 1995.
Berner, R. A., Lasaga, A. C., and Garrels, R. M.: The carbonate-silicate geochemical cycle and its effect on atmospheric carbon dioxide over the past 100 million years, Am. J. Sci., 283, 641–683, https://doi.org/10.2475/ajs.283.7.641, 1983.
Bhatia, M. P., Kujawinski, E. B., Das, S. B., Breier, C. F., Henderson, P. B., and Charette, M. A.: Greenland meltwater as a significant and potentially bioavailable source of iron to the ocean, Nat. Geosci., 6, 274–278, https://doi.org/10.1038/ngeo1746, 2013.
Boyd, E. S., Hamilton, T. L., Havig, J. R., Skidmore, M. L., and Shock, E. L.: Chemolithotrophic primary production in a subglacial ecosystem, Appl. Environ. Microb., 80, 6146–6153, https://doi.org/10.1128/AEM.01956-14, 2014.
Christiansen, J. R. and Jørgensen, C. J.: First observation of direct methane emission to the atmosphere from the subglacial domain of the Greenland Ice Sheet, Sci. Rep.-UK, 8, 2–7, https://doi.org/10.1038/s41598-018-35054-7, 2018.
Cowton, T., Nienow, P., Sole, A., Wadham, J., Lis, G., Bartholomew, I., Mair, D., and Chandler, D.: Evolution of drainage system morphology at a land – terminating Greenlandic outlet glacier, J. Geophys. Res.-Earth, 118, 29–41, https://doi.org/10.1029/2012JF002540, 2013.
Da Prat, F. A. and Martin, E.: Weathering in the Glacial Foreland of Southern and Western Greenland, UF Center for Undergraduate Research, University of Florida, Florida, USA, 20, https://doi.org/10.32473/ufjur.v20i2.106168, 2019.
de Visscher, A., de Pourcq, I., and Chanton, J.: Isotope fractionation effects by diffusion and methane oxidation in landfill cover soils, J. Geophys. Res.-Atmos., 109, D18111, https://doi.org/10.1029/2004JD004857, 2004.
Deuerling, K. M., Martin, J. B., Martin, E. E., and Scribner, C. A.: Hydrologic exchange and chemical weathering in a proglacial watershed near Kangerlussuaq, west Greenland, J. Hydrol., 556, 220–232, https://doi.org/10.1016/j.jhydrol.2017.11.002, 2018.
Deuerling, K. M., Martin, J. B., Martin, E. E., Abermann, J., Myreng, S. M., Petersen, D., and Rennermalm, A. K.: Chemical weathering across the western foreland of the Greenland Ice Sheet, Geochim. Cosmochim. Ac., 245, 426–440, https://doi.org/10.1016/j.gca.2018.11.025, 2019.
Dieser, M., Broemsen, E. L. J. E., Cameron, K. A., King, G. M., Achberger, A., Choquette, K., Hagedorn, B., Sletten, R., Junge, K., and Christner, B. C.: Molecular and biogeochemical evidence for methane cycling beneath the western margin of the Greenland Ice Sheet, ISME J., 8, 2305–2316, https://doi.org/10.1038/ismej.2014.59, 2014.
Graly, J. A., Humphrey, N. F., Landowski, C. M., and Harper, J. T.: Chemical weathering under the Greenland Ice Sheet, Geology, 42, 551–554, https://doi.org/10.1130/G35370.1, 2014.
Graly, J. A., Harrington, J., and Humphrey, N.: Combined diurnal variations of discharge and hydrochemistry of the Isunnguata Sermia outlet, Greenland Ice Sheet, The Cryosphere, 11, 1131–1140, https://doi.org/10.5194/tc-11-1131-2017, 2017.
Harrold, Z. R., Skidmore, M. L., Hamilton, T. L., Desch, L., Amada, K., Van Gelder, W., Glover, K., Roden, E. E. and Boyd, E. S.: Aerobic and anaerobic thiosulfate oxidation by a cold-adapted, subglacial chemoautotroph, Appl. Environ. Microb., 82, 1486–1495, https://doi.org/10.1128/AEM.03398-15, 2016.
Hasholt, B., Van As, D., Mikkelsen, A. B., Mernild, S. H., and Yde, J. C.: Observed sediment and solute transport from the Kangerlussuaq sector of the Greenland Ice Sheet (2006–2016), Arct. Antarct. Alp. Res., 50, S100009, https://doi.org/10.1080/15230430.2018.1433789, 2018.
Hawkings, J., Wadham, J., Tranter, M., Telling, J., and Bagshaw, E.: The Greenland Ice Sheet as a hot spot of phosphorus weathering and export in the Arctic, Global Biogeochem. Cy., 30, 191–210, https://doi.org/10.1002/2015GB005237, 2016.
Henriksen, N., Higgins, A. K., Kalsbeek, F., and Pulvertaft, T. C. R.: Greenland from Archaean to Quaternary, Descriptive text to the 1995 Geological map of Greenland, 1:2 500 000, 2nd Edn., GEUS Bull., 18(SE-MONOGRAPH), 1–126, https://doi.org/10.34194/geusb.v18.4993, 2009.
Herschy, R.: Hydrometry, edn. 2, John Wiley & Sons, Ltd., Chichester, New York, Winheim, Brisbane, Singapore, Toronto, 1999.
Hindshaw, R. S., Rickli, J., Leuthold, J., Wadham, J., and Bourdon, B.: Identifying weathering sources and processes in an outlet glacier of the Greenland Ice Sheet using Ca and Sr isotope ratios, Geochim. Cosmochim. Ac., 145, 50–71, https://doi.org/10.1016/j.gca.2014.09.016, 2014.
ISO GUIDE 98-3: Evaluation of measurement data–guide to the expression of uncertainty in measurement, International Organization for Standardization (ISO), Geneva, 120 pp., 2008.
Kalsbeek, F. and Taylor, P. N.: Isotopic and chemical variation in granites across a Proterozoic continental margin – the Ketilidian mobile belt of South Greenland, Earth Planet. Sc. Lett., 73, 65–80, 1985.
Keeling, C. D.: The concentration and isotopic abundances of atmospheric carbon dioxide in rural areas, Geochim. Cosmochim. Ac., 13, 322–334, https://doi.org/10.1016/0016-7037(58)90033-4, 1958.
Lamarche-Gagnon, G., Wadham, J., Sherwood Lollar, B., Arndt, S., Fietzek, P., Beaton, A. D., Tedstone, A. J., Telling, J., Bagshaw, E. A., Hawkings, J. R., Kohler, T. J., Zarsky, J. D., Mowlem, M. C., Anesio, A. M., and Stibal, M.: Greenland melt drives continuous export of methane from the ice-sheet bed, Nature, 565, 73–77, https://doi.org/10.1038/s41586-018-0800-0, 2019.
Larsen, N. K., Find, J., Kristensen, A., Bjørk, A. A., Kjeldsen, K. K., Odgaard, B. V., Olsen, J., and Kjær, K. H.: Holocene ice marginal fluctuations of the Qassimiut lobe in South Greenland, Sci. Rep.-UK, 6, 22362, https://doi.org/10.1038/srep22362, 2016.
Lawson, E. C., Wadham, J. L., Tranter, M., Stibal, M., Lis, G. P., Butler, C. E. H., Laybourn-Parry, J., Nienow, P., Chandler, D., and Dewsbury, P.: Greenland Ice Sheet exports labile organic carbon to the Arctic oceans, Biogeosciences, 11, 4015–4028, https://doi.org/10.5194/bg-11-4015-2014, 2014.
Lindbäck, K., Pettersson, R., Hubbard, A. L., Doyle, S. H., As, D., Mikkelsen, A. B., and Fitzpatrick, A. A.: Subglacial water drainage, storage, and piracy beneath the Greenland ice sheet, Geophys. Res. Lett., 42, 7606–7614, https://doi.org/10.1002/2015GL065393, 2015.
Lüders, V., Plessen, B., and di Primio, R.: Stable carbon isotopic ratios of CH4-CO2-bearing fluid inclusions in fracture-fill mineralization from the Lower Saxony Basin (Germany) – A tool for tracing gas sources and maturity, Mar. Petrol. Geol., 30, 174–183, https://doi.org/10.1016/j.marpetgeo.2011.10.006, 2012.
Ludwig, W., Amiotte Suchet, P., and Probst, J.-L.: Enhanced chemical weathering of rocks during the last glacial maximum: a sink for atmospheric CO2?, Chem. Geol., 159, 147–161, https://doi.org/10.1016/S0009-2541(99)00038-8, 1999.
Macdonald, M. L., Wadham, J. L., Telling, J., and Skidmore, M. L.: Glacial Erosion Liberates Lithologic Energy Sources for Microbes and Acidity for Chemical Weathering Beneath Glaciers and Ice Sheets, Front. Earth Sci., 6, 212, https://doi.org/10.3389/feart.2018.00212, 2018.
Madsen, J. K.: A review of the composition and evolution of hydrocarbon gases during solidification of the Ilímaussaq alkaline complex, South Greenland, Geology of Greenland Survey Bulletin, 190, 159–166, https://doi.org/10.34194/ggub.v190.5187, 2001.
Mahieu, K., De Visscher, A., Vanrolleghem, P. A., and Van Cleemput, O.: Modelling of stable isotope fractionation by methane oxidation and diffusion in landfill cover soils, Waste Manage., 28, 1535–1542, https://doi.org/10.1016/j.wasman.2007.06.003, 2008.
Mauritz, M., Celis, G., Ebert, C., Hutchings, J., Ledman, J., Natali, S. M., Pegoraro, E., Salmon, V. G., Schädel, C., Taylor, M., and Schuur, E. A. G.: Using Stable Carbon Isotopes of Seasonal Ecosystem Respiration to Determine Permafrost Carbon Loss, J. Geophys. Res.-Biogeo., 124, 46–60, https://doi.org/10.1029/2018JG004619, 2019.
Mouginot, J., Rignot, E., Bjørk, A. A., van den Broeke, M., Millan, R., Morlighem, M., Noël, B., Scheuchl, B., and Wood, M.: Forty-six years of Greenland Ice Sheet mass balance from 1972 to 2018, P. Natl. Acad. Sci. USA, 116, 201904242, https://doi.org/10.1073/pnas.1904242116, 2019.
Myrttinen, A., Becker, V., and Barth, J. A. C.: A review of methods used for equilibrium isotope fractionation investigations between dissolved inorganic carbon and CO2, Earth-Sci. Rev., 115, 192–199, https://doi.org/10.1016/j.earscirev.2012.08.004, 2012.
Newton, R. C., Smith, J. V., and Windley, B. F.: Carbonic metamorphism, granulites and crustal growth, Nature, 288, 45–50, https://doi.org/10.1038/288045a0, 1980.
Pain, A., Martin, J., Martin, E., and Rahman, S.: Hydrogeochemistry of Greenlandic proglacial and nonglacial streams, 2017–2018, Arctic Data Center, https://doi.org/10.18739/A2PC2T94T, 2019a.
Pain, A. J., Martin, J. B., and Young, C. R.: Sources and sinks of CO2 and CH4 in siliciclastic subterranean estuaries, Limnol. Oceanogr., 64, 1500–1514, https://doi.org/10.1002/lno.11131, 2019b.
Parkhurst, L.: Geochemical mole-balance modeling with uncertain data, Water Resour. Res., 33, 1957–1970, 1997.
Preuss, I., Knoblauch, C., Gebert, J., and Pfeiffer, E.-M.: Improved quantification of microbial CH4 oxidation efficiency in arctic wetland soils using carbon isotope fractionation, Biogeosciences, 10, 2539–2552, https://doi.org/10.5194/bg-10-2539-2013, 2013.
Ravn, N. R., Elberling, B., and Michelsen, A.: Arctic soil carbon turnover controlled by experimental snow addition, summer warming and shrub removal, Soil Biol. Biochem., 142, 107698, https://doi.org/10.1016/j.soilbio.2019.107698, 2020.
Rennermalm, A. K., Smith, L. C., Chu, V. W., Forster, R. R., Box, J. E., and Hagedorn, B.: Proglacial river stage, discharge, and temperature datasets from the Akuliarusiarsuup Kuua River northern tributary, Southwest Greenland, 2008–2011, Earth Syst. Sci. Data, 4, 1–12, https://doi.org/10.5194/essd-4-1-2012, 2012.
Rennermalm, A. K., Smith, L. C., Chu, V. W., Box, J. E., Forster, R. R., Van den Broeke, M. R., van As, D., and Moustafa, S. E.: Evidence of meltwater retention within the Greenland ice sheet, The Cryosphere, 7, 1433–1445, https://doi.org/10.5194/tc-7-1433-2013, 2013.
Repo, M. E., Huttunen, J. T., Naumov, A. V., Chichulin, A. V., Lapshina, E. D., Bleuten, W., and Martikainen, P. J.: Release of CO2 and CH4 from small wetland lakes in western Siberia, Tellus B, 59, 788–796, https://doi.org/10.1111/j.1600-0889.2007.00301.x, 2007.
Ruskeeniemi, T., Engström, J., Lehtimäki, J., Vanhala, H., Korhonen, K., Kontula, A., Claesson Liljedahl, L., Näslund, J. O., and Pettersson, R.: Subglacial permafrost evidencing re-advance of the Greenland Ice Sheet over frozen ground, Quaternary Sci. Rev., 199, 174–187, https://doi.org/10.1016/j.quascirev.2018.09.002, 2018.
Sharp, M., Parkes, J., Cragg, B., Fairchild, I. J., Lamb, H., and Tranter, M.: Widespread bacterial populations at glacier beds and their relationship to rock weathering and carbon cycling, Geology, 27, 107–110, https://doi.org/10.1130/0091-7613(1999)027<0107:WBPAGB>2.3.CO;2, 1999.
Solinst: Solinst Technical Bulletin: Understanding Pressure Sensor Accuracy, Precision, Resolution & Drift, available at: https://www.solinst.com/products/dataloggers-and-telemetry/3001-levelogger-series/technical-bulletins/understanding-pressure-sensor-drift.pdf (last access: 30 March 2021), 2017.
St Pierre, K. A., St Louis, V. L., Schiff, S. L., Lehnherr, I., Dainard, P. G., Gardner, A. S., Aukes, P. J. K., and Sharp, M. J.: Proglacial freshwaters are significant and previously unrecognized sinks of atmospheric CO2, P. Natl. Acad. Sci. USA, 116, 17690–17695, https://doi.org/10.1073/pnas.1904241116, 2019.
Stibal, M., Wadham, J. L., Lis, G. P., Telling, J., Pancost, R. D., Dubnick, A., Sharp, M. J., Lawson, E. C., Butler, C. E. H., Hasan, F., Tranter, M., and Anesio, A. M.: Methanogenic potential of Arctic and Antarctic subglacial environments with contrasting organic carbon sources, Global Change Biol., 18, 3332–3345, https://doi.org/10.1111/j.1365-2486.2012.02763.x, 2012.
Tipple, B. J., Meyers, S. R., and Pagani, M.: Carbon isotope ratio of Cenozoic CO2: A comparative evaluation of available geochemical proxies, Paleoceanography, 25, PA3202, https://doi.org/10.1029/2009pa001851, 2010.
Tranter, M.: Geochemical Weathering in Glacial and Proglacial Environments, in: Surface and Ground Water, Weathering, and Soils: Treatise on Geochemistry, edited by: Drever, J. I., Elsevier Amsterdam, https://doi.org/10.1016/B0-08-043751-6/05078-7, 2005.
Upton, B. G. J., Emeleus, C. H., Heaman, L. M., Goodenough, K. M., and Finch, A. A.: Magmatism of the mid-Proterozoic Gardar Province, South Greenland: Chronology, petrogenesis and geological setting, Lithos, 68, 43–65, https://doi.org/10.1016/S0024-4937(03)00030-6, 2003.
Urra, A., Wadham, J., Hawkings, J. R., Telling, J., Hatton, J. E., Yde, J. C., Hasholt, B., van As, D., Bhatia, M. P., and Nienow, P.: Weathering Dynamics Under Contrasting Greenland Ice Sheet Catchments, Front. Earth Sci., 7, 299, https://doi.org/10.3389/feart.2019.00299, 2019.
van As, D., Bech Mikkelsen, A., Holtegaard Nielsen, M., Box, J. E., Claesson Liljedahl, L., Lindbäck, K., Pitcher, L., and Hasholt, B.: Hypsometric amplification and routing moderation of Greenland ice sheet meltwater release, The Cryosphere, 11, 1371–1386, https://doi.org/10.5194/tc-11-1371-2017, 2017.
van As, D., Hasholt, B., Ahlstrøm, A. P., Box, J. E., Cappelen, J., Colgan, W., Fausto, R. S., Mernild, S. H., Bech, A., Noël, B. P. Y., Petersen, D., and van den Broeke, M. R.: Reconstructing Greenland Ice Sheet meltwater discharge through the Watson River (1949–2017), Arct. Antarct. Alp. Res., 50, e1433799-1–e1433799-10, https://doi.org/10.1080/15230430.2018.1433799, 2018.
van de Wal, R. S. W. and Russell, A. J.: A comparison of energy balance calculations, measured ablation and meltwater runoff near Sondre Stromfjord, West Greenland, Global Planet. Change, 9, 29–38, https://doi.org/10.1016/0921-8181(94)90005-1, 1994.
van Gool, J. A., Alsop, G. I., Arting, U. E., Garde, A. A., Knudsen, C., Krawiec, A. W., Mazur, S., Nygaard, J., Piazolo, S., and Thomas, C. W.: Precambrian geology of the northern Nagssugtoqidian orogen, West Greenland: mapping in the Kangaatsiaq area, Geology of Greenland Survey Bulletin, 191, 13–23, 2002.
Wadham, J. L., Tranter, M., Tulaczyk, S., and Sharp, M.: Subglacial methanogenesis: A potential climatic amplifier?, Global Biogeochem. Cy., 22, GB2021, https://doi.org/10.1029/2007GB002951, 2008.
Wadham, J. L., Tranter, M., Skidmore, M., Hodson, A. J., Priscu, J., Lyons, W. B., Sharp, M., Wynn, P., and Jackson, M.: Biogeochemical weathering under ice: Size matters, 24, GB3025, https://doi.org/10.1029/2009GB003688, 2010.
Wadham, J. L., Hawkings, J. R., Tarasov, L., Gregoire, L. J., Spencer, R. G. M., Gutjahr, M., Ridgwell, A., and Kohfeld, K. E.: Ice sheets matter for the global carbon cycle, Nat. Commun., 10, 3567, https://doi.org/10.1038/s41467-019-11394-4, 2019.
Walker, J. C. G., Hays, P. B., and Kasting, J. F.: A negative feedback mechanism for the long-term stabilization of earth's surface temperature, J. Geophys. Res., 86, 9776–9782, 1981.
Warren, C. R. and Glasser, N. F.: Contrasting response of south Greenland glaciers to recent climatic change, Arctic Alpine Res., 24, 124–132, https://doi.org/10.2307/1551532, 1992.
Whiticar, M. J.: Carbon and hydrogen isotope systematics of bacterial formation and oxidation of methane, Chem. Geol., 161, 291–314, 1999.
Whiticar, M. J. and Schoell, M.: Biogenic methane formation in marine and freshwater environments: CO2 reduction vs. acetate fermentation – Isotope evidence, Geochim. Cosmochim. Ac., 50, 693–709, 1986.
Wimpenny, J., James, R. H., Burton, K. W., Gannoun, A., Mokadem, F., and Gíslason, S. R.: Glacial effects on weathering processes: New insights from the elemental and lithium isotopic composition of West Greenland rivers, Earth Planet. Sc. Lett., 290, 427–437, https://doi.org/10.1016/j.epsl.2009.12.042, 2010.
Wimpenny, J., Burton, K. W., James, R. H., Gannoun, A., Mokadem, F., and Gíslason, S. R.: The behaviour of magnesium and its isotopes during glacial weathering in an ancient shield terrain in West Greenland, Earth Planet. Sc. Lett., 304, 260–269, https://doi.org/10.1016/j.epsl.2011.02.008, 2011.
Winsor, K., Carlson, A. E., and Rood, D. H.: 10Be dating of the Narsarsuaq moraine in southernmost Greenland: Evidence for a late-Holocene ice advance exceeding the Little Ice Age maximum, Quaternary Sci. Rev., 98, 135–143, https://doi.org/10.1016/j.quascirev.2014.04.026, 2014.
World Meteorological Organization (WMO): Manual on Stream Gauging, Volume I: Fieldwork, 2010.
Yde, J. C., Knudsen, N. T., Hasholt, B., and Mikkelsen, A. B.: Meltwater chemistry and solute export from a Greenland Ice Sheet catchment, Watson River, West Greenland, J. Hydrol., 519, 2165–2179, https://doi.org/10.1016/j.jhydrol.2014.10.018, 2014.