the Creative Commons Attribution 4.0 License.
the Creative Commons Attribution 4.0 License.
 | 31 Mar 2021
Methane pathways in winter ice of a thermokarst lake–lagoon–coastal water transect in north Siberia
Ines Spangenberg
Ellen Damm
Ingeborg Bussmann
Hanno Meyer
Susanne Liebner
Michael Angelopoulos
Boris K. Biskaborn
Mikhail N. Grigoriev
Guido Grosse
The thermokarst lakes of permafrost regions play a major role in the global carbon cycle. These lakes are sources of methane to the atmosphere although the methane flux is restricted by an ice cover for most of the year. How methane concentrations and fluxes in these waters are affected by the presence of an ice cover is poorly understood. To relate water body morphology, ice formation and methane to each other, we studied the ice of three different water bodies in locations typical of the transition of permafrost from land to ocean in a continuous permafrost coastal region in Siberia. In total, 11 ice cores were analyzed as records of the freezing process and methane composition during the winter season. The three water bodies differed in terms of connectivity to the sea, which affected fall freezing. The first was a bay underlain by submarine permafrost (Tiksi Bay, BY), the second a shallow thermokarst lagoon cut off from the sea in winter (Polar Fox Lagoon, LG) and the third a land-locked freshwater thermokarst lake (Goltsovoye Lake, LK). Ice on all water bodies was mostly methane-supersaturated with respect to atmospheric equilibrium concentration, except for three cores from the isolated lake. In the isolated thermokarst lake, ebullition from actively thawing basin slopes resulted in the localized integration of methane into winter ice. Stable isotope signatures indicated that methane in the lagoon ice was oxidized to concentrations close to or below the calculated atmospheric equilibrium concentration. Increasing salinity during winter freezing led to a micro-environment on the lower ice surface where methane oxidation occurred and the lagoon ice functioned as a methane sink. In contrast, the ice of the coastal marine environment was slightly supersaturated with methane, consistent with the brackish water below. Our interdisciplinary process study shows how water body morphology affects ice formation which mitigates methane fluxes to the atmosphere.
- Article
(6011 KB) - Full-text XML
- BibTeX
- EndNote


As a large reservoir of organic carbon, permafrost holds a potential positive feedback to climate warming (Strauss et al., 2013; Hugelius et al., 2014; Schuur et al., 2015). Amplified warming of the atmosphere in the Arctic is increasing ground temperatures and thawing permafrost (Biskaborn et al., 2019). As a consequence organic carbon stored in permafrost becomes available for microbial decomposition, leading to the release of greenhouse gases (Koven et al., 2011; Knoblauch et al., 2018). Therefore, these regions play an important role in the global carbon cycle and contribute to global warming (Schuur et al., 2015; Turetsky et al., 2019; Walter Anthony et al., 2018).
Arctic aquatic systems in permafrost regions are sources of atmospheric methane (CH4). CH4 is produced mainly in carbon-bearing sediments under anoxic conditions (e.g., Conrad, 2009) and transported from sediment layers into the water column by diffusion and ebullition (Bastviken et al., 2008). The amount of CH4 emitted from Arctic water bodies to the atmosphere is uncertain but is expected to increase as a result of Arctic warming (Bastviken et al., 2004; Boereboom et al., 2012; Cole et al., 2007; Walter et al., 2006). Northern high latitude lakes – i.e., thermokarst lakes – are suggested to act as CH4 sources throughout the entire annual cycle (Wik et al., 2016) and may have particularly high CH4 emissions if organic-rich permafrost deposits underneath are actively thawing and microbial decomposition results in CH4 production (Langer et al., 2015; Walter et al., 2007). Recent studies have illustrated the importance of the winter period for annual CH4 and CO2 emission budgets of northern lakes (Denfeld et al., 2018; Powers and Hampton, 2016; Zimov et al., 2006); however, processes controlling CH4 and CO2 dynamics in the frozen period are still poorly understood. While gas may easily escape from thermokarst lakes to the atmosphere in ice- and snow-free periods, an ice cover forms a barrier for 9 to 10 months in winter. During the wintertime, gas bubbles are trapped under and eventually within the ice (Walter et al., 2008). Production of CH4 is temperature-dependent (Kelly and Chynoweth, 1981; Zeikus and Winfrey, 1976), but CH4 ebullition and accumulation under the ice suggest that CH4 production continues during winter (Walter Anthony et al., 2010). Waters that are deep enough do not freeze to the bottom in winter and are therefore underlain with unfrozen sediment (talik) (Arp et al., 2016) in which microbes may produce CH4 in winter. Since seasonally ice-covered lakes dominate permafrost landscapes, they are expected to play a major role in changing the global carbon cycle (Grosse et al., 2013; Wik et al., 2016; Bartsch et al., 2017).
Previous work has focused mostly on the occurrence and spatial variability of CH4 bubbles within lake ice (Walter et al., 2006; Wik et al., 2011; Sasaki et al., 2009; Walter Anthony et al., 2010) and CH4 accumulation underneath lake ice (Boereboom et al., 2012; Langer et al., 2015). CH4 distribution in ice cores and under ice were analyzed in shallow ice-covered tundra lakes in Alaska (Phelps et al., 1998) and in the ice covering four lakes in a discontinuous permafrost area (Boereboom et al., 2012). In both studies the accumulation of CH4 in and under the ice during winter was observed. Their findings are corroborated by other studies, which also show a high CH4 emission rate during ice melt in spring in high-latitude lakes (Karlsson et al., 2013; Michmerhuizen et al., 1996). CH4 may be oxidized at the ice–water interface (Canelhas et al., 2016; Rudd and Hamilton, 1978), but the conditions required are poorly understood (Canelhas et al., 2016; Winkel et al., 2019). While Phelps et al. (1998) suggest that methanotrophic activity is generally inhibited in cold waters, CH4 has been found to oxidize at temperatures as low as 2 ∘C (Canelhas et al., 2016).
Few studies compare ice from different types of Arctic water bodies, crossing freshwater-to-saline gradients. CH4 oxidation observed in Arctic shelf waters (Damm et al., 2005; Mau et al., 2013; Bussmann et al., 2017), in sediments (Overduin et al., 2015; Winkel et al., 2018), in lake water (Bastviken et al., 2002; Lidstrom and Somers, 1984) and at the water–ice interface (Martinez-Cruz et al., 2015; Canelhas et al., 2016) may limit the emissions of CH4 during spring ice melt (Canelhas et al., 2016). The transition from lakes to lagoons and further to bay waters via sea level rise and permafrost coastal erosion (e.g., Romanovskii et al., 2000) may substantially change the CH4 budget of aquatic systems in permafrost regions, since CH4 fluxes in lake systems are coupled to the lake's limnological and geomorphological characteristics (Bastviken et al., 2008, 2004; Boereboom et al., 2012; Denfeld et al., 2018).
To improve our understanding of how water bodies function as CH4 sources or sinks, this study aims to clarify the role of the winter ice cover for CH4 in three different stages in the lake–lagoon–shelf transition in a region of thawing permafrost in northeast Siberia. Our objective is to demonstrate how CH4 is distributed within seasonal ice from Tiksi Bay (BY), Polar Fox Lagoon (LG) and Goltsovoye Lake (LK), (1) to better understand how freezing processes differ between the three water bodies, (2) to better understand how freezing affects CH4 concentration in the ice and (3) to gain an indication of which processes change CH4 concentration during the ice cover season.
This study was conducted on the southern coast of the Bykovsky Peninsula at 71.7–71.8∘ N, 129.0–129.5∘ E, in northeastern Siberia. The Bykovsky Peninsula is located northeast of the harbour town of Tiksi and approximately 20 km southeast of the Lena River delta, central Laptev Sea (Grosse et al., 2007). This area offers a rich variety of water body types in the continuous permafrost zone, with ice-rich Yedoma permafrost, a widespread, organic-rich and syngenetic fine-grained deposit that accumulated during the glacial age in the unglaciated regions of Siberia and central Alaska (Zimov et al., 2006; Schirrmeister et al., 2011). Most thermokarst lakes in the region originated in the early Holocene when surficial permafrost thawed. Their sediments typically have total organic carbon (TOC) contents of about 5–30 % by weight (Biskaborn et al., 2012, 2013a, b, 2016; Schleusner et al., 2015). The southern coastline erodes at mean rates of between 0.25 and 0.60 m yr−1 and can intersect these water bodies, draining them or leading to the formation of thermokarst lagoons (Lantuit et al., 2011; Schirrmeister et al., 2018). For our study, we selected three water bodies at the southern coast of the Bykovsky Peninsula: Tiksi Bay, Polar Fox Lagoon and Goltsovoye Lake (Fig. 1, Table 1).
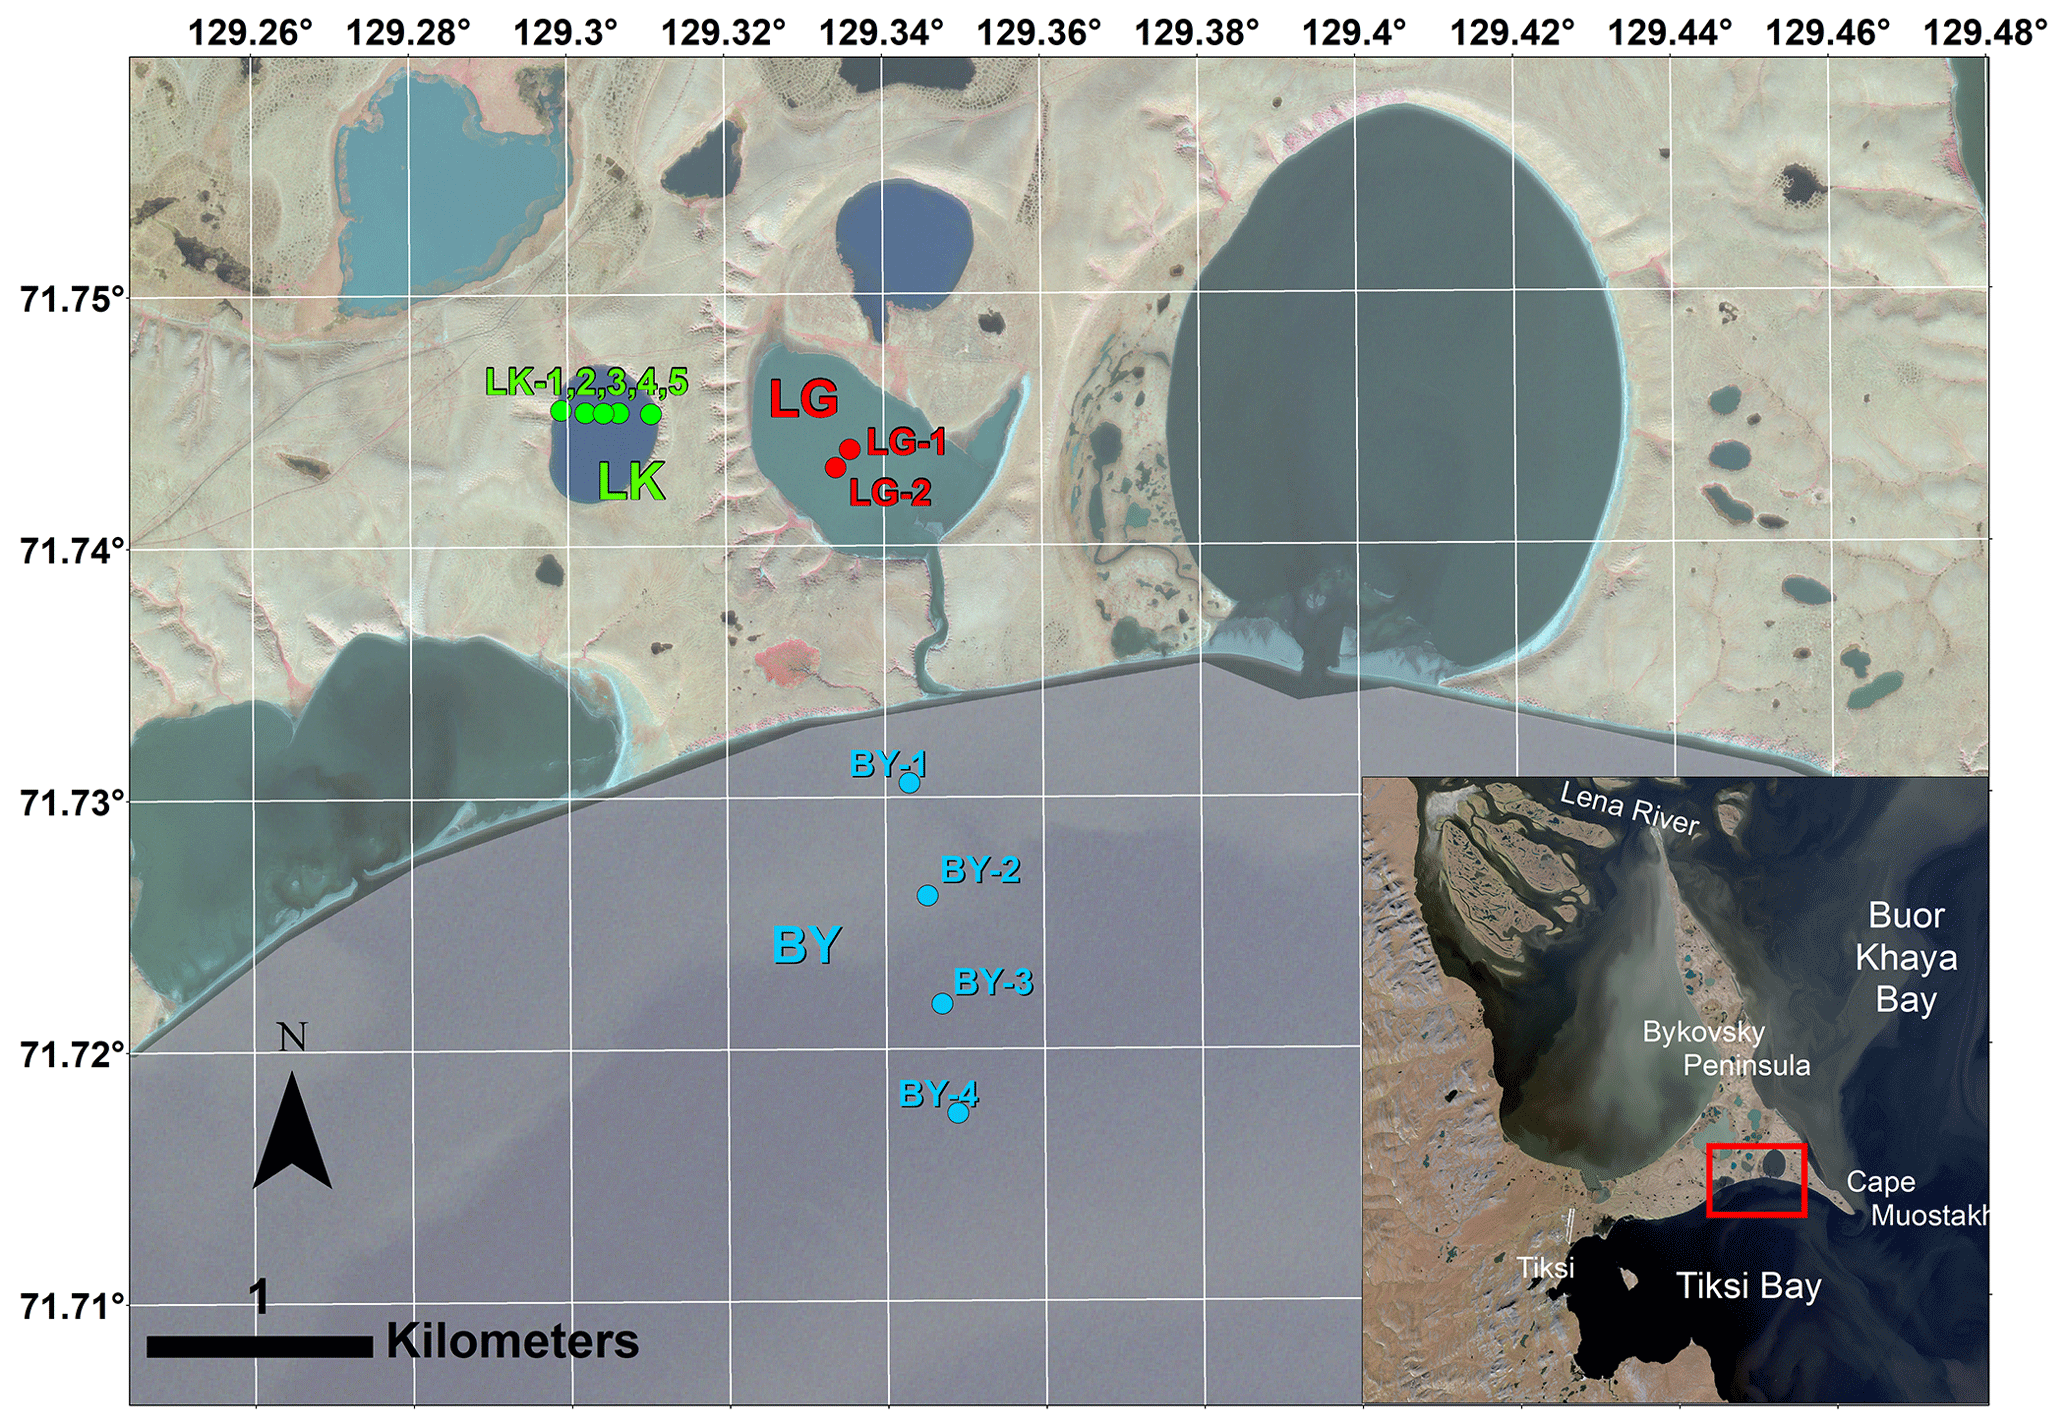
Figure 1Study design on the Bykovsky Peninsula, NE Yakutia, Arctic Russia. Ice cores were recovered from three water bodies on the southern shore of the Bykovsky Peninsula: Tiksi Bay (BY: blue), Polar Fox Lagoon (LG: red) and Goltsovoye Lake (LK: green dots). Imagery in the main map is from WorldView-3 on 2 September 2016 (© DigitalGlobe).
BY is a relatively shallow bay (mostly less than 11 m deep, and less than 5 m deep below our ice core transect) underlain by submarine permafrost (Overduin et al., 2016), at least close to the coast. The bay is located to the southeast of Bykovskaya Channel, which is the major outlet of the Lena River through which about 25 % of the Lena’s spring discharge exits the delta (Fedorova et al., 2015). The mixing of fresh water from the Lena River with saline water from the Laptev Sea results in brackish conditions in the bay (Lantuit et al., 2011). BY belongs to the Buor Khaya Bay region, where the water column is usually stratified, with a colder, more saline water layer underlying the brackish surface layer (Overduin et al., 2016). The depth of the pycnocline varies between 4 and 10 m, and the stratification may be disturbed by storm events. Storm surges also influence sea level at BY, with maximum wave heights of about 1.1 m. Sea level oscillations driven by tides have little influence on the height of storm surges, and the Bykovsky Peninsula region is characterized by a micro-tidal regime (Lantuit et al., 2011).
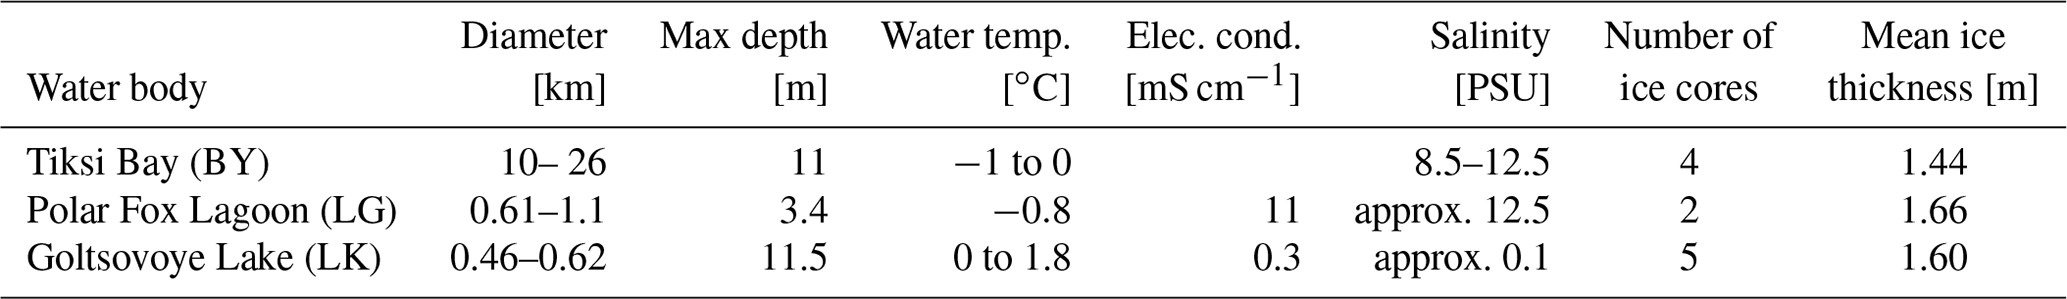
LG is connected to BY by a shallow channel (Fig. 1) and therefore dominated by brackish water. LG represents a transitional stage between a land-bound thermokarst lake and a bay: a thermokarst lagoon. Its morphology suggests that it formed in a thermokarst depression. The lower extent of ice-rich sediments and the thermokarst lake beds can lie below sea level (Günther et al., 2015). LK is a slightly oval-shaped thermokarst lake about 0.5 km in diameter, surrounded by Yedoma uplands at various stages of degradation. The studied water bodies differ markedly in their characteristics, as shown in Table 1.
Table 1Hydrological characteristics of water bodies of the southern Bykovsky Peninsula from which ice cores were taken for this study in spring 2017. Water temperatures and electrical conductivity for LG and LK were measured in the field below the ice; temperature and salinity for BY are from Charkin et al. (2017).
3.1 Sampling in the field
Ice cores were collected from BY in a transect roughly perpendicular to the shore (Fig. 1). Ice growth slows when heat flux to the atmosphere decreases in spring and is negligible by the end of April at our study site. Ice was cored at close to its maximum thickness to include almost the entire winter record of freezing. Ice cores were drilled on 8 April 2017 (LK), 10 April 2017 (LG) and 11 April 2017 (BY). For LG, two cores were recovered near the centre of the lagoon. The sites of the five cores from LK were located along an approximately west–east transect across the lake. Mean water body ice thicknesses measured during ice core sampling lie within 0.22 m of each other (Table 1).
The ice cores were taken with a Kovacs Mark II ice coring system (0.09 m diameter), between 5 and 12 April 2017. Cores were collected in triplicate from each sampling site. One core was only used for temperature measurements. Immediately after sampling, vertical temperature profiles were obtained by drilling small holes every 0.1 m, at the boundaries between sample sections, and inserting a digital thermometer. Average temperature values were calculated for each section from the top and bottom depths. The other cores were wrapped in sealed plastic tubes and packed in thermally insulated boxes for transport in a frozen state to the climate-controlled room where sub-sampling took place. Water column temperature and electrical conductivity (EC) were measured with a SonTek CastAway instrument at each coring site. The accuracy and resolution of the device were ±0.05 and 0.01 ∘C, respectively, for temperature and ±5 and 1 µS cm−1 for EC. Further details on fieldwork and sampling can be found in the expedition report (Strauss et al., 2018).
3.2 Sample processing
Cores were stored in freezers after drilling and in a permafrost tunnel (lednik) while waiting for transport, and then they were transported by refrigerated truck at freezer temperatures (−18 ∘C). We did not record temperature during transport, but based on a comparison of photos of the cores after drilling and in the laboratory the structure and ice morphology of the cores were preserved during transport. We are therefore confident that not even surficial melting took place. The ice cores were cut with a band saw in a climate-controlled room at −15 ∘C. Cores were cut at 0.1 m intervals, and samples were stored for melting in gas-tight TEDLAR bags at 4 to 7 ∘C for 1–2 d. The closed bags were evacuated with a vacuum pump prior to melting, which effectively sealed the inner bag surface to the ice. After melting, the water was gently mixed and poured through tubing, without producing bubbles, into 100 mL glass bottles for the analysis of CH4 concentrations and δ13C in CH4. The remaining water was distributed into other sample bottles for hydrochemical measurements of pH, EC, dissolved organic carbon (DOC), δ18O and δD isotopes of water, as well as major anion and cation concentrations. Data points in the graphs of variation against core depth thus represent a mean value for a section of usually 0.1 m within an ice core.
3.3 Hydrochemistry in ice
EC and temperature of LK and LG were measured in the field. EC and pH of ice core samples were measured with a WTW Multilab 540 device directly after bottling. The salinity was calculated from the values of the EC referenced to 25 ∘C after McDougall and Barker (2011). The samples of DOC were filtered with 0.7 µm pore size glass fibre filters (the filters were first rinsed with 20 mL of the sample), filled in 20 mL glass-headspace vials and closed with aluminum crimp caps. For preservation, 50 µL of 30 % supra-pure HCl was added to the sample before closing the vials, which were stored at 4 ∘C until measurement. DOC was measured with a Shimadzu Total Organic Carbon Analyzer (TOC-VCPH). An average of three to five injections per sample was used as the measured value. The detection limit for the DOC measurement is 0.25 mg L−1, and the uncertainty of the measurement was ±10 % for values higher than 1.5 mg L−1 and ±15–20 % for values lower than 1.5 mg L−1.
3.4 Stable water isotopes
To measure stable water isotopes (δ18O, δD), 10 mL of the untreated water sample was filled in 10 mL PE narrow-neck bottles. Seven samples with EC higher than 3 mS cm−1 were measured with an Isotope Ratio Mass Spectrometer (IRMS: Finnigan Delta-S), using equilibration techniques (Meyer et al., 2000). All other samples had lower EC and were measured with an Ultra High-Precision Isotopic Water Analyzer (PICARRO L2130-i, coupled with an autosampler and vaporizer using cavity ring-down spectroscopy). The internal precision of the H and O isotope measurements is better than ±0.8 and ±0.10 ‰, respectively. The oxygen and hydrogen isotopic compositions are given relative to Vienna Standard Mean Ocean Water (VSMOW) using the conventional δ notation.
Stable water isotopes have been widely used in palaeoclimate and palaeohydrological research as isotope fractionation is temperature-dependent. The mean annual δ18O of precipitation is positively correlated with the mean annual air temperature, and hence snow typically has a strong isotope variability as well as relatively low (or light) values, particularly at high latitudes (Dansgaard, 1964). Stable water isotopes can also be used to trace water phase changes, i.e., prior to freezing and during freezing as these are accompanied by kinetic isotope fractionation processes (Souchez and Jouzel, 1984; Lacelle, 2011). The comparison of δ18O to δD provides valuable information about the freezing characteristics, as the regression line (freezing line) is usually lower than that of the global meteoric water line (GMWL, slope =8). Slope values in the range of 6 to 7.3 can be interpreted as freezing under equilibrium freezing conditions (Lacelle, 2011). The extent of fractionation in the water–ice system critically depends on the velocity and rate of freezing (Gibson and Prowse, 1999; Tranter, 2011), which in turn is directly connected to the thermal conditions and the water availability of a given system. Isotopic fractionation during freezing is accompanied by heavier isotope composition for the first ice and lighter isotope composition for the last ice formed (Gibson and Prowse, 1999, 2002). In this study, we differentiate between open- and closed-system freezing. In an open system, the water source under the ice and hence the isotope composition of the ice formed both remain largely constant, differing from closed-system freezing where the isotopic composition of the water pool changes as freezing progresses. Furthermore, the water isotopic signature may be indicative of the mixing of different water masses (endmembers), i.e., precipitation with surface water. The isotopic signature is then indicative of the relative contribution of each endmember and preceding natural isotopic fractionation processes, which changes if the endmembers' specific isotope composition differs. The δ18O−δD values in ice may also be directly influenced by precipitation if liquid or solid precipitation falls on the ice layer and freezes to a part of the ice. In a co-isotope plot, δ18O and δD of precipitation generally have values that lie on or near to the GMWL (Craig, 1961).
3.5 Dissolved CH4 concentration
Meltwater from the TEDLAR bags was filled until overflowing into 100 mL glass bottles, sealed with butyl stoppers and crimped with aluminum plugs. The samples were kept cool (4 ∘C) and dark until the measurements in the lab (max 2 months between sampling and measurement). For CH4 concentration, 5 mL of N2 was added into the vials, whereby 5 mL of water was removed from the vials. Afterward, the water sample equilibrated with the N2 by shaking for 1 h at room temperature. Then, 1.5 mL of the equilibrated air was removed from the vial and injected into a gas chromatograph (GC; Agilent 8900) with a flame ionization detector (FID). For gas chromatographic separation, a packed column (Porapak Q 80/100 mesh) was used. The GC was operated isothermally (60 ∘C), and the FID was held at 250 ∘C. Standards of different gas mixtures between 1.665 and 100 ppm that were used for calibration yielded standard deviations of <0.3 ppm. The GC precision had an error of 1 %. Forty-six percent (n=74) of the samples had CH4 concentrations below the lowest standard of 1.665 ppm (ranging from 0.7 to 1.6 ppm), while 11 % (n=18) had concentrations exceeding the highest standard (ranging from 105 to 2723 ppm).
3.6 Carbon isotopes of CH4
The carbon isotopic composition of CH4 () was measured on the same day and from the same bottle as the CH4 concentrations, to assure comparability of the data. After measuring the CH4 concentration, 20 mL of N2 was added to the sample bottle to increase the headspace of the bottle for stable carbon isotope measurements. The bottle was shaken for at least 30 min. Twenty millilitres of gas was removed with a glass syringe by adding 20 mL of Milli-Q water at the same time to equilibrate pressure. was determined using a Finnigan Delta plus XP mass spectrometer. The extracted gas was purged and trapped with PreCon equipment (Finnigan) to pre-concentrate the sample. The carbon isotopic ratios are given relative to the Vienna Pee Dee Belemnite (VPDB) standard using the conventional δ notation. The analytical error of the analyses is ±1.5 ‰ for values. CH4 concentration in nanomolar (nM) was calculated with the Bunsen solubility coefficient of Wiesenburg and Guinasso (1979).
For all water bodies, a Rayleigh distillation model of the type discussed by Coleman et al. (1981) and used by Damm et al. (2005, 2015) was calculated:
where α is the isotope fractionation factor, f is the fraction of the CH4 remaining and ()0 is the initial isotopic composition. For the Rayleigh model, bacterial oxidation was assumed to be the only CH4 sink, with no further inputs or mixing that would affect the isotopic composition of CH4.
3.7 Bubble transect
To gain insight into the type and spatial distribution of CH4 bubbles trapped in the ice of LK, a CH4 bubble transect was mapped. Snow was cleared from a lake ice transect of 70 m length and 1.4 m width, starting 30 m from the northwest shoreline aiming towards the lake centre (Figs. 2, 3). A GoPro Hero 7 camera was used to take overlapping photos of the transect from approx. 1.7 m vertical height along the entire transect to photographically record the CH4 bubble patches captured in the lake ice that are associated with seep types. A measurement tape at the side of the cleared transect area served as a scale in the images and to measure the sizes of seeps and bubble types. The images were orthorectified and mosaicked in the image rectification software AGISoft Professional, and the georeferenced mosaic was imported to a desktop geographical information system (ArcGIS, version 10.4). CH4 seep types were classified and mapped following Walter Anthony and Anthony (2013). The distance to the shoreline of seep classes was calculated in ArcGIS using the “near” function. We chose 14 distance classes in a kernel density estimation guided by two criteria: (1) only allow bin size in which each bin is represented by seep data, and (2) maximize visualization of the density trend over the profile. The kernel density estimation was calculated with R (a free software environment with interpreted computer language for statistical computing and graphics, https://www.r-project.org/, last access: 15 February 2021).
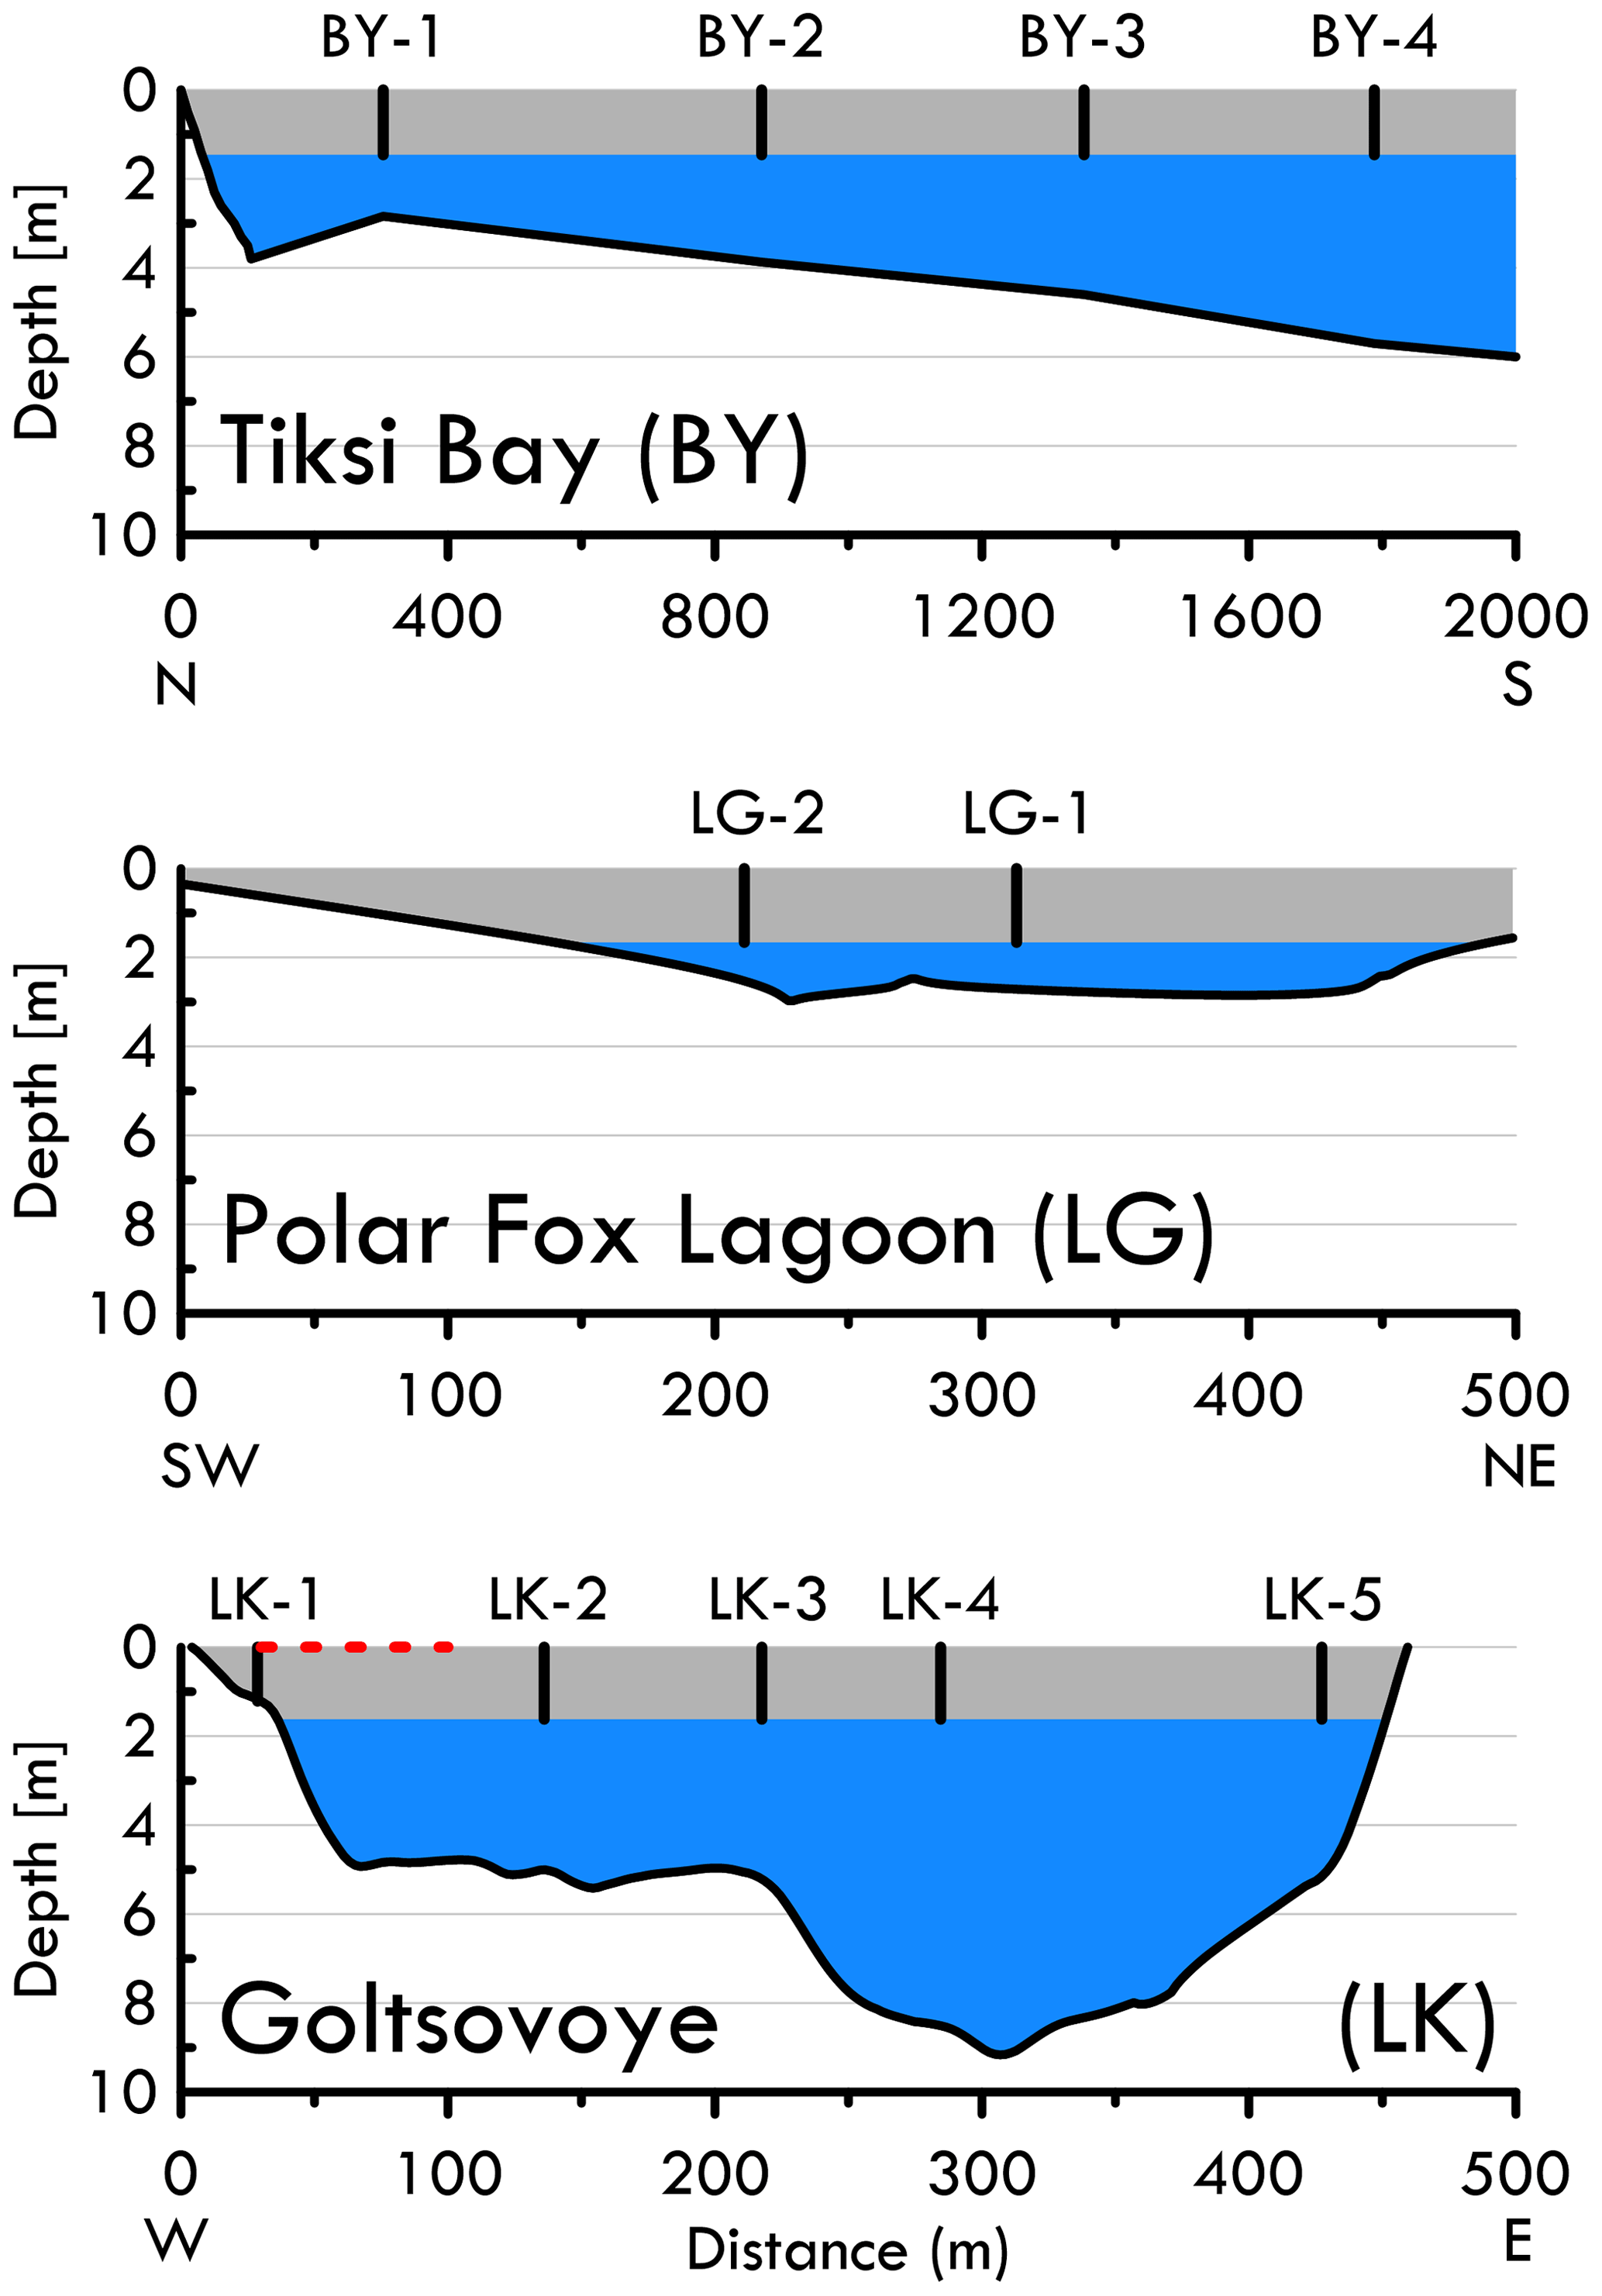
Figure 2Cross sections of the bathymetry of the Tiksi Bay (BY) profile (N to S), Polar Fox Lagoon (LG) from southwest to northeast and Goltsovoye Lake (LK) along the coring transect (W to E). Positions of the ice cores are indicated as numbered vertical lines in the ice layer (grey shading shows mean water body ice thickness), and the water column below the ice is indicated in blue. The position of the bubble transect at Goltsovoye Lake is represented with a dashed red line.
4.1 Ice morphology
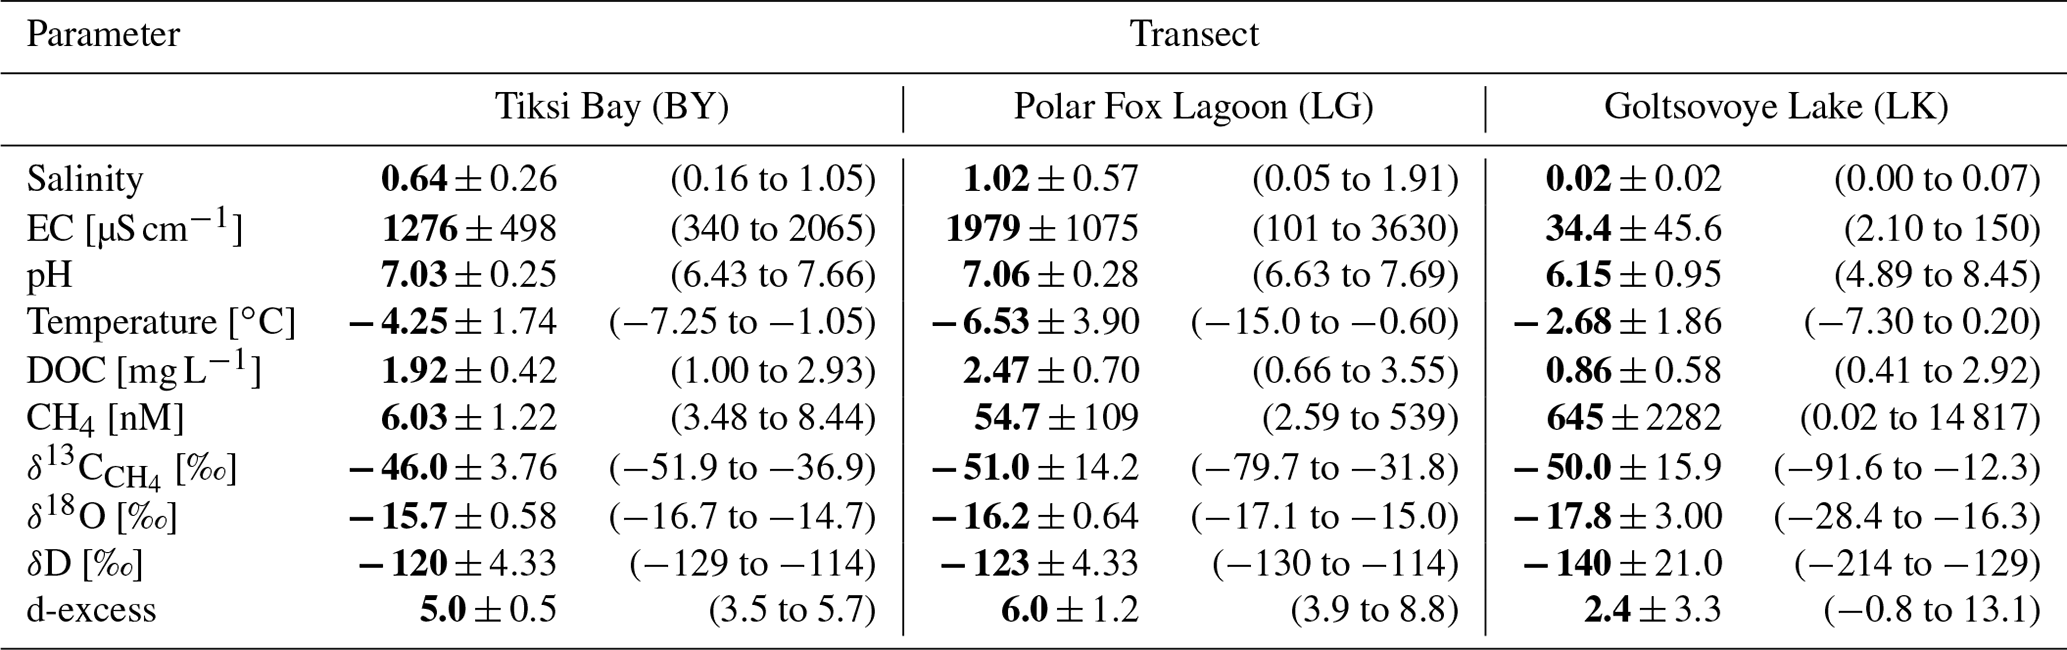
We compared the variability of measured parameters within each ice core as a function of depth below the ice surface and between sets of cores from each water body. For a simple comparison between ice cores and the three water bodies, mean values and the range (min and max values) were calculated for every location (Table 2). The length of the ice cores ranged from 1.1 to 1.97 m, corresponding to total ice thicknesses. Mean lengths were 1.44 m in BY, 1.66 m in LG and 1.6 m in LK. The ice of all cores from BY was nontransparent, with a high concentration of enclosed gas bubbles. The uppermost 0.03 m (BY-4) to 0.1 m (BY-2) was identified as regelation ice from snowmelt based on the appearance of the ice during sampling.
On the ice of BY, the snow thickness ranged from 0.11 m (BY-4) to 0.32 m (BY-2). For LG, the ice of the two cores was clear and contained inclusions of elongated gas bubbles. The uppermost 0.03 m of core LG-1 appeared milky white. The difference in snow thickness above the two cores was quite large: 0.08 m (LG-2) and 0.2 m (LG-1). For LK, the ice morphology was heterogeneous. LK-2 appeared transparent white, while LK-1 included small, elongated air bubbles, and the uppermost 0.05 m was regelation ice from snowmelt. The ice of core LK-4 appeared whiter below a depth of 1.11 m, while LK-5 was milky white from the surface down to a depth of ca. 1.12 to 1.14 m. The snow cover was hard-packed and characterized by different melt forms. Snow was either absent (LK-2 and LK-3) or 0.15 m (LK-4), 0.23 m (LK-1) and 0.92 m (LK-5) thick. None of the cores contained algae inclusions (Strauss et al., 2018).
4.2 Spatial bubble distribution
In the total snow-cleared transect area of 89.2 m2 we found 29 seeps of class A and 5 seeps of class B (Fig. 3), but none of the larger class C or hot spots (Walter Anthony and Anthony, 2013). The average density of class A seeps in the observed area was 0.33 seeps m−2. Seep density of class B was more than 6 times lower (0.05 seeps m−2), and the total seep density over the transect (classes A+B) was 0.39 seeps m−2. The distribution of seep density along the transect showed no linear or homogeneous pattern.

Figure 3Distribution of CH4 seeps of class A and B (Walter Anthony and Anthony, 2013) in Goltsovoye Lake (LK) perpendicular to the northwestern shore in a snow-cleared area of 70×1.4 m. Bars represent the frequency of seeps A and B given as probability. The black line shows the kernel density function (Gaussian kernel performed on distances to shore; width is 34 data points).
4.3 Hydrochemistry of the ice
4.3.1 Electrical conductivity (EC)
The four cores of the bay (BY) had EC values ranging from 340 to 2065 µS cm−1 (Table 2) and similar vertical trends: the EC increased with depth in the upper portion (until approximately 80–90 cm) and then decreased in the lower portion of the cores (>80–90 cm) (Fig. 4). For the two lagoon cores (LG), the EC ranged from 101 to 3630 µS cm−1 (Table 2). In both cores, EC showed a similar increase with depth (Fig. 4): the EC was lower in the upper portion of the ice and highest at the bottom. In the lake (LK), EC was uniformly distributed with depth, and values ranged from 2.10 to 150 µS cm−1. EC measured in the ice of the freshwater LK was low compared to the other two marine-influenced locations.
Table 2The mean ± SD values and ranges (in parentheses) of measured parameters for all ice core samples for each transect are shown.
4.3.2 Temperature
Figure 4 shows the ice temperatures measured in the field. Overall, the temperature for all ice cores increased with depth (Fig. 4), a reflection of the temperature offset between air and water at the end of winter. Ice temperatures for BY ranged from −7.3 ∘C at the surface to −1.1 ∘C at the bottom (Table 2). For both cores in LG, the temperature ranged from −15.1 ∘C (first 0.1 m) to −0.6 ∘C (bottom depths) (Table 2). The temperature of the four cores of LK was in the range from −7.3 to 0.20 ∘C (Table 2).
4.3.3 Dissolved organic carbon (DOC)
For BY, the DOC concentration ranged from 1.0 to 2.9 mg L−1 (Table 2, Fig. 4). For the cores of LG, DOC concentrations increased with depth, with values up to 3.6 mg L−1 in the lower ice. In the upper ice, DOC concentrations were highly variable and ranged from 0.7 to 3.3 mg L−1 (0–60 cm) (Fig. 4). DOC concentrations were between 0.7 and 3.6 mg L−1 for both cores, with a mean value of 2.5±0.7 mg L−1 (Table 2). The lowest DOC concentrations (0.4 mg L−1) of the three locations were observed at LK, where the mean concentration of all samples was 0.9±0.6 mg L−1 (Table 2).
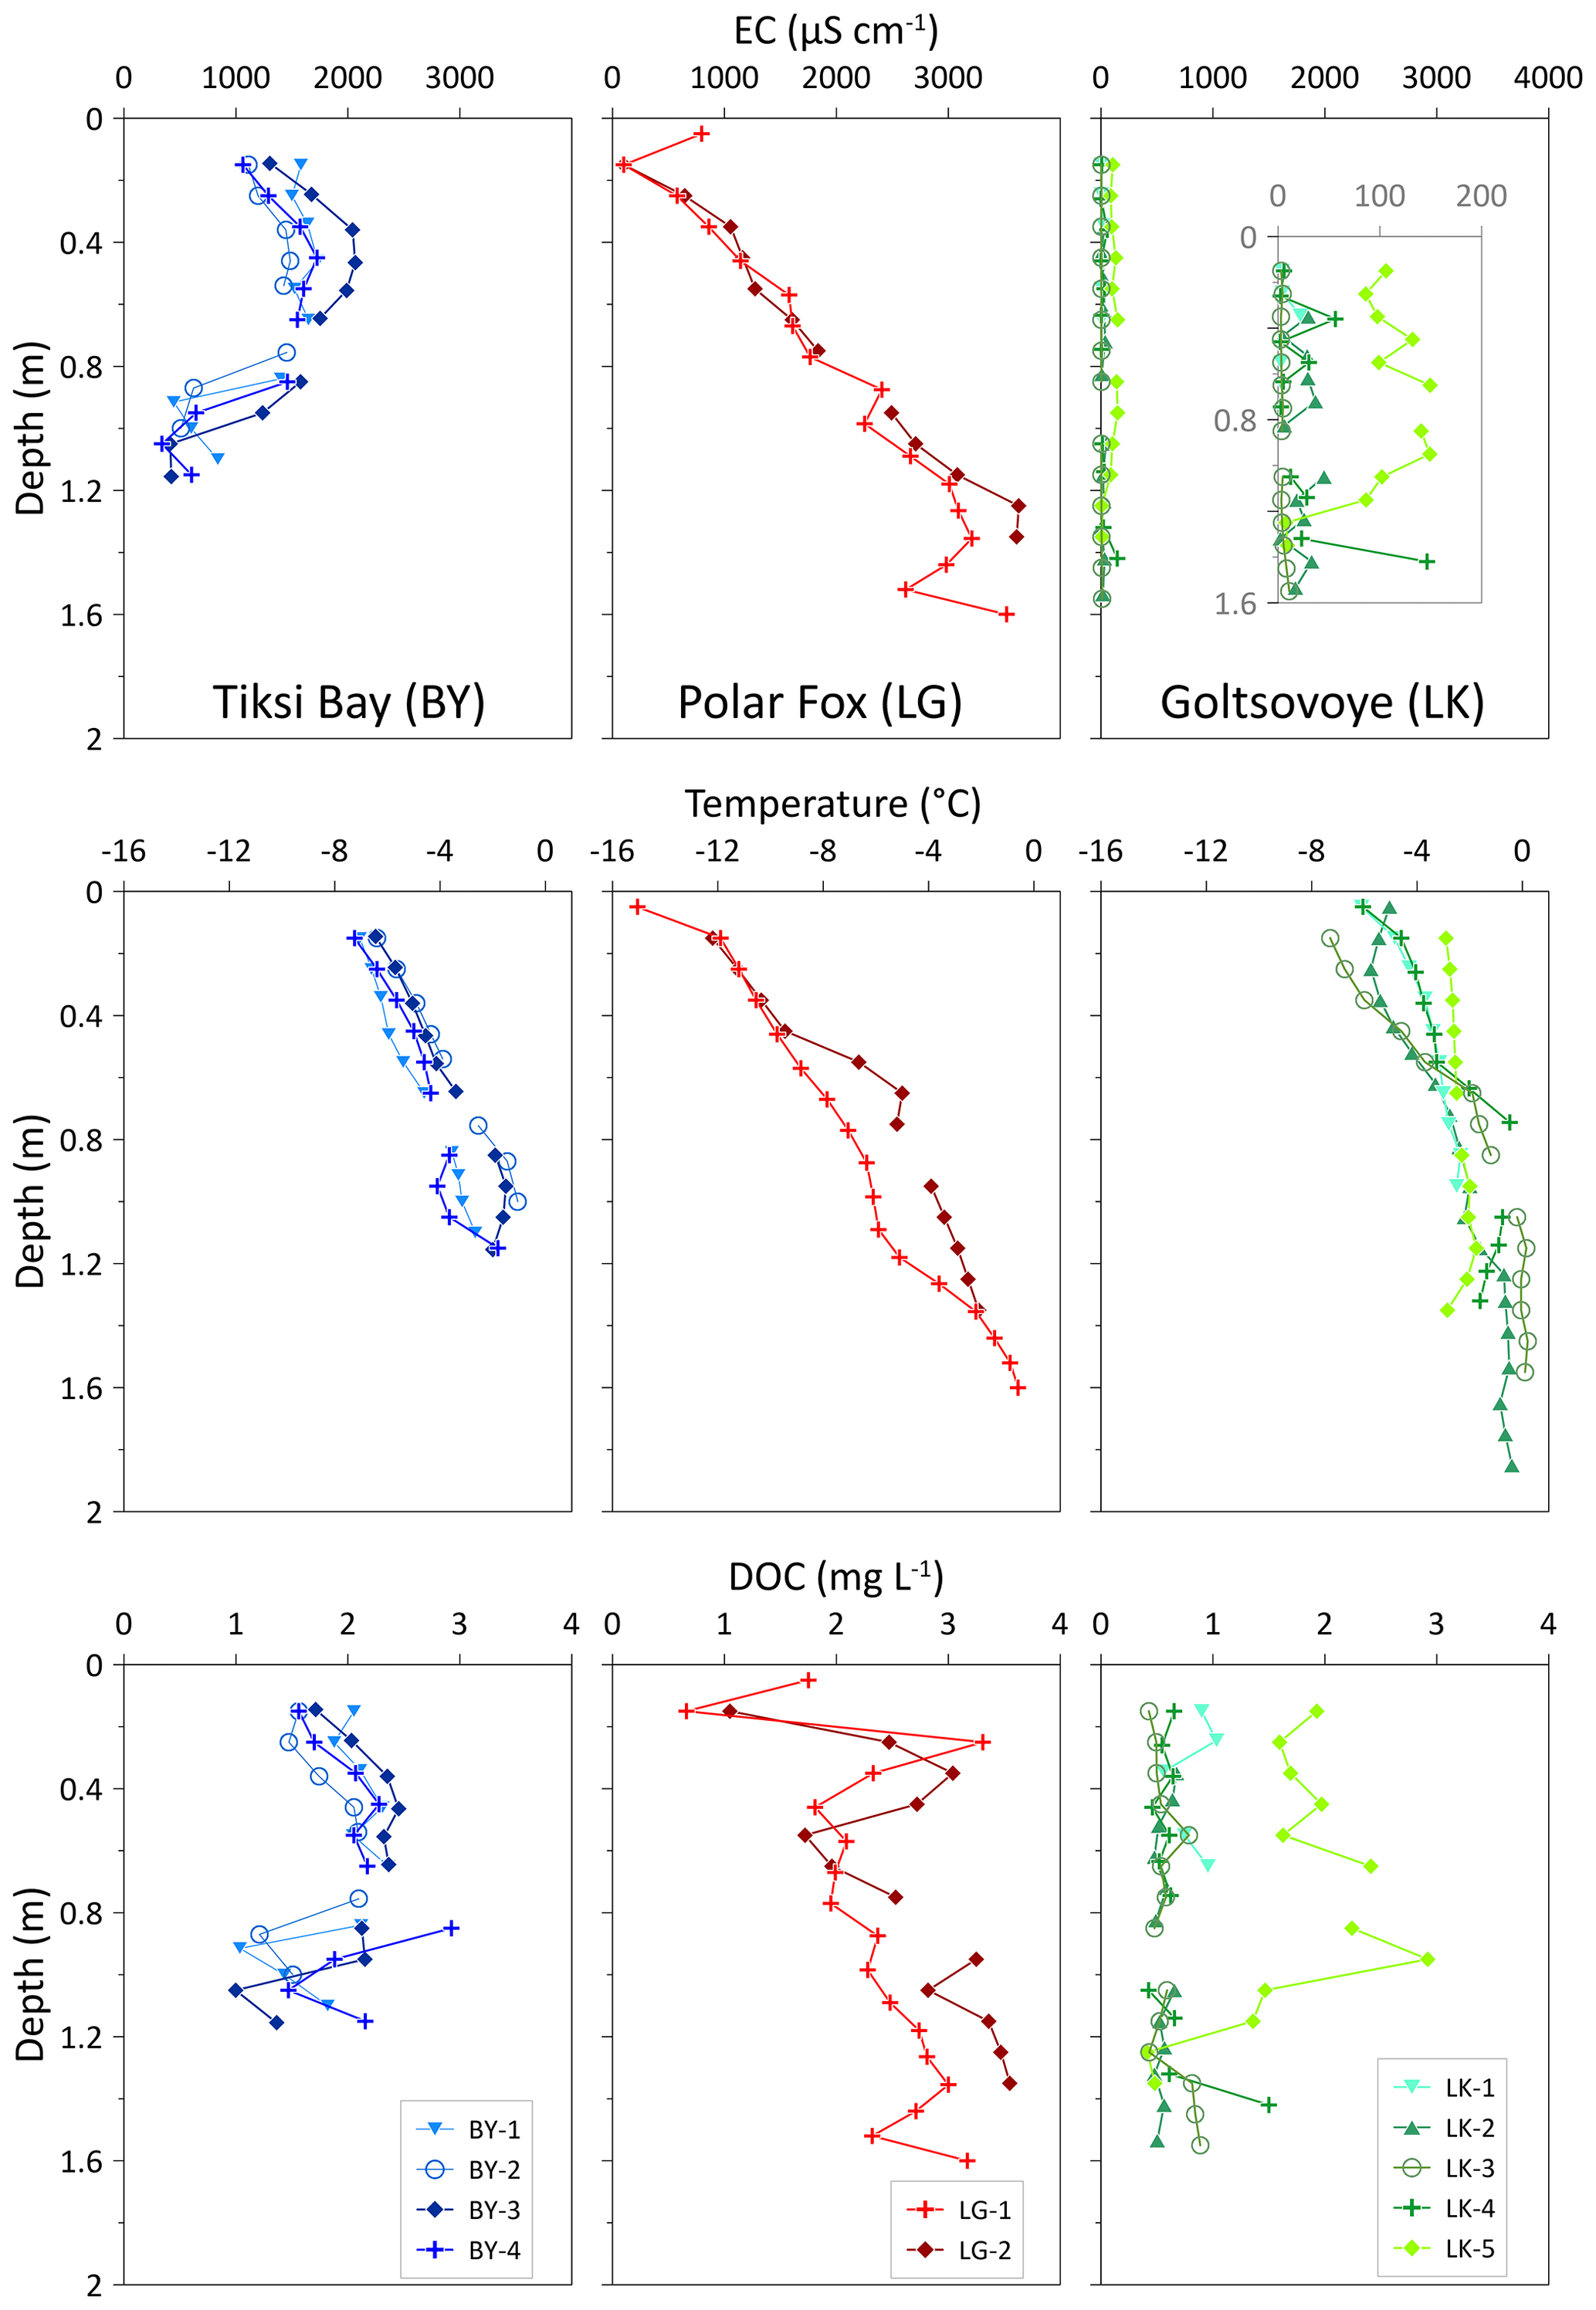
Figure 4Vertical distribution of the electrical conductivity (EC), temperature, and dissolved organic carbon (DOC) in ice cores with depth.
4.3.4 Stable water isotopes
For the four cores of the BY transect, δ18O and δD values ranged from −16.7 to −14.7 ‰ and −129 to −114 ‰, respectively (Table 2). However, changes of the stable isotope composition with depth in the ice cores of BY were relatively similar to each other (Fig. 5). The values were lowest at the bottom of the ice cores in each case. The d-excess (d-excess ; Dansgaard, 1964) was quite uniform with a range from +3.5 to +5.7 ‰ for all four cores of BY (Table 2).
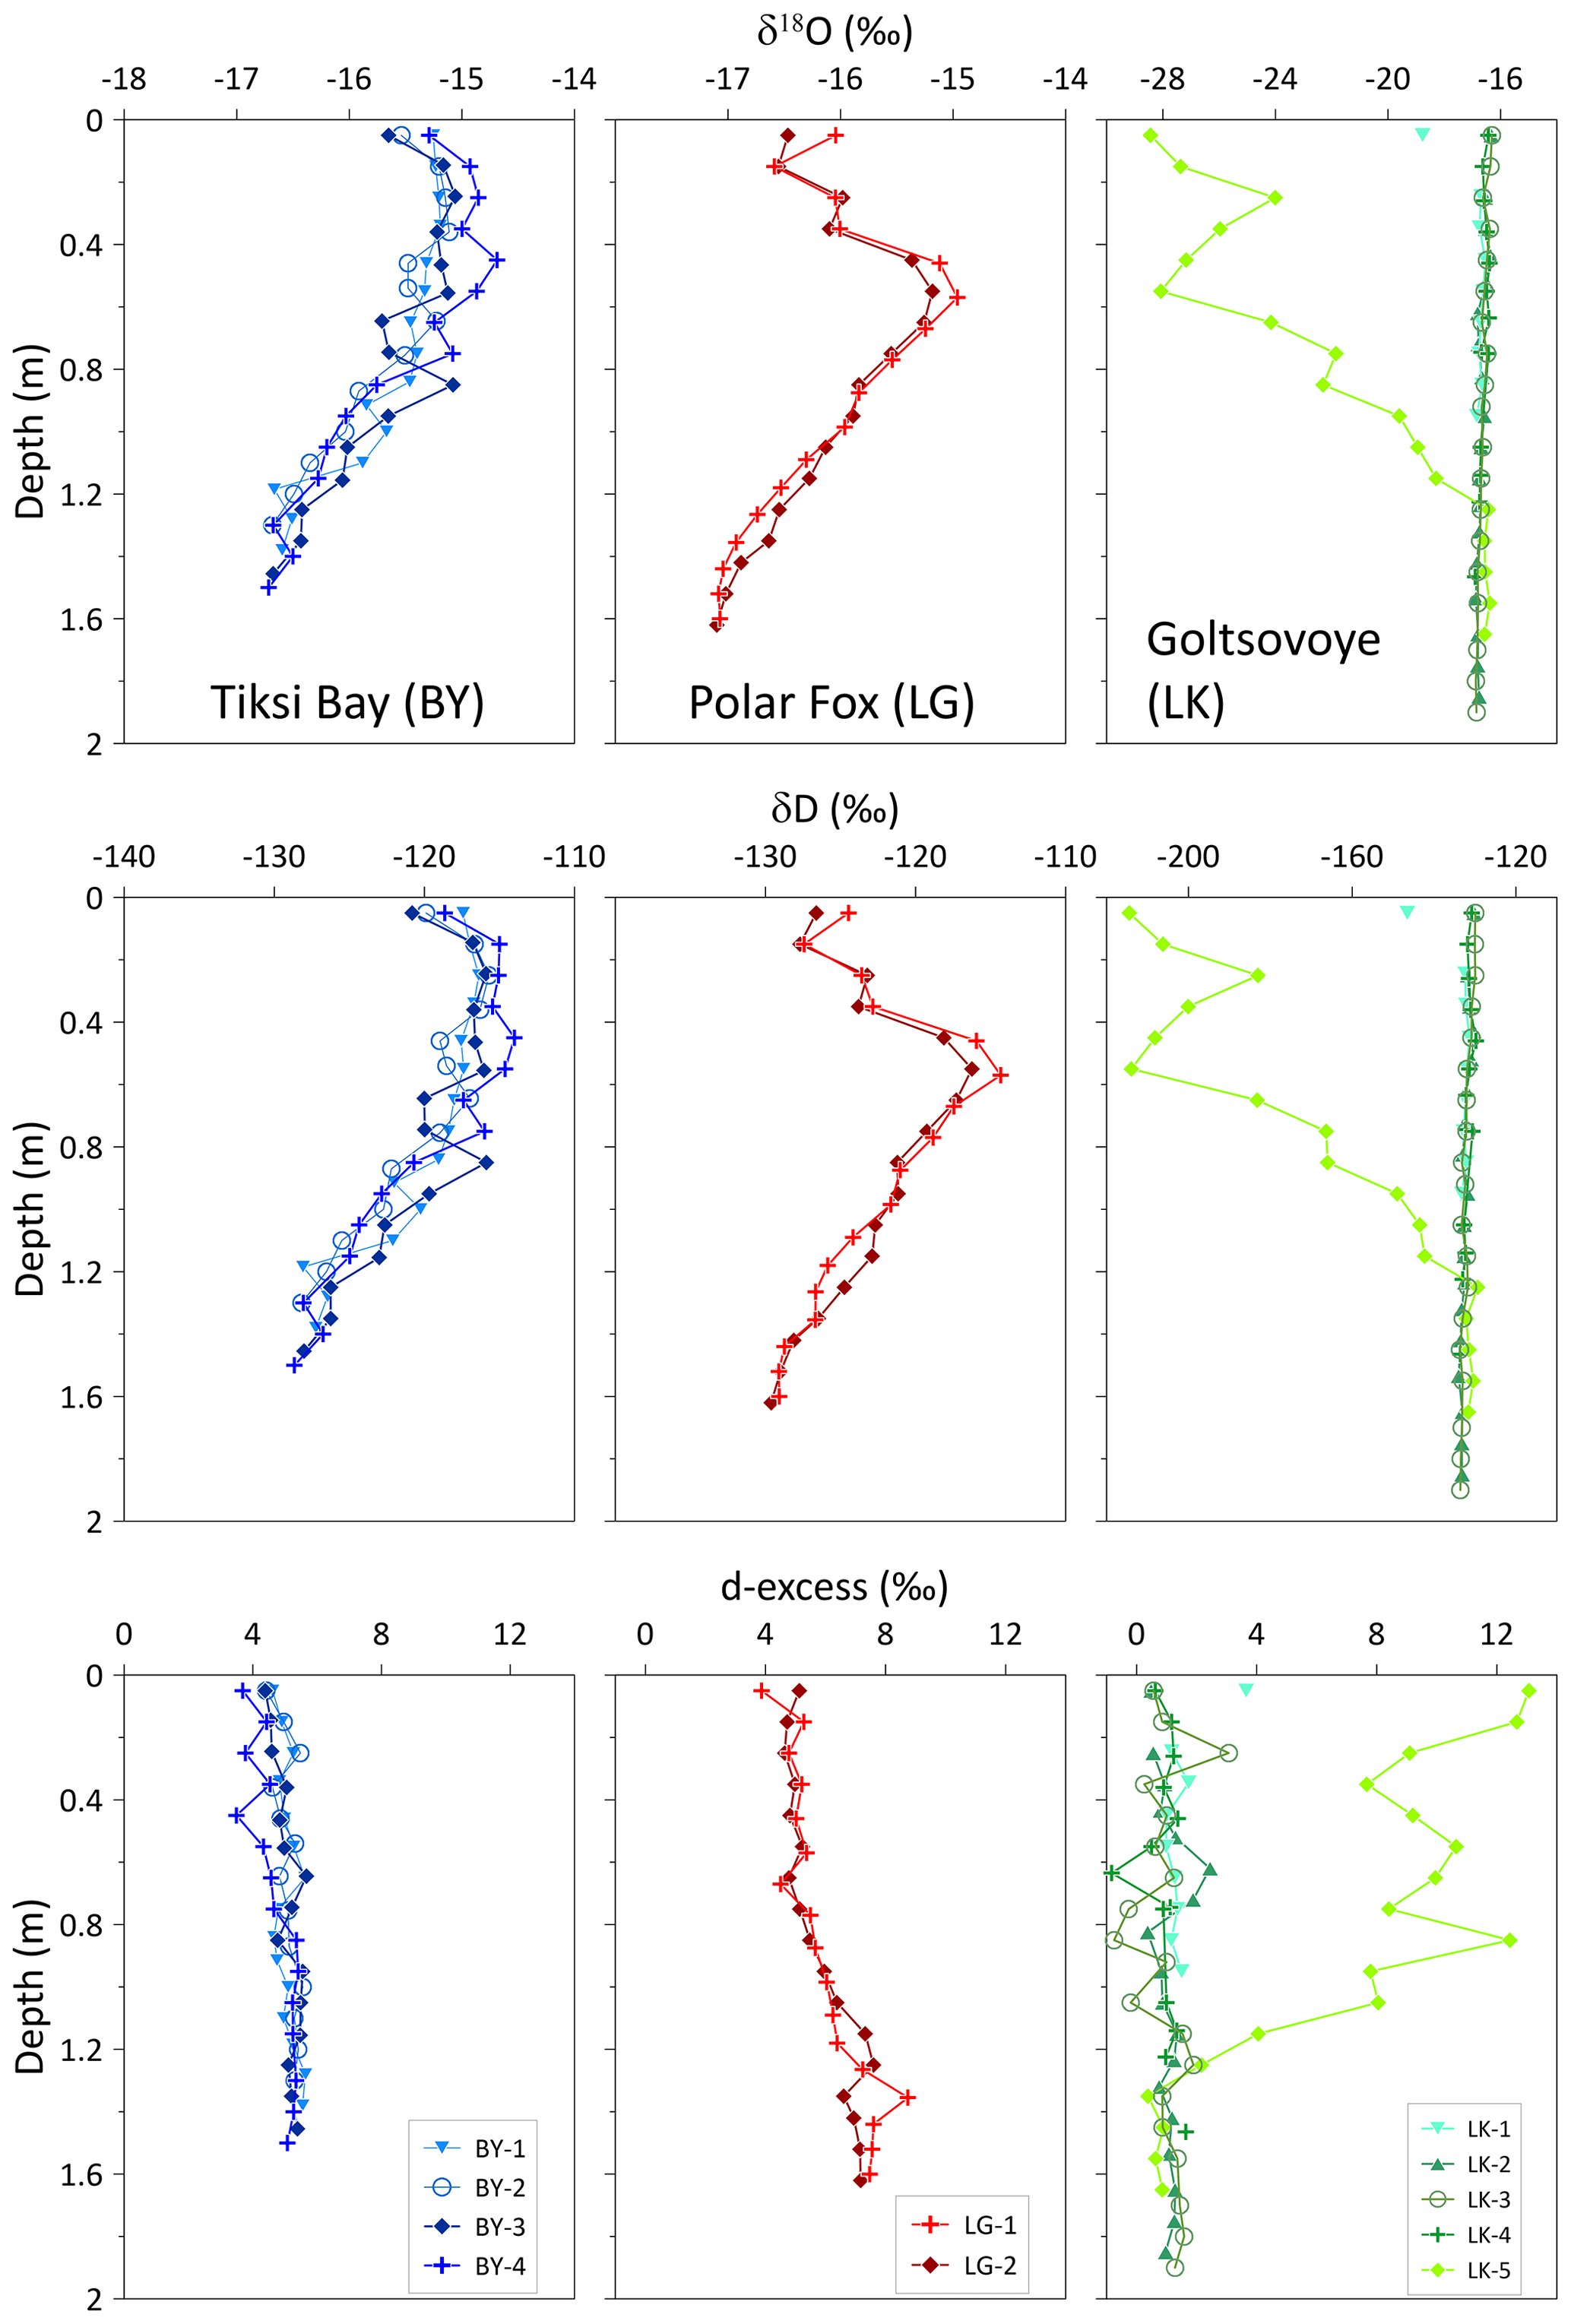
Figure 5Vertical distribution of the stable water isotopic compositions (δ18O, δD and d-excess) in ice cores with depth. Note that the isotope composition scales for Goltsovoye Lake (LK, at right) differ from the other two sites to accommodate the values observed in core LK-5.
For LG, the stable water isotope composition ranged from −17.1 to −15.0 ‰ for δ18O and −130 to −114 ‰ for δD (Table 2). The d-excess values were constant until 0.9 m, followed by an increase near the bottom of the cores (Fig. 5).
For LK, the values of the stable water isotopes ranged from −28.4 to −16.3 ‰ for δ18O and from −215 to −129 ‰ for δD (Table 2). Both δD and δ18O in the LK cores did not vary with depth and were similar to the isotope signatures of BY and LG. LK-5 differed, with much lower δ values (Fig. 5). Values for the d-excess were between −0.8 and 13.1 ‰ (Table 2). For all LK cores except LK-5, d-excess values ranged from −0.8 to 3.6 ‰ (Fig. 5).
4.4 CH4 in the ice
4.4.1 Dissolved CH4 concentrations
In the ice cores from BY, CH4 concentrations were generally very low (3.48–8.44 nM; mean: 6.03±1.22 nM) (Table 2) compared to the other locations and showed no variations with depth (Fig. 6). The dissolved CH4 concentrations in the water beneath the ice cores were 51 and 154 nM (BY-1 and BY-2, respectively). In the ice cores from LG, we observed high CH4 concentrations in the upper ice (up to 193.7 nM), followed by a decrease at depths from 0.6 to 1 m and a final increase towards 539 nM at the bottom of LG-1. In LG ice CH4 concentrations covered a wide range, with values from 2.59 to 539 nM (Table 2, Fig. 6). Dissolved CH4 concentrations of 1768 and 3394 nM (LG-2 and LG-1, respectively) were measured in the water beneath the ice cores. In the ice cores of LK, CH4 concentrations were low and uniform with depth in LK-1, LK-2 and LK-4. Very high and very variable concentrations (maximum 14 817 nM in LK-3) were observed in LK-3 and LK-5, which both contained bubbles.
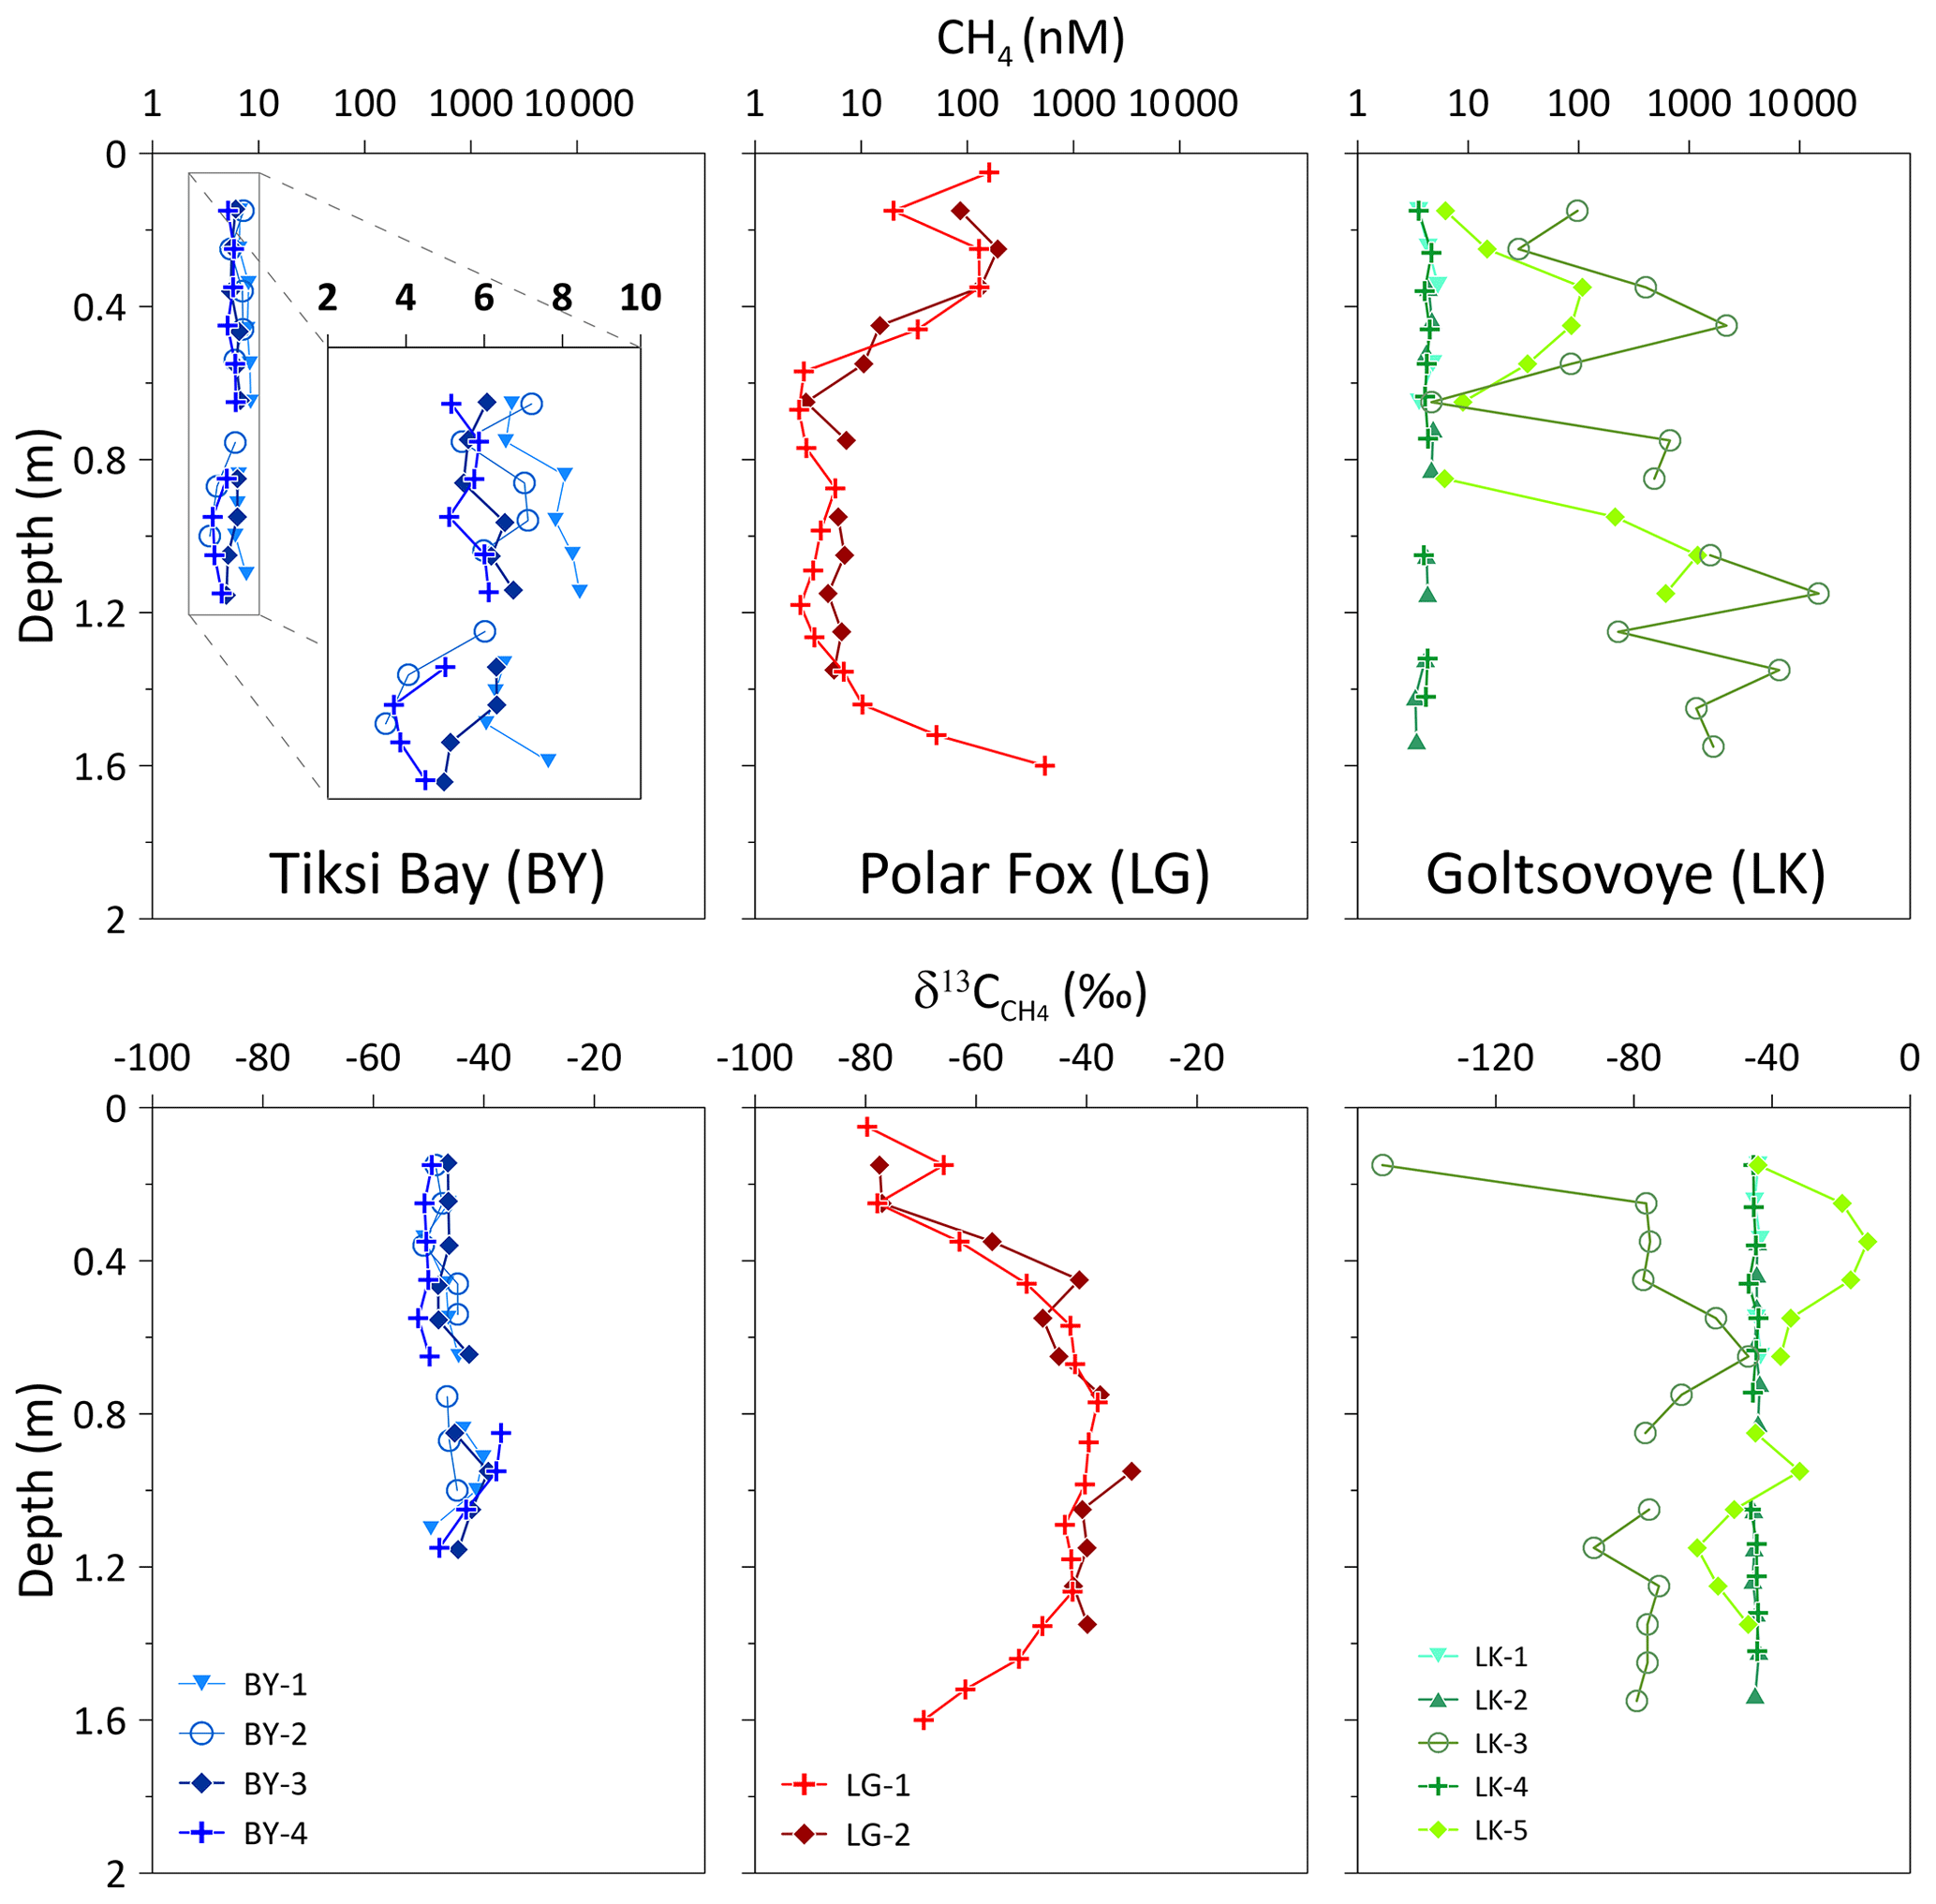
Figure 6Vertical distribution of the CH4 concentration (on a logarithmic scale) and with depth for the three locations.
4.4.2 Stable carbon isotopes
In the ice cores from BY, ranged from −51.9 to −36.9 ‰. These values are in a lower range than the of the cores of the other locations (Table 2). In LG, ranged from −79.7 to −31.8 ‰ for both cores (Table 2). The cores indicate a similar pattern, with carbon isotopes more enriched in in the lower portion of the cores than in the upper portion (Fig. 6). Stable decreased in the bottom depths of LG-1. The pattern is inverse to that of the CH4 concentrations. In LK-1, LK-2 and LK-4, the values had a mean of −43.3 ‰ and were uniform (±2.2 ‰) with depth, whereas values in LK-3 and LK-5 ranged from −91.6 to −12.3 ‰, with a strong variability within and between the two cores. A greater variability was observed for CH4 concentrations.
The seasonal ice cover forms a barrier to gas exchange between water and the atmosphere. The coastal water bodies studied here are typically ice covered for about 9 months every year, a period that is shortening for both lake and marine ice (e.g., Günther et al., 2015). At the same time, air temperatures (Boike et al., 2013), sea level rise rates (Nerem et al., 2018) and coastal thermo-erosion rates (Günther et al., 2013) all increased, indicating a rapidly shifting regime for aquatic environments in the region. The importance of the persistence and duration of the seasonal ice cover in all of these processes is poorly understood. As further warming of the Arctic will shorten the duration of ice cover, pathways to CH4 emissions will probably shift.
The three water bodies in this study represent (1) the marine shoreface in a setting where ice-rich Yedoma permafrost is undergoing thermo-erosion (BY), (2) a thermokarst lake that has become a coastal lagoon via thermo-erosion (LG) and (3) a terrestrial thermokarst lake (LK). Although the ice cover sampled from all three settings was largely clear ice, we observed systematic differences in ice hydrochemistry and CH4 concentration. As observed in Harris et al. (2017), the degree of connectivity to the sea is important in determining the composition of the water for coastal lagoons. In the LG setting, thickening of the ice cover eventually plugged the shallow connection of the brackish basin to the sea, after which the brine concentration beneath the ice increased for the rest of the winter (semi-closed system), a typical situation in lagoons, behind barrier islands or on gently inclined shorefaces (Fig. 7). Landfast ice on the shoreface does not close off the water basin, which continues to undergo exchange with the central Laptev Sea and Lena River inflow (open system). The thermokarst lake had neither outlets nor significant inlets, and the ice effectively closed off the water body (closed system), isolating the freshwater basin and its talik. Based on our data, we suggest that the type of water body also determines the circulation of CH4. In the following we examine in detail how the water body type affected ice growth, CH4 concentrations and composition and further discuss the processes involved.
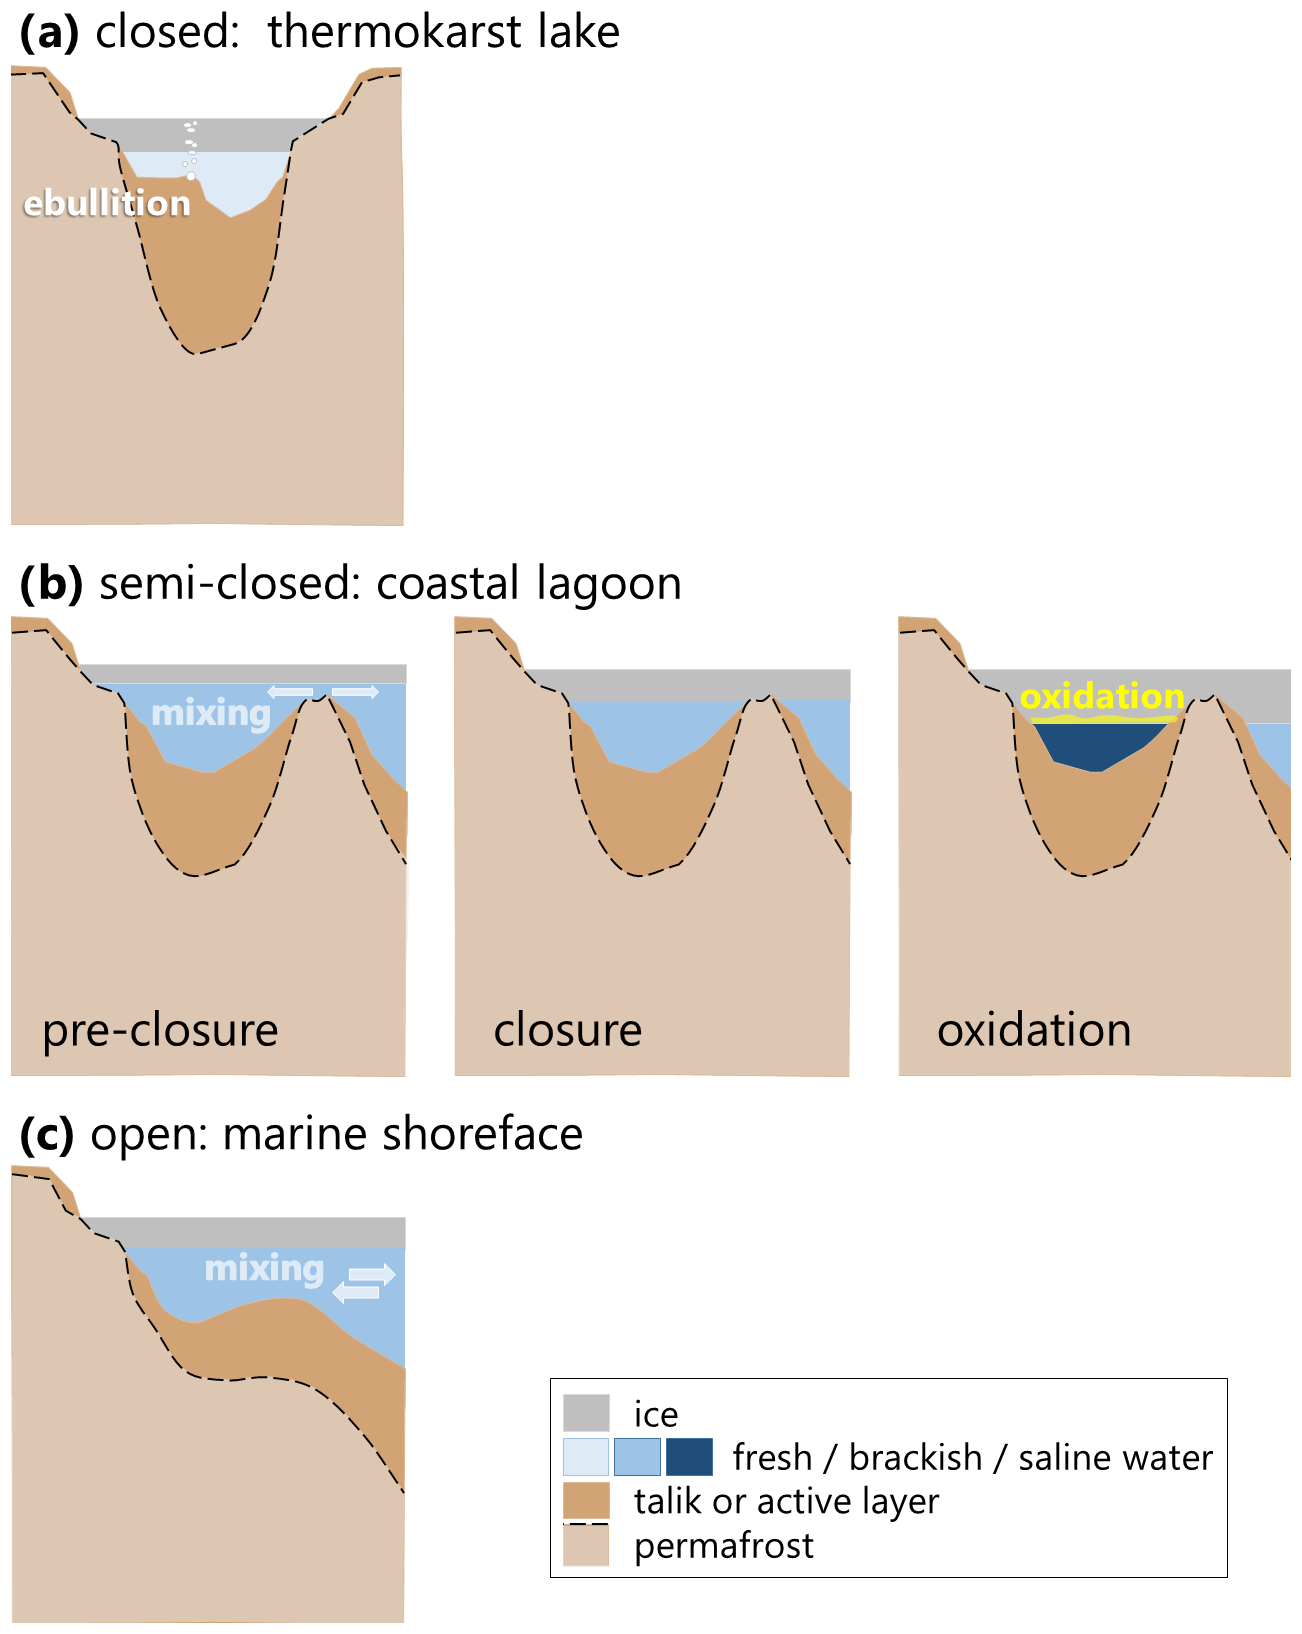
Figure 7Schematics of geomorphological differences between the three aquatic systems under investigation: (a) the closed system represents a typical thermokarst lake, such as LK, with a closed talik and a complete winter ice cover over fresh water; (b) the semi-closed system is a brackish to highly saline water body (LG), whose ice cover separates it from the marine system at some point during the winter and for which continued ice growth can lead to hypersalinity; and (c) the open system (BY), where ice cover growth does not prevent mixing with marine and/or fluvial waters beneath the ice.
5.1 Tiksi Bay (BY) – the open system
Tikski Bay is part of Buor Khaya Bay and via the central Laptev Sea perennially connected to the Arctic Ocean. The marine setting delays the onset of ice formation compared to the terrestrial aquatic system shown by satellite images from ESA Sentinel-1 and Sentinel-2. In addition to seawater, snowmelt in spring, small coastal catchments and the Lena River enter into BY south of Cape Muostakh. Lena River discharge follows a nival discharge regime, with very high discharge in the spring and early summer months (Magritsky et al., 2018), while in winter, when the connection between Buor Khaya Bay and BY is restricted by sea ice, the contribution of Lena discharge must be much smaller. When BY freezes, it is supposed to be a continuously open system; i.e., water exchange is ongoing during winter below the ice. Both aspects (open system and the mixing of fresh and brackish water) are corroborated in the stable water isotope composition of the ice cores. A mean δ18O value of −15 ‰ for BY is well below full marine conditions and displays the continuous and strong influence of freshwater supply through the Lena River to the Laptev Sea.
Firstly, in an open system such as BY, the water circulates freely beneath the ice cover. The isotope composition of the ice should remain more or less constant over the winter (Gibson and Prowse, 1999) and reflect the fractionation resulting from the freezing of Tiksi Bay water. Accordingly, the water isotopic composition and salinity values are constant until the ice is approximately 0.8–0.9 m thick (Figs. 4, 5). The small variation at the top might be due to variability in isotopic fractionation, i.e., related to a change of the freezing rate after ice formation started. Oxygen isotope fractionation during the freezing of seawater has been addressed by Toyota et al. (2013) through laboratory experiments and field observations. These authors demonstrate a general dependency of increasing isotope fractionation with decreasing ice growth rate. Therefore, faster freezing induces less isotope fractionation when compared to slowly formed ice at a later stage of sea ice formation.
Secondly, BY is influenced by marine and river water, the ratio of which affects δ18O and δD captured in the ice. The advection of mixed water below the ice imprints on the freezing process. Hence, water mixing is likely reflected in the small shift towards −17 ‰ in δ18O and −130 ‰ in δD in the lower part of the ice (>0.9 m) (Figs. 4, 5 and 6), even though the δ18O−δD data behave like isotopic fractionation in a closed system, where the last ice that formed displays the lightest isotope composition. The change of the water isotope composition without a change in the d-excess, as well as changing EC and DOC, suggests a substantial contribution of another water mass and indicates the reduction of marine influence or an increased river water impact in the lower part of the ice compared to the upper part. Reduced EC concentrations corroborate the enhanced freshwater content in the bottom segments of the ice cores, further substantiated by lower δ18O and δD values. Overall, the upper part of the BY ice cores indicates freezing from brackish water, whereas the lower part may capture a slightly higher proportion of river water, probably reflecting changes to the isotopic and hydrochemical composition of BY. This is reflected in the regression lines of the δ18O−δD plot for BY, which differ in slope for the two sections (Fig. 8) and indicate a shift in fractionation (Souchez and Jouzel, 1984). Episodic advection of meteoric water during the winter season was also detected in landfast sea ice cores from Barrow, Alaska (Smith et al., 2016). The samples of the upper portion of the ice plot along a regression slope of 6.9, demonstrating open-system freezing under equilibrium conditions (Lacelle, 2011). In contrast, the lower portion of the ice plots along a regression line of 7.9 (Table 3), close to the slope of the GMWL of 8. Lena River water from much further south is carried into Tiksi Bay throughout the year and plots close to the local meteoric water line (slope 7.3, Juhls et al., 2020). In April this flux is still at base flow levels but contributes to the least dense surface water layer beneath the ice. Hence, we assumed this portion of the ice to be mixed with water of meteoric origin. The change in the water isotopes between the upper and lower ice was not related to closed-system freezing, as this would also be indicated by a deviation from the GMWL and a change in the d-excess.
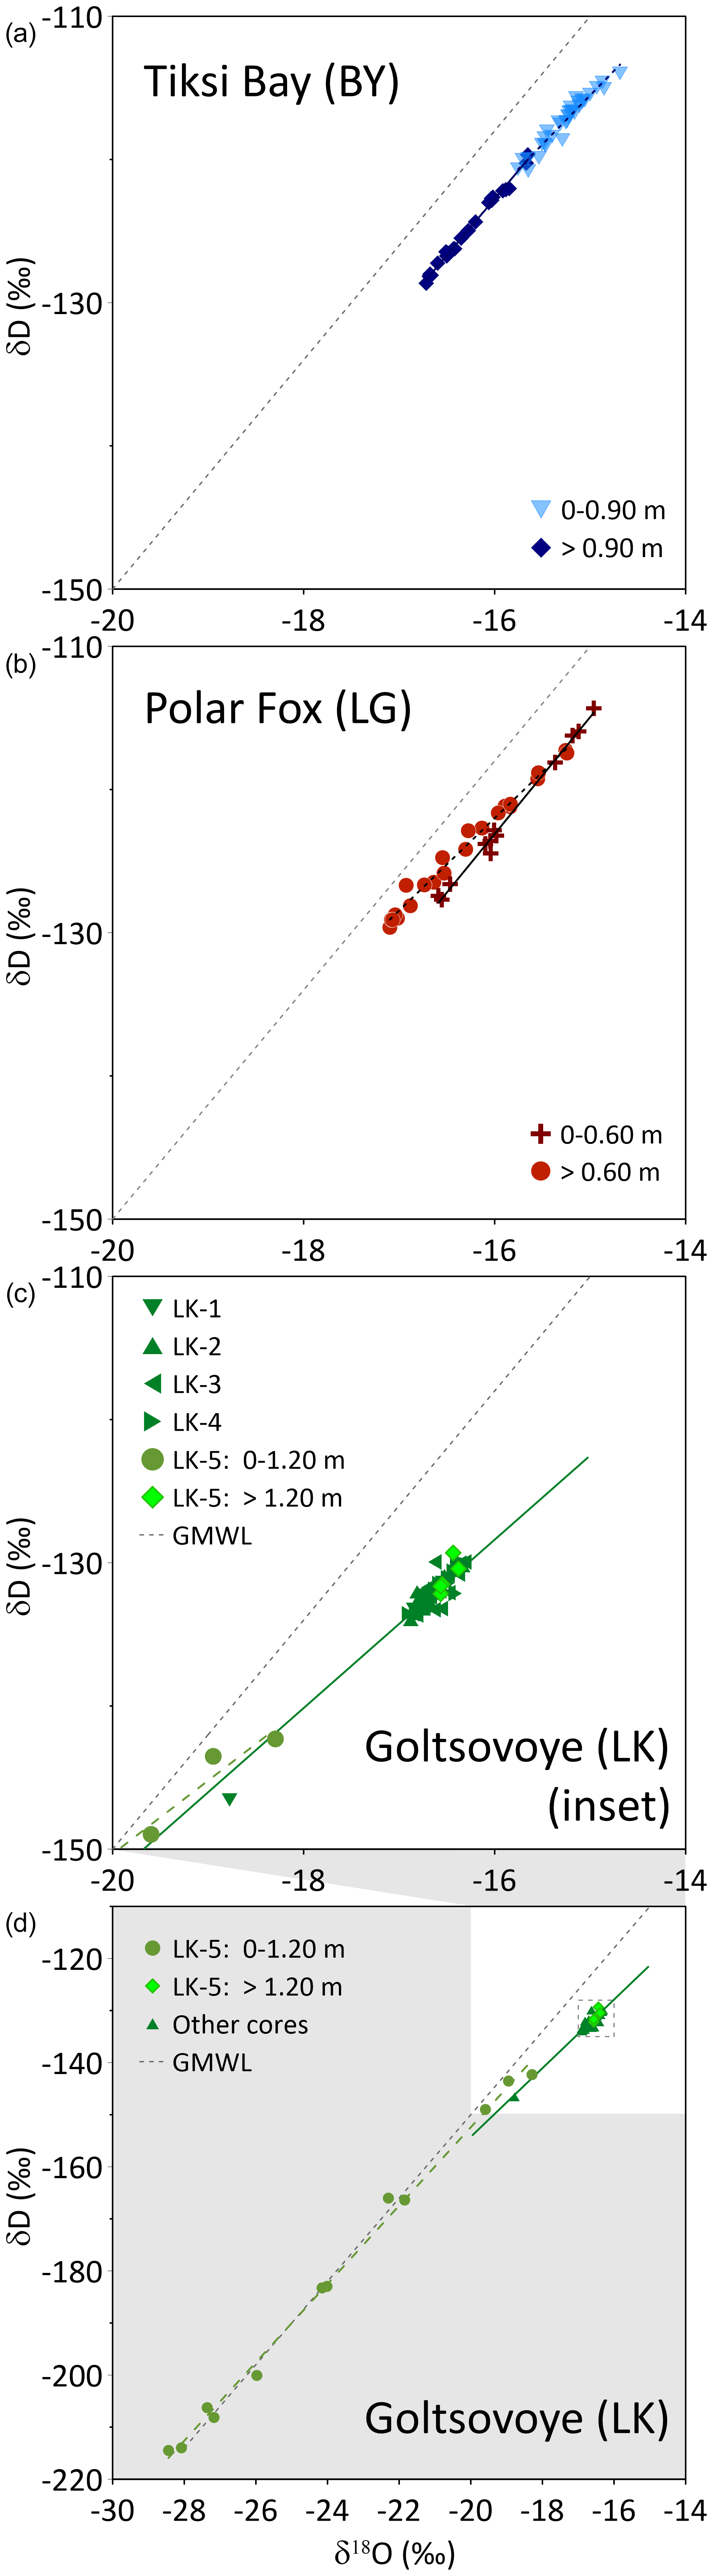
Figure 8Isotope composition and linear regressions for Tiksi Bay (BY, a), Polar Fox Lagoon (LG, b) and Goltsovoye Lake (LK, c, d) ice cores. For comparison, the global meteoric water line (GMWL, ; Craig, 1961, grey dotted line) is shown. The limits of the axes of the inset graph (d) differ from those above.
CH4 concentrations in BY ice are small but still supersaturated relative to the atmospheric background concentration and probably the result of freezing of CH4-supersaturated brackish water in BY. CH4 supersaturation has been reported for the Buor Khaya Bay (Bussmann, 2013), and large amounts of CH4 are stored in sediments of this region (Overduin et al., 2015). Supersaturation in the shallow water of BY is probably caused by CH4 release from sediments (Bussmann et al., 2017), which likely occurs in the fall when cooling induces convection and resuspension events (Damm et al., 2007). In comparison, during calm sub-ice winter conditions resuspension events cease and CH4 concentration decreases in the brackish water from which the ice forms, shown by the slightly reduced concentration in the lower part of the ice (>0.9 m) (Fig. 5). The slight decrease in concentration with increasing distance from shore and a homogeneous carbon isotopic signature also point to calm water conditions during freezing and a local source of CH4. Very similar processes during freezing for all BY cores are corroborated by the homogeneous () carbon isotopic signature along the onshore–offshore gradient.
5.2 Polar Fox Lagoon (LG) – the semi-closed system
LG is connected to BY through a wide, shallow and winding channel. Storm surges and high-water events in the summer force seawater, driftwood and sediment into LG. ESA Sentinel-1 and Sentinel-2 imagery indicate that the ice on LG started to form in mid-October, and hence earlier than at BY. During the early freezing period, the connecting channel allowed water exchange between LG and BY until the growing ice reached the channel bed (less than 0.5 m deep), where it exits LG in 2017. At that point, LG changed from a connected to an isolated system, affecting water chemistry below the ice. The timing of closure, interpreted from the change of δ18O and δD values with depth, corresponds to an ice thickness of 0.6 m. At the time of coring the ice thickness on LG was about 1.6 m. The ice on more than 75 % of the lagoon's area was probably be frozen to the bed (Angelopoulos et al., 2020). In the lagoon centre, ice was floating and the lagoon had a talik, although it contained a thin ice-bearing layer (4.8 to 8.3 m below the sediment surface, Angelopoulos et al., 2020).
For ice that formed before the lagoon was separated from the sea (above 0.6 m), the isotopic signature indicates freezing under non-equilibrium conditions (Lacelle, 2011), with a slope of 8.2 between δ18O and δD (Fig. 8, Table 3). As the freezing was influenced by mixing of the initial water with a different water mass (water from the bay), probably no equilibrium freezing occurred. Below 0.6 m, however, isotopic values decrease, indicating freezing under closed conditions. A slope of 6.5 (Fig. 8, Table 3) suggests freezing under equilibrium conditions (Lacelle, 2011). This freezing process is influenced not by a changing initial isotope composition of water but by isotopic fractionation during freezing. Freezing leads to a lighter isotope signature of the remaining water, as the heavy isotopes are preferentially incorporated into the ice (Gibson and Prowse, 1999, 2002). This results in lighter isotope composition and an increase of d-excess in deeper ice (below 0.6 m) compared to the upper ice. The concentrations of dissolved constituents (indicated by EC and DOC) also increase with increasing ice thickness (Fig. 4) and corroborate this interpretation.
Table 3Regression lines of the δ18O-versus-δD plot for the three systems (Fig. 8).
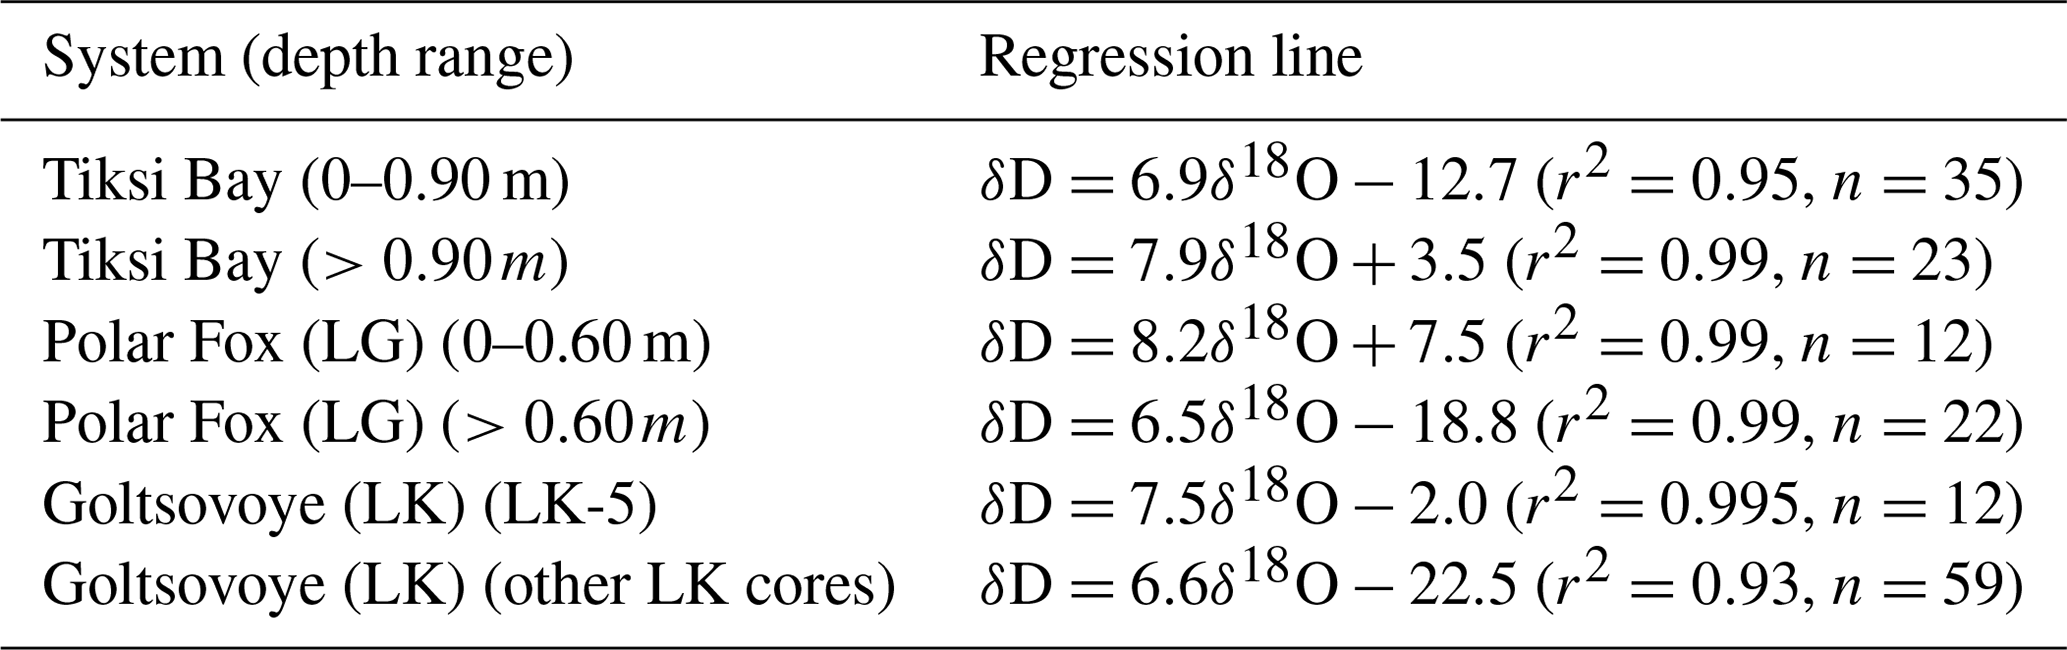
Thermokarst lake basins that are transformed into thermokarst lagoons are increasingly affected by seawater, at least intermittently, during high-water events such as storm surges, resulting in changes to their temperature and salinity regimes (Romanovskii et al., 2000). Increasing salinity in turn also affects subsurface permafrost thaw dynamics and may therefore result in different CH4 production rates (Angelopoulos et al., 2019, 2020). In the uppermost ice – i.e., when freezing started – CH4 concentration in LG water was more than 10 times higher than in BY. The isotopic signature was in the range of microbially produced CH4 (−70 to −80 ‰) (Whiticar, 1999). This large excess of δ13C-depleted CH4 clearly points to CH4 from the unfrozen talik, released into the water body and stored therein during the ice-free season. When LG switched from a connected to a closed system at around 0.6 m ice thickness, ongoing CH4 oxidation beneath the ice lowered the CH4 concentration captured in the ice to ≤10 nM, comparable to those in BY ice. At the same time, the CH4 isotopic signature became comparably enriched in δ13C (Figs. 6, 9). Ongoing ice formation under closed-system conditions (below 0.6 m), as indicated by stable water isotopes, induced a continuous increase in ice salinity (Fig. 4), which in turn favoured the shift of the horizon where CH4 oxidation could occur from the water to the bottom of the ice. This is corroborated by the Rayleigh fractionation curves calculated for ice that grew under closed conditions, using as initial CH4 isotopic signature the uppermost value, i.e., the signature when freezing began (Figs. 6, 9).
Figure 9Observed and CH4 concentrations in the ice of Polar Fox Lagoon (LG) for shallow and deep ice (above and below 0.6 m, respectively; shown as symbols). The lines show calculated based on Rayleigh fractionation during oxidation (Eq. 1). For these modelled values, α was set to 1.004 and the initial values were 195 nM (0 to 0.6 m, dotted line) and 450 nM (>0.6 m, solid line) with initial isotopic signatures of −80 and −70 ‰, respectively.
In addition, the temperature increased towards the bottom of the ice (Fig. 4). The bottom ice offers a protected environment with favourable conditions for microbial metabolism: relatively warm temperatures, contact with liquid water and permeable ice. The latter permits migration of gases and nutrients, similar to marine ice, where most bacteria are located in the lowest centimetres of the ice (Krembs and Engel, 2001). At LG, the bottom ice temperature decreases during the winter. This occurs because the temperature of the underlying water remains in equilibrium with a dynamic freezing point that decreases with increasing salinity when LG is cut off from Tiksi Bay. The ice surface temperature at the time of coring was primarily a function of snow cover and air temperature. The ice coring locations for LG exhibited colder ice surface temperatures and steeper gradients compared to ice coring locations at LK. Ice has a high thermal conductivity and is susceptible to quick temperature changes. Since ice temperatures were also observed for windswept areas at LK, decreasing air temperatures from 8 April 2017 (final LK coring day) to 11 April 2017 (LG coring day) explain the generally colder ice temperature profiles at LG. How salty the sub-ice water becomes is probably highly variable from year to year and will depend on how much seawater is forced into the lagoon during the fall storm season.
During freezing of the ice cover, its growth rate decreases (cf. Anderson, 1961), providing more time and space for bacterial metabolism. CH4 uptake from the water into the bottom of the ice and its oxidation there may have continued over the winter until the ice break-up. CH4 oxidation ceases when concentrations are too low for oxidation to be efficient (Cowen et al., 2002; Valentine et al., 2001), at values ranging from 0.6 to 10 nM. CH4 concentrations in the ice above 1.3 m (Fig. 6) were less than 10 nM, suggesting that ice is an effective sink for CH4 in this type of water body during winter.
5.3 Goltsovoye Lake (LK) – the closed system
The ice core hydrochemistry from LK reflected a water body that froze in equilibrium with atmospheric CH4 concentrations, with two cores that showed the influence of snow loading and of ebullition.
LK is an isolated thermokarst basin surrounded by ice-rich Yedoma uplands to the west and east and partially degraded Yedoma uplands to the north and south. The lake is underlain by continuous permafrost some hundreds of metres deep and has a thaw bulb (talik) beneath its bed due to the positive temperatures at the lake bottom. Water in LK derives from precipitation, most of which falls as snow, and reaches the lake either directly, via overland flow, or via groundwater flow through the shallow active layer. Thus, the concentration of dissolved constituents remains small in lake water and ice, as reflected in very low electrical conductivities of less than 50 µS cm−1 (Fig. 4).
Water depths range from <1 m to about 8.5 m from the western to the eastern shore, respectively (Fig. 2). This asymmetric shape influences the progress of ice growth in winter. Ice formation typically starts from the lake shore, most likely at the very shallow west shore, and leads to bedfast ice formation at the position of LK-1, i.e., lake ice frozen to the lake bed. Hence, it is likely that LK-1 began to form earlier in the season and that the upper ice in this core, and probably also in LK-4, reflected the chemistry of the summer/autumn lake water. All cores except LK-5 had similar δ18O (around −16.5 ‰) and δD (−140 ‰) values, with a regression slope of 6.6 (Fig. 8, Table 3), pointing to freezing under equilibrium conditions (Lacelle, 2011). At this location both the CH4 concentrations and the uniform δ13C signature indicate equilibrated values with respect to the atmospheric background values (Fig. 6). Our data demonstrate that lake water was not supersaturated during the ice-free season. The other two cores show clear differences and are described in the following.
For LK-5 stable water isotopes in the upper 1.2 m follow the GMWL (Fig. 8), indicating equilibrium fractionation (in the vapour–water system, as snow is involved) due to different precipitation sources. δ18O values as low as −28 ‰ indicate snow as a source. The proximity of snow samples to the GMWL is typical for northern Siberia and has been also found at snow patches on the Bykovsky Peninsula (Meyer et al., 2002). LK-5 lay close to LK's steepest shoreline, where active thermo-erosion results in shoreline retreat, and that lies in the lee of prevailing winds (Günther et al., 2015), where deep snow is expected to accumulate and load the lake ice. Snow of 0.92 m thickness lay on the ice at this location at the time of drilling, and water streamed out of the hole after coring (Strauss et al., 2018), indicating an ice cover under positive hydrostatic pressure. The ice of LK-5 was milky white from the surface to about 1.12 to 1.14 m depth, consistent with a mixture of snow and water. Thus, we conclude a snow signal evident from the stable isotope composition in the upper 1.2 m of LK-5. The higher EC and DOC in the same interval (relative to lower ice and to the other LK cores) are unlikely to have derived from snow, however, and imply heterogeneous ice development above 1.2 m. These may be the result of mixing of uprising lake water with snow within ice cracks. Adams and Lasenby (1985) describe the formation of white ice (or snow ice) by water percolation through thermally induced cracks to the surface of the ice, where the water mixes with snow and forms another ice layer above the former ice. This was observed by Adams and Lasenby (1985) when a snow load depressed the surface of the ice cover below the hydrostatic water level. The high and highly variable CH4 concentrations over this interval, together with the high EC and DOC, suggest that resuspension events, for example slope failure, occurred during ice formation. The carbon stable isotope signature in LK-5 may reflect microbial CH4 oxidation in the sediment rather than oxidation in or beneath the ice.
The highest concentrations of CH4 were found in LK-3 (up to 15 000 nM), with the lowest δ13C signatures (down to −150 ‰, Fig. 6). LK-3 was drilled above the steepest portion of the lake bed, where ebullition may be a by-product of thermokarst processes beneath the bed. The 12C-enriched signal is consistent with CH4 that has not been oxidized in the sediment and is released in gas bubbles. The earlier release of the lightest CH4 may be the result of fractionation during migration in the sediment and may be an indication the ebullition and ice formation are related, i.e., that ebullition was initiated as a result of pressure changes owing to the onset of freezing.
CH4 concentrations in the seasonal ice cover of three types of Arctic water bodies (bay marine, lagoon and lake) differed in ways related to the process of ice formation and its importance as a mitigator of CH4 fluxes to the atmosphere. In the ice of Tiksi Bay, open to the central Laptev Sea throughout the winter and underlain by permafrost, CH4 concentrations were low but, as in all three water bodies, supersaturated with respect to atmospheric concentration. In the coastal Polar Fox Lagoon, a breached thermokarst lake, ice formation sealed the channel between the lagoon to the sea midway during ice cover development. The brackish water trapped beneath the thickening ice during the winter led to increasing salt content. The CH4 concentrations and stable isotope signatures strongly suggested that bacterial oxidation takes place at the interface between ice and water, reducing the CH4 concentration preserved in the ice. We interpret this as evidence that the ice cover may act as a sink, providing a habitat for CH4-oxidizing micro-organisms. In the third water body, a land-locked thermokarst lake surrounded by Yedoma landscapes, CH4 concentrations in the lake ice were spatially highly variable. High CH4 concentrations were local and probably associated with ebullition and snow loading of the ice near an eroding shoreline.
Winter ice on the water bodies studied here showed a transition from a brackish water coastal environment to a lagoonal basin isolated only by freezing in winter, in which the availability of salt water facilitates oxidation, and finally to an isolated basin in which CH4 was released at discrete locations in winter. Since CH4 is produced in the sediment in this setting, and since DOC can be a source of CH4 production in the water or the ice, future studies including sediment pore water values and CH4 and DOC concentrations should reveal CH4 pathways from their source in comparable water bodies. Furthermore, our comparison of CH4 concentrations in brackish and fresh water bodies shows differences between CH4 oxidation in thermokarst lakes and Arctic lagoons. If CH4 oxidation takes place at the lower ice surface, as we suggest, future shorter ice cover duration and fresher water below the ice will decrease the CH4 flux mitigation by winter ice cover in some settings. As carbon dioxide is an important greenhouse gas and the product of CH4 oxidation, future studies should include relative proportions of both greenhouse gases.
Concentration data are available on PANGAEA (https://doi.org/10.1594/PANGAEA.913642, Spangenberg et al., 2020).
IS, PPO, ED, SL and IB conceptualized the study. Field investigations and/or laboratory analyses were carried out by IS, BKB, ED, GG, HM, IB, MA, MNG, PPO and SL. IS and PPO prepared the manuscript with contributions from all co-authors.
The authors declare that they have no conflict of interest.
Logistical support for the fieldwork was provided by the Russian Hydrographic Service (HydroBase Tiksi). We thank Hoang Vu Tuyen for rectifying and mosaicking images for the CH4 bubble transect and Ilsetraut Stölting for help with CH4 measurements. We thank Pat Langhorne, Blaize Denfeld and the editor for their help in improving this paper.
This research has been supported by the H2020 European Research Council (PETA-CARB (grant no. 338335)), and the Russian Foundation for Basic Research supported this work via projects awarded to Mikhail N. Grigoriev (grant nos. 18-05-70091 and 18-45-140057).
The article processing charges for this open-access publication were covered by a Research Centre of the Helmholtz Association.
This paper was edited by Petra Heil and reviewed by Pat Langhorne and Blaize Denfeld.
Adams, W. and Lasenby, D.: The roles of snow, lake ice and lake water in the distribution of major ions in the ice cover of a lake, Ann. Glaciol., 7, 202–207, https://doi.org/10.3189/S0260305500006170, 1985. a, b
Anderson, D. L.: Growth rate of sea ice, J. Glaciol., 3, 1170–1172, https://doi.org/10.3189/S0022143000017676, 1961. a
Angelopoulos, M., Westermann, S., Overduin, P., Faguet, A., Olenchenko, V., Grosse, G., and Grigoriev, M. N.: Heat and salt flow in subsea permafrost modeled with CryoGRID2, J. Geophys. Res.-Earth, 124, 920–937, https://doi.org/10.1029/2018JF004823, 2019. a
Angelopoulos, M., Overduin, P. P., Westermann, S., Tronicke, J., Strauss, J., Schirrmeister, L., Biskaborn, B. K., Liebner, S., Maksimov, G., Grigoriev, M. N., and Grosse, G: Thermokarst lake to lagoon transitions in eastern Siberia: Do submerged taliks refreeze?, J. Geophys. Res.-Earth, 125, e2019JF005424, https://doi.org/10.1029/2019JF005424, 2020. a, b, c
Arp, C. D., Jones, B. M., Grosse, G., Bondurant, A. C., Romanovsky, V. E., Hinkel, K. M., and Parsekian, A. D.: Threshold sensitivity of shallow Arctic lakes and sublake permafrost to changing winter climate, Geophys. Res. Lett., 43, 6358–6365, https://doi.org/10.1002/2016GL068506, 2016. a
Bartsch, A., Pointner, G., Leibman, M. O., Dvornikov, Y. A., Khomutov, A. V., and Trofaier, A. M.: Circumpolar mapping of ground-fast lake ice, Front. Earth Sci., 5, 12, https://doi.org/10.3389/feart.2017.00012, 2017. a
Bastviken, D., Ejlertsson, J., and Tranvik, L.: Measurement of methane oxidation in lakes: a comparison of methods, Environ. Sci. Technol., 36, 3354–3361, https://doi.org/10.1021/es010311p, 2002. a
Bastviken, D., Cole, J., Pace, M., and Tranvik, L.: Methane emissions from lakes: Dependence of lake characteristics, two regional assessments, and a global estimate, Global Biogeochem. Cy., 18, GB4009, https://doi.org/10.1029/2004GB002238, 2004. a, b
Bastviken, D., Cole, J. J., Pace, M. L., and Van de Bogert, M. C.: Fates of methane from different lake habitats: Connecting whole-lake budgets and CH4 emissions, J. Geophys. Res.-Biogeo., 113, G02024, https://doi.org/10.1029/2007JG000608, 2008. a, b
Biskaborn, B. K., Herzschuh, U., Bolshiyanov, D., Savelieva, L., and Diekmann, B.: Environmental variability in northeastern Siberia during the last 13 300 years inferred from lake diatoms and sediment-geochemical parameters, Palaeogeogr. Palaeocl., 329, 22–36, https://doi.org/10.1016/j.palaeo.2012.02.003, 2012. a
Biskaborn, B. K., Herzschuh, U., Bolshiyanov, D., Savelieva, L., Zibulski, R., and Diekmann, B.: Late Holocene thermokarst variability inferred from diatoms in a lake sediment record from the Lena Delta, Siberian Arctic, J. Paleolimnol., 49, 155–170, https://doi.org/10.1007/s10933-012-9650-1, 2013a. a
Biskaborn, B. K., Herzschuh, U., Bolshiyanov, D. Y., Schwamborn, G., and Diekmann, B.: Thermokarst processes and depositional events in a tundra lake, northeastern Siberia, Permafrost Periglac., 24, 160–174, https://doi.org/10.1002/ppp.1769, 2013b. a
Biskaborn, B. K., Subetto, D., Savelieva, L. A., Vakhrameeva, P. S., Hansche, A., Herzschuh, U., Klemm, J., Heinecke, L., Pestryakova, L., Meyer, H., Kuhn, G., and Diekmann, B.: Late Quaternary vegetation and lake system dynamics in north-eastern Siberia: implications for seasonal climate variability, Quaternary Sci. Rev., 147, 406–421, https://doi.org/10.1016/j.quascirev.2015.08.014, 2016. a
Biskaborn, B. K., Smith, S. L., Noetzli, J., et al.: Permafrost is warming at a global scale, Nat. Commun., 10, 264, https://doi.org/10.1038/s41467-018-08240-4, 2019. a
Boereboom, T., Depoorter, M., Coppens, S., and Tison, J.-L.: Gas properties of winter lake ice in Northern Sweden: implication for carbon gas release, Biogeosciences, 9, 827–838, https://doi.org/10.5194/bg-9-827-2012, 2012. a, b, c, d
Boike, J., Kattenstroth, B., Abramova, K., Bornemann, N., Chetverova, A., Fedorova, I., Fröb, K., Grigoriev, M., Grüber, M., Kutzbach, L., Langer, M., Minke, M., Muster, S., Piel, K., Pfeiffer, E.-M., Stoof, G., Westermann, S., Wischnewski, K., Wille, C., and Hubberten, H.-W.: Baseline characteristics of climate, permafrost and land cover from a new permafrost observatory in the Lena River Delta, Siberia (1998–2011), Biogeosciences, 10, 2105–2128, https://doi.org/10.5194/bg-10-2105-2013, 2013. a
Bussmann, I.: Distribution of methane in the Lena Delta and Buor-Khaya Bay, Russia, Biogeosciences, 10, 4641–4652, https://doi.org/10.5194/bg-10-4641-2013, 2013. a
Bussmann, I., Hackbusch, S., Schaal, P., and Wichels, A.: Methane distribution and oxidation around the Lena Delta in summer 2013, Biogeosciences, 14, 4985–5002, https://doi.org/10.5194/bg-14-4985-2017, 2017. a, b
Canelhas, M. R., Denfeld, B. A., Weyhenmeyer, G. A., Bastviken, D., and Bertilsson, S.: Methane oxidation at the water-ice interface of an ice-covered lake, Limnol. Oceanogr., 61, 78–90, https://doi.org/10.1002/lno.10288, 2016. a, b, c, d, e
Charkin, A. N., Rutgers van der Loeff, M., Shakhova, N. E., Gustafsson, Ö., Dudarev, O. V., Cherepnev, M. S., Salyuk, A. N., Koshurnikov, A. V., Spivak, E. A., Gunar, A. Y., Ruban, A. S., and Semiletov, I. P.: Discovery and characterization of submarine groundwater discharge in the Siberian Arctic seas: a case study in the Buor-Khaya Gulf, Laptev Sea, The Cryosphere, 11, 2305–2327, https://doi.org/10.5194/tc-11-2305-2017, 2017. a
Cole, J. J., Prairie, Y. T., Caraco, N. F., McDowell, W. H., Tranvik, L. J., Striegl, R. G., Duarte, C. M., Kortelainen, P., Downing, J. A., Middelburg, J. J., and Melack, J.: Plumbing the global carbon cycle: integrating inland waters into the terrestrial carbon budget, Ecosystems, 10, 172–185, https://doi.org/10.1007/s10021-006-9013-8, 2007. a
Coleman, D. D., Risatti, J. B., and Schoell, M.: Fractionation of carbon and hydrogen isotopes by methane-oxidizing bacteria, Geochim. Cosmochim. Ac., 45, 1033–1037, https://doi.org/10.1016/0016-7037(81)90129-0, 1981. a
Conrad, R.: The global methane cycle: recent advances in understanding the microbial processes involved, Env. Microbiol. Rep., 1, 285–292, https://doi.org/10.1111/j.1758-2229.2009.00038.x, 2009. a
Cowen, J. P., Wen, X., and Popp, B. N.: Methane in aging hydrothermal plumes, Geochim. Cosmochim. Ac., 66, 3563–3571, https://doi.org/10.1016/S0016-7037(02)00975-4, 2002. a
Craig, H.: Isotopic variations in meteoric waters, Science, 133, 1702–1703, https://doi.org/10.1126/science.133.3465.1702, 1961. a, b
Damm, E., Mackensen, A., Budéus, G., Faber, E., and Hanfland, C.: Pathways of methane in seawater: Plume spreading in an Arctic shelf environment (SW-Spitsbergen), Cont. Shelf Res., 25, 1453–1472, https://doi.org/10.1016/j.csr.2005.03.003, 2005. a, b
Damm, E., Schauer, U., Rudels, B., and Haas, C.: Excess of bottom-released methane in an Arctic shelf sea polynya in winter, Cont. Shelf Res., 27, 1692–1701, https://doi.org/10.1016/j.csr.2007.02.003, 2007. a
Damm, E., Rudels, B., Schauer, U., Mau, S., and Dieckmann, G.: Methane excess in Arctic surface water-triggered by sea ice formation and melting, Sci. Rep.-UK, 5, 16179, https://doi.org/10.1038/srep16179, 2015. a
Dansgaard, W.: Stable isotopes in precipitation, Tellus A, 16, 436–468, https://doi.org/10.1111/j.2153-3490.1964.tb00181.x, 1964. a, b
Denfeld, B. A., Baulch, H. M., del Giorgio, P. A., Hampton, S. E., and Karlsson, J.: A synthesis of carbon dioxide and methane dynamics during the ice-covered period of northern lakes, Limnol. Oceanogr., 3, 117–131, https://doi.org/10.1002/lol2.10079, 2018. a, b
Fedorova, I., Chetverova, A., Bolshiyanov, D., Makarov, A., Boike, J., Heim, B., Morgenstern, A., Overduin, P. P., Wegner, C., Kashina, V., Eulenburg, A., Dobrotina, E., and Sidorina, I.: Lena Delta hydrology and geochemistry: long-term hydrological data and recent field observations, Biogeosciences, 12, 345–363, https://doi.org/10.5194/bg-12-345-2015, 2015. a
Gibson, J. and Prowse, T.: Isotopic characteristics of ice cover in a large northern river basin, Hydrol. Process., 13, 2537–2548, https://doi.org/10.1002/(SICI)1099-1085(199911)13:16<2537::AID-HYP940>3.0.CO;2-A, 1999. a, b, c, d
Gibson, J. and Prowse, T.: Stable isotopes in river ice: identifying primary over-winter streamflow signals and their hydrological significance, Hydrol. Process., 16, 873–890, https://doi.org/10.1002/hyp.366, 2002. a, b
Grosse, G., Schirrmeister, L., Siegert, C., Kunitsky, V. V., Slagoda, E. A., Andreev, A. A., and Dereviagyn, A. Y.: Geological and geomorphological evolution of a sedimentary periglacial landscape in Northeast Siberia during the Late Quaternary, Geomorphology, 86, 25–51, https://doi.org/10.1016/j.geomorph.2006.08.005, 2007. a
Grosse, G., Jones, B., and Arp, C.: Thermokarst Lakes, Drainage, and Drained Basins, in: Treatise on Geomorphology, edited by: Shroder, J. F., Academic Press, San Diego, USA, 325–353, https://doi.org/10.1016/B978-0-12-374739-6.00216-5, 2013. a
Günther, F., Overduin, P. P., Sandakov, A. V., Grosse, G., and Grigoriev, M. N.: Short- and long-term thermo-erosion of ice-rich permafrost coasts in the Laptev Sea region, Biogeosciences, 10, 4297–4318, https://doi.org/10.5194/bg-10-4297-2013, 2013. a
Günther, F., Overduin, P. P., Yakshina, I. A., Opel, T., Baranskaya, A. V., and Grigoriev, M. N.: Observing Muostakh disappear: permafrost thaw subsidence and erosion of a ground-ice-rich island in response to arctic summer warming and sea ice reduction, The Cryosphere, 9, 151–178, https://doi.org/10.5194/tc-9-151-2015, 2015. a, b, c
Harris, C. M., McClelland, J. W., Connelly, T. L., Crump, B. C., and Dunton, K. H.: Salinity and Temperature Regimes in Eastern Alaskan Beaufort Sea Lagoons in Relation to Source Water Contributions, Estuaries Coasts, 40, 50–62, https://doi.org/10.1007/s12237-016-0123-z, 2017. a
Hugelius, G., Strauss, J., Zubrzycki, S., Harden, J. W., Schuur, E. A. G., Ping, C.-L., Schirrmeister, L., Grosse, G., Michaelson, G. J., Koven, C. D., O'Donnell, J. A., Elberling, B., Mishra, U., Camill, P., Yu, Z., Palmtag, J., and Kuhry, P.: Estimated stocks of circumpolar permafrost carbon with quantified uncertainty ranges and identified data gaps, Biogeosciences, 11, 6573–6593, https://doi.org/10.5194/bg-11-6573-2014, 2014. a
Juhls, B., Stedmon, C. A., Morgenstern, A., Meyer, H., Hölemann, J., Heim, B., Povazhnyi, V., and Overduin, P. P.: Identifying Drivers of Seasonality in Lena River Biogeochemistry and Dissolved Organic Matter Fluxes, Front. Environ. Sci., 8, 53, https://doi.org/10.3389/fenvs.2020.00053, 2020. a
Karlsson, J., Giesler, R., Persson, J., and Lundin, E.: High emission of carbon dioxide and methane during ice thaw in high latitude lakes, Geophys. Res. Lett., 40, 1123–1127, https://doi.org/10.1002/grl.50152, 2013. a
Kelly, C. A. and Chynoweth, D. P.: The contributions of temperature and of the input of organic matter in controlling rates of sediment methanogenesis, Limnol. Oceanogr., 26, 891–897, https://doi.org/10.4319/lo.1981.26.5.0891, 1981. a
Knoblauch, C., Beer, C., Liebner, S., Grigoriev, M. N., and Pfeiffer, E.-M.: Methane production as key to the greenhouse gas budget of thawing permafrost, Nat. Clim. Change, 8, 309–312, https://doi.org/10.1038/s41558-018-0095-z, 2018. a
Koven, C. D., Ringeval, B., Friedlingstein, P., Ciais, P., Cadule, P., Khvorostyanov, D., Krinner, G., and Tarnocai, C.: Permafrost carbon-climate feedbacks accelerate global warming, P. Natl. Acad. Sci. USA, 108, 14769–14774, https://doi.org/10.1073/pnas.1103910108, 2011. a
Krembs, C. and Engel, A.: Abundance and variability of microorganisms and transparent exopolymer particles across the ice–water interface of melting first-year sea ice in the Laptev Sea (Arctic), Mar. Biol., 138, 173–185, https://doi.org/10.1007/s002270000396, 2001. a
Lacelle, D.: On the δ18O, δD and D-excess relations in meteoric precipitation and during equilibrium freezing: theoretical approach and field examples, Permafrost Periglac., 22, 13–25, https://doi.org/10.1002/ppp.712, 2011. a, b, c, d, e, f
Langer, M., Westermann, S., Walter Anthony, K., Wischnewski, K., and Boike, J.: Frozen ponds: production and storage of methane during the Arctic winter in a lowland tundra landscape in northern Siberia, Lena River delta, Biogeosciences, 12, 977–990, https://doi.org/10.5194/bg-12-977-2015, 2015. a, b
Lantuit, H., Atkinson, D., Paul Overduin, P., Grigoriev, M., Rachold, V., Grosse, G., and Hubberten, H.-W.: Coastal erosion dynamics on the permafrost-dominated Bykovsky Peninsula, north Siberia, 1951–2006, Polar Res., 30, 7341, https://doi.org/10.3402/polar.v30i0.7341, 2011. a, b, c
Lidstrom, M. E. and Somers, L.: Seasonal study of methane oxidation in Lake Washington, Appl. Environ. Microb., 47, 1255–1260, 1984. a
Magritsky, D., Aibulatov, D., and Gorelkin, A.: Regularities in the Space and Time Flow Variations in the Near-Mouth Reach and Delta of the Lena R., Water Resour., 45, 12–26, https://doi.org/10.1134/S009780781801013X, 2018. a
Martinez-Cruz, K., Sepulveda-Jauregui, A., Walter Anthony, K., and Thalasso, F.: Geographic and seasonal variation of dissolved methane and aerobic methane oxidation in Alaskan lakes, Biogeosciences, 12, 4595–4606, https://doi.org/10.5194/bg-12-4595-2015, 2015. a
Mau, S., Blees, J., Helmke, E., Niemann, H., and Damm, E.: Vertical distribution of methane oxidation and methanotrophic response to elevated methane concentrations in stratified waters of the Arctic fjord Storfjorden (Svalbard, Norway), Biogeosciences, 10, 6267–6278, https://doi.org/10.5194/bg-10-6267-2013, 2013. a
McDougall, T. J. and Barker, P. M.: Getting started with TEOS-10 and the Gibbs Seawater (GSW) oceanographic toolbox, SCOR/IAPSO WG, available at: https://www.teos-10.org/ (last access: 15 February 2021), 2011. a
Meyer, H., Schönicke, L., Wand, U., Hubberten, H.-W., and Friedrichsen, H.: Isotope studies of hydrogen and oxygen in ground ice-experiences with the equilibration technique, Isot. Environ. Healt. S., 36, 133–149, https://doi.org/10.1080/10256010008032939, 2000. a
Meyer, H., Derevyagin, A. Y., Siegert, C., and Hubberten, H.-W.: Paleoclimate studies on Bykovsky Peninsula, North Siberia-hydrogen and oxygen isotopes in ground ice, Polarforschung, 70, 37–51, https://doi.org/10.2312/polarforschung.70.37, 2002. a
Michmerhuizen, C. M., Striegl, R. G., and McDonald, M. E.: Potential methane emission from north-temperate lakes following ice melt, Limnol. Oceanogr., 41, 985–991, https://doi.org/10.4319/lo.1996.41.5.0985, 1996. a
Nerem, R. S., Beckley, B. D., Fasullo, J. T., Hamlington, B. D., Masters, D., and Mitchum, G. T.: Climate-change-driven accelerated sea-level rise detected in the altimeter era, P. Natl. Acad. Sci. USA, 115, 2022–2025, https://doi.org/10.1073/pnas.1717312115, 2018. a
Overduin, P. P., Liebner, S., Knoblauch, C., Günther, F., Wetterich, S., Schirrmeister, L., Hubberten, H.-W., and Grigoriev, M. N.: Methane oxidation following submarine permafrost degradation: Measurements from a central Laptev Sea shelf borehole, J. Geophys. Res.-Biogeo., 120, 965–978, https://doi.org/10.1002/2014JG002862, 2015. a, b
Overduin, P. P., Wetterich, S., Günther, F., Grigoriev, M. N., Grosse, G., Schirrmeister, L., Hubberten, H.-W., and Makarov, A.: Coastal dynamics and submarine permafrost in shallow water of the central Laptev Sea, East Siberia, The Cryosphere, 10, 1449–1462, https://doi.org/10.5194/tc-10-1449-2016, 2016. a, b
Phelps, A. R., Peterson, K. M., and Jeffries, M. O.: Methane efflux from high-latitude lakes during spring ice melt, J. Geophys. Res.-Atmos., 103, 29029–29036, https://doi.org/10.1029/98JD00044, 1998. a, b
Powers, S. M. and Hampton, S. E.: Winter limnology as a new frontier, Limnology and Oceanography Bulletin, 25, 103–108, https://doi.org/10.1002/lob.10152, 2016. a
Romanovskii, N., Hubberten, H.-W., Gavrilov, A., Tumskoy, V., Tipenko, G., Grigoriev, M., and Siegert, C.: Thermokarst and land-ocean interactions, Laptev Sea region, Russia, Permafrost Periglac., 11, 137–152, https://doi.org/10.1002/1099-1530(200004/06)11:2<137::AID-PPP345>3.0.CO;2-L, 2000. a, b
Rudd, J. W. and Hamilton, R.: Methane cycling in a eutrophic shield lake and its effects on whole lake metabolism, Limnol. Oceanogr., 23, 337–348, https://doi.org/10.4319/lo.1978.23.2.0337, 1978. a
Sasaki, M., Imura, S., Kudoh, S., Yamanouchi, T., Morimoto, S., and Hashida, G.: Methane efflux from bubbles suspended in ice-covered lakes in Syowa Oasis, East Antarctica, J. Geophys. Res., 114, D18114, https://doi.org/10.1029/2009JD011849, 2009. a
Schirrmeister, L., Kunitsky, V., Grosse, G., Wetterich, S., Meyer, H., Schwamborn, G., Babiy, O., Derevyagin, A., and Siegert, C.: Sedimentary characteristics and origin of the Late Pleistocene Ice Complex on north-east Siberian Arctic coastal lowlands and islands – A review, Quatern. Int., 241, 3–25, https://doi.org/10.1016/j.quaint.2010.04.004, 2011. a
Schirrmeister, L., Grigoriev, M. N., Strauss, J., Grosse, G., Overduin, P. P., Kholodov, A., Guenther, F., and Hubberten, H.-W.: Sediment characteristics of a thermokarst lagoon in the northeastern Siberian Arctic (Ivashkina Lagoon, Bykovsky Peninsula), Arktos, 4, 1–16, https://doi.org/10.1007/s41063-018-0049-8, 2018. a
Schleusner, P., Biskaborn, B. K., Kienast, F., Wolter, J., Subetto, D., and Diekmann, B.: Basin evolution and palaeoenvironmental variability of the thermokarst lake El'gene-Kyuele, Arctic Siberia, Boreas, 44, 216–229, https://doi.org/10.1111/bor.12084, 2015. a
Schuur, E. A., McGuire, A. D., Schädel, C., Grosse, G., Harden, J., Hayes, D. J., Hugelius, G., Koven, C., Kuhry, P., Lawrence, D. M., Natali, S. M., Olefeldt, D., Romanovsky, V. E., Schaefer, K., Turetsky, M. R., Treat, C. C., and Vonk, J. E.: Climate change and the permafrost carbon feedback, Nature, 520, 171–179, https://doi.org/10.1038/nature14338, 2015. a, b
Smith, I., Eicken, H., Mahoney, A., Van Hale, R., Gough, A., Fukamachi, Y., and Jones, J.: Surface water mass composition changes captured by cores of Arctic land-fast sea ice, Cont. Shelf Res., 118, 154–164, https://doi.org/10.1016/j.csr.2016.02.008, 2016. a
Spangenberg, I., Overduin, P. P., Damm, E., Bussmann, I., Meyer, H., Liebner, S., Angelopoulos, M., Biskaborn, B. K., Grigoriev, M. N., and Grosse, G.: Dissolved methane and hydrochemical parameters in ice cores from April 2017 of a bay, thermokarst lagoon, and thermokarst lake, Bykovsky Peninsula, Lena Delta area, PANGAEA, https://doi.org/10.1594/PANGAEA.913642, 2020. a
Souchez, R. and Jouzel, J.: On the isotopic composition in δD and δ18O of water and ice during freezing, J. Glaciol., 30, 369–372, https://doi.org/10.3189/s0022143000006249, 1984. a, b
Strauss, J., Schirrmeister, L., Grosse, G., Wetterich, S., Ulrich, M., Herzschuh, U., and Hubberten, H.-W.: The deep permafrost carbon pool of the Yedoma region in Siberia and Alaska, Geophys. Res. Lett., 40, 6165–6170, https://doi.org/10.1002/2013GL058088, 2013. a
Strauss, J., Boike, J., Bolshiyanov, D. Y., Grigoriev, M. N., El-Hajj, H., Morgenstern, A., Overduin, P. P., and Udke, A.: Russian-German Cooperation: Expeditions to Siberia in 2017, in: Berichte zur Polar- und Meeresforschung = Reports on Polar and Marine Research, Alfred-Wegener-Institut, Helmholtz-Zentrum für Polar- und Meeresforschung, Bremerhaven, Germany, 1–296, https://doi.org/10.2312/BzPM_0725_2018, 2018. a, b, c
Toyota, T., Smith, I. J., Gough, A. J., Langhorne, P. J., Leonard, G. H., Hale, R. J. V., Mahoney, A. R., and Haskell, T. G.: Oxygen-isotope fractionation during the freezing of seawater, J. Glaciol., 59, 697–710, https://doi.org/10.3189/2013JoG12J163, 2013. a
Tranter, M.: Isotopic Fractionation of Freezing Water, Springer, Dordrecht, Netherlands, 668–669, https://doi.org/10.1007/978-90-481-2642-2_310, 2011. a
Turetsky, M. R., Abbott, B. W., Jones, M. C., Anthony, K. W., Olefeldt, D., Schuur, E. A., Koven, C., McGuire, A. D., Grosse, G., Kuhry, P., Hugelius, G., Lawrence, D. M., Gibson, C., and Sannel, A. B. K.: Permafrost collapse is accelerating carbon release, Nature, 569, 32–34, https://doi.org/10.1038/d41586-019-01313-4, 2019. a
Valentine, D. L., Blanton, D. C., Reeburgh, W. S., and Kastner, M.: Water column methane oxidation adjacent to an area of active hydrate dissociation, Eel River Basin, Geochim. Cosmochim. Ac., 65, 2633–2640, https://doi.org/10.1016/S0016-7037(01)00625-1, 2001. a
Walter, K. M., Zimov, S. A., Chanton, J. P., Verbyla, D., and Chapin III, F.: Methane bubbling from Siberian thaw lakes as a positive feedback to climate warming, Nature, 443, 71–75, https://doi.org/10.1038/nature05040, 2006. a, b
Walter, K. M., Smith, L. C., and Stuart Chapin III, F.: Methane bubbling from northern lakes: present and future contributions to the global methane budget, Philos. T. Roy. Soc. A, 365, 1657–1676, https://doi.org/10.1098/rsta.2007.2036, 2007. a
Walter, K. M., Chanton, J., Chapin, F., Schuur, E., and Zimov, S.: Methane production and bubble emissions from arctic lakes: Isotopic implications for source pathways and ages, J. Geophys. Res.-Biogeo., 113, G00A08, https://doi.org/10.1029/2007JG000569, 2008. a
Walter Anthony, K. M. and Anthony, P.: Constraining spatial variability of methane ebullition seeps in thermokarst lakes using point process models, J. Geophys. Res.-Biogeo., 118, 1015–1034, https://doi.org/10.1002/jgrg.20087, 2013. a, b, c
Walter Anthony, K. M., Vas, D. A., Brosius, L., Chapin, F. S., Zimov, S. A., and Zhuang, Q.: Estimating methane emissions from northern lakes using ice-bubble surveys, Limnol. Oceanogr.-Meth., 8, 592–609, https://doi.org/10.4319/lom.2010.8.0592, 2010. a, b
Walter Anthony, K. M., Schneider von Deimling, T., Nitze, I., Frolking, S., Emond, A., Daanen, R., Anthony, P., Lindgren, P., Jones, B., and Grosse, G.: 21st-century modeled permafrost carbon emissions accelerated by abrupt thaw beneath lakes, Nat. Commun., 9, 3262, https://doi.org/10.1038/s41467-018-05738-9, 2018. a
Whiticar, M. J.: Carbon and hydrogen isotope systematics of bacterial formation and oxidation of methane, Chem. Geol., 161, 291–314, https://doi.org/10.1016/S0009-2541(99)00092-3, 1999. a
Wiesenburg, D. A. and Guinasso Jr., N. L.: Equilibrium solubilities of methane, carbon monoxide, and hydrogen in water and sea water, J. Chem. Eng. Data, 24, 356–360, https://doi.org/10.1021/je60083a006, 1979. a
Wik, M., Crill, P. M., Bastviken, D., Danielsson, Å., and Norbäck, E.: Bubbles trapped in arctic lake ice: Potential implications for methane emissions, J. Geophys. Res.-Biogeo., 116, G03044, https://doi.org/10.1029/2011JG001761, 2011. a
Wik, M., Varner, R. K., Walter Anthony, K., MacIntyre, S., and Bastviken, D.: Climate-sensitive northern lakes and ponds are critical components of methane release, Nat. Geosci., 9, 99–105, https://doi.org/10.1038/ngeo2578, 2016. a, b
Winkel, M., Mitzscherling, J., Overduin, P. P., Horn, F., Winterfeld, M., Rijkers, R., Grigoriev, M. N., Knoblauch, C., Mangelsdorf, K., Wagner, D., and Liebner, S.: Anaerobic methanotrophic communities thrive in deep submarine permafrost, Sci. Rep.-UK, 8, 1291, https://doi.org/10.1038/s41598-018-19505-9, 2018. a
Winkel, M., Sepulveda-Jauregui, A., Martinez-Cruz, K., Heslop, J. K., Rijkers, R., Horn, F., Liebner, S., and Anthony, K. M. W.: First evidence for cold-adapted anaerobic oxidation of methane in deep sediments of thermokarst lakes, Environ. Res. Commun., 1, 021002, https://doi.org/10.1088/2515-7620/ab1042, 2019. a
Zeikus, J. and Winfrey, M.: Temperature limitation of methanogenesis in aquatic sediments, Appl. Environ. Microb., 31, 99–107, 1976. a
Zimov, S. A., Schuur, E. A., and Chapin, F. S.: Permafrost and the global carbon budget, Science, 312, 1612–1613, https://doi.org/10.1126/science.1128908, 2006. a, b