the Creative Commons Attribution 4.0 License.
the Creative Commons Attribution 4.0 License.
 | 22 Mar 2021
Basal traction mainly dictated by hard-bed physics over grounded regions of Greenland
Florent Gimbert
Fabien Gillet-Chaulet
Adrien Gilbert
On glaciers and ice sheets, identifying the relationship between velocity and traction is critical to constrain the bed physics that controls ice flow. Yet in Greenland, these relationships remain unquantified. We determine the spatial relationship between velocity and traction in all eight major drainage catchments of Greenland. The basal traction is estimated using three different methods over large grid cells to minimize interpretation biases associated with unconstrained rheologic parameters used in numerical inversions. We find the relationships are consistent with our current understanding of basal physics in each catchment. We identify catchments that predominantly show Mohr–Coulomb-like behavior typical of deforming beds or significant cavitation, as well as catchments that predominantly show rate-strengthening behavior typical of Weertman-type hard-bed physics. Overall, the traction relationships suggest that the flow field and surface geometry of the grounded regions in Greenland is mainly dictated by Weertman-type hard-bed physics up to velocities of approximately 450 m yr−1, except within the Northeast Greenland Ice Stream and areas near floatation. Depending on the catchment, behavior of the fastest-flowing ice (∼ 1000 m yr−1) directly inland from marine-terminating outlets exhibits Weertman-type rate strengthening, Mohr–Coulomb-like behavior, or is not confidently resolved given our methodology. Given the complex basal boundary across Greenland, the relationships are captured reasonably well by simple traction laws which provide a parameterization that can be used to model ice dynamics at large scales. The results and analysis serve as a first constraint on the physics of basal motion over the grounded regions of Greenland and provide unique insight into future dynamics and vulnerabilities in a warming climate.
- Article
(4212 KB) - Full-text XML
-
Supplement
(3907 KB) - BibTeX
- EndNote


For glaciers and ice sheets the relationship between basal motion, basal traction, and the response to external forcing are fundamental to realistic ice flow modeling. The physics that control the interdependencies between these characteristics is dictated by the properties of the bed. For hard beds basal traction is related to the viscous drag generated as ice slides around bed roughness (Weertman, 1964). Meltwater modulates friction and sliding over hard beds by occupying cavities on the lee side of bedrock bumps (Gagliardini et al., 2007; Lliboutry, 1968; Schoof, 2005), increasing sliding by reducing the apparent roughness of the bedrock. For deformable till beds the traction and occurrence of basal motion primarily depends on the failure strength of the till which acts as a Mohr–Coulomb material (Iverson et al., 1998; Kamb, 1991; Tulaczyk, 1999; Zoet and Iverson, 2020). Meltwater can weaken deformable beds by increasing pore pressures within the till (Iverson et al., 1998, 2003) and induce bed deformation where there was previously none.
Constraining the type of bed is critical to understanding the dynamic response to future forcing given the difference in the physical processes that control ice motion (Bougamont et al., 2014). In Greenland, the composition of the basal substrate is known to vary significantly. There are both hard and till beds (Booth et al., 2012; Cooper et al., 2019; Dow et al., 2013; Doyle et al., 2018; Harper et al., 2017; Kulessa et al., 2017; Lindbäck and Pettersson, 2015; Lüthi et al., 2002). The exact distribution of each is unknown, but direct observations have shown that they coexist at the regional scale (Booth et al., 2012; Dow et al., 2013; Harper et al., 2017). Hydrologic regimes also vary significantly. In low-elevation regions meltwater is delivered to the bed via supraglacial routing of water into moulins (Smith et al., 2015), while at higher elevations water stored in supraglacial lakes can be suddenly injected into the basal interface during catastrophic lake drainages (Das et al., 2008; Stevens et al., 2015). In other regions, basal melting from high geothermal heat fluxes provides an in situ source of basal water independent of surface melt (Fahnestock et al., 2001).
Given the complexity of the basal boundary in Greenland, the roles of different physical processes operating at the base in controlling sliding speeds and surface geometry of the ice sheet at large scales have historically been difficult to quantify. Improvements over the last decade in satellite observations of surface velocity and geometry have made it possible to infer bed properties across ice thickness length scales based on ice dynamics (Gillet-Chaulet et al., 2016; Habermann et al., 2013; Minchew et al., 2016). The main approach is to use time variations in the ice flow and surface geometry to constrain characteristic properties of different bed types (Gillet-Chaulet et al., 2016; Habermann et al., 2013). This approach has been used to infer the apparent sliding exponent at Pine Island Glacier and in Antarctica (Gillet-Chaulet et al., 2016) and changes in bed strength underneath Jakobshavn Isbræ (Habermann et al., 2013). However, using time variations to constrain bed properties is limited to regions where large changes in the surface speeds and ice geometry coincide and cannot be applied to much of the ice sheet where dynamic changes are small.
An alternative way to infer bed properties is to use the spatial distribution of velocity and traction to determine the physical relationship between the variables. A study on Hofsjökull, a small isothermal ice cap located in Iceland, used inverted tractions and sliding velocities to show that the relationship between velocity and traction is consistent with deforming bed physics (Minchew et al., 2016). Yet explicitly inverting for basal traction using a shallow approximation or full-Stokes representation of the momentum balance yields a traction solution that is non-unique and is dependent on the a priori choice of model parameters including both physical parameters related to ice rheology and parameters within regularization schemes necessary to stabilize the numerical solvers and avoid data overfit (Habermann et al., 2013; Shapero et al., 2016). The influence of the parameters on traction solution is difficult to evaluate but is expected to be particularly important where rheologic parameters are poorly constrained leading to biases in the interpretations of the bed conditions (Habermann et al., 2013; Joughin et al., 2012).
The nonlinear ice rheology dictated by Glen's law is only known to an approximate degree but is known to have strong dependencies on ice temperature (Cuffey and Paterson, 2010). The Greenland Ice Sheet (GrIS) has a complex polythermal structure especially near the margin where cryohydrologic warming is pervasive (Harrington et al., 2015; Lüthi et al., 2015). Further, in Greenland the uncertainty of the deformation exponent, n, is large. Direct estimates of n range considerably from 2.5 to 4.5 (Bons et al., 2018; Dahl-Jensen and Gundestrup, 1987; Gillet-Chaulet et al., 2011; Lüthi et al., 2002; Ryser et al., 2014). Other aspects of ice flow such as crevasses that are common in regions of concentrated fast flow (Cavanagh et al., 2017; Lampkin et al., 2013) and in extensional regimes (Poinar et al., 2015) are not accounted for in high-order inversions but could significantly impact the relationship between the velocity field and higher-order stresses (stress gradients). Together, these aspects make it difficult to confidently estimate the rheology to invert for tractions across the Greenland Ice Sheet and use the spatial relationship between basal traction and velocity to infer bed properties. An initial study found no relationship between velocities and tractions for the fast-flowing outlet glaciers located on the periphery of Greenland (Stearns and van der Veen, 2018), a result which is still under debate (Minchew et al., 2019; Stearns and van der Veen, 2019).
In this study, we compare multi-year-averaged surface velocities to the basal traction estimated using three different methods with differing complexity over large 6 km × 6 km grid cells (Fig. 1) to determine the form of the velocity–traction relationship within all eight drainage catchments in Greenland (Zwally et al., 2012). Our hierarchical approach to infer the basal traction is designed to minimize interpretation bias associated with parameter choice in numerical inversions. Averaging the traction across large length scales diminishes the role of higher-order stresses and thus the need to correctly prescribe the ice rheology to invert for basal traction. Using the three inversions with different complexity (shallow-ice approximation, SIA; shallow-stream approximation, SSA; and full Stokes, FS), we can determine the length scale at which the influence of higher-order stresses is minimized. Further, we can separately identify topographic-scale form drag, which arises from ice flowing around large-scale topography (Kyrke-Smith et al., 2018), and skin drag, which is the component of the basal resistance dictated by bed properties that are of interest for traction laws. Where the three inversions converge, we can confidently infer the form of the velocity and traction relationship, and where they diverge, we can constrain the range of basal physics possible given the different assumptions within each inversion method. We compare the form of the velocity–traction relationships to expectations given different bed physics to interpret the dominant basal processes operating at the catchment scale. Finally, we discuss the implications of the results for current and future ice dynamics in Greenland.
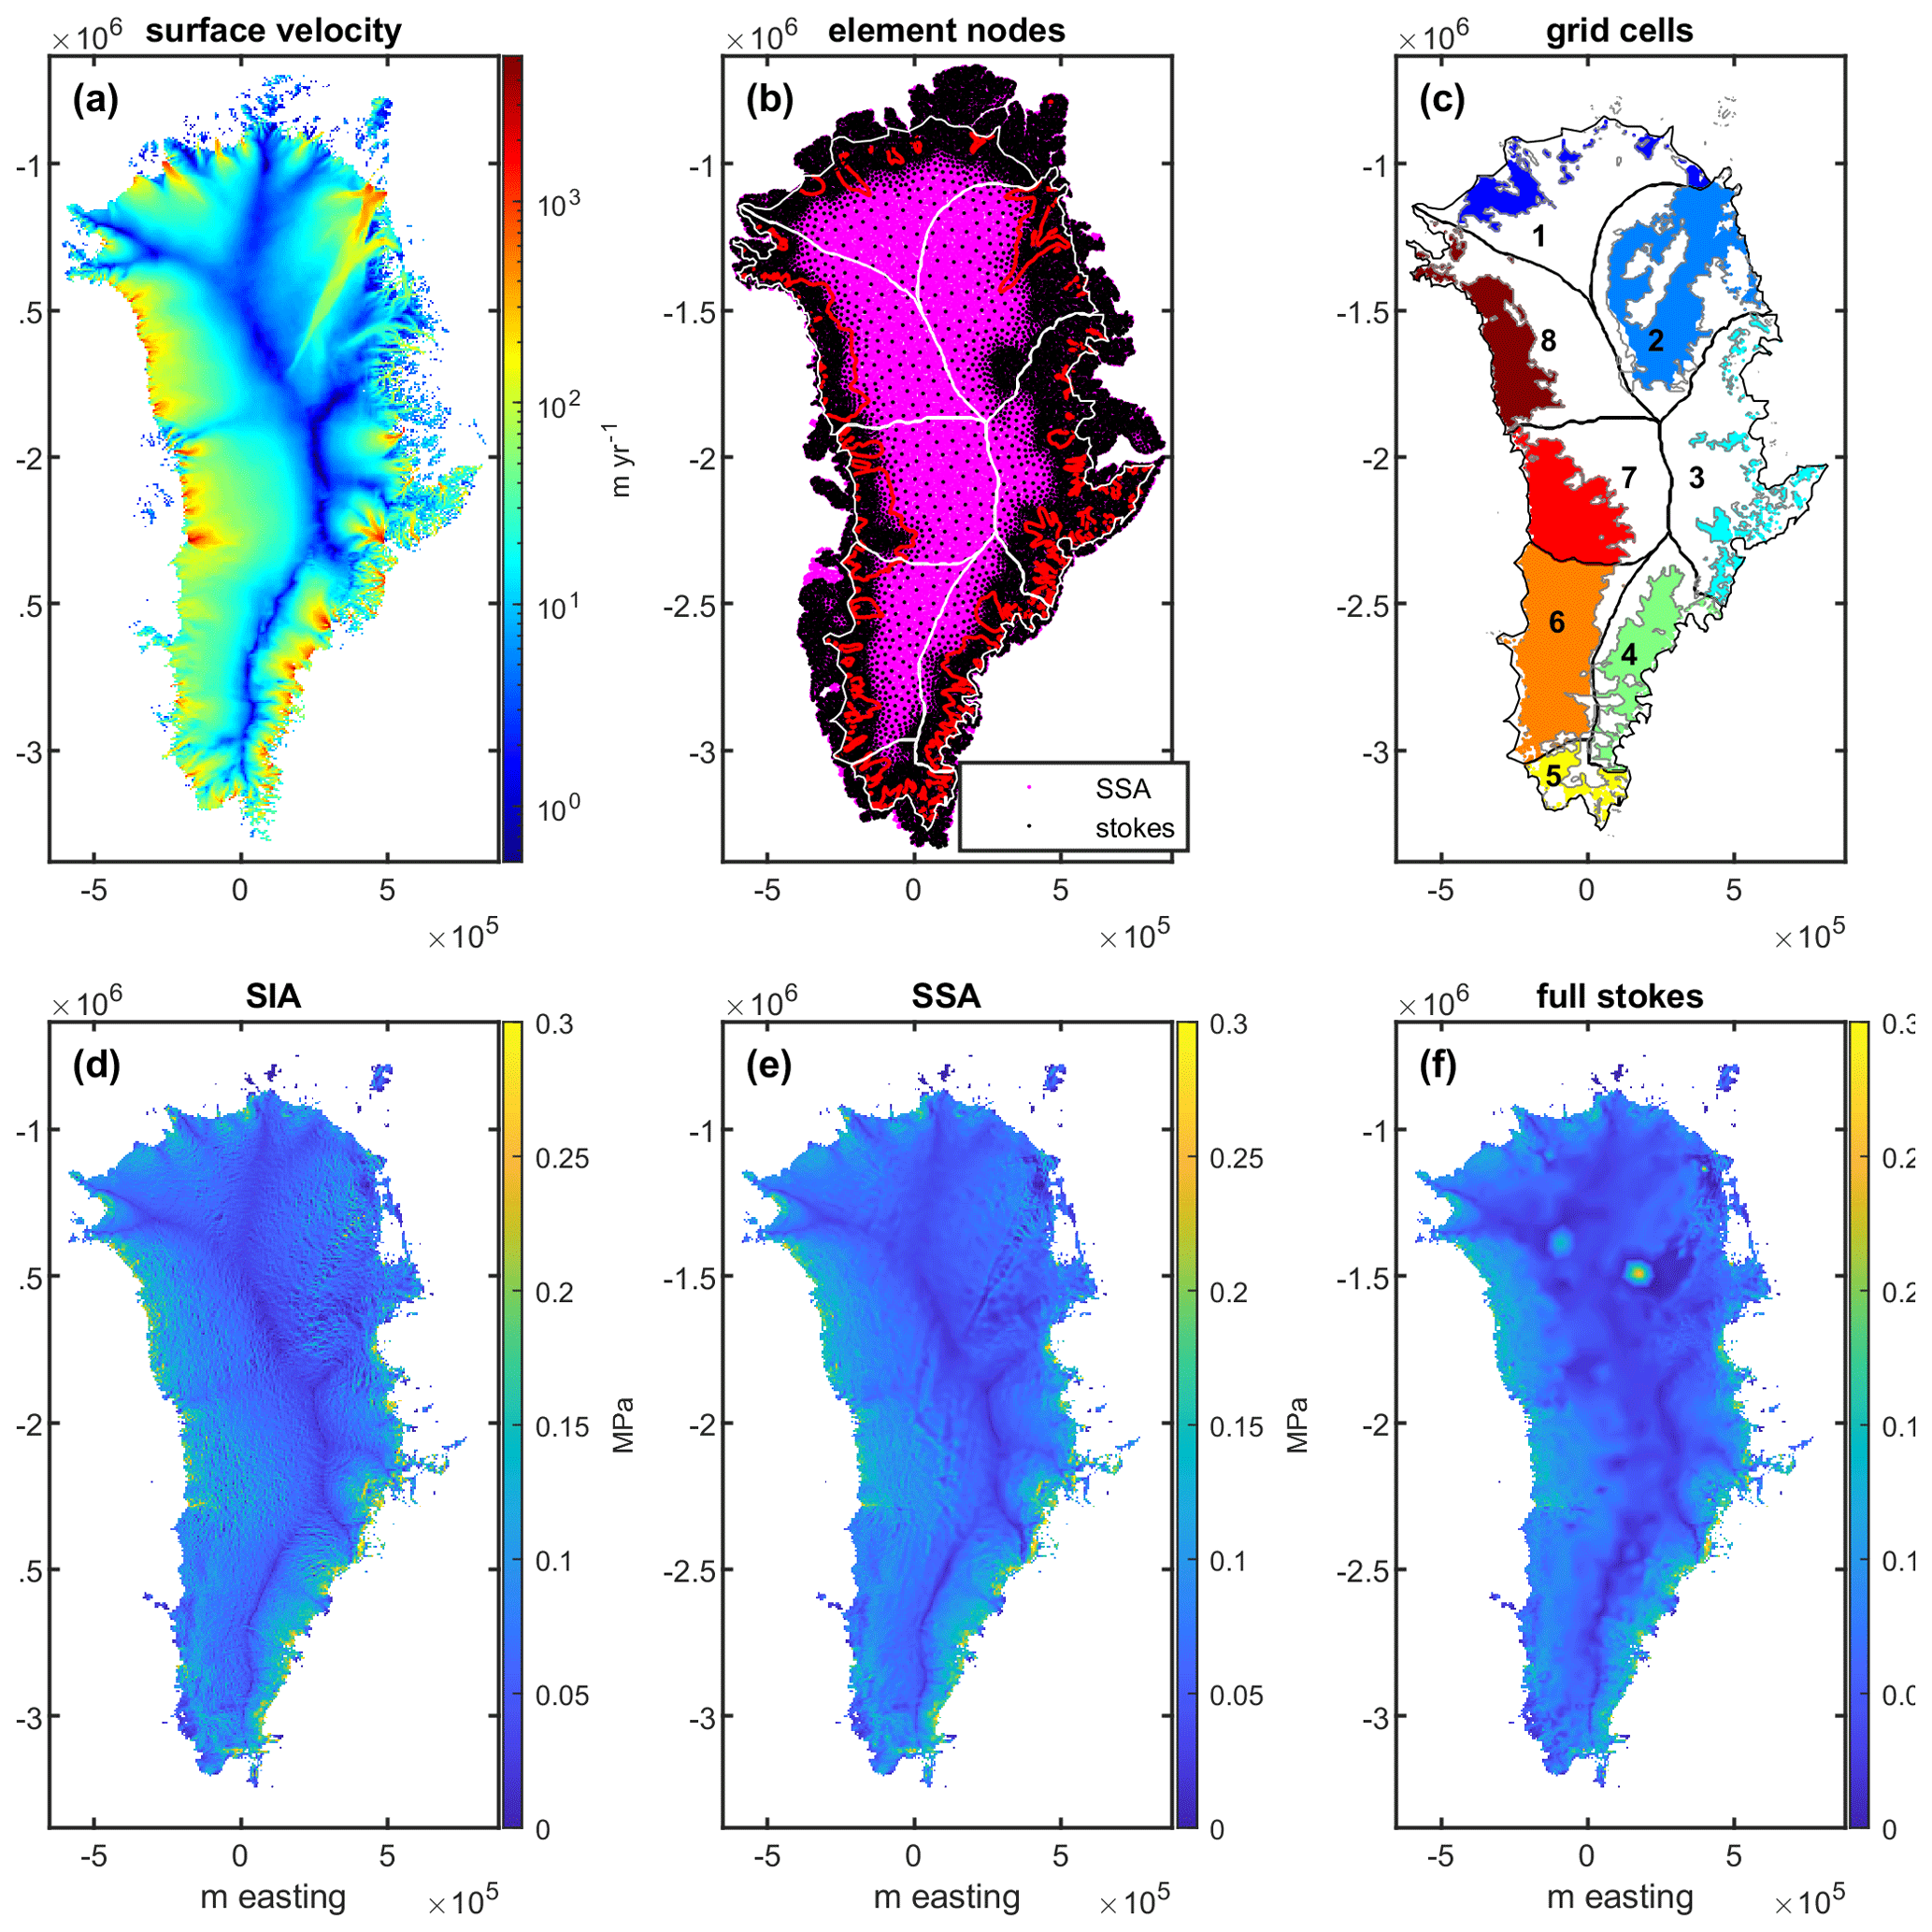
Figure 1(a) Multi-year surface velocity mosaic for GrIS (Joughin et al., 2018). (b) Element nodes for the SSA (pink dots) and FS (black dots) inversions. The red contour shows the 100 m yr−1 velocity contour which delineates the regions from the Stokes inversion used in the analysis. (c) Map of regions used in analysis. Black lines show drainage catchment delineation. The grey line indicates boundary of likely thawed region. (d) Driving stress calculated over 6 km × 6 km grid cells. (e) Basal traction from SSA inversion averaged over 6 km × 6 km grid cells. (f) Basal traction from FS inversion averaged over 6 km × 6 km grid cells.
2.1 Data
All three inversions use identical surface elevation, bed elevation, and surface velocity data sets (Fig. 1). We use the GIMP digital elevation model of the ice sheet surface (30 m resolution) (Howat et al., 2014, 2017) and ice thicknesses and bed topography from BedMachine v3 (150 m resolution) (Morlighem, 2018; Morlighem et al., 2017). We use surface velocities from a multi-year velocity mosaic (250 m resolution) with complete coverage of Greenland (Joughin et al., 2016, 2018) and low absolute errors (generally < 3 m yr−1). The velocities represent decadal-scale averages generated from data collected from 1995–2015 but are mostly derived from data from 2005–2015. The time averaging of velocities incorporates both summer and winter flow, and thus they are not expected to reflect a strong seasonality (Joughin et al., 2018). To ensure high data fidelity we exclude regions where the error and uncertainty in either the velocity or the driving stress exceeds 50 % of its magnitude (Supplement Fig. S7). We restrict our analysis to thawed regions of each catchment where basal motion is expected to occur. This is delineated using a map of the basal thermal state (Fig. 1) (MacGregor et al., 2016, 2017) which delineates thawed, frozen, and uncertain regions. We note our results do not significantly change if the uncertain regions are included in the analysis (Fig. S1).
2.2 Basal traction inversions
2.2.1 Shallow-ice approximation
The shallow-ice approximation (SIA) neglects higher-order stresses and thus assumes that the basal traction is equivalent to the gravitational driving stress (Morland and Johnson, 1980). The SIA is valid when the influence of stress–gradient coupling, which arises from spatially complex flow, is negligible, i.e., typically across length scales of roughly 10 ice thicknesses (Cuffey and Paterson, 2010; Kamb and Echelmeyer, 1986), and also where the effects of topographic-scale form drag are small, i.e., where the bed is mostly flat. While simple, the SIA does not require the use of unmeasured parameters for either the ice rheology or regularization schemes.
We calculate the driving stress across 6 km length scales using
where ρi is the density of ice (900 kg m−3); H is the ice thickness; g is the gravitation constant (9.81 m s−2); and α is the surface slope, which is calculated by taking the gradient of the surface elevations. Prior to the calculation, data sets are filtered with a 6 km × 6 km Gaussian kernel with a sigma optimized to minimize the difference between the SIA and SSA (shallow-stream approximation) estimates of traction. The choice of length scale is discussed further in Sect. 2.3. We decimate the driving stress and velocity data sets to 6 km grid spacing to generate independent cells. We scale the estimates of driving stress with the surface area of the bed in each grid cell to account for topographic variations which are needed to estimate skin drag (i.e., tangential tractions). This is equivalent to a shape factor commonly used for alpine glaciers (Cuffey and Paterson, 2010).
2.2.2 Shallow-stream approximation
The shallow-stream approximation (SSA) solves the vertically integrated form of the momentum balance in two dimensions which accounts for higher-order stresses that arise from gradients in the velocity field assuming shearing of the ice column is negligible (MacAyeal, 1989). This approximation is most valid for ice flow where shearing is limited or concentrated near the base. The method also implicitly assumes that interactions with the bed besides tangential tractions are negligible and does not explicitly account for topographic-scale form drag. The SSA is therefore most appropriate in regions where the bed topography is relatively flat.
The SSA inversion was implemented in Elmer/Ice, three-dimensional finite-element ice modeling software (Gagliardini et al., 2013; Goelzer et al., 2017). The inversion domain consists of a triangular element mesh with a resolution ranging from 500 m to 5 km across the ice sheet domain (Fig. 1). The model uses an ice rheology with a vertically averaged viscosity generated from ice temperatures from a paleo-spin-up of the SICOPOLIS model and n=3 (Goelzer et al., 2017; Seddik et al., 2012). The basal traction was inverted using the control-inverse method with a linear sliding law to find the “effective” friction coefficient which was optimized to minimize the misfit between the observed and modeled velocity (Gagliardini et al., 2013; Morlighem et al., 2010). This friction coefficient includes all the physical dependencies between sliding and tractions. While a linear sliding law is used for the inversion, the traction field is shown to have little sensitivity to the choice of sliding law (Joughin et al., 2004).
2.2.3 Full-Stokes inversion
The full-Stokes (FS) continuum equations represent the full momentum balance without simplifying assumptions. This means the traction inversions are made with full consideration of vertical shearing of the ice column, higher-order stresses, and topographic form drag as the ice flows around landscape-scale roughness.
The FS inversion is also implemented in Elmer/Ice on a variable-resolution triangular element mesh with a fine resolution (∼ 500 m) near the margin and coarse resolution within the interior (∼ 60 km) (Gagliardini et al., 2013; Goelzer et al., 2017). The large grid dimensions in the interior reduce the high computation costs of the FS, which allocates more resources near the margin where ice flow is more complex (Fig. 1). The ice rheology is calculated using ice temperatures from the SICOPOLIS paleo-spin-up updated for use in ISMIP6 and n=3, and the basal traction was inverted using the same methods as with the SSA. For consistency with the other inversions, we compare the FS traction field against the surface velocity in our analysis instead of the inverted sliding velocities. The results are very similar in both cases and do not change the interpretations presented in the paper (see Supplement).
2.3 Length scale for grid cells
We compare the traction estimates for grid cells with different dimensions to determine at what length scale the effects of higher-order stresses are small, and correspondingly, the biases associated with rheology choice in the numeric inversions are also small. To do so we compare SIA traction computed across grid cells with dimensions of 1.5–12 km to the traction from the SSA averaged across the same grid cells (Fig. 2). We use SSA instead of the FS inversion as it does not explicitly include bed interactions beyond traction, and thus differences in the comparison to the SIA traction estimates can be attributed solely to higher-order stresses. We find that averaged over length scales of 6 km, the mean difference between the two traction estimates on average is less than 0.016 MPa (Fig. 2) which on average is ∼ 17 % of the traction. The mean difference is similar for marginal flow (< 1200 m a.s.l.) and interior flow (> 1200 m a.s.l.) and thick (> 1500 m) and thin (< 1500 m) ice (Fig. 2), showing the length scale is appropriate for a wide range of glaciological settings. This is consistent with previous work which found spatially invariant filters can be used to estimate the driving stress for various ice thicknesses as long as the filter length is sufficiently long (McCormack et al., 2019). Increasing the length scale beyond 6 km further decreases the difference between the data sets; however, it does not change the data interpretations presented in the paper, which we note are also similar if a 3 km length scale is used (Figs. S2, S3). We choose to use 6 km grid cells in the analysis in order to maximize the resolution near the margins, lengthen the span of velocity and traction range used to determine the relationship between the variables, and provide more interpretable relationships in catchments 3 and 5 which have fewer grid cells. Like the SSA, the FS tractions are averaged across the 6 km grid cells for this analysis. Due to the coarse nature of the interior grid cells for the FS simulation, we only use grid cells where velocities are greater than 100 m yr−1 which conservatively delineates where the mesh resolution is less than 6 km (Fig. 1).
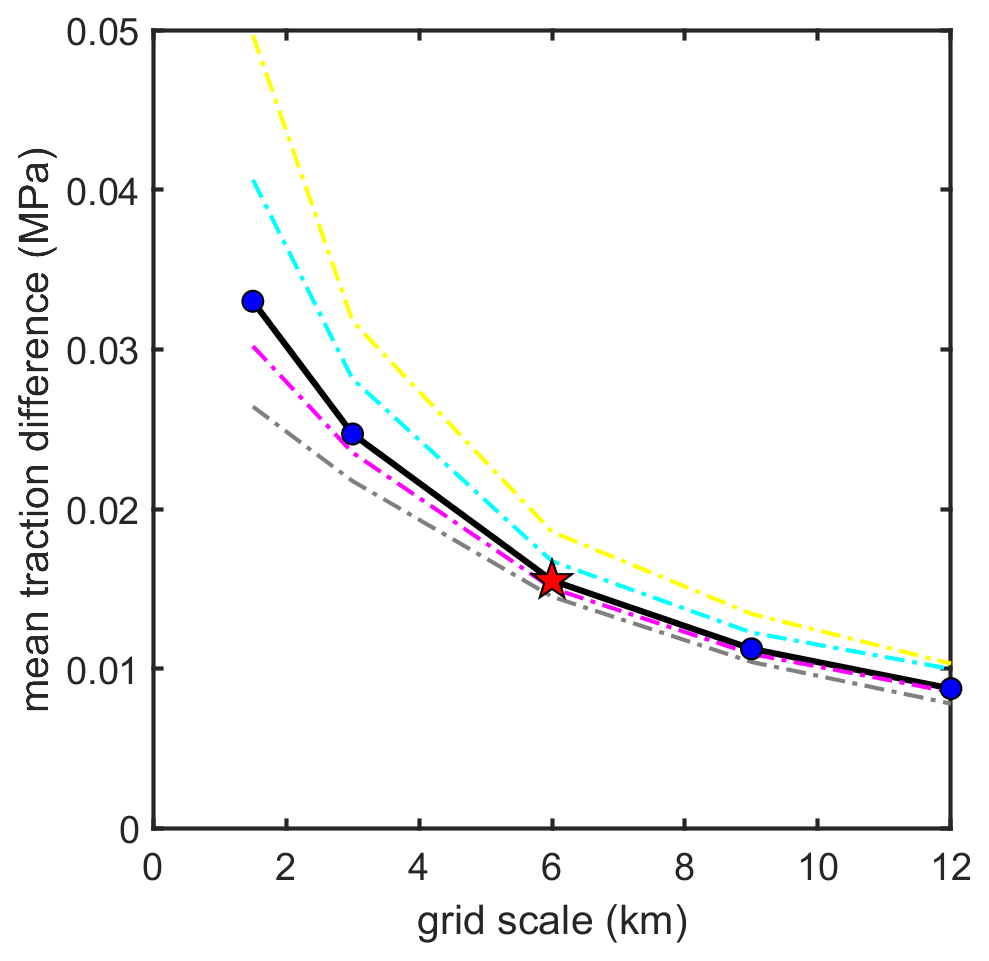
Figure 2Mean traction difference (magnitude of SIA minus SSA) between the SIA and SSA approximation of basal traction as a function of grid scale. Decreasing difference indicates the effect of higher-order stresses decreases with increasing grid length. Red star shows 6 km grid scale which is the primary grid scale used for our analysis. Dashed lines show same analysis for different subsets of the data (margin regions < 1200 m a.s.l. – yellow line, interior regions > 1200 m a.s.l. – grey line, thickness > 1500 m – magenta line, thickness < 1500 m – cyan line).
2.4 Interpreting the velocity–traction relationships
2.4.1 Physical traction relationships
The theoretical relationships between velocity and traction for idealized beds have characteristic features that can be used to distinguish between different types of basal physics. Below we outline three types of beds and the diagnostic features that will aid in our characterization of the basal physics in each catchment.
Hard bed (Weertman, 1964). Weertman sliding describes the velocity–traction relationship for ice sliding around bed roughness without cavitation:
where As is a friction factor that incorporates the basal roughness characteristics as well as the near-basal ice rheology, ub is the sliding velocity, and m is the sliding exponent. This is a rate-strengthening relationship where increasing sliding results in increasing stress (Fig. 3).
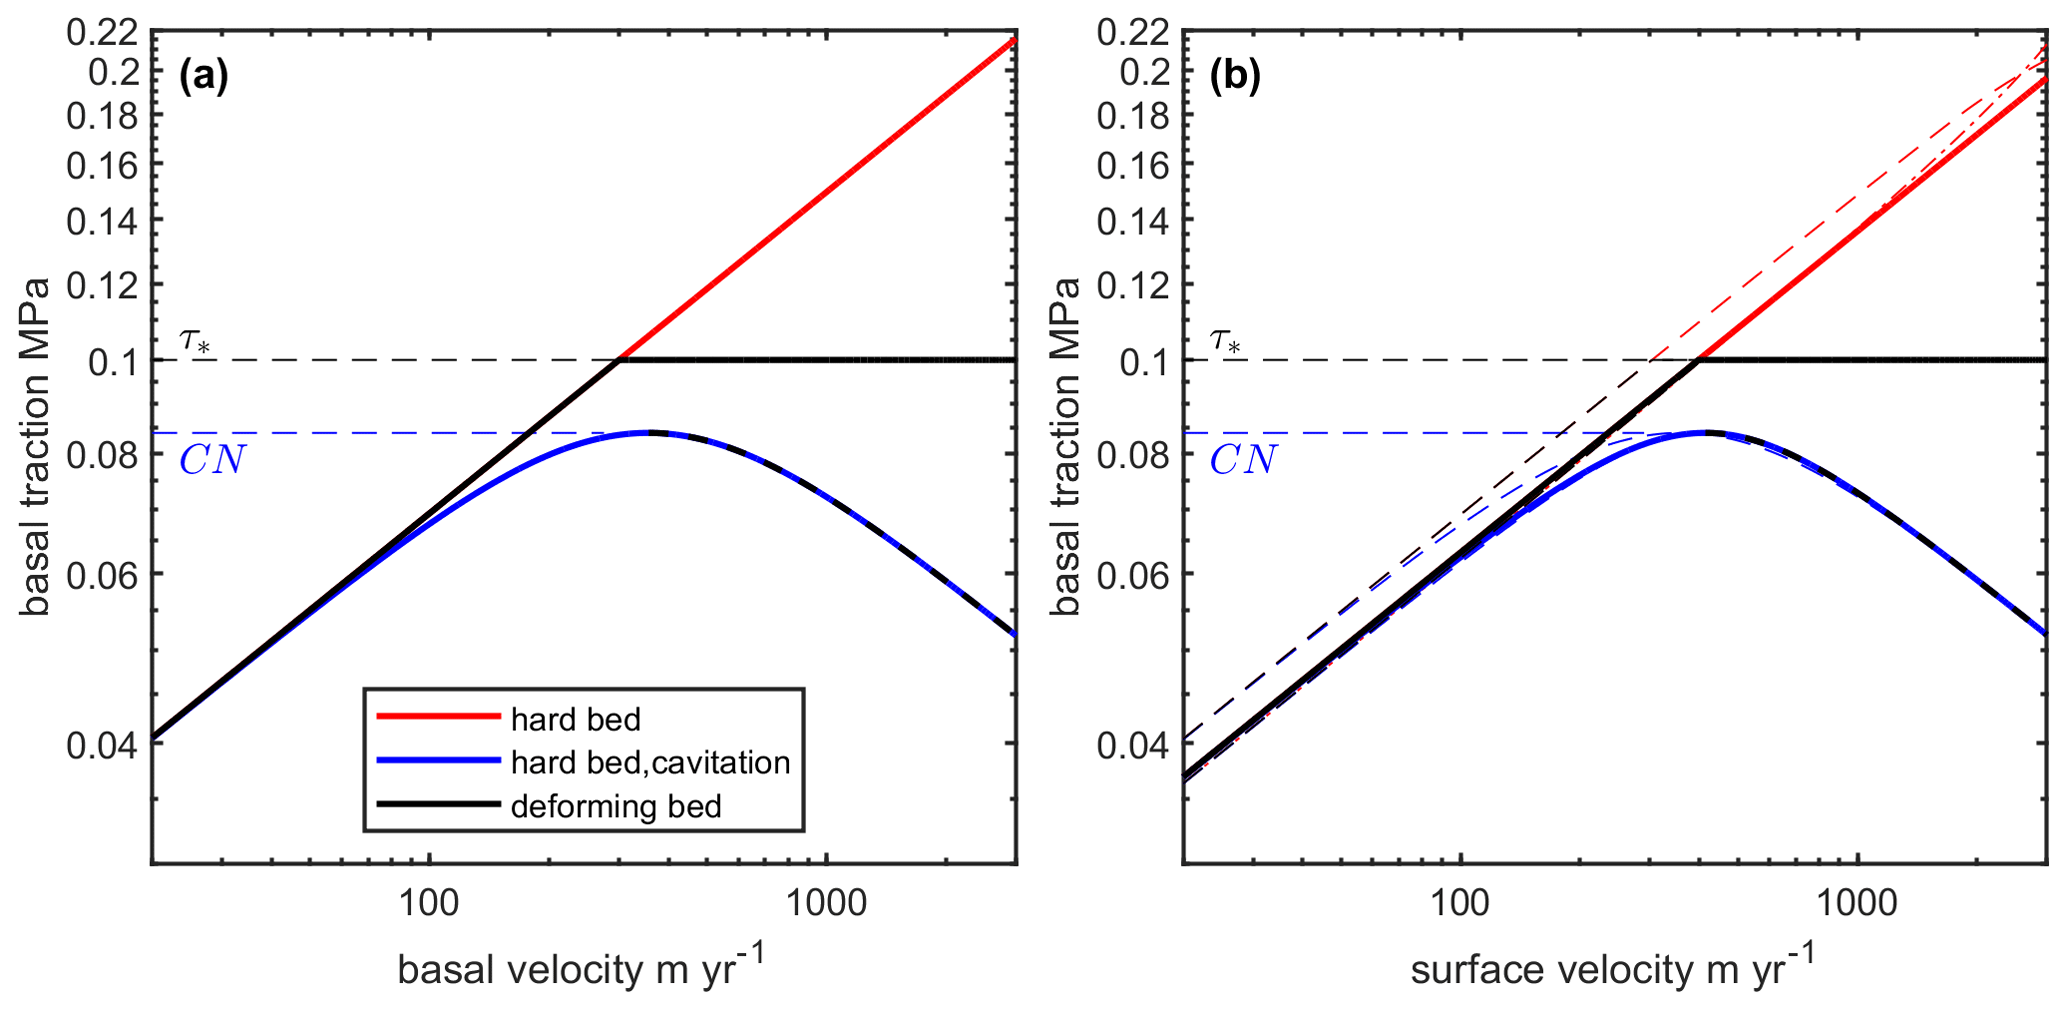
Figure 3(a) Traction models that relate basal motion to basal traction for hard beds with and without cavitation and for deforming beds. CN indicates Iken's bound, and τ∗ is the critical shear stress for deforming till (these parameters are set to fit the curves within the plotting space). (b) The same relationships are shown with added deformation motion calculated with T=0∘ and H=2500 m. The bounds show deformation motion where parameters in the deformation calculation change with velocity. For the higher bound, H is held constant at 2500 m while T increases from −25∘ to 0∘ through the velocity range. For the lower bound, T is held constant at 0∘ and H decreases from 3000 to 200 m through the velocity range.
Hard bed with cavitation (Gagliardini, 2007). A hard-bed relationship that includes cavitation combines aspects of both rate-strengthening and Mohr–Coulomb-like behavior given by
where α is a function of q and . Here q is a bed shape parameter, C a parameter related to the steepness of the bed roughness, N is the effective pressure at the bed, As is a friction factor comparable to that in the Weertman relation, and ub is the sliding velocity. Here, rate strengthening occurs at high effective pressures producing a relationship identical to Weertman sliding (Eq. 2, Fig. 3). When CN is approached the curvature of the relationship begins to increase, deviating from Weertman behavior. This continues until CN is reached which is commonly known as Iken's bound (Iken, 1981). Further increases beyond Iken's bound would cause the basal drag to decrease (rate weakening) causing the ice flow to become unstable in the absence of higher-order stresses. However, outside of rare instances leading to glacier collapse (Kääb et al., 2018), glaciers remain stable because sliding and traction in this range is controlled non-locally by higher-order stresses.
Deformable bed (Zoet, 2020). Traction for deformable beds combines rate strengthening and Mohr–Coulomb behavior. Below the strength of the till, basal motion occurs as over a hard bed (the same as described in Eq. 2), occurring at the interface between the ice and the till as the ice deforms around bed roughness. Once the basal traction reaches the yield stress (τ∗), till deformation begins. Further increases in stress are limited, and the velocity becomes independent of the stress, which as with cavitation, is dictated non-locally by higher-order stresses. This produces a characteristic sharp kink in the velocity–traction relationship at the yield stress of the till (Fig. 3). Over the large grid cells used in this analysis the gravitational stress is mainly balanced by the basal traction. For grid cells with mostly deforming beds this means higher-order stresses will only play a minor role in the stress equilibrium but ice flow in the surrounding regions will still control the velocity field. This same logic applies to the rate-weakening range for hard beds with significant cavitation.
2.4.2 Deformation motion
The surface velocity reflects the combined motion due to basal motion and internal ice deformation, and thus interpretation of the derived relationships requires consideration of both components of motion. In Greenland, the rheologic uncertainty and complex thermal structure make it difficult to infer a location-specific rheology to confidently calculate deformation across the ice sheet (Maier et al., 2019). However, direct measurements of basal motion collectively show the prevalence of high fractions of basal motion (0.44–0.96) across a wide range of glaciological environments in Greenland (Doyle et al., 2018; Lüthi et al., 2002; MacGregor et al., 2016; Maier et al., 2019; Ryser et al., 2014).
Nevertheless, we demonstrate the relationship between surface velocity and traction remains interpretable in terms of bed properties even if deformation motion contributes significantly to the surface velocity and/or the parameters that control the rate of deformation change significantly towards the margin. In Fig. 3b we add deformation motion to the traction relationships presented in Sect. 2.4.1 for a temperate ice column with a thickness of 2500 m using
where A(T) is a temperature-dependent rate factor (calculated following Cuffey and Paterson (2010), n is the flow law exponent equal to 3, and τb is the basal traction as dictated by the relationships in Fig. 3a. This corresponds to a deformation fraction of 0.33 for the rate-strengthening range of the traction relationships, which is similar to that measured along the margins (Doyle et al., 2018; Lüthi et al., 2002; MacGregor et al., 2016; Maier et al., 2019; Ryser et al., 2014), and would approximate deformation where changes in flow line ice thickness are small, i.e., some trough-bound outlet glaciers. We show the characteristic features of the relationship are identical to the theoretical relationships which relate basal motion to traction. We then test how systematic changes in deformation motion due to marginal thinning or ice warming, which is documented as ice moves from the interior to the margin (Harrington et al., 2015; Lüthi et al., 2015), could influence the traction relationship. We find that even with large marginal ice thickness (3000 to 200 m) and ice temperature changes (−25∘ to 0∘) occurring through the velocity range, the characteristic features of the traction relationships remain unchanged. The persistence of the traction relationships with added deformation motion arises from the strong and nonlinear dependence of deformation motion on the basal traction which is controlled by the properties of the bed. Thus, we can interpret the characteristic features that define each type of bed physics using surface velocities which remain clearly distinguishable even with deformation motion.
2.4.3 Power-law model fitting
We fit a general flow approximation to the observed surface velocity (us) and traction range in each catchment using
where Cp is a rate parameter and p is an apparent flow exponent. Since the surface velocity reflects the combined motion due to internal ice deformation and basal motion, this equation approximates the combined physics and nonlinearities of each flow mechanism. However, as shown in Fig. 3 the main features of the traction relationships, and therefore the model fit, will be dictated by the basal physics.
We use the magnitude of p as an additional indicator of basal physics and hydrologic influence to interpret catchment dynamics (Joughin et al., 2019). Frozen beds are expected to have p approximately equal to the deformation exponent n. The regelation and creep processes (Cuffey and Paterson, 2010; Weertman, 1964) that dictate hard-bed sliding suggest m≈2.5–3 for n=3, which is similar to that expected over frozen beds. However, when cavities form on the lee side of bedrock bumps as in Eq. (3), the apparent sliding exponent m and thus p have the potential to increase beyond this range due to decreased ice–bed contact area (Gagliardini et al., 2007; Joughin et al., 2019), which increases curvature in the velocity–traction relationship (Gagliardini et al., 2007; Joughin et al., 2019). For deforming beds, p is expected to be large to approximate Mohr–Coulomb behavior (Iverson et al., 1998; Kamb, 1991; Tulaczyk et al., 2001). This is supported by in situ field (Gillet-Chaulet et al., 2016) and laboratory (Kamb, 1991) experiments which show m≥20 over deforming beds.
We fit the model to the binned velocity–traction relationship in the thawed and frozen regions of each catchment (number of bins is 20, logarithmically spaced) using a nonlinear least-squares regression implemented in MATLAB. Fitting the binned data gives equal weights to high- and low-velocity regions of each catchment regardless of the number of grid cells of each. We do not fit models to the FS tractions which we limit to velocities above 100 m yr−1 and do not reflect the full velocity range. We note that velocity and traction magnitudes are dampened due to grid cell averaging; thus the binned relationships and model fits will reflect this range rather than the full range possible in each catchment.
3.1 Relationship between velocity and basal traction
The velocity–traction relationships have a large degree of scatter but show increasing velocities result in increasing traction (Figs. 4, S4 – linear scale). The relationship between the binned variables (magenta dots) is visually well defined in all catchments and for each estimate of traction. In general, there is good agreement with the binned data and model fit at both high and low velocities. The R2 is high in catchments 3, 4, and 6 through 8 (0.88–0.99) indicating that the power-law model generally describes most of the variability in the binned relationships (Fig. 4, Supplement Table S1) for the SIA and SSA tractions. In the remaining catchments (1, 2, and 5) the R2 is lower (0.22–0.69), which results from the increasing curvature in the binned data at higher velocities which is not captured with the power law. With the exception of catchment 2, 3, and 5, the interquartile range (IQR) for each bin occupies a small region of the total data spread, indicating the binned relationships represent a large fraction of the data in each catchment.
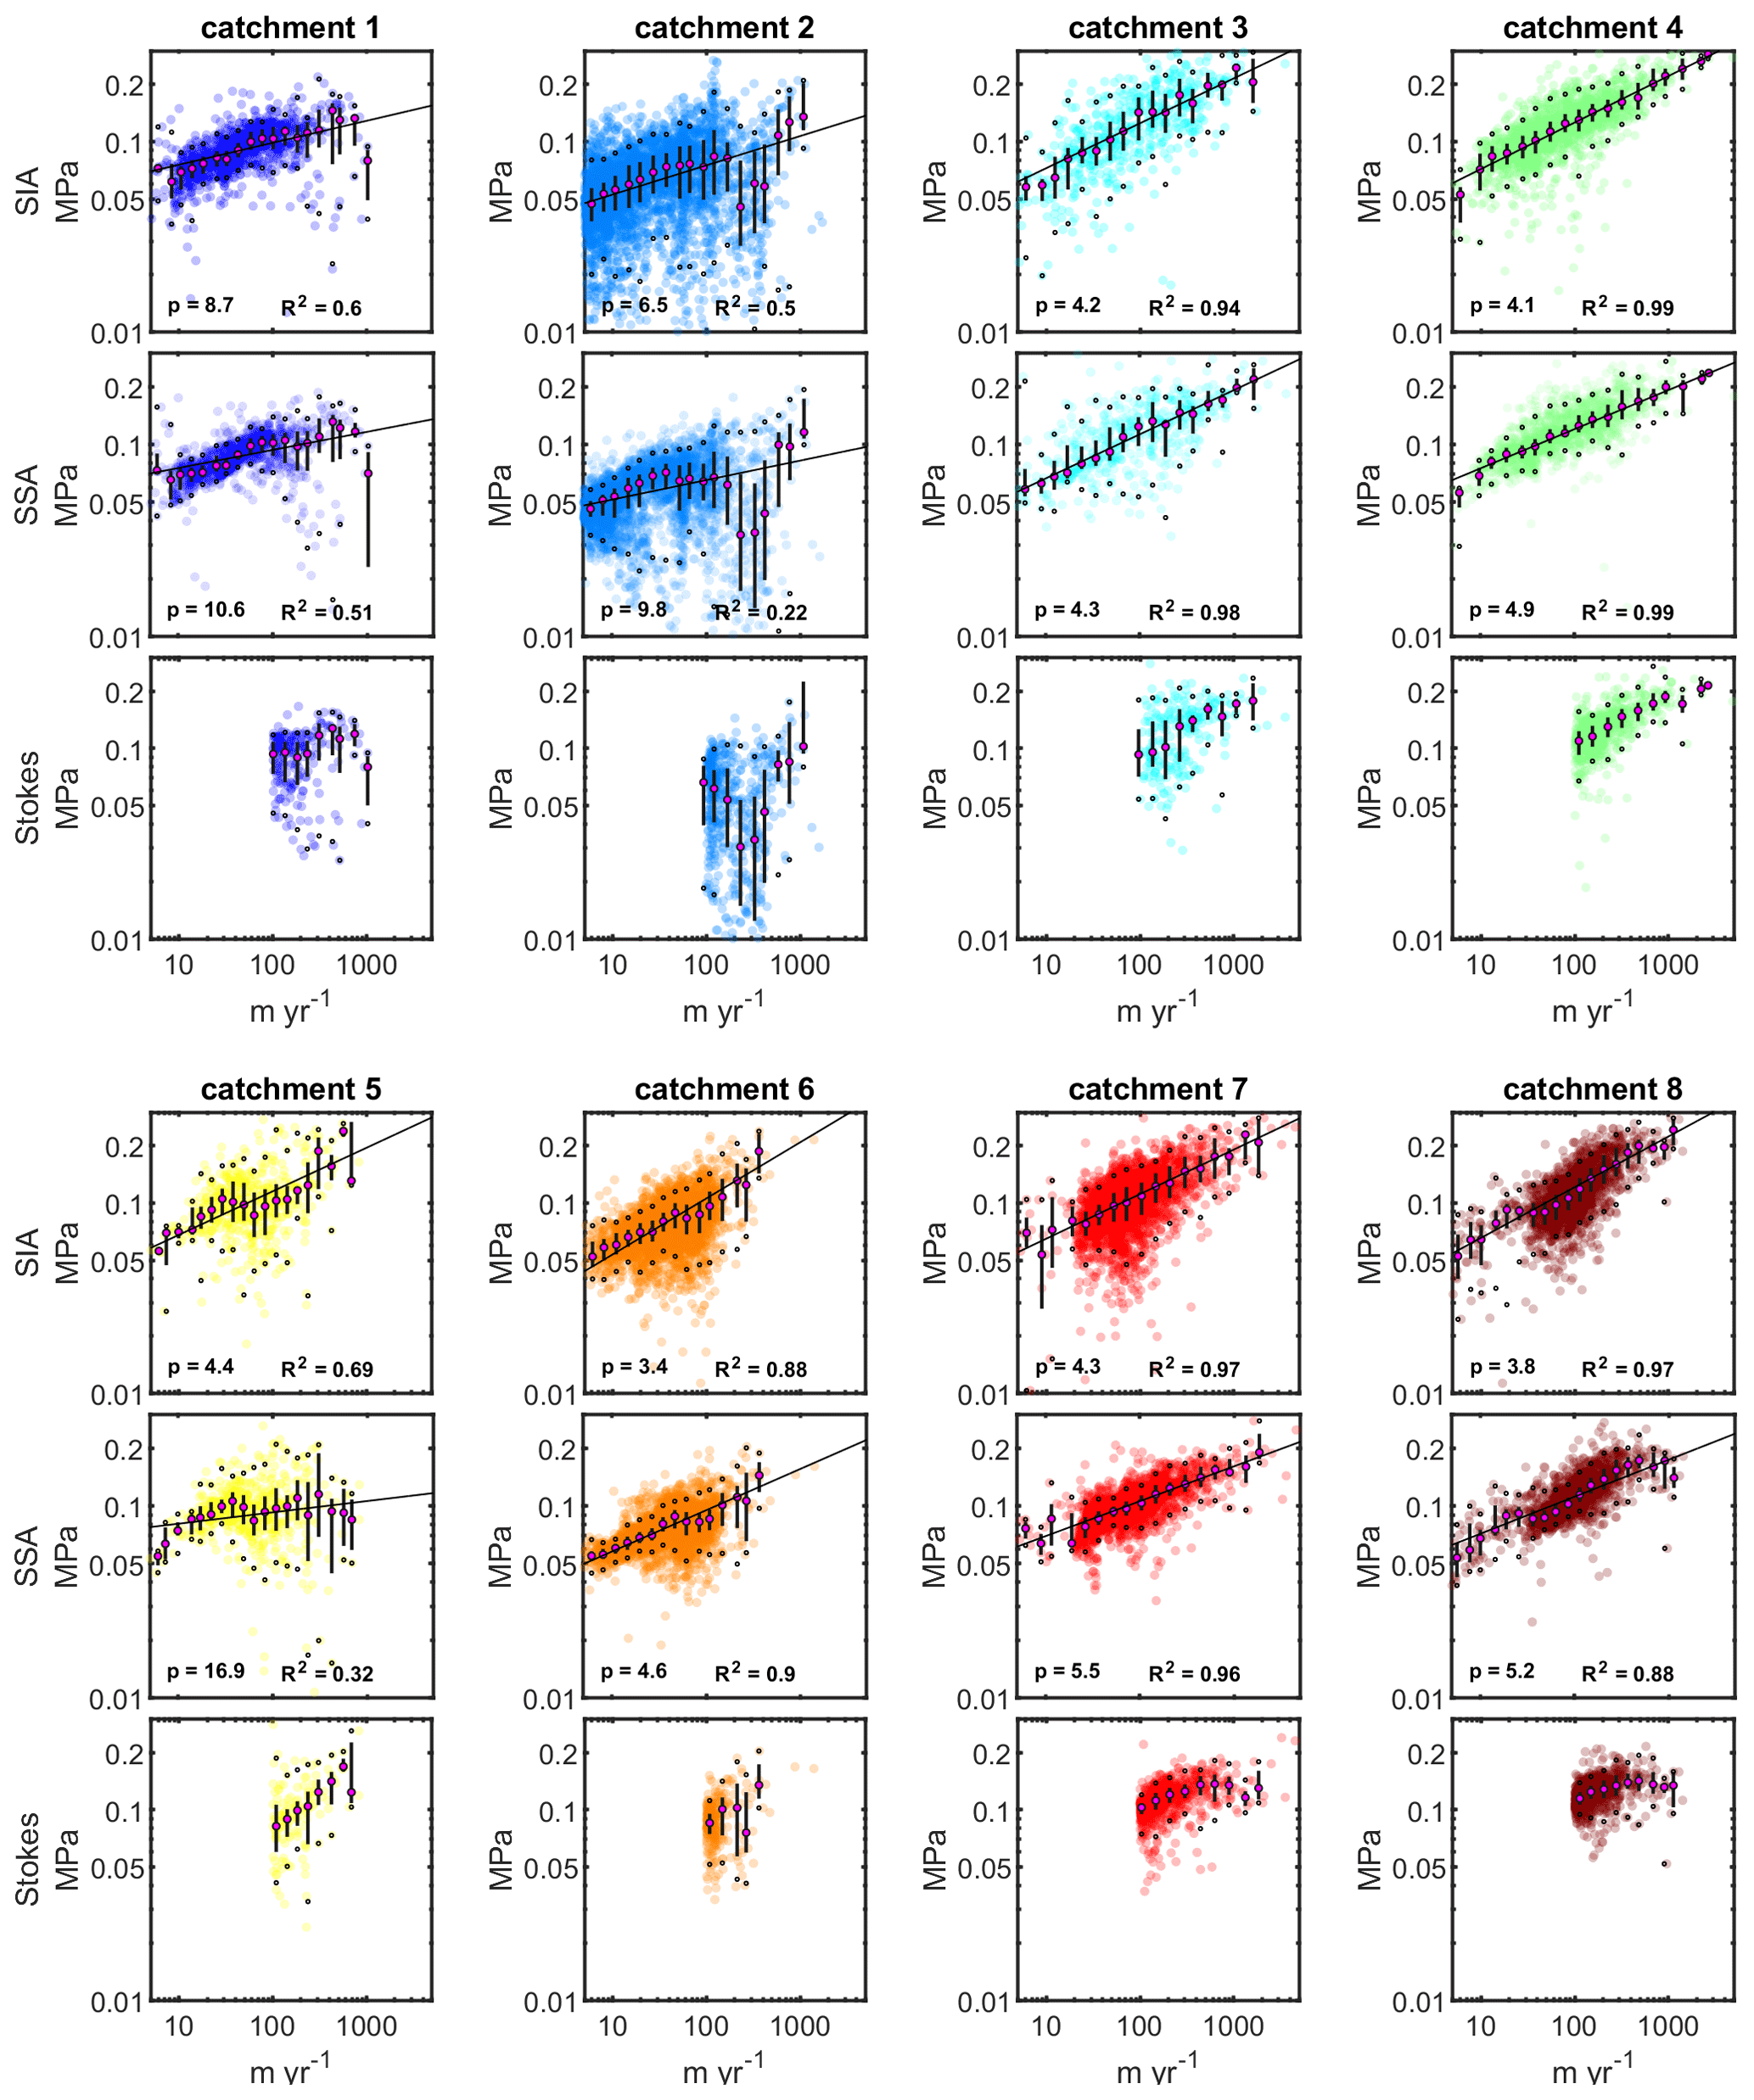
Figure 4The velocity–traction relationship for the SIA, SSA, and full-Stokes inversions for all eight drainage catchments. Transparency is an indicator of data density, where opaque areas indicate four or more grid cells occupy the same marker area on the plot. Magenta markers show the median traction values for 20 logarithmically spaced velocity bins; the vertical bars show the interquartile range; and the black dots indicate the middle 90th percentile of the data. Black line shows a power-law model fit to the binned data. No models were fit to the Stokes relationships due to the velocity range (> 100 m yr−1) which is limited in our analysis.
The relationships for SIA, SSA, and FS inversions show varying degrees of consistency in each catchment (Fig. 5). In general, the different inversion methods show the same traction variations through the velocity range but show some offset in the basal traction. Bins with offset between the SIA and SSA suggest higher-order stresses may influence tractions, while bins with offset between the SSA and FS suggest topographic-scale roughness may support some of the gravitation stress through form drag. All catchments show offset between the SIA and SSA at some bins; however, the offset is small (generally < 0.02 MPa). Similarly, catchments show some differences between SSA and FS. In catchments 6 through 8, we find the relationships increasingly diverge as velocities increase, where peak separation between the SIA, SSA, and FS coincides with the highest velocities.
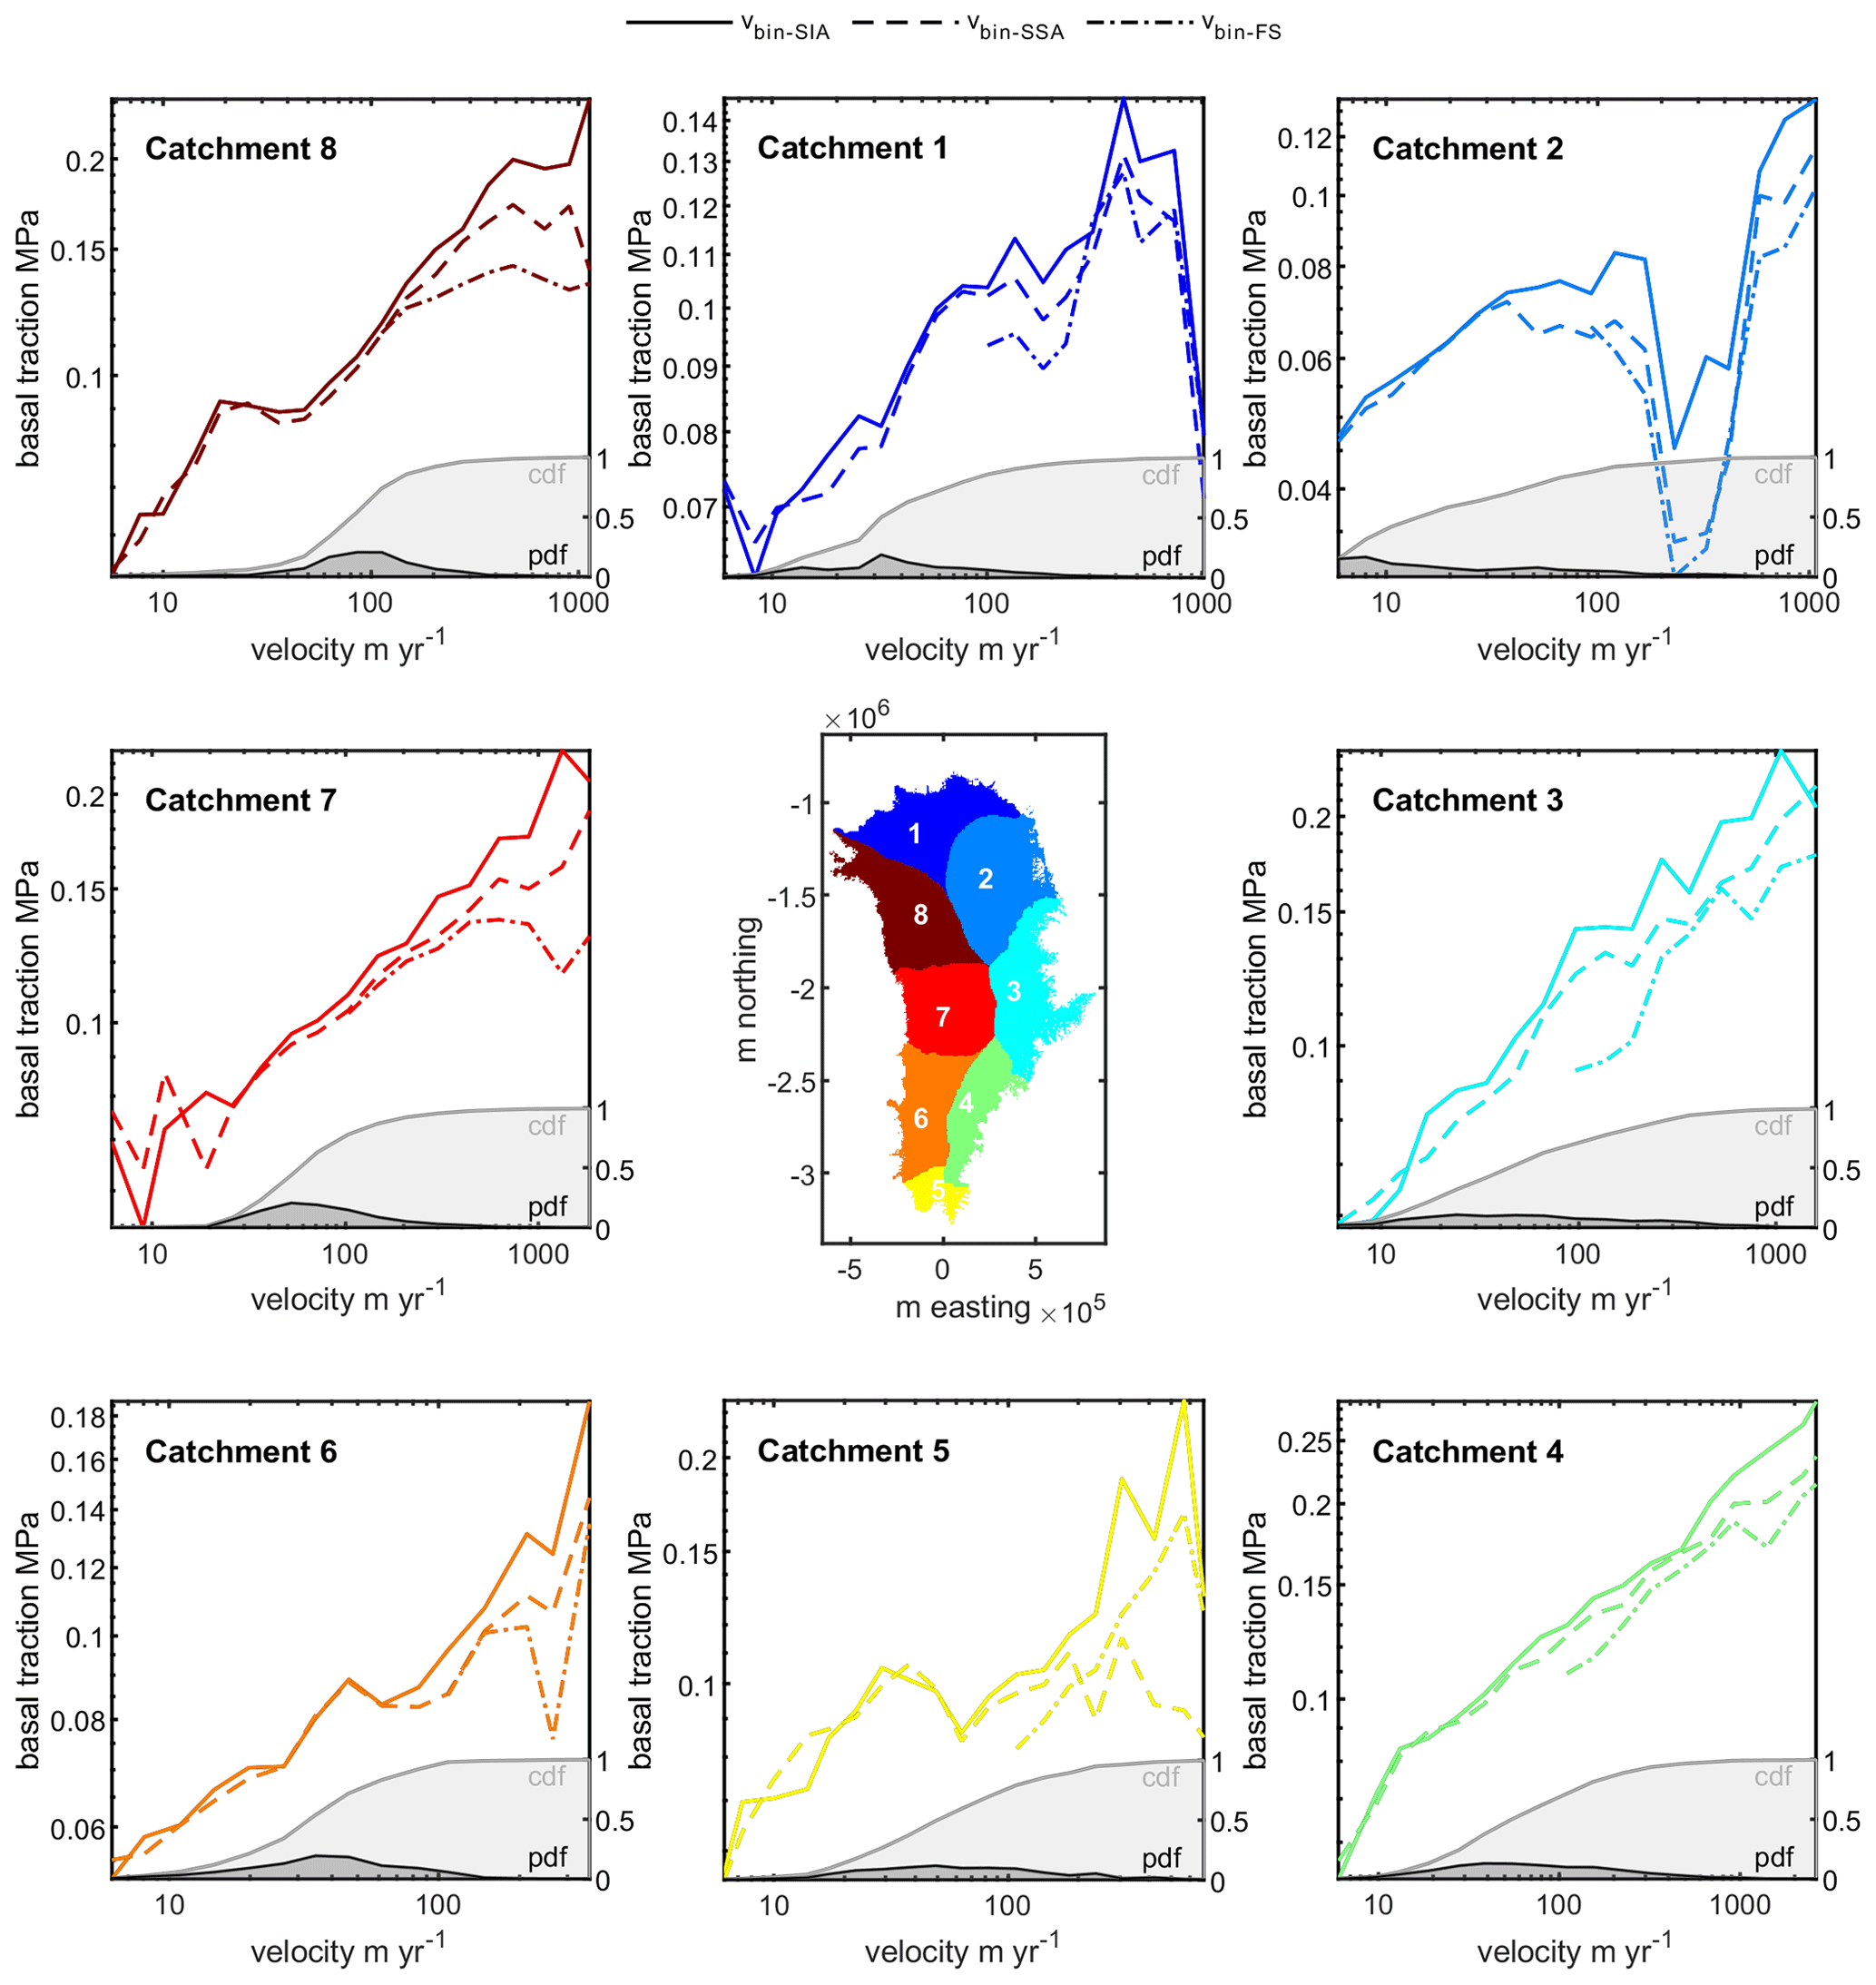
Figure 5The relationships between velocity and traction for the SIA (solid line), SSA (dashed line), and FS (dash-dotted line) are shown together for each catchment. The right axis shows the probability density function (black line) and cumulative distribution function of the data (grey line) moving through the velocity range.
The binned velocity–traction relationships (Fig. 5) all have one or more of the characteristic features found in the theoretical traction relationships presented in Fig. 3. In catchments 1 and 2 there is rate strengthening until a visible kink in the traction relationships at ∼ 0.1 and ∼ 0.08 MPa respectively where tractions level off. In catchment 2 this is followed by a large dip in the traction relationship where tractions decrease to a local minimum at ∼ 230 m yr−1. In both catchment 1 and catchment 2, the highest velocities again correspond with high tractions which follow a similar trend to the binned relationship before the kink. Catchments 3 and 4 show rate strengthening through the entire velocity range. Catchment 5 shows rate-strengthening until ∼ 40 m yr−1 where tractions abruptly dip until ∼ 60 m yr−1. The SIA and FS then begin to increase again at a rate similar to that before the dip but offset towards higher velocities, while the tractions for the SSA level off at ∼ 0.095 MPa. Catchment 6 predominantly shows rate strengthening, with a small kink at ∼ 50 m yr−1 which corresponds with an increase in data scatter and IQR span. Catchment 7 also predominantly shows rate strengthening, but at high velocities (440 m yr−1) the relationships for the different inversions diverge: the SIA continues rate strengthening; the SSA has a kink where tractions level off; and the FS tractions decrease. Catchment 8 is almost identical to catchment 7 which shows rate strengthening until ∼ 480 m yr−1 after which the traction estimates diverge. However, catchment 8 also has a small kink that occurs at ∼ 20 m yr−1.
3.2 p magnitude
The averaged flow exponent (calculated using the combined mean of SIA and SSA) within the likely frozen regions is 2.9 (2.4–4.1) which is expected to approximate n (Figs. 6, S5). In all catchments, the p of the thawed regions exceeds the approximate n to varying degrees (4.0–10.6) suggesting the influence of processes that increase the nonlinearity of ice flow at the catchment scale. The highest p (> 8.1) is recorded in the two northernmost catchments and the southernmost catchment driven by a strong increase in curvature and abrupt dips in traction as velocities increase (Fig. 5). However, for catchment 5 high p and increased curvature only occur for the SSA traction estimates. A p of this magnitude cannot be explained through systematic variations in n (Supplement) and thus is consistent with the influence of basal processes (i.e., deforming till, cavitation, roughness) on catchment-scale dynamics (Gagliardini et al., 2007; Kamb, 1991). The binned traction relationships and associated p in the remaining catchments (3, 4, 6–8) are similar. The p is approximately 4.4 (4.0–4.9), indicating a modest increase in nonlinearity compared to the frozen regions. The changes in the deformation fraction as ice warms or thins towards the margin shown in Fig. 3 are unlikely to produce a greater than ∼ 0.15 change in p from n, and thus even though small, the increase in p is unlikely to be due to systematic deformation variations. This suggests a modest influence of basal processes or rheologic variations that would increase p from n (Supplement).
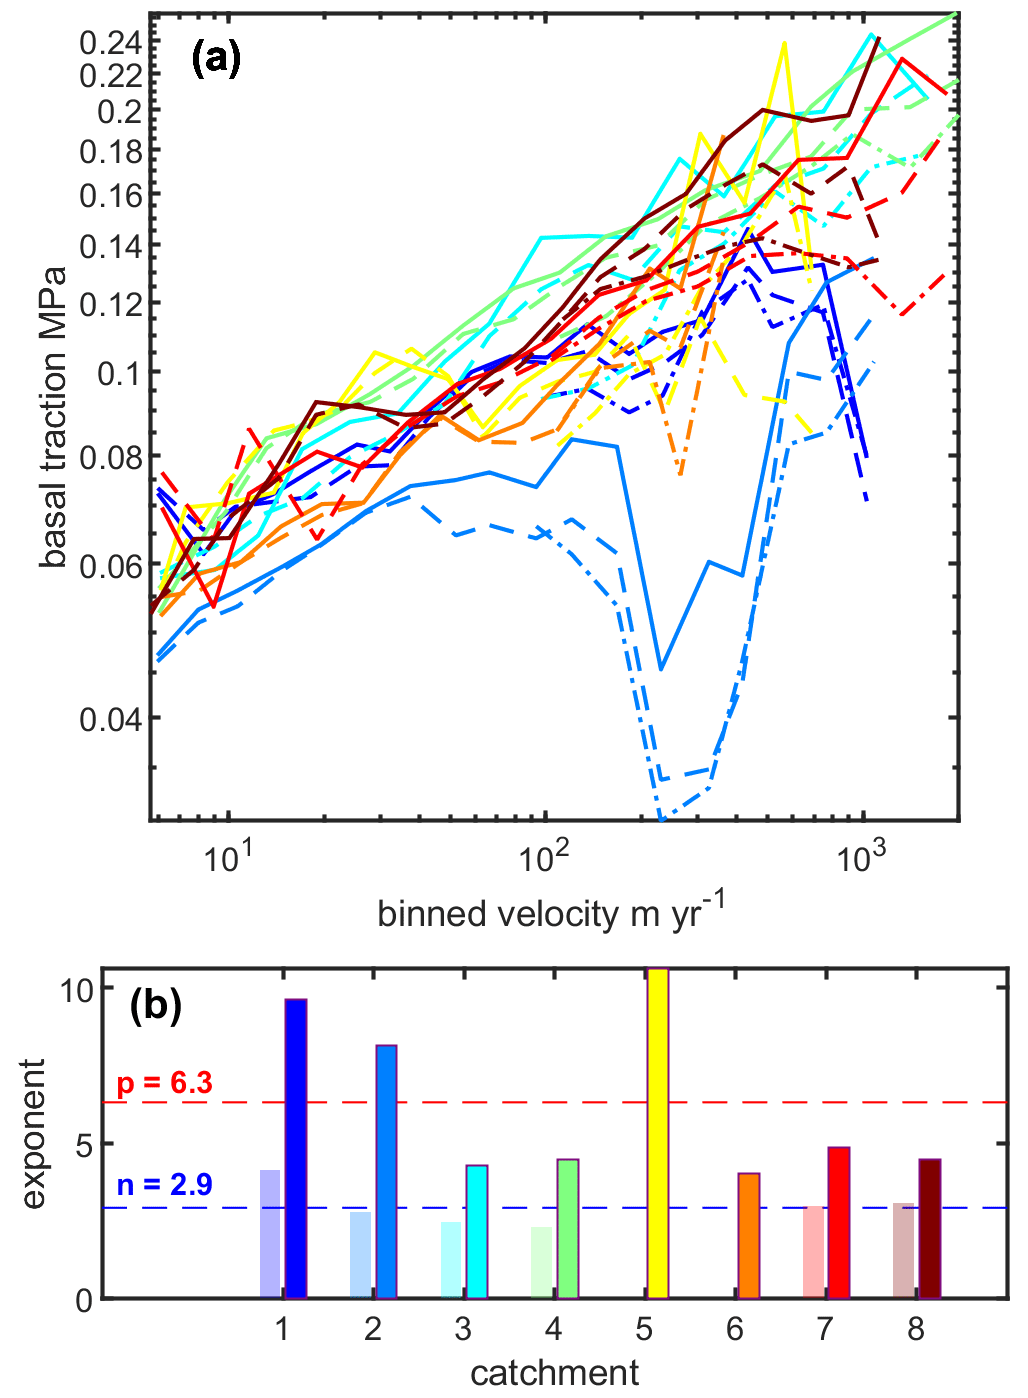
Figure 6(a) Binned velocity versus traction for all catchments and traction estimates (SIA – solid, SSA – dashed, FS – dash-dotted). (b) The p for likely thawed regions (dark bars) and n for likely frozen regions (light bars) in each catchment. Values for each catchment are the average from the SIA and SSA. Dashed lines show the mean value for each exponent. No n is shown for catchments 5 and 6 which did not have enough grid cells to produce a reliable relationship (Fig. S5).
3.3 Spatial distribution of strong and weak beds
We map the distribution of weak and strong beds across the GrIS using the residual distribution from the ice-sheet-averaged flow relationship derived from the mean of the three traction estimates (Figs. 7, 8). We classify strong and weak beds as data that comprise the top and bottom 15 % of the distribution respectively, while the middle 70 % of the data are classified as having normal strength (Fig. 7). In other words, strong beds have a higher-than-normal traction for a given velocity, while weak beds have a lower-than-normal traction for a given velocity, and thus the classification is independent of substrate type. By using the mean traction, information from all three traction methods is incorporated, and thus weak and strong beds will occur most frequently where the traction estimates agree on the bed strength. We note that the variability used for this designation is far greater than that expected from data error and uncertainty (Fig. S6) and thus represents real spatial variations in basal characteristics. We compare the spatial variability in bed strength to the decadally averaged snowline which serves as a time-integrated proxy for the equilibrium-line altitude (ELA) (Vandecrux et al., 2019) and also the concentrated areas of faster flow near the margin which are roughly shown by plotting the 200 m yr−1 contour in Fig. 8.

Figure 7Weak- and strong-bed delineation is presented based on residuals from ice-sheet-wide flow relationship. Ice-sheet-wide flow relationship (black line) is calculated by averaging the SIA, SSA, and FS traction estimates for each grid cell in the likely thawed regions and fitting a power-law model to the binned data. Pink markers show the binned velocity–traction relationship (median, 20 bins, logarithmically spaced). The residuals from the model relationship are used to delineate and map bed strength throughout Greenland. Strong and weak beds comprise the bottom and top 15 % percent of the log-residual distribution, while grid cells with normal bed strength occupy the middle 70 %.
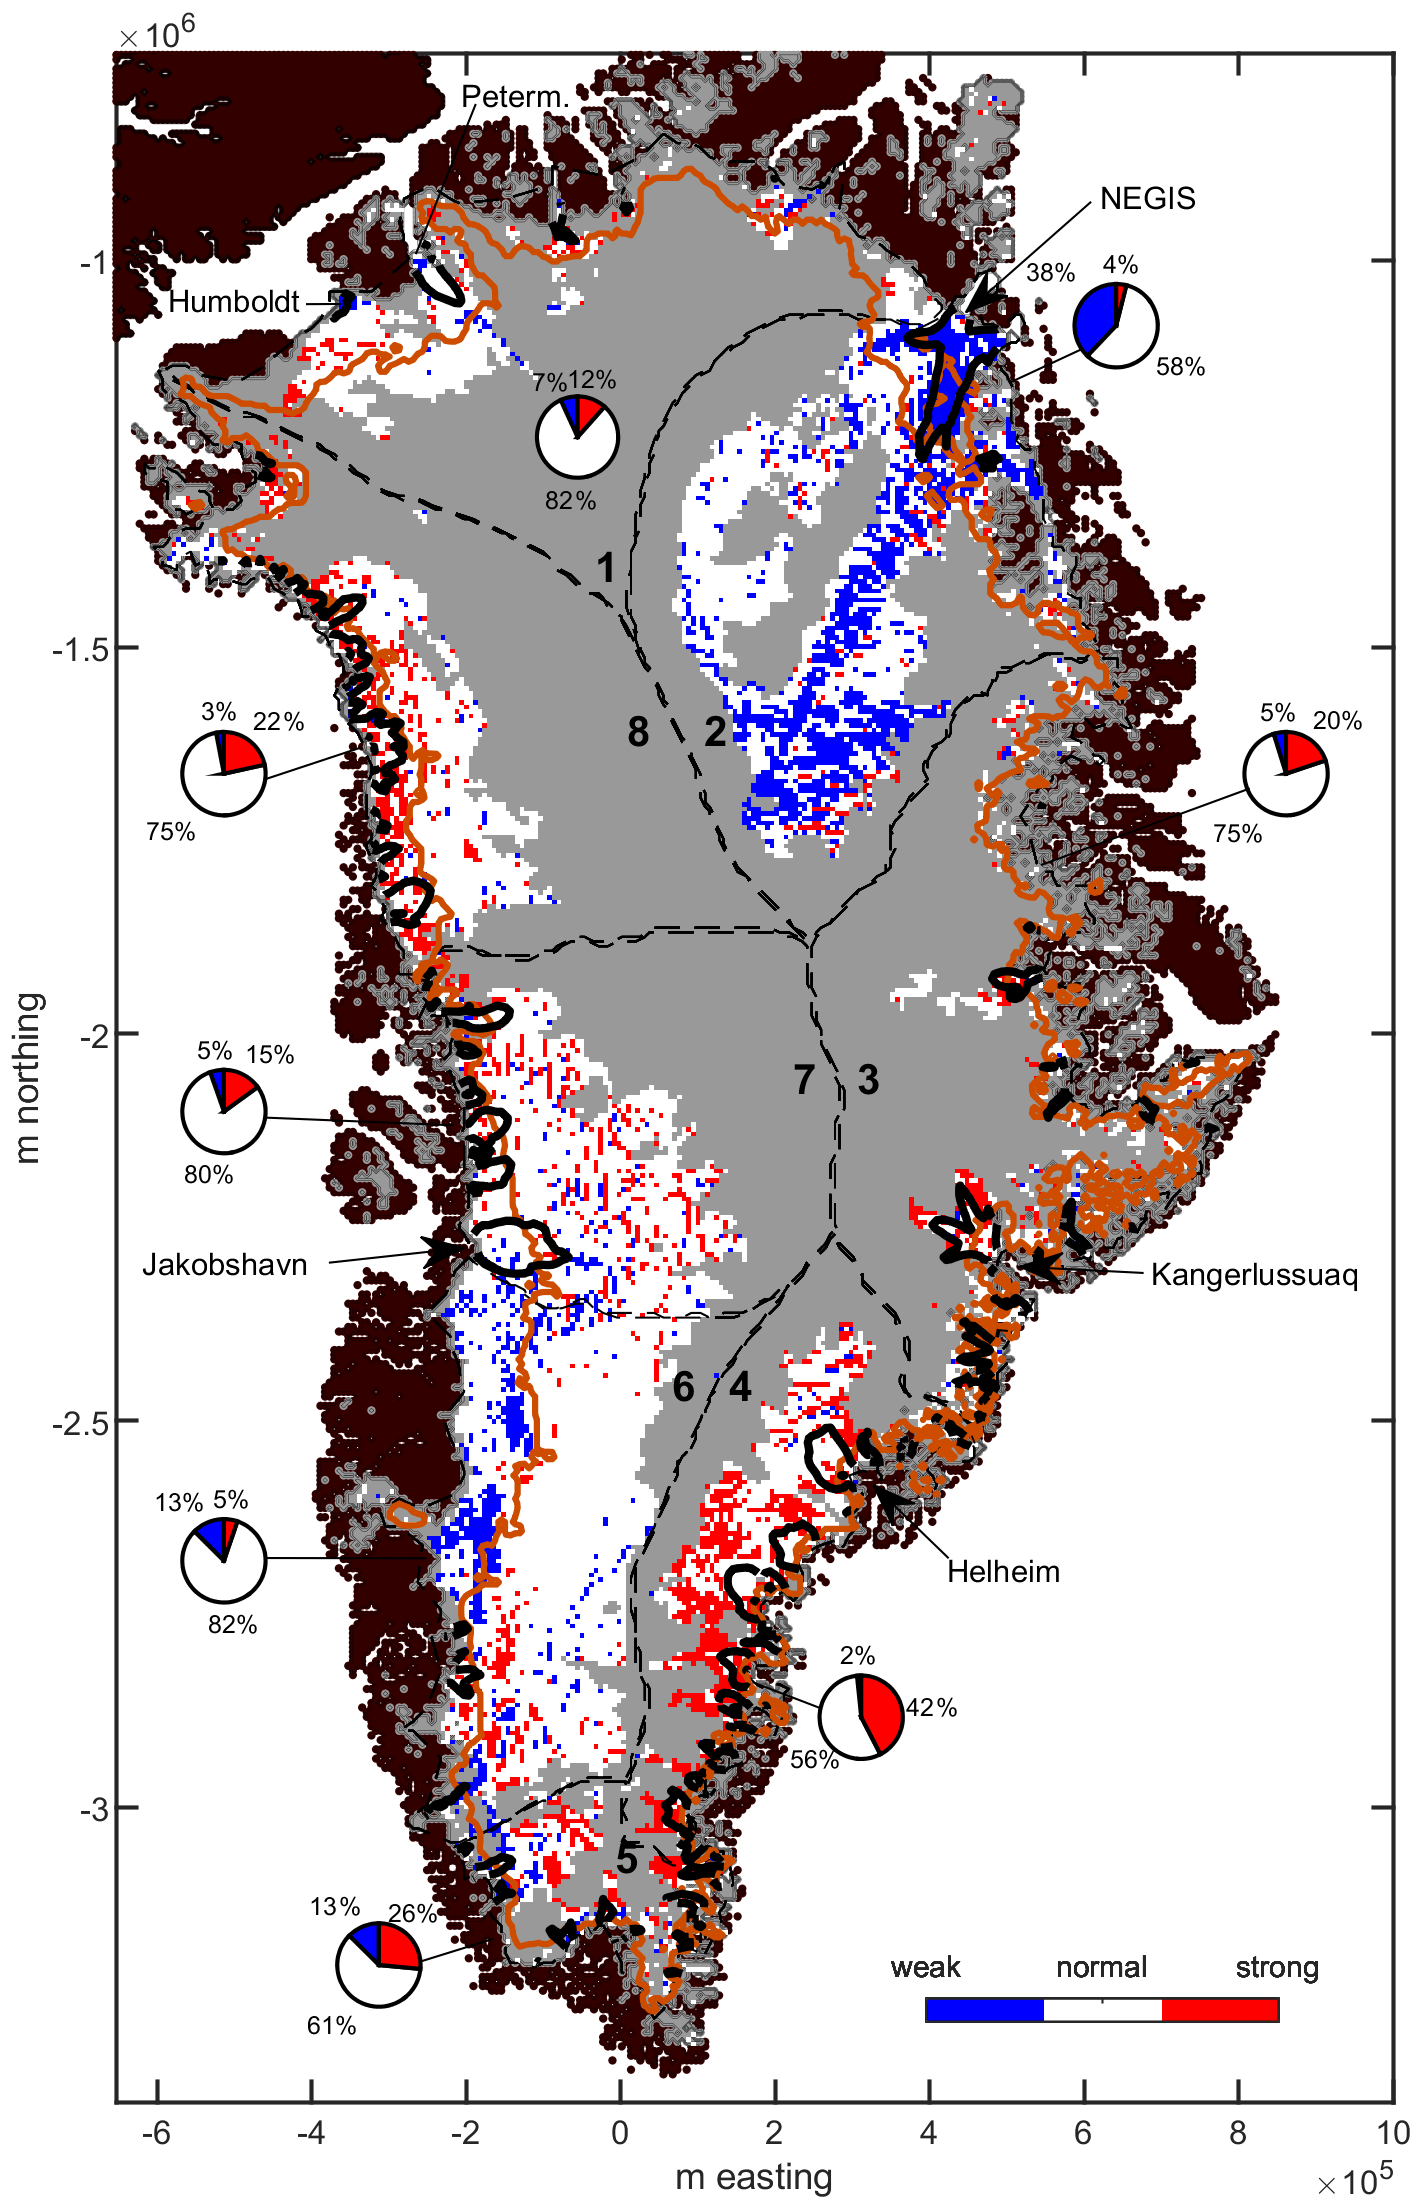
Figure 8Map of weak- and strong-bed grid cells. Black contours indicate 200 m yr−1 and identify concentrated regions of faster flow. Orange line delineates the average snowline from 2001 to 2017 (Vandecrux et al., 2019). Dashed lines delineate flow catchments. The small pie charts show the percentage of weak and strong regions within each catchment.
The ice-sheet-wide distributions of strong and weak regions show the majority of the ice sheet domain is of average strength with aggregated regions of strong and weak beds distributed in select locations (Fig. 8). This general description applies to both the inland regions and the concentrated regions of faster flow which include the three largest glaciers in Greenland: Jakobshavn Isbræ, Kangerlussuaq Glacier, and Helheim Glacier (Shapero et al., 2016). There are only a few visually aggregated weak-bed regions across the GrIS. The largest region occurs in catchment 2 within the bounds of the Northeast Greenland Ice Stream (NEGIS). Aggregated weak beds also occur in catchment 6 directly downgradient from the snowline, suggesting meltwater forcing is likely important to their occurrence. Aggregated strong beds occur in catchment 4 and catchment 8. In catchment 4 these primarily occur along the thawed-region boundary and could be due to the basal thermal state being misclassified or to locally elevated stress coupling that arises near the transition to sliding. The strong-bed regions in catchment 8 occur below the snowline and are therefore less likely to be misclassified or strongly coupled to frozen regions. We suggest they could instead be related to rougher topography (Fig. S8) or possibly subglacial drainage conditions near the margins. Overall, we find catchments 3, 4, and 8 have the highest proportion of strong beds, while catchments 2 and 6 have the highest fraction of weak beds and are the only catchments with a higher proportion of weak beds than strong beds (Fig. 8).
4.1 Physically based traction relationships
We show that physically based velocity–traction relationships can be retrieved from the ice dynamics of Greenland. This should give confidence that our current descriptions of basal physics, where stresses are related to velocity, are appropriate to model ice motion across much of the ice sheet. We find that in most catchments the binned velocity and traction have characteristics that are expected given our understanding of basal physics and, moreover, can be well represented with a generic power-law traction relationship with varying exponents at high and low velocities. This provides a simple, catchment-specific parameterization that can be used to model the flow field and tractions at large scales which could be directly prescribed for SIA and SSA simulations (discussed in more detail in Sect. 4.4, model parameters provided in Table S1).
Our finding of gravity-driven flow is the opposite result to an analysis by Stearns and van der Veen (2018) which found no relationship between traction and velocities for tidewater outlet glaciers on the periphery of Greenland. The two analyses are fundamentally different in terms of both methodology and scope, making a straightforward comparison difficult. The coarse grid spacing needed to infer the basal traction and the catchment-scale approach presently used mean our data-derived relationships dominantly reflect the fully grounded regions of the ice sheet, i.e., the regions where sea level does not affect the base pressure. However, the large ice tongues of the Humboldt and Petermann glaciers which are near floatation (Carr et al., 2015; Hogg et al., 2016) are resolved by our method and are found to be underlain by anomalously weak beds (Fig. 8). This suggests tidewater regions might have mostly Mohr–Coulomb-like behavior, and therefore our observations do not directly contradict the previous findings (Stearns and van der Veen, 2018) which found behavior interpreted to be consistent with deforming beds. Nevertheless, most of the high-velocity regions inland from the calving face of Jakobshavn Isbræ, Kangerlussuaq Glacier, and Helheim Glacier do show reasonable adherence to the derived flow relationships, which was not previously found (Stearns and van der Veen, 2018).
4.2 Interpretation of catchment-scale dynamics
Each catchment covers a large area where varying bed properties are likely. We use the characteristics of and data scatter from the binned relationships, p magnitude, and the distribution of weak- and strong-bed grid cells to interpret and discuss the dominant basal physics that would result in the catchment-scale dynamics observed. We note that tractions for hard-bed sliding with cavitation and deforming beds have very similar characteristic features (i.e., strong increase in curvature vs. kink). Here we characterize these features as Mohr–Coulomb-like behavior which could reasonably occur over both bed types and only interpret further where additional information permits. We note that our interpretations assume that the binned relationships (and thus model fits) reflect the main characteristics of the traction laws outlined in Sect. 2.4.1 as opposed to systematic variations in bed parameters (i.e., roughness characteristics).
4.2.1 Predominantly rate strengthening
The binned velocity–traction relationships in catchments 3 and 4 have all the characteristics of Weertman-type traction laws. There is rate strengthening through the entire velocity range with no large kinks or curvature changes that would indicate Mohr–Coulomb-like behavior is induced either via cavitation or via deforming till (Fig. 5). Correspondingly, p is the closest to n for these catchments, indicating only a limited occurrence of higher nonlinearity processes operating at the basal interface (Fig. 6). There are relatively few high-velocity low-traction grid cells outside the middle 90th percentile of the data suggesting that weak beds in these regions are not common (Fig. 4) and those that do occur are mostly within the slower-moving regions inland from the margin, with the exception being the very terminus of Helheim Glacier (Fig. 8). Given the adherence to rate strengthening in these catchments, we can constrain CN which sets Iken's bound (defined in Eq. 3) to be greater than or equal to 2.1 and 2.3 MPa for the SSA and SIA respectively (Fig. 4). However, other hard-bed parameters cannot be confidently defined since our binned relationships are derived from surface velocities which include deformation motion.
To a large degree the relationships in catchments 7 and 8 also adhere to Weertman-type hard-bed physics behavior for all three traction estimates below velocities of ∼ 450 m yr−1, which account for more than 95 % of the data within each catchment (Fig. 5). At higher velocities the traction estimates diverge and the interpretation becomes more ambiguous. The SIA continues to show rate strengthening while the curvature of SSA and FS increase and the tractions level off. The difference between the relationships indicates that higher-order stresses and/or topographic form drag could influence the defining characteristics of the traction relationship at high velocities which is consistent with the spatially complex flow and bed topography found near the margins (Joughin et al., 2018; Morlighem et al., 2017). The magnitude of these effects is again determined by rheology, and thus the true traction field remains uncertain but could reasonably reflect either rate strengthening or Mohr–Coulomb-like behavior given the spread in the relationships at high velocities.
An increase in Mohr–Coulomb-like behavior at high velocities near the marine-terminating outlets would be consistent with prior traction inversions of the fastest-flowing outlet glaciers in Greenland (Jakobshavn Isbræ, Helheim, Kangerlussuaq) (Habermann et al., 2013; Joughin et al., 2012; Shapero et al., 2016). In general, these inversions have found uniformly weak beds underneath the concentrated regions of fast flow that occur within the deep bed troughs. Interestingly, these outlet glaciers also correspond to high driving stress which cannot be supported by the inferred weak beds, and thus stress is balanced by > 0.5 MPa traction bands along the margins of the bed troughs which control the flow speeds (Habermann et al., 2013; Joughin et al., 2012; Shapero et al., 2016).
While our analysis by design cannot capture the complex traction field of individual outlet glaciers, we can use our flow relationships to estimate flow speeds expected at tractions of 0.5 MPa and provide a test of the weak-bed hypothesis in these regions using our data-constrained flow relationships. We find that flow speeds at 0.5 MPa would range from ∼ 20–100 km yr−1 (spread from the rate-strengthening catchments). This exceeds the ∼ 5–10 km yr−1 velocities that are observed in these regions which would better correspond with tractions ranging from ∼ 0.275–0.4 MPa. This suggests short-length-scale bed roughness where the high stresses occur may be exceptionally rough and support higher stresses than expected for the given flow speeds or alternatively the ice in the shear margins is weaker and produces less resistance than expected, and thus beds within the trough may still be weak but not as weak or as uniformly weak as previously inferred.
4.2.2 Predominantly Mohr–Coulomb-like
Catchments 1 and 2 both show strong evidence of Mohr–Coulomb-like behavior. In both catchments the average p is greater than > 8.1 (Fig. 6), driven by abrupt increases in curvature in the binned velocity–traction relationship which is characteristic of Mohr–Coulomb beds (Figs. 4, 5). Further, the dip in the binned relationship in catchment 2 indicates that weak beds make up a substantial fraction of grid cells at high velocities. The abrupt curvature changes occur at 0.07 and 0.1 MPa for catchment 1 and 2 respectively and would correspond to a catchment-mean CN or τ∗ depending on whether the bed is hard or deforming (discussed more below).
The distribution of grid cells indicates the beds in each catchment have different characteristics even though they both display Mohr–Coulomb-like traction relationships. In catchment 1, the change in curvature coincides with an increase in high-velocity low-traction grid cells (Fig. 4) which occur within the ice tongues of the Humboldt and Petermann glaciers (Fig. 8), indicating that weak beds mainly coincide with areas where the influence of sea level on basal water pressures can occur (Carr et al., 2015; Hogg et al., 2016). In catchment 2 low-traction grid cells occur throughout the entire velocity range and become more dominant at higher velocities (Fig. 4). Unsurprisingly, they closely coincide with the NEGIS (Fig. 8) which is known to be underlain by mechanically weak till (Christianson et al., 2014) and has high rates of basal melting from an anomalous geothermal heat flux (Fahnestock et al., 2001), factors which are considered critical to its occurrence (Christianson et al., 2014; Fahnestock et al., 2001; Rogozhina et al., 2016).
4.2.3 Mixed behavior
The binned relationship for catchment 6 is predominantly rate strengthening and has a good fit to the power-law models which only a show small increase in p over n (Figs. 4–6). Yet the catchment also has the second-highest percentage of weak-bed grid cells (Fig. 8) that sharply increase in occurrence at 60 % through the velocity range which coincides with a small kink in the traction relationship (Figs. 4, 5). Correspondingly, the delineation of the bottom 5 % of the data (black markers, Fig. 4) in each bin also shows a sharp Mohr–Coulomb-like kink. Thus, while there are not enough weak-bed grid cells to significantly impact the median of the binned relationships, weak beds consistent with Mohr–Coulomb-like behavior are clearly present and important to the ice dynamics in this catchment. Since the relationship has clear attributes of both rate strengthening and Mohr–Coulomb-like behavior through the velocity range, we classify this catchment as mixed. This characterization is consistent with direct measurements of basal conditions that have identified both hard and till beds (Booth et al., 2012; Dow et al., 2013; Harper et al., 2017; Kulessa et al., 2017) as well as persistently low effective pressures that are almost always less than 20 % of overburden (Wright et al., 2016).
The weak-bed grid cells mostly occur directly downgradient from the snowline and presumably are linked to the occurrence of hydrologic forcing (Fig. 8) which matches conclusions of a previous study which identified the weak-bed regions as occurring due to the onset of hydrologic forcing (Meierbachtol et al., 2016). In these higher-elevation zones, moulins are sparsely spaced (Smith et al., 2015), but large, stochastic injections of water to the base from supraglacial lake drainages are thought to weaken the bed during the melt season (Das et al., 2008; Kulessa et al., 2017; Stevens et al., 2015). Interestingly, this region is the only region to show a transition to weak beds below the snowline even though supraglacial lakes and meltwater forcing are ubiquitous along the margins of the ice sheet (Leeson et al., 2015).
4.2.4 Unclassified
There is no clear interpretation for the relationship in catchment 5 which has the fewest grid cells (Fig. 1) and the highest ice thickness and velocity errors that are often near 50 % magnitude (Fig. S7). Unlike the other catchments, p for the southernmost catchment is notably different for the SIA (p=4.4) and SSA (p=16.9) (Fig. 4). While there is a well-defined kink in the flow relationship, after the kink the SIA and FS again show rate strengthening while the SSA shows Mohr–Coulomb-like behavior (Fig. 5). It is generally unclear why the FS has higher tractions, which due to the inclusion of topographic form drag should have lower tractions than the SSA. The kink occurs at low-velocity high-stress conditions inland from the ELA (Fig. 8), which could reasonably be a result of misclassification of the basal thermal state as thawed or a transition to a Mohr–Coulomb-like bed. Given these uncertainties, we refrain from characterizing the catchment in further detail.
4.3 Grounded regions of the ice sheet mainly set by hard-bed physics
The ice-sheet-wide velocity–traction relationship exhibits rate strengthening which is typical of hard-bed physics (Fig. 7). This reflects the catchment-scale results which are generally consistent with a Weertman-type traction law, except catchments 1 and 2 and the highest-velocity regions (> 450 m yr−1) of catchments 7 and 8. This suggests that hard-bed physics primarily dictates the traction field for most of the fully grounded regions of the ice sheet outside of the NEGIS and areas with a high flotation fraction. Yet, our results also suggest that in some regions, such as catchments 3 and 4, the relationships for all inversion methods remain consistent with hard-bed physics as ice velocities approach 1000 m yr−1, which includes regions near the termini of some of the largest marine-terminating outlets glaciers. In contrast, for catchments 7 and 8, the divergence of the traction relationships above ∼ 450 m yr−1 indicates uncertainty in the bed physics at high velocities. This reflects the limitation of the methodological approach employed and suggests that at these velocities higher-order stresses might not be fully minimized and topographic form drag likely supports a non-negligible fraction of the gravitational stress. For all catchments, lower data density at the highest velocities (Fig. 5) indicates the catchment-scale relationships are less constrained at high velocities in general.
We cannot explicitly discriminate between bedrock beds and non-deforming till beds which are expected to have identical sliding physics in the rate-strengthening range (Gagliardini et al., 2007; Weertman, 1964; Zoet and Iverson, 2020). However, the p magnitudes in the rate-strengthening catchments are greater than expected due to regelation alone (; Weertman, 1964), which indicates the main rate-strengthening process is likely form drag around bed roughness. Interestingly, comparison to direct observations made via seismic and borehole survey indicates till beds are relatively common across the western half of Greenland in regions where we identify the bed to predominantly reflect Weertman-type sliding (Booth et al., 2012; Dow et al., 2013; Doyle et al., 2018; Kulessa et al., 2017; Walter et al., 2014). However, these observations contradict radar-derived roughness proxies at the ice-sheet scale that find significant bed roughness at the < 100 m scale (Cooper et al., 2019) and kilometer length scale (Lindbäck and Pettersson, 2015; Rippin, 2013) which is inconsistent with flat beds typically associated with sediment plains. Thus, there is a discrepancy between the local and ice-sheet-wide indicators of substrate and our observations of rate strengthening.
To reconcile the observations and the results of our study, we posit that even though till beds appear to be relatively common across the grounded regions of the ice sheet, they are weak and predominantly occur in small patches, more widespread but mechanically strong, or not always deforming in time. As a result, even across mixed-substrate domains, hard-bed physics is predominantly manifested in the ice flow field and surface geometry at large scales in Greenland. Our assertion of either dispersed and patchy or mechanically strong till beds is supported by the stress regimes coinciding with the direct till observations made on the western margin of Greenland. The five field sites where till was directly identified indicate overall high bed strength with driving stresses between 0.08 and 0.21 MPa (Booth et al., 2012; Doyle et al., 2018; Kulessa et al., 2017; Ryser et al., 2014; Walter et al., 2014) (Table S2). Further, the occurrence of multiple observations of hard-bed conditions (Harper et al., 2017) in the same region as many of the till observations (Booth et al., 2012; Dow et al., 2013; Kulessa et al., 2017) suggests that till naturally occurs in discontinuous patches along the bed which is consistent with our interpretation.
4.4 Implications for Greenland ice flow
Our comparison of multi-year velocities and tractions shows the adherence to rate strengthening averaged across summer and winter flow which suggests over longer timescales the dynamics at the ice-sheet scale are largely determined by the stress at the bed in most catchments. Future changes in ice speeds will be dictated by marginal thinning, changes at marine-terminating outlets, or changes in the basal hydrology (Alley and Joughin, 2012). Our flow relationships are not prognostic at the seasonal to annual timescales where changes in the gravitational stresses are small and flow variations predominantly reflect changes in the subglacial drainage system or changes at marine-terminating outlets. Yet, where there are large changes in the traction due to thinning, our flow relationships can estimate the corresponding change in dynamics. Using our model parameters from the rate-strengthening catchments, we estimate the rate at which velocities will change in response to traction perturbations. For velocities typical of outlet glaciers (∼ 1000 m yr−1) the rate of velocity change is estimated at between 15 and 35 m yr−1 kPa−1 and for velocities typical of inland and land-terminating regions (∼ 100 m yr−1) at between 3 and 5 m yr−1 kPa−1 (Fig. S9, Table S1). This serves as an important constraint in Greenland where much of the marginal zones are observed to be thinning (Csatho et al., 2014; Mouginot et al., 2019).
Across timescales and in regions where meltwater forcing drives flow variations, one of the most critical characteristics that determines how ice flow will respond is whether the bed is hard bedrock or deformable sediment. This property not only sets the type of physics at the bed but also sets the morphology of the basal drainage system, where water either flows at the basal interface through networks of cavities and channels or conversely flows through the pore space of the till (Cuffey and Paterson, 2010). While our analysis cannot explicitly distinguish Mohr–Coulomb-like behavior induced by till deformation versus extensive cavitation, we posit that the weak-bed grid cells are reasonable candidates for where there could be consistently deforming till beds. Modeling has suggested deforming till beds are much more likely to experience continued acceleration with increasing melt (Bougamont et al., 2014), and correspondingly, these regions could be more vulnerable to increased meltwater forcing in a warming climate. Interestingly, there are very few weak-bed grid cells found below the snowline where active meltwater forcing occurs except in catchment 6. This is in stark contrast with catchments 7 and 8, where bed strength below the snowline is mainly normal or strong. This may indicate hydrology has a limited effect on multi-year-averaged ice flow outside of select regions but, importantly, also reinforces the idea that till beds in other regions outside of catchments 1 and 2 either are mechanically strong or only sporadically undergo periods of deformation likely during periods of active melt forcing.
We use multi-year-averaged velocities and basal traction estimates to determine the spatial relationship between the velocity–traction relationship for all eight drainage catchments in Greenland. With our methodology we can clearly distinguish between predominantly rate-strengthening and predominantly Mohr–Coulomb-like behavior in different catchments, both of which are consistent with our current understanding of hard- and deforming-bed physics. Overall, we find the flow field and ice geometry of Greenland mainly reflect Weertman-type sliding physics for ice flowing up to 450 m yr−1 outside the NEGIS and regions near floatation. In eastern Greenland, the adherence to rate strengthening continues towards velocities of 1000 m yr−1 which includes areas adjacent to the termini of marine-terminating outlets. In western Greenland there is disagreement between the relationships derived from different inversions at the highest velocities making it difficult to confidently infer the basal physics. Using the ice-sheet-wide flow relationship we identify the location of weak beds that could be more vulnerable to increased melt in a warming climate. Nonetheless, our work mainly suggests that current and future dynamics over the grounded regions of Greenland will in large part depend on Weertman-type hard-bed sliding physics. This provides an important constraint for understanding future change on the ice sheet and serves as a starting point for further investigations that examine location specific bed properties and traction relationships at finer scales.
All data used to generate this paper are currently archived and publicly available for download: MEaSUREs Multi-year Greenland Ice Sheet Velocity Mosaic v1 (Joughin et al., 2016; https://doi.org/10.5067/QUA5Q9SVMSJG), MEaSUREs Greenland Ice Mapping Project (GIMP) Digital Elevation Model from GeoEye and WorldView Imagery v1, (Howat et al., 2017; https://doi.org/10.5067/H0KUYVF53Q8M), IceBridge BedMachine Greenland v3 (Morlighem, 2018; https://doi.org/10.5067/2CIX82HUV88Y), Likely Basal Thermal State of the Greenland Ice Sheet v1 (McGregor et al., 2017; https://doi.org/10.5067/R4MWDWWUWQF9), and Firn Area Delineation (multi-year averaged snowline) (Vandecrux et al., 2019; https://doi.org/10.18739/A2V40JZ6C). Elmer/Ice code and output is available upon request.
The supplement related to this article is available online at: https://doi.org/10.5194/tc-15-1435-2021-supplement.
NM designed the study, analyzed the data, produced the figures, and is the primary author of the paper. FG contributed significantly to the data analysis and writing of the manuscript. FGC performed the basal traction inversions that were implemented with Elmer/Ice and contributed to the writing of the manuscript. AG contributed to the writing of the manuscript.
The authors declare that they have no conflict of interest.
We would like to thank the anonymous reviewer and Bradley Lipovsky for detailed comments which significantly improved the quality of the manuscript. The Elmer/Ice computations presented in this paper were performed using the GRICAD infrastructure (https://gricad.univ-grenoble-alpes.fr), which is supported by Grenoble research communities. This work also benefited from many fruitful discussions with colleagues at IGE.
This research has been supported by the French National Research Agency (grant no. ANR-17-CE01-0008).
This paper was edited by Joseph MacGregor and reviewed by Bradley Lipovsky and one anonymous referee.
Alley, R. B. and Joughin, I.: Modeling Ice-Sheet Flow, Science, 336, 551–552, 2012.
Bons, P. D., Kleiner, T., Llorens, M., Prior, D. J., Sachau, T., Weikusat, I., and Jansen, D.: Greenland Ice Sheet: Higher nonlinearity of ice flow significantly reduces estimated basal motion, Geophys. Res. Lett., 45, 6542–6548, 2018.
Booth, A. D., Clark, R. A., Kulessa, B., Murray, T., Carter, J., Doyle, S., and Hubbard, A.: Thin-layer effects in glaciological seismic amplitude-versus-angle (AVA) analysis: implications for characterising a subglacial till unit, Russell Glacier, West Greenland, The Cryosphere, 6, 909–922, https://doi.org/10.5194/tc-6-909-2012, 2012.
Bougamont, M., Christoffersen, P., Hubbard, A., Fitzpatrick, A., Doyle, S., and Carter, S.: Sensitive response of the Greenland Ice Sheet to surface melt drainage over a soft bed, Nat. Commun., 5, 19, https://doi.org/10.1038/ncomms6052, 2014.
Carr, J. R., Vieli, A., Stokes, C., Jamieson, S., Palmer, S., Christoffersen, P., Dowdeswell, J., Nick, F., Blankenship, D. D., and Young, D. A.: Basal topographic controls on rapid retreat of Humboldt Glacier, northern Greenland, J. Glaciol., 61, 137–150, 2015.
Cavanagh, J., Lampkin, D., and Moon, T.: Seasonal variability in regional ice flow due to meltwater injection into the shear margins of Jakobshavn Isbræ, J. Geophys. Res.-Earth, 122, 2488–2505, 2017.
Christianson, K., Peters, L. E., Alley, R. B., Anandakrishnan, S., Jacobel, R. W., Riverman, K. L., Muto, A., and Keisling, B. A.: Dilatant till facilitates ice-stream flow in northeast Greenland, Earth Planet. Sc. Lett., 401, 57–69, 2014.
Cooper, M. A., Jordan, T. M., Schroeder, D. M., Siegert, M. J., Williams, C. N., and Bamber, J. L.: Subglacial roughness of the Greenland Ice Sheet: relationship with contemporary ice velocity and geology, The Cryosphere, 13, 3093–3115, https://doi.org/10.5194/tc-13-3093-2019, 2019.
Csatho, B. M., Schenk, A. F., van der Veen, C. J., Babonis, G., Duncan, K., Rezvanbehbahani, S., Van Den Broeke, M. R., Simonsen, S. B., Nagarajan, S., and van Angelen, J. H.: Laser altimetry reveals complex pattern of Greenland Ice Sheet dynamics, P. Natl. Acad. Sci. USA, 111, 18478–18483, 2014.
Cuffey, K. M. and Paterson, W. S. B.: The Physics of Glaciers, Academic Press, Burlington, MA, Butterworth-Heinemann/Elsevier, 721 pp., 2010.
Dahl-Jensen, D. and Gundestrup, N.: Constitutive properties of ice at Dye 3, Greenland, International Association of Hydrological Sciences Publication, 170, 31–43, 1987.
Das, S. B., Joughin, I., Behn, M. D., Howat, I. M., King, M. A., Lizarralde, D., and Bhatia, M. P.: Fracture propagation to the base of the Greenland Ice Sheet during supraglacial lake drainage, Science, 320, 778–781, 2008.
Dow, C. F., Hubbard, A., Booth, A. D., Doyle, S. H., Gusmeroli, A., and Kulessa, B.: Seismic evidence of mechanically weak sediments underlying Russell Glacier, West Greenland, Ann. Glaciol., 54, 135–141, 2013.
Doyle, S. H., Hubbard, B., Christoffersen, P., Young, T. J., Hofstede, C., Bougamont, M., Box, J., and Hubbard, A.: Physical conditions of fast glacier flow: 1. Measurements from boreholes drilled to the bed of Store Glacier, West Greenland, J. Geophys. Res.-Earth, 123, 324–348, 2018.
Fahnestock, M., Abdalati, W., Joughin, I., Brozena, J., and Gogineni, P.: High geothermal heat flow, basal melt, and the origin of rapid ice flow in central Greenland, Science, 294, 2338–2342, 2001.
Gagliardini, O., Cohen, D., Råback, P., and Zwinger, T.: Finite-element modeling of subglacial cavities and related friction law, J. Geophys. Res.-Earth, 112, F02027, https://doi.org/10.1029/2006JF000576, 2007.
Gagliardini, O., Zwinger, T., Gillet-Chaulet, F., Durand, G., Favier, L., de Fleurian, B., Greve, R., Malinen, M., Martín, C., Råback, P., Ruokolainen, J., Sacchettini, M., Schäfer, M., Seddik, H., and Thies, J.: Capabilities and performance of Elmer/Ice, a new-generation ice sheet model, Geosci. Model Dev., 6, 1299–1318, https://doi.org/10.5194/gmd-6-1299-2013, 2013.
Gillet-Chaulet, F., Hindmarsh, R. C., Corr, H. F., King, E. C., and Jenkins, A.: In-situquantification of ice rheology and direct measurement of the Raymond Effect at Summit, Greenland using a phase-sensitive radar, Geophys. Res. Lett., 38, L24503, https://doi.org/10.1029/2011GL049843, 2011.
Gillet-Chaulet, F., Durand, G., Gagliardini, O., Mosbeux, C., Mouginot, J., Rémy, F., and Ritz, C.: Assimilation of surface velocities acquired between 1996 and 2010 to constrain the form of the basal friction law under Pine Island Glacier, Geophys. Res. Lett., 43, 10–311, 2016.
Goelzer, H., Robinson, A., Seroussi, H., and van de Wal, R. S. W.: Recent Progress in Greenland Ice Sheet Modelling, Curr. Clim. Change Rep., 3, 291–302, 2017.
Habermann, M., Truffer, M., and Maxwell, D.: Changing basal conditions during the speed-up of Jakobshavn Isbræ, Greenland, The Cryosphere, 7, 1679–1692, https://doi.org/10.5194/tc-7-1679-2013, 2013.
Harper, J. T., Humphrey, N. F., Meierbachtol, T. W., Graly, J. A., and Fischer, U. H.: Borehole measurements indicate hard bed conditions, Kangerlussuaq sector, western Greenland Ice Sheet, J. Geophys. Res.-Earth, 122, 1605–1618, 2017.
Harrington, J. A., Humphrey, N. F., and Harper, J. T.: Temperature distribution and thermal anomalies along a flowline of the Greenland ice sheet, Ann. Glaciol., 56, 98–104, 2015.
Hogg, A. E., Shepherd, A., Gourmelen, N., and Engdahl, M.: Grounding line migration from 1992 to 2011 on Petermann Glacier, north-west Greenland, J. Glaciol., 62, 1104–1114, 2016.
Howat, I. M., Negrete, A., and Smith, B. E.: The Greenland Ice Mapping Project (GIMP) land classification and surface elevation data sets, The Cryosphere, 8, 1509–1518, https://doi.org/10.5194/tc-8-1509-2014, 2014.
Howat, I., Negrete, A., and Smith, B.: MEaSUREs Greenland Ice Mapping Project (GIMP) Digital Elevation Model from GeoEye and WorldView Imagery, Version 1, Boulder, Colorado USA, NASA National Snow and Ice Data Center Distributed Active Archive Center, https://doi.org/10.5067/H0KUYVF53Q8M, 2017.
Iken, A.: The Effect of the Subglacial Water Pressure on the Sliding Velocity of a Glacier in an Idealized Numerical Model, J. Glaciol., 27, 407–421, https://doi.org/10.3189/S0022143000011448, 1981.
Iverson, N. R., Hooyer, T. S., and Baker, R. W.: Ring-shear studies of till deformation: Coulomb-plastic behavior and distributed strain in glacier beds, J. Glaciol., 44, 634–642, 1998.
Iverson, N. R., Cohen, D., Hooyer, T. S., Fischer, U. H., Jackson, M., Moore, P. L., Lappegard, G., and Kohler, J.: Effects of basal debris on glacier flow, Science, 301, 81–84, 2003.
Joughin, I., MacAyeal, D. R., and Tulaczyk, S.: Basal shear stress of the Ross ice streams from control method inversions, J. Geophys. Res.-Sol. Ea., 109, B09405, https://doi.org/10.1029/2003JB002960, 2004.
Joughin, I., Smith, B. E., Howat, I. M., Floricioiu, D., Alley, R. B., Truffer, M., and Fahnestock, M.: Seasonal to decadal scale variations in the surface velocity of Jakobshavn Isbrae, Greenland: Observation and model-based analysis, J. Geophys. Res.-Earth, 117, F02030, https://doi.org/10.1029/2011JF002110, 2012.
Joughin, I., Smith, B., Howat, I., and Scambos, T.: MEaSUREs Multi-year Greenland Ice Sheet Velocity Mosaic, Version 1, Boulder, Colorado USA, NASA National Snow and Ice Data Center Distributed Active Archive Center, https://doi.org/10.5067/QUA5Q9SVMSJG, 2016.
Joughin, I., Smith, B. E., and Howat, I. M.: A complete map of Greenland ice velocity derived from satellite data collected over 20 years, J. Glaciol., 64, 1–11, 2018.
Joughin, I., Smith, B. E., and Schoof, C. G.: Regularized Coulomb friction laws for ice sheet sliding: application to Pine Island Glacier, Antarctica, Geophys. Res. Lett., 46, 4764–4771, 2019.
Kääb, A., Leinss, S., Gilbert, A., Bühler, Y., Gascoin, S., Evans, S. G., Bartelt, P., Berthier, E., Brun, F., and Chao, W.-A.: Massive collapse of two glaciers in western Tibet in 2016 after surge-like instability, Nat. Geosci., 11, 114–120, 2018.
Kamb, B.: Rheological nonlinearity and flow instability in the deforming bed mechanism of ice stream motion, J. Geophys. Res.-Sol. Ea., 96, 16585–16595, 1991.
Kulessa, B., Hubbard, A. L., Booth, A. D., Bougamont, M., Dow, C. F., Doyle, S. H., Christoffersen, P., Lindbäck, K., Pettersson, R., Fitzpatrick, A. A. W., and Jones, G. A.: Seismic evidence for complex sedimentary control of Greenland Ice Sheet flow, Sci. Adv., 3, e1603071, https://doi.org/10.1126/sciadv.1603071, 2017.
Kyrke-Smith, T. M., Gudmundsson, G. H., and Farrell, P. E.: Relevance of detail in basal topography for basal slipperiness inversions: a case study on Pine Island Glacier, Antarctica, Front. Earth Sci., 6, 33, https://doi.org/10.3389/feart.2018.00033, 2018.
Lampkin, D., Amador, N., Parizek, B., Farness, K., and Jezek, K.: Drainage from water-filled crevasses along the margins of Jakobshavn Isbræ: A potential catalyst for catchment expansion, J. Geophys. Res.-Earth, 118, 795–813, 2013.
Leeson, A., Shepherd, A., Briggs, K., Howat, I., Fettweis, X., Morlighem, M., and Rignot, E.: Supraglacial lakes on the Greenland ice sheet advance inland under warming climate, Nat. Clim. Change, 5, 51–55, 2015.
Lindbäck, K. and Pettersson, R.: Spectral roughness and glacial erosion of a land-terminating section of the Greenland Ice Sheet, Geomorphology, 238, 149–159, 2015.
Lliboutry, L.: General Theory of Subglacial Cavitation and Sliding of Temperate Glaciers, J. Glaciol., 7, 21–58, 1968.
Lüthi, M., Funk, M., Iken, A., Gogineni, S., and Truffer, M.: Mechanisms of fast flow in Jakobshavn Isbræ, West Greenland: Part III. Measurements of ice deformation, temperature and cross-borehole conductivity in boreholes to the bedrock, J. Glaciol., 48, 369–385, 2002.
Lüthi, M. P., Ryser, C., Andrews, L. C., Catania, G. A., Funk, M., Hawley, R. L., Hoffman, M. J., and Neumann, T. A.: Heat sources within the Greenland Ice Sheet: dissipation, temperate paleo-firn and cryo-hydrologic warming, The Cryosphere, 9, 245–253, https://doi.org/10.5194/tc-9-245-2015, 2015.
MacAyeal, D. R.: Large-scale ice flow over a viscous basal sediment: Theory and application to ice stream B, Antarctica, J. Geophys. Res.-Sol. Ea., 94, 4071–4087, 1989.
MacGregor, J., Fahnestock, M. A., Catania, G. A., Aschwanden, A., Clow, G. D., Colgan, W. T., Gogineni, S. P., Morlighem, M., Nowicki, S. M. J., Paden, J. D., Price, S. F., and Seroussi, H.: A synthesis of the basal thermal state of the Greenland Ice Sheet, J. Geophys. Res.-Earth, 121, 1328–1350, 2016.
MacGregor, J., Fahnestock, M., Catania, G., Paden, J., Gogineni, P., Morlighem, M., Colgan, W., Nowicki, S. M., Clow, G., Aschwanden, A., Price, S. F., and Seroussi, H.: Likely Basal Thermal State of the Greenland Ice Sheet, Version 1, Boulder, Colorado USA, NASA National Snow and Ice Data Center Distributed Active Archive Center, https://doi.org/10.5067/R4MWDWWUWQF9, 2017.
Maier, N., Humphrey, N., Harper, J., and Meierbachtol, T.: Sliding dominates slow-flowing margin regions, Greenland Ice Sheet, Sci. Adv., 5, eaaw540, https://doi.org/10.1126/sciadv.aaw5406, 2019.
McCormack, F. S., Roberts, J. L., Jong, L. M., Young, D. A., and Beem, L. H.: A note on digital elevation model smoothing and driving stresses, Polar Res., 38, https://doi.org/10.33265/polar.v38.3498, 2019.
Meierbachtol, T., Harper, J., and Johnson, J.: Force Balance along Isunnguata Sermia, West Greenland, Front. Earth Sci., 4, 87, https://doi.org/10.3389/feart.2016.00087, 2016.
Minchew, B., Simons, M., Björnsson, H., Pálsson, F., Morlighem, M., Seroussi, H., Larour, E., and Hensley, S.: Plastic bed beneath Hofsjökull Ice Cap, central Iceland, and the sensitivity of ice flow to surface meltwater flux, J. Glaciol., 62, 147–158, 2016.
Minchew, B., Meyer, C. R., Pegler, S. S., Lipovsky, B. P., Rempel, A. W., Gudmundsson, G. H., and Iverson, N. R.: Comment on “Friction at the bed does not control fast glacier flow”, Science, 363, eaau6055, https://doi.org/10.1126/science.aau6055, 2019.
Morland, L. and Johnson, I.: Steady motion of ice sheets, J. Glaciol., 25, 229–246, 1980.
Morlighem, M.: IceBridge BedMachine Greenland, Version 3, Boulder, Colorado USA, NASA National Snow and Ice Data Center Distributed Active Archive Center, https://doi.org/10.5067/2CIX82HUV88Y, 2018.
Morlighem, M., Rignot, E., Seroussi, H., Larour, E., Ben Dhia, H., and Aubry, D.: Spatial patterns of basal drag inferred using control methods from a full-Stokes and simpler models for Pine Island Glacier, West Antarctica, Geophys. Res. Lett., 37, L14502, https://doi.org/10.1029/2010GL043853, 2010.
Morlighem, M., Williams, C. N., Rignot, E., An, L., Arndt, J. E., Bamber, J. L., Catania, G., Chauché, N., Dowdeswell, J. A., and Dorschel, B.: BedMachine v3: Complete bed topography and ocean bathymetry mapping of Greenland from multibeam echo sounding combined with mass conservation, Geophys. Res. Lett., 44, 11051–11061, https://doi.org/10.1002/2017GL074954, 2017.
Mouginot, J., Rignot, E., Bjørk, A. A., Van Den Broeke, M., Millan, R., Morlighem, M., Noël, B., Scheuchl, B., and Wood, M.: Forty-six years of Greenland Ice Sheet mass balance from 1972 to 2018, P. Natl. Acad. Sci. USA, 116, 9239–9244, 2019.
Poinar, K., Joughin, I., Das, S. B., Behn, M. D., Lenaerts, J. T., and Van Den Broeke, M. R.: Limits to future expansion of surface-melt-enhanced ice flow into the interior of western Greenland, Geophys. Res. Lett., 42, 1800–1807, 2015.
Rippin, D. M.: Bed roughness beneath the Greenland ice sheet, J. Glaciol., 59, 724–732, 2013.
Rogozhina, I., Petrunin, A. G., Vaughan, A. P., Steinberger, B., Johnson, J. V., Kaban, M. K., Calov, R., Rickers, F., Thomas, M., and Koulakov, I.: Melting at the base of the Greenland ice sheet explained by Iceland hotspot history, Nat. Geosci., 9, 366–369, 2016.
Ryser, C., Lüthi, M. P., Andrews, L. C., Hoffman, M. J., Catania, G. A., and Hawley, R. L.: Sustained high basal motion of the Greenland ice sheet revealed by borehole deformation, J. Glaciol., 60, 647660, https://doi.org/10.3189/2014JoG13J196, 2014.
Schoof, C.: The effect of cavitation on glacier sliding, P. Roy. Soc. A-Math. Phys., 461, 609–627, 2005.
Seddik, H., Greve, R., Zwinger, T., Gillet-Chaulet, F., and Gagliardini, O.: Simulations of the Greenland ice sheet 100 years into the future with the full Stokes model Elmer/Ice, J. Glaciol., 58, 427–440, 2012.
Shapero, D. R., Joughin, I. R., Poinar, K., Morlighem, M., and Gillet-Chaulet, F.: Basal resistance for three of the largest Greenland outlet glaciers, J. Geophys. Res.-Earth, 121, 168–180, 2016.
Smith, L. C., Chu, V. W., Yang, K., Gleason, C. J., Pitcher, L. H., Rennermalm, A. K., Legleiter, C. J., Behar, A. E., Overstreet, B. T., Moustafa, S. E., Tedesco, M., Forster, R. R., LeWinter, A. L., Finnegan, D. C., Sheng, Y., and Balog, J.: Efficient meltwater drainage through supraglacial streams and rivers on the southwest Greenland ice sheet, P. Natl. Acad. Sci. USA, 112, 1001, https://doi.org/10.1073/pnas.1413024112, 2015.
Stearns, L. A. and van der Veen, C. J.: Friction at the bed does not control fast glacier flow, Science, 361, 273–277, https://doi.org/10.1126/science.aat2217, 2018.
Stearns, L. A. and van der Veen, C.: Response to Comment on “Friction at the bed does not control fast glacier flow”, Science, 363, eaau8375, https://doi.org/10.1126/science.aau8375, 2019.
Stevens, L. A., Behn, M. D., McGuire, J. J., Das, S. B., Joughin, I., Herring, T., Shean, D. E., and King, M. A.: Greenland supraglacial lake drainages triggered by hydrologically induced basal slip, Nature, 522, 73–76, 2015.
Tulaczyk, S.: Ice sliding over weak, fine-grained tills: Dependence of ice-till interactions on till granulometry, Geol. S. Am. S., 337, 159, https://doi.org/10.1130/0-8137-2337-X.159, 1999.
Tulaczyk, S. M., Scherer, R. P., and Clark, C. D.: A ploughing model for the origin of weak tills beneath ice streams: a qualitative treatment, Quaternary Int., 86, 59–70, 2001.
Vandecrux, B., MacFerrin, M., Machguth, H., Colgan, W. T., van As, D., Heilig, A., Stevens, C. M., Charalampidis, C., Fausto, R. S., Morris, E. M., Mosley-Thompson, E., Koenig, L., Montgomery, L. N., Miège, C., Simonsen, S. B., Ingeman-Nielsen, T., and Box, J. E.: Firn data compilation reveals widespread decrease of firn air content in western Greenland, The Cryosphere, 13, 845–859, https://doi.org/10.5194/tc-13-845-2019, 2019.
Walter, F., Chaput, J., and Lüthi, M. P.: Thick sediments beneath Greenland's ablation zone and their potential role in future ice sheet dynamics, Geology, 42, 487–490, 2014.
Weertman, J.: The Theory of Glacier Sliding, J. Glaciol., 5, 287–303, 1964.
Wright, P. J., Harper, J. T., Humphrey, N. F., and Meierbachtol, T. W.: Measured basal water pressure variability of the western Greenland Ice Sheet: Implications for hydraulic potential, J. Geophys. Res.-Earth, 121, 1134–1147, 2016.
Zoet, L. K. and Iverson, N. R.: A slip law for glaciers on deformable beds, Science, 368, 76–78, 2020.
Zwally, H. J., Giovinetto, M. B., Beckley, M. A., and Saba, J. L.: Antarctic and Greenland drainage systems, GSFC cryospheric sciences laboratory, available at: https://icesat4.gsfc.nasa.gov/cryo_data/ant_grn_drainage_systems.php (last access: 1 March 2015), 2012.