the Creative Commons Attribution 4.0 License.
the Creative Commons Attribution 4.0 License.
 | 12 Mar 2021
Combined influence of oceanic and atmospheric circulations on Greenland sea ice concentration
Roshin P. Raj
Laurent Bertino
Sebastian H. Mernild
Meethale Puthukkottu Subeesh
Nuncio Murukesh
Muthalagu Ravichandran
The amount and spatial extent of Greenland Sea (GS) ice are primarily controlled by the sea ice export across the Fram Strait (FS) and by local seasonal sea ice formation, melting, and sea ice dynamics. In this study, using satellite passive microwave sea ice observations, atmospheric and a coupled ocean-sea ice reanalysis system, TOPAZ4, we show that both the atmospheric and oceanic circulation in the Nordic Seas (NS) act in tandem to explain the SIC variability in the south-western GS. Northerly wind anomalies associated with anomalously low sea level pressure (SLP) over the NS reduce the sea ice export in the south-western GS due to westward Ekman drift of sea ice. On the other hand, the positive wind stress curl strengthens the cyclonic Greenland Sea Gyre (GSG) circulation in the central GS. An intensified GSG circulation may result in stronger Ekman divergence of surface cold and fresh waters away from the south-western GS. Both of these processes can reduce the freshwater content and weaken the upper-ocean stratification in the south-western GS. At the same time, warm and saline Atlantic Water (AW) anomalies are recirculated from the FS region to the south-western GS by a stronger GSG circulation. Under weakly stratified conditions, enhanced vertical mixing of these subsurface AW anomalies can warm the surface waters and inhibit new sea ice formation, further reducing the SIC in the south-western GS.
- Article
(7374 KB) - Full-text XML
- BibTeX
- EndNote


The fresh waters in the GS play an important part for Nordic Seas overflow (Huang et al., 2020), which constitutes the lower limb of the Atlantic meridional overturning circulation (Chafik and Rossby, 2019). The freshwater content in this region is largely driven by the amount of sea ice therein (Aagaard and Carmack, 1989). Sea ice in GS is also important in determining shipping routes (Instanes et al., 2005; Johannessen et al., 2007) as well as to the regional marine ecosystem due to its impact on the light availability (Grebmeier et al., 1995). Most of the sea ice in the GS is exported from the central Arctic Ocean across the Fram Strait (FS) and is largely controlled by the ice drift with the Transpolar Drift (Zamani et al., 2019). Anomalous sea ice export through the FS is associated with events like the “Great Salinity Anomaly” (Dickson et al., 1988) which can have impact on the freshwater content in the Nordic Seas. Therefore, it is quite evident that the changes in sea ice export through the FS influence the GS sea ice and thus the freshwater availability in the Nordic Seas (Belkin et al., 1998; Dickson et al., 1988; Serreze et al., 2006).
Even though it is one of the main mechanisms contributing to the overall SIC in GS, the relation between sea ice export through FS and SIC variability in GS is not very robust (Kern et al., 2010). This further points to the importance of local sea ice formation and sea ice dynamics in the GS. The impact of these processes can be realized prominently in the marginal ice zone (MIZ) in the south-western GS and the “Odden” region in the central GS (see Fig. 1 for approximate locations of the regions). These regions have exhibited strong-negative-SIC trends during recent decades (Rogers and Hung, 2008; see also Fig. 1a in Selyuzhenok et al., 2020). Changes in sea ice of this region can modify the deep water convection through influencing both the heat and salt budgets (Shuchman et al., 1998). Selyuzhenok et al. (2020) found that in spite of increasing sea ice export through the FS, the overall sea ice volume (SIV) in the GS decreased during the period 1979–2016. They further attributed the interannual variability and decreasing trend of SIV to local oceanic processes, more precisely warmer Atlantic Water (AW) temperatures in the Nordic Seas. Further local meteorological parameters, e.g. air temperature, wind speed and direction along with oceanic waves, and eddies, have also been found to influence the sea ice properties in the central GS, particularly for the Odden region (Campbell et al., 1987; Johannessen et al., 1987; Wadhams et al., 1996; Shuchman et al., 1998; Toudal, 1999; Comiso et al., 2001).
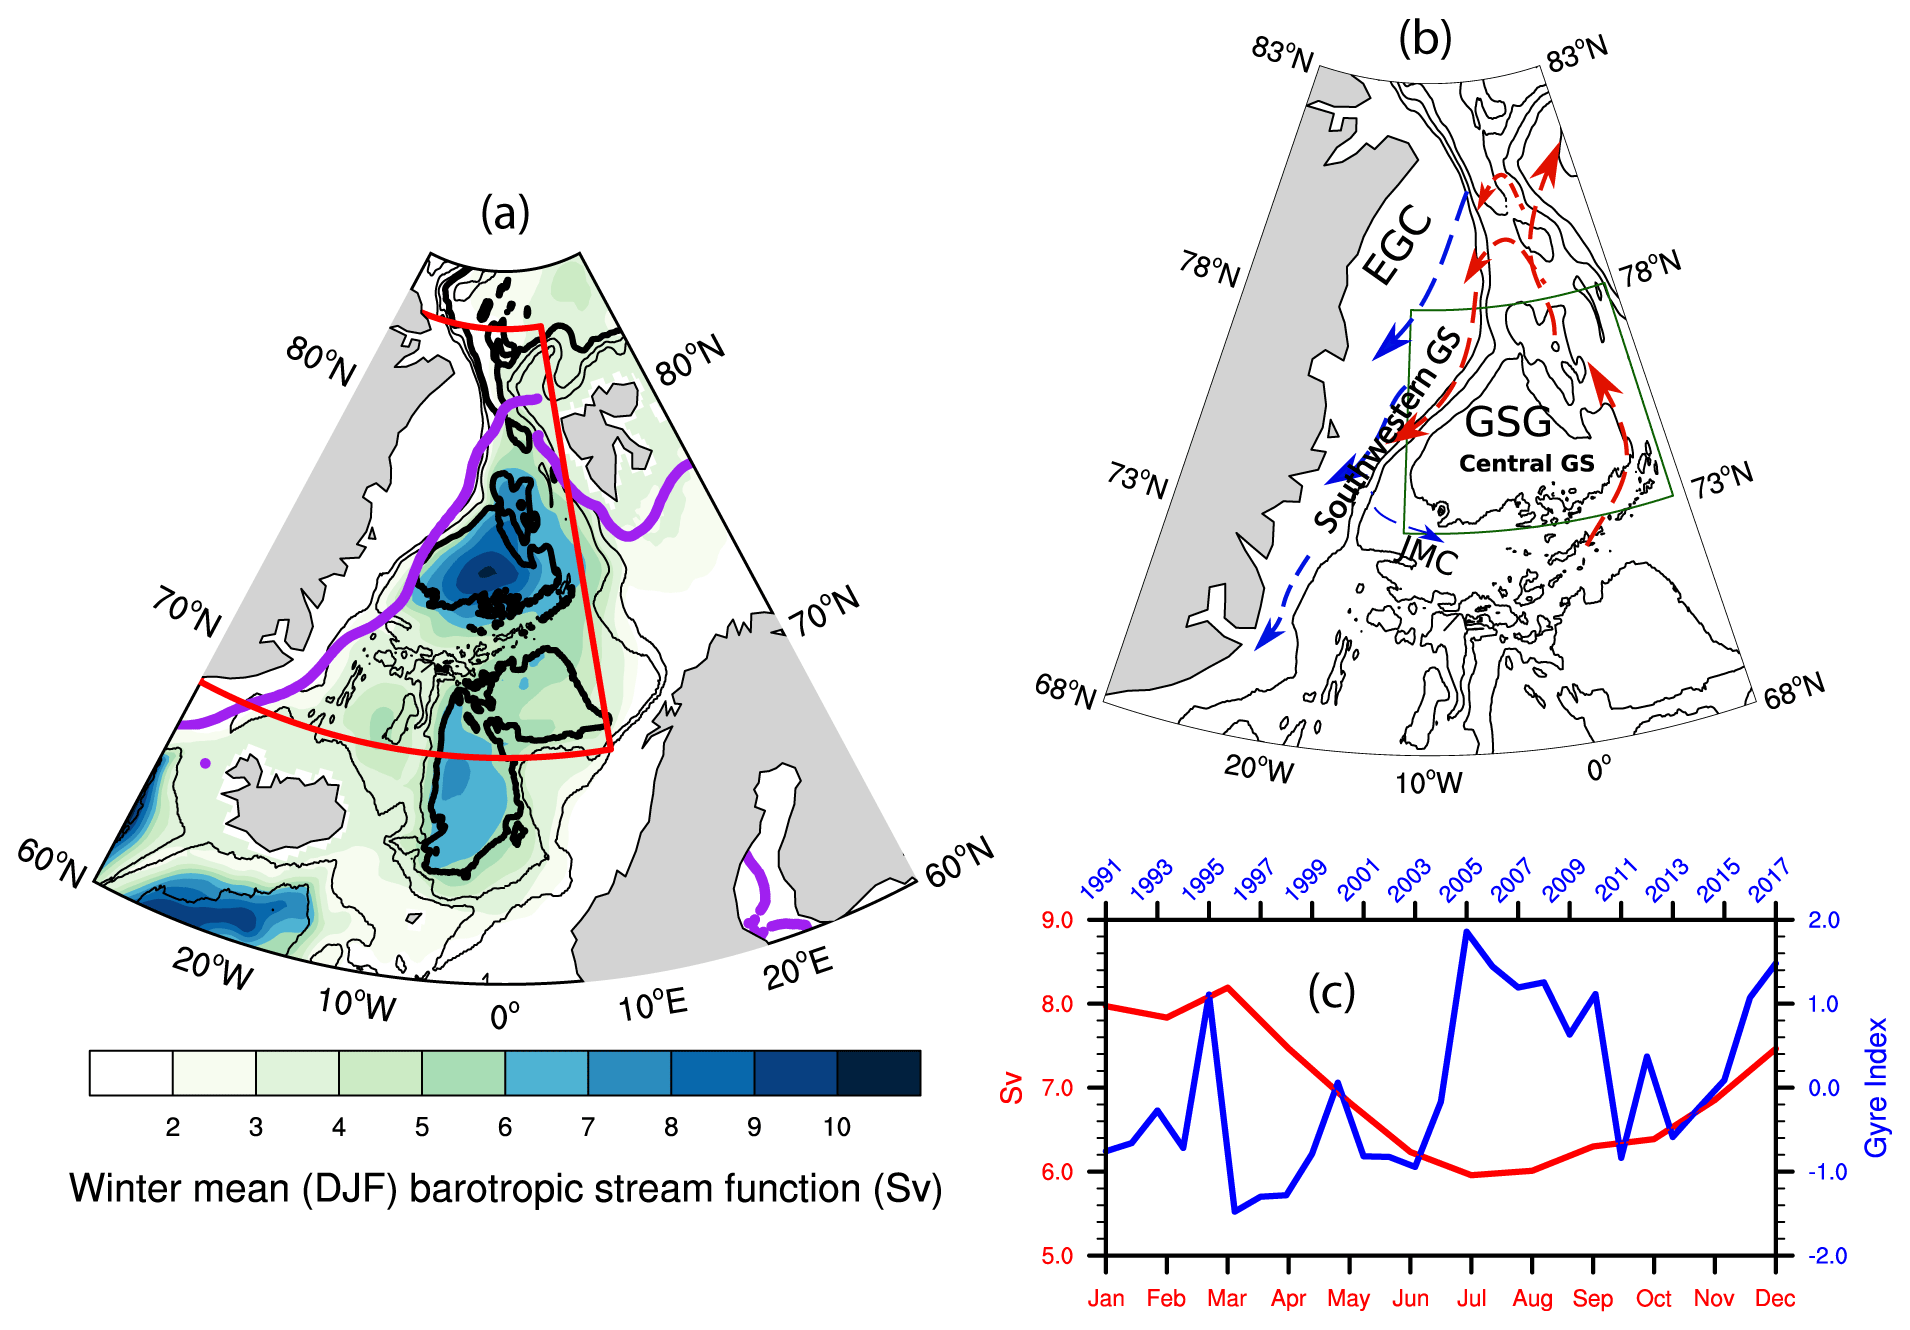
Figure 1(a) Winter-mean (DJF) barotropic stream function for the period 1991–2017. The region marked in red indicates the Nordic Seas region. The purple line shows the mean DJF sea ice extent for the study period. (b) Schematic of the major currents discussed in the text. JMC: Jan Mayen Current; EGC: East Greenland Current; GSG: Greenland Sea Gyre. Warm currents are drawn in red, and cold currents are in blue. Black contours show bottom topography drawn every 1000 m. The thick black contour indicates the 3000 m isobath. The marked region in dark green is used to calculate the “gyre index” as detailed in the next section. (c) The blue line indicates the gyre index used in this study, and the red line shows the annual cycle of the strength of GSG circulation determined by averaging barotropic stream function within the 3000 m isobath in the region marked in (b).
Besides the local factors, sea ice in the GS also responds to large-scale atmospheric forcing. For example, a high-sea-level-pressure (SLP) anomaly over the Nordic Seas (NS) results in anomalous southerly wind in the GS. The associated Ekman drift towards the central GS may assist the eastward expansion of the sea ice and SIC increase in the central GS (Germe et al., 2011). Selyuzhenok et al. (2020) also argued that consistent positive North Atlantic Oscillation (NAO) forcing in recent decades has led to warmer AW in the Nordic Seas and resulted in a declining sea ice volume trend. However, the response of Nordic Seas circulation to the atmospheric forcing and the mechanism through which it can influence the SIC in GS is not studied in detail.
The Greenland Sea Gyre (GSG) is a prominent large-scale feature of the Nordic Seas circulation and can be identified as a cyclonic circulation in the central GS basin (Fig. 1). It is known to respond to the atmospheric forcing in the NS and contribute to AW heat distribution in the Nordic Seas (Hatterman et al., 2016; Chatterjee et al., 2018). A stronger GSG circulation increases the AW temperature in the FS by modifying the northward AW transport in its eastern side (Chatterjee et al., 2018). A simultaneous increase in its southward-flowing western branch, constituting the southern recirculation pathway of AW (Hattermann et al., 2016; Jeansson et al., 2017), can increase the heat content in the south-western GS through a stronger and warmer recirculation of AW (Chatterjee et al., 2018). The return AW, even after significant modification, remains denser than the local cold and fresh surface waters and thus mostly remains in the subsurface (Schlichtholz and Houssais, 1999; Eldevik et al., 2009). However, enhanced vertical winter mixing can cause warming of the surface waters in the GS (Våge et al., 2018). Further, the eastward-flowing Jan Mayen Current (JMC), originating from the East Greenland Current (EGC), constitutes the south-western closing branch of the cyclonic GSG circulation in the GS (Fig. 1b). The eastward extension of the cold and fresh JMC into the central GS basin helps in both new sea ice formation and advection of sea ice from the EGC (Wadhams and Comiso, 1999). Changes in GSG circulation and associated AW recirculation in the GS may also influence the JMC strength and temperature. Thus given the potential role of GSG in modifying the oceanic conditions, it is important to understand how the response of GSG circulation to the atmospheric forcing can influence the SIC in the GS.
In this study we hypothesize that the interannual winter-mean SIC variability in the GS can be explained by the combined influence of atmospheric and oceanic circulations, more precisely the GSG circulation. Using a combination of satellite passive microwave SIC, a coupled sea ice ocean reanalysis, and atmospheric reanalysis data, we show that changes in the GSG dynamics and resulting AW transport in the GS can potentially influence the SIC in the south-western GS. Further, we also show that the atmospheric circulation associated with the GSG circulation variability provides favourable conditions for the GSG's control on the SIC variability in the south-western GS region. Section 2 describes the data and methods applied in the study followed by the results in Sect. 3. Discussion and conclusions are mentioned in Sect. 4.
2.1 Atmospheric data
Monthly mean sea level pressure (SLP) data were obtained from the ERA-Interim reanalysis (Dee et al., 2011) for the period 1991–2017 on a 0.5∘ by 0.5∘ grid resolution. Monthly anomalies were calculated from the monthly climatology field using the full time period (1991–2017) and were averaged for December–January–February (DJF). For the linear regression analysis the DJF-averaged SLP anomalies were detrended.
2.2 Oceanic data
Monthly mean oceanic data used in this study were taken from TOPAZ4, a coupled ocean and sea ice data assimilation system for the North Atlantic and the Arctic. TOPAZ4 is based on the HYbrid Coordinate Ocean Model (HYCOM, with 28 hybrid z-isopycnal layers at a horizontal resolution of 12 to 16 km in the Nordic Seas and the Arctic) and ensemble Kalman filter data assimilation, the results of which have been evaluated in earlier studies (Lien et al., 2016; Xie et al., 2017; Chatterjee et al., 2018; Raj et al., 2019). TOPAZ4 represents the Arctic component of the Copernicus Marine Environment Monitoring Service (CMEMS) and is forced by ERA-Interim reanalysis and assimilates (every week) observations from different platforms. The detailed setup and performance of the TOPAZ4 reanalysis, including the counts of observations and the temporal variations in the data counts, are described in Xie et al. (2017). Of particular relevance for the GS are the assimilation of Argo profiles, research cruise conductivity–temperature–depth (CTDs) from the Institute of Oceanology Polish Academy of Science (IOPAS) and Alfred Wegener Institute (AWI; Sakov et al., 2012), satellite sea ice concentration, sea surface temperature, and sea level anomaly from the CMEMS platforms.
2.3 Sea ice data
Monthly mean sea ice concentrations (SICs) from Nimbus-7 SMMR and DMSP SSM/I-SSMIS Passive Microwave Data, Version 1 (Cavalieri et al., 1996) were obtained from the National Snow and Ice Data Center for the period 1991–2017. The dataset provides a continuous time series of SIC on a polar projection at a grid scale size of 25 km by 25 km. Sea ice velocity data were taken from the Polar Pathfinder Daily 25 km EASE-Grid Sea Ice Motion Vectors (Tschudi et al., 2019).
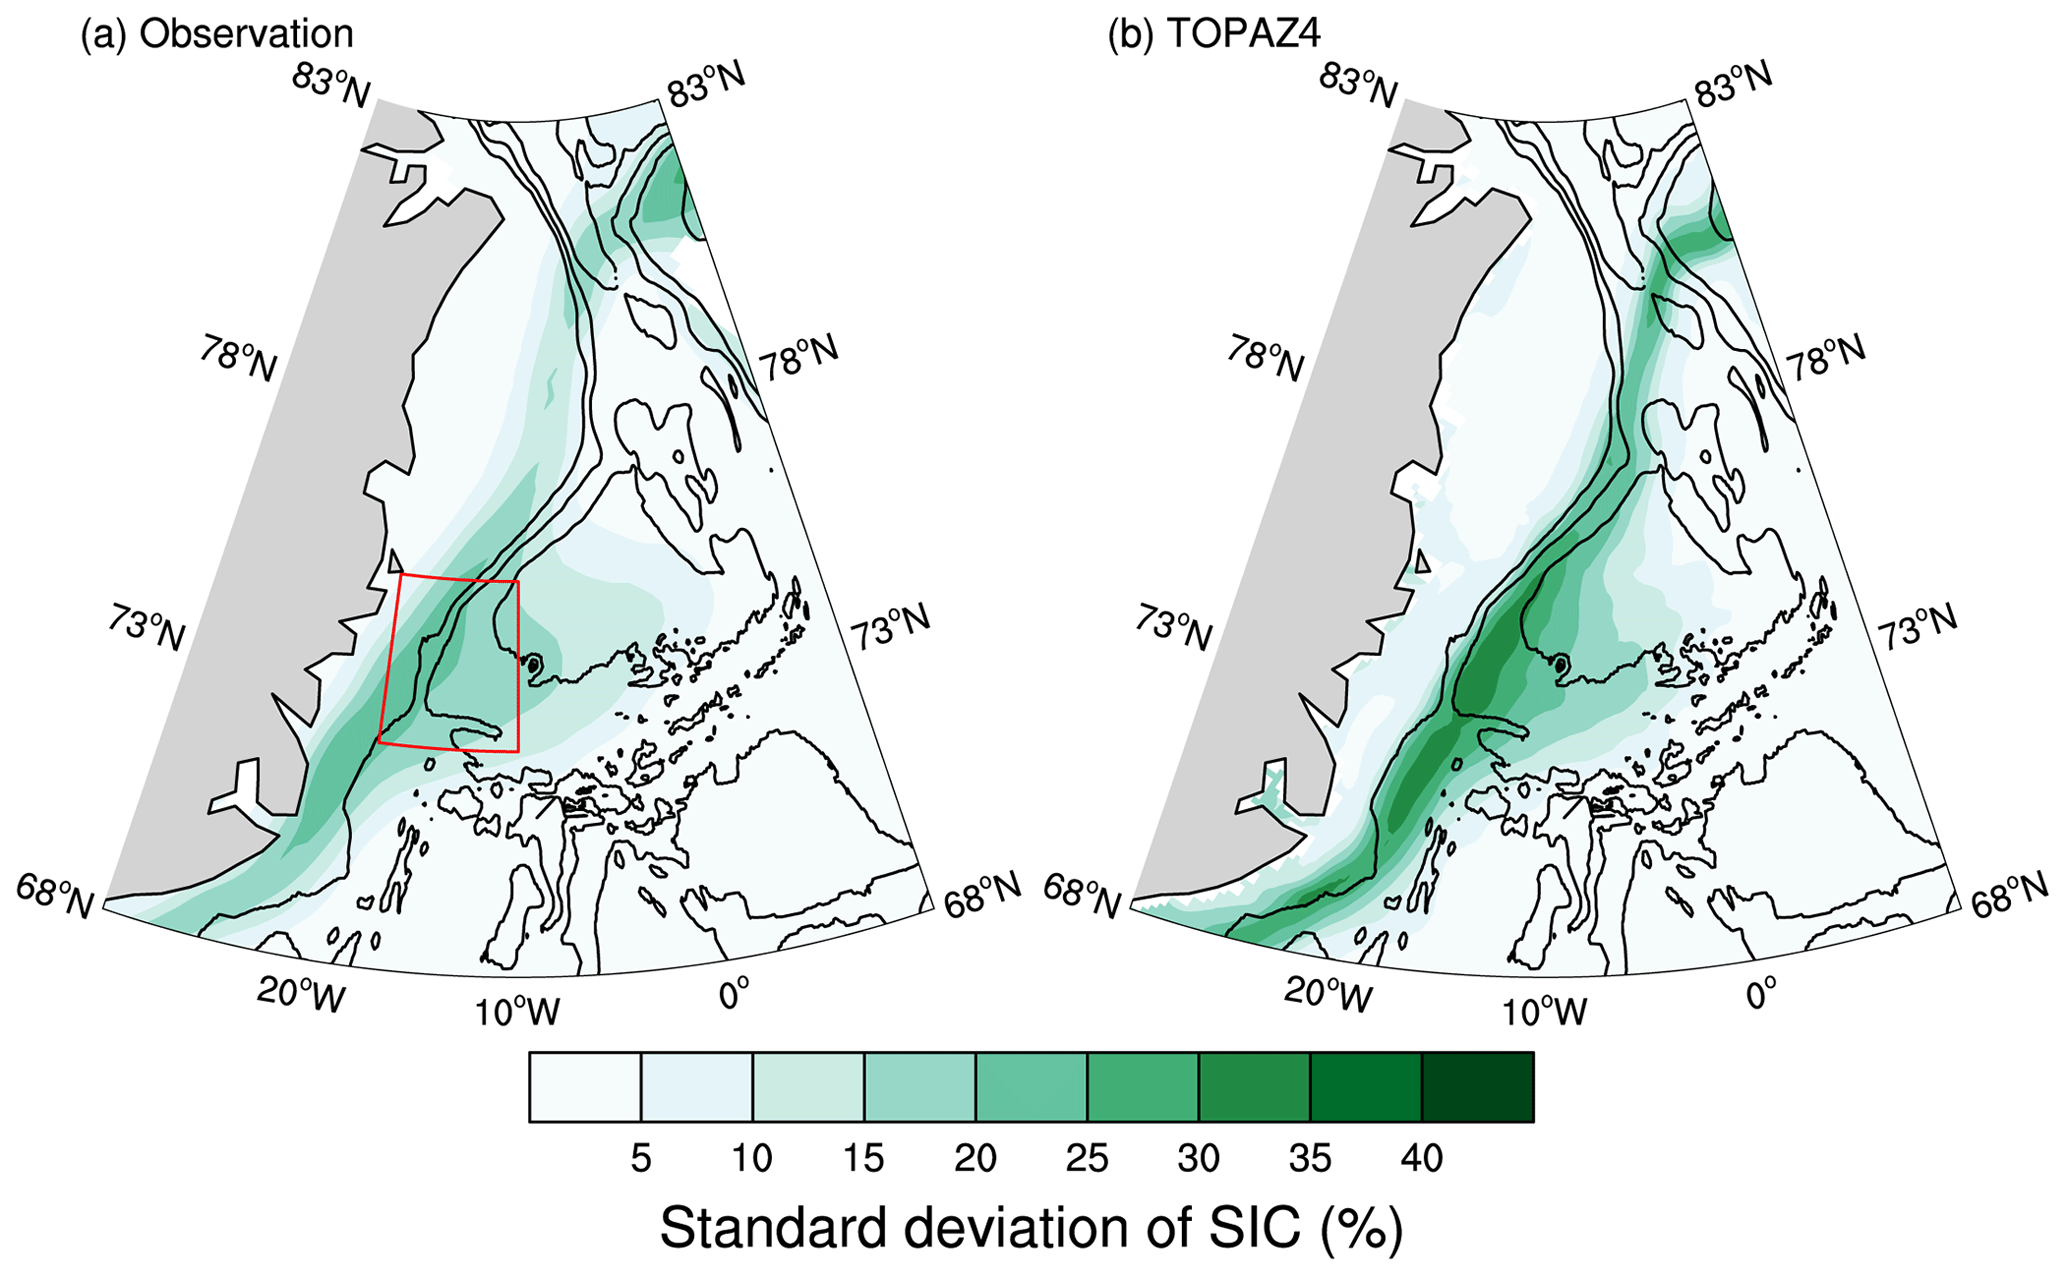
Figure 2Standard deviations of DJF monthly mean sea ice concentration for the period 1991–2017 from (a) satellite observations and (b) TOPAZ4 reanalysis. The red box with high values is drawn over the region 72–75∘ N, 18–10∘ W and is referred to as the south-western GS hereafter.
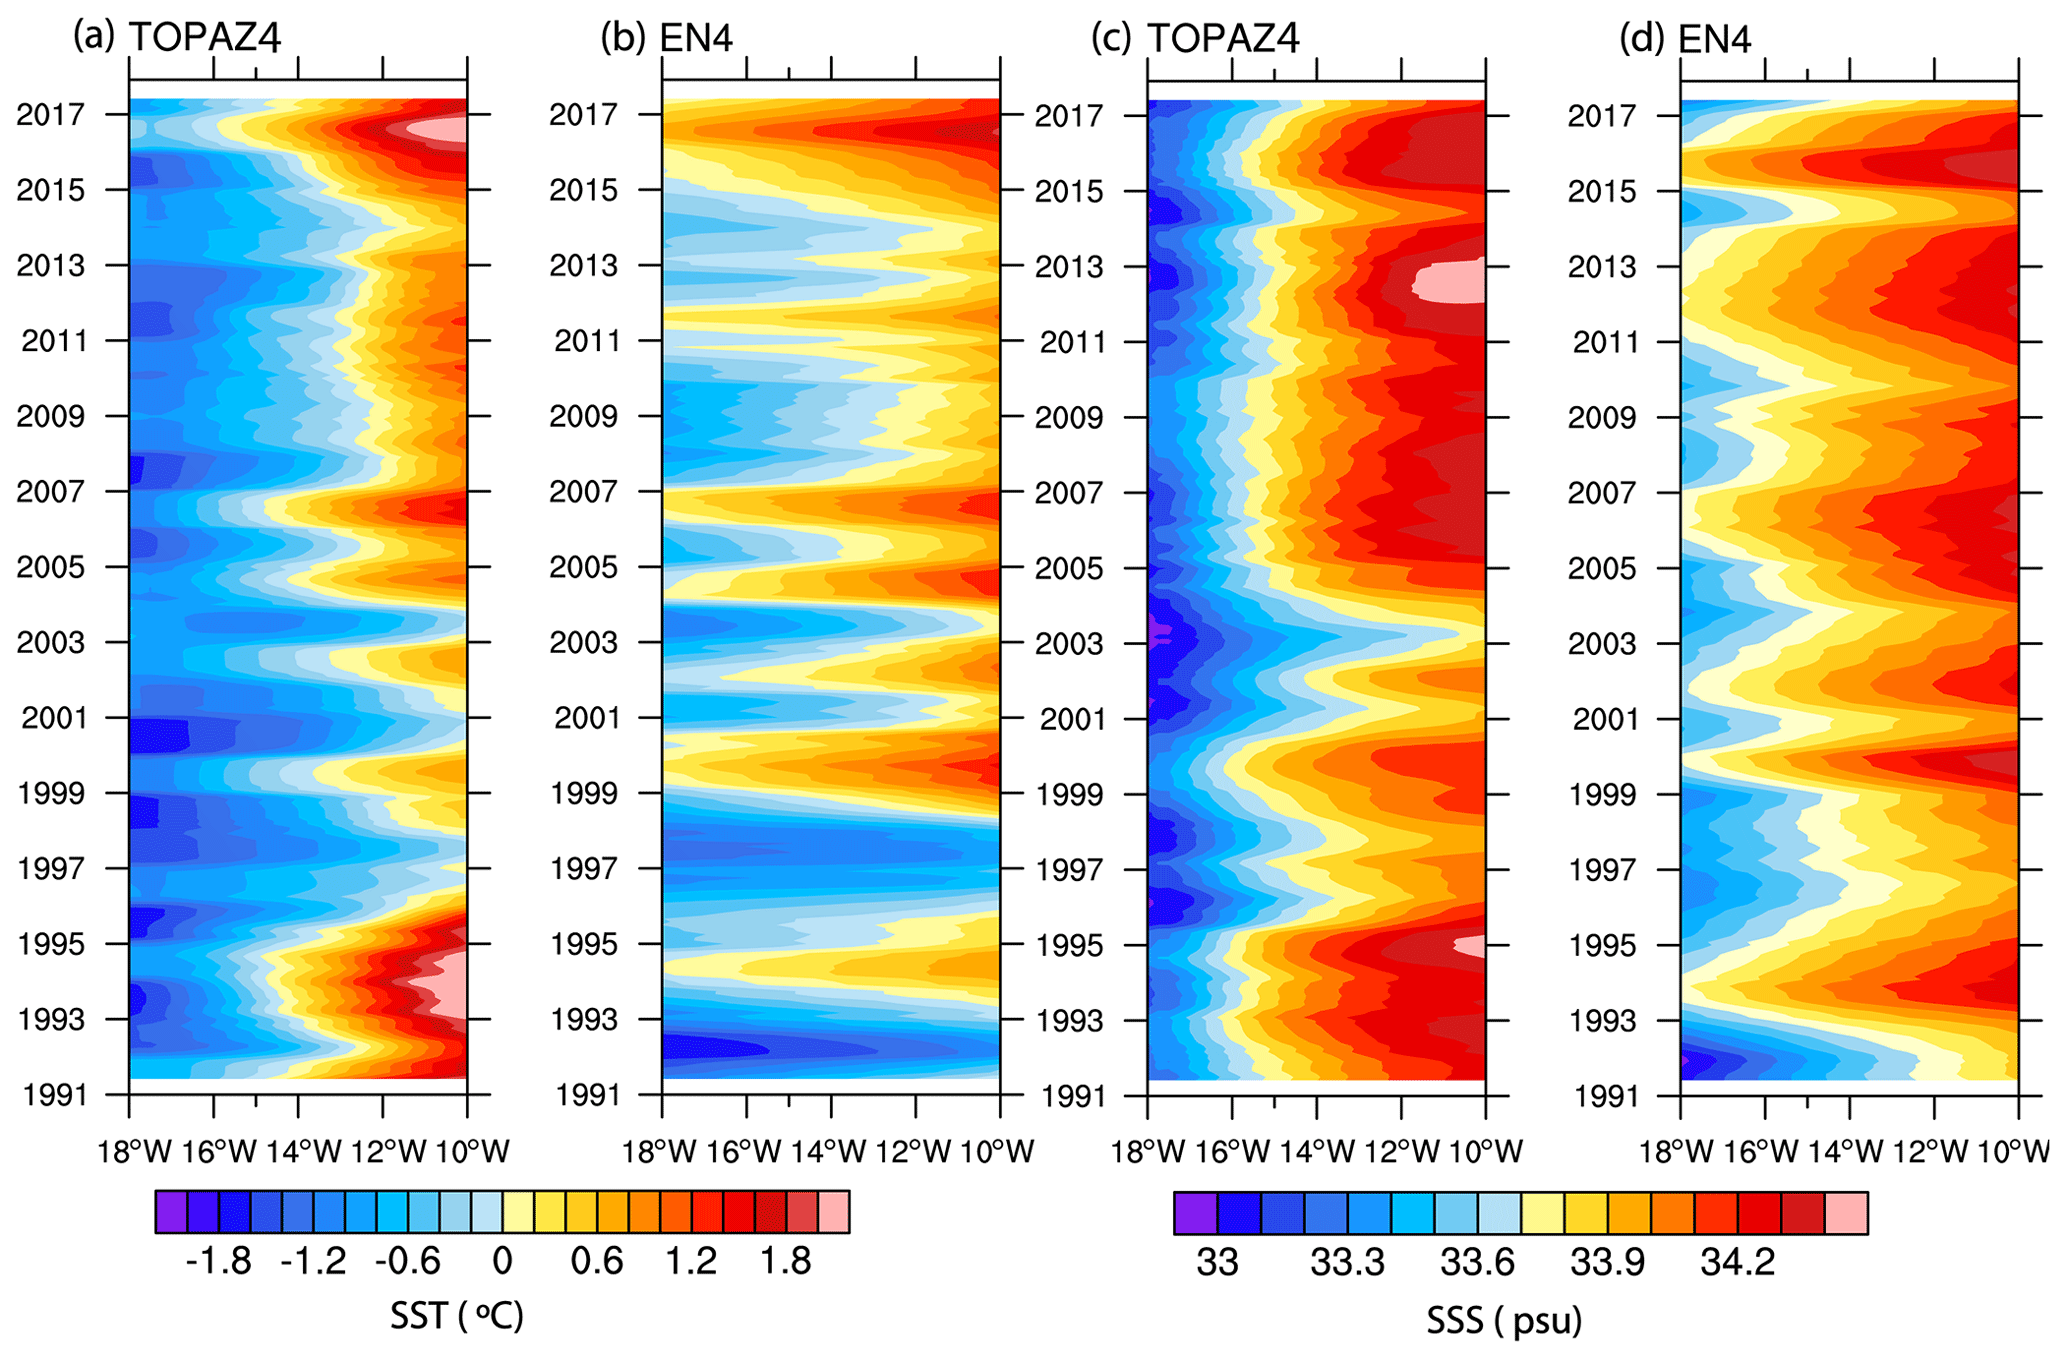
Figure 3Hovmöller (longitude–time) diagram of the SST (∘C; a, b) and SSS (psu; c, d) over the region over 72–75∘ N, 18–10∘ W in the south-western GS as marked in Fig. 2. Panels (a) and (c) are for TOPAZ4, and (b) and (d) are for EN4 observations. In all cases data were smoothed with a 1-year running mean.
2.4 Methods and evaluation of TOPAZ4
We estimated the strength of the GSG circulation by area-averaging the winter-mean (DJF) barotropic stream function anomalies within the 3000 m isobath in the region 72–75∘ N, 18–10∘ W (as marked with the green box in Fig. 1b). The area-averaged values were then standardized over the complete time period 1991–2017 to estimate the “gyre index” (Fig. 1c). In this study we focused only on the winter (DJF) season as the local sea ice in GS can only form during winter, and also the strength of the GSG circulation peaks during winter (Fig. 1c). Composite analysis of DJF mean potential temperature anomaly was performed by averaging the same for strong- and weak-gyre-index years, which were determined when the gyre index crosses the 0.75 and −0.75 marks respectively. The 0.75 threshold was chosen to consider only the periods of sufficiently strong–weak gyre circulation. Throughout the article, all regression and correlation analyses were performed with the detrended time series for the corresponding variables. Freshwater content was calculated using the following formula:
where S is salinity, and the reference salinity Sref is chosen as 34.8 psu.
The standard deviation of winter-mean DJF SIC, in both observation and TOPAZ4, showed high variability along the MIZ in south-western GS and the Odden region in the central GS (Fig. 2). Note that the TOPAZ4 reanalysis data exhibit a more confined MIZ than observations, which is a known model deficiency (Sakov et al., 2012). The sea ice model (Hunke and Dukowicz, 1997), used in TOPAZ4, has a narrower transition zone between the pack ice and the open ocean. Although assimilation of the sea ice observations does slightly improve the position of MIZ in TOPAZ4 compared to observations, the sharp transition in a narrow band still remains, which could have resulted in higher standard deviations in a narrow MIZ of TOPAZ4 as observed in Fig. 2b. However, as we will find in the next section, the sea ice response to the atmospheric and oceanic processes explained in the study can be significantly found in both the observation and TOPAZ4, with slightly higher signals along the MIZ in TOPAZ4. Thus the higher signal-to-noise ratio in TOPAZ4 should not affect the qualitative aspects of the processes and their influence on SIC, which is the main objective of the study.

Figure 4Comparison between EN4 observation (red lines) and TOPAZ4 (blue lines). Monthly mean (thin lines) and 1-year running mean (thick lines) of potential temperature (a, c), salinity (b, d), and stratification index (e, difference of potential density between 200 m and surface) averaged over 72–75∘ N, 18–10∘ W in the south-western GS as marked in Fig. 2. Panels (a, b) are for the 0–50 m depth average and (c, d) for the 100–400 m depth average. (f) DJF mean sea ice concentration in the same region from satellite observations (red) and TOPAZ4 (blue).
Figure 5Linear regression of winter-mean (DJF) sea ice concentration from (a) satellite observations and (b) TOPAZ reanalysis on the gyre index. Only significant values at the 95 % level are shown. Contours are bottom topography drawn every 1000 m.
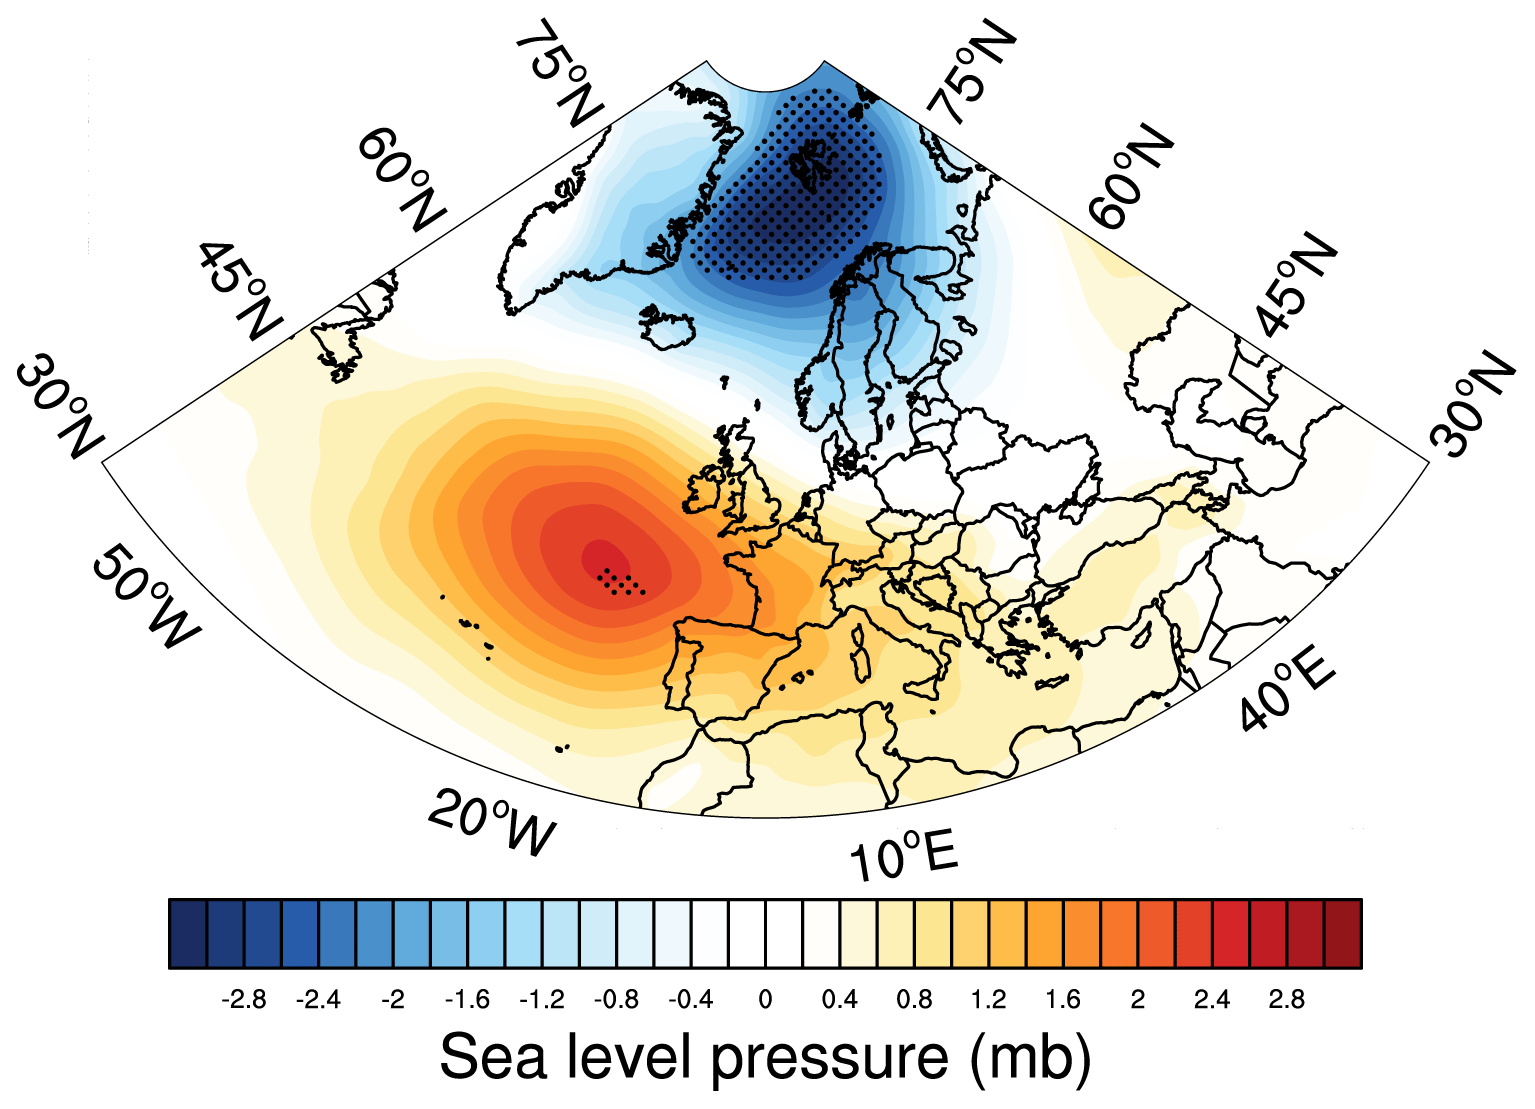
Figure 6Linear regression of DJF mean sea level pressure anomaly on the gyre index. Regions with 95 % statistical significance are dotted.
For evaluation of the oceanic conditions in TOPAZ4, we used temperature and salinity observations obtained from EN4 (version 4.2.1) quality-controlled analyses with Levitus et al. (2009) corrections applied. Here we chose to compare the oceanic parameters in a region (as marked in Fig. 2) in the south-western GS where the standard deviation of the SIC is found to be at a maximum in both TOPAZ4 and observations. We will also show in the next section that SIC response to the processes described here is most profound in this region. Hereafter we refer to this region as the south-western GS for simplicity. Figure 3 shows the spatio-temporal patterns of sea surface temperature (SST) and salinity (SSS) in the south-western GS as found in TOPAZ4 and EN4. Although the temporal evolution of these parameters is well captured in TOPAZ4, compared to observations, the westward extension of the warm and saline waters was found to be less in TOPAZ4. This indicates that the front between the cold and fresh waters along the Greenland shelf and the warm and saline waters in the south-western GS is slightly shifted towards the east in TOPAZ4 compared to observations. This could be a reason for the fact that a higher standard deviation of SIC is found slightly toward the east in TOPAZ4 than observations (Fig. 2). In the south-western GS, both the surface and subsurface temperature in TOPAZ4 were found to be colder compared to observations (Fig. 4). The negative biases in TOPAZ4 were more profound in the subsurface for both temperature and salinity. Xie et al. (2017) also found a similar result with TOPAZ4 and attributed it to sparse observations. Using the potential density difference between 200 m and the surface as an indicator of the stratification, we found that TOPAZ4 has weaker stratification compared to observations (Fig. 4e). Consistent with the cold bias in TOPAZ4, winter-mean SIC in TOPAZ4 is higher than the satellite observations in the south-western GS (Fig. 4f). However, we found a strong correlation (r=0.9) between the SIC in observations and TOPAZ4. This indicates that the interannual variability of SIC, which is the focus of the study, is quite consistent in both TOPAZ4 and observations.
The regression map of winter-mean SIC on the gyre index showed significant negative SIC in the south-western GS (Fig. 5). The spatial pattern of the regression coefficients closely resembles the standard deviation of winter-mean SIC in the GS, as shown in Fig. 2. This indicates that a considerable amount of the SIC variability in the GS can be associated with GSG circulation. However, it should be noted that the atmospheric forcing in the NS can influence both the GSG circulation (Aagaard, 1970; Legutke, 2002; Chatterjee et al., 2018) and SIC variability in the GS (Germe et al., 2011).
To elucidate the possible influence of atmospheric circulation pattern associated with GSG circulation on the SIC variability in the GS, linear regression of the sea level pressure anomalies on the gyre index was calculated and shown in Fig. 6. The large-scale atmospheric circulation shows a positive NAO-like pattern associated with a strong GSG circulation, but with centres of actions north of their usual locations (Fig. 6). The GSG circulation responds to the anomalous wind stress curl induced by the low-SLP anomaly patterns in the NS (Chatterjee et al., 2018). However, we found that the station-based NAO index, with its spatial feature highlighting the Icelandic low and Azores high (https://climatedataguide.ucar.edu/sites/default/files/nao_station_seasonal.txt, last access: 19 December 2020), and the gyre index have a very low correlation (r=0.2). This further points to the importance of the spatial variability of NAO (Zhang et al., 2008; Moore et al., 2012) and its influence on the Nordic Seas circulation. Also note that the low correlation could be due to the fact that the equatorward pole of NAO does not exhibit very significant regression patterns in Fig. 6.
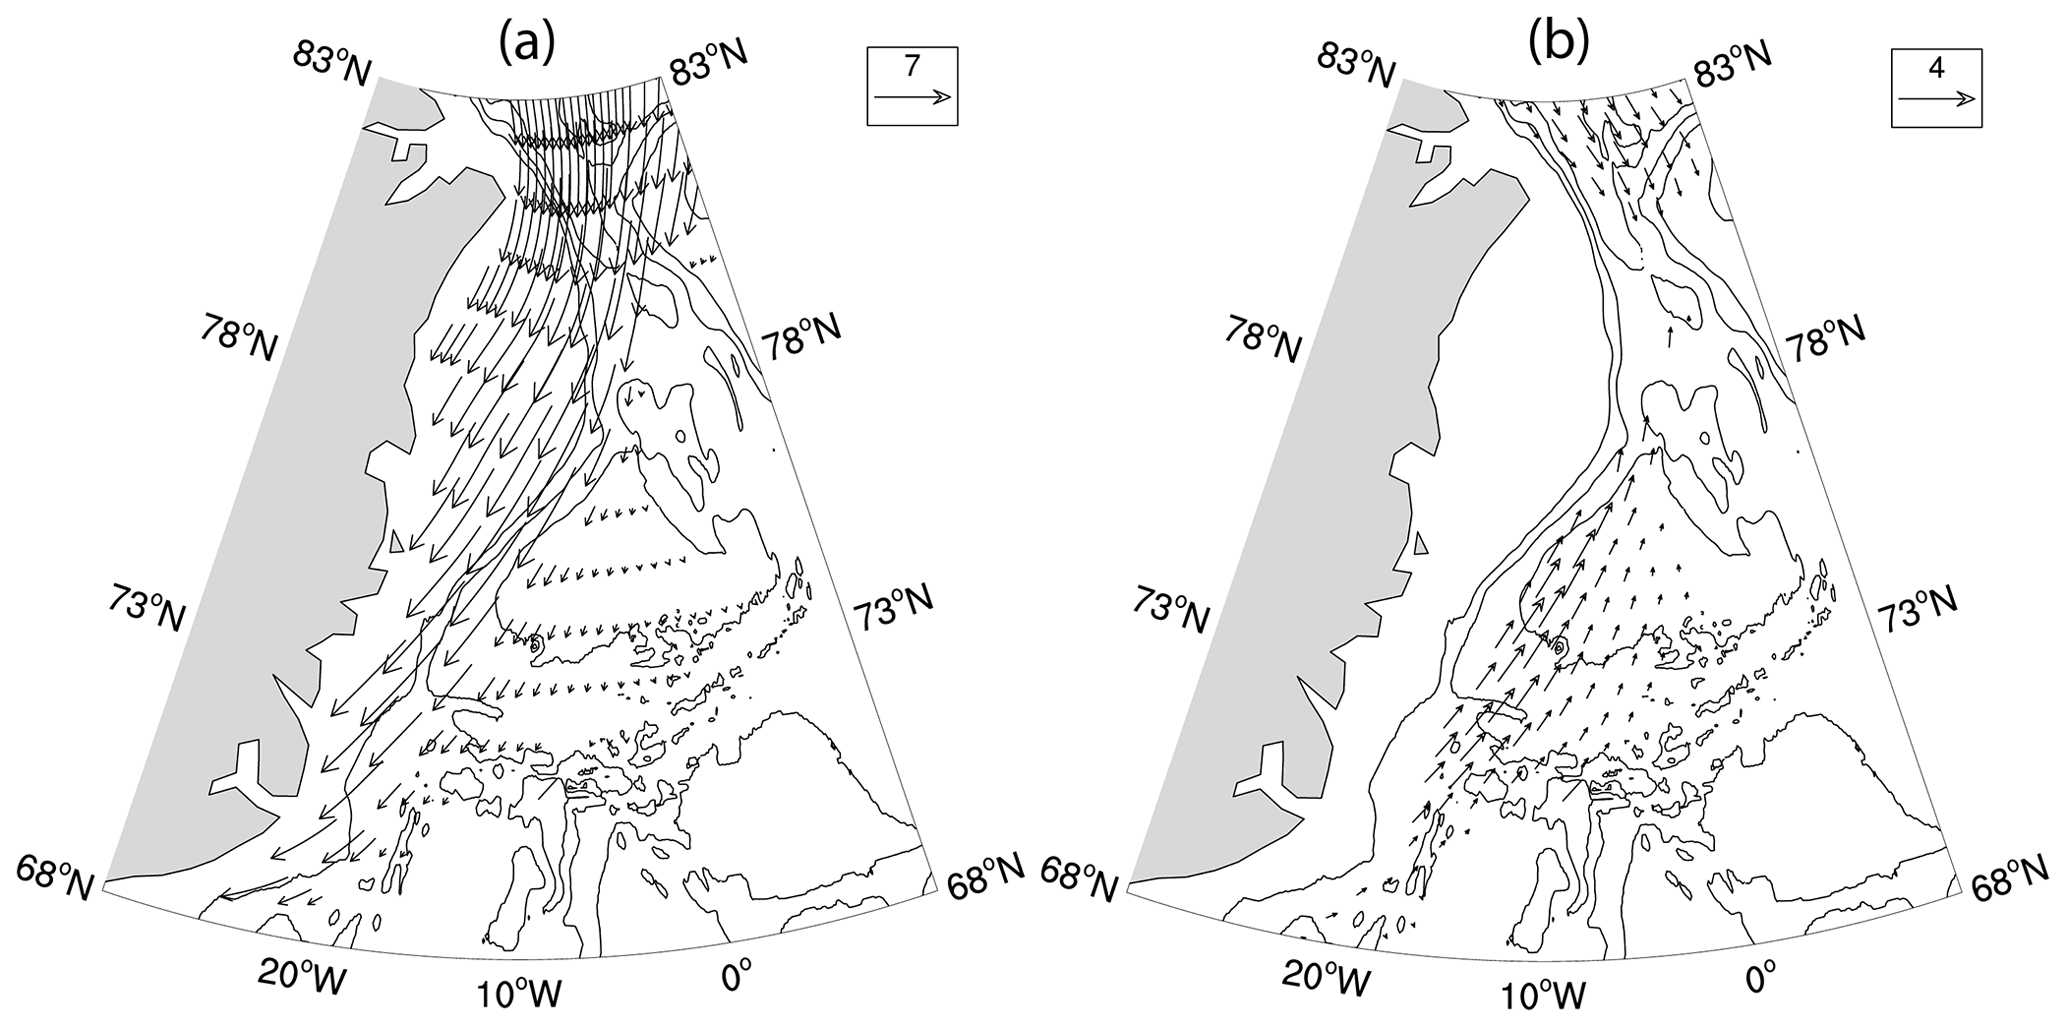
Figure 7(a) Climatological (1991–2017) DJF sea ice velocity vectors (cm s−1) from satellite observations. (b) Regression of DJF sea ice velocity anomalies (cm s−1) on the gyre index. Only results significant at 95 % are shown for clarity. Contours are bottom topography drawn every 1000 m.
The mean southward sea ice export in the GS across the FS (Fig. 7a) is strongly driven by the geostrophic winds in this region (Smedsrud et al. 2011). The low-SLP pattern over the NS associated with the GSG circulation can induce anomalous northerlies in the GS. Linear regression of sea ice velocities on the gyre index showed anomalous northward sea ice velocities in the GS associated with an increase in GSG strength (Fig. 7b). This indicates that the anomalous northerly winds during a strong GSG circulation would lead to Ekman drift of sea ice which tends to push the sea ice towards the Greenland coast and reduce the mean southward sea ice velocities in this region (Fig. 7a). This could lead to reduced sea ice export in this region and result in low SIC.

Figure 8(a) Difference between 400 m depth-averaged potential temperature anomalies (∘C) averaged for years of strong (red bars in b) and weak (blue bars in b) gyre index. (b) Gyre index (blue) and standardized surface salinity anomaly (black) temperature advection (U∇T) in the upper 400 m (red) for DJF over the region 72–75∘ N, 18–10∘ W, as marked in (a).
Next, we investigate GSG's potential in influencing the oceanic conditions and hence the sea ice in the GS, given that the local oceanic conditions largely affect the sea ice conditions therein (Johannessen et al., 1987; Visbeck et al., 1995; Kern et al., 2010; Selyuzhenok et al., 2020). Figure 8a shows the difference in ocean temperature anomaly in the upper 400 m averaged for the strong- and weak-GSG-circulation years (marked in Fig. 8b; see methods for definitions). The average temperature anomaly for the strong-GSG-circulation years was found to be approximately 1 ∘C higher than the same during weak-GSG-circulation years. The warm anomalies further extend eastward with the JMC towards the central GS and could potentially affect the sea ice formation in the Odden region. Further, we found significant positive correlation (r=0.7, p<0.01; Fig. 8b) between gyre index and temperature advection (U∇T in the upper 400 m) in the south-western GS (marked region in Fig. 8a), where maximum GSG influence on SIC is found (Fig. 3a). This suggests that a strong GSG circulation recirculates the warm AW anomalies into the south-western GS from the FS. This is consistent with earlier study indicating an increased oceanic heat content in the south-western GS due to a stronger GSG circulation (Chatterjee et al., 2018).
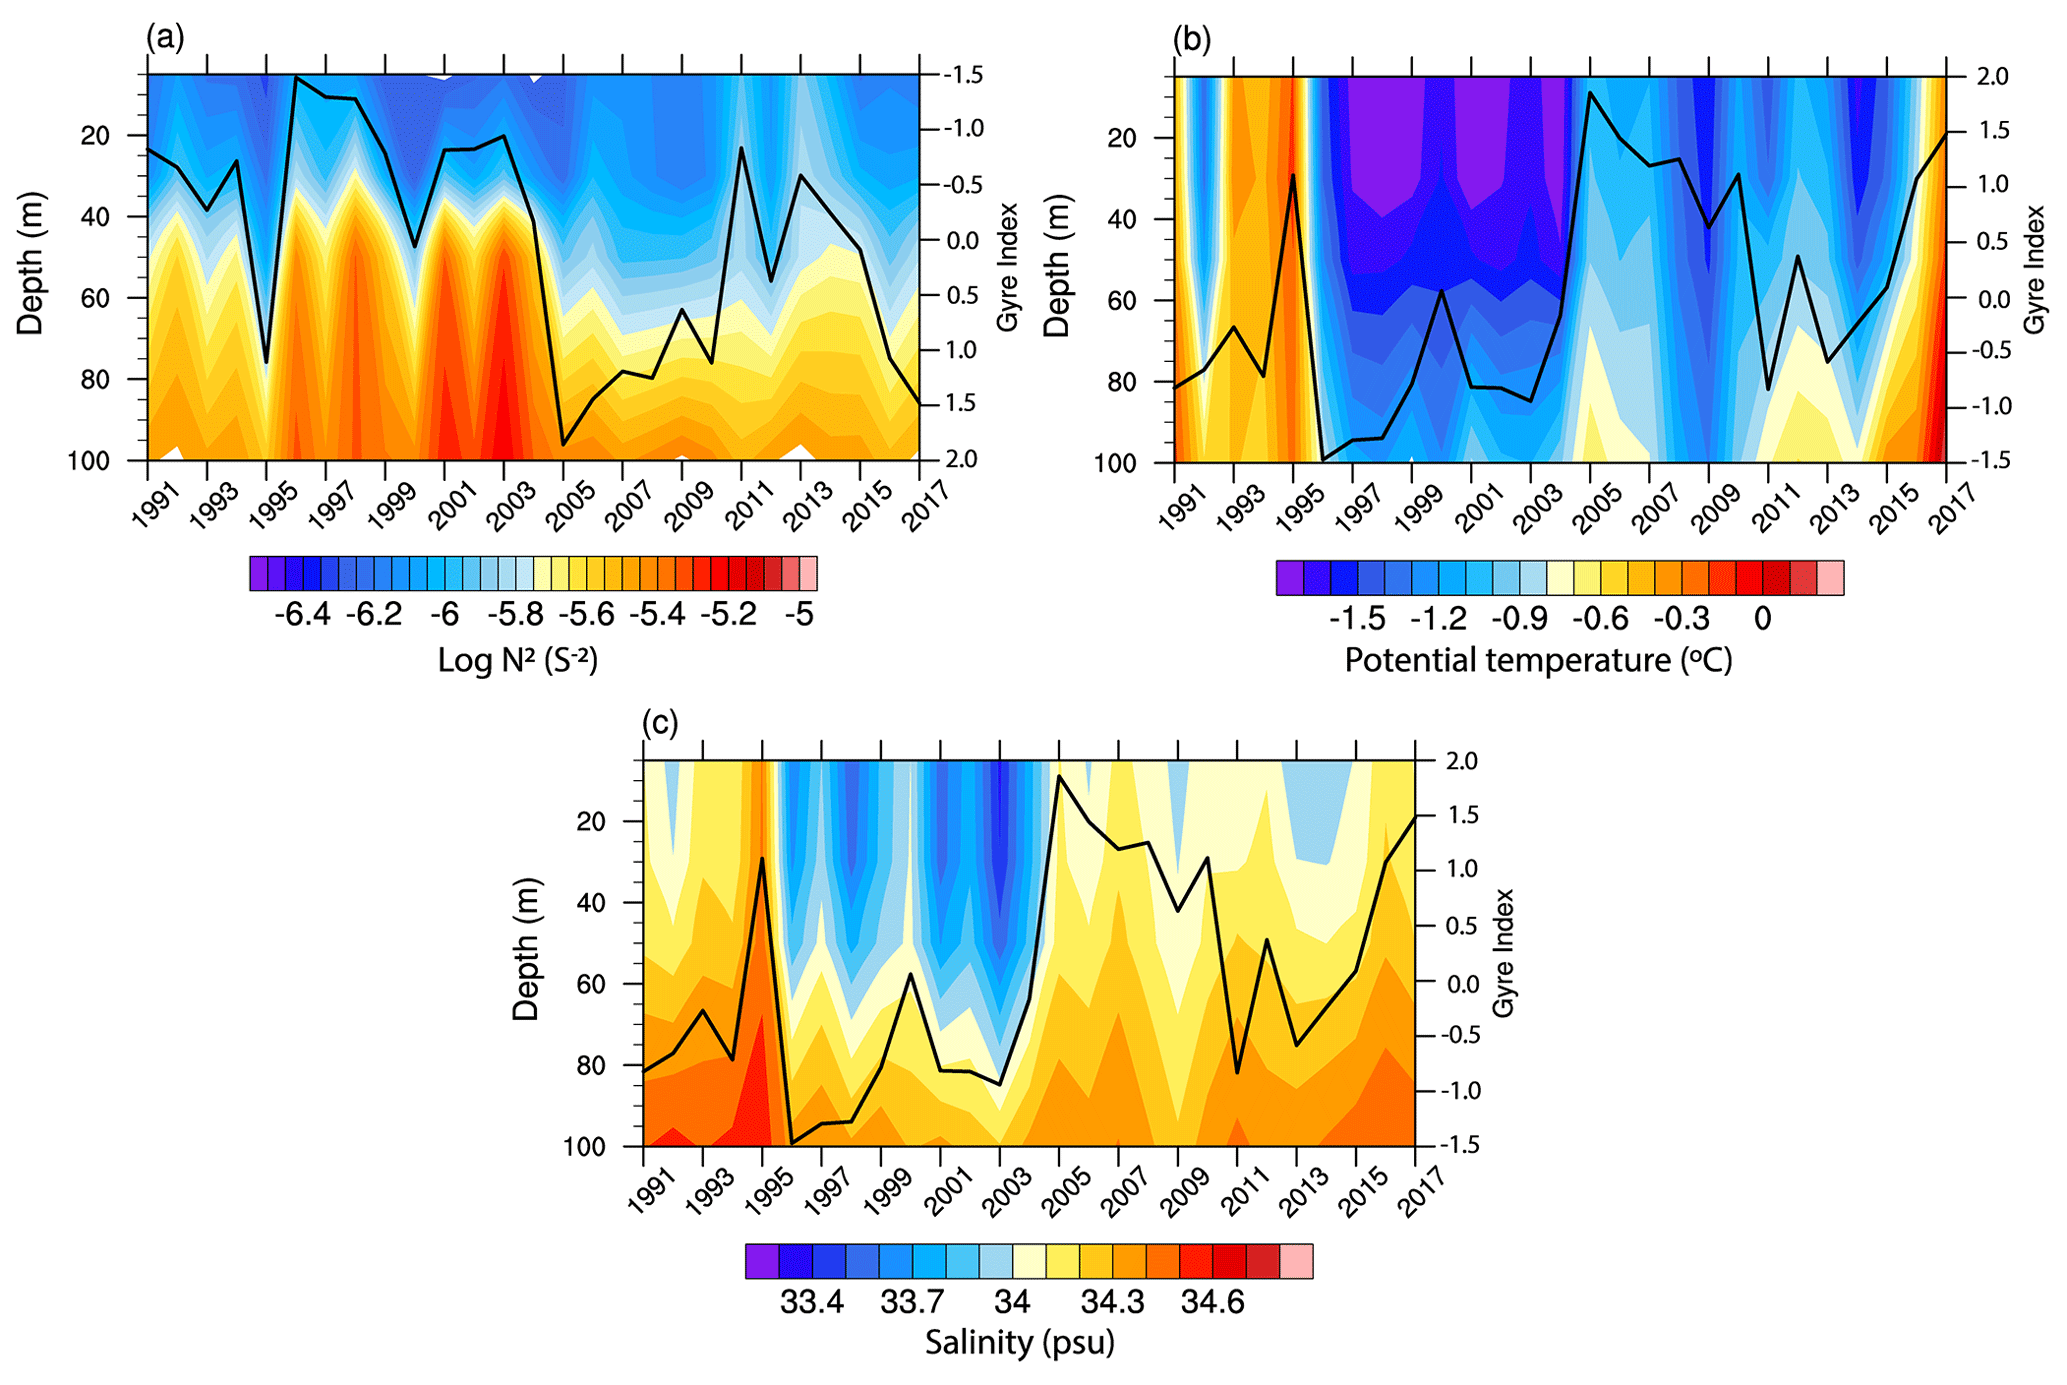
Figure 9(a) Logarithm of squared Brunt–Väisälä frequency (N2, colour shaded), (b) potential temperature, and (c) salinity for DJF over the region 72–75∘ N, 18–10∘ W, as marked in Fig. 8a. The black time series on the right y axis is the gyre index in all three panels. Note that the gyre index is plotted on a reversed y axis in (a) for ease of comparison.
However, it should be noted that the recirculated AW in the GS still remains dense enough to be in the subsurface (Schlichtholz and Houssais, 1999; Eldevik et al., 2009) and needs to be vertically mixed to have an impact on the sea ice. We found that the upper-ocean stratification in the south-western GS strongly covaries with GSG circulation strength (Fig. 9a). The analysis shows that a weakening of the stratification in the upper part of the water column coincides with a stronger GSG circulation and vice versa (Fig. 9a). Further, warm and saline signatures in the upper ocean can be found during strong GSG circulation, indicating enhanced vertical mixing of the AW in the south-western GS (Fig. 9b and c). This is further confirmed by significant positive correlation (r=0.7, p<0.01) between surface salinity anomaly and gyre index (Fig. 8b). These surface anomalies can further inhibit new sea ice formation and also may cause melting of existing sea ice from the bottom.
Here we investigated the combined influence of atmospheric and oceanic circulations on the interannual variability of the winter-mean SIC variability in the GS and showed that the NS, in particular the GSG circulation, can significantly contribute to the SIC variability in the south-western GS. Figure 10 shows the flow chart and a schematic illustration of the mechanisms proposed in this study. The large-scale atmospheric circulation pattern that influences the GSG circulation resembles a NAO-like pattern with its northern centre of action situated northeast of the typical NAO pattern. The cyclonic GSG circulation strengthens in response to the positive wind stress curl induced by the low-SLP anomaly in the NS (Legutke, 2002; Chatterjee et al., 2018). The resulting northerly wind anomalies over the GS can potentially alter the sea ice export across the FS (Kwok and Rothrock, 1999; Jung and Hilmer, 2001; Vinje, 2001; Tsukernik et al., 2010; Smedsrud et al., 2011; Ionita et al., 2016). However, winter-mean SIC in the GS and FS ice area flux are not strongly correlated; Germe et al., 2011), suggesting that the SIC variability in the GS can be significantly influenced by the local sea ice dynamics and oceanic conditions.
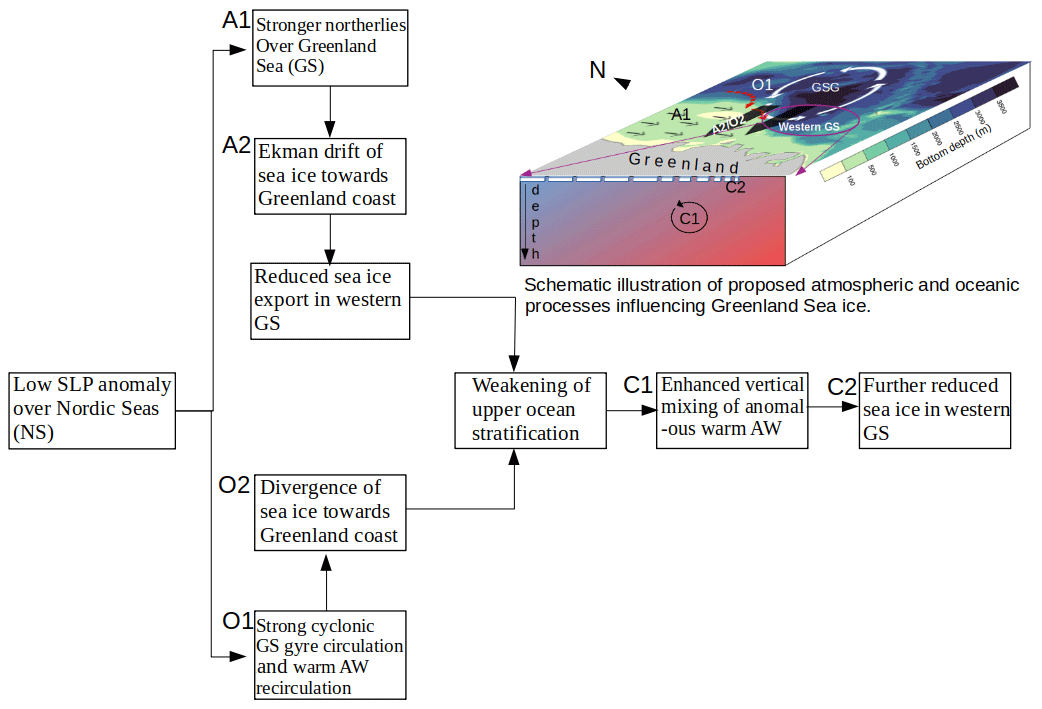
Figure 10A flow chart and schematic diagram of the proposed processes influencing the SIC variability in the south-western GS.
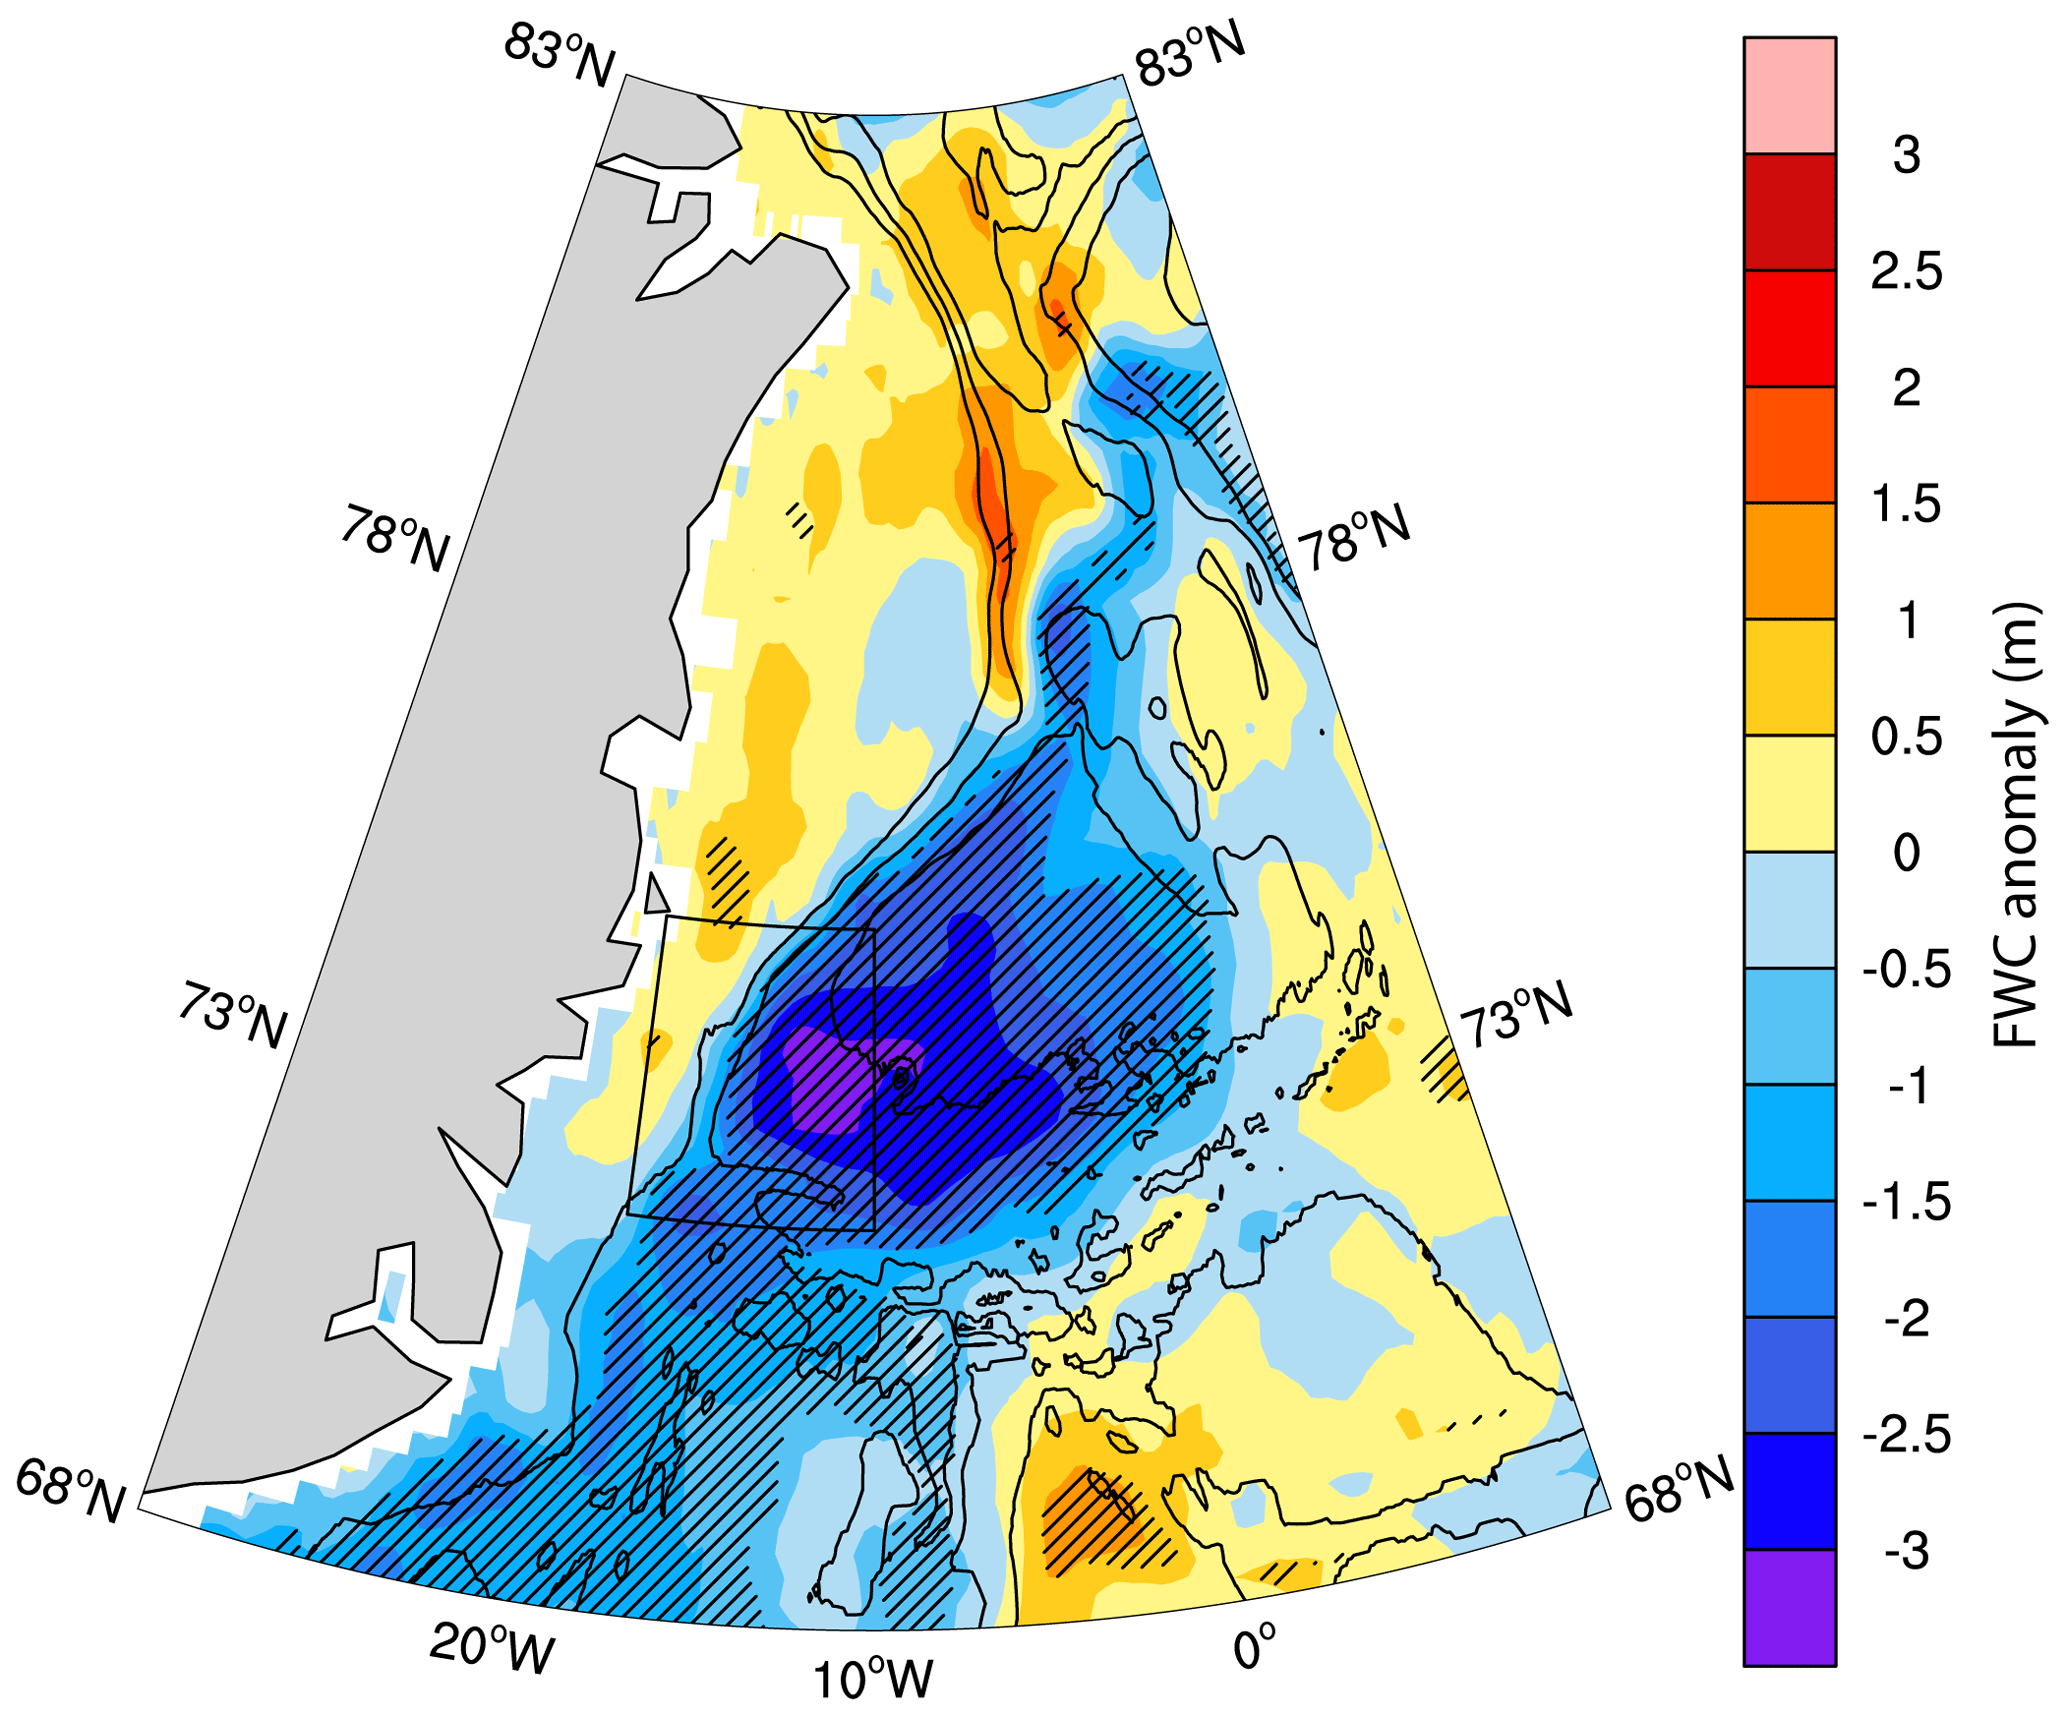
Figure 11Difference in freshwater content (FWC) anomaly (m) between strong- and weak-gyre-index periods. Significant differences at the 95 % level are stippled.
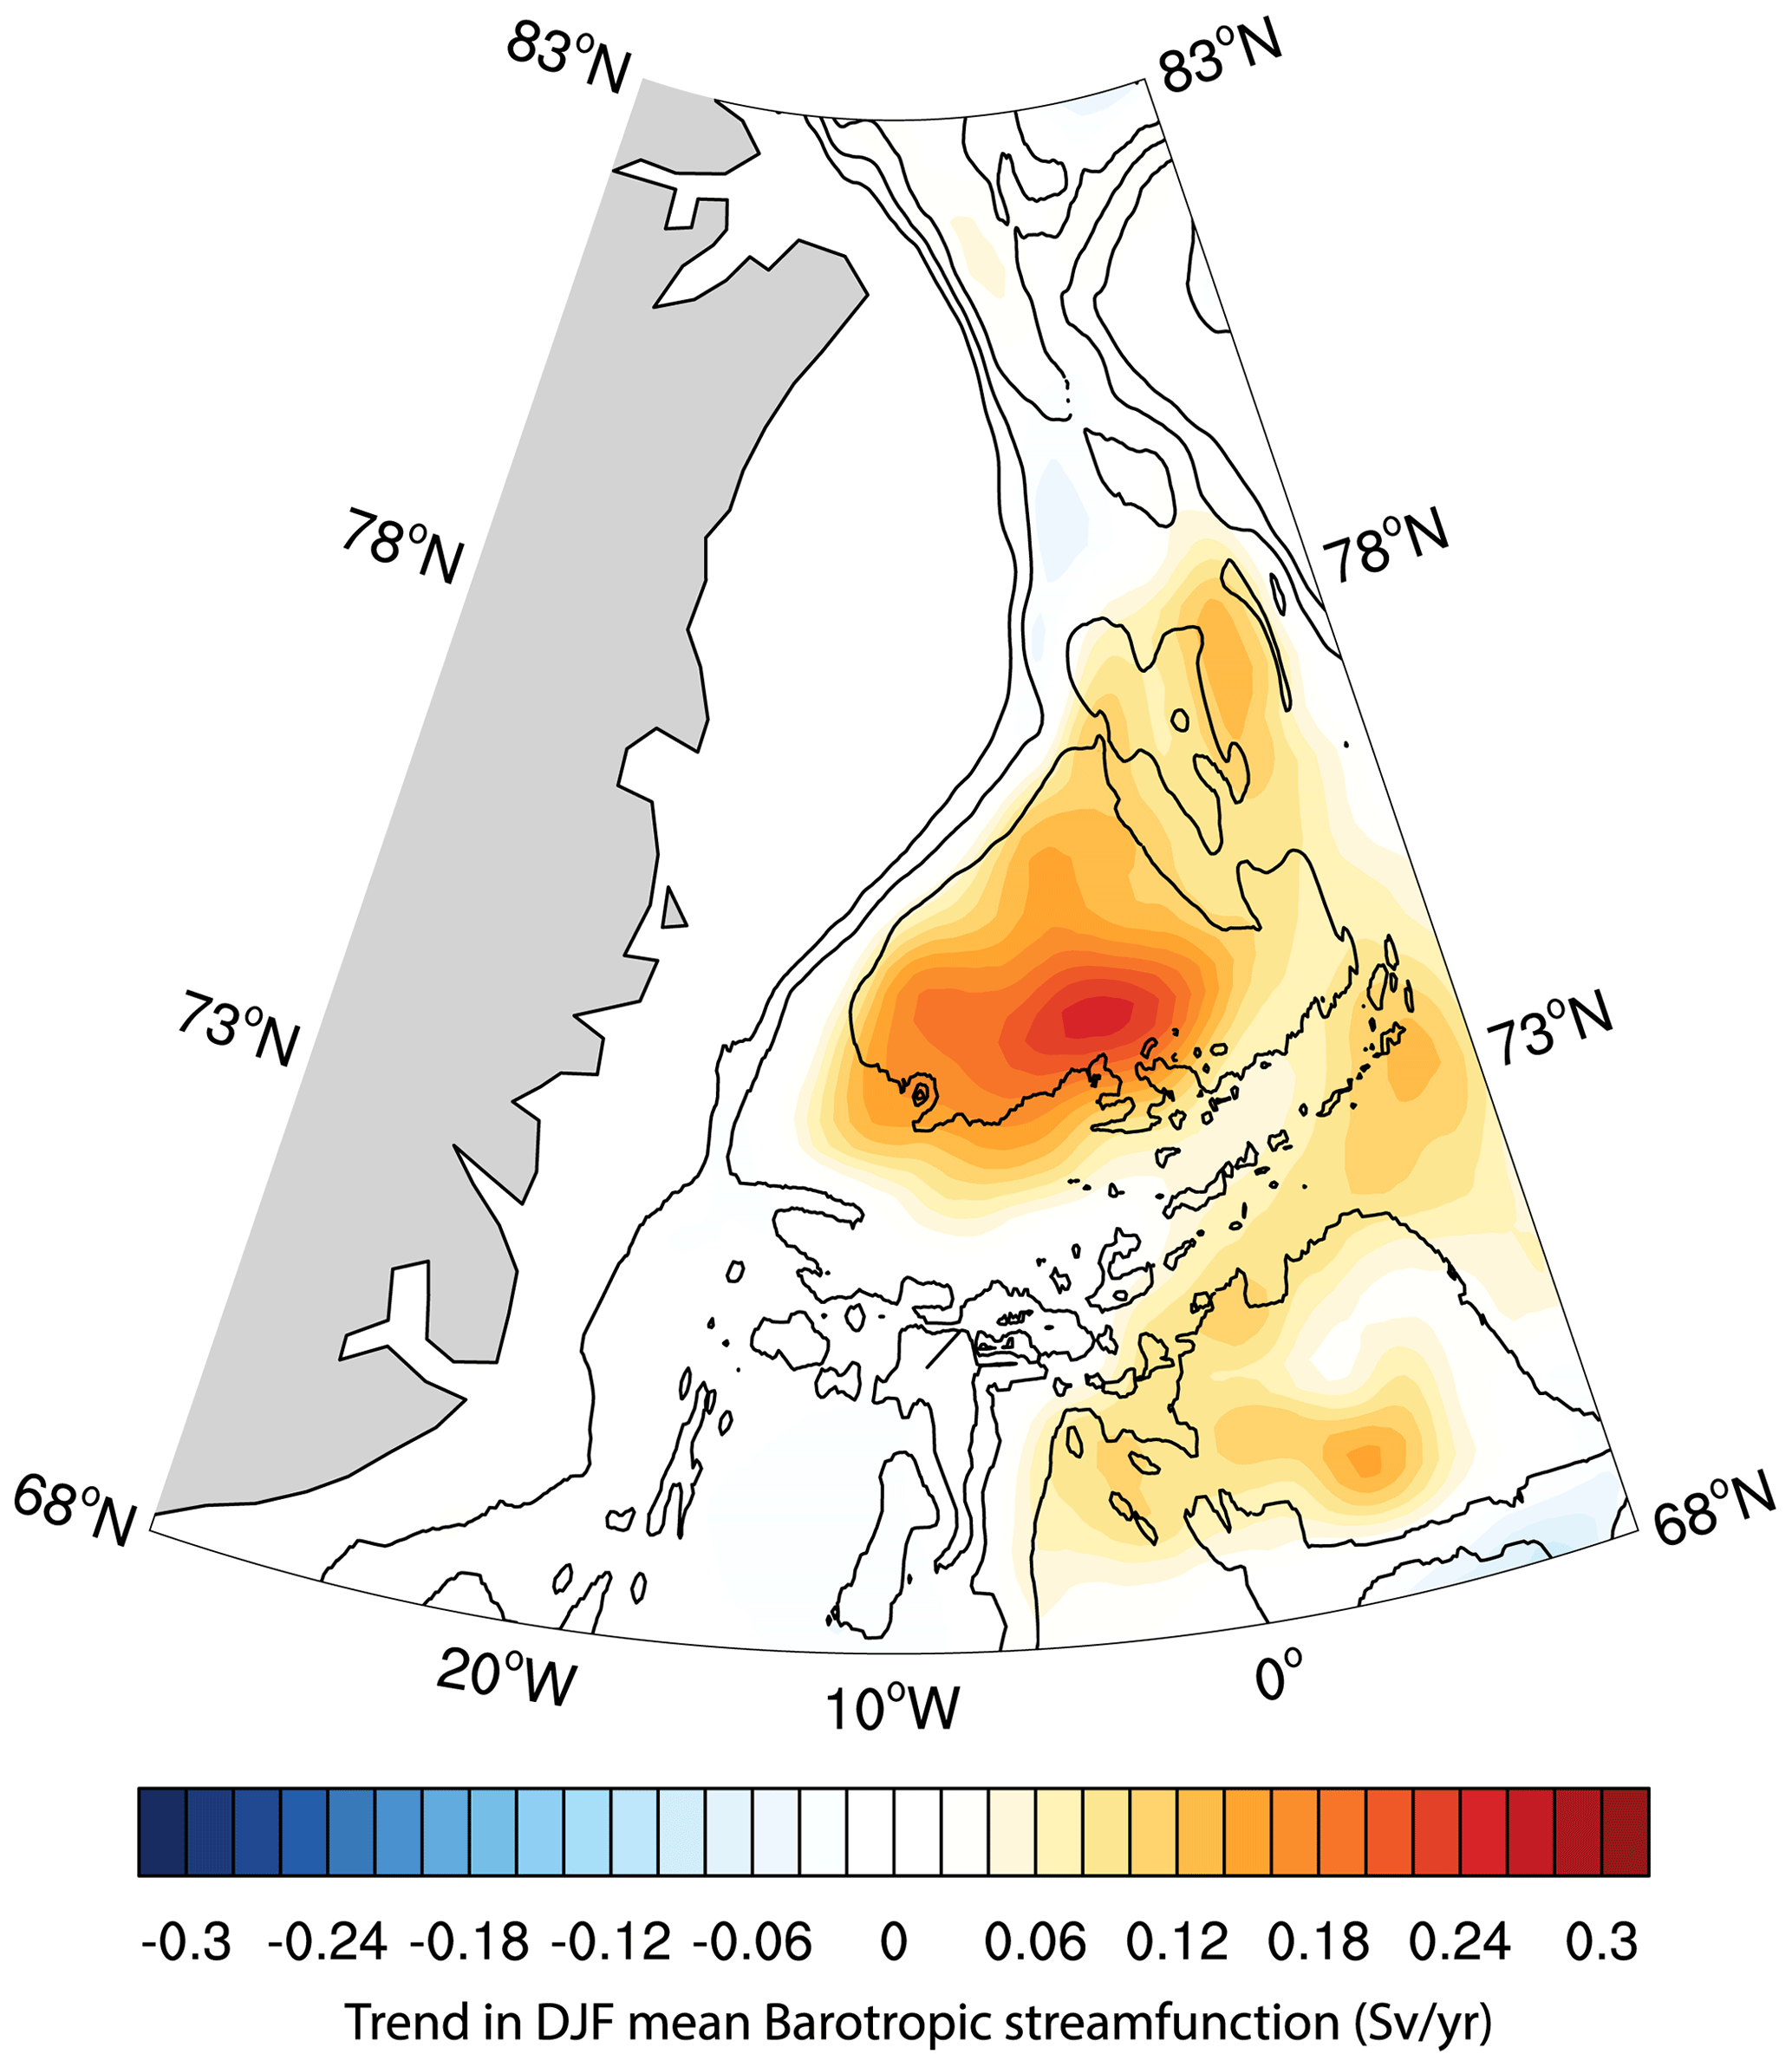
Figure 12Linear trend (Sv yr−1) in winter-mean (DJF) barotropic stream function for 1991–2017. Only significant values at the 95 % level are shown for clarity. Contours are bottom topography drawn every 1000 m.
Anomalous winds in the Nordic Seas are known to influence the SIC in the GS through Ekman drift of the sea ice (Germe et al., 2011). During time periods with anomalously low SLP over the NS, anomalous northerly winds and associated Ekman drift towards the Greenland coast can reduce the sea ice export in the western and central GS (Fig. 8b). Enhanced Ekman divergence due to a strengthened GSG circulation can further lead to reduced fresh water and sea ice in the south-western GS (Fig. 11). We found that these can lead to weakening of the upper-ocean stratification in the south-western GS (Fig. 9a). At the same time, a stronger GSG circulation recirculates the warm and saline subsurface AW anomalies from the FS into the south-western GS (Fig. 8a). These AW anomalies can warm the surface waters by enhanced vertical mixing in a weakly stratified condition (Fig. 9) and can cause further reduction of SIC by inhibiting new sea ice formation or even melting the sea ice from the bottom. Although our study does not show bottom melting of the sea ice, this can be realized from the findings by Ivanova et al. (2012), who showed enhanced bottom melting in this region during positive-NAO periods. Thus, the SIC variability in the south-western GS responds to simultaneous influences from the atmospheric and oceanic circulation (Fig. 10). Despite the known influences of smaller-scale processes, such as eddies and wave interactions, on the SIC in the south-western GS, our results show that the larger-scale processes can also significantly affect the SIC variability in the region, particularly on interannual timescales when the impacts of smaller-scale processes can cancel out or may not be strong enough to dampen the impact of larger-scale processes. However, as found in Raj et al. (2020), interactions between the gyre circulation and the eddies can be an important factor controlling the oceanic conditions and hence the SIC in the south-western GS.
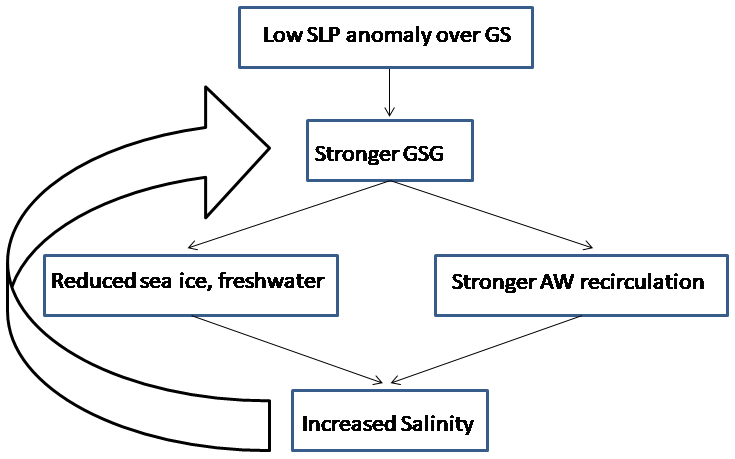
This study finds one of the mechanisms of SIC variability in the GS, highlighting the role of large-scale atmospheric and oceanic circulations in the NS. Observations and modelling results suggest stronger atmospheric forcing in the NS due to spatial variation in the NAO (Zhang et al., 2008) and its tendency towards the positive phase in a warmer climate (Bader et al., 2011; Stephenson et al., 2006). Consistent with that, we find a significant positive trend in the GSG circulation strength during the study period (Fig. 12). The response of GSG circulation to this altered atmospheric forcing can further be realized with increased GSG strength (Fig. 1c) and a northeastward displacement of the NAO's poleward centre of action in the Nordic Seas during the early 2000s (Fig. 1a in Zhang et al., 2008). Recent observations further suggest intensified convection in the GSG and changes in water mass formation during the last 2 decades (Lauvset et al., 2018; Brakstad et al., 2019). Lauvset et al. (2018) further discussed the role of recirculated AW in inducing intensified convection in the GSG through surface salinity anomaly. Consistent with this, our results show that the salinity anomalies and intensified convection in the GSG can be induced by a stronger GSG circulation (in response to the atmospheric forcing), which helps in recirculation of AW anomalies in the GS. Thus we propose that the atmospheric forcing over the NS imposes a positive oceanic feedback (Fig. 13). The low-SLP anomaly over the NS strengthens the GSG circulation. The Ekman divergence pushes the fresh water and sea ice from the GS interior towards the coast. Enhanced AW recirculation due to a stronger GSG and weakened stratification due to reduced fresh water allow the warm and saline AW anomalies to get vertically mixed and increase the temperature and salinity in the central GS. The increased salinity further helps in a stronger GSG circulation, completing the feedback loop. However it should be noted that the complex subsurface processes and their interactions with large-scale circulation are often difficult to capture in the reanalysis, particularly with sparse and interrupted subsurface observations over time and space. For example, while the surface variables are well captured in TOPAZ4, it has some limitations with the subsurface properties as observed in Xie et. al (2017). Of particular interest in this study, the south-south-western GS is an exceptionally observational-data-sparse region. Increased long-term observations from these areas will be helpful in improvement of the reanalysis datasets and better understanding of the complex atmosphere–ocean interaction processes and their impact on the sea ice variability of this region.
All the codes are available on reasonable request to the corresponding author.
All the data used here are freely available at the following data portals: sea ice concentration (https://nsidc.org/data/NSIDC-0051/versions/1, last access: 14 November 2018) and velocity (https://nsidc.org/data/nsidc-0116/versions/4, last access: 21 August 2018) are obtained from the National Snow and Ice Data Centre. The monthly TOPAZ4 results used in this study are obtained via CMEMS (https://resources.marine.copernicus.eu/?option=com_csw&view=details&product_id=ARCTIC_REANALYSIS_PHYS_002_003, last access: 3 December 2020). EN4 (version 4.2.1) observational data are provided by the UK Met Office Hadley Centre and obtained from https://www.metoffice.gov.uk/hadobs/en4/download-en4-2-1.html (last access: 11 September 2020).
SC conceived the idea in discussion with RPR and wrote the manuscript. SC performed all the analyses. All authors contributed in improvement and writing of the manuscript.
The authors declare that they have no conflict of interest.
The authors thank Ola M. Johannessen, Nansen Scientific Society, for valuable suggestions during the course of the study. Jiping Xie is thanked for assistance with TOPAZ4 data. The TOPAZ4 simulations have used grants from Sigma2 infrastructure under the project number NS2993K. NCPOR is an autonomous institute fully funded by the Ministry of Earth Sciences, Government of India. This is NCPOR contribution number J-97/2020-21. All figures were made using the NCAR Command Language (version 6.4.0).
This paper was edited by Christian Haas and reviewed by two anonymous referees.
Aagaard, K.: Wind-driven transports in the Greenland and Norwegian seas, Deep-Sea Res. Oceanogr. Abstr., 17, 281–291, https://doi.org/10.1016/0011-7471(70)90021-5, 1970.
Aagaard, K. and Carmack, E. C.: The role of sea ice and other fresh water in the Arctic circulation, J. Geophys. Res., 94, 14485–14498, https://doi.org/10.1029/jc094ic10p14485, 1989.
Bader, J., Mesquita, M. D. S., Hodges, K. I., Keenlyside, N., Østerhus, S., and Miles, M.: A review on Northern Hemisphere sea-ice, storminess and the North Atlantic Oscillation: Observations and projected changes, Atmos. Res., 101, 809–834, https://doi.org/10.1016/j.atmosres.2011.04.007, 2011.
Belkin, I. M., Levitus, S., Antonov, J., and Malmberg, S. A.: Great Salinity Anomalies in the North Atlantic, Prog. Oceanogr., 41, 1–68, https://doi.org/10.1016/S0079-6611(98)00015-9, 1998.
Brakstad, A., Våge, K., Håvik, L., and Moore, G. W. K.: Water Mass Transformation in the Greenland Sea during the Period 1986–2016, J. Phys. Oceanogr., 49, 121–140, https://doi.org/10.1175/JPO-D-17-0273.1, 2019.
Campbell, W. J., Gloersen, P., Josberger, E. G., Johannessen, O. M., Guest, P. S., Mognard, N., Shuchman, R., Burns, B. A., Lannelongue, N., and Davidson, K. L.: Variations of mesoscale and large-scale sea ice morphology in the 1984 marginal ice zone experiment as observed by microwave remote sensing, J. Geophys. Res.-Oceans, 92, 6805–6824, https://doi.org/10.1029/JC092iC07p06805, 1987.
Cavalieri, D. J., Parkinson, C. L., Gloersen, P., and Zwally, H. J.: Sea Ice Concentrations From Nimbus-7 SMMR and DMSP SSM/I Passive Microwave Data, Natl. Snow and Ice Data Cent., Boulder, Colorado, 1996 [Updated 2018].
Chafik, L. and Rossby, T.: Volume, heat, and freshwater divergences in the Subpolar North Atlantic suggest the Nordic Seas as key to the state of the Meridional Overturning Circulation, Geophys. Res. Lett., 46, 4799–4808, https://doi.org/10.1029/2019GL082110, 2019.
Chatterjee, S., Raj, R. P., Bertino, L., Skagseth, Ravichandran, M., and Johannessen, O. M.: Role of Greenland Sea Gyre Circulation on Atlantic Water Temperature Variability in the Fram Strait, Geophys. Res. Lett., 45, 8399–8406, https://doi.org/10.1029/2018GL079174, 2018.
Comiso, J. C., Wadhams, P., Pedersen, L. T., and Gersten, R. A.: Seasonal and interannual variability of the Odden ice tongue and a study of environmental effects, J. Geophys. Res.-Ocean., 106, 9093–9116, https://doi.org/10.1029/2000jc000204, 2001.
Dee, D. P., Uppala, S. M., Simmons, A. J., Berrisford, P., Poli, P., Kobayashi, S., Andrae, U., Balmaseda, M. A., Balsamo, G., Bauer, P., Bechtold, P., Beljaars, A. C. M., van de Berg, L., Bidlot, J., Bormann, N., Delsol, C., Dragani, R., Fuentes, M., Geer, A. J., Haimberger, L., Healy, S. B., Hersbach, H., Hólm, E. V., Isaksen, L., Kållberg, P., Köhler, M., Matricardi, M., Mcnally, A. P., Monge-Sanz, B. M., Morcrette, J. J., Park, B. K., Peubey, C., de Rosnay, P., Tavolato, C., Thépaut, J. N., and Vitart, F.: The ERA-Interim reanalysis: Configuration and performance of the data assimilation system, Q. J. Roy. Meteor. Soc., 137, 553–597, https://doi.org/10.1002/qj.828, 2011.
Dickson, R. R., Meincke, J., Malmberg, S. A., and Lee, A. J.: The great salinity anomaly in the Northern North Atlantic 1968–1982, Prog. Oceanogr., 20, 103–151, https://doi.org/10.1016/0079-6611(88)90049-3, 1988.
Eldevik, T., Nilsen, J. E., Iovino, D., Anders Olsson, K., Sandø, A. B., and Drange, H.: Observed sources and variability of Nordic seasoverflow, Nat. Geosci., 2, 406–410, https://doi.org/10.1038/ngeo518, 2009.
Germe, A., Houssais, M. N., Herbaut, C., and Cassou, C.: Greenland Sea sea ice variability over 1979–2007 and its link to the surface atmosphere, J. Geophys. Res.-Ocean., 116, 1–14, https://doi.org/10.1029/2011JC006960, 2011.
Grebmeier, J. M., Smith Jr., W. O., and Conover, R. J.: Biological Processes on Arctic Continental Shelves: Ice‐Ocean‐Biotic Interactions, in: Arctic Oceanography: Marginal Ice Zones and Continental Shelves, edited by: Smith, W. O. and Grebmeir, J. M., American Geophysical Union, https://doi.org/10.1029/CE049p0231, 1995.
Hattermann, T., Isachsen, P. E., Von Appen, W. J., Albretsen, J., and Sundfjord, A.: Eddy-driven recirculation of Atlantic Water in Fram Strait, Geophys. Res. Lett., 43, 3406–3414, https://doi.org/10.1002/2016GL068323, 2016.
Huang, J., Pickart, R. S., Huang, R. X., Lin, P., Brakstad, A., and Xu, F.: Sources and upstream pathways of the densest overflow water in the Nordic Seas, Nat. Commun., 11, 5389, https://doi.org/10.1038/s41467-020-19050-y, 2020.
Hunke, E. C. and Dukowicz, J. K.: An elastic-viscous-plastic model for sea ice dynamics, J. Phys. Oceanogr., 27, 1849–1867, 1997.
Instanes, A., Anisimov, O., Brigham, L., Goering, D., Khrustalev, L. N., Ladanyi, B., Larsen, J. O., Smith, O., Stevermer, A., Weatherhead, B., and Weller, G.: Infrastructure: buildings, support systems, and industrial facilities, in: Arctic Climate Impact Assessment, Cambridge University Press, Cambridge, UK and New York, NY, 907–944, 2005.
Ionita, M., Scholz, P., Lohmann, G., Dima, M., and Prange, M.: Linkages between atmospheric blocking, sea ice export through Fram Strait and the Atlantic Meridional Overturning Circulation, Sci. Rep., 6, 32881, https://doi.org/10.1038/srep32881, 2016.
Ivanova, D. P., McClean, J. L., and Hunke, E. C.: Interaction of ocean temperature advection, surface heat fluxes and sea ice in the marginal ice zone during the North Atlantic Oscillation in the 1990s: A modeling study, J. Geophys. Res., 117, C02031, https://doi.org/10.1029/2011JC007532, 2012.
Jeansson, E., Olsen, A., and Jutterström, S.: Arctic Intermediate Water in the Nordic Seas, 1991–2009, Deep Sea Res. Part I Oceanogr. Res. Pap., 128, 82–97, https://doi.org/10.1016/j.dsr.2017.08.013, 2017.
Johannessen, O. M., Johannessen, J. A., Svendsen, E., Shuchman, R. A., Campbell, W. J., and Josberger, E.: Ice-edge eddies in the Fram Strait marginal ice zone, Science, 236, 427–429, https://doi.org/10.1126/science.236.4800.427, 1987.
Johannessen, O. M., Alexandrov, V., Frolov, Ye. I., Sandven, S., Petterson, H. L., Bobylev, P. L., Kloster, K., Smirnov, G. V., Mironov, U. Y., and Babich, G. N.: Remote Sensing of Sea Ice in the Northern Sea Route, Springer-Verlag Berlin Heidelberg, Germany, 2007.
Jung, T. and Hilmer, M.: The link between the North Atlantic oscillation and Arctic sea ice export through Fram Strait, J. Climate, 14, 3932–3943, https://doi.org/10.1175/1520-0442(2001)014<3932:TLBTNA>2.0.CO;2, 2001.
Kern, S., Kaleschke, L., and Spreen, G.: Climatology of the nordic (irminger, greenland, barents, kara and white/pechora) seas ice cover based on 85 GHz satellite microwave radiometry: 1992–2008, Tellus A, 62, 411–434, https://doi.org/10.1111/j.1600-0870.2009.00457.x, 2010.
Kwok, R. and Rothrock, D. A.: Variability of Fram Strait ice flux and North Atlantic Oscillation, J. Geophys. Res., 104, 5177–5189, 1999.
Lauvset, S. K., Brakstad, A., Våge, K., Olsen, A., Jeansson, E., and Mork, K. A.: Continued warming, salinification and oxygenation of the Greenland Sea gyre, Tellus A, 70, 1–9, https://doi.org/10.1080/16000870.2018.1476434, 2018.
Legutke, S.: A Numerical Investigation of the Circulation In the Greenland and Norwegian Seas, J. Phys. Oceanogr., 21, 118–148, https://doi.org/10.1175/1520-0485(1991)021<0118:aniotc>2.0.co;2, 2002.
Levitus, S., Antonov, J. I., Boyer, T. P., Locarnini, R. A., Garcia, H. E., and Mishonov, A. V.: Global ocean heat content 1955–2008 in light of recently revealed instrumentation problems, Geophys. Res. Lett., 36, L07608. https://doi.org/10.1029/2008GL037155, 2009.
Lien, V. S., Hjøllo, S. S., Skogen, M. D., Svendsen, E., Wehde, H., Bertino, L., Counillon, F., Chevallier, M., and Garric, G.: An assessment of the added value from data assimilation on modelled Nordic Seas hydrography and ocean transports, Ocean Model., 99, 43–59, https://doi.org/10.1016/j.ocemod.2015.12.010, 2016.
Moore, G. W. K., Renfrew, I. A., and Pickart, R. S.: Multidecadal mobility of the North Atlantic Oscillation, J. Climate, 26, 2453–2466, https://doi.org/10.1175/JCLI-D-12-00023.1, 2012.
Raj, R. P., Chatterjee, S., Bertino, L., Turiel, A., and Portabella, M.: The Arctic Front and its variability in the Norwegian Sea, Ocean Sci., 15, 1729–1744, https://doi.org/10.5194/os-15-1729-2019, 2019.
Raj, R. P., Halo, I., Chatterjee, S., Belonenko, T., Bakhoday-Paskyabi, M., Bashmachnikov, I., Federov, A., and Xie P.: Interaction between mesoscale eddies and the gyre circulation in the Lofoten Basin, J. Geophys. Res.-Oceans, 125, e2020JC016102, https://doi.org/10.1029/2020JC016102, 2020.
Rogers, J. C. and Hung, M.-P.: The Odden ice feature of the Greenland Sea and its association with atmospheric pressure, wind, and surface flux variability from reanalyses, Geophys. Res. Lett., 35, L08504, https://doi.org/10.1029/2007GL032938, 2008.
Sakov, P., Counillon, F., Bertino, L., Lisæter, K. A., Oke, P. R., and Korablev, A.: TOPAZ4: an ocean-sea ice data assimilation system for the North Atlantic and Arctic, Ocean Sci., 8, 633–656, https://doi.org/10.5194/os-8-633-2012, 2012.
Schlichtholz, P. and Houssais, M.-N.: An inverse modeling study in Fram Strait. Part II: water mass distribution and transports, Deep-Sea Res. Pt. II, 46, 1137–1168, https://doi.org/10.1016/S0967-0645(99)00017-X, 1999.
Selyuzhenok, V., Bashmachnikov, I., Ricker, R., Vesman, A., and Bobylev, L.: Sea ice volume variability and water temperature in the Greenland Sea, The Cryosphere, 14, 477–495, https://doi.org/10.5194/tc-14-477-2020, 2020.
Serreze, M. C., Barrett, A. P., Slater, A. G., Woodgate, R. A., Aagaard, K., Lammers, R. B., Steele, M., Moritz, R., Meredith, M., and Lee, C. M.: The large-scale freshwater cycle of the Arctic, J. Geophys. Res.-Ocean., 111, C11010, https://doi.org/10.1029/2005JC003424, 2006.
Shuchman, R. A., Josberger, E. G., Russel, C. A., Fischer, K. W., Johannessen, O. M., Johannessen, J. and Gloersen, P.: Greenland Sea Odden sea ice feature: Intra-annual and interannual variability, J. Geophys. Res.-Ocean., 103, 12709–12724, https://doi.org/10.1029/98jc00375, 1998.
Smedsrud, L. H., Sirevaag, A., Kloster, K., Sorteberg, A., and Sandven, S.: Recent wind driven high sea ice area export in the Fram Strait contributes to Arctic sea ice decline, The Cryosphere, 5, 821–829, https://doi.org/10.5194/tc-5-821-2011, 2011.
Stephenson, D. B., Pavan, V., Collins, M., Junge, M. M., and Quadrelli, R.: North Atlantic Oscillation response to transient greenhouse gas forcing and the impact on European winter climate: A CMIP2 multi-model assessment, Clim. Dynam., 27, 401–420, https://doi.org/10.1007/s00382-006-0140-x, 2006.
Toudal, L.: Ice extent in the Greenland Sea 1978–1995, Deep Sea Res. Part II Top. Stud. Oceanogr., 46, 1237–1254, https://doi.org/10.1016/S0967-0645(99)00021-1, 1999.
Tschudi, M., Meier, W. N., Stewart, J. S., Fowler, C., and Maslanik, J.: Polar Pathfinder Daily 25 km EASE-Grid Sea Ice Motion Vectors, Version 4. Boulder, CO, USA, NASA National Snow and Ice Data Center Distributed Active Archive Center, updated: 2019, https://doi.org/10.5067/INAWUWO7QH7B, 2019.
Tsukernik, M., Deser, C., Alexander, M., and Tomas, R.: Atmospheric forcing of Fram Strait sea ice export: A closer look, Clim. Dyn., 35, 1349–1360, https://doi.org/10.1007/s00382-009-0647-z, 2010.
Våge, K., Papritz, L., Håvik, L., Spall, M. A., and Moore, G. W. K.: Ocean convection linked to the recent ice edge retreat along east Greenland, Nat. Commun., 9, 1287, https://doi.org/10.1038/s41467-018-03468-6, 2018.
Vinje, T.: Fram Strait Ice Fluxes and Atmospheric Circulation: 1950–2000, J. Climate, 14, 3508–3517, https://doi.org/10.1175/1520-0442(2001)014<3508:FSIFAA>2.0.CO;2, 2001.
Visbeck, M., Fischer, J., and Schott, F.: Preconditioning the Greenland Sea for deep convection: ice formation and ice drift, J. Geophys. Res., 100, 18489–18502, https://doi.org/10.1029/95jc01611, 1995.
Wadhams, P. and Comiso, J. C.: Two modes of appearance of the Odden ice tongue in the Greenland Sea, Geophys. Res. Lett., 26, 2497–2500, https://doi.org/10.1029/1999GL900502, 1999.
Wadhams, P., Comiso, J. C., Prussen, E., Wells, S., Brandon, M., Aldworth, E., Viehoff, T., Allegrino, R., and Crane, D. R.: The development of the Odden ice tongue in the Greenland Sea during winter 1993 from remote sensing and field observations, J. Geophys. Res.-Ocean., 101, 18213–18235, https://doi.org/10.1029/96JC01440, 1996.
Xie, J., Bertino, L., Counillon, F., Lisæter, K. A., and Sakov, P.: Quality assessment of the TOPAZ4 reanalysis in the Arctic over the period 1991–2013, Ocean Sci., 13, 123–144, https://doi.org/10.5194/os-13-123-2017, 2017.
Zamani, B., Krumpen, T., Smedsrud, L. H., and Gerdes, R.: Fram Strait sea ice export affected by thinning: comparing high-resolution simulations and observations, Clim. Dynam., 53, 3257–3270, https://doi.org/10.1007/s00382-019-04699-z, 2019.
Zhang, X., Sorteberg, A., Zhang, J., Gerdes, R., and Comiso, J. C.: Recent radical shifts of atmospheric circulations and rapid changes in Arctic climate system, Geophys. Res. Lett., 35, L22701, https://doi.org/10.1029/2008GL035607, 2008.