the Creative Commons Attribution 4.0 License.
the Creative Commons Attribution 4.0 License.
 | 03 Mar 2021
Ice content and interannual water storage changes of an active rock glacier in the dry Andes of Argentina
Christian Halla
Jan Henrik Blöthe
Carla Tapia Baldis
Dario Trombotto Liaudat
Christin Hilbich
Christian Hauck
Lothar Schrott
The quantification of volumetric ice and water content in active rock glaciers is necessary to estimate their role as water stores and contributors to runoff in dry mountain catchments. In the semi-arid to arid Andes of Argentina, active rock glaciers potentially constitute important water reservoirs due to their widespread distribution. Here however, water storage capacities and their interannual changes have so far escaped quantification in detailed field studies. Volumetric ice and water content was quantified using a petrophysical four-phase model (4PM) based on complementary electrical resistivity tomography (ERT) and seismic refraction tomography (SRT) in different positions of the Dos Lenguas rock glacier in the upper Agua Negra basin, Argentina. We derived vertical and horizontal surface changes of the Dos Lenguas rock glacier, for the periods 2016–2017 and 2017–2018 using drone-derived digital elevation models (DEMs). Interannual water storage changes of −36 mm yr−1 and +27 mm yr−1 derived from volumetric surface changes for the periods 2016–2017 and 2017–2018, respectively, indicate that significant amounts of annual precipitation can be stored in and released from the active rock glacier.
Geophysical results show heterogeneous ice and water content with ice-rich permafrost and supra-, intra- and sub-permafrost water pathways at the end of the thaw period. Active layer and ice-rich permafrost control traps and pathways of shallow groundwater and thus regulate interannual storage changes and water releases from the active rock glaciers in the dry mountain catchment. The ice content of 1.7–2.0 × 10⁹ kg in the active Dos Lenguas rock glacier represents an important long-term ice reservoir, as do other ground ice deposits in the vicinity, if compared to surface ice that covers less than 3 % of the high mountain catchment.
- Article
(24396 KB) - Full-text XML
- Comment
-
Supplement
(5777 KB) - BibTeX
- EndNote


Presently moving rock glaciers are classified as active rock glaciers (Barsch, 1996) defined as the “the visible expression of cumulative deformation by long-term creep of ice/debris mixtures under permafrost conditions” (Berthling, 2011, p. 105). Rock glaciers constitute predominant landforms in the extensive periglacial belts of arid high mountain regions, such as the Central Andes of Argentina and Chile (Corte, 1976; Trombotto et al., 1999). Here, rock glaciers show some of the highest spatial densities worldwide (Azocar and Brenning, 2010; Blöthe et al., 2019), covering more surface area than glaciers in some parts (IANIGLA, 2018).
Rock glaciers have been identified and discussed as significant water reservoirs in the dry Andes due to their widespread distribution (Arenson and Jakob, 2010; Brenning, 2010; Corte, 1976, 1978). Recently, first-order assessments of their water storage capacities suggest that significant amounts of ice are stored in rock glaciers (Jones et al., 2018a). However, field-based studies that rigorously quantify rock glacier water storage capacities and their interannual changes are lacking in the region (Schaffer et al., 2019). In this study we investigate the water storage capacities of a tongue-shaped rock glacier, whose material source is derived from talus slopes.
Under a changing climate, temperatures in the semi-arid to arid Andes are predicted to increase at a faster rate compared to their lowlands (Bradley et al., 2006). Associated changes in the mountain cryosphere, such as the degradation of glaciers (Braun et al., 2019; Dussaillant et al., 2019), permafrost (Drewes et al., 2018; Rangecroft et al., 2016) and snowpack (Malmros et al., 2018; Saavedra et al., 2018), will strongly affect Andean watersheds currently dominated by runoff generated from snowmelt and ice melt (Barnett et al., 2005; Bradley et al., 2006). Rising air temperatures are expected to shift the timing of seasonal snow cover and snowmelt resulting in reduced discharge in summer and autumn when demands are highest (Barnett et al., 2005; Bradley et al., 2006). The sensitivity of the Central Andes and Desert Andes of Argentina towards recent warming is reflected by more pronounced snow cover reduction and rising snowline elevations compared to the western side of the Andes (Saavedra et al., 2018). In the semi-arid Andes of Argentina many active rock glaciers currently exist at or below the 0 ∘C isotherm (Brenning, 2005; Trombotto et al., 1999). For the next decades it is predicted that the 0 ∘C isotherm of mean annual air temperature will increase by more than 500 m based on the representative concentration pathway of an additional radiative forcing of 8.5 W m−2 (RCP8.5), which is likely to trigger widespread thermal disturbances and permafrost degradation in the Central Andes (Drewes et al., 2018). Yet, studies investigating changes in rock glacier volume over time are lacking so far. Generally, ground ice in rock glaciers responds more slowly to climate change compared to surface snow and ice due to the presence of the seasonally frozen active layer which dampens thermal changes in the subsurface (Haeberli et al., 2006). Massive ground ice and ice-supersaturated conditions, i.e. ice-rich permafrost in rock glaciers, are less sensitive to climatic warming than permafrost with low ice content (Scherler et al., 2013) due to complex interactions of advective and convective heat fluxes and latent heat effects during freeze and thaw processes (Scherler et al., 2010). However, ice melt is also predicted for rock glaciers (Marmy et al., 2016), and corresponding changes are currently being observed in the European Alps (Mollaret et al., 2019). In addition, signs of permafrost warming have been reported for many active rock glaciers worldwide, often manifested as rising permafrost temperatures that induce increased surface velocities (Kääb et al., 2007). Borehole data show that most of the rock glacier deformation occurs within shear horizons of creeping permafrost (Arenson et al., 2002; Haeberli et al., 1998). Velocity variations of rock glaciers are additionally affected by liquid water availability and groundwater fluxes (Ikeda et al., 2008) after rainfall and snowmelt, which increase pore water pressure temporarily enhancing shearing (Cicoira et al., 2019; Kenner et al., 2017; Wirz et al., 2016). Thus, rock glacier movement is impacted by hydrology and ground temperatures (Kenner et al., 2020). Interannual vertical variations of the surface topography are mostly related to the mass balance of rock glaciers (Kääb et al., 1998; Konrad et al., 1999). Annual mass balance and discharge are significantly lower for rock glaciers compared to glaciers (Kääb et al., 1997; Krainer and Mostler, 2002).
The hydrologic system of rock glaciers receives water from precipitation, snowmelt, ice melt and groundwater flow, while water is lost by discharge, groundwater flow, evaporation and sublimation (Burger et al., 1999; Krainer et al., 2007). Internal water flow, water storage capacities and changes are controlled by heterogeneous material compositions (debris, ice, water and air) and their hydrothermal properties (e.g. porosity and solid- or liquid-phase state of water). Ice-rich permafrost functions as long-term water storage, while the active layer functions as a seasonal reservoir (Jones et al., 2018b). Seasonal to annual ice gains and water releases have been mainly attributed to freezing and thawing of the active layer during winter and summer, respectively (Duguay et al., 2015). Shallow groundwater drainage in rock glaciers is regulated by unfrozen and frozen conditions with supra-, sub- and intra-permafrost flow (Jones et al., 2019). Rock glaciers can contribute to groundwater recharge and basin streamflow during late summer, autumn and winter (Harrington et al., 2018; Williams et al., 2006). The water input and different hydraulic properties of hydrological flow paths of frozen and unfrozen ground delay and buffer the water release of rock glaciers (Harrington et al., 2018; Jones et al., 2019; Rogger et al., 2017), which impacts the runoff generation in mountain catchments (Geiger et al., 2014; Krainer and Mostler, 2002). Moreover, water releases of rock glaciers and permafrost degradation can impact surface freshwater in mountain catchments by changing their inorganic chemistry (Colombo et al., 2018a, b) and influencing the stream energy budget (Harrington et al., 2017). However, only few studies have investigated groundwater flow pathways in rock glaciers (Harrington et al., 2018) and other landforms of mountain watersheds sustaining stream runoff during dry periods (Langston et al., 2011; McClymont et al., 2012, 2010).
The hydrologic importance of water storage capacities in rock glaciers compared to glaciers (Croce and Milana, 2002; Milana and Maturano, 1999) as well as river discharge (Schrott, 1996) and chemistry during summer months due to the melt of frozen ground (Lecomte et al., 2008) has been previously investigated in the upper Agua Negra catchment in the dry Andes of Argentina. The present study of the talus rock glacier “Dos Lenguas” builds upon this earlier research and presents results of high-resolution surface detections and extensive hydro-geophysical subsurface measurements in the data-scarce region of the dry Andes. In spite of speculations on their hydrological significance (Azocar and Brenning, 2010; Corte, 1976; Jones et al., 2018a), almost no quantitative and measurement-based estimates about water storage capacities of Andean rock glaciers and their changes over different timescales exist. With the present study, we try to fill this gap and aim to (1) quantify long-term ice storage capacities and water content at the end of the thaw period by estimating the current material composition, (2) analyse surface deformations and gain quantitative estimates of interannual storage changes, and (3) infer the internal hydrologic structure from the spatial distribution of ice and water content in different geomorphological areas of the active rock glacier.
The upper Agua Negra basin and Dos Lenguas rock glacier are located at approximately 30∘ S in the dry Andes of Argentina (Fig. 1a). The regional climate is characterized by semi-arid conditions and extremely high solar radiation intensities throughout the year (Schrott, 1998). Precipitation above 4000 m a.s.l. is mainly solid and falls as snow and sleet during winter. Due to the absent or thin snow cover during 8 months of the year, the incoming solar radiation controls surface temperatures and the upper ground thermal regime (Schrott, 1991). Available annual records from meteorological stations in recent years show mainly negative mean annual air temperature in the catchment (Table 1). The mean to maximum annual precipitation in the Agua Negra catchment area was between 45 and 168 mm yr−1 in the hydrological years 2016–2017 and 2017–2018 (Table 2, CHIRPS-derived estimates, Climate Hazards Group InfraRed Precipitation with Stations, Funk et al., 2015). Continuous permafrost has been estimated to cover roughly 16 % or 9 km2 of the watershed above 5200 m a.s.l. (Schrott, 1996). The lower limit of discontinuous permafrost extends to ∼ 4000 m a.s.l., potentially covering large areas in the basin, including active rock glaciers (0.88 km2) (Schrott, 1994; Tapia-Baldis and Trombotto-Liaudat, 2020).
Table 1Potential mean annual air temperature (MAAT) of recent years derived from different local meteorological stations for the upper Agua Negra basin. The altitudes of 4300 and 4500 m a.s.l. correspond to the elevation range of the Dos Lenguas rock glacier, respectively.

* A dry adiabatic lapse rate of 0.98 ∘C km−1 was used to derive potential MAAT in different elevations from each station.
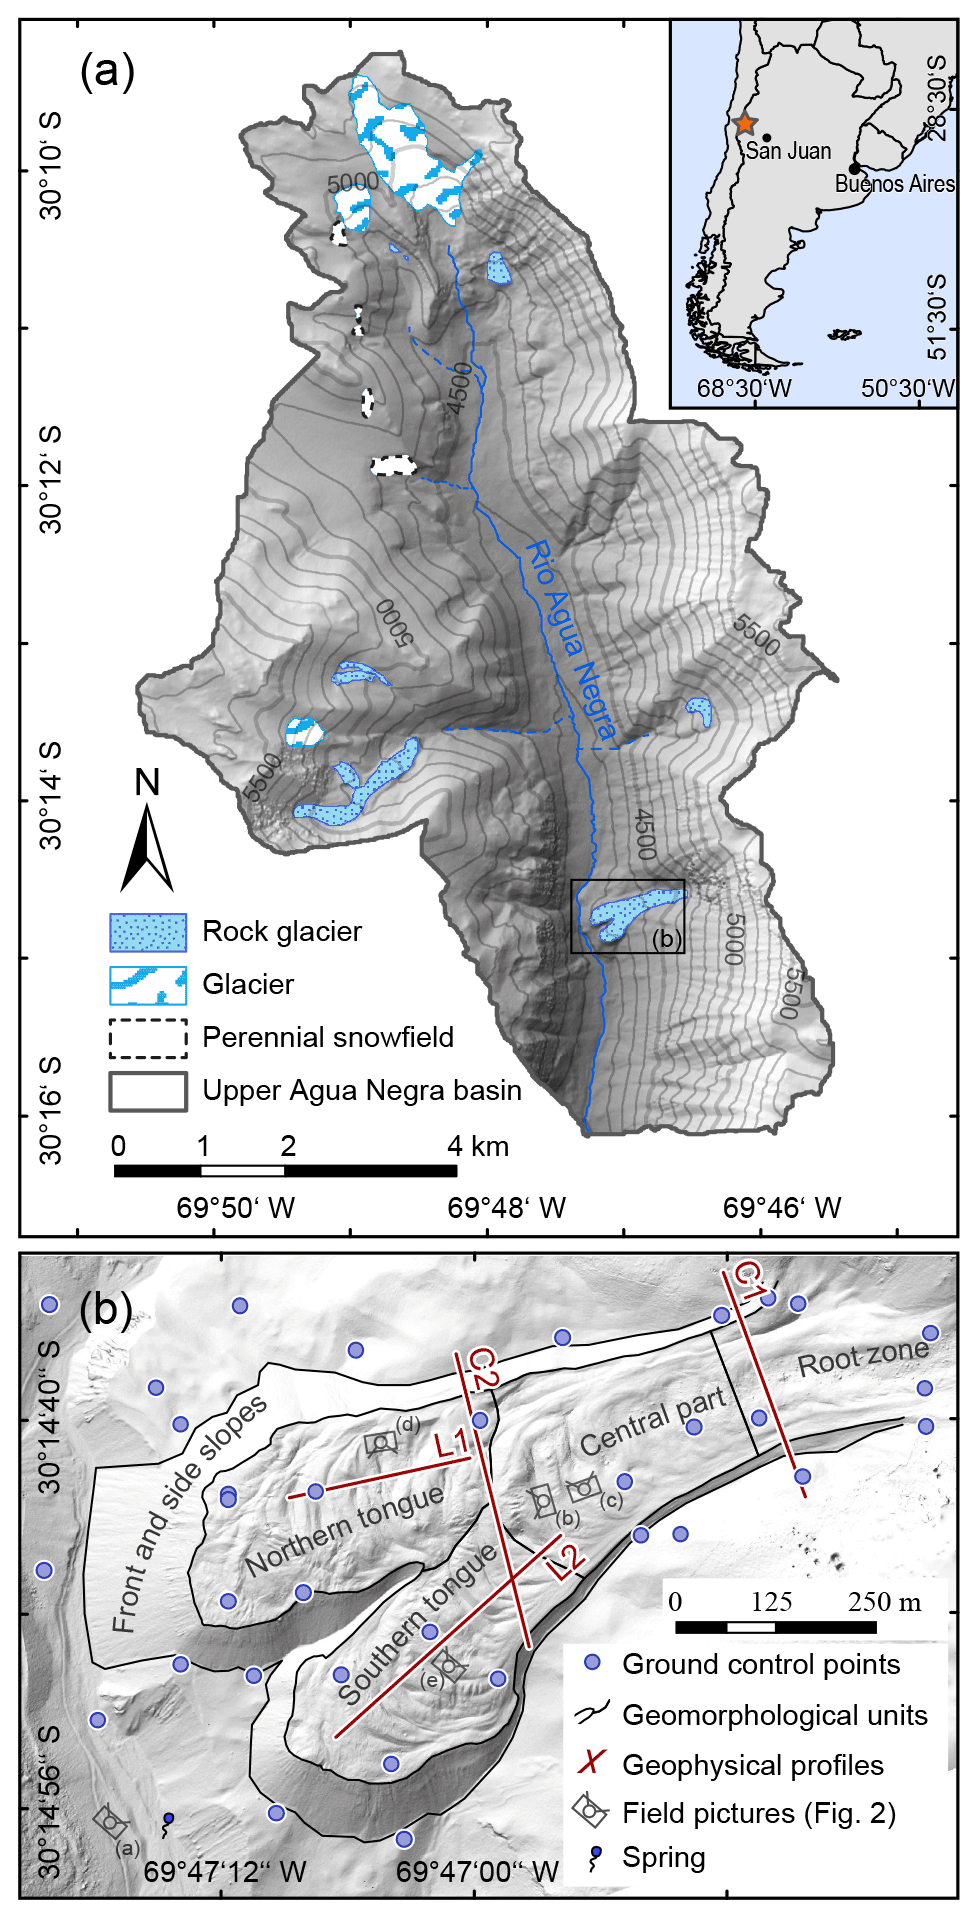
Figure 1(a) Spatial distribution of active rock glaciers, glaciers and perennial snowfields in the upper Agua Negra catchment (hillshade based on TanDEM-X – TerraSAR-X add-on for Digital Elevation Measurement – data © DLR – Deutsches Zentrum für Luft- und Raumfahrt – 2017) mapped by the Glacier Inventory of Argentina (IANIGLA, 2018). The inset shows the location of the upper Agua Negra catchment. (b) Based on the drone-derived DEM 2016, the shaded relief map of the Dos Lenguas rock glacier shows the geomorphological units subdivided into the root zone, central part, northern and southern tongue, the locations of geophysical profiles, field pictures (Fig. 2), and ground control points for displacement measurements.
Surface ice and snow stored in mountain glaciers (1.4 km2) and perennial snowfields (0.18 km2) together account for 2.8 % of the watershed (Fig. 1). The high mountain cryosphere of the upper Agua Negra basin has been one of the areas where previous studies investigated the hydrologic significance of runoff from the high mountain cryosphere. Discharge measurements confirmed that meltwater from areas affected by permafrost conditions and seasonally frozen ground account for an important share of ∼ 20 % of the discharge, which increases up to 30 % after snowmelt during the ablation season (Schrott, 1994, 1996). Hydrochemical analysis of meltwater indicates significant internal recycling by sublimation and evaporation and delayed meltwater throughputs from Dos Lenguas and other rock glaciers in the upper Agua Negra basin (Lecomte et al., 2008). Geophysical investigations on the El Paso rock glacier suggest that the active layer traps and conducts water and interacts with the permafrost table during summer thaw, while ice-rich permafrost is an important water reservoir releasing water mainly during droughts (Croce and Milana, 2002).
Previous studies at Dos Lenguas have investigated hydrological–geomorphological aspects such as the active layer and the discharge of 5–8 L s−1 during the thaw period (Schrott, 1994; Schrott, 1996). The tongue-shaped talus rock glacier is roughly 1200 m long; is between 200 and 600 m wide in its upper and lower part, respectively; and extends from 4200 m at the foot to 4500 m in the root zone (Fig. 1b). Its surface covers an area of ∼ 0.36 km2 including side and front slopes and 0.25 km2 excluding them. In its lower part the west-southwest flowing rock glacier separates into a northern and a southern tongue (Dos Lenguas is Spanish for “two tongues”) both with distinct transverse ridges and furrows terminating in oversteepened frontal slopes (> 35∘). The surface morphology of the root zone is featured by longitudinal ridges and furrows. In the central part of Dos Lenguas longitudinal ridges transition into transverse structures downslope, where crevasses indicate the splitting of the tongues (Fig. 2). Meltwater ponds occur in transversal furrows in the central part and on the northern tongue of Dos Lenguas. The headwall talus system (1.01 km2) is located at a fault system and delivers mass input to the root zone by rockfalls and groundwater from the contributing area above. The debris supply is composed of weathered volcanic rocks of the Permian–Triassic Choiyoi Group consisting of rhyolites, dacites, andesites and basaltic lavas, tuffs, breccias, and ignimbrites (Heredia et al., 2012, 2002). The rock glacier surface is predominantly characterized by a thin layer (< 0.5 m) of coarse pebbles to small boulders supported by a sandy matrix (Schrott, 1994), with isolated large boulders that occur more frequently closer to the headwalls.
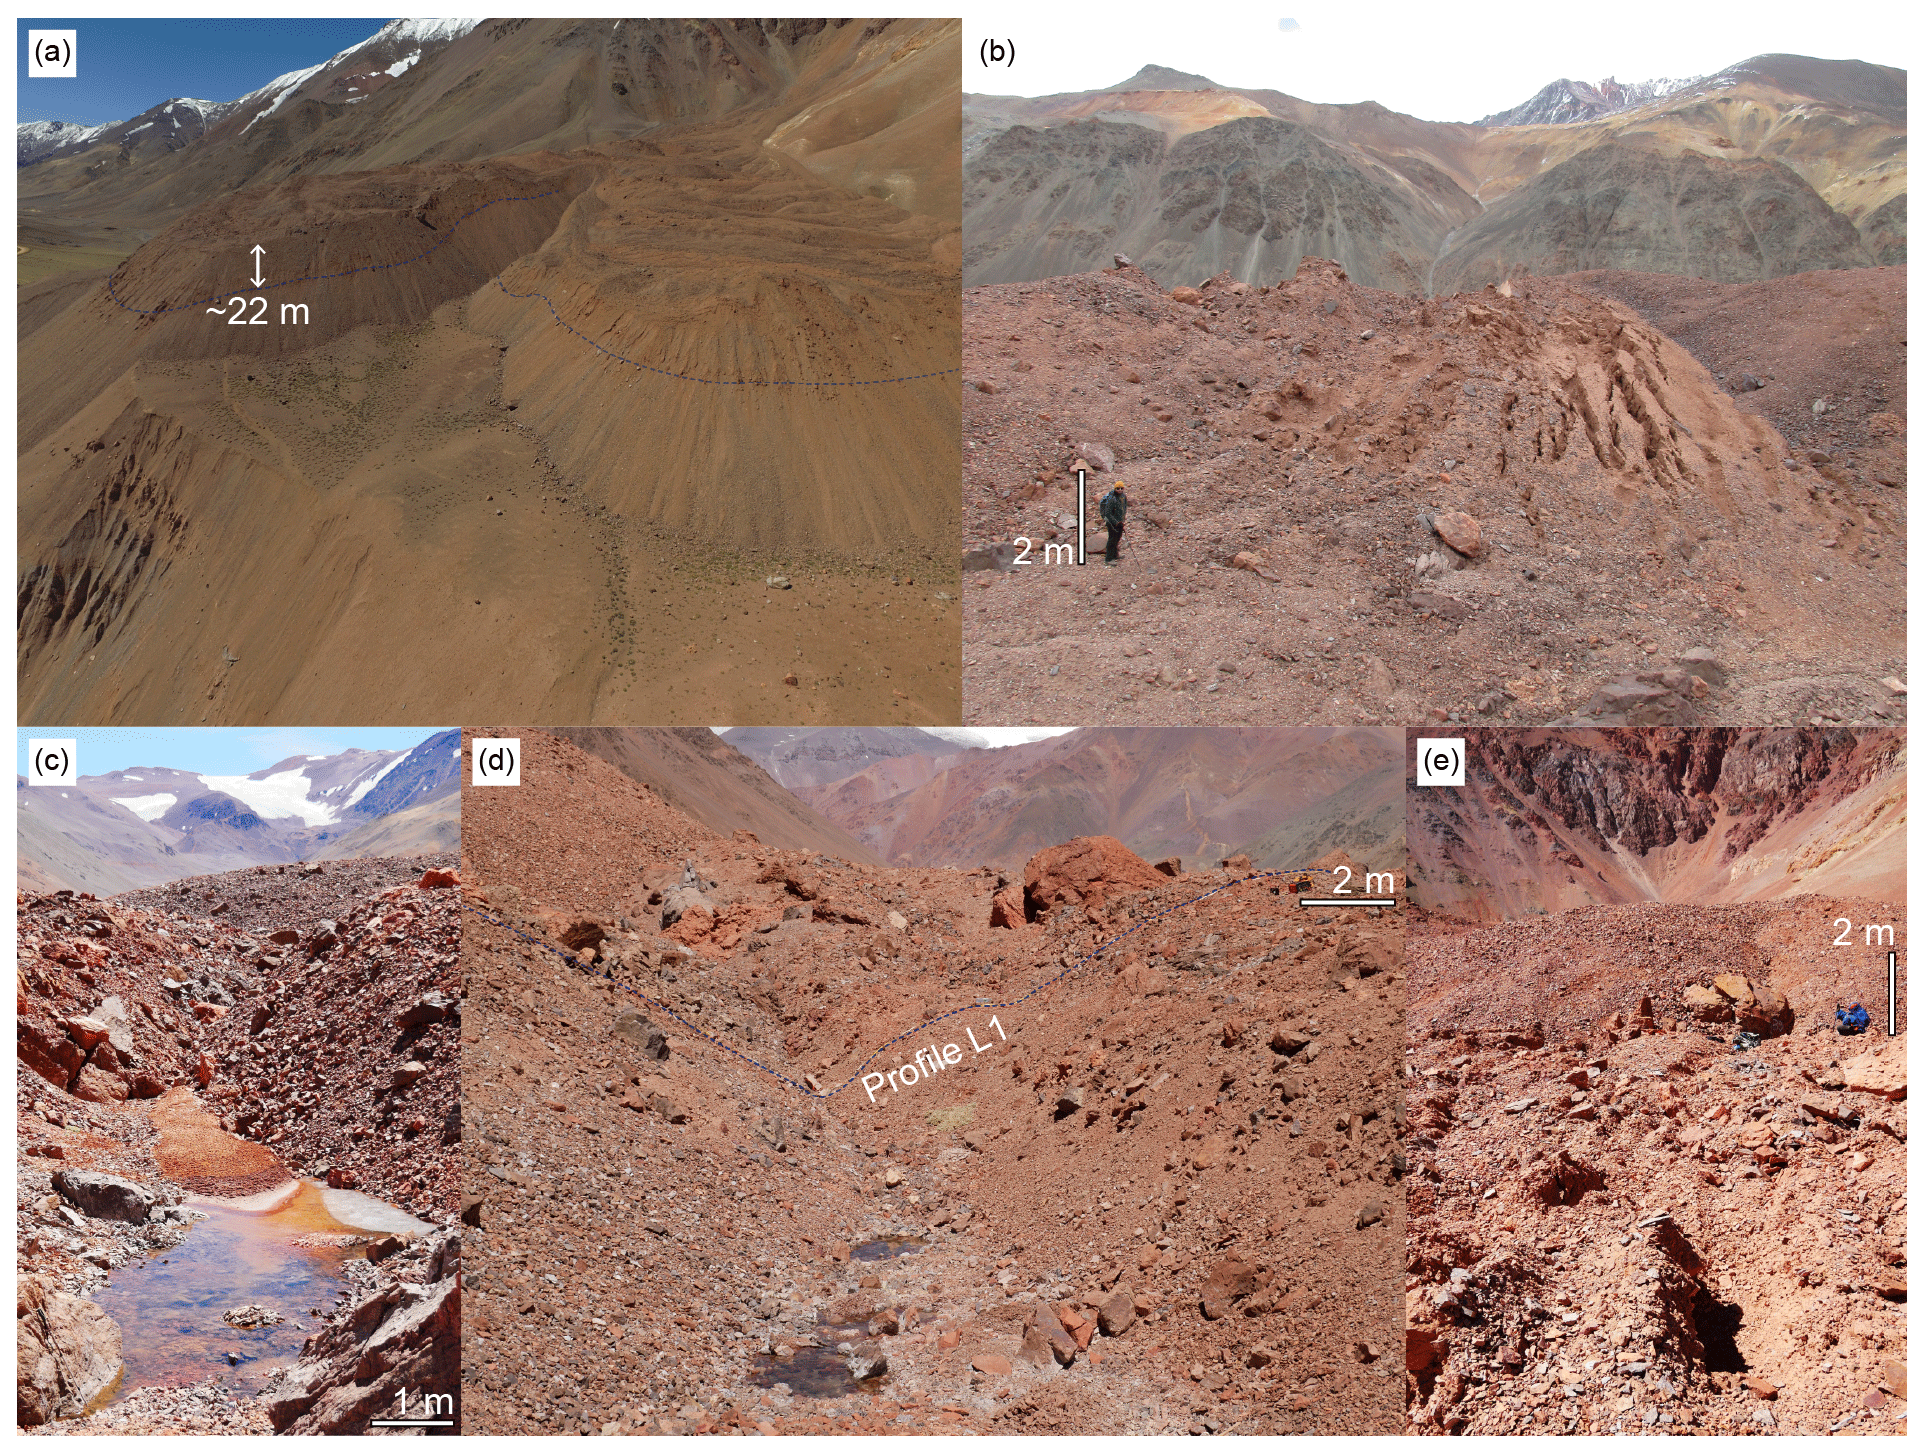
Figure 2Field images of Dos Lenguas. (a) View towards the northern (left) and southern (right) tongues of the rock glacier. Note gully-like structures in the upper oversteepened frontal slopes indicate the depths of the basal layer at both tongues (dotted lines). (b) Crevasses in the central rock glacier part indicate rupturing of transversal ridge thereby exposing fine debris. (c) Partly frozen thermokarst pond with delta indicating fine-sediment transport and accumulation along water pathways in furrows. (d) Thermokarst ponds next to profile L1 on the northern tongue. (e) Gully-like structures at the surface perpendicular to the ridge and furrows indicate meltwater pathways in the active layer next to profile L2 on the southern tongue (larger gullies on the southern tongue are also visible in Fig. 1b next to the field image location).
3.1 Timing of field surveys
All field surveys were carried out between late February and mid-March in 2016, 2017 and 2018. During late summer, the active-layer depth and the meltwater content should be close their maximum. Therefore, the time span is particularly suitable to detect internal hydrological structures and quantify ice and water content by means of geophysical methods. The ice content and the liquid water content during the end of the thaw period were only estimated once at each geophysical profile.
The horizontal and vertical surface changes were surveyed on a yearly basis with an unmanned aerial vehicle (UAV). Accordingly, interannual storage changes between 2016–2017 and 2017–2018 were derived from the volumetric changes of the surface towards the end of the thaw season.
3.2 DEM generation and analysis
To investigate the kinematics, i.e. vertical and horizontal surface changes, of the Dos Lenguas rock glacier, we relied on the production of digital elevation models (DEMs) from aerial photography collected with a UAV. Using structure-from-motion multi-view stereo (SfM-MVS) algorithms, we derived dense point clouds from overlapping aerial imagery with Agisoft PhotoScan Professional (version 1.4.4).
3.2.1 Data acquisition and DEM processing
During late summer in 2016, 2017 and 2018, we surveyed Dos Lenguas using a Phantom 3 Advanced Multicopter equipped with a standard camera (12.4 MP; FOV – field of view – 94∘), taking between 550 and 1800 overlapping images per survey. Survey flights were accomplished in a single day (13 March 2016) or spanning multiple days (24 February–2 March 2017 and 3–7 March 2018), depending on weather conditions. Across the survey area, which covered the rock glacier and its surrounding stable surfaces, we distributed 34 ground control points (Fig. 1b) that were repeatedly measured with a Trimble R8s/R2 differential global navigation satellite system (dGNSS) operating in a real-time kinematic base-rover configuration. The positions of ground control points were recorded with horizontal root-mean-squared (RMS) errors of 0.012 and 0.013 m for 2017 and 2018, respectively, and vertical RMS errors of 0.022 and 0.027 m for 2017 and 2018, respectively. For all 3 years, the identical workflow was followed in PhotoScan, starting with image alignment, followed by the manual identification of ground control points and camera optimization.
3.2.2 Measurement of horizontal rock glacier displacement
With the advancement of SfM-MVS software solutions and the availability of low-cost UAVs, the production of high-resolution DEMs and orthoimages has offered new time-efficient possibilities for the assessment of rock glacier kinematics (Dall'Asta et al., 2017). Here we use two complementary approaches: (a) the repeated measurement of 34 ground control points using a dGNSS device and (b) an automated image-matching approach to quantify horizontal movement on the rock glacier.
For automated image co-registration in optical imagery we used the freely available stand-alone environmental motion-tracking (EMT) software (https://tu-dresden.de/geo/emt, last access: 21 January 2020), originally developed for motion tracking in oblique pictures (Schwalbe and Maas, 2017) but likewise applicable to vertical images. As orthoimages collected in consecutive years show large spectral differences, caused by shadowing effects, snow cover, surface moisture, etc., we used DEMs and their derivatives as input for image-matching applications (Dall'Asta et al., 2017). EMT software applies area-based matching to automatically find corresponding patches of pixel values in multi-temporal images using least-squares matching or cross-correlation algorithms (Förstner, 1986; Schwalbe and Maas, 2017). Images are loaded into EMT software, where starting points (patch centres) are defined, the patch size and search area are set, and the tracking method and master and slave images are selected. While the patch size defines the area of master image values to match, the search area defines the maximum offset of the patch in the slave image. We applied least-squares matching with a patch size of 150 × 150 pixels and a search area of 50 × 50 pixels on hillshade images with 0.5 × 0.5 m resolution, resulting in a patch size of 75 × 75 m and a search area of 25 × 25 m.
3.2.3 Volumetric surface changes
Besides analysing the horizontal displacements of the rock glacier, short-term surface elevation changes can be used to approximate the geodetic mass balance of a rock glacier from photogrammetric investigations (Kääb et al., 1998; Kääb et al., 1997) or dGNSS measurements (Konrad et al., 1999). The production of multi-temporal DEMs allows for the calculation of volumetric surface changes between consecutive surveys. The vertical changes of the rock glacier surface area over the periods 2016–2017 and 2017–2018 were estimated by subtracting surface elevations of the 2016 DEM from the 2017 DEM and the 2017 DEM from the 2018 DEM, respectively. Then, the pixel-wise volumetric change was derived by multiplying the vertical changes of each raster cell by cell size. The total positive and total negative volumetric changes (bar graphs in Fig. 4) for the different geomorphological units of Dos Lenguas (Fig. 1b) were summed to derive negative and positive volumetric changes of the respective surface areas. The total volumetric net changes of the geomorphological units are the sum of positive and negative volumetric changes in the respective surface areas. The density of ice (900 kg m−3) was used to estimate the corresponding net change of ground ice, which is given as water equivalent (1 mm yr−1 corresponds to 1 kg m−2 yr−1) for each geomorphological area except for the side and front slopes. Therefore, it was assumed that the net changes in ground ice are mainly caused by volume expansion due to freezing of water and volume reduction due to melting of ground ice or thawing of ice-supersaturated permafrost. The net change in ground ice content per year was interpreted as a first-order estimate of the interannual water storage change. The assumption implies that spatial variations of the flow regime, bulk density changes of debris and edge effects of surface areas of the rock glacier are included in total volumetric net changes but potentially of minor importance for the considered timescale.

Figure 3Horizontal surface displacement on the Dos Lenguas rock glacier. Ground control point: GCP.

Figure 4Vertical changes of Dos Lenguas from March 2017 to March 2018. The bar graphs show the total positive volumetric (bluish bars) and the total negative volumetric (reddish bars) changes for each geomorphological area (Fig. 1b) as a function of the confidence intervals for the periods 2016–2017 and 2017–2018. Starting at the 12 o'clock position and following in the clockwise direction, the five bar graphs contain the total volumetric changes of the root zone, the central area, the southern tongue, the front and side slopes, and the northern tongue. The corresponding total net changes of ice are given in Table 6 as water equivalents.
Different sources of error might complicate the interpretation of volumetric surface changes; amongst these errors are dGNSS measurements, manual tagging of ground control points aerial image quality and interpolation algorithms (Wheaton et al., 2010). Therefore, a minimum level of detection (LoD) was calculated that incorporates propagated uncertainties from individual DEMs and determines a threshold to discriminate significant changes from non-significant noise. Following Brasington et al. (2003) we define the minimum LoD using Eq. (1):
where t is the critical value of a given confidence interval in a two-sided Student's t distribution and σ is the error associated with the DEM, calculated from the average reprojection error of 34 ground control points for epochs i and i+1. Raster values less than the LoD were later excluded from the calculation of the total positive and total negative volumetric changes of the respective surface areas (Fig. 4).
3.3 Geophysics
Two-dimensional electrical resistivity tomography (ERT) and seismic refraction tomography (SRT) were conducted along identical longitudinal profiles and cross-profiles on the Dos Lenguas rock glacier (Fig. 1b) to image the internal structure and to quantify its material composition based on a petrophysical model, the so-called four-phase model (4PM, see below) (Hauck et al., 2011).
The layout and survey geometry of the profiles were chosen according to the surface morphology of the rock glacier (Fig. 1b): (i) to gather subsurface properties in the four main structural units of the rock glacier, i.e. the root zone (profile C1), the central part (profile C2) and both tongues (profiles L1 and L2); (ii) to include longitudinal profiles and cross-profiles, which cover side slopes; and (iii) to survey perpendicular to potential water pathways (Langston et al., 2011) and water traps indicated by depressions and the local slope of surface topography.
3.3.1 Electrical resistivity tomography (ERT)
Subsurface resistivity is measured by injecting direct current into the ground through two electrodes while measuring the potential difference between two other electrodes coupled to the ground. Iterative tomographic inversions of apparent resistivities measured at different electrode locations and separations along a profile finally yield a two-dimensional model of the specific resistivity of the subsurface. The application of ERT has become a standard technique to image and monitor variations of electrical resistivity in the near subsurface of mountain permafrost due to its sensitivity to the state of water (liquid or solid) in unfrozen and frozen conditions (Hauck, 2013; Hilbich et al., 2008; Mollaret et al., 2019).
Four two-dimensional ERT profiles were measured with an ABEM Terrameter LS system (four channels) with 4 cables and 81 electrodes. Sponges were placed around steel electrodes and wetted with salt water to reduce contact resistance of the dry and loose surface material (sands and pebbles to boulders) in order to improve galvanic coupling (Maurer and Hauck, 2007). Profile lengths of 240 m (L1), 320 m (C1) and 400 m (C2 and C2) were achieved with an electrode spacing of 3, 4 and 5 m, respectively (Table 3). All profiles were measured with the multiple-gradient array, which reached maximum penetration depths of 41 m for L1, 60 m for C1, and 68 m for C2 and L2. Before data inversion, data points exceeding the threshold of 1 % of the coefficient of variation were removed.
Table 2Mean and maximum precipitation in the Agua Negra valley for the hydrological periods 2016–2017 and 2017–2018 from the CHIRPS (Climate Hazards Group InfraRed Precipitation with Stations) data archive (Funk et al., 2015).
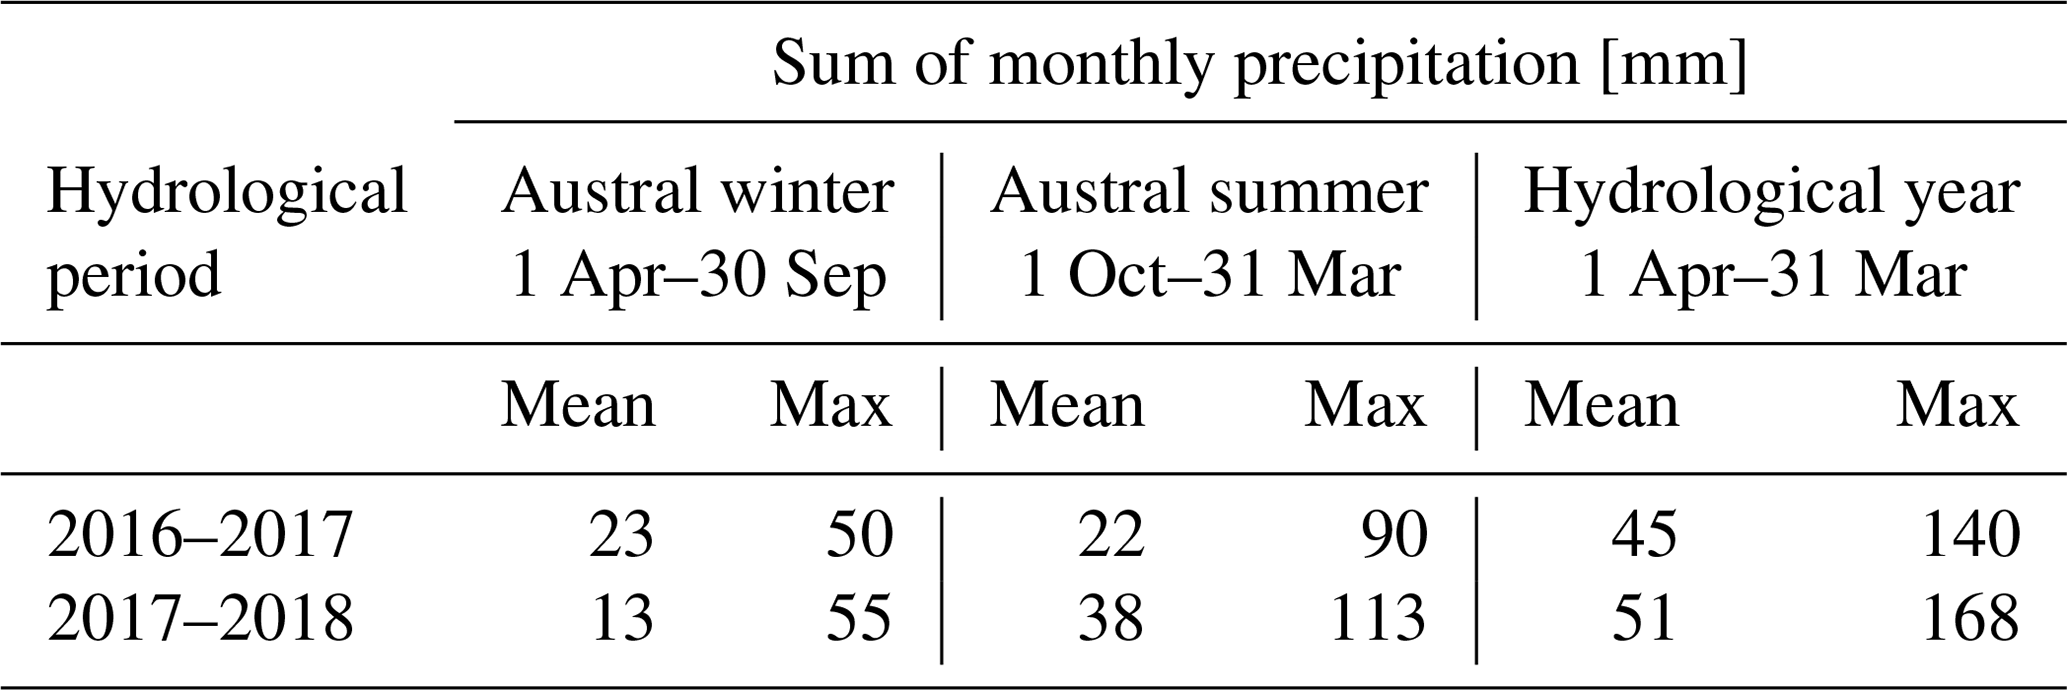
Table 3Details of the ERT surveys. The columns to the left of the acquisition date contain details of the layout geometry of each profile (see Fig. 1b for the position of the profiles). The columns to the right of the acquisition date contain filtered data points and the quality of the inversion. Longitudinal profile: long. profile.

Data inversion was done using the RES2DINV inversion software (http://www.geotomosoft.com, last access: 21 January 2021). Default inversion settings were adapted to comply with high resistivity contrasts on the order of several magnitudes, typical for permafrost environments. The robust inversion scheme (L1 norm) with no limits for the resistivity range was used, as sharp boundaries and high resistivities for ice-rich permafrost were expected. The surface topography was integrated based on dGNSS measurements of each electrode along the profiles, and the topographic shift of the subsurface nodes of the inversion models were exponentially damped with depth (Loke, 2018).
The mean absolute misfit error of the inversion model is given by the difference between calculated and measured apparent resistivity of the model blocks (Loke, 2018). Data outliers of measured apparent resistivities were filtered using a filter criterion of RMS error of > 100 % after a first inversion run before the inversion was repeated with the filtered data set (Loke, 2018). In total, 92 % of all gathered data points were used after filtering (Table 3).
3.3.2 Seismic refraction tomography (SRT)
Significantly different elastic properties between the frozen and the unfrozen state of the subsurface can be measured using its P-wave velocities. P waves are refracted at subsurface layers with velocity contrasts. Subsurface layers and structures can be delineated by analysing first-arrival times at each receiver if velocities increase with depth. Velocity changes in the active layer and permafrost are mainly influenced by the porosity of sediments and their saturation with air (330 m s−1), water (1500 m s−1) or ice (3500 m s−1) and are thus more distinct in unconsolidated coarse-grained sediments than consolidated rocks (Hilbich, 2010). P-wave velocities in rock glaciers derived from different field studies increase generally from the active layer (< 1500 m s−1) to permafrost (range of 1500–5000 m s−1) (Draebing, 2016; Hauck and Kneisel, 2008).
Difficulties for the interpretation of structures can arise from overlapping P-wave velocities, e.g. sand (200–2000 m s−1) or bedrock (1300–6200 m s−1, cf. Table A3 in Hauck and Kneisel, 2008) and permafrost in rock glaciers (1500–5000 m s−1, cf. Draebing, 2016). Low-velocity layers sandwiched between or located below high-velocity layers cannot be detected from P waves (Schrott and Hoffmann, 2008). Despite the challenges in mountain permafrost terrain, refraction seismic surveys have been successfully applied on periglacial landforms like rock glaciers (Croce and Milana, 2002; Hausmann et al., 2007; Ikeda, 2006; Musil et al., 2002; Schrott, 1996), moraines (Langston et al., 2011), talus slopes (Otto and Sass, 2006) and debris-covered slopes (Hilbich, 2010).
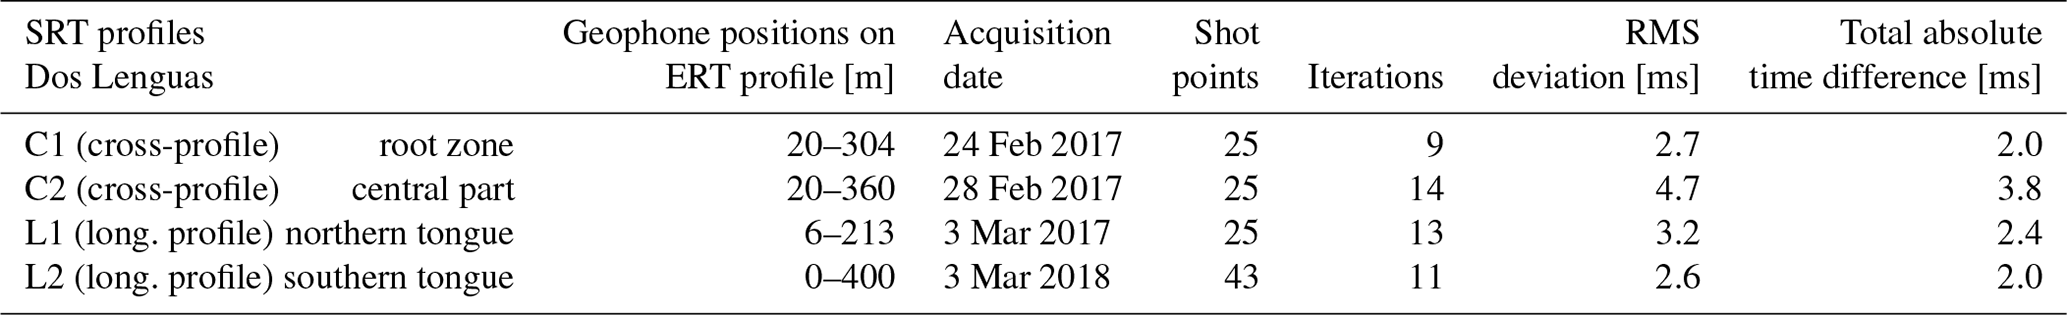
We used a 24-channel Geode (Geometrics) with 14 Hz geophones to record seismic waves with a sample interval of 0.125 ms and five stackings per shot point. A sledge hammer (7.5 kg) and an aluminium plate were used to generate P waves. A total of 8 to 10 in-line shots and 3 to 6 offset shots were measured for each layout before “rolling” on. The geophone spacing ranges between 3 and 5 m in alignment with the spacing of the ERT profiles, as electrode positions were used for geophones to ensure consistent sensor positions within the same geophysical profile (Table 4). The complete data processing workflow, including first-arrival picking, travel time analysis and data inversion, was performed with the Reflexw software package that uses an inversion algorithm based on the simultaneous iterative reconstruction technique (Sandmeier, 2016). Profile topography and an initial velocity gradient of 300 m s−1m−1 were integrated in all start models. The reliability of the tomograms is given by the RMS and by the sum of the total absolute time differences between observed and calculated travel times (Table 4) (Sandmeier, 2016).
Table 4Details of the SRT surveys. Sensor spacing and orientation of all SRT profiles are identical to the corresponding ERT profiles (cf. Table 3). Longitudinal profile: long. profile.
3.3.3 Four-phase model (4PM)
In order to quantify the material composition of the rock glacier, the complementary ERT and SRT field data were combined in the 4PM to estimate the volumetric fractions of ice, water, air and rock based on petrophysical relationships. Using the ERT-derived inverted specific resistivity distribution ρ and the P-wave velocity distribution from SRT, the 4PM determines the volumetric fractions of liquid water (fw), ice (fi,) and air (fa) within the predefined porosity (ϕ) of the rock fraction (fr) by assuming that the sum of all fractions equals one in each model cell of the two-dimensional model domain (Hauck et al., 2011).
In its simplest version, the estimation of fw in the 4PM is based on Archie's law that relates the measured and inverted electrical resistivity ρ (in Ω m) of sediments to the resistivity of pore water ρw, the porosity ϕ and the saturation with water Sw:
where m (cementation index) and n (saturation exponent) are empirically determined parameters of the host material (Archie, 1942). This petrophysical relation is assumed to be still valid in partly frozen material and permafrost close to 0 ∘C, where unfrozen water can still be present (Hauck et al., 2011). Regarding the seismic velocities, the 4PM incorporates and extends the time-average equation of Timur (1968) to four phases:
where vis the obtained P-wave velocity of the bulk material and vw, vr, vi and va are P-wave velocities of water, rock, ice and air, respectively (Hauck et al., 2011). Equations (2), (3) and (4) can be combined and solved for fw, fi and fa by replacing and in Eq. (3) to yield
Equations (5)–(7) allow for calculating the fractions fw, fi and fa based on the input data ρ and v from ERT and SRT, respectively, if the other material properties (, vi and va, cf. Table 5) are prescribed.
Table 5Model parameters for 4PM calculation.
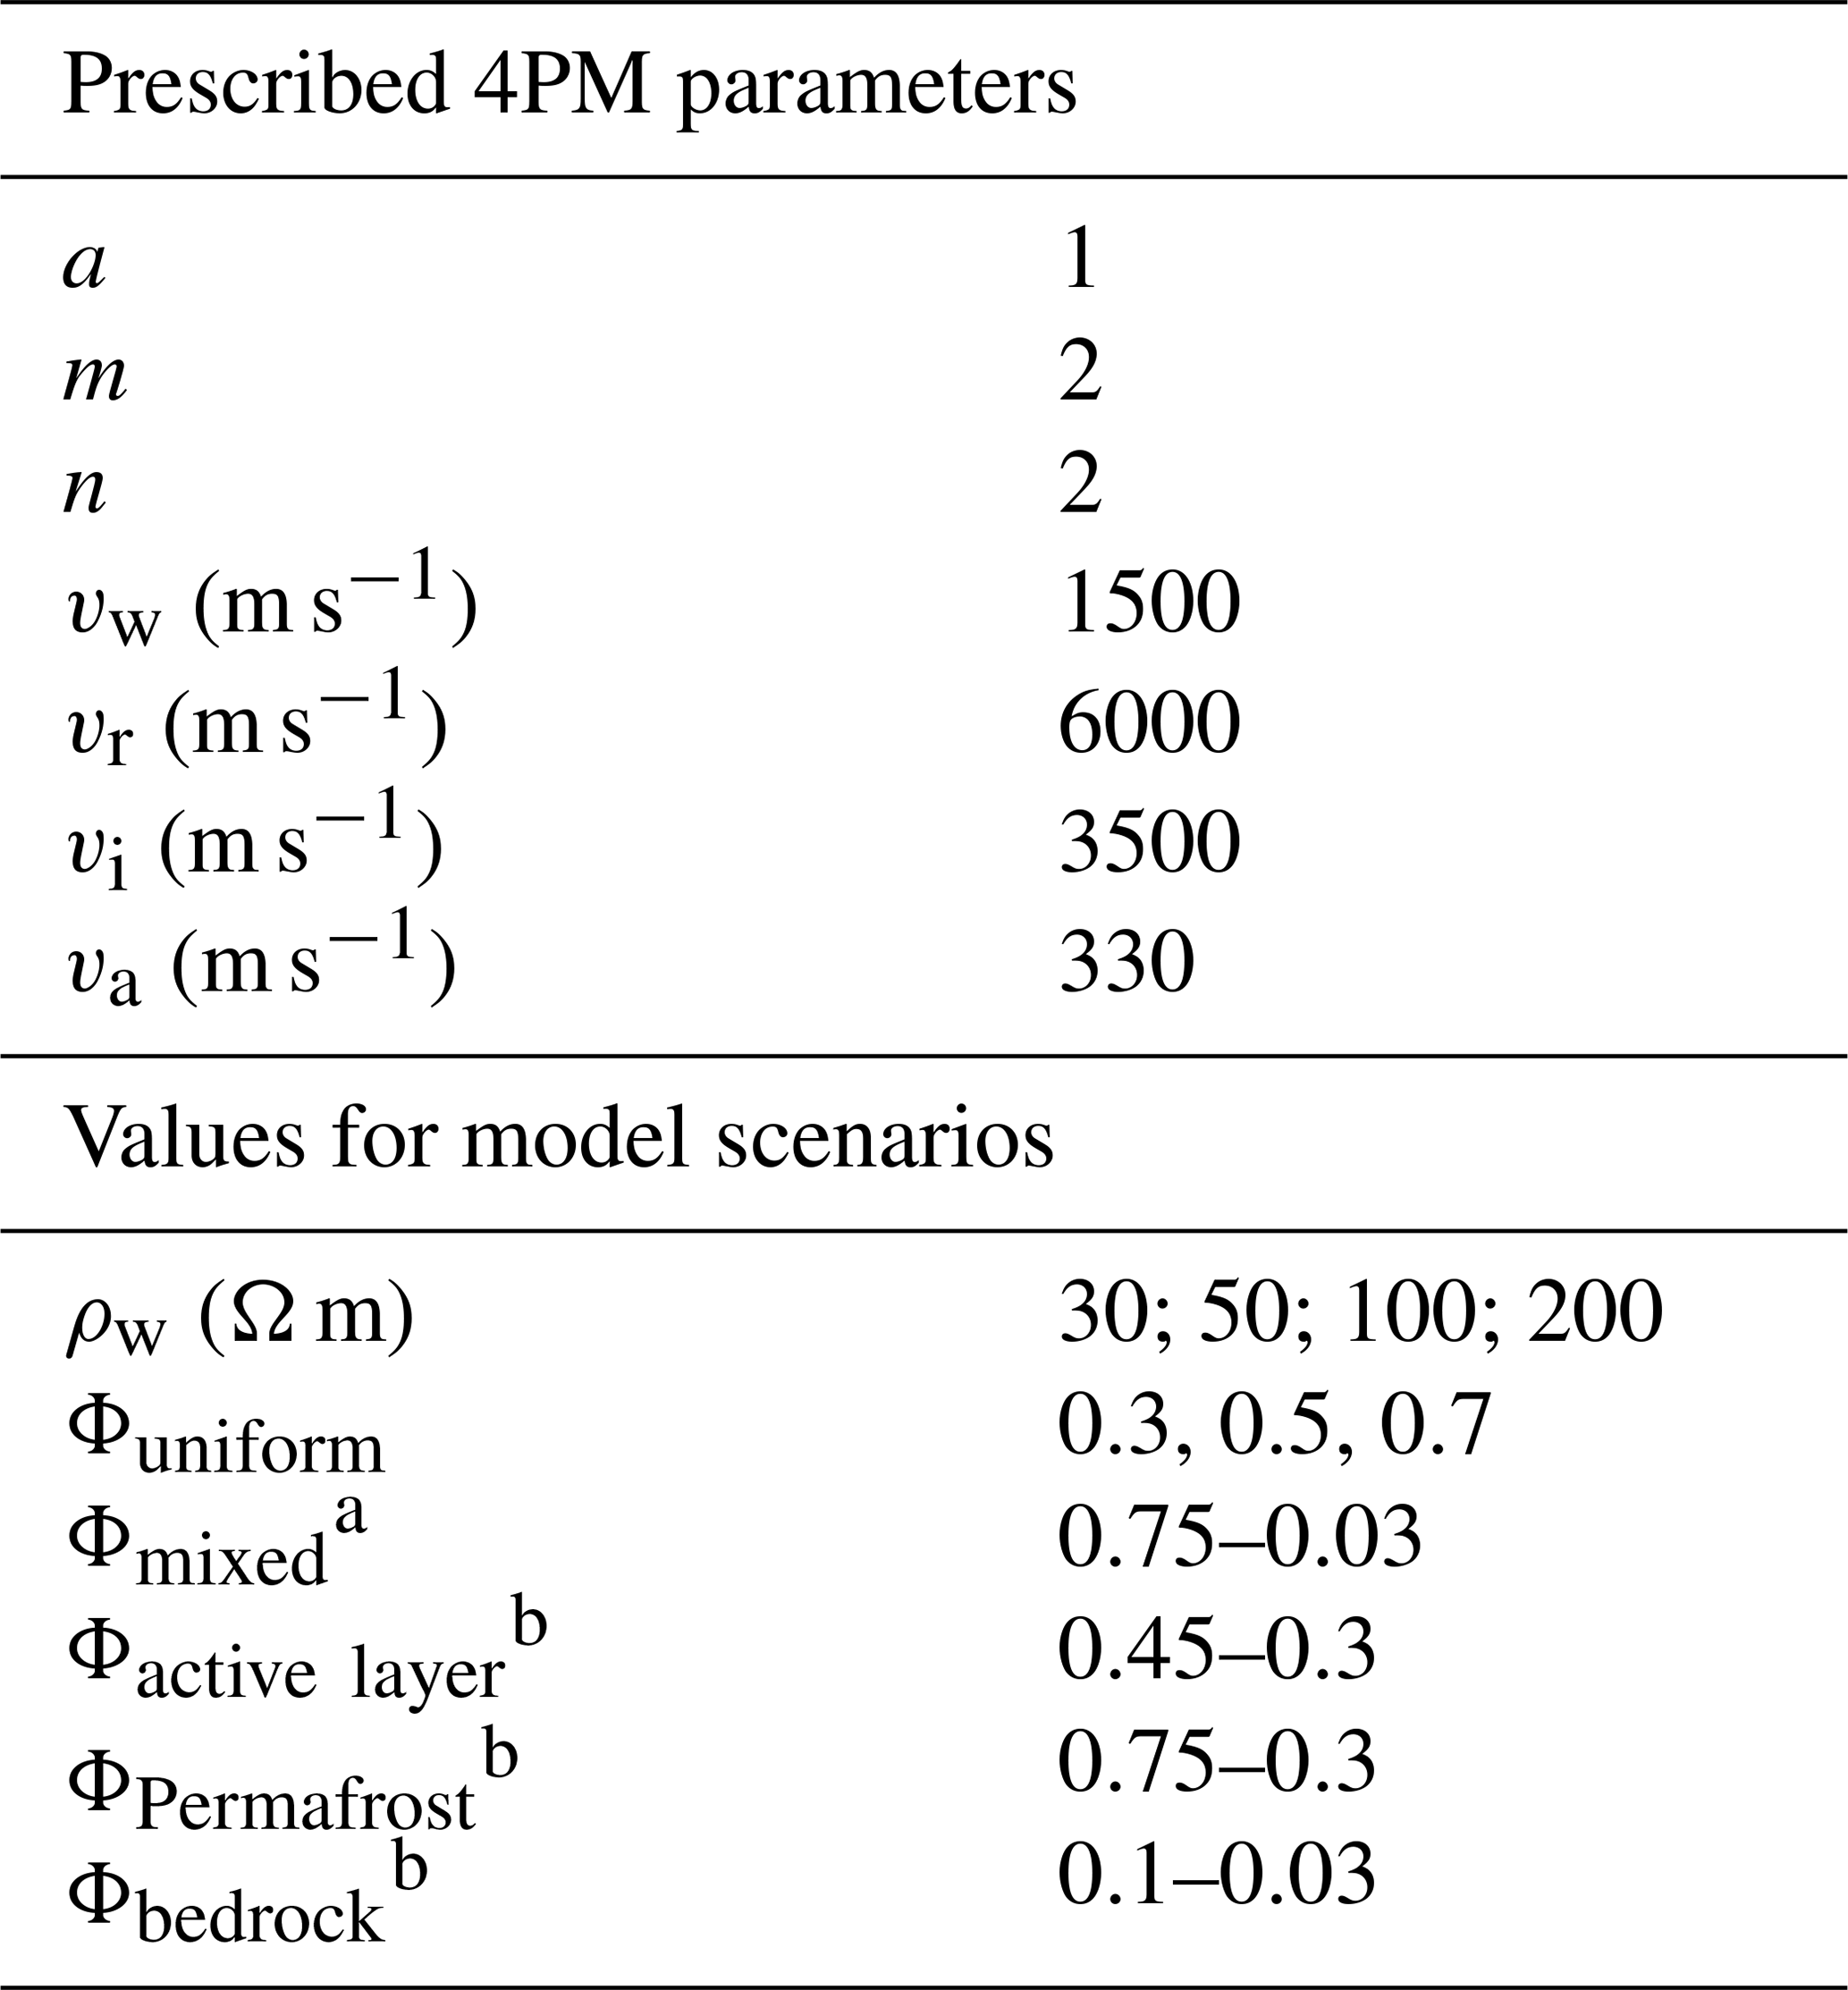
a Mixed model includes different porosities of the active layer, permafrost and bedrock. b Porosity ranges include depth gradient.
The P-wave velocities vw, vi and va are known material properties and were taken from previous studies in periglacial environments (Hauck and Kneisel, 2008). The P-wave velocity vr of the frozen volcanic rocks was assumed to be 6000 m s−1, since comparable frozen or unfrozen rock types range between 4000 and 7000 m s−1 (Draebing, 2016; Schön, 2011) and the sensitivity of the 4PM is very low for variations in vr (Hauck et al., 2011). The free parameters m and n in Archie's law were adopted from studies that have been successfully conducted in different mountain permafrost environments (Pellet et al., 2016), including different rock glaciers (Hauck et al., 2011; Mewes et al., 2017; Schneider et al., 2013) or have been tested for unfrozen and frozen sands (King et al., 1988). These prescribed parameters of the 4PM were kept constant in the model scenarios. The most sensitive 4PM parameters from Table 5 are the porosity ϕ and the pore water resistivity ρw (Hauck et al., 2011). Hence, for this study model scenarios with different combinations of ϕ and ρw values were performed to estimate and evaluate modelled material compositions.
We used three uniform porosity models with ϕ of 30 %, 50 % and 70 % and one mixed-porosity model by integrating different porosity ranges of 45 %–30 %, 75 %–30 % and 10 %–3 % for the active layer, permafrost and bedrock, respectively (Table 5), due to the high spatial variability of the porosity and volumetric ice content in rock glaciers. Observations from drill cores have shown that volumetric ground ice content can range from 0 % to 90 % in ice-free, ice-poor and ice-rich layers in rock glaciers (Haeberli et al., 1998; Krainer et al., 2017; Monnier and Kinnard, 2013). The frozen core of active rock glaciers is mainly characterized by ice-supersaturated conditions (> 40 % ice content) and can contain massive ground ice. Therefore the assumed uniform 70 % porosity model and mixed-porosity model represent the upper-bound assumptions for the 4PM modelling approach of a talus rock glacier, like Dos Lenguas. Ice-supersaturated conditions could be expected for volumetric ice content greater than 40 %, since the dominant grain sizes of Dos Lenguas are sands and pebbles (Schrott, 1994). The 30 % and 50 % porosity models allow for volumetric ice content less than 30 % and 50 %, given that the voids in rock glaciers and the 4PM also contain water and air. Therefore the latter porosity models would be suitable for an inactive or intact rock glacier, which does not presently move, as the creep of frozen soils is restricted by interlocking particles without ice-supersaturated conditions (Arenson et al., 2002; Arenson and Springman, 2005). The spatial arrangement of mixed porosities was deduced from interpretations of the ERT and SRT data. Negative depth gradients (0.01–0.03 m−1) were included to simulate substrate compaction with depth while allowing for higher volumetric ice content in the upper part of the frozen core of the rock glacier. Porosity assumptions for geophysical models are further discussed by Mollaret et al. (2020), who also found porosity values of 30 %–70 % for active rock glaciers based on jointly inverted data sets.
All porosity scenarios were modelled for different pore water resistivities of 30, 50, 100 and 200 Ω m. Modelled pore water resistivities were based on in situ measurements of specific electrical resistivity of surface waters derived from the spring (∼ 30 Ω m), thermokarst ponds (∼ 50 Ω m) and melted snow from the surface (∼ 200 Ω m). A fourth value of 100 Ω m was assumed to represent an intermediate model response to snow-derived groundwater increasing its conductivity during percolation.
The 4PM model results were evaluated based on two criteria. First, we used the ratio of the number of model cells with physically consistent solutions (i.e. which satisfied Eq. 2) to the total number of model cells as proxy for the suitability of the sensitive 4PM parameters Φ and ρw. Second, the model results were qualitatively compared to check plausible material compositions in permafrost and the active layer during summer thaw, e.g. whether ice content in permafrost is sufficient to allow for creep deformations and whether model results indicate unreasonable ice content near the surface, i.e. active-layer depths. After the evaluation, plausible conservative and maximum scenarios were chosen in order to estimate ranges of the total ice content of Dos Lenguas and the liquid water content at the end of the thaw season. The mean volumetric fraction of water (mean fw) and ice (mean fi) of all model cells located below the rock glacier surface of each profile (4PM model cells below side slopes and outside the rock glacier were excluded at profiles C1 and C2) were converted to mass using densities of 997 and 900 kg m−3 for water and ice, respectively. The mean ice and water content along the profiles C1 (root zone), C2 (central area), L1 (northern tongue) and L2 (southern tongue) were extrapolated to the mean depth of ice-rich permafrost of each profile and to the respective surface area of the geomorphological units (Fig. 1b). The error estimation for the mean ice and water content in Dos Lenguas was calculated by linearly propagating the uncertainties of (i) the mean fw and the mean fi of all used model cells of each profile, (ii) mean depths of ice-rich permafrost, and (iii) 2 % error attributed to the mapped surface areas derived from the high-resolution DEM.
Besides the quantification of the material composition, the 4PM was used to infer the internal hydrologic structure of the rock glacier from the spatial distribution of ice and water content per porosity, i.e. ice and water saturations, along the profiles. The resolution capacity of water and ice content along 4PM profiles was previously tested by Mewes et al. (2017) using synthetic models and field data to assess detectable hydrological structures in rock glaciers.
4.1 Horizontal surface displacements
The Dos Lenguas rock glacier shows a heterogeneous pattern of horizontal surface displacements that are consistent in both direction and magnitude for the two epochs (Fig. 3). Generally, surface velocities fall between a few decimetres and 2 m yr−1 and decrease downslope and laterally from the central flow lines towards the side slopes. The highest surface speeds of 1.5–2 m yr−1 are attained along the central flow line of the root zone, where surface morphology is dominated by longitudinal ridges and furrows indicating extensional flow in a mainly western direction. Surface movements remain between 1.5 and 2 m yr−1 in the upper central part, while the flow direction slightly turns to the west-southwest. Grading into the southern tongue of the rock glacier, surface displacement decreases only moderately to between 1 and 1.25 m yr−1 and bends towards the southwest. In contrast to this, the boundary between the central part and the northern tongue is much sharper. Here, the flow continues in a west-southwest direction and immediately drops down to below 0.75 m yr−1. Approaching the front of the northern tongue, surface displacement accelerates again, reaching velocities of up to 1.25 m yr−1. Opposed to this, the southern tongue further bends towards the southwest, keeping relatively high surface displacement rates between 1 and 1.5 m yr−1 before slowing down to 0.75–0.5 m yr−1 on top of the frontal slope. Consistently on both frontal slopes, however, displacement rates rapidly decrease downwards from approximately 1 m yr−1 to below the LoD.
The horizontal surface displacement rates confirm the active state of Dos Lenguas, while the displacements of ground control points with rates smaller than the LoD and random bearings (Fig. 3) underline the inactive state of the rock glacier part north of Dos Lenguas classified from surface morphology (Schrott, 1996).
4.2 Volumetric changes
For two epochs, 2016–2017 and 2017–2018, we calculated vertical surface changes and corresponding volumetric changes for the five morphological units of the Dos Lenguas rock glacier. The spatial pattern of interannual positive volumetric changes along the front of the transverse ridges and negative volumetric changes on the back of the transverse ridges indicate the advance of the surface of the rock glacier (Fig. 4). The highest amounts of these paired positive and negative volumetric changes correlate spatially to the lower central area and along the southern tongue where strongly developed transverse ridges and furrows match with high horizontal displacements (cf. Figs. 3 and 4). Although the highest displacement rates occurred in the root zone, volumetric changes are less pronounced here, as surface topography is characterized by longitudinal ridges and furrows. Conversely, weaker volumetric changes occurred on the northern tongue, where slower movements of the transverse ridges predominate. Positive volumetric changes of the upper front slopes reflect the advancement and oversteepening above the shear layer, which is also visible on the aerial images (cf. Figs. 2a, 3 and 4). Negative volumetric changes delineate superimposed linear erosion features at the upper frontal slopes. Positive volumetric changes below the shear layer show downslope transported and accumulated debris at the front slopes.
If the volumetric changes of the surface topography were produced solely by the interannual forward movement, the sum of total positive and negative volumetric changes should be close to zero within the given uncertainties. However, the total positive and negative volumetric changes yielded different magnitudes for the rock glacier surface (excluding front and side slopes) and the different geomorphologic units during the observation periods (cf. bar graphs in Fig. 4). Thus, annual net changes of the ground ice content, i.e. volumetric gains and losses of ice, were calculated as a first-order estimate of the interannual water storage changes given in water equivalents (Table 6). The sum of the total volumetric changes in all geomorphological units (excluding the area of the front and side slopes) gives an annual net change in ground ice of −36 and +27 mm yr−1 in the years 2016–2017 and 2017–2018, respectively, with a confidence interval of 95 % (Table 6). The spatial differences in the first observation period, 2016–2017, indicate major ice losses of −61 mm yr−1 in the central area and moderate losses between −23 and −30 mm yr−1 in the other geomorphological units. During the second period of 2017–2018, the central part, northern tongue and southern tongue gained 14, 45 and 30 mm yr−1, respectively, while gains of 4 mm yr−1 indicate almost equilibrium conditions in the root zone. Thus, based on the 95 % confidence interval, the total net change of the ground ice between March 2016 and March 2018 indicates ice losses of −23 and −47 mm yr−1 in the root zone and central part, respectively; ice gains of 22 mm yr−1 on the northern tongue; and equilibrium conditions with 0 mm yr−1 for the southern tongue.
Table 6Level of detection (LoD; top) is given for different confidence intervals and t values for detected vertical changes. Associated net balance estimates (bottom) derived from the sum of positive and negative interannual volumetric changes for the observation periods. The net changes of ice are given in water equivalent per year for the whole surface area and each geomorphological unit of the rock glacier. The net balance approximations correspond to interannual water storage change under the assumption that the volumetric changes were mainly caused by gains and losses of ice.
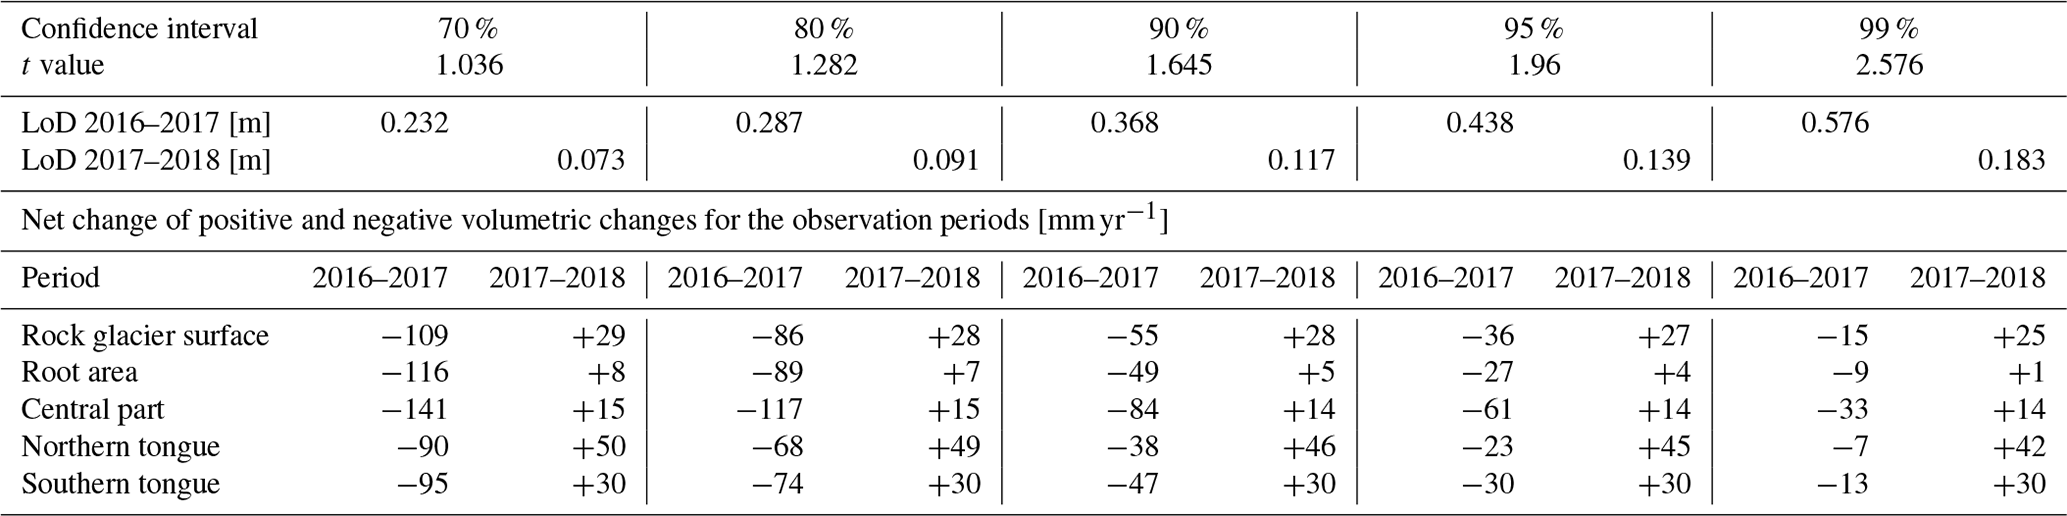
The robustness of volumetric estimates was assessed by calculating LoDs based on different confidence intervals as input to Eq. (1), using t values from a two-sided Student's t distribution (Table 6, Fig. 4). Most of the revealed vertical changes from 2016 to 2017 had high limits of detection from 0.232 to 0.576 m for the 70 % to 99 % confidence intervals, respectively. In contrast, vertical changes from 2017 to 2018 had very narrow limits of detection between 0.073 and 0.183 m for the 70 % to 99 % confidence intervals, respectively. Thus, detected volumetric changes for 2017–2018 can be regarded as more reliable due to their higher accuracy. The lower accuracy for the period 2016–2017 might be related to bulging effects causing spatial errors (Mosbrucker et al., 2017) in the central part of the 2016 DEM due to technical difficulties during dGNSS measurements of central ground control points. However, the 95 % and 99 % confidence intervals yielded still comparable magnitudes of volumetric changes for both periods and give rather conservative estimates.
If the amounts of interannual storage changes are considered as mean depth variations of an ice-rich permafrost table, they would mean the growth or melting of ground ice at the top of a frozen core by several centimetres per year. Observed wet active-layer conditions above ice-rich permafrost during the summer thaw in our study and other studies (Arenson et al., 2010; Croce and Milana, 2002; Kenner et al., 2020) add to the interpretation that active layer and ice-rich permafrost tables are potential sinks and sources of interannual storage changes. Yet, the interannual growth and decay of ground ice in and around other parts of the rock glacier could add to the interannual water storage changes. The estimated magnitudes of interannual changes seem reasonable given the high variability of mountain weather conditions, micro-topographic effects and strong influence of incoming solar radiation potentially controlling local active-layer variations on rock glaciers in the upper Agua Negra catchment (Schrott, 1998).
4.3 Internal structure, ice and water content
4.3.1 ERT results and interpretations
The inversion results of all ERT data show a heterogeneous distribution of high, intermediate and low specific resistivities in the rock glacier (Fig. 5). High-resistivity zones (> 104 Ω m) are mainly located underneath ridges of the rock glacier, reaching depths of 10–30 m below the surface. Low resistivities (< 103 Ω m) predominantly occur in and near topographic depressions close to the surface in all profiles or below high resistivities at depths of approximately 40 m in both cross-profiles (C1 and C2) and below depths of 35 m in the longitudinal profile L2 (Fig. 5)
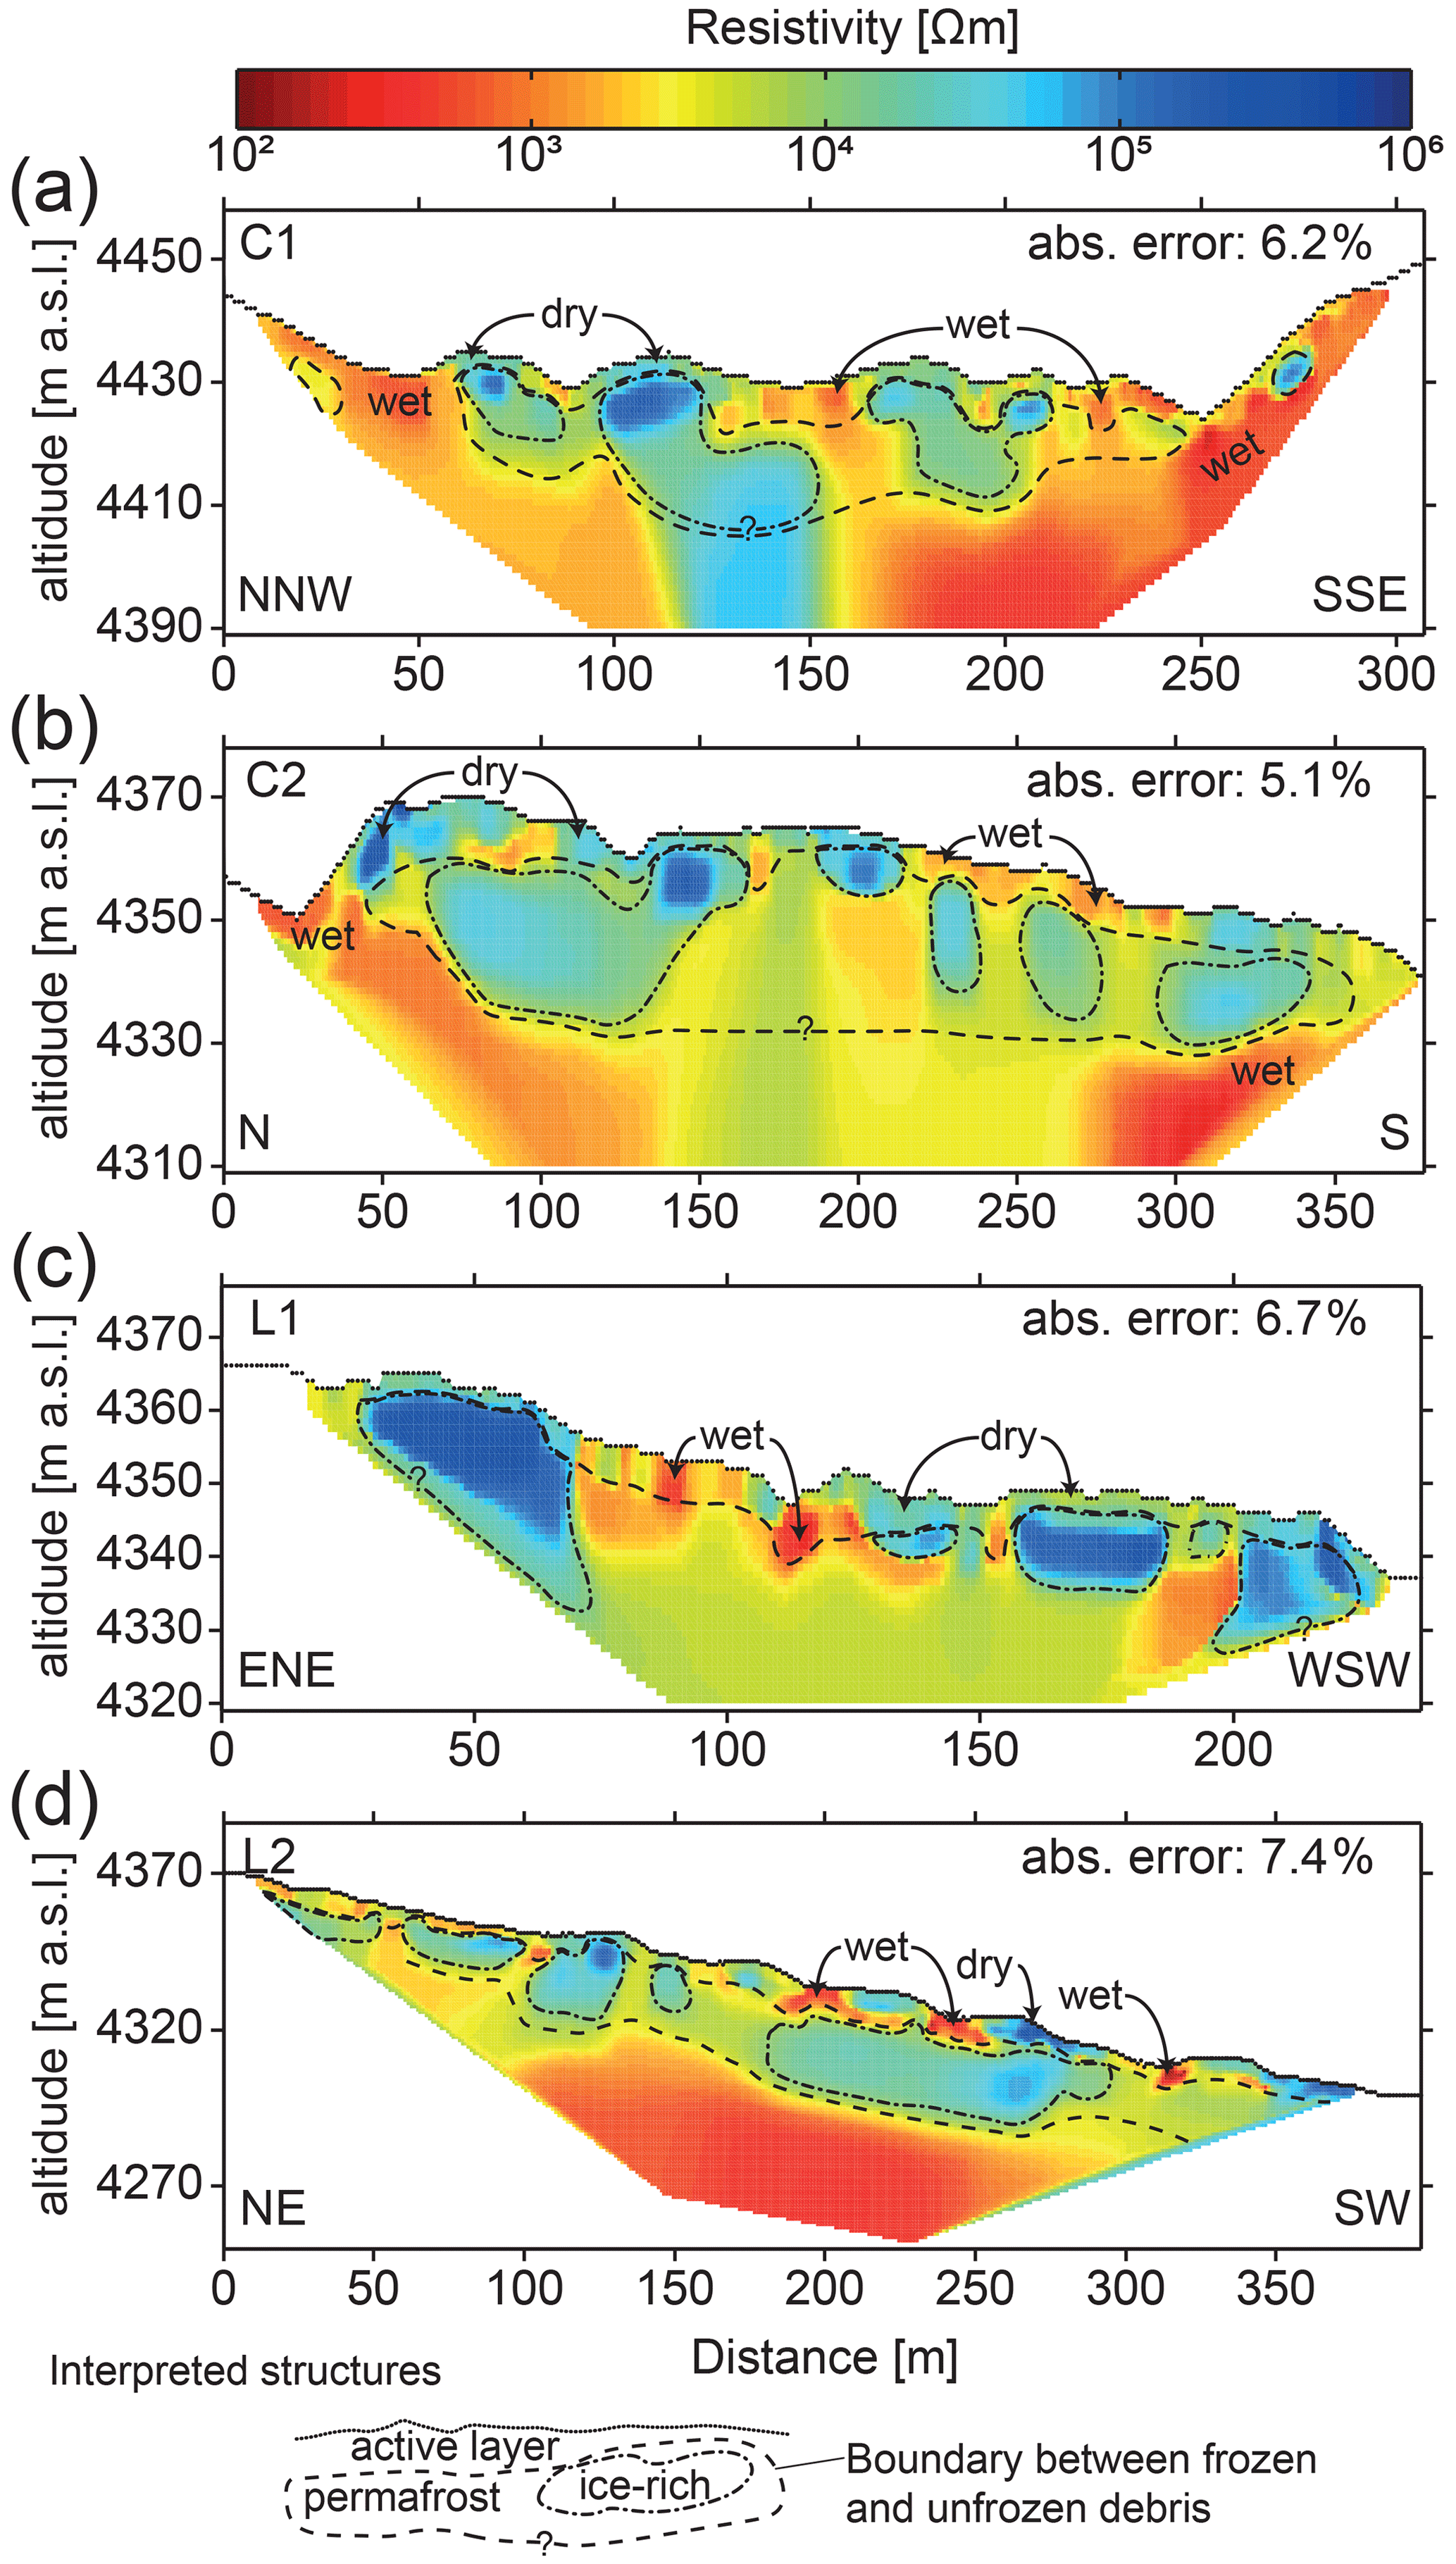
Figure 5ERT of Dos Lenguas. (a) Cross-profile C1 of the root area. (b) Cross-profile C2 of the central rock glacier. (c) Longitudinal profile L1 of the northern tongue. (d) Longitudinal profile L2 of the southern tongue. Note the different horizontal and vertical scales for the different profiles. Absolute error: abs. error.
According to the heterogeneous pattern of resistivity ranges as well as field observations of the surface debris along the profiles, the resistivity ranges were interpreted as follows: (i) low electrical resistivities (< 103 Ω m) correspond to unfrozen and wet subsurface conditions, and (ii) high electrical resistivities (> 104 Ω m) close to the surface show dry unconfined sands and/or coarser debris with large voids, while high electrical resistivities (> 104 Ω m) in the subsurface indicate rather ice-rich permafrost in the rock glacier. Thus, we interpret the active layer to be mainly characterized by very dry debris of ridges and locally wet conditions located in longitudinal and compressional furrows or in topographic depressions between side slopes and talus slopes of the rock glacier (Fig. 5). Direct proof of wet active-layer conditions is given at L1 where meltwater ponds are present in furrows next to the profile (Fig. 2d) on the northern tongue. Horizontal and vertical contrasts and anomalies of resistivity permitted a clear delimitation of the permafrost body in the rock glacier. Lower electrical resistivities below depressions and furrows could indicate higher water and/or lower ice content in the rock glacier due to percolating water and/or local permafrost degradation between interpreted ice-rich permafrost (Fig. 5). Ice-rich permafrost shows large vertical variations and increasing thicknesses of 10–20, 15–25 and 15–30 m in the root zone, central area and both tongues, respectively. As the electrical conductivity ( resistivity) is mostly sensitive to liquid water content, it remains inconclusive if higher resistivities are caused by air- or ice-filled voids. Additionally, inversion model sensitivity decreases with depth and towards lateral borders of ERT, and high-resistivity contrasts can cause inversion artefacts in the model (Hilbich et al., 2009; Marescot et al., 2003). Nevertheless, the mean thickness of ice-rich permafrost was roughly approximated from the vertical dimensions of high-resistivity zones of 15 ± 5, 20 ± 5 and 22 ± 7 m in the root zone, central area and both tongues, respectively (cf. interpreted structures in Fig. 5).
4.3.2 SRT results and interpretations
All SRT profiles reveal a horizontal two-layer structure of smoothly increasing P-wave velocities with depth (Fig. 6). P-wave velocities of < 600 m s−1 of the active layer reflect dry unconfined sands and pebble- to boulder-sized material close to the surface (< 3 m depth). Increasing velocities up to 1500 m s−1 at depths of 3–8 m indicate a more compacted and/or moister sandy material above the permafrost table. Inverted P-wave velocities of the lower layer have a wide range from 1500 to 5000 m s−1, thereby showing spatially heterogeneous velocity distributions. The upper low-velocity layer (< 1500 m s−1) indicates unfrozen areas, while the intermediate- to high-velocity layer (1500–4500 m s−1) is interpreted as permafrost. The gradually increasing P-wave velocities are partly vertically incised between higher P-wave velocities (cf. 2000 m s−1 isoline in Fig. 6), indicating the transition from unfrozen debris to thawing permafrost between 1500 and 2000 m s−1 during summer, which has been observed on previous seismic surveys of rock glaciers in the study area (Croce and Milana, 2002; Schrott, 1994). The P-wave velocities of the transition area around the permafrost table could either indicate higher water (vw=1500 m s−1) and lower ice content and/or be related to the vertical resolution of the smoothly inverted P-wave velocities.

Figure 6SRT of Dos Lenguas. (a) Cross-profile C1 of the root area. (b) Cross-profile C2 of the central rock glacier. (c) Longitudinal profile L1 of the northern tongue. (d) Longitudinal profile L2 of the southern tongue. Note the different horizontal and vertical scales for the different profiles.
Higher velocities were interpreted as ice-rich permafrost (2500–4500 m s−1) and bedrock occurrences (> 4500 m s−1), where Dos Lenguas starts to split up (cf. Fig. 6b and c) and below the talus slope next to the root area (cf. Fig. 6a). However, a reliable discrimination between frozen unconsolidated rocks, and bedrock is difficult due to the large overlapping P-wave velocity ranges of permafrost (Draebing, 2016; Schrott and Hoffmann, 2008), volcanic rocks (Schön, 2011) and the limited resolution capacity in the lowest parts of the models. Due to the ambiguities of velocity patterns and resistivity distributions, the spatial delineations differ in some areas of the independently interpreted structures in the SRT and ERT profiles (cf. spatial variations of ice-rich permafrost and the active layer in Figs. 5 and 6). However, the comparison of SRT and ERT profiles also shows similar spatial patterns in the interpreted structures. Especially vertical structures and anomalies are displayed along all profiles (cf. Figs. 5 and 6). Both methods locally indicate the presence of water in unfrozen areas potentially affecting permafrost composition underneath. For example, vertical structures are indicated along the cross-profile C2 between 150 and 200 m (cf. Figs. 5b and 6b), where open crevasses on the surface show the rupturing of the rock glacier core and expose fine material (Fig. 2b) and where meltwater and groundwater could percolate.
Interpreted bedrock structures from SRT were transferred to the mixed-porosity model of the 4PM. The combined interpretation of ERT and SRT data is given in the following section.
4.3.3 4PM results and interpretations
The 4PM was applied to quantify the ice and water content of Dos Lenguas based on complementary ERT and SRT measurements. The model area and depth of the 4PM was spatially limited by the SRT data sets, due to the lower penetration depth of the P waves compared to the resistivity measurements along the profiles. The porosity variations of ice-rich permafrost and bedrock structures that were found within the interpreted ERT and SRT profiles were built into the mixed-porosity model. The spatial distribution of the ice and water content per porosity, i.e. the ice saturation and the water saturation, was further used to estimate the internal hydrological structure of the rock glacier. In general, the 4PM results show the heterogeneous material composition in the rock glacier (Figs. 7 and 8). The volumetric fractions of ice and water per porosity along the profiles are shown in the supplements for all porosity scenarios (Figs. S1–S16).
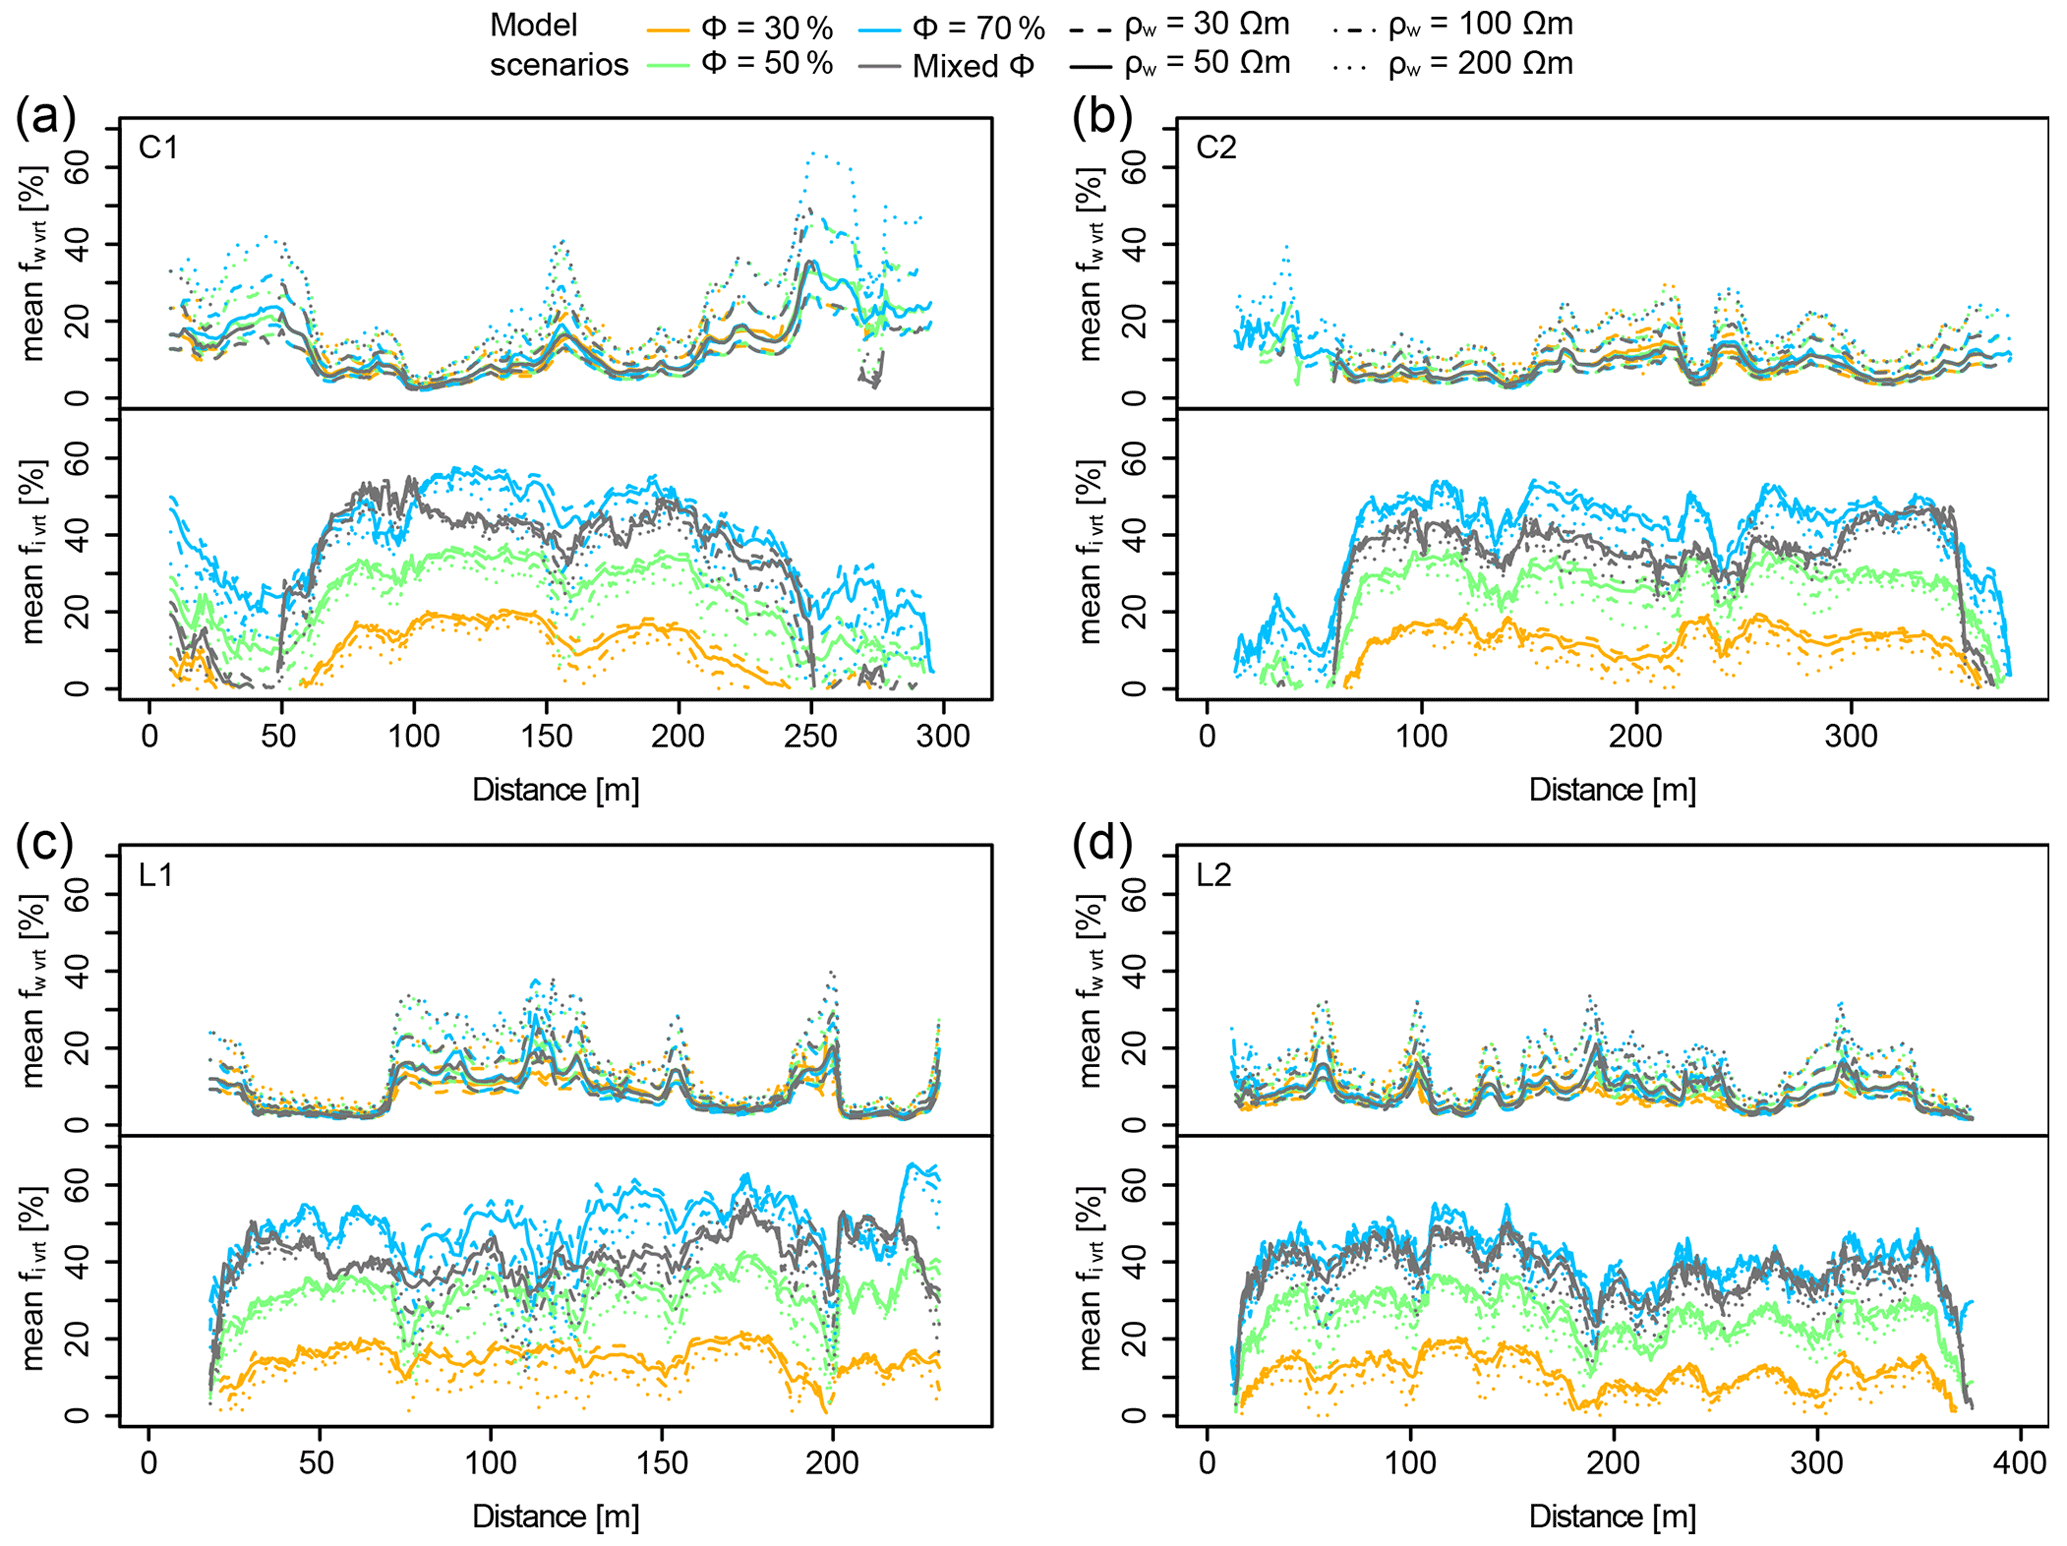
Figure 7Estimated mean vertical ice content (fi vrt) and mean vertical water content (fw vrt) along profiles (a) C1, (b) C2, (c) L1 and (d) L2 for all 4PM scenarios. The volumetric water (upper panel) and volumetric ice content (lower panel) of the 4PM model cells along the profiles were arithmetically averaged over the 4PM depth (vertical dimension) to compare the results of the various scenarios to each other. The porosity scenarios are colour-coded and combined with different line types representing the pore water resistivities used. The mixed-porosity (grey) and 70 % porosity scenarios (blue) with pore water resistivities of 30 and 50 Ω m were evaluated as most reasonable for the active rock glacier, since the range of mean vertical ice content indicates ice-supersaturated conditions (fi vrt > 40 %) and the mean vertical water content is mainly less than 10 %. The estimated ranges of the mean fi and mean fw of the plausible scenarios with uncertainties are given in Table 7 for each profile and for the extrapolated absolute ice and water content of the geomorphological units.
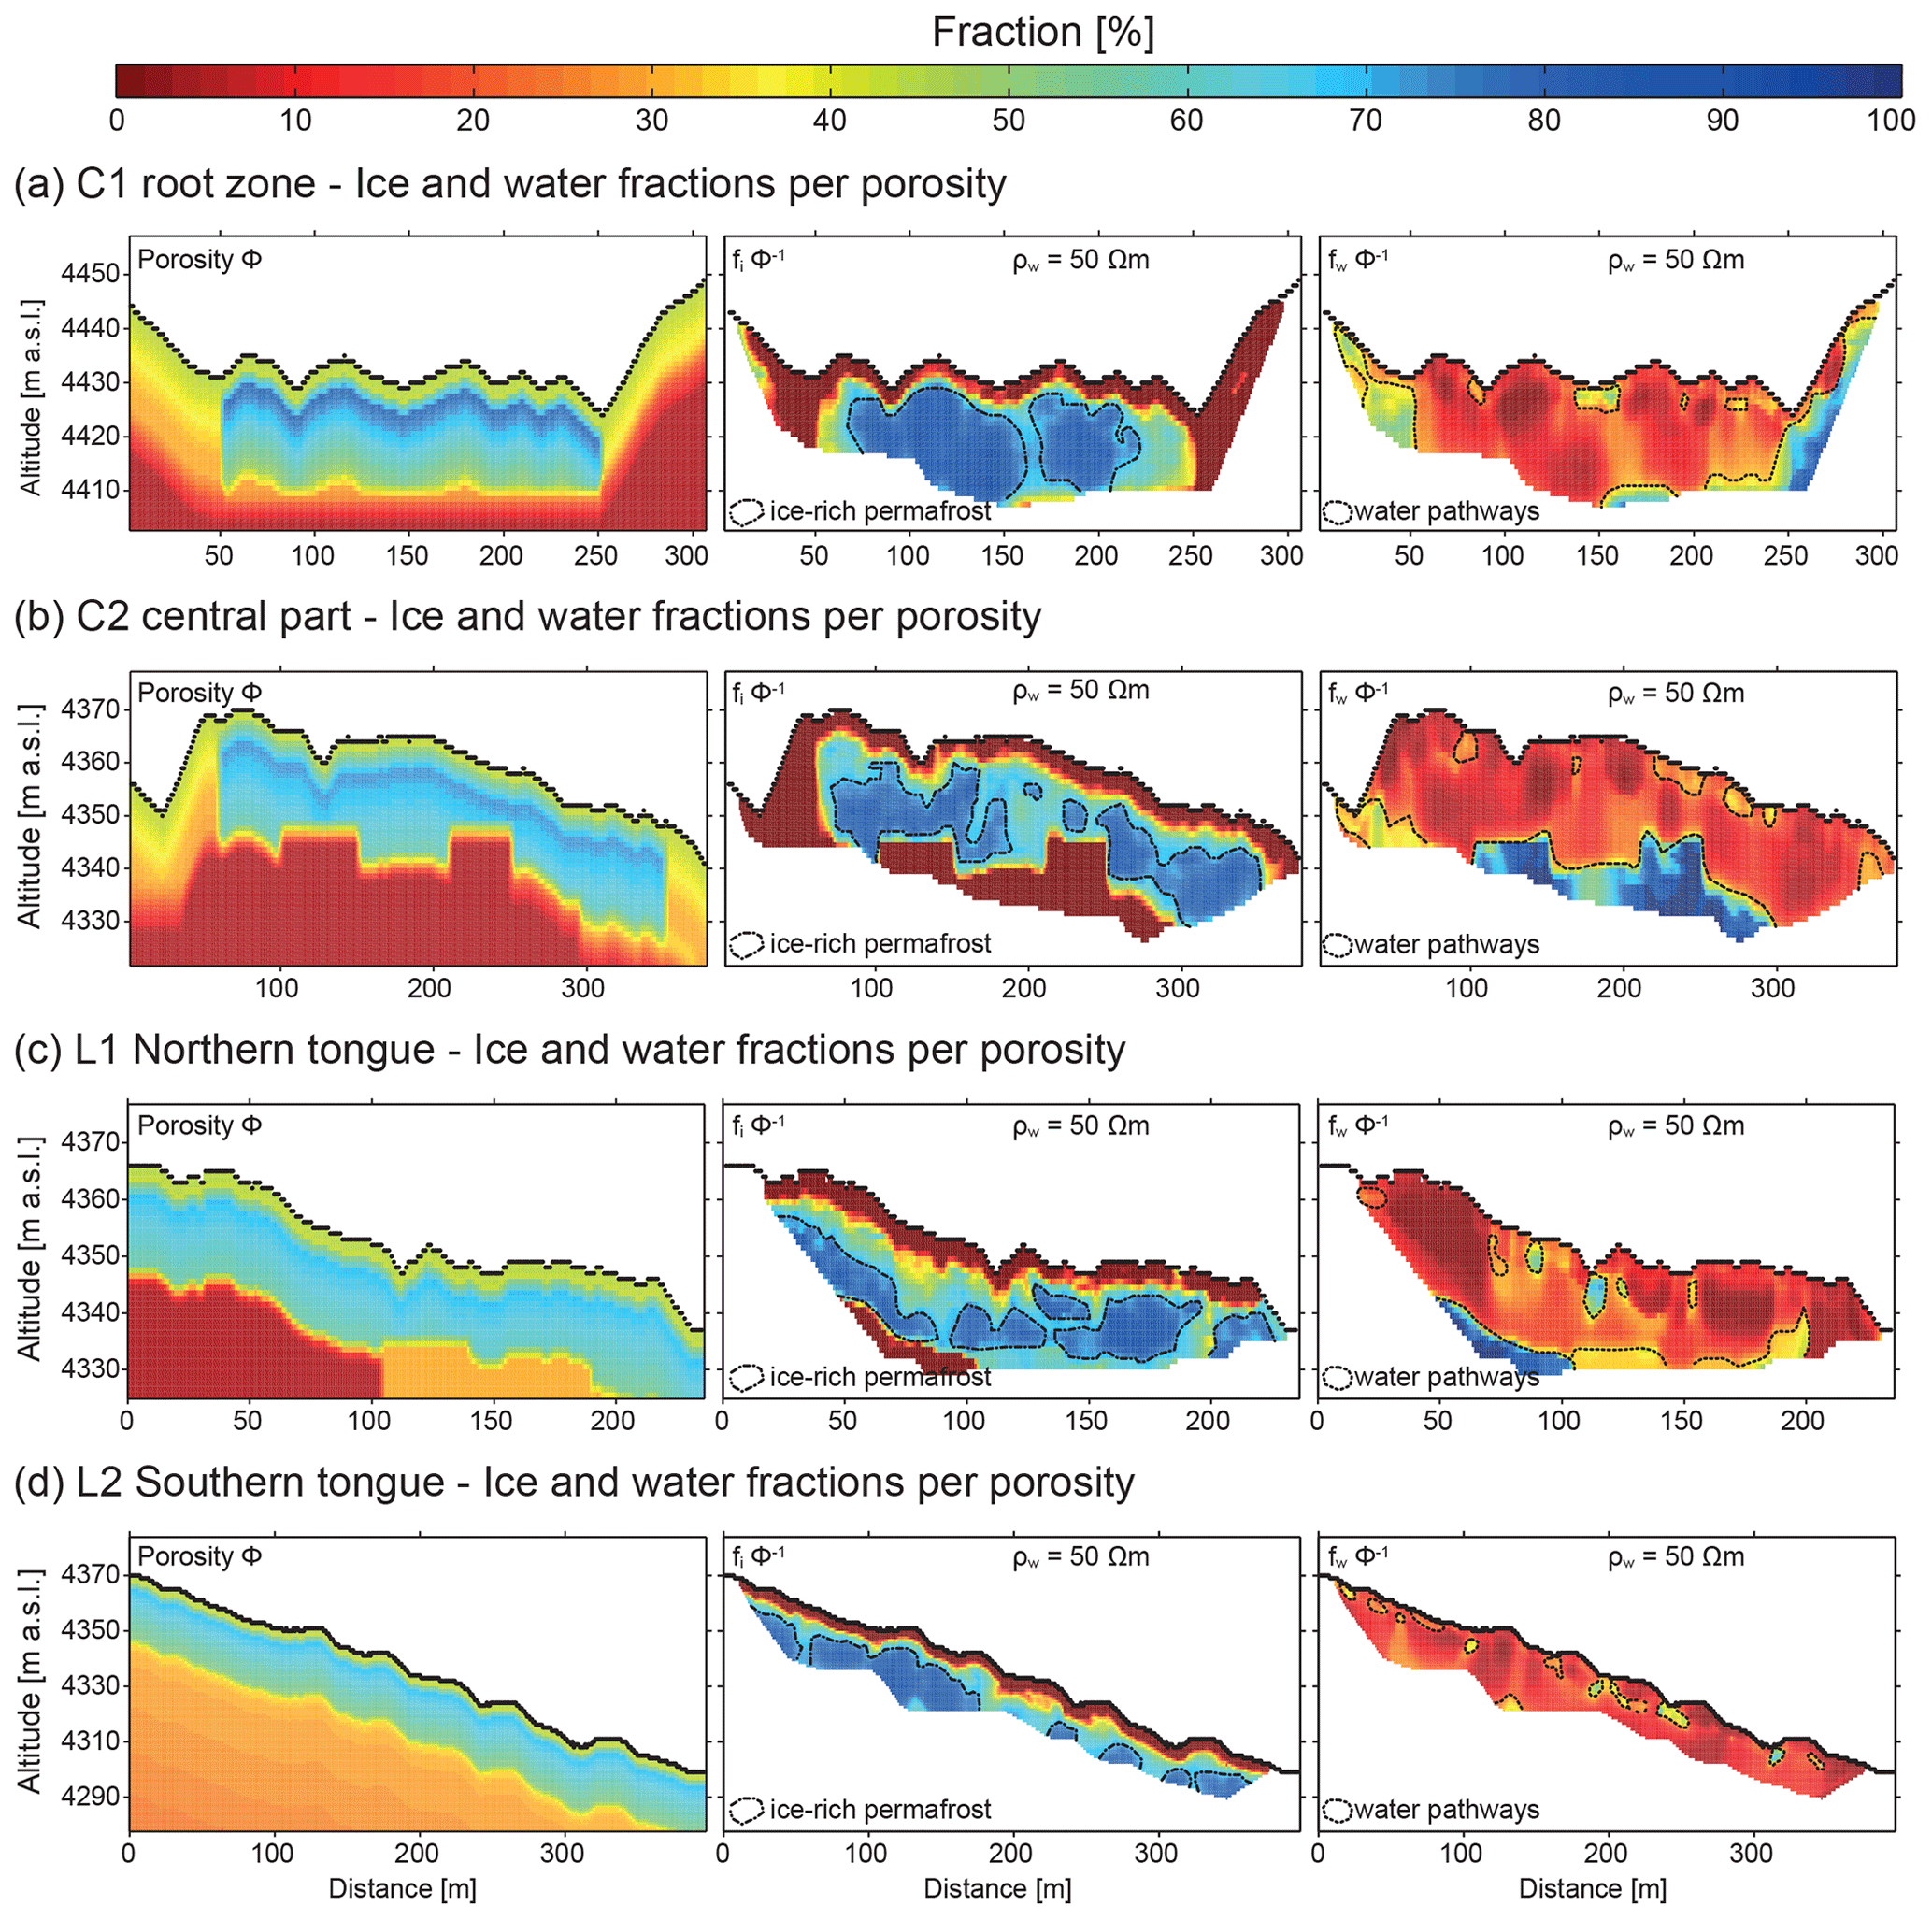
Figure 8Spatial distribution of ice and water content per porosity, i.e. ice and water saturations, of the 4PM scenario with the mixed-porosity model and pore water resistivities of 50 Ω m for (a) the cross-profile C1 in the root zone, (b) the cross-profile C2 in the central rock glacier area, (c) longitudinal profile L1 in the northern tongue and (d) longitudinal profile L2 in the southern tongue. Porosities of < 10 % represent potential bedrock occurrence based on SRT interpretations. Porosities of > 40 % allow ice-rich permafrost conditions in the 4PM. Ice content per porosity (fiΦ−1) shows heterogeneous distributions of ice-rich permafrost and indicates the active layer and unfrozen bedrock in the ice-free model. High water content per porosity (fwΦ−1) indicates water pathways and traps in the ice-free area, while increased water saturations between ice-rich permafrost could indicate aquitards and/or thawing permafrost in late summer. Note the different horizontal and vertical scales of the figures for the different profiles.
Table 7Mean fractions of ice, water and air content for different scenarios containing the minimum and maximum model for ice and water content and the scenario with mixed porosities for the anticipated internal structure and pore water resistivities from field measurements. The mean fractions are solely based on model cells below the rock glacier surface area (model areas outside the rock glacier were excluded). The ratio of numerically solved model cells to the total model domain gives the amount of physical consistent solutions of the different 4PM scenarios. Absolute ice and water content is estimated based on mean fi and fw along the profiles that were extrapolated to surface area and mean depth of permafrost. Longitudinal profile: long. profile.

1 Errors as the standard deviation. 2 Errors as the propagated uncertainties of fw and fi, permafrost thickness and surface area.
Along all profiles, the mean vertical ice content (fi vrt) and the mean vertical water content (fw vrt) of all scenarios show increasing volumetric ice content with higher porosity and increasing volumetric water content with higher pore water resistivity, respectively (Fig. 7). Modelled mean fw vrt data show local maxima, where reduced ice content occurs along the profiles. Mean fi vrt data range roughly from 5 % to 15 %, 20 % to 30 % and 40 % to 50 % for the uniform porosity models with 30 %, 50 % and 70 % porosity, respectively. The mixed-porosity model yielded intermediate values of volumetric ice content that range between the uniform 50 % and 70 % porosity models. The comparison of the mean vertical ice content (fi vrt) along the profiles indicates that the model scenarios with porosities less than or equal to 50 % do not yield ice-supersaturated conditions in the rock glacier.
The 4PM scenarios using the highest porosities and lowest pore water resistivities yielded the highest quantities of physically consistent numerical solutions, whereas scenarios with lower porosities and higher pore water resistivities yielded the lowest quantities of physically consistent numerical solutions (Table 7). Thus along all profiles, the scenario using ϕuniform=70 % and ρw=30 Ω m yielded the highest amount of physically consistent model solutions giving the highest volumetric ice content and lowest mean fraction of water. However, despite resulting in maximal physically consistent model solutions for all profiles, the respective model results showed substantial ice content within the active layer close to the surface, which is clearly unrealistic. Hence, the model scenario using variable porosities for the active layer, permafrost and bedrock were interpreted as the most plausible. This mixed-porosity model provided conservative estimates for fi, since these scenarios prevent overestimations caused by uniform porosity assumptions. Likewise, pore water resistivities of 30 and 50 Ω m were interpreted as most plausible, as the scenarios using higher pore water resistivities reduced the ice content, while the modelled water content in the active layer and permafrost were unreasonable high for the dry mountain environment. Thus, lower solved model cell ratios, relatively low mean ice content (< 40 %), and unreasonable high water content of the 4PM scenarios with ϕ≤50% and ρw≥100 Ω m were interpreted as not suitable and less plausible for an active rock glacier with displacement rates up to 2 m yr−1. Consequently, the scenario with ϕuniform=70 % and ρw=30 Ω m was interpreted as the maximum model for the ice content estimation, while the scenario with ϕmixed and ρw=50 Ω m represents conservative ice content estimates along the profiles. Based on these scenarios, the calculated mass of ice and water in the rock glacier ranges from 1.71 × 10⁹ kg (±42 %) to 2.00 × 10⁹ kg (±44 %) and from 0.36 × 10⁹ kg (±32 %) to 0.43 × 10⁹ kg (±32 %), respectively (Table 7).
The volumetric fractions of ice and water per porosity were used to infer the internal hydrological structure of Dos Lenguas towards the end of the thaw season (Fig. 8), as they indicate the spatial distribution of the active layer and ice-rich permafrost and areas influenced by shallow groundwater pathways and storages for the scenario with ϕmixed and ρw=50 Ωm. Ice-free model cells indicate the active-layer depth above model cells containing ice. Ice saturation varies spatially strongly from ∼ 30 % to 90 %. Modelled ice-rich permafrost (fi> 40 %) is dissected by permafrost conditions with lower volumetric ice content (fi< 40 %). Water saturations larger than 10 % show locations with moist to saturated conditions that occur preferentially beneath and close to depressions of longitudinal and transverse furrows. Water saturations less than 10 % indicate either relatively dry conditions of the active layer close to the surface or minor amounts of liquid water in permafrost. High water saturation (> 25 %) was interpreted as seasonal groundwater pathways and water traps in the rock glacier during summer thaw in potentially unfrozen areas (fi=0). Model areas with low volumetric ice content (fi < 40 %) and increased water saturation (> 10 %) could indicate that the frozen core of the rock glacier thaws locally during summer and therefore functions as an aquitard.
The spatial occurrence of increased groundwater content and thermokarst ponds indicate a strong influence of the ridge and furrow topography on the water pathways and traps within the rock glacier (cf. Figs. 8 and 9). Areas with high water saturations in profile C1 could indicate the presence of perched aquifers above permafrost (e.g. at ∼ 150 m in profile C1, Fig. 8a) below longitudinal furrows and groundwater pathways from adjacent talus slopes (Fig. 9) adding water to the root zone from the catchment above. Profile C2 indicates water pathways in the active layer and below the northern side slope and sub-permafrost or intra-permafrost flow paths where bedrock porosities have been implemented (Fig. 8b). Vertical structures with increased water and reduced ice saturations could indicate water pathways along crevasses in the central part of the profile, where Dos Lenguas starts to split up (Fig. 1b). The longitudinal profile L1 on the northern tongue shows water pathways and traps below compressional furrows and indicates water-saturated bedrock below ice-rich permafrost. Meltwater ponds next to L1 (Fig. 2) are consistent with modelled shallow groundwater content in the depressions. Profile L2 on the southern tongue indicates water pathways between compressional ridges in the active layer and increased water saturations between ice-rich permafrost. More details on the internal hydrological structure are discussed below in combination with interannual surface changes of the rock glacier.
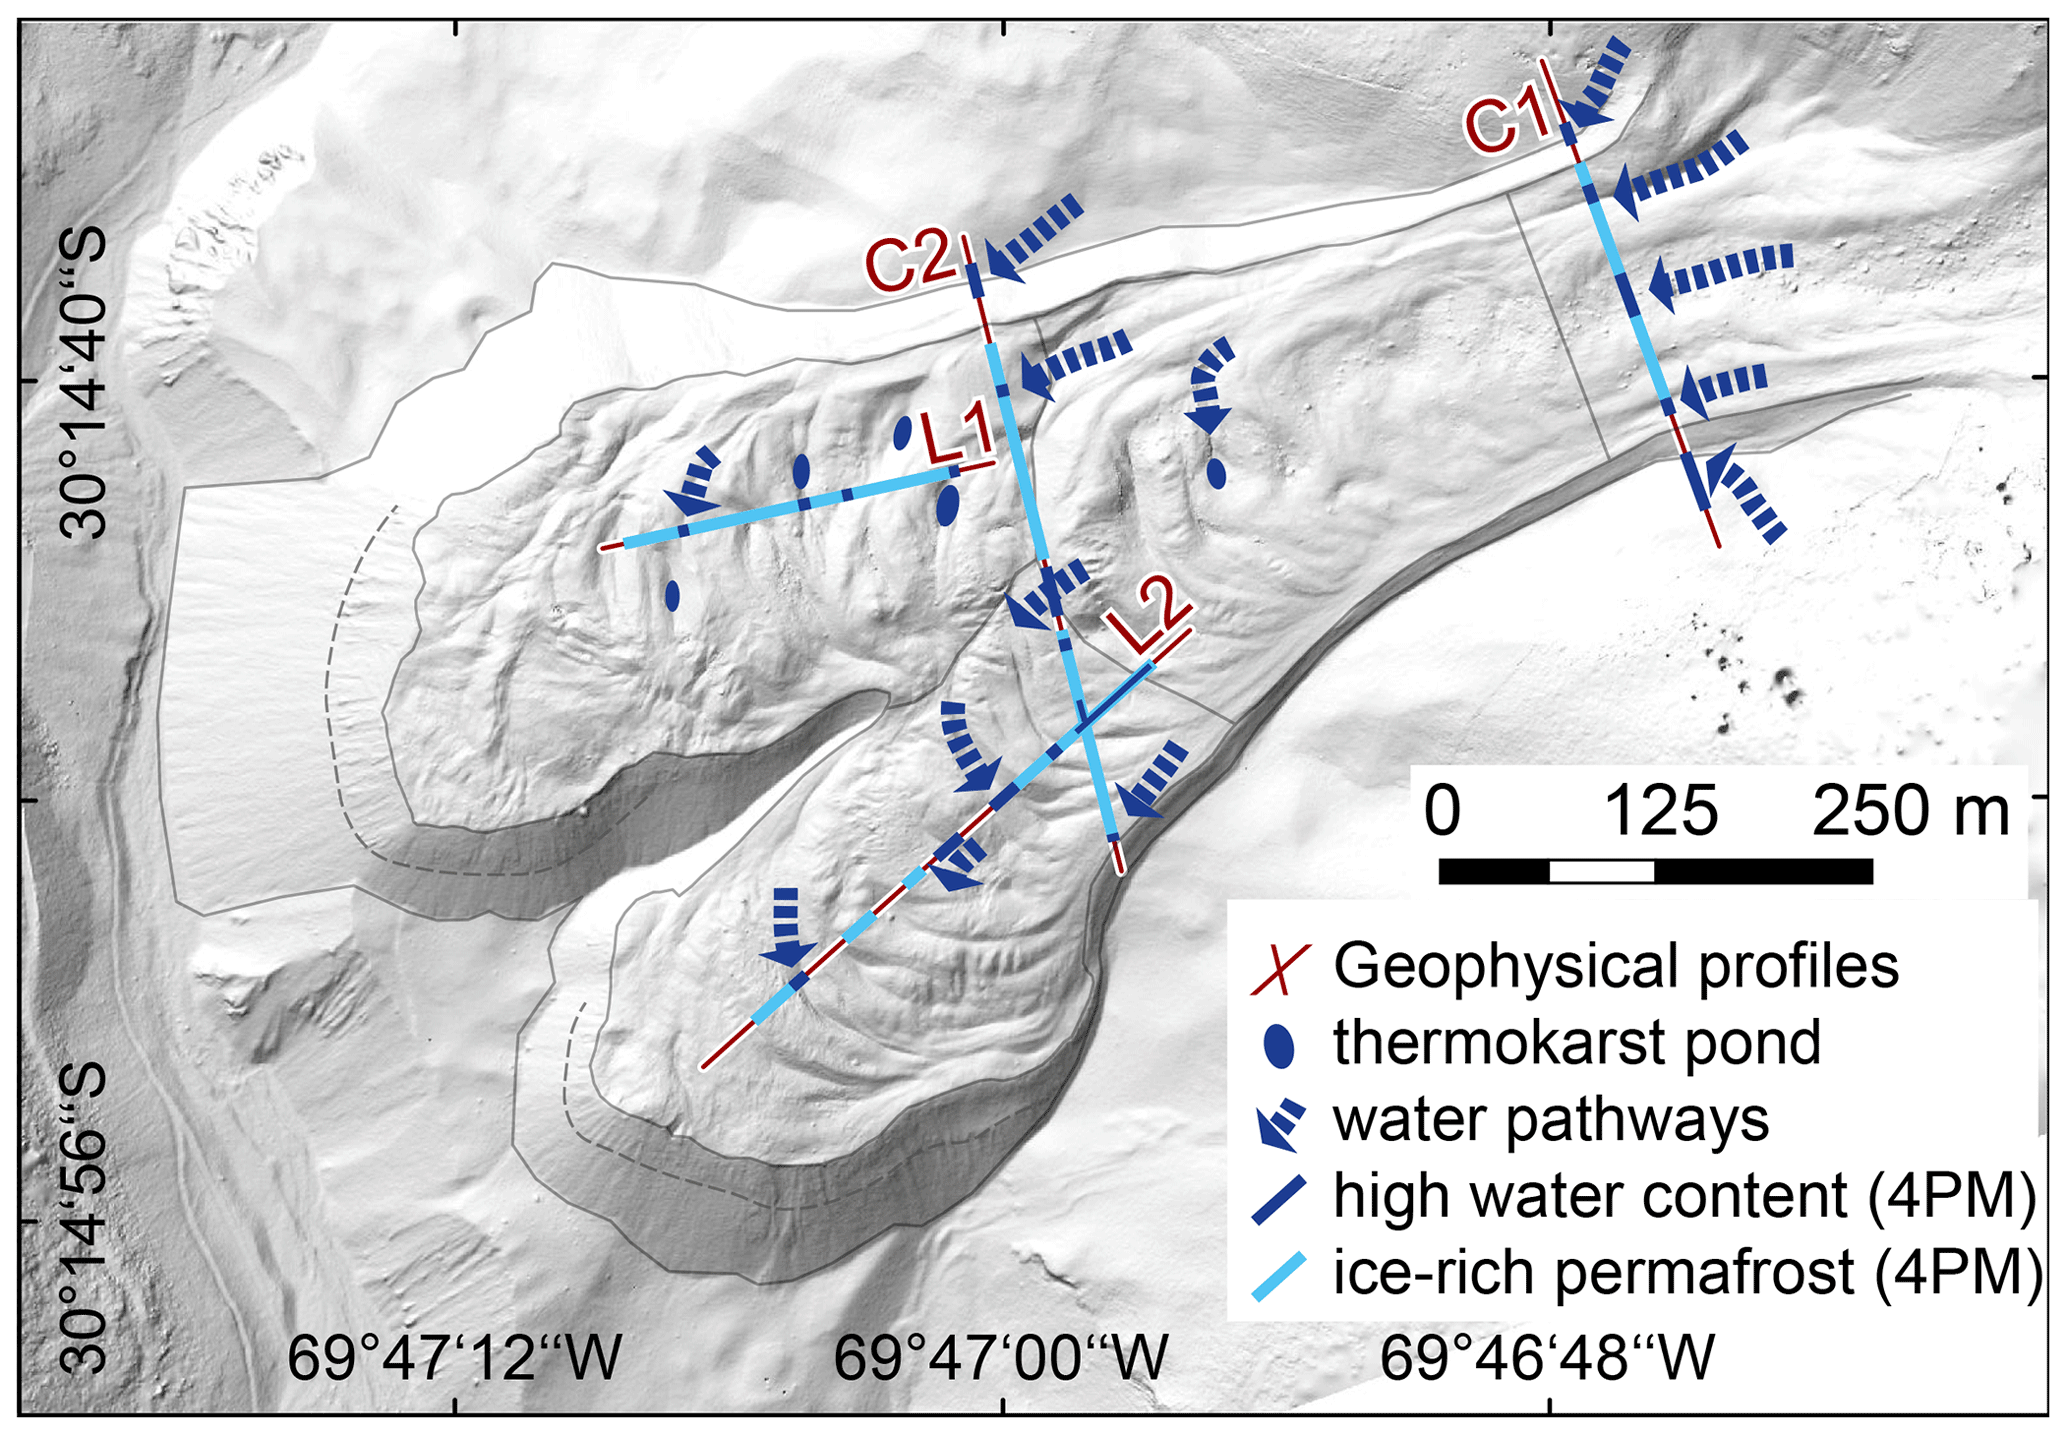
Figure 9Topographic positions of water pathways and ice-rich permafrost based on observed hydrological structures in the 4PM along the geophysical profiles (cf. Fig. 8). The spatial distribution of ice-rich permafrost, high water content, and interpreted water pathways in the subsurface indicate interrelations with the ridge and furrow topography and thermokarst ponds at the surface of Dos Lenguas. The dotted lines show the depth of the basal layers at both front slopes, which roughly corresponds to the thickness of ice-rich permafrost in the tongues.
5.1 Methodological discussion
5.1.1 Volumetric changes
The sum of positive and negative volumetric changes of the rock glacier surface gives a first-order estimate of interannual water storage changes due to seasonal freeze and thaw processes in the subsurface. Our results do not show a clear signal of positive and negative interannual changes in different morphological units of Dos Lenguas over the 2-year observation period (Fig. 10b).

Figure 10(a) Spatial interrelation of horizontal surface velocities along the central flow line; (b) negative and positive interannual storage changes (net balance) in 2016–2017 and 2017–2018, respectively; and (c) longitudinal sketch profiles (not to scale) along the central flow line topographies (scaled) of the northern (black) and southern (red) tongue, including the potential internal hydrologic structure with water traps and pathways in the active layer, as well as potential intra- and sub-permafrost drainage pathways. Volumetric chances due to seasonal freezing and thawing at the interface of an ice-rich permafrost table and a wet active-layer base could be locally enhanced by increased water content where meltwater is trapped in and along furrows, e.g. thermokarst ponds (see inset).
Our volumetric estimates exclude values that lie within the limits of detection of respective confidence intervals, translating to cut-off limits of ±0.368 and ±0.117 m for the 90 % confidence interval for 2016–2017 and 2017–2018, respectively (Table 6). Previous studies investigating the geodetic mass balance of rock glaciers have been conducted at the Gruben rock glacier (Kääb et al., 1997) and the Galena Creek rock glacier (Konrad et al., 1999). Assuming incompressibility of the Gruben rock glacier, vertical changes associated with the spatial variations of the flow regime have been estimated to attain magnitudes on the order of cm yr−1 (Kääb et al., 1997). Similarly, Konrad et al. (1999) estimated that vertical changes from differential ice gains and losses of the Galena Creek rock glacier are 1 order of magnitude greater than vertical changes induced by the flux of ice, assuming isotropic creep behaviour, ice thickness and no basal sliding of the rock glacier. Thus, our calculated interannual vertical changes based on values above the limit of detection are at least 1 order of magnitude greater than vertical changes expected from spatial variations of the flow regime. We are therefore confident that volumetric surface changes reliably estimate interannual water storage changes dominantly associated with ice gains and losses, though these might well incorporate minor contributions from three-dimensional creep deformations and/or changes in bulk densities of the rock glacier material (Kääb et al., 1998, 1997). The derived net changes in ground ice of −36 and 28 mm yr−1 of the 95 % confidence interval for the 2 observed hydrological years resulted in rather conservative estimates if compared to observed mean annual active-layer thickening of > 150 mm yr−1 at the Morenas Coloradas rock glacier complex in the Central Andes of Mendoza between 1992 and 2007 (Trombotto and Borzotta, 2009).
5.1.2 Geophysical approach
The 4PM approach was applied for a first quantitative approximation of the water and ice content of the active talus rock glacier Dos Lenguas in the semi-arid Andes of Argentina. In the absence of a priori information or calibration data from boreholes for the 4PM (Pellet et al., 2016), the most sensitive model parameters, Φ and ρw, were used to build scenarios to cover a plausible range of model estimations and to account for uncertainties arising from the heterogeneous material composition observed in drill cores of rock glaciers (Arenson et al., 2002). In combination with the large spatial coverage of the conducted two-dimensional geophysical surveys, this approach is considered to yield a plausible range of ice and water content for the whole rock glacier. Previous studies applying and testing the 4PM on rock glaciers showed that estimated ice and water content can be reasonably well delineated and are in good agreement with nearby boreholes and complementary data sets (Hauck et al., 2011; Mewes et al., 2017; Schneider et al., 2013).
However, several limitations accompanied the geophysical approach, which are mainly caused by the inherent ambiguity of ERT and SRT inversion and the uncertainties associated with the petrophysical relationships, as well as their free parameters, are used in the 4PM (Duvillard et al., 2018; Hauck et al., 2011; Mewes et al., 2017). In addition, the spatial resolution of the geophysical approach depends on the sensor spacing in the field in relation to the dimension of the observed layers and anomalies causing a trade-off between the spatial coverage of the landform (profile length and investigation depth) and the resolution capacity for small-scale structures in the model domain. Mewes et al. (2017) showed that the resolution capacity of the 4PM is suitable to detect hydrological structures and permafrost degradation in rock glaciers with sensor spacings comparable to the spacings used in this study (Tables 3 and 4). However they emphasize that the resolution capacity of vertical structures is generally good in the 4PM, whereas horizontal saturated layers may be overestimated due to inversion artefacts (Mewes et al., 2017).
With respect to the SRT input data, the accuracy or data misfit between our modelled and observed travel times of roughly 2 ms (Table 4) is in good accordance with SRT results from other permafrost investigations (Hilbich, 2010; Krautblatter and Draebing, 2014). However, modelled P-wave velocities towards the base of the tomograms are of lower confidences (Hilbich, 2010) due to generally decreasing ray densities with increasing depth that limit the interpretations of overlapping velocity ranges (Draebing, 2016; Schrott and Hoffmann, 2008) in the deepest model areas.
The overall quality of ERT data is very good considering the extreme rock glacier conditions, with mean absolute misfit errors of the inversion models between 5.1 % and 7.4 % with only 7.7 % filtered data points during processing (Table 3). We used the multiple-gradient measurement as input for the 4PM, as this configuration yields a higher spatial resolution of horizontal- and vertical-resistivity heterogeneities in the inversion models (Aizebeokhai and Oyeyemi, 2014) compared to the Wenner array (Dahlin and Zhou, 2004). Nevertheless, higher uncertainties remain in and below high-resistivity ice-rich permafrost (Hilbich et al., 2009) and towards lateral and lower boundaries of ERT profiles due to the low sensitivities in these model areas.
Vertical dimensions of water-saturated layers above the permafrost body can be overestimated in the 4PM due to inversion artefacts of ERT as demonstrated in Mewes et al. (2017). As a consequence, the thickness of the 4PM-derived water pathways or perched aquifers (Fig. 8) above aquitards and the respective calculated water content close to the surface could be overestimated where large resistivity contrasts (Fig. 5) occur, while in turn ice content might be underestimated in these model parts. However, almost water-saturated ground conditions (∼ 70 % fwΦ−1) close to the surface were only modelled at profile L2, where a thermokarst pond in the furrow next to the profile confirms saturated active-layer conditions (cf. Figs. 2 and 9). Besides that, only potential bedrock occurrences with low porosities indicate water-saturated conditions. Although these water-saturated ground conditions could be overestimated in their vertical dimension (Fig. 8), all other interpreted water pathways indicate unsaturated conditions with lower water saturations of < 50 %. Associated with these moist conditions at the transition from the active layer to permafrost, observed P-wave velocity patterns indicate relatively low permafrost velocities of 1500–2000 m s−1 (Fig. 6). This range of P-wave velocities correlates well with decreasing P-wave velocities of permafrost from austral summer to autumn ranging between 1500 and 2400 m s−1 compared to 3400 m s−1 during winter found at the neighbouring El Paso rock glacier (Croce and Milana, 2002). Thus, relatively low inverted velocities of < 2000 m s−1 may potentially indicate the seasonal influences of permafrost thaw and increased meltwater content at the permafrost table.
5.2 Spatial pattern and interrelations of internal hydrologic structures and surface kinematics
In order to relate spatial heterogeneities of the internal hydrologic structures of the rock glacier to the observed vertical and horizontal surface velocities, the following discussion is focused on the individual geomorphologic units.
5.2.1 Root zone
The cross-profile C1 reveals the influence of shallow groundwater on the ice content and the internal hydrologic structure of the root zone of the rock glacier (Fig. 8a). The 4PM results suggest that the central longitudinal depression at the surface of the rock glacier (horizontal distance of 150 m) acts as a trap and pathway for groundwater and meltwater from the contributing area above. Here, the relatively high water content in the active layer is in accordance with observed wet surface debris a few hours before the field measurements due to previous precipitation and snowmelt. While the rock glacier composition below this depression is characterized by reduced ice and elevated water content, areas below longitudinal ridges show ice-rich permafrost. This suggested interplay of reduced ice content and increased water content could be related to different processes: first, the highest surface velocities of 1.5–2 m yr−1 occur along the central flow line, characterizing an extensional flow regime with longitudinal furrows (Fig. 10). The extensional deformation potentially creates drainage pathways for meltwater and shallow groundwater from the active layer that infiltrates into the ground ice of the rock glacier (Ikeda et al., 2008), increasing the hydraulic conductivity of ice-rich permafrost and shifting the rock glacier body from an aquiclude towards an aquitard (Figs. 8 and 10). Second, increased water content could be related to local permafrost degradation, seasonal thawing or talik evolution due to localized effects of either conduction, radiation or advection effects of water or air (Haeberli et al., 2006; Luethi et al., 2017; Scherler et al., 2013). Negative and positive vertical changes in the root zone show a spatially heterogeneous pattern with ice gains and losses in 2016–2017 and in 2017–2018, respectively (Fig. 10). Therefore, homogeneous thaw settlement can be excluded from our data over the observation period 2016–2018 (Fig. 4), and it is more likely that locally increased water content points to water pathways below longitudinal furrows and/or seasonal-thaw effects induced by the micro-topography (Fig. 10). Besides internally developed water pathways in the active layer and permafrost, subsurface compositions of adjacent side slopes illustrate the influence of groundwater draining towards sub-permafrost flow paths from the side and talus slopes below the root zone of Dos Lenguas (horizontal distances of < 50 and > 250 m in Fig. 8a). The northern left part of the profile shows little ice remnants and shallow groundwater influences of the talus slope from the inactive rock glacier next to Dos Lenguas, while the lower parts of the southern talus slope depicts water-saturated conditions for assumed bedrock porosities in the 4PM.
The generally high horizontal velocities of > 1 m yr−1 in the root zone compared to the other geomorphological units could be related to ice-rich permafrost above bedrock and the steepest mean slopes of the surface and might be enhanced by increased water supply from the surface and catchment, which reduces resisting forces in shear layers due to positive pore water pressures (Kenner et al., 2017).
5.2.2 Central part
The influence of groundwater draining underneath the active rock glacier from the northern depression at the side slope is also suggested in the cross-profile C2 (Fig. 8b). High seismic velocities at 20 to 30 m depth below the surface indicate bedrock occurrences in the lower central part of the rock glacier that were incorporated in the mixed-porosity model of the 4PM, which indicates sub-permafrost water pathways in unfrozen and water-saturated bedrock. The permafrost body above bedrock shows vertical structures with increased water and reduced ice content illustrating water pathways along filled fissures and crevasses in the subsurface due to the splitting of the central rock glacier part into the northern and southern tongues (see also vertical structures of ERT and SRT in Figs. 5b and 6b, respectively). Locally, relatively high water content could indicate channelized unsaturated flow paths in the southern part of the profile.
The spatial pattern of horizontal surface velocities generally shows a decelerating trend approaching the tongues (Fig. 3), portraying the transition from extensional to compressional flow that is also expressed in a transition from longitudinal structures to transverse ridge and furrow topography. Further downslope, the moving rock glacier mass decelerates towards the less inclined northern tongue, while the surface velocities remain high in the direction of the southern tongue. As a consequence, lateral velocity contrasts of ∼ 0.5 m yr−1 cause the shear-induced tearing apart of the tongues in the lower central part of Dos Lenguas, which is also documented by longitudinal rupturing of transverse ridges with open crevasses at the surface (Fig. 2). These surface findings are corroborated by higher mean air content at C2 compared to C1 (cf. Table 7 and Figs. S1–S9 in the Supplement), indicating a thickening of the active layer and a lateral spread of the cross section from the root zone towards the lower central part.
The volumetric changes of 2017–2018 are increased in the central part (14 mm yr−1) compared to the root zone (1 mm yr−1). The spatial pattern of gains and losses illustrates higher volumetric changes along distinct transverse ridges and furrows in the lower part of the central area. Besides mimicking the advance of ridges and furrows (Kääb et al., 2003; Kääb and Weber, 2004), the small-scale topography might enhance differential ice gain and losses (Kääb et al., 1998) due to shading effects in furrows preventing direct sublimation of snow and vaporization of water. Thus, meltwater infiltration could be more efficient in furrows due to micro-topographic effects. In addition, shallow groundwater drainage along furrows (4PM) could be transferred to lower rock glacier areas and locally be trapped in the deepest parts of transverse furrows. This process is indicated by potential drainage pathways along furrows in C1 and C2 and a thermokarst pond with a delta in the central part (Fig. 2), as well as water traps in transverse furrows of both tongues (cf. Figs. 8, 9 and 10).
5.2.3 Tongues
Below the northern tongue our results indicate an extended bedrock occurrence from the central part further downslope. Ice-rich permafrost is dissected by areas with high water content, indicating water pathways along furrows (cf. Figs. 8 and 9). Here, 4PM results are in accordance with direct observations of thermokarst ponds occurring 20–30 m south of the profile, where meltwater is trapped and exposed at the surface in the deepest part of the furrows. This is similar to L2 on the southern tongue, where high water content indicates water pathways and water traps located in depressions in front of and behind compressional ridges. Moreover, gully-like structures on the surface perpendicular to transverse ridges and furrows indicate thermal erosion along meltwater pathways in the subsurface in some parts of the southern tongues (cf. Figs. 2, 8 and 9).
The flatter northern tongue, hosting numerous thermokarst ponds, shows the largest positive interannual storage change for 2017–2018 and is the only morphological unit of Dos Lenguas which gained ice over both observation years. The steeper southern tongue appeared to be in equilibrium between 2016 and 2018 with equal negative and positive interannual storage changes of 30 mm yr−1 in 2016–2017 and 2017–2018, respectively (Fig. 10). The increasing interannual storage changes from the root zone over the central parts to both tongues in 2017–2018 could reflect the role of drainage pathways and water traps in and along furrows. Longitudinal furrows could build more effective drainage pathways, transferring meltwater inputs downslope from steeper areas of the rock glacier. Decreasing mean surface slopes and a strong transverse ridge and furrow topography might better trap and collect inputs from drainage pathways and percolating water from the surface (precipitation and snowmelt). On both tongues, water pathways and water traps along transverse furrows (Figs. 9 and 10) overlap with the spatial pattern of locally increased volume gains and losses. Especially along transverse ridges and furrows with increased water content, meltwater and ground ice could interact at the permafrost table, potentially causing significant amounts of volumetric changes and respective vertical changes due to the seasonal thaw of an ice-rich permafrost table and/or refreezing of a wet active-layer bottom. The clear contrast in horizontal velocities between both tongues coincides with the overall slope gradient. While the steeply descending southern tongue experiences high horizontal velocities of 0.75–1.5 m yr−1, potentially enhanced by the influence of meltwater, the generally flatter northern tongue shows decelerated horizontal surface velocities (0.25–1.0 m yr−1), potentially also related to bedrock obstacles at the rock glacier bed. Whereas the southern tongue decelerates towards its front, the surface velocities of the northern tongue accelerate towards the steep frontal slope mimicking the creep behaviour of oversteepened cliffs (Cuffey and Paterson, 2010).
5.2.4 Front and side slopes
Surface velocities generally decrease towards the side and frontal slopes given the increase in friction, which indicates lower or no ice content within material accumulated at the outer margins. Lower to no ice content within the side slopes is also indicated in the 4PM-derived material composition of the cross-profiles C1 and C2.
The advancement of the rock glacier is reflected by volumetric changes and horizontal displacement at the front slopes. Here, two superimposed processes act: first, the upper front is oversteepened (> 35∘) by permafrost creep, and second, gravitational processes transfer debris to lower front-slope positions. The oversteepened advance of the upper slope shows increasing horizontal displacement rates towards the surface, indicating cumulative deformations of creeping permafrost. From digital topography we further delineate the approximate depth of the shear horizon below the surface (Figs. 2 and 9). Derived depths of 20–25 and 15–20 m below the surface at the northern and southern tongue, respectively, match roughly to observed depth ranges of ice-rich permafrost in ERT and 4PM profiles. Whether the stiff basal layer below the shear horizon and deeper parts of the rock glacier are frozen or unfrozen, potentially functioning as a sub-permafrost aquifer (Haeberli et al., 1998), or intra-permafrost aquifers in case of talik evolution (Kenner et al., 2017; Luethi et al., 2017), remains unclear judging from our data. However, our detected depths of ice-rich permafrost and calculated ice and water content in Dos Lenguas are in line with borehole data from active rock glaciers in the Alps which revealed that ice-rich permafrost and internal deformations occur mainly in and above shear zones in depths of less than ∼ 30 m (Arenson et al., 2002; Buchli et al., 2018; Haeberli et al., 1998; Kenner et al., 2017; Krainer et al., 2017). As a consequence, estimations of ice content in active rock glaciers should exclude side and front slopes, and the depth of ice-rich permafrost should be either limited (threshold of < 30 m depth) or based on observations. Taking this into account could in particular improve potential estimates of regional water storage capacities of rock glaciers that were based on area–thickness relationships (Azocar and Brenning, 2010; Jones et al., 2018a; Rangecroft et al., 2015) in order to avoid overestimations of ice-rich permafrost thicknesses in large rock glaciers.
Frontal advances by accumulated sediment at the frontal slopes revealed that Dos Lenguas efficiently transports, deposits and overruns sediments. Long-term sediment transfer and slope instabilities at the front of the northern tongue (Kummert et al., 2018) could further push the Agua Negra River towards the opposite valley side, putting the pass route at risk and/or building a rock glacier dam that endangers downstream infrastructures and modulates sediment and water transfer (Blöthe et al., 2019).
5.3 Water storage capacities and interannual changes
The overall long-term ice storage of this rock glacier ranges between 1.71 (±42 %) × 109 kg and −2 (±44 %) × 109 kg based on the mean volumetric fractions of the most reasonable evaluated 4PM scenarios (Table 7). The mean volumetric fraction of water at the end of the thaw period was 0.36 (±32 %)–0.43 (±32 %) × 109 kg (Table 7). If only the mean values of the two scenarios are compared, the water content is about one-fifth of the ice content. The latter estimate must be seen as an upper bound, due to the uncertainties in quantifying thin water layers from ERT data mentioned above. Therefore, the ratios of ice to water content suggest that the scenario with the highest porosity and the lowest pore water resistivity provides the most plausible volumetric fractions of ice (mean fi of 24 %–64 %) and water (mean fw of 2 %–15 %) in the rock glacier during the end of the summer. The material composition and the potential ratios between ice and water content could mean that a relatively large amount of groundwater and meltwater is available for ice and water storage exchanges in the rock glacier at the end of the thaw period.
Interannual storage changes derived from volumetric changes of −36 mm yr−1 (−8.92 × 10⁶ kg) in 2016–2017 and 28 mm yr−1 (6.64 × 10⁶ kg) in 2017–2018 correspond to only 2 %–4 % of the water content (using the mean fw as the upper bound) at the end of the thaw period. The small ratio of interannual ice storage changes with respect to the 4PM-derived water content suggests that (a) volumetric changes due to ground ice loss and gain can occur under very dry conditions and (b) the water content may be overestimated, given 4PM sensitivity and the wet ground conditions during the geophysical measurements. However, this small ratio could also mean that the majority of groundwater and meltwater passes along the water pathways through the rock glacier. Nevertheless, the interannual water storage changes of −36 mm yr−1 and +28 mm yr−1 of the 95 % confidence interval suggest that significant amounts of the mean to the maximum annual precipitation of 45–140 and 51–168 mm (cf. Table 2, CHIRPS-derived estimates; Funk et al., 2015) could have been released and stored in the active rock glacier during the hydrological years 2016–2017 and 2017–2018. The mass loss of −36 mm yr−1 corresponds to 25 %–80 % of the annual precipitation in the hydrological year 2016–2017. The ice gain of 28 mm yr−1 corresponds to 17 %–55 % of annual precipitation in the hydrological period 2017–2018. Higher maximum precipitations during the latter hydrological year could have contributed to the positive interannual storage changes in 2017–2018 compared to the hydrological year 2016–2017. The mean annual precipitations with less than 51 mm yr−1 of the 2 hydrological years (Table 2) do not show significant differences that could explain the positive and negative volumetric net changes in ice storage but would increase the significance of the interannual storage changes due to the dry meteorological conditions. Recorded ground surface temperatures of Dos Lenguas could indicate that the strongly fluctuating temperature regime (Fig. S17) could have additionally influenced the negative and positive interannual storage changes of Dos Lenguas in the years 2016–2017 and 2017–2018, respectively. During the thaw period 2016–2017 the temperature profile of monthly median ground surface temperatures shows an earlier beginning and a higher summer maximum compared to summer 2017–2018, which is characterized by a lower and later temperature maximum. The significantly lower amplitudes of the ground surface temperatures in winter 2016–2017 compared to winter 2017–2018 indicate that there was no damping of ground surface temperatures by snow in winter of 2017–2018. Consequently, the generally higher ground surface temperature during austral summer 2016–2017 could have led to the observed negative storage changes due to the deeper thaw penetration. In contrast, the ice gain during the hydrological year 2017–2018 might have been fostered by higher precipitation, more effective penetration of cold winter temperatures and smaller active-layer depths.
The measured discharge of 5–8 L s−1 from the Dos Lenguas spring found by Schrott (1996) would translate to a total of 64.8–103.7 × 10⁶ L for a 5-month-long thaw season. Due to the dry and cold meteorological conditions during winter, spring flow can be expected to be active only in summer. The discharge can be fuelled by precipitation, snowmelt, melting ground ice and sub-permafrost groundwater flow in the catchment area of the spring (2.7 km2), which includes rock glacier (0.36 km2) and the contribution area of the root zone (1.01 km2). The potential range of discharge averaged over the catchment area of the spring corresponds to an output of 24–38 mm during the thaw season. The potential discharge would thus be in the range of the mean precipitation input of 22 and 38 mm in the austral summer periods 2016–2017 and 2017–2018, respectively (Table 2). However, the higher mean and maximum precipitation of 45–168 mm of the full hydrological years 2016–2017 and 2017–2018 indicate that additional precipitation input could be released along other groundwater pathways or is temporarily stored in the hydrological system of the rock glacier and its catchment. The negative interannual storage of −8.92 × 10⁶ L in 2016–2017 of the rock glacier would potentially correspond to 9 %–14 % of the total discharge at the spring (65–104 × 106 L). The positive interannual storage change of 6.64 × 10⁶ L in 2017–2018 could have decreased the potential discharge about 6 %–10 %. The interannual storage changes due to freezing and thawing could therefore buffer the groundwater release and add or reduce groundwater flow during the course of the year.
Finally, about 11 %–42 % of the mean water content of the rock glacier could supply discharge at the rock glacier spring, since the estimated mean water content (mean fw corresponds to 244–570 × 106 L) was larger than the potential discharge at the spring during the thaw period. The remaining share of water content (58 %–89 %) could leave the internal hydrological system of the rock glacier along other water pathways and/or refill or exchange with groundwater stores in and below the rock glacier. Although the several uncertainties in the estimation of the different components of the water balance have to be kept in mind, the estimated ice and water storage capacities and the interannual storage changes demonstrate that (a) an active rock glacier like Dos Lenguas could play a crucial role in buffering and regulating seasonal groundwater flow and recharge, while (b) it constitutes a long-term ice storage in the dry high mountain catchment, where currently only 2.8 % of the surface area remains permanently covered with surface ice and snow. Given the widespread distribution (IANIGLA, 2018) and the slower response of active rock glaciers (Haeberli et al., 2006) to the predicted temperature increases in the dry Andes (Barnett et al., 2005) compared to down-wasting Andean glaciers (Braun et al., 2019), our results suggests that long-term water storages and seasonal buffers in ice-rich permafrost and the active layer, respectively, could become more important for Andean watersheds in the future.
Water storage capacities and their interannual changes were quantified for an active rock glacier in the semi-arid Andes of Argentina. For this, we jointly analysed surface changes and the material composition of different morphological units of the Dos Lenguas rock glacier. Based on digital elevation models and their derivatives from structure-from-motion multi-view stereo algorithms, horizontal and volumetric surface changes were calculated using motion tracking and elevation differences, respectively. Electrical resistivity and seismic refraction tomography data sets from field measurements were used as input data for a petrophysical model called the four-phase model (4PM). Ice and water content were quantified based on different scenarios of the most sensitive parameters used in the 4PM. Additionally, we used spatial heterogeneities of ice and water content to infer the internal hydrological structure of Dos Lenguas towards the end of the thaw season.
Based on these data sets we found that water pathways and traps in depressions and furrows and ice-rich permafrost below ridges indicate interactions of the distinct ridge and furrow topography with the internal hydrologic structure of the rock glacier. The role of drainage pathways and water traps along longitudinal and transverse furrows is also reflected by the net mass changes of ice in the downward direction. Horizontal surface deformations up to 2 m yr−1 prove the active status of the rock glacier. Our findings suggest that water storage capacities and interannual storage changes can be estimated despite the uncertainties arising from spatial heterogeneities and indirect measurements. We conclude that the ground ice content of 1.71 (±42 %)–2 (±44 %) × 109 kg and the interannual water storage changes of −36 mm yr−1 (−8.92 × 10⁶ kg) and 28 mm yr−1 (6.64 × 10⁶ kg) of the active rock glacier Dos Lenguas represent an important long-term water reservoir and seasonal water buffer in the upper Agua Negra valley; 25 %–80 % and 17 %–55 % of annual precipitation may have been released and buffered by interannual water storage changes during the summer period of 2016–2017 and 2017–2018, respectively. Interannual water storage changes correspond to 11 %–42 % of the potential discharge at the spring and 2 %–4 % of the water content of 0.36 (±32 %)–0.43 (±32 %) × 109 kg of the rock glacier at the end of the thaw period. The majority of water input and seasonal meltwater may leave the internal hydrological system of the rock glacier along other groundwater pathways. The estimated ice and water content and interannual water storage changes of the active rock glacier show exemplarily that rock glaciers and mountain permafrost can strongly influence the hydrology in sparsely glaciated and dry mountain catchments. The detection of basal layers at rock glacier fronts may help to better constrain depths and volumes of ice-rich permafrost for different rock glacier types and sizes and could further help to calibrate area–thickness relationships. Front and side slopes should be excluded from rock glacier areas to avoid overestimations of local and regional water storage capacities. This study closes an important knowledge gap with respect to the quantification of ice content and water storages changes of an active talus rock glacier in the dry Andes and can serve as a benchmark for further field-based approaches.
Yet, further monitoring approaches and field-based studies on rock glacier hydrology are necessary to elucidate quantities and the functioning of long- and short-term storage changes, as well as their interactions with catchment hydrology. The water storage capacities and hydrological contributions of active rock glaciers and ice-rich permafrost may become more and more important as potential water reservoirs and sources in dry mountain catchments due to changes of the cryosphere.
The data sets can be obtained on request to the authors.
The supplement related to this article is available online at: https://doi.org/10.5194/tc-15-1187-2021-supplement.
CHal designed the study, conducted fieldwork, collected and processed geophysical and SfM data, wrote the paper, and conceptualized the figures. JB collected and processed SfM data, helped with data processing, and conducted fieldwork. CTB and DT contributed to field logistics and data acquisition. CHi and CHau helped with geophysical data processing and analysis. LS conducted fieldwork, contributed to the study design and data acquisition, and obtained funding. All authors contributed to the revision of the text.
The authors declare that they have no conflict of interest.
We thank Lorenz Banzer, Henning Clemens, Nico Griesang, Friedrich Fröhlich, Gerrit Heinmüller, Thorsten Höser, Julius Isigkeit, Martin Mendoza, Floreana Miesen, David Morche, Agostina Ortiz and Simon Terweh for their help during fieldwork. We acknowledge Masaki Hayashi and Nicole Schaffer, as well as the editor, Francesca Pellicciotti, for their helpful comments and suggestions that improved the quality of the paper.
This research has been supported by the German Research Foundation (grant no. SCHR 648/3-1).
This paper was edited by Francesca Pellicciotti and reviewed by Masaki Hayashi, Nicole Schaffer, and one anonymous referee.
Aizebeokhai, A. P. and Oyeyemi, K. D.: The use of the multiple-gradient array for geoelectrical resistivity and induced polarization imaging, J. Appl. Geophys., 111, 364–376, https://doi.org/10.1016/j.jappgeo.2014.10.023, 2014.
Archie, G. E.: The Electrical Resistivity Log as an Aid in Determining Some Reservoir Characteristics, Petroleum Transactions of American Institute of Mining and Metallurgical Engineers (AIME), 146, 54–62, https://doi.org/10.2118/942054-G, 1942.
Arenson, L. and Springman, S.: Triaxial constant stress and constant strain rate tests on ice-rich permafrost samples, Can. Geotech. J., 42, 412–430, https://doi.org/10.1139/T04-111, 2005.
Arenson, L., Hoelzle, M., and Springman, S.: Borehole deformation measurements and internal structure of some rock glaciers in Switzerland, Permafrost Periglac., 13, 117–135, https://doi.org/10.1002/Ppp.414, 2002.
Arenson, L. U. and Jakob, M.: The Significance of Rock Glaciers in the Dry Andes – A Discussion of Azocar and Brenning (2010) and Brenning and Azocar (2010), Permafrost Periglac., 21, 282–285, https://doi.org/10.1002/Ppp.693, 2010.
Arenson, L. U., Pastore, S., Trombotto, D., Bolling, S., Quiroz, M. A., and Ochoa, X. L.: Characteristics of two rock glaciers in the dry Argentinean Andes based on initial surface investigations, in: Proceedings 6th Canadian Permafrost Conference, Calgary, Alberta, 2010.
Azocar, G. F. and Brenning, A.: Hydrological and Geomorphological Significance of Rock Glaciers in the Dry Andes, Chile (27–33∘ S), Permafrost Periglac., 21, 42–53, https://doi.org/10.1002/Ppp.669, 2010.
Barnett, T. P., Adam, J. C., and Lettenmaier, D. P.: Potential impacts of a warming climate on water availability in snow-dominated regions, Nature, 438, 303–309, 2005.
Barsch, D.: Rockglaciers: indicators for the present and former geoecology in high mountain environments, Springer, Berlin, 331 pp., 1996.
Berthling, I.: Beyond confusion: Rock glaciers as cryo-conditioned landforms, Geomorphology, 131, 98–106, https://doi.org/10.1016/j.geomorph.2011.05.002, 2011.
Blöthe, J. H., Rosenwinkel, S., Höser, T., and Korup, O.: Rock-glacier dams in High Asia, Earth Surf. Proc. Land., 44, 808–824, https://doi.org/10.1002/esp.4532, 2019.
Bradley, R. S., Vuille, M., Diaz, H. F., and Vergara, W.: Threats to water supplies in the tropical Andes, Science, 312, 1755–1756, 2006.
Brasington, J., Langham, J., and Rumsby, B.: Methodological sensitivity of morphometric estimates of coarse fluvial sediment transport, Geomorphology, 53, 299–316, https://doi.org/10.1016/S0169-555X(02)00320-3, 2003.
Braun, M. H., Malz, P., Sommer, C., Farías-Barahona, D., Sauter, T., Casassa, G., Soruco, A., Skvarca, P., and Seehaus, T. C.: Constraining glacier elevation and mass changes in South America, Nat. Clim. Change, 9, 130–136, https://doi.org/10.1038/s41558-018-0375-7, 2019.
Brenning, A.: Geomorphological, hydrological and climatic significance of rock glaciers in the Andes of Central Chile (33–35∘ S), Permafrost Periglac., 16, 231–240, https://doi.org/10.1002/Ppp.528, 2005.
Brenning, A.: The significance of rock glaciers in the dry Andes – reply to Arenson, L. and Jakob, M., Permafrost Periglac., 21, 286–288, https://doi.org/10.1002/ppp.702, 2010.
Buchli, T., Kos, A., Limpach, P., Merz, K., Zhou, X., and Springman, S. M.: Kinematic investigations on the Furggwanghorn Rock Glacier, Switzerland, Permafrost Periglac., 29, 3–20, https://doi.org/10.1002/ppp.1968, 2018.
Burger, K. C., Degenhardt Jr., J. J., and Giardino, J. R.: Engineering geomorphology of rock glaciers, Geomorphology, 31, 93–132, https://doi.org/10.1016/S0169-555X(99)00074-4, 1999.
CEAZA: Datos provistos por CEAZA, available at: http://www.ceazamet.cl (last access: 21 January 2020), 2019.
Cicoira, A., Beutel, J., Faillettaz, J., and Vieli, A.: Water controls the seasonal rhythm of rock glacier flow, Earth Planet. Sc. Lett., 528, 115844, https://doi.org/10.1016/j.epsl.2019.115844, 2019.
Colombo, N., Salerno, F., Gruber, S., Freppaz, M., Williams, M., Fratianni, S., and Giardino, M.: Review: Impacts of permafrost degradation on inorganic chemistry of surface fresh water, Global Planet. Change, 162, 69–83, 2018a.
Colombo, N., Sambuelli, L., Comina, C., Colombero, C., Giardino, M., Gruber, S., Viviano, G., Antisari, L. V., and Salerno, F.: Mechanisms linking active rock glaciers and impounded surface water formation in high-mountain areas, Earth Surf. Proc. Land., 43, 417–431, https://doi.org/10.1002/esp.4257, 2018b.
Corte, A.: The Hydrological Significance of Rock Glaciers, J. Glaciol., 17, 157–158, https://doi.org/10.3189/S0022143000030859, 1976.
Corte, A.: Rock glaciers as permafrost bodies with a debris cover as an active layer, A hydrological approach, Andes of Mendoza, Argentina, Proceedings of the Third International Conference on Permafrost, Edmonton, Alberta, Canada, National Research Council of Canada, Ottawa, 262–269, 1978.
Croce, F. A. and Milana, J. P.: Internal structure and behaviour of a rock glacier in the arid Andes of Argentina, Permafrost Periglac., 13, 289–299, https://doi.org/10.1002/ppp.431, 2002.
Cuffey, K. M. and Paterson, W. S. B.: The physics of glaciers, Academic Press, Springer, Berlin, 331 pp., 2010.
Dahlin, T. and Zhou, B.: A numerical comparison of 2D resistivity imaging with 10 electrode arrays, Geophys. Prospect., 52, 379–398, https://doi.org/10.1111/j.1365-2478.2004.00423.x, 2004.
Dall'Asta, E., Forlani, G., Roncella, R., Santise, M., Diotri, F., and Morra di Cella, U.: Unmanned Aerial Systems and DSM matching for rock glacier monitoring, ISPRS J. Photogramm., 127, 102–114, https://doi.org/10.1016/j.isprsjprs.2016.10.003, 2017.
Draebing, D.: Application of refraction seismics in alpine permafrost studies: A review, Earth-Sci. Rev., 155, 136–152, https://doi.org/10.1016/j.earscirev.2016.02.006, 2016.
Drewes, J., Moreiras, S., and Korup, O.: Permafrost activity and atmospheric warming in the Argentinian Andes, Geomorphology, 323, 13–24, https://doi.org/10.1016/j.geomorph.2018.09.005, 2018.
Duguay, M. A., Edmunds, A., Arenson, L. U., and Wainstein, P. A.: Quantifying the significance of the hydrological contribution of a rock glacier – A review, in: GEOQuébec 2015: Challenges From North to South, 68th Canadian Geotechnical Conference and 7th Canadian Permafrost Conference, Québec, Canada, 2015.
Dussaillant, I., Berthier, E., Brun, F., Masiokas, M., Hugonnet, R., Favier, V., Rabatel, A., Pitte, P., and Ruiz, L.: Two decades of glacier mass loss along the Andes, Nat. Geosci., 12, 802–808, https://doi.org/10.1038/s41561-019-0432-5, 2019.
Duvillard, P. A., Revil, A., Qi, Y., Soueid Ahmed, A., Coperey, A., and Ravanel, L.: Three-Dimensional Electrical Conductivity and Induced Polarization Tomography of a Rock Glacier, J. Geophys. Res.-Sol. Ea., 123, 9528–9554, https://doi.org/10.1029/2018JB015965, 2018.
Förstner, W.: A feature based correspondence algorithm for image matching, International Archives of Photogrammetry and Remote Sensing, 26, 150–166, 1986.
Funk, C., Peterson, P., Landsfeld, M., Pedreros, D., Verdin, J., Shukla, S., Husak, G., Rowland, J., Harrison, L., Hoell, A., and Michaelsen, J.: The climate hazards infrared precipitation with stations – a new environmental record for monitoring extremes, Scientific Data, 2, 150066, https://doi.org/10.1038/sdata.2015.66, 2015.
Geiger, S. T., Daniels, J. M., Miller, S. N., and Nicholas, J. W.: Influence of rock glaciers on stream hydrology in the La Sal Mountains, Utah, Arct. Antarct. Alp. Res., 46, 645–658, https://doi.org/10.1657/1938-4246-46.3.645, 2014.
Haeberli, W., Hoelzle, M., Kääb, A., Keller, F., Vonder Mühll, D., and Wagner, S.: Ten years after drilling through the permafrost of the active rock glacier Murtèl, eastern Swiss Alps: answered questions and new perspectives, in: Collection Nordicana, 7th International Conference on Permafrost, 23–27 June 1998, edited by: Lewkowicz, A. G., and Allard, M., Université Laval, Yellowknife, Canada, 403–410, 1998.
Haeberli, W., Hallet, B., Arenson, L., Elconin, R., Humlun, O., Kaab, A., Kaufmann, V., Ladanyi, B., Matsuoka, N., Springman, S., and Von der Mühll, D.: Permafrost creep and rock glacier dynamics, Permafrost Periglac., 17, 189–214, https://doi.org/10.1002/ppp.561, 2006.
Harrington, J. S., Hayashi, M., and Kurylyk, B. L.: Influence of a rock glacier spring on the stream energy budget and cold-water refuge in an alpine stream, Hydrol. Process., 31, 4719–4733, https://doi.org/10.1002/hyp.11391, 2017.
Harrington, J. S., Mozil, A., Hayashi, M., and Bentley, L. R.: Groundwater flow and storage processes in an inactive rock glacier, Hydrol. Process., 32, 3070–3088, 2018.
Hauck, C.: New Concepts in Geophysical Surveying and Data Interpretation for Permafrost Terrain, Permafrost Periglac., 24, 131–137, https://doi.org/10.1002/ppp.1774, 2013.
Hauck, C. and Kneisel, C.: Applied Geophysics in Periglacial Environments, Cambridge University Press, Cambridge, UK, 256 pp., 2008.
Hauck, C., Böttcher, M., and Maurer, H.: A new model for estimating subsurface ice content based on combined electrical and seismic data sets, The Cryosphere, 5, 453–468, https://doi.org/10.5194/tc-5-453-2011, 2011.
Hausmann, H., Krainer, K., Bruckl, E., and Mostler, W.: Internal structure and ice content of reichenkar rock glacier (Stubai Alps, Austria) assessed by geophysical investigations, Permafrost Periglac., 18, 351–367, https://doi.org/10.1002/Ppp.601, 2007.
Heredia, N., Rodrıìguez Fernández, L. R., Gallastegui, G., Busquets, P., and Colombo, F.: Geological setting of the Argentine Frontal Cordillera in the flat-slab segment (30∘00′–31∘30′ S latitude), J. S. Am. Earth Sci., 15, 79–99, https://doi.org/10.1016/S0895-9811(02)00007-X, 2002.
Heredia, N., Farias, P., García-Sansegundo, J., and Giambiagi, L.: The basement of the Andean Frontal Cordillera in the Cordón del Plata (Mendoza, Argentina): Geodynamic evolution, Andean. Geol., 39, 242–257, https://doi.org/10.5027/andgeoV39n2-a03, 2012.
Hilbich, C.: Time-lapse refraction seismic tomography for the detection of ground ice degradation, The Cryosphere, 4, 243–259, https://doi.org/10.5194/tc-4-243-2010, 2010.
Hilbich, C., Hauck, C., Hoelzle, M., Scherler, M., Schudel, L., Voelksch, I., Muehll, D. V., and Maeusbacher, R.: Monitoring mountain permafrost evolution using electrical resistivity tomography: A 7-year study of seasonal, annual, and long-term variations at Schilthorn, Swiss Alps, J. Geophys. Res.-Earth, 113, F01S90, https://doi.org/10.1029/2007jf000799, 2008.
Hilbich, C., Marescot, L., Hauck, C., Loke, M. H., and Mäusbacher, R.: Applicability of electrical resistivity tomography monitoring to coarse blocky and ice-rich permafrost landforms, Permafrost Periglac., 20, 269–284, https://doi.org/10.1002/ppp.652, 2009.
IANIGLA: Data provided by Instituto Argentino de Nivología, Glaciología y Ciencias Ambientales (IANIGLA), “Agua Negra” and “Diaguita” meteorological stations, available at: http://bdhi.hidricosargentina.gob.ar (last access: 21 January 2020), 2019.
IANIGLA: Inventario Nacional de Glaciares, Informe de la subcuenca río Blanco Superior, Cuenca del río Jáchal, IANIGLA-CONICET, Ministerio de Ambiente y Desarrollo Sustentable de la Nación, Argentina, 65 pp., 2018.
Ikeda, A.: Combination of conventional geophysical methods for sounding the composition of rock glaciers in the Swiss Alps, Permafrost Periglac., 17, 35–48, https://doi.org/10.1002/Ppp.550, 2006.
Ikeda, A., Matsuoka, N., and Kaab, A.: Fast deformation of perennially frozen debris in a warm rock glacier in the Swiss Alps: An effect of liquid water, J. Geophys. Res.-Earth, 113, F01021, https://doi.org/10.1029/2007jf000859, 2008.
Jones, D. B., Harrison, S., Anderson, K., and Betts, R. A.: Mountain rock glaciers contain globally significant water stores, Sci. Rep.-UK, 8, 2834, https://doi.org/10.1038/s41598-018-21244-w, 2018a.
Jones, D. B., Harrison, S., Anderson, K., Selley, H. L., Wood, J. L., and Betts, R. A.: The distribution and hydrological significance of rock glaciers in the Nepalese Himalaya, Global Planet. Change, 160, 123–142, https://doi.org/10.1016/j.gloplacha.2017.11.005, 2018b.
Jones, D. B., Harrison, S., Anderson, K., and Whalley, W. B.: Rock glaciers and mountain hydrology: A review, Earth-Sci. Rev., 193, 66–90, https://doi.org/10.1016/j.earscirev.2019.04.001, 2019.
Kääb, A. and Weber, M.: Development of transverse ridges on rock glaciers: Field measurements and laboratory experiments, Permafrost Periglac., 15, 379–391, 2004.
Kääb, A., Haeberli, W., and Gudmundsson, G. H.: Analysing the creep of mountain permafrost using high precision aerial photogrammetry: 25 years of monitoring Gruben Rock Glacier, Swiss Alps, Permafrost Periglac., 8, 409–426, 1997.
Kääb, A., Gudmundsson, G. H., and Hoelzle, M.: Surface deformation of creeping mountain permafrost, Photogrammetric investigations on rock glacier Murtèl, Swiss Alps, in: Collection Nordicana, 7th International Conference on Permafrost, 23–27 June 1998, edited by: Lewkowicz, A. G., and Allard, M., Université Laval, Yellowknife, Canada, 531–537, 1998.
Kääb, A., Kaufmann, V., Ladstädter, R., and Eiken, T.: Rock glacier dynamics: Implications from high-resolution measurements of surface velocity fields, Permafrost. Proceedings of the 8th International Conference on Permafrost, 21–25 July 2003, Zurich, Switzerland, edited by: Phillips, M., Springman, S. M. and Arenson, L. U., A.A. Balkema, Lisse, 501–506, 2003.
Kääb, A., Frauenfelder, R., and Roer, I.: On the response of rockglacier creep to surface temperature increase, Global Planet. Change, 56, 172–187, https://doi.org/10.1016/j.gloplacha.2006.07.005, 2007.
Kenner, R., Phillips, M., Beutel, J., Hiller, M., Limpach, P., Pointner, E., and Volken, M.: Factors Controlling Velocity Variations at Short-Term, Seasonal and Multiyear Time Scales, Ritigraben Rock Glacier, Western Swiss Alps, Permafrost Periglac., 28, 675–684, https://doi.org/10.1002/ppp.1953, 2017.
Kenner, R., Pruessner, L., Beutel, J., Limpach, P., and Phillips, M.: How rock glacier hydrology, deformation velocities and ground temperatures interact: Examples from the Swiss Alps, Permafrost Periglac., 31, 3–14, https://doi.org/10.1002/ppp.2023, 2020.
King, M. S., Zimmerman, R. W., and Corwin, R. F.: Seismic and Electrical Properties of Unconsolidated Permafrost, Geophys. Prospect., 36, 349–364, https://doi.org/10.1111/j.1365-2478.1988.tb02168.x, 1988.
Konrad, S. K., Humphrey, N. F., Steig, E. J., Clark, D. H., Potter Jr., N., and Pfeffer, W. T.: Rock glacier dynamics and paleoclimatic implications, Geology, 27, 1131–1134, https://doi.org/10.1130/0091-7613(1999)027<1131:rgdapi>2.3.co;2, 1999.
Krainer, K. and Mostler, W.: Hydrology of active rock glaciers: Examples from the Austrian Alps, Arct. Antarct. Alp. Res., 34, 142–149, https://doi.org/10.2307/1552465, 2002.
Krainer, K., Mostler, W., and Spötl, C.: Discharge from active rock glaciers, Austrian Alps: a stable isotope approach, Austrian J. Earth Sci., 100, 102–112, 2007.
Krainer, K., Bressan, D., Dietre, B., Haas, J. N., Hajdas, I., Lang, K., Mair, V., Nickus, U., Reidl, D., Thies, H., and Tonidandel, D.: A 10 300-year-old permafrost core from the active rock glacier Lazaun, southern Ötztal Alps (South Tyrol, northern Italy), Quaternary Res., 83, 324–335, https://doi.org/10.1016/j.yqres.2014.12.005, 2017.
Krautblatter, M. and Draebing, D.: Pseudo 3D P wave refraction seismic monitoring of permafrost in steep unstable bedrock, J. Geophys. Res.-Earth, 119, 287–299, https://doi.org/10.1002/2012jf002638, 2014.
Kummert, M., Delaloye, R., and Braillard, L.: Erosion and sediment transfer processes at the front of rapidly moving rock glaciers: Systematic observations with automatic cameras in the western Swiss Alps, Permafrost Periglac., 29, 21–33, 2018.
Langston, G., Bentley, L. R., Hayashi, M., McClymont, A., and Pidlisecky, A.: Internal structure and hydrological functions of an alpine proglacial moraine, Hydrol. Process., 25, 2967–2982, https://doi.org/10.1002/hyp.8144, 2011.
Lecomte, K. L., Milana, J. P., Formica, S. M., and Depetris, P. J.: Hydrochemical appraisal of ice- and rock-glacier meltwater in the hyperarid Agua Negra drainage basin, Andes of Argentina, Hydrol. Process., 22, 2180–2195, https://doi.org/10.1002/Hyp.6816, 2008.
Loke, M. H.: Tutorial : 2D and 3D electrical imaging surveys, Geotomo Software, Malaysia, 2018.
Luethi, R., Phillips, M., and Lehning, M.: Estimating Non-Conductive Heat Flow Leading to Intra-Permafrost Talik Formation at the Ritigraben Rock Glacier (Western Swiss Alps), Permafrost Periglac., 28, 183–194, https://doi.org/10.1002/ppp.1911, 2017.
Malmros, J. K., Mernild, S. H., Wilson, R., Tagesson, T., and Fensholt, R.: Snow cover and snow albedo changes in the central Andes of Chile and Argentina from daily MODIS observations (2000–2016), Remote Sens. Environ., 209, 240–252, https://doi.org/10.1016/j.rse.2018.02.072, 2018.
Marescot, L., Loke, M., Chapellier, D., Delaloye, R., Lambiel, C., and Reynard, E.: Assessing reliability of 2D resistivity imaging in mountain permafrost studies using the depth of investigation index method, Near Surf. Geophys., 1, 57–67, 2003.
Marmy, A., Rajczak, J., Delaloye, R., Hilbich, C., Hoelzle, M., Kotlarski, S., Lambiel, C., Noetzli, J., Phillips, M., Salzmann, N., Staub, B., and Hauck, C.: Semi-automated calibration method for modelling of mountain permafrost evolution in Switzerland, The Cryosphere, 10, 2693–2719, https://doi.org/10.5194/tc-10-2693-2016, 2016.
Maurer, H. and Hauck, C.: Instruments and methods – Geophysical imaging of alpine rock glaciers, J. Glaciol., 53, 110–120, https://doi.org/10.3189/172756507781833893, 2007.
McClymont, A. F., Hayashi, M., Bentley, L. R., Muir, D., and Ernst, E.: Groundwater flow and storage within an alpine meadow-talus complex, Hydrol. Earth Syst. Sci., 14, 859–872, https://doi.org/10.5194/hess-14-859-2010, 2010.
McClymont, A. F., Hayashi, M., Bentley, L. R., and Liard, J.: Locating and characterising groundwater storage areas within an alpine watershed using time-lapse gravity, GPR and seismic refraction methods, Hydrol. Process., 26, 1792–1804, https://doi.org/10.1002/Hyp.9316, 2012.
Mewes, B., Hilbich, C., Delaloye, R., and Hauck, C.: Resolution capacity of geophysical monitoring regarding permafrost degradation induced by hydrological processes, The Cryosphere, 11, 2957–2974, https://doi.org/10.5194/tc-11-2957-2017, 2017.
Milana, J. P. and Maturano, A.: Application of Radio Echo Sounding at the arid Andes of Argentina: the Agua Negra Glacier, Global Planet. Change, 22, 179–191, https://doi.org/10.1016/S0921-8181(99)00035-1, 1999.
Mollaret, C., Hilbich, C., Pellet, C., Flores-Orozco, A., Delaloye, R., and Hauck, C.: Mountain permafrost degradation documented through a network of permanent electrical resistivity tomography sites, The Cryosphere, 13, 2557–2578, https://doi.org/10.5194/tc-13-2557-2019, 2019.
Mollaret, C., Wagner, F. M., Hilbich, C., Scapozza, C., and Hauck, C.: Petrophysical Joint Inversion Applied to Alpine Permafrost Field Sites to Image Subsurface Ice, Water, Air, and Rock Contents, Front. Earth Sci., 8, 1–25, https://doi.org/10.3389/feart.2020.00085, 2020.
Monnier, S. and Kinnard, C.: Internal structure and composition of a rock glacier in the Andes (upper Choapa valley, Chile) using borehole information and ground-penetrating radar, Ann. Glaciol., 54, 61–72, https://doi.org/10.3189/2013aog64a107, 2013.
Mosbrucker, A. R., Major, J. J., Spicer, K. R., and Pitlick, J.: Camera system considerations for geomorphic applications of SfM photogrammetry, Earth Surf. Proc. Land., 42, 969–986, 2017.
Musil, M., Maurer, H., Green, A. G., Horstmeyer, H., Nitsche, F. O., Von der Mühll, D., and Springman, S.: Shallow seismic surveying of an Alpine rock glacier, Geophysics, 67, 1701–1710, https://doi.org/10.1190/1.1527071, 2002.
Otto, J. C. and Sass, O.: Comparing geophysical methods for talus slope investigations in the Turtmann valley (Swiss Alps), Geomorphology, 76, 257–272, 2006.
Pellet, C., Hilbich, C., Marmy, A., and Hauck, C.: Soil Moisture Data for the Validation of Permafrost Models Using Direct and Indirect Measurement Approaches at Three Alpine Sites, Front. Earth Sci., 3, 1–21, https://doi.org/10.3389/feart.2015.00091, 2016.
Rangecroft, S., Harrison, S., and Anderson, K.: Rock Glaciers as Water Stores in the Bolivian Andes: An Assessment of Their Hydrological Importance, Arct. Antarct. Alp. Res., 47, 89–98, https://doi.org/10.1657/AAAR0014-029, 2015.
Rangecroft, S., Suggitt, A. J., Anderson, K., and Harrison, S.: Future climate warming and changes to mountain permafrost in the Bolivian Andes, Climatic Change, 137, 231–243, https://doi.org/10.1007/s10584-016-1655-8, 2016.
Rogger, M., Chirico, G. B., Hausmann, H., Krainer, K., Brückl, E., Stadler, P., and Blöschl, G.: Impact of mountain permafrost on flow path and runoff response in a high alpine catchment, Water Resour. Res., 53, 1288–1308, https://doi.org/10.1002/2016WR019341, 2017.
Saavedra, F. A., Kampf, S. K., Fassnacht, S. R., and Sibold, J. S.: Changes in Andes snow cover from MODIS data, 2000–2016, The Cryosphere, 12, 1027–1046, https://doi.org/10.5194/tc-12-1027-2018, 2018.
Sandmeier, K. J.: REFLEXW, Version 8.0, Windows™ XP/7/8/10-program for the processing of seismic, acoustic or electromagnetic reflection, refraction and transmission data, Karlsruhe, Germany, 2016.
Schaffer, N., MacDonell, S., Réveillet, M., Yáñez, E., and Valois, R.: Rock glaciers as a water resource in a changing climate in the semiarid Chilean Andes, Reg. Environ. Change, 19, 1263–1279, https://doi.org/10.1007/s10113-018-01459-3, 2019.
Scherler, M., Hauck, C., Hoelzle, M., Stahli, M., and Volksch, I.: Meltwater Infiltration into the Frozen Active Layer at an Alpine Permafrost Site, Permafrost Periglac., 21, 325–334, https://doi.org/10.1002/Ppp.694, 2010.
Scherler, M., Hauck, C., Hoelzle, M., and Salzmann, N.: Modeled sensitivity of two alpine permafrost sites to RCM-based climate scenarios, J. Geophys. Res.-Earth, 118, 780–794, https://doi.org/10.1002/Jgrf.20069, 2013.
Schneider, S., Daengeli, S., Hauck, C., and Hoelzle, M.: A spatial and temporal analysis of different periglacial materials by using geoelectrical, seismic and borehole temperature data at Murtèl–Corvatsch, Upper Engadin, Swiss Alps, Geogr. Helv., 68, 265–280, https://doi.org/10.5194/gh-68-265-2013, 2013.
Schön, J.: Physical properties of rocks: A workbook, Elsevier, Oxford, 481 pp., 2011.
Schrott, L.: Global solar radiation, soil temperature and permafrost in the Central Andes, Argentina: A progress report, Permafrost Periglac., 2, 59–66, https://doi.org/10.1002/ppp.3430020110, 1991.
Schrott, L.: Die Solarstrahlung als steuernder Faktor im Geosystem der subtropischen semiariden Hochanden (Agua Negra, San Juan, Argentinien), Dissertation, Geographisches Institut der Universität Heidelberg, Heidelberg, Germany, 199 pp., 1994.
Schrott, L.: Some geomorphological-hydrological aspects of rock glaciers in the Andes (San Juan, Argentina), Z. Geomorphol. Supp., 104, 161–173, 1996.
Schrott, L.: The hydrological significance of high mountain permafrost and its relation to solar radiation, A case study in the high Andes of San Juan, Argentina, Bamberger Geographische Schriften, 15, 71–84, 1998.
Schrott, L. and Hoffmann, T.: Refraction seismics, in: Applied Geophysics in Periglacial Environments, edited by: Hauck, C. and Kneisel, C., Cambridge University Press, Cambridge, UK, 256 pp., 2008.
Schwalbe, E. and Maas, H. G.: The determination of high-resolution spatio-temporal glacier motion fields from time-lapse sequences, Earth Surf. Dynam., 5, 861–879, https://doi.org/10.5194/esurf-5-861-2017, 2017.
Tapia-Baldis, C. and Trombotto-Liaudat, D.: Permafrost model in coarse-blocky deposits for the Dry Andes, Argentina (28–33∘ S), Cuadernos de Investigación Geográfica, 46, 33–58, https://doi.org/10.18172/cig.3802, 2020.
Timur, A.: Velocity of Compressional Waves in Porous Media at Permafrost Temperatures, Geophysics, 33, 584, https://doi.org/10.1190/1.1439954, 1968.
Trombotto, D. and Borzotta, E.: Indicators of present global warming through changes in active layer-thickness, estimation of thermal diffusivity and geomorphological observations in the Morenas Coloradas rockglacier, Central Andes of Mendoza, Argentina, Cold Reg. Sci. Technol., 55, 321–330, https://doi.org/10.1016/j.coldregions.2008.08.009, 2009.
Trombotto, D., Buk, E., and Hernández, J.: Rock glaciers in the Southern Central Andes (approx. 33–34S), Cordillera Frontal, Mendoza, Argentina, Bamberger Geographische Schriften, 19, 145–173, 1999.
Wheaton, J. M., Brasington, J., Darby, S. E., and Sear, D. A.: Accounting for uncertainty in DEMs from repeat topographic surveys: improved sediment budgets, Earth Surf. Proc. Land., 35, 136–156, https://doi.org/10.1002/esp.1886, 2010.
Williams, M. W., Knauf, M., Caine, N., Liu, F., and Verplanck, P. L.: Geochemistry and source waters of rock glacier outflow, Colorado Front Range, Permafrost Periglac., 17, 13–33, https://doi.org/10.1002/Ppp.535, 2006.
Wirz, V., Gruber, S., Purves, R. S., Beutel, J., Gartner-Roer, I., Gubler, S., and Vieli, A.: Short-term velocity variations at three rock glaciers and their relationship with meteorological conditions, Earth Surf. Dynam., 4, 103–123, https://doi.org/10.5194/esurf-4-103-2016, 2016.