the Creative Commons Attribution 4.0 License.
the Creative Commons Attribution 4.0 License.
 | 10 Dec 2020
The cryostratigraphy of the Yedoma cliff of Sobo-Sise Island (Lena delta) reveals permafrost dynamics in the central Laptev Sea coastal region during the last 52 kyr
Sebastian Wetterich
Alexander Kizyakov
Michael Fritz
Juliane Wolter
Gesine Mollenhauer
Hanno Meyer
Matthias Fuchs
Aleksei Aksenov
Heidrun Matthes
Lutz Schirrmeister
Thomas Opel
The present study examines the formation history and cryolithological properties of the late-Pleistocene Yedoma Ice Complex (IC) and its Holocene cover in the eastern Lena delta on Sobo-Sise Island. The sedimentary sequence was continuously sampled at 0.5 m resolution at a vertical Yedoma cliff starting from 24.2 m above river level (a.r.l.). The sequence differentiates into three cryostratigraphic units: Unit A, dated from ca. 52 to 28 cal kyr BP; Unit B, dated from ca. 28 to 15 cal kyr BP; Unit C, dated from ca. 7 to 0 cal kyr BP. Three chronologic gaps in the record are striking. The hiatus during the interstadial marine isotope stage (MIS) 3 (36–29 cal kyr BP) as well as during stadial MIS 2 (20–17 cal kyr BP) might be related to fluvial erosion and/or changed discharge patterns of the Lena river caused by repeated outburst floods from the glacial Lake Vitim in southern Siberia along the Lena river valley towards the Arctic Ocean. The hiatus during the MIS 2–1 transition (15–7 cal kyr BP) is a commonly observed feature in permafrost chronologies due to intense thermokarst activity of the deglacial period. The chronologic gaps of the Sobo-Sise Yedoma record are similarly found at two neighbouring Yedoma IC sites on Bykovsky Peninsula and Kurungnakh-Sise Island and are most likely of regional importance.
The three cryostratigraphic units of the Sobo-Sise Yedoma exhibit distinct signatures in properties of their clastic, organic, and ice components. Higher permafrost aggradation rates of 1 m kyr−1 with higher organic-matter (OM) stocks (29 ± 15 kg C m−3, 2.2 ± 1.0 kg N m−3; Unit A) and mainly coarse silt are found for the interstadial MIS 3 if compared to the stadial MIS 2 with 0.7 m kyr−1 permafrost aggradation, lower OM stocks (14 ± 8 kg C m−3, 1.4 ± 0.4 kg N m−3; Unit B), and pronounced peaks in the coarse-silt and medium-sand fractions. Geochemical signatures of intra-sedimental ice reflect the differences in summer evaporation and moisture regime by higher ion content and less depleted ratios of stable δ18O and stable δD isotopes but lower deuterium excess (d) values during interstadial MIS 3 if compared to stadial MIS 2. The δ18O and δD composition of MIS 3 and MIS 2 ice wedges shows characteristic well-depleted values and low d values, while MIS 1 ice wedges have elevated mean d values between 11 ‰ and 15 ‰ and surprisingly low δ18O and δD values. Hence, the isotopic difference between late-Pleistocene and Holocene ice wedges is more pronounced in d than in δ values.
The present study of the permafrost exposed at the Sobo-Sise Yedoma cliff provides a comprehensive cryostratigraphic inventory, insights into permafrost aggradation, and degradation over the last approximately 52 kyr as well as their climatic and morphodynamic controls on the regional scale of the central Laptev Sea coastal region in NE Siberia.
- Article
(7915 KB) - Full-text XML
-
Supplement
(624 KB) - BibTeX
- EndNote


During sea level low stands of the last glacial period, vast areas of the eastern Siberian arctic shelves were exposed and formed the unglaciated Beringia land bridge between the Eurasian–Scandinavian and Kara–Barents ice sheets and the North American Laurentide ice sheet (Hopkins, 1959). Beringia hosted a unique cold-adapted ecosystem with no analogue in modern times – the tundra–steppe that maintained the late-Pleistocene mammoth fauna (Hopkins, 1982). Beringian environments were characterized by permafrost formation in widespread ice wedge polygonal networks (Sher, 1997). The ice wedge polygons grew syngenetically, i.e. contemporaneously with deposition of ice-rich clastic and organic material. Generally, ice wedge formation takes place after thermal contraction cracking of the frozen ground in wintertime, consecutive infill of the cracks by meltwater in spring, and immediate refreezing and expansion (Leffingwell, 1915). The vertical ice veins formed by annual repetition of this mechanism widen the wedge ice, which in addition grows upwards with ongoing deposition. For about 70 kyr during the marine isotope stages (MISs) 4, 3, and 2, the Beringian tundra–steppe environment accumulated up to 50 m thick ice wedge polygon sequences that are named the Yedoma Ice Complex (IC; Tumskoy, 2012) in Russian stratigraphy. The Yedoma IC was first described by Soloviev (1959) in central Yakutia, while Katasonov (1954/2009) and Romanovskiy (1959) undertook first cryostratigraphic research of the Yedoma IC in the eastern Siberian lowlands. Yedoma IC formation is characterized by cryogenic cyclicity (Popov, 1953; Vasil'chuk, 2013) that is expressed in distinct horizons, which formed in relation to the deposition rate of inter-annual variations in active-layer depth and resulted in freezing events that built a respective uppermost portion of perennially frozen ground (Wetterich et al., 2014). Diagnostic for the Yedoma IC are the presence of syngenetic ice wedges, the oversaturation of the sediment with pore ice, and segregated ice (excess ice) forming lenticular and reticulate cryostructures within mainly fine-grained deposits (for an overview see Schirrmeister et al., 2013).
After deglaciation at the end of the last glacial maximum (LGM), sea level rise and subsequent inundation of the eastern Siberian shelves flooded large parts of Beringia, whose remaining areas were further affected by intense permafrost degradation caused by deglacial warming. The LGM distribution of the Yedoma domain included currently submerged shelf areas (1.9 million km2) and the modern maximum extent of Yedoma deposits on land (1.4 million km2). This amounts to an area of about 3.3 million km2 where Yedoma IC formation potentially took place (Strauss et al., 2017 and references therein). In the modern terrestrial Yedoma domain, up to 70 % of the area is affected by thermokarst (Strauss et al., 2013), which is the degradation of ice-rich permafrost due to thaw, ground subsidence, and erosion. In Eurasia, Yedoma IC deposits are most widespread in the accumulative lowlands of northern and central Yakutia, less on Taimyr and Chukotka (Romanovskiy, 1993; Kunitsky, 2007; Konishchev, 2011; Grosse et al., 2013). The most widespread distribution of the IC is characteristic of lowland plains at altitudes of less than 100 m above sea level (a.s.l.). The inland Yedoma IC has, however, also been found in e.g. the Yana uplands exposed in the Batagay megaslump (Kunitsky et al., 2013; Murton et al., 2017; Opel et al., 2019). In North America, deposits similar to the Siberian Yedoma IC occur in lower parts of the Arctic foothills, in the northern part of Seward Peninsula, in interior Alaska, and in the Yukon Territory (Péwé, 1955; Sanborn et al., 2006; Kanevskiy et al., 2011).
Ongoing research of the Yedoma IC employs its clastic component to unravel material sources, transformation, transportation, and sedimentation processes by applying mineralogy, grain-size analysis, and endmember modelling approaches (e.g. Murton et al., 2015; Schirrmeister et al., 2011a; Schirrmeister et al., 2020; Strauss et al., 2012) to reveal the depositional history. The organic component of the Yedoma IC bears information on the Beringian environment and its variability over time in floral and faunal fossil records (e.g. Sher et al., 2005). The organic matter (OM) preserved in the Yedoma IC was studied for its carbon stocks (e.g. Strauss et al., 2013; Zimov et al., 2006) and carbon vulnerability to estimate its degradability upon thaw (e.g. Stapel et al., 2016; Strauss et al., 2015). To obtain chronologies of Yedoma IC formation, radiocarbon (14C) dating of organic remains is commonly applied (e.g. Schirrmeister et al., 2002a; Wetterich et al., 2014). The ground-ice component comprises intra-sedimental ice and wedge ice, which together constitute the major share of up to about 80 percent per volume (vol %) of the Yedoma IC (Strauss et al., 2013). Cryostructures of intra-sedimental ice as well as its stable-water-isotope composition host information of past freezing conditions (e.g. Dereviagin et al., 2013; Schwamborn et al., 2006). The stable-isotope composition of wedge ice is more often used in palaeoclimate studies and serves as a proxy for winter climate conditions and moisture sources because the wedge ice derives mainly from winter precipitation (e.g. Lachenbruch, 1962; Opel et al., 2018).
The present study in the eastern Lena delta fills a geographic gap in the extensive Yedoma IC studies in the Laptev Sea coastal region, which were executed during the last approximately 2 decades in joint Russian–German research (Khazin et al., 2019; Meyer et al., 2002a, b; Schirrmeister et al., 2002a, 2011a, 2017; Sher et al., 2005; Strauss et al., 2013, 2015; Tumskoy, 2012; Wetterich et al., 2005, 2008a, 2011, 2014). Our study seeks (1) to capture and to characterize the entire cryostratigraphic inventory of frozen deposits and ground ice of the Sobo-Sise Yedoma cliff; (2) to estimate permafrost aggradation and degradation timing, extent, and processes on Sobo-Sise Island in the context of widespread Yedoma IC occurrence in the central Laptev Sea coastal region; (3) to decipher regional winter climate conditions and moisture sources; and (4) to disentangle the relation of permafrost dynamics controlled by large-scale climate variability and regional to local geomorphologic conditions and processes.
The Lena delta stretches along the shore of the Laptev Sea between about 72 and 74∘ N and 123 and 130∘ E (Fig. 1) and is the largest Arctic river delta (Walker et al., 1998). The terrestrial surface of the delta differentiates into three geomorphological units (or terraces; Grigoriev, 1993). The Holocene-aged first terrace comprises the north-eastern and the south-western parts of the delta and is mainly covered by wet polygonal tundra and thermokarst basins (Morgenstern et al., 2008). The second terrace in the north-western part of the delta is composed of fluvial dry sands dated to MIS 3–2 (Schirrmeister et al., 2011b) and is characterized by numerous NNW–SSE-oriented lake basins and less expressed polygonal surface morphology (Morgenstern et al., 2008). The third terrace of MIS 4-2 age occurs in the southern part of the delta. The study area on Sobo-Sise Island in the south-eastern part of the delta belongs to the third geomorphologic terrace that is shaped by remnants of the late-Pleistocene Yedoma IC and its degradation features. According to a landform classification of Sobo-Sise by Fuchs et al. (2018), 43 % of the land surface is occupied by Yedoma uplands and partly degraded Yedoma slopes, 43 % is thermokarst basins, and 14 % is lakes. The studied Yedoma cliff in the northern part of Sobo-Sise facing the Sardakhskaya channel is remarkable for its rapid shoreline retreat of up to 22.3 m yr−1 (based on remote-sensing time series from 1965–2018; Fuchs et al., 2020) with a mean annual retreat rate of 9.1 m yr−1 over the observation period. The resulting annual OM release into the Lena river amounts to at least 5.2×10⁶ kg organic C and 0.4×10⁶ kg N per year for the period 2015–2018 (Fuchs et al., 2020). Furthermore, the Sobo-Sise Yedoma undergoes elevation changes due to thaw subsidence between −2 cm yr−1 (based on Sentinel-1 InSAR, 2017, for the entire Sobo-Sise Island; Chen et al., 2018) and −3.4 cm yr−1 (based on on-site rLiDAR at the studied Yedoma cliff; Günther et al., 2018), indicating ongoing permafrost degradation. Thus, the Sobo-Sise Yedoma represents a typical OM source in land-to-ocean pathways. It is characterized by substantial OM stocks and fast permafrost degradation (Fuchs et al., 2020) accelerated by Arctic warming (Fritz et al., 2017). The Yedoma cliff rises to about 27.7 m above river level (arl; Fuchs et al., 2020) and stretches about 1.66 km in the NW–SE direction (Fig. 1). It is likely that the Yedoma IC extends up to about 12 m below the river level as deduced by Fuchs et al. (2020) from near-shore bathymetry in front of the cliff.
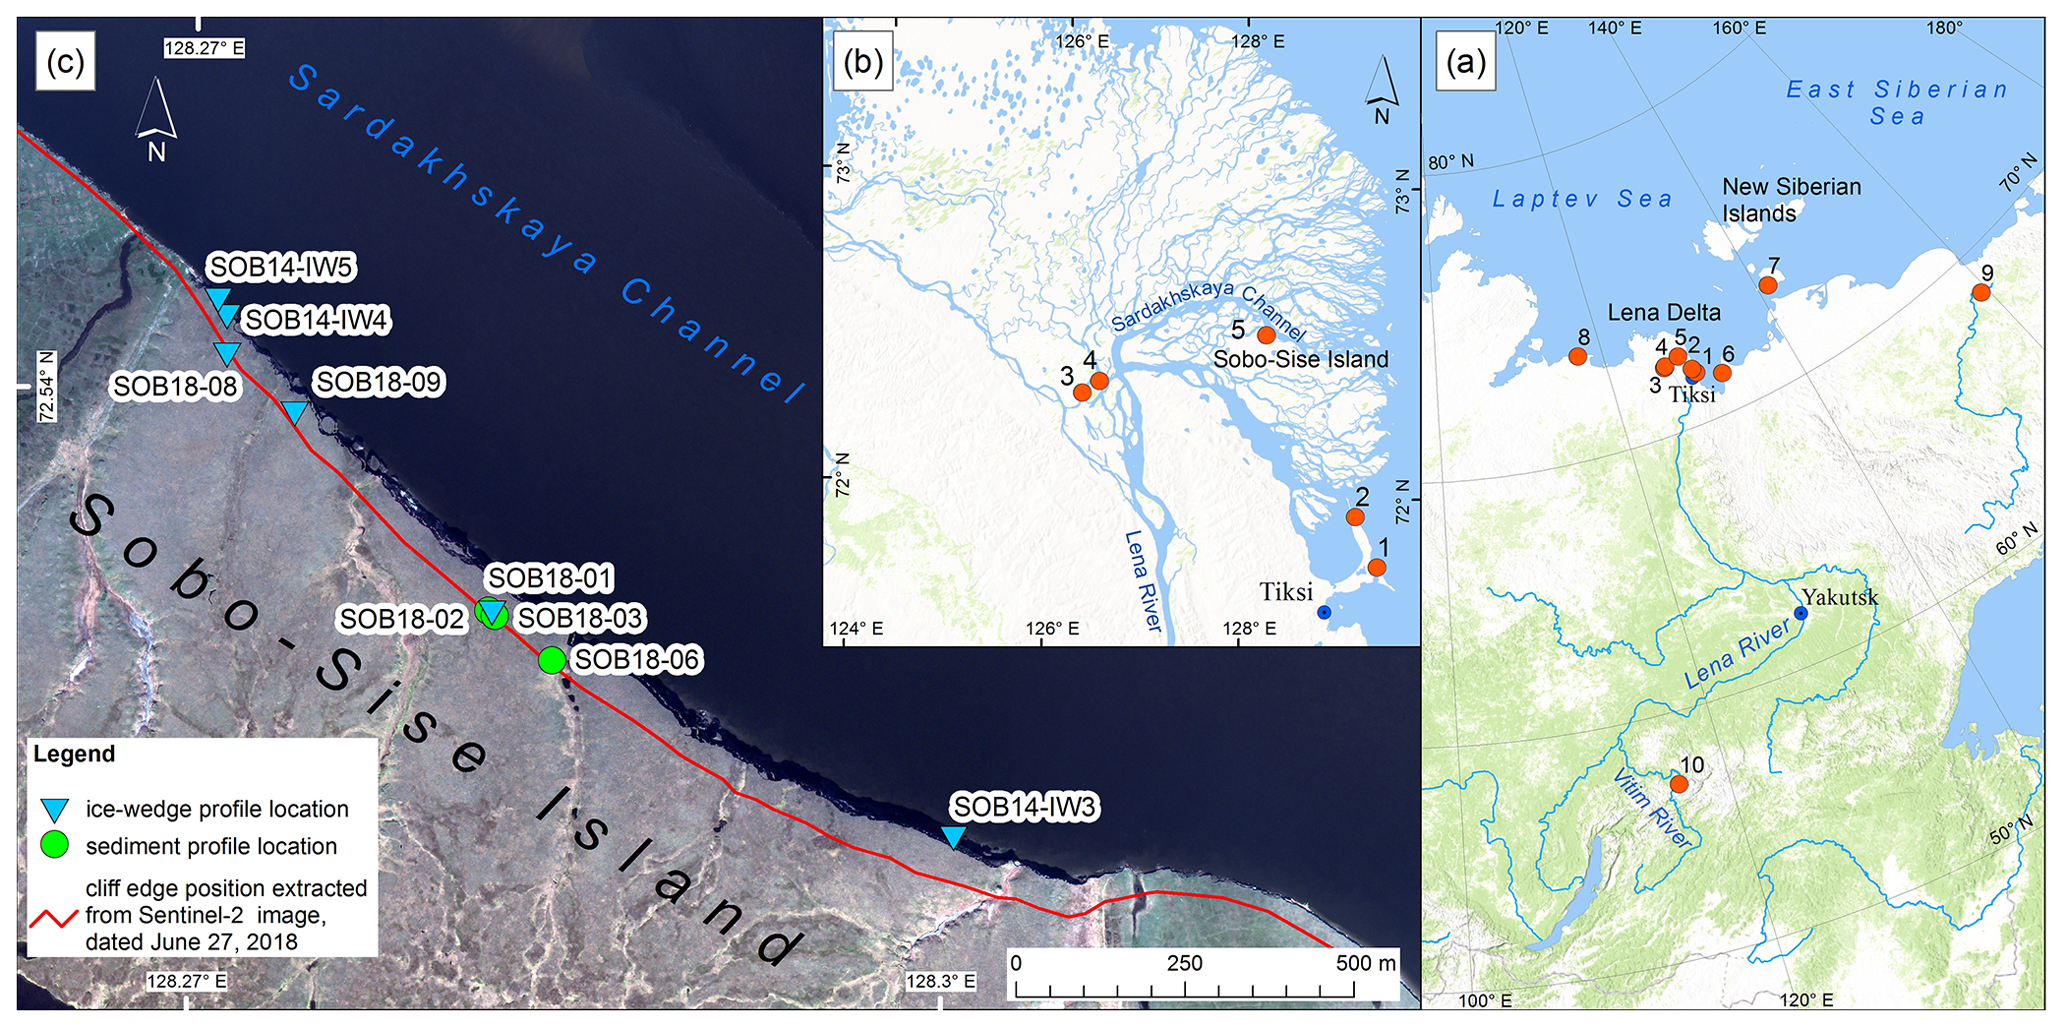
Figure 1Study area (a) in north-eastern Siberia showing the study site on Sobo-Sise Island in the eastern Lena delta (red dot no. 5) and further locations mentioned in the paper: Bykovsky Peninsula (1: site Mamontovy Khayata; and 2: B–S site), Lena delta (3: Kurungnakh-Sise Island; 4: Samoylov Island), Buor Khaya Peninsula (6), Bol'shoy Lyakhovsky Island (7), Mamontov Klyk (8), Duvanny Yar (9), and Lake Vitim (10). More details of the eastern Lena delta and the Yedoma IC sites studied nearby Sobo-Sise Island are shown in panel (b). Profile locations are indicated in (c) at the Yedoma IC cliff on Sobo-Sise Island (image based on GeoEye-1 scene dated 08 July 2014). Panels (a) and (b) are based on ESRI ArcGIS Living Atlas of the World, layer World Topo Base (2020).
The modern climate of the Lena delta as recorded by ongoing monitoring on Samoylov Island in the central delta reveals a mean annual air temperature of −12.3 ∘C (1998–2017; Boike et al., 2019). Mean monthly air temperatures reach 9.5 ∘C in July and −32.7 ∘C in February. The average annual rainfall amounts to 169 mm and the average annual winter snow cover to 0.3 m (2002–2017; Boike et al., 2019). Between 2006 and 2017, permafrost has warmed by 1.3 ∘C at the zero-annual-amplitude depth of 20.75 m (Boike et al., 2019), while the permafrost maximum depth in the region reaches 500–600 m (Grigoriev, 1993). Unfrozen underground (talik) is, however, assumed below the main channels of the Lena delta and below thermokarst lakes exceeding 2 m water depth.
The modern vegetation of Sobo-Sise Island is mainly characterized by dwarf shrub – moss – tussock tundra communities occupying varying habitats of the land surface of Yedoma uplands, pingos, floodplains, and thermokarst basins. Common species belong to the genera Salix, Dryas, Saxifraga, Polygonum, Carex, Poa, Trisetum, Equisetum, and Luzula and unspecified mosses and lichen according to Raschke and Savelieva (2017).
3.1 Fieldwork
We sampled profiles at different positions of the Yedoma cliff including three vertical sediment profiles and six horizontal ice wedge profiles to cover the entire exposed permafrost inventory (Fig. 2). The sequence was cryolithologically described according to French and Shur (2010), and frozen samples were obtained using a hammer and axe at 0.5 m resolution via rope descending. Vertical overlaps of the three profiles of sedimentary polygon fillings of the exposure ensured complete sampling coverage of the cliff (Fig. 2). Sample positions of profiles SOB18-01 and SOB18-03 were measured as depths in metres below surface (m b.s.) and transferred to heights from the measured height of 24.2 m a.r.l. at the cliff edge above the profiles. Sampling positions of the lowermost profile SOB18-06 were directly measured as heights in metres above river level. Height measurements in metres above river level correspond to those above sea level (m a.s.l.), given the proximity of Sobo-Sise Island at the Sardakhskaya channel in the eastern part of the Lena delta to the Laptev Sea (Fig. 1b). In total, 61 sediment samples were taken (Wetterich et al., 2019). The gravimetric ice or water content was measured in the field as the difference between wet and dry weights after careful drying on a field oven and is given as weight percent (wt %).
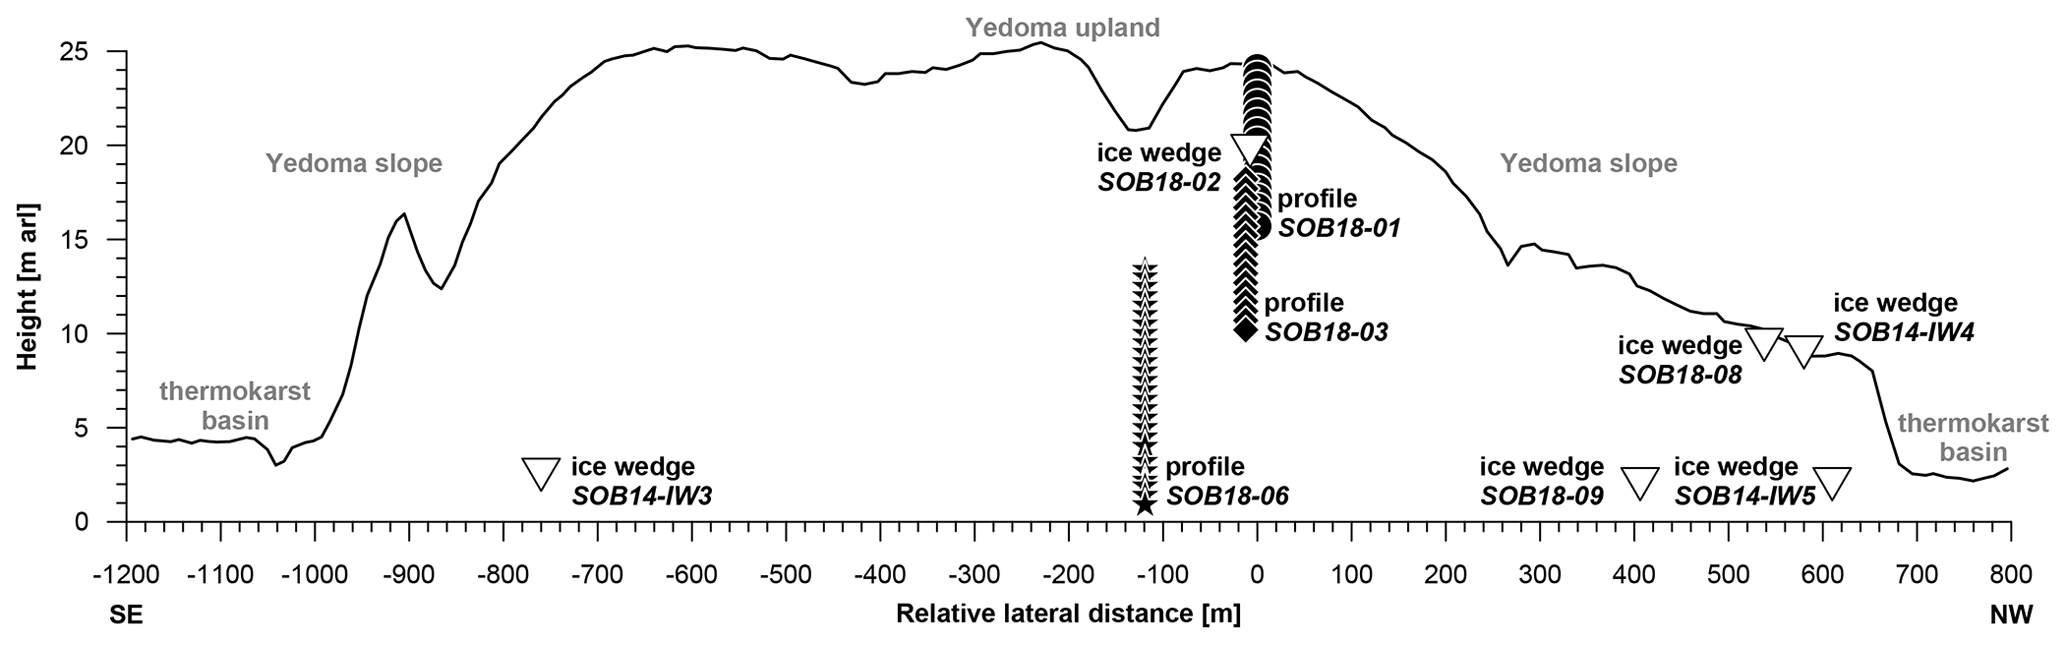
Figure 2Profile positions of sediment profiles SOB18-01 (circles), SOB18-03 (diamonds), and SOB18-06 (stars) as well as ice wedge profiles (triangles) sampled at the Sobo-Sise Yedoma cliff in 2014 (SOB14 ice wedge profiles) and 2018 (SOB18 ice wedge profiles). Cliff edge line elevation (relative to river level) was retrieved from ArcticDEM (10 m spatial resolution; Mosaic v3.0 10m: tile 59_43; Porter et al., 2018).
Three horizontal ice wedge profiles at the Yedoma IC cliff were sampled in 2018 at different height levels (Fig. 2). An additional three ice wedge profiles sampled in 2014 were analysed and included in the present study. Ice wedge profile SOB18-02 was taken at 19.7 m a.r.l. on rope by ice screw at 15 cm resolution between the sediment profiles SOB18-01 and SOB18-03 in the uppermost part of the cliff (Fig. 3b). The ice wedge SOB18-09 derives from the central western part of the Yedoma and was sampled at 2 m a.r.l. at beach level (Fig. 3f). The ice wedge profiles SOB18-08 and SOB14-IW4 were sampled at the upper western slope of the Yedoma towards the western alas basin at 9.4 and 9 m a.r.l., respectively (Fig. 3e, h). Ice wedge profiles in the lower part of the cliff were obtained at 2.5 m a.r.l. (eastern slope, SOB14-IW3) and at 2 m a.r.l. (western slope, SOB14-IW5; Fig. 3g, i). Except for profile SOB18-02, all ice wedge profiles were taken by chainsaw either in blocks for subsampling in the cold lab at 1.5 to 2 cm resolution or in slices in the field at varying resolutions of 4 cm (SOB18-08, SOB18-09) and of 15 cm (SOB14-IW3), depending on fieldwork logistics (Wetterich et al., 2019).
3.2 Laboratory analyses
3.2.1 Sediment and organic-matter analyses
Upon arrival in the laboratory, the sediment samples were freeze-dried (Zirbus Subliminator 3–4–5), manually homogenized, and split for further analyses. The grain-size distribution (GSD) was measured using a laser diffraction particle analyser (Malvern Mastersizer 3000). GSD was calculated with the internal software of the laser diffraction particle analyser and further analysed using GRADISTAT 8.0 (Blott and Pye, 2001) for sand–silt–clay distribution, arithmetic mean in micrometres, and sorting in phi (φ). Further details of GSD sample preparation and laboratory procedures are given in Schirrmeister et al. (2020). The sample SOB18-03-03 was not included in the data interpretation because of analytical artefacts.
To attempt an unmixing of the measured grain-size distributions into underlying characteristic grain-size sub-populations associated with specific sedimentological deposition and transformation processes, a robust endmember modelling approach (EMMA) following Dietze and Dietze (2019) was applied to a total of 56 GSD matrices from profiles SOB18-01, SOB18-03, and SOB18-06, representing the Yedoma IC and excluding the uppermost Holocene cover. EMMA is a type of eigenspace analysis with the capacity to transform the resulting endmember components so that the loadings of the endmembers can be interpreted as grain-size distributions (see details in Dietze et al., 2012). Each sample used in the analysis is then represented as a linear combination of the identified endmembers, where the scores provide a quantitative estimate of how much an endmember contributes to a sample. The used R package EMMAGeo (Dietze and Dietze, 2019) additionally allows the identification of robust endmembers (rEMs) using a multiple-parameter approach, where rEMs are those that occur independently from model parameters. A Monte Carlo approach is then used for assessing the uncertainties associated with the scores computed for each sample. Overall class-wise explained variance is 63 %, with the lowest R2 occurring for the very fine and very coarse classes (Fig. S1 in the Supplement). Overall, sample-wise explained variance is 91 %, with only one sample with an explained variance below 80 % (Fig. S1).
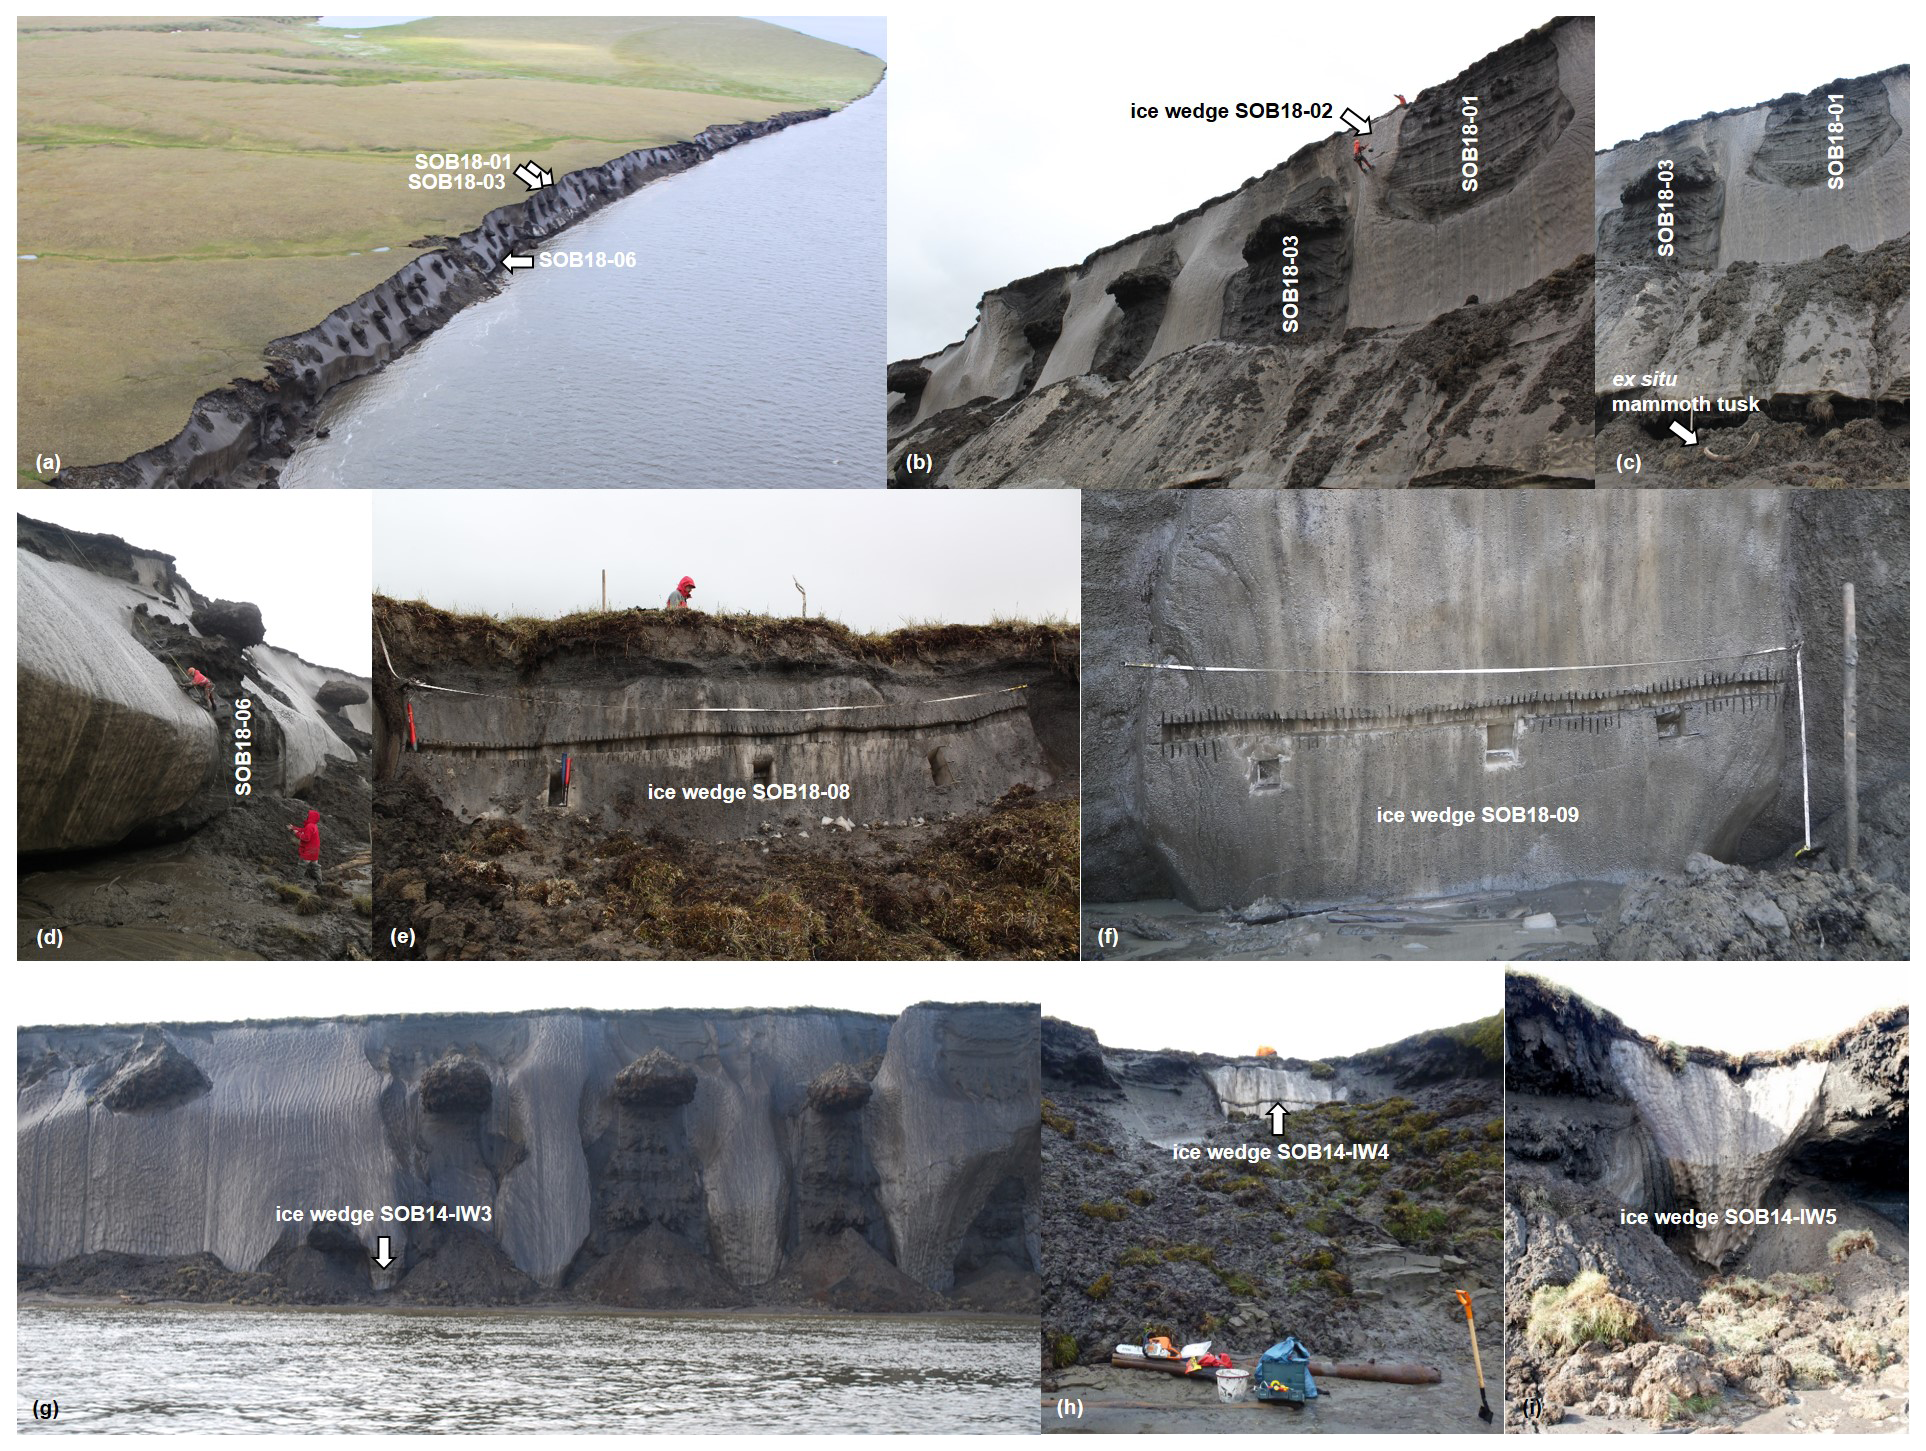
Figure 3Field photographs of the sampling locations of the sediment profiles (a–d) and the ice wedge profiles (b, e–i) at the Sobo-Sise Yedoma cliff. Photographs are provided by the authors of this study.
Mass-specific magnetic susceptibility (MS) as a proxy for sediment content of magnetizable minerals was measured using a Bartington Instruments MS2 equipped with an MS2B sensor. MS data are expressed in SI units (10−8 m3 kg−1). Total nitrogen (TN) and total organic-carbon (TOC) content of the samples were measured with elemental analysers (ElementarVario EL III for TN and ElementarVario MAX C for TOC; analytical accuracy ± 0.1 wt %). The ratio of TOC and TN is referred to as C∕N. Stable-carbon (δ13C)- and stable-nitrogen (δ15N)-isotope analysis was undertaken using a Thermo Scientific Delta V Advantage isotope ratio MS equipped with a Flash 2000 organic elemental analyser using helium as a carrier gas. Values are given as per mil (‰) difference from the Vienna Pee Dee Belemnite (VPDB) standard for δ13C and from nitrogen in ambient air (AIR) for δ15N. The accuracy was better than ±0.15 ‰ for δ13C and ±0.2 ‰ for δ15N. Further details on OM analyses are given in Davidson et al. (2018). In total, 61 sediment samples were analysed for the parameters described above (Table 1).
Table 1Data of the three cryostratigraphic units A, B, and C of the Sobo-Sise Yedoma cliff, summarizing minimum (MIN), mean (MEAN), and maximum (MAX) values as well as standard deviation (SD) of sedimentological, organic-matter, stable-isotope, and hydrochemical analyses.
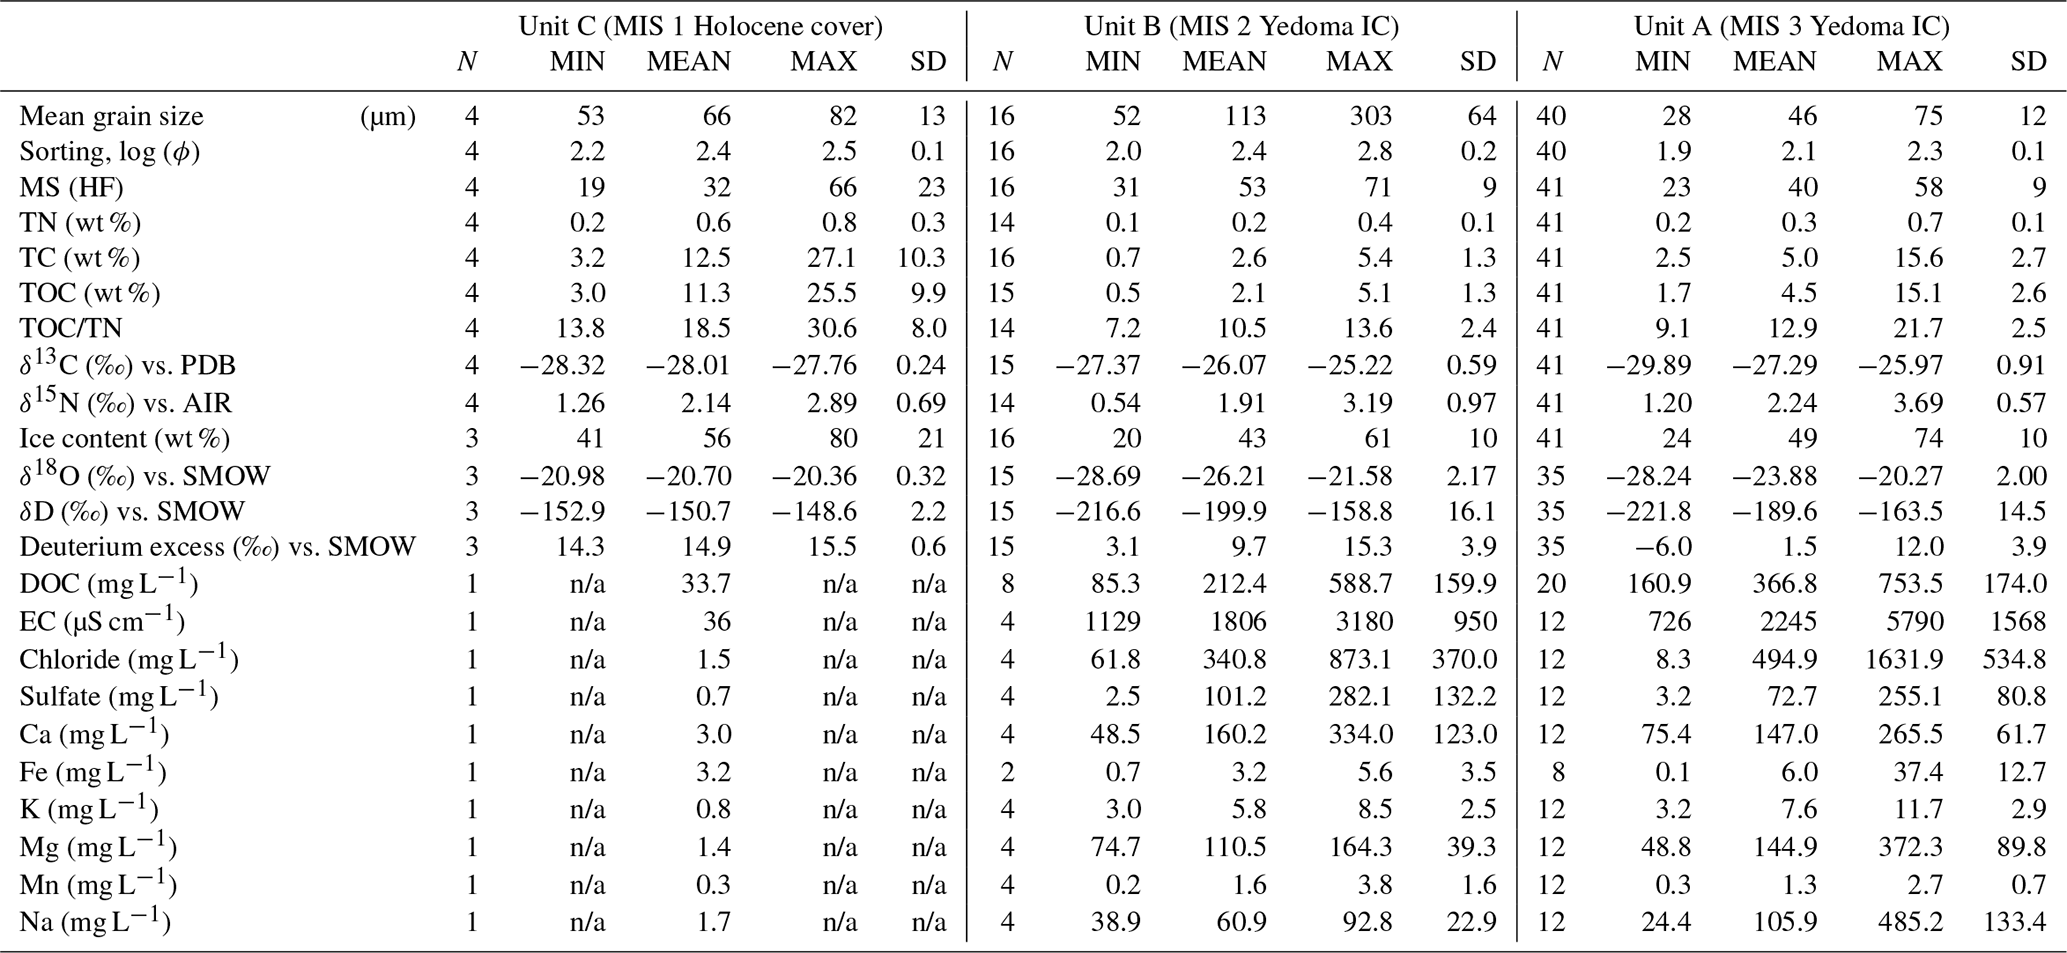
n/a – not applicable
3.2.2 Ground-ice analyses
Supernatant water of thawed sediment from 53 samples (Table 1) was decanted in the field. Hydrochemical characterization included electrical conductivity (EC), major anions and cations, and dissolved organic-carbon (DOC) concentration. For major ion analyses 17 samples were filtered through 0.45 µm CA syringe filters and filled into sample bottles. HNO3 (65 % Suprapur) was added to cation samples for conservation. The cation content was analysed by inductively coupled plasma optical emission spectrometry (ICP-OES; Perkin-Elmer Optima 3000 XL), while the anion content was determined by ion chromatography (IC; Dionex DX-320). Ion concentrations are given in milligrams per litre (mg L−1). For DOC concentration analyses, samples were filtered through pre-rinsed 0.7 µm GF/F glass fibre filters attached to a rubber-free syringe. The liquids were filled in clear glass vials with screw caps and PTFE septum and acidified with HCl (30 % Suprapur). All samples were stored cool and dark. DOC concentrations (mg L−1) were measured in 29 samples with a high-temperature (680 ∘C) combustion TOC analyser (Shimadzu TOC-VCPH).
The oxygen (δ18O) and hydrogen (δD) stable-isotope compositions of melted samples of intra-sedimental ice and of wedge ice were measured using a Finnigan MAT Delta-S mass spectrometer (1σ<0.1 ‰ for δ18O, 1σ<0.8 ‰ for δD; Meyer et al., 2000). Values are given as per mil (‰) difference from the Vienna Standard Mean Ocean Water (VSMOW) standard. The deuterium excess (d) is calculated following Dansgaard (1964) in Eq. (1):
In total, 511 samples of wedge ice were analysed for their stable-water-isotope composition. We excluded marginal samples from further interpretation at the interface of wedge ice to sediment, which showed indications of isotopic alteration. Furthermore, the sampled ice wedge profile SOB14-IW4 captured a polygon junction and included ice of two neighbouring ice wedges. We considered only a full profile of one wedge cut and sampled perpendicular to its lateral growth direction and neglected the remaining samples of the second ice wedge, not completely captured due to its oblique exposition. In total, 412 wedge ice samples were interpreted from six analysed ice wedge profiles (Table 2).
Table 2Stable-isotope data of ice wedges of the Sobo-Sise Yedoma cliff, summarizing minimum (MIN), mean (MEAN), and maximum (MAX) values as well as standard deviation (SD). Radiocarbon dates of organic material from inside the wedge ice are further given in Table 3.

NA – not available
3.3 Radiocarbon dating and age modelling
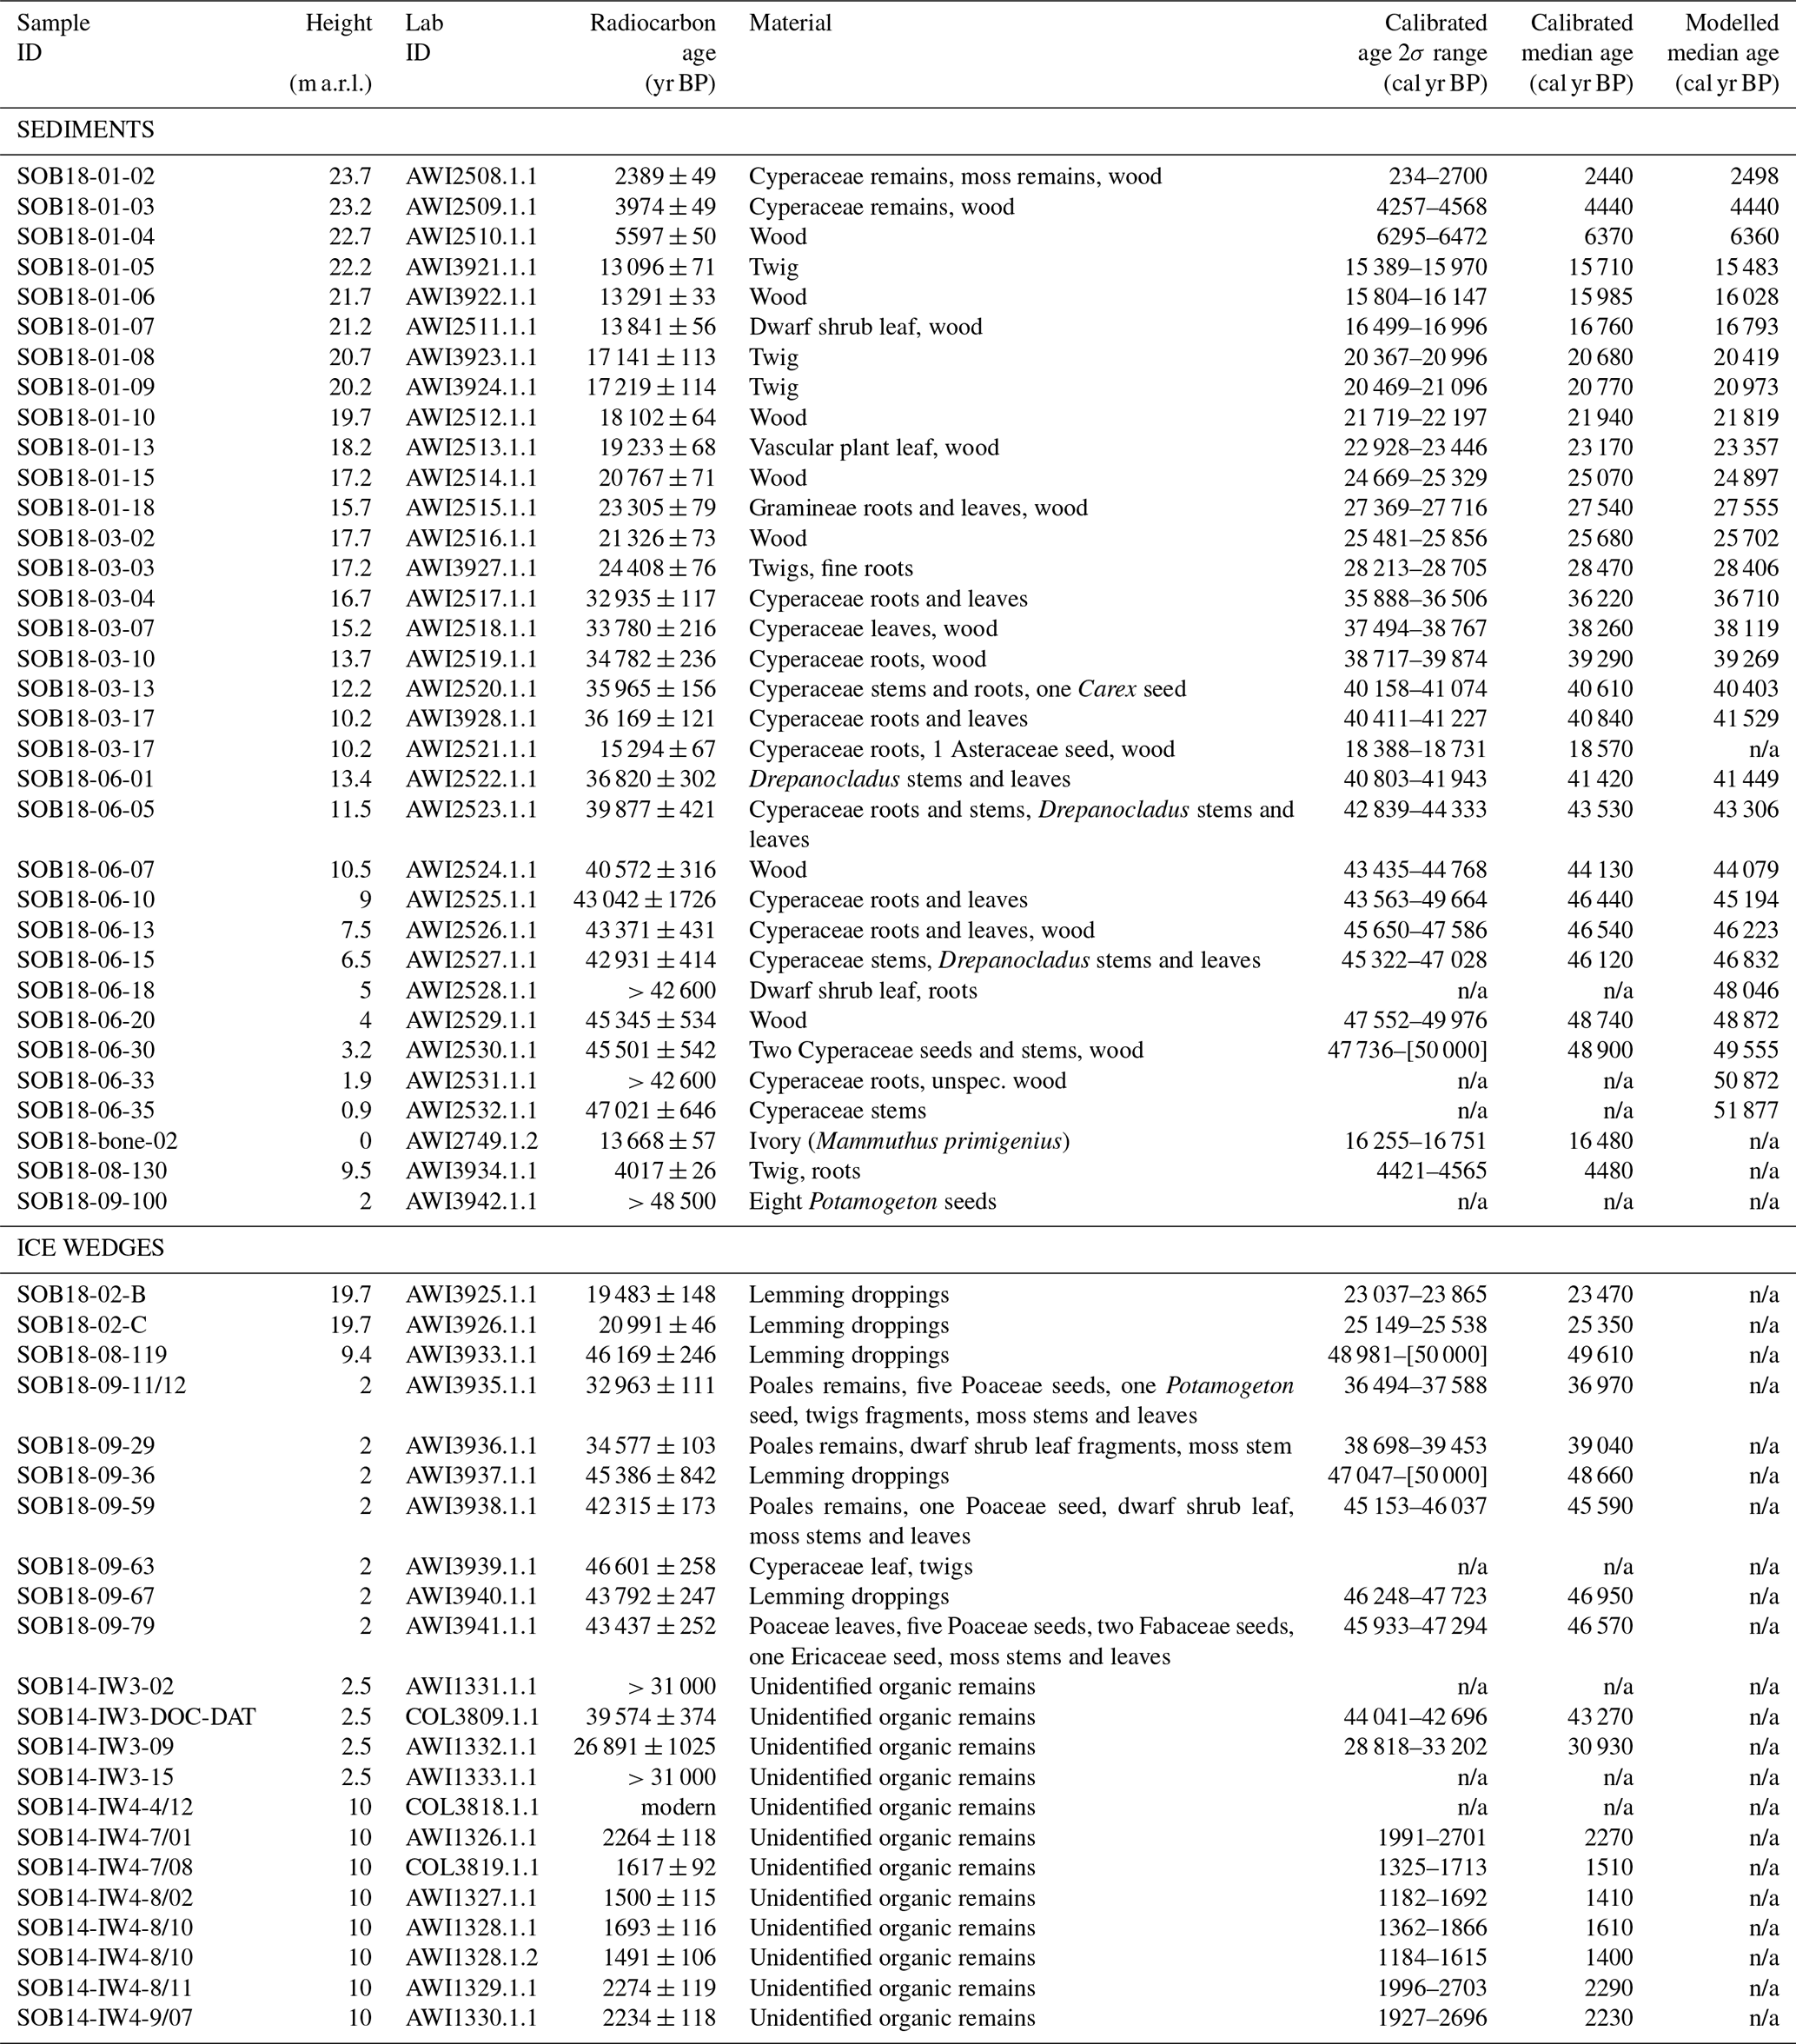
The geochronology along each profile was established on the basis of 32 accelerator mass spectrometry (AMS) radiocarbon dates from 31 selected sediment samples (Table 3) using a Mini Carbon Dating System (MICADAS) at Alfred Wegener Institute Helmholtz Centre for Polar and Marine Research (AWI). Further details on laboratory procedures and sample pretreatment are given in Opel et al. (2019). Notably, depending on size, samples were analysed as graphite or gas targets; the small sample size of some gas targets causes a reduced age range for which reliable radiocarbon ages can be obtained (Table 3). The dated material was obtained by hand picking terrestrial plant remains from freeze-dried samples. In a first batch, 26 samples were chosen every 1–1.5 m, representing sediment horizons and their boundaries. On the basis of the obtained dates, five additional samples were chosen on either side of suspected hiatuses to verify and delimit them more reliably. All radiocarbon dates were calibrated using the IntCal13 calibration dataset (Reimer et al., 2013). Ages are given as calibrated years before present (cal yr BP).
Table 3Radiocarbon ages of organic material from sediments and ice wedges of the Sobo-Sise Yedoma cliff. The abbreviation “n/a” stands for “not analysed” if ages were infinite or beyond the calibration limits (Reimer et al., 2013). rbacon-modelled median ages are given for comparison (Fig. S2).
A total of 27 radiocarbon dates were used in the Bayesian age–height model, which was established using the package rbacon 2.3 (2.3.9.1; Blaauw and Christen, 2019) in R version 3.6.1 (R Core Team, 2019). Four ages were not used for the age–height modelling: sample SOB18-03-17 (15 294 ± 67 yr BP) is most likely redeposited (see Sect. 5.1.1 for discussion), two of the dates have unspecified infinite ages of > 42 600 yr BP (SOB18-06-18 and SOB18-06-33), and one further age of 47 021 ± 646 yr BP (SOB18-06-35) was beyond calibration range (Fig. 4). All three ages do, however, support the age–height relation as they are of approximate age.

Figure 4Age–height relation of the Sobo-Sise Yedoma cliff exposure shown in calibrated radiocarbon ages. Note the sampling overlap of the profiles SOB18-01 (circles), SOB18-03 (diamonds), and SOB18-06 (stars) and their alignment to cryostratigraphic units A (blue), B (green), and C (orange). The open diamond indicates one age of redeposited material from sample SOB18-03-17, and open stars indicate infinite radiocarbon ages of samples from profile SOB18-06.
Each profile was modelled individually (Fig. S2). Section thickness was adjusted in relation to sampling frequency along each profile to balance model performance (Blaauw and Christen, 2019). Sediment profile SOB18-01 was modelled using 12 14C dates, a section thickness of 10 cm, and a hiatus at 1.75 m b.s. (22.45 m a.r.l.) and 3.25 m b.s. (20.95 m a.r.l.). Profile SOB-03 was modelled using seven 14C dates, a section thickness of 30 cm, and a hiatus at 7.25 m b.s. (16.95 m a.r.l.). This model was extrapolated 0.5 m beyond the uppermost (youngest) dated sample to cover the entire profile. Profile SOB18-06 was modelled using eight 14C dates and a section thickness of 40 cm and was extrapolated 2.3 m beyond the lowermost radiocarbon age used in the model to cover the lowermost samples of this profile. SOB18-06 represents the oldest deposits of the dataset and infringes on the age limit of radiocarbon dating (Fig. S2). The median of the modelled probability distribution was used to assign an age to each centimetre along the profiles.
Additional age information was obtained from one mammoth tusk found at beach level below the sediment profile SOB18-01 (Fig. 3c) and from host sediments of ice wedges SOB18-08 and SOB18-09 (Table 3). Floral and faunal remains from inside wedge ice were dated where available (Table 3). In total, age information for five ice wedges was obtained from 22 radiocarbon dates. Of those, 19 samples were dated at the MICADAS facility mentioned above, and three samples were dated at the CologneAMS (University of Cologne, Germany), whose laboratory procedures are given in detail in Rethemeyer et al. (2013).
4.1 Chronostratigraphy
The three sediment profiles were sampled in close proximity to cover the entire exposed permafrost sequence at 0.5 m sampling resolution in spatial context. The overlap in sampling heights was applied to account for possible relief diversity during permafrost aggradation (Fig. 2). Profile SOB18-01 covers the uppermost part of the exposure between 24.2 and 15.5 m a.r.l., dated from 2440 to 27 540 cal yr BP. The adjacent sedimentary polygon filling was sampled in profile SOB18-03 between 18.8 and 10.2 m a.r.l., dated from 25 680 to 40 840 cal yr BP. The lowermost profile SOB18-06, sampled about 120 m east of the SOB18-01 between 13.4 and 0.8 m a.r.l., shows ages from 41 420 to > 50 000 cal yr BP (Table 3). The overlap in sampling positions of the three profiles (Fig. 4) and the modelled age–height relation allows for the deduction of a stacked record that differentiates into three chronostratigraphic units:
Unit A – MIS 3, Yedoma IC (52 to 28 cal kyr BP);
Unit B – MIS 2, Yedoma IC (28 to 15 cal kyr BP);
Unit C – MIS 1, Holocene cover (7 to 0 cal kyr BP).
The stacked sequence is not continuous and shows three temporal gaps in the record, which are related to changes in the depositional and/or erosional regimes. Those are discussed in detail in Sect. 5.3. One hiatus is obvious within Unit A (in profile SOB18-03) between about 36 and 29 cal kyr BP, one hiatus within Unit B (in profile SOB18-01) between 20 and 17 cal kyr BP, and one hiatus between units B and C (in profile SOB18-01) between about 15 and 7 cal kyr BP (Fig. 4).
Age inversions are often observed in permafrost chronologies given the effect of cryogenic processes such as cryoturbation within the uppermost thawed active layer before the material enters the perennially frozen state (Bockheim, 2007), the high vulnerability of ice-rich permafrost to thaw, and erosion (Grosse et al., 2011; Günther et al., 2015). An obvious example for the latter is seen in the Sobo-Sise record, where sample SOB18-03-17 has an age of 15 294 ± 67 yr BP (18 570 cal yr BP), while the entire profile SOB18-03 dates from 25 680 to 40 840 cal yr BP (Table 3). We assume that this age of 18 570 cal yr BP most likely represents a contamination from thawed sediment, which was redeposited downwards along the cliff and represents a mixed age of Holocene and older OM. To validate this assumption, additional plant material from sample SOB18-03-17 was picked and dated to 40 840 cal yr BP, in line with the lower age limit of profile SOB18-03.
Three ice wedge profiles of Unit A were dated. Seven 14C dates from ice wedge SOB18-09 range from 48 660 to 36 970 cal yr BP. We found one infinite age of > 48 500 yr BP from the host deposit at the same height level as the sampling transect. Ice wedge SOB14-IW3 shows ages of 43 270 and of 30 930 cal yr BP and two infinite ages of > 31 000 yr BP each. Organic material from ice wedge SOB18-08-I yielded a 14C age of 49 610 cal yr BP.
The SOB18-02-I wedge ice of Unit B was dated by two ages of 25 350 and of 23 470 cal yr BP. The host deposits at the same height level as the sampling profile at about 18 to 20 m a.r.l. show an age range from 23 170 to 21 940 cal yr BP that is in general agreement with the assumed SOB18-02-I formation time. The only direct age information from Unit C wedge ice is available for profile SOB14-IW4, with eight ages spanning from 2290 cal yr BP to modern times (Table 3). Indirect age information is available for SOB18-08-II, whose host deposits at the same height level as the sampling transect were dated to 4480 cal yr BP (Table 3), implying a middle- to late-Holocene formation of this ice wedge.
Relocated material might also enter wedge ice when wintertime frost cracks are filled with snowmelt transporting OM and preserving it in vertical ice veins (Opel et al., 2018). This might be the case for the age determination of 49 610 cal yr BP in ice wedge (IW) SOB18-08-I, which is, however, attributed to Unit A of MIS 3 age by its isotopic composition.
4.2 Cryostratigraphy
Each cryostratigraphic unit is characterized by its specific clastic, organic, and ice compositions. Those were captured by field observations (Wetterich et al., 2019) and analytical data that are described in detail below and summarized in Figs. 5 and 6 and Table 1. Representation of our analytical results is based on the modelled age–height relation for each profile and their stacking by age (Fig. S2).

Figure 5Sediment properties of the Sobo-Sise Yedoma record and their variations over time. Dashed horizontal lines indicate the limits of the cryostratigraphic units A, B, and C. White circles in the plot of grain-size properties relate to the upper x axis (mean grain size).
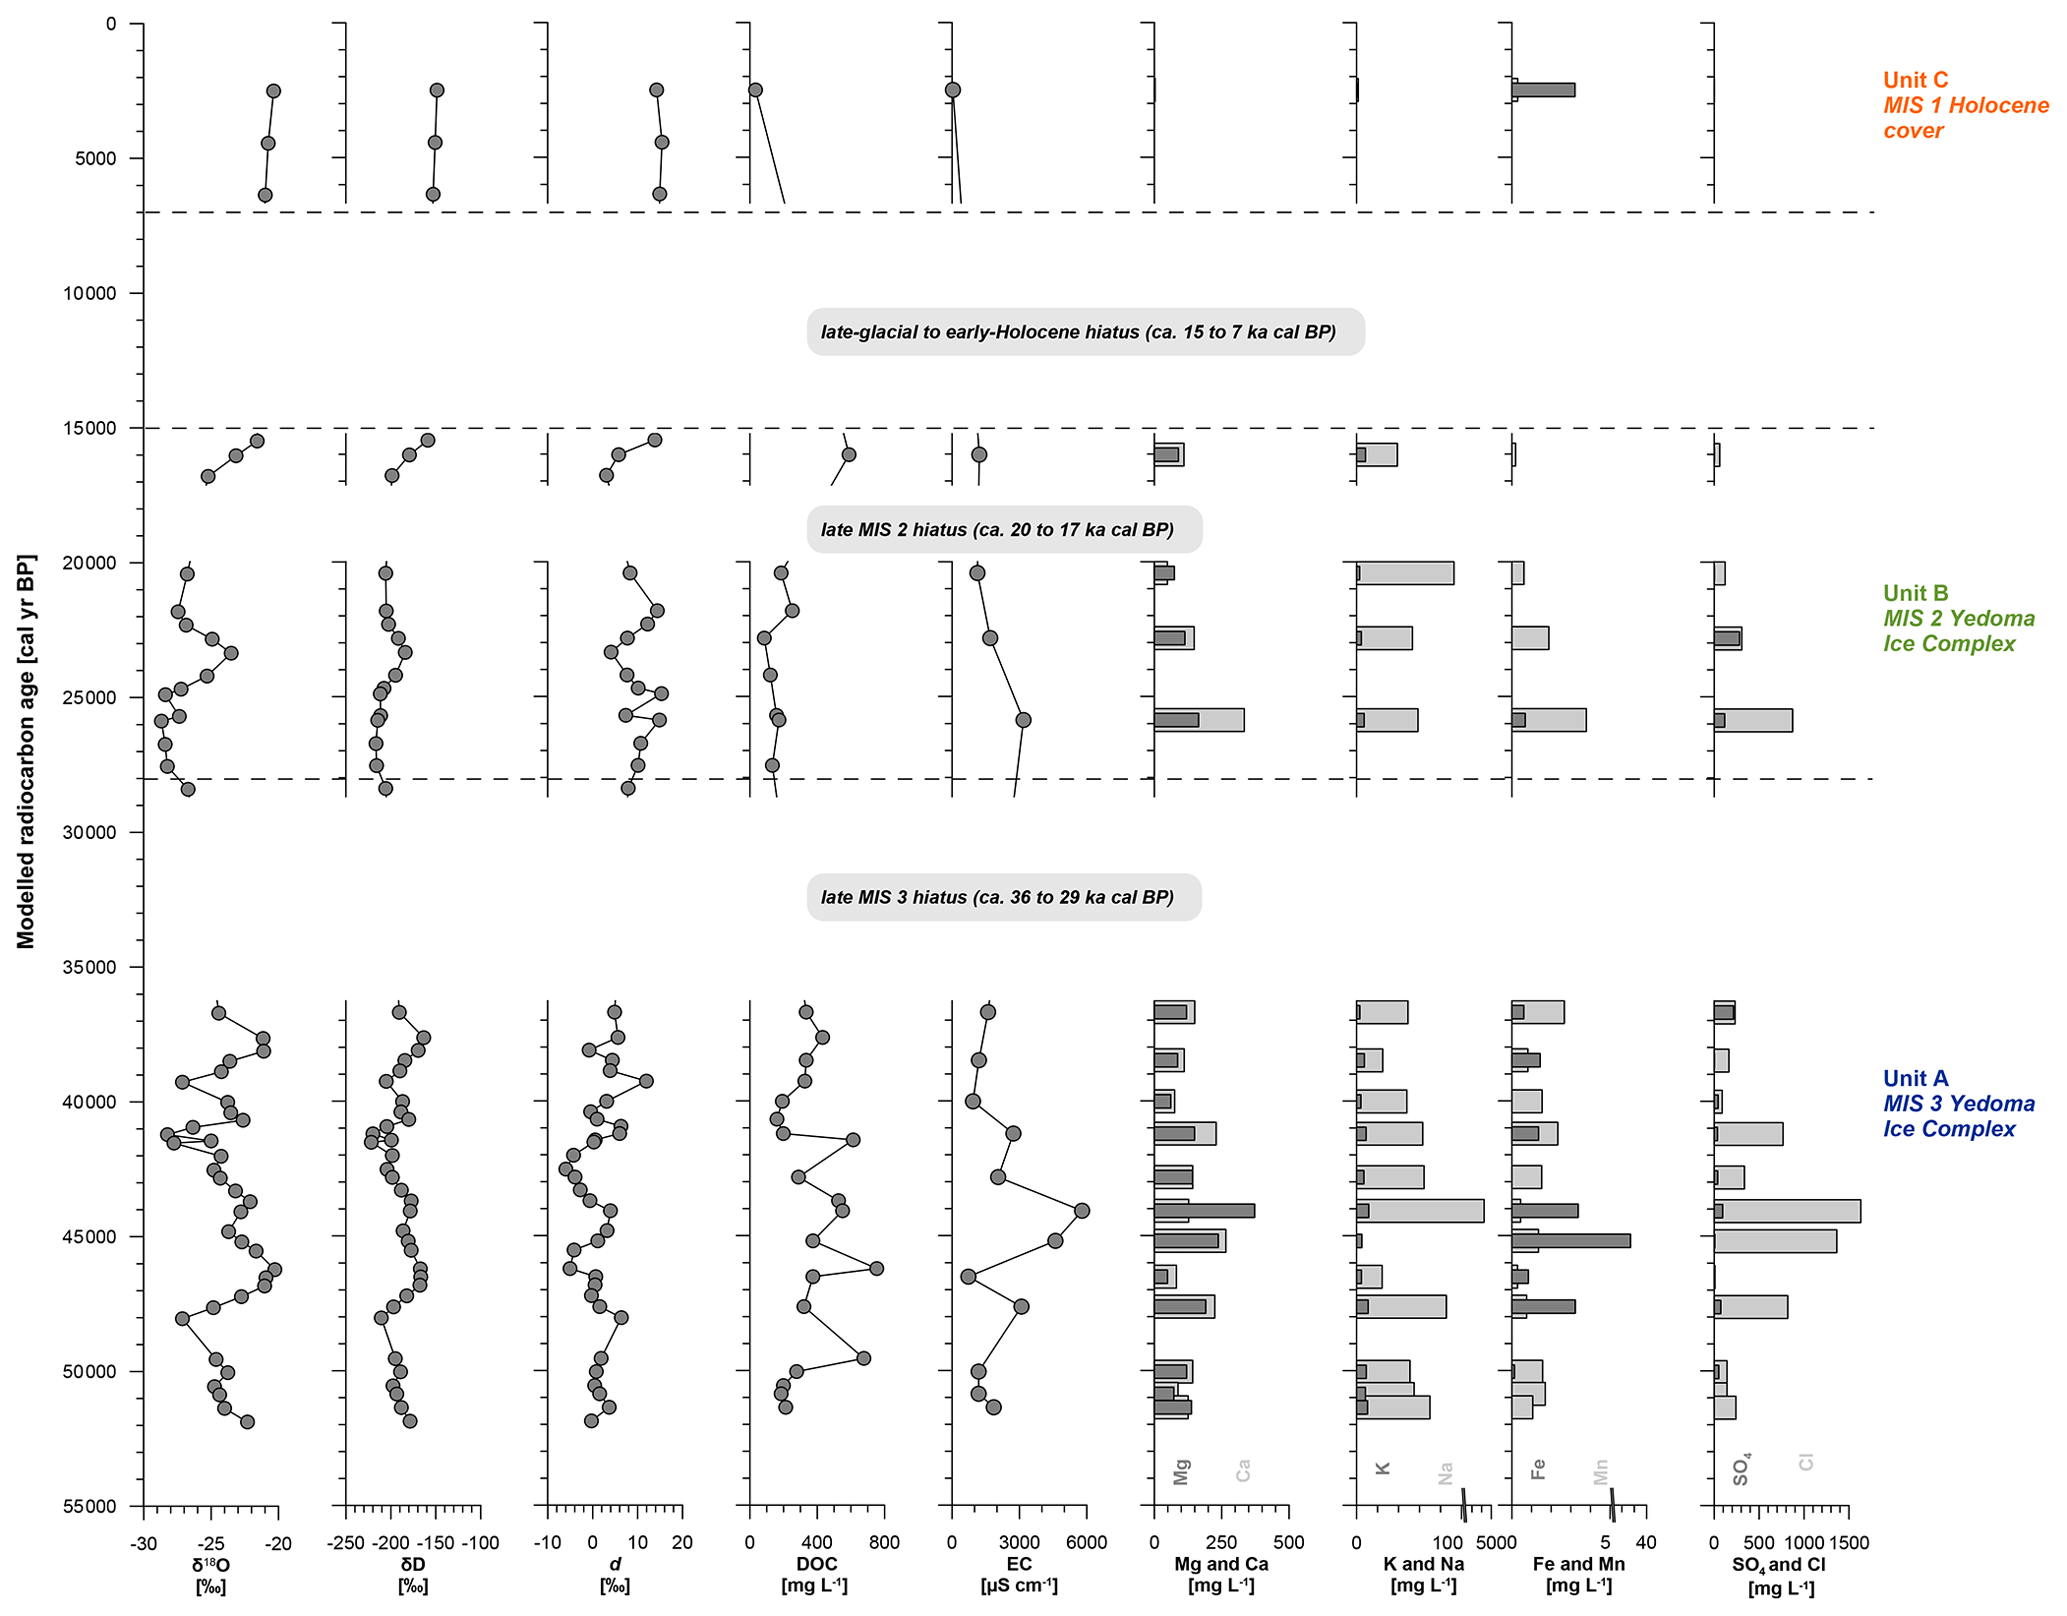
Figure 6Intra-sedimental ice properties of the Sobo-Sise Yedoma record and their variations over time. Dashed horizontal lines indicate the limits of the cryostratigraphic units A, B, and C.
Stable-water-isotope records and age information of six horizontal ice wedge profiles sampled at the Sobo-Sise Yedoma cliff are attributed to the cryostratigraphic units A, B, and C by position (Fig. 7), isotopic composition (Table 2), and age (Table 3). Two of the ice wedge profiles (SOB18-08 and SOB18-02) exhibited stable-isotope compositions pointing to different stages of ice wedge formation, which formed under contrasting climatic conditions and therefore represent different time periods. These differentiations are explained in detail below. Spatial dimensions and other field observations of the wedge ice are summarized in Wetterich et al. (2019). Note that marginal ice wedge samples that underwent isotopic exchange with the host sediment (Meyer et al., 2002a) are excluded from summary statistics given in Table 2, although they are shown in Fig. 7 as grey symbols for completeness of the raw data.

Figure 7Horizontal wedge ice profiles of the Sobo-Sise Yedoma cliff and their alignment to the cryostratigraphic units A (blue graphs), B (green graphs), and C (orange graphs). Upper graphs refer to the deuterium excess data and the respective right y axis. Please note that data points shown in grey are excluded from summary statistics in Table 2. Radiocarbon dates are shown as hollow diamonds and refer to Table 3.
4.2.1 Unit A (MIS 3, Yedoma IC, 52 to 28 cal kyr BP)
The frozen deposits of Unit A are represented by the entire sediment profile SOB18-06 and most of sediment profile SOB18-03 (except for its uppermost two samples that belong to Unit B; Fig. 4). Unit A is evenly composed of grey, poorly sorted sandy silt (mean grain size of 45 ± 12 µm) with a pronounced peak in the coarse-silt fraction and a minor peak in the middle-sand fraction (Fig. 8c).
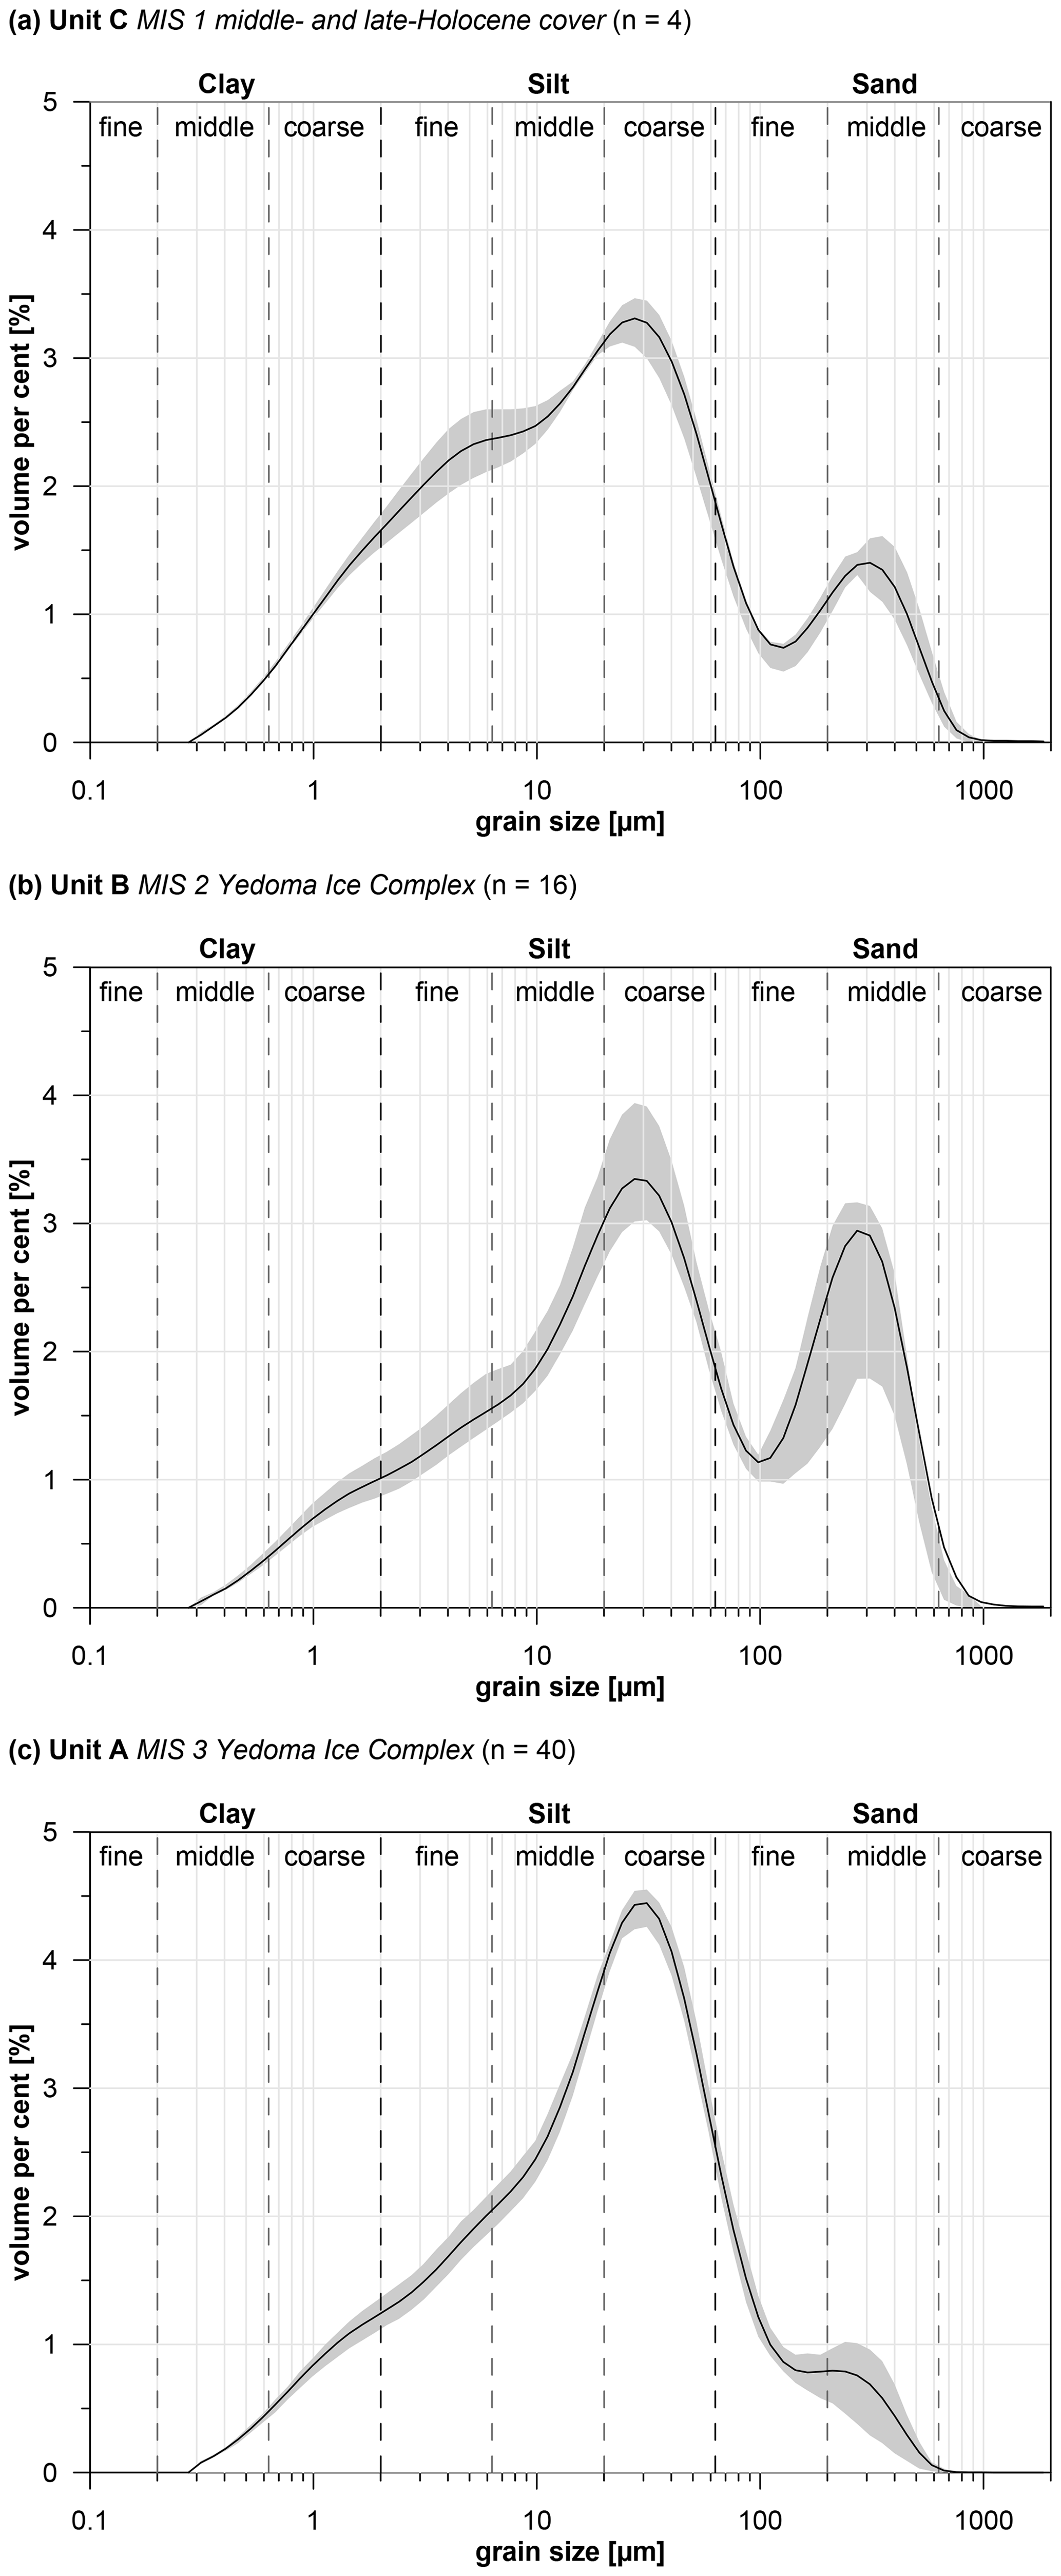
Figure 8Grain-size distribution curves for (a) Holocene Unit C, (b) MIS 2 Unit B, and (c) MIS 3 Unit A of the Sobo-Sise Yedoma cliff. Bold lines indicate the mean value, and grey shaded areas indicate the 25 % to 75 % quartile.
Endmember modelling of grain-size distributions revealed four robust endmembers (rEMs) for the Yedoma IC units A and B. In Unit A, the coarse-silt rEM2 (primary mode at 31 µm) dominates, while the fine-silt rEM1 (primary mode at 6 µm) and fine-sand rEM 3 (primary mode at 76 µm) occur less frequently (Fig. 5). The mean magnetic susceptibility of Unit A is 40 ± 9 SI.
The OM of Unit A deposits consists of numerous twigs and grass remains, black and brownish spots (0.1–0.5 cm in diameter), single peaty lenses (15–20 cm in diameter), and peat layers (10–20 cm up to 130 cm thick). The mean TOC and TN values are 4.5 ± 2.5 and 0.3 ± 0.1 wt %, respectively; C∕N is 12.9 ± 2.5. The corresponding mean stable-isotope values are −27.3 ± 0.9 ‰ for δ13C and 2.2 ± 0.6 ‰ for δ15N, respectively.
The organic component represented as DOC in intra-sedimental ice of Unit A shows large variations between 161 and 754 mg L−1 at a mean value of 367 mg L−1.
The intra-sedimental ice of Unit A amounts to a gravimetric ice content of 49 ± 10 wt %, manifested in lenticular cryostructures and reticulate and wavy, sometimes structureless cryostructures between the ice layers. The stable-water-isotope composition of the intra-sedimental ice shows a mean value of −23.9 ± 2.0 ‰ for δ18O and −190 ± 15 ‰ for δD (Fig. 9a). The d values also vary considerably between −6 ‰ and 12 ‰ (mean of 1.5 ‰).
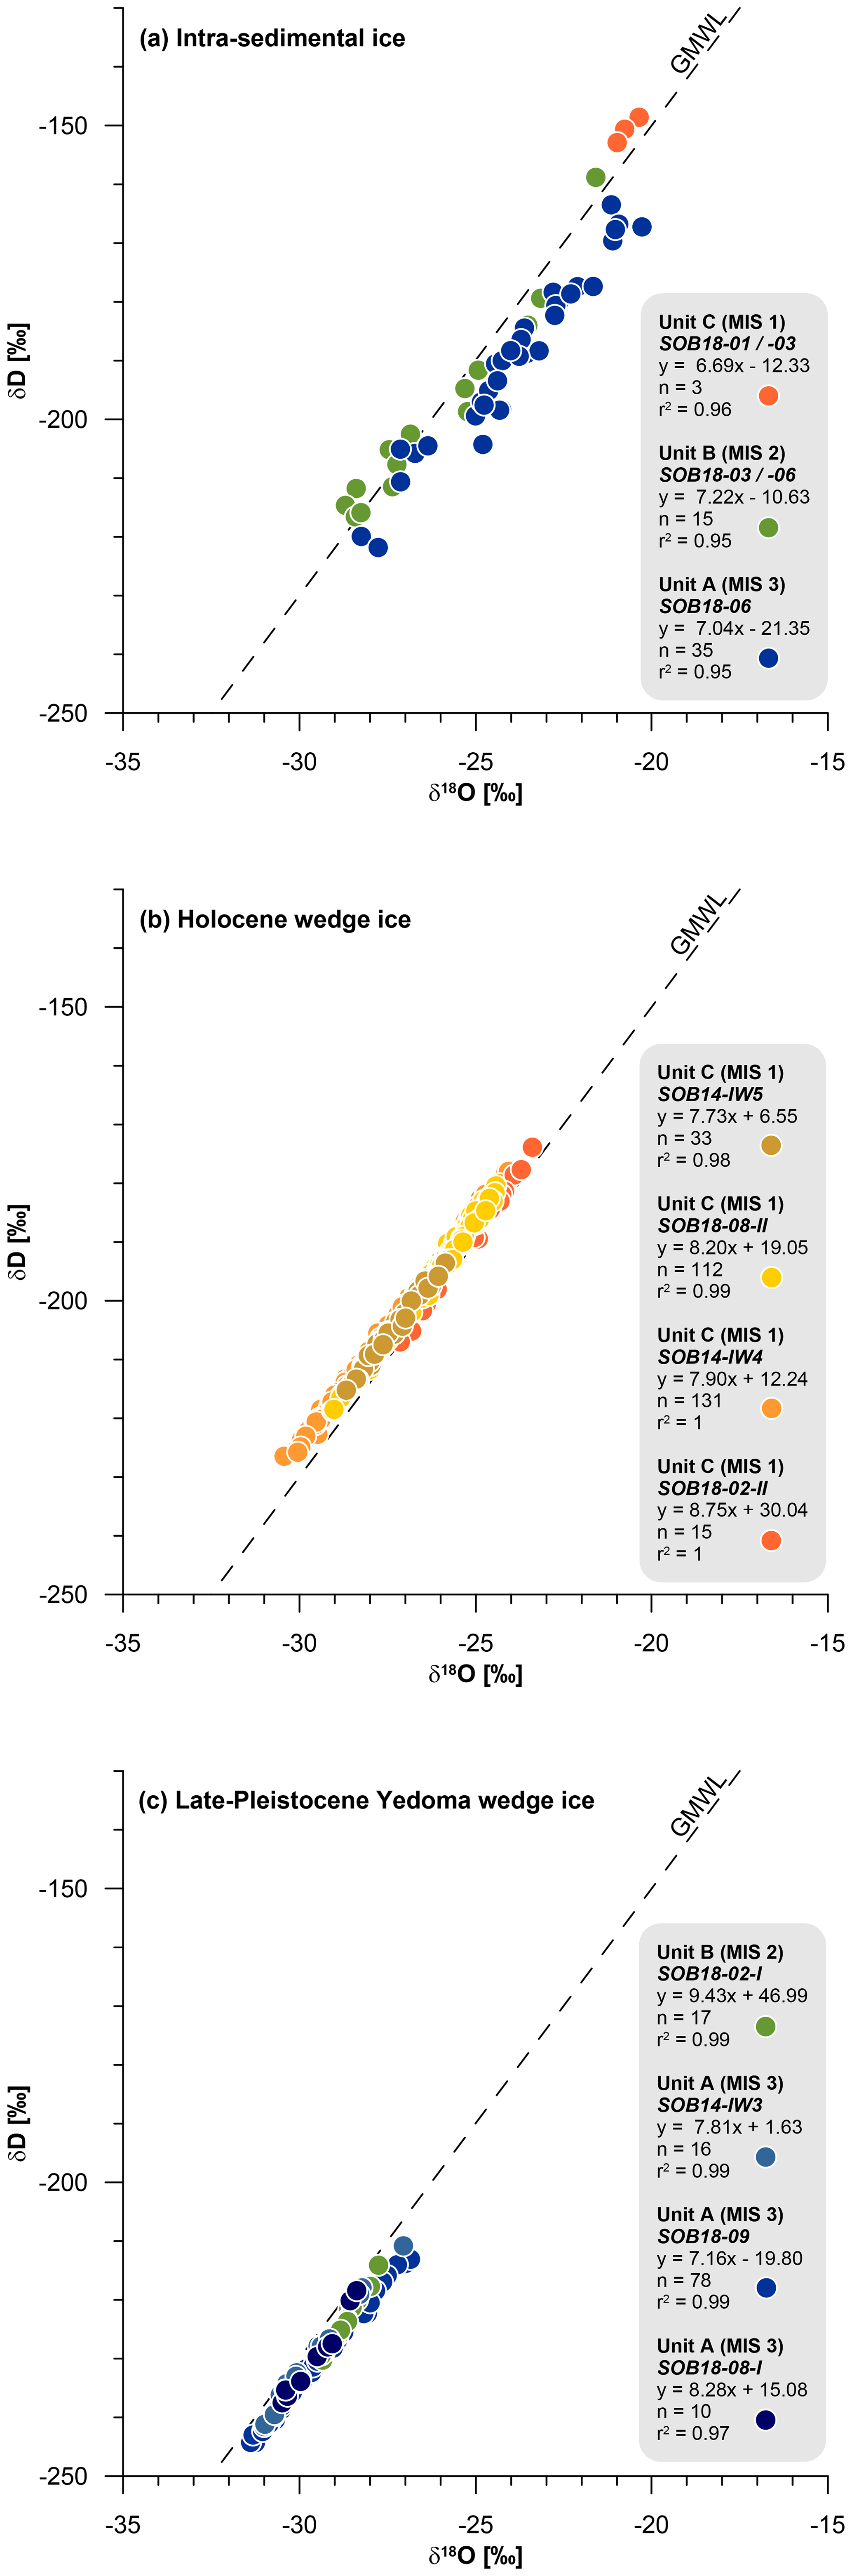
Figure 9Stable-water-isotope composition (δ18O, δD) of (a) intra-sedimental (excess and pore) ice from units A, B, and C of (b) Holocene wedge ice of Unit C and of (c) late-Pleistocene Yedoma wedge ice of units B and A of the Sobo-Sise cliff.
The electrical conductivity of the intra-sedimental ice of Unit A shows a large variability between about 730 and 5780 µS cm−1 (mean 2245 ± 1570 µS cm−1) and is thus higher than in units B and C. The cations Ca and Mg dominate the hydrochemical composition, suggesting also substantial concentrations of HCO3 that were, however, not measured due to limited sample amount. Na and Cl concentrations also reach higher values and dominate the peak in ion content around 44–43 cal kyr BP (Fig. 6). At this peak increased Fe concentrations are also notable.
The ice wedge SOB18-09 of Unit A reveals an isotopic composition with mean values of −29.7 ‰ in δ18O, −232 ‰ in δD, and d of 5.2 ‰. SOB14-IW3 shows identical mean values of −29.7 ‰ in δ18O and −231 ‰ in δD but a higher d of 7.2 ‰.
The eastern part of profile SOB18-08 (differentiated as SOB18-08-I) is characterized by more depleted values in δ18O (by 4 ‰), δD (by 40 ‰), and d (by 4 ‰) if compared to the main part of the profile (SOB18-08-II), which is attributed to Unit C. Mean values of SOB18-08-I are −29.6 ‰ in δ18O, −230 ‰ in δD, and 6.8 ‰ in d, close to the respective values of the other two ice wedge profiles of Unit A.
In summary, the ice wedges of Unit A show most depleted mean values down to −29.9 ‰ in δ18O (range from −31.4 ‰ to −26.9 ‰) and −232 ‰ in δD (range from −244 ‰ to −213 ‰). They plot mainly below the global meteoric water line (GMWL) and show low d between 5.2 ‰ and 7.4 ‰ in comparison to IWs of units B and C. The slopes in co-isotopic plots of ice wedge data from Unit A vary between 7.2 and 8.3 (Fig. 9c).
4.2.2 Unit B (MIS 2, Yedoma IC, 28 to 15 cal kyr BP)
Unit B comprises the uppermost two samples of sediment profile SOB18-03 and most of sediment profile SOB18-01 (except its uppermost four samples that belong to Unit C; Fig. 4). Unit B is composed of brownish grey, poorly sorted sandy silt (mean grain size 113 ± 64 µm) and occasional sand lenses, resulting in a bimodal GSD and pronounced peaks in the coarse-silt and medium-sand fractions (Fig. 8b).
Generally coarser grain-size distributions than in Unit A are characteristic for Unit B and supported by the EMMA results. The middle-sand rEM4 (primary mode at 310 µm) is present in the lower part of Unit B, while fine-silt rEM1 and coarse-silt rEM2 dominate the upper part of Unit B (Fig. 5). The fine-sand rEM3 is less frequent in Unit B compared to Unit A.
The magnetic susceptibility of Unit B has a mean of 53 ± 9 SI. OM is present as single twig remains (2–4 mm in diameter), dark brown spots, finely dispersed organic remains, and peaty lenses (5 to 25 cm in diameter). The mammoth tusk found at beach level below the profile SOB18-01 most likely originates from Unit B deposits belonging to the faunal component of OM. It was radiocarbon-dated to 16 480 cal yr BP and thus fits into the age range of Unit B. This finding fits well into the fossil record of the late-Pleistocene mammoth fauna in the region (Kuznetsova et al., 2019). The OM content of Unit B is lower compared to that of Unit A, with mean values of 2.1 ± 1.3 wt % for TOC and 0.2 ± 0.1 wt % for TN, resulting in mean C∕N of 10.5 ± 2.4.
The OM isotopic composition exhibits lower mean values than in Unit A of −26.1 ± 0.6 ‰ for δ13C and 1.9 ± 1.0 ‰ for δ15N. The DOC content of intra-sedimental ice of Unit B is generally lower compared to those of Unit A, with values from 85 to 589 mg L−1 (mean of 212 mg L−1).
The ice content of Unit B is the lowest of all units, with 43 ± 10 wt %. Prevailing cryostructures are lenticular (1–5 cm thick ice layers in 1–20 cm distance) and reticulate (1–2 mm thick ice lenses 4–12 mm long) or wavy parallel (1 mm thick ice lenses 4–10 mm long) between the ice layers. If compared to Unit A, the intra-sedimental ice of Unit B shows similar mean values and comparable ranges in δ18O of −26.2 ± 2.2 ‰ and in δD of −200 ± 16 ‰ (Fig. 9a). The mean d value of about 10 ‰ is much higher than in Unit A, ranging from 3 ‰ to 15 ‰.
The hydrochemical composition of intra-sedimental ice of Unit B shows an upward decreasing trend in ion content with electrical conductivity ranging from about 3180 to 1130 µS cm−1 (mean: 1810 µS cm−1; Fig. 6). Ca and Mg cations dominate the cation composition, while Cl concentrations decrease upwards.
The only IW record of Unit B was obtained in the eastern part of profile SOB18-02. Like SOB18-08-I, the isotopic composition of SOB18-02-I differs from the western part of its profile (SOB18-02-II attributed to Unit C) by more depleted isotopic mean values and a lower d: −28.8 ± 0.5 ‰ in δ18O, −225 ± 5 ‰ in δD, and d of 5.8 ± 0.9 ‰. The values plot below the GMWL, and the co-isotopic plot shows a slope of 9.4 (Fig. 9c).
4.2.3 Unit C (MIS 1, Holocene cover, 7 to 0 cal kyr BP)
The uppermost four samples of sediment profile SOB18-01 represent the cryostratigraphic Unit C including the uppermost seasonally thawed active layer (of 0.2 m on 20 July 2018 at the sampling site) that consists of modern vegetation and peat (Fig. 4). Below the active layer, grey poorly sorted sandy silt is present. Its grain-size distribution is bimodal with peaks in the coarse-silt and medium-sand fractions (mean grain size of 66 ± 13 µm; Figs. 5, 8a). The mean MS is the lowest of all units, with 32 ± 23 SI, which corresponds to the highest OM content (present in numerous peaty lenses, 2 to 25 cm in diameter), with mean TOC of 11.3 ± 9.9 wt % and mean TN of 0.6 ± 0.3 wt %. The C∕N is highest for all units, with a mean value of 18.5 ± 8. The OM stable-isotope composition exhibits the most depleted mean value of −28.0 ± 0.2 ‰ for δ13C of all units and a mean value of 2.1 ± 0.7 ‰ for δ15N. From Unit C only one measurement of DOC of intra-sedimental ice is available, showing the lowest value of the entire DOC data with 34 mg L−1.
The protective layer underlying the thawed active layer (Kanevskiy et al., 2017) is characterized by a high ice content of 80 wt %, representing ice segregation towards the freezing front during the annual freeze–thaw cycles. The cryostructures are reticulate, with 2–4 mm thick and 4–10 mm long ice lenses. Below, lenticular (up to 10 mm thick ice layers at 2–8 cm distance) and reticulate (1–4 mm thick ice lenses, 6–12 mm long) cryostructures are present. The stable-water-isotope composition of intra-sedimental ice is less depleted than in units A and B, with mean values of −20.7 ± 0.3 ‰ in δ18O and −151 ± 2 ‰ in δD, and shows only low variation (Fig. 9a), likely due to the low sample number (n=3). The d value is highest for all units, with about 15 ‰.
The hydrochemical composition in intra-sedimental ice of Unit C was characterized in only one sample, which shows a very low electrical conductivity of 36 µS cm−1, and major ion concentrations of less than 2 mg L−1 except for Ca and Fe.
One complete IW profile (SOB14-IW4) and two profile parts (SOB18-08-II and SOB18-02-II) belong to the cryostratigraphic Unit C of Holocene cover deposits. We furthermore consider the Holocene ice wedge profile SOB14-IW5 from the lowermost part of the Yedoma slope that might represent a former thermokarst basin (alas) level overlying the Yedoma IC. The isotopic composition of SOB14-IW4 shows mean values of −27.8 ‰ in δ18O, −207 ‰ in δD, and 14.9 ‰ in d. Less depleted values in δ18O of −27.3 ‰, −26.2 ‰, and −25.2 ‰ are found in profiles SOB14-IW5, SOB18-08-II, and SOB18-02-II, respectively. The according δD mean values from these three profile are −204 ‰, −196 ‰, and −190 ‰, with d values of 13.8 ‰, 13.8 ‰, and 11.2 ‰. All wedge ice records of Unit C are clearly distinguished from those of units A and B by less depleted δ18O and δD and d values well above 10 ‰ (Table 2). They plot predominantly above the GMWL. The co-isotopic plot reveals a large range of 7 ‰ in δ18O from −30.4 ‰ to −23.4 ‰ and of 53 ‰ in δD from −227 ‰ to −174 ‰. The respective slopes vary between 7.7 and 8.8 (Fig. 9b).
5.1 Cryolithological properties of the Sobo-Sise Yedoma IC and its Holocene cover
5.1.1 Permafrost aggradation rates and deposition history
Excluding the chronological gap between about 36 and 29 cal kyr BP within Unit A, we assume continuous permafrost aggradation of the MIS 3 Yedoma IC on Sobo-Sise from at least about 52 to 36 cal kyr BP, which is represented by a 16 m thick permafrost sequence. The resulting aggradation rate of the MIS 3 Yedoma IC amounts to about 1 m kyr−1. The continuous permafrost aggradation assumed from the MIS 2 Yedoma IC between about 28 and 20 cal kyr BP, excluding the hiatus within Unit B (from 20 to 17 cal kyr BP), formed a 5 m thick sequence at a rate of about 0.7 m kyr−1. If compared to the Bykovsky Yedoma IC record (site Mamontovy Khayata; Schirrmeister et al., 2002a), higher aggradation rates are obvious: about 1.5 m kyr−1 for MIS 3 (12 m thick sequence between 46 and 38 cal yr BP) and about 0.85 m kyr−1 for MIS 2 (6 m thick sequence between 28 and 21 cal kyr BP). Thus, less permafrost aggradation during MIS 2 than during MIS 3 is also seen on Bykovsky Peninsula. However, it should be noted that the syngenetic growth of ice-oversaturated permafrost such as the Yedoma IC is not only controlled by clastic and organic sedimentation but further triggered by formation of pore and segregation ice that contributes 49 ± 10 wt % in MIS 3 and 43 ± 10 wt % in MIS 2 deposits to the Yedoma IC on Sobo-Sise. The volumetric ice content based on the absolute ice content (assuming ice saturation if the ice content is > 20 wt %) according to Strauss et al. (2012) amounts to 66 ± 9 vol % and 65 ± 8 vol % for MIS 3 and MIS 2, respectively (Fuchs et al., 2020). At this rather equal volumetric share of intra-sedimental ice during MIS 3 and MIS 2, mainly organic accumulation seems to have controlled the difference in permafrost aggradation rates. It should further be noted that growing ice wedges deform the frozen deposits in between by material transport from the polygon centre toward the rim and upward push (Mackay, 1981). Thus, the vertical thickness of the sediment layers, determined now, might exceed the initial thickness due to the formation of intra-sedimental (excess) ice but also due to lateral material transport by the growing ice wedges. The MIS 1 cover deposits accumulated the uppermost 1.4 m since about 6.4 cal kyr BP. Due to freeze–thaw cycles in the active layer and thaw subsidence on the modern Sobo-Sise Yedoma surface of several centimetres per year (Chen et al., 2018), the aggradation rate for Unit C has not been calculated.
The MIS 3 Yedoma IC of Unit A is characterized mainly by coarse silt and partly by fine sand. This is also seen in the prevalent rEM2 and rEM3 of Unit A and differs from the bimodal grain-size characteristics of the MIS 2 Yedoma IC of Unit B, with pronounced peaks in the coarse-silt and medium-sand fractions represented predominantly by rEM4 and rEM2 (Figs. 8, 10, S1). Such changes in grain-size distributions of the MIS 3 and MIS 2 Yedoma IC may point to different material sources and/or transport processes. A study by Schirrmeister et al. (2020) of Yedoma IC deposition history, sources, and material transport mechanisms includes the neighbouring study sites on Bykovsky Peninsula and Kurungnakh-Sise Island (Fig. 1) but lacks a differentiation into the MIS 3 and MIS 2 Yedoma IC as undertaken for data from Sobo-Sise. Therefore, a direct comparison per formation period is of less use to disentangle changes in sedimentation over time, although some general information can be deduced. The medium-sand rEM4 grain-size class of the Sobo-Sise data relates to high-energy transport including saltation in meltwater run-off or fluvial water (rEM2 in Schirrmeister et al., 2020). The fine-sand rEM3 represents overbank deposits or settled suspensions in temporarily flooded sections during floodplain deposition (rEM4 in Schirrmeister et al., 2020), while the coarse-silt rEM2 (rEM5 in Schirrmeister et al., 2020) might relate to floodplain deposition as well but could also originate from aeolian sources (Vandenberghe, 2013) or frost weathering processes (Schwamborn et al., 2012). The fine-silt rEM1 (rEM8 in Schirrmeister et al., 2020) reflects low-energy settling of suspended material from aeolian or pedogenic sources under still-water conditions, which is characteristic in low-centre polygon ponds. Thus, the Yedoma IC of Sobo-Sise formation during MIS 3 with prevailing fine sand (rEM3) and coarse silt (rEM2) derived mainly from floodplain-related or meltwater run-off alluvial deposition processes but possibly also includes aeolian and frost-weathering components. The same coarse-silt rEM2 dominates the grain-size distributions from MIS 2 deposits with a pronounced peak (Figs. 8, 10, S1). We therefore assume a depositional regime similar to that in MIS 3 for this time. MIS 2 deposition, however, shows a second pronounced peak in medium sand (rEM4), pointing to occasional high-energy material transport in alluvial fan environments with strong meltwater run-off and/or fluvial transport. Sparse vegetation cover as deduced from LGM climate conditions in the area (Andreev et al., 2011) might have promoted the potential for high transport energy in a barren landscape. The differing grain-size compositions at the three location on Bykovsky, Sobo-Sise, and Kurungnakh-Sise reflect local diversity in accumulation processes, for example with higher fluvial input on Kurungnakh-Sise Island, but generally support the multi-process and multi-source regional Yedoma IC formation (Schirrmeister et al., 2020).
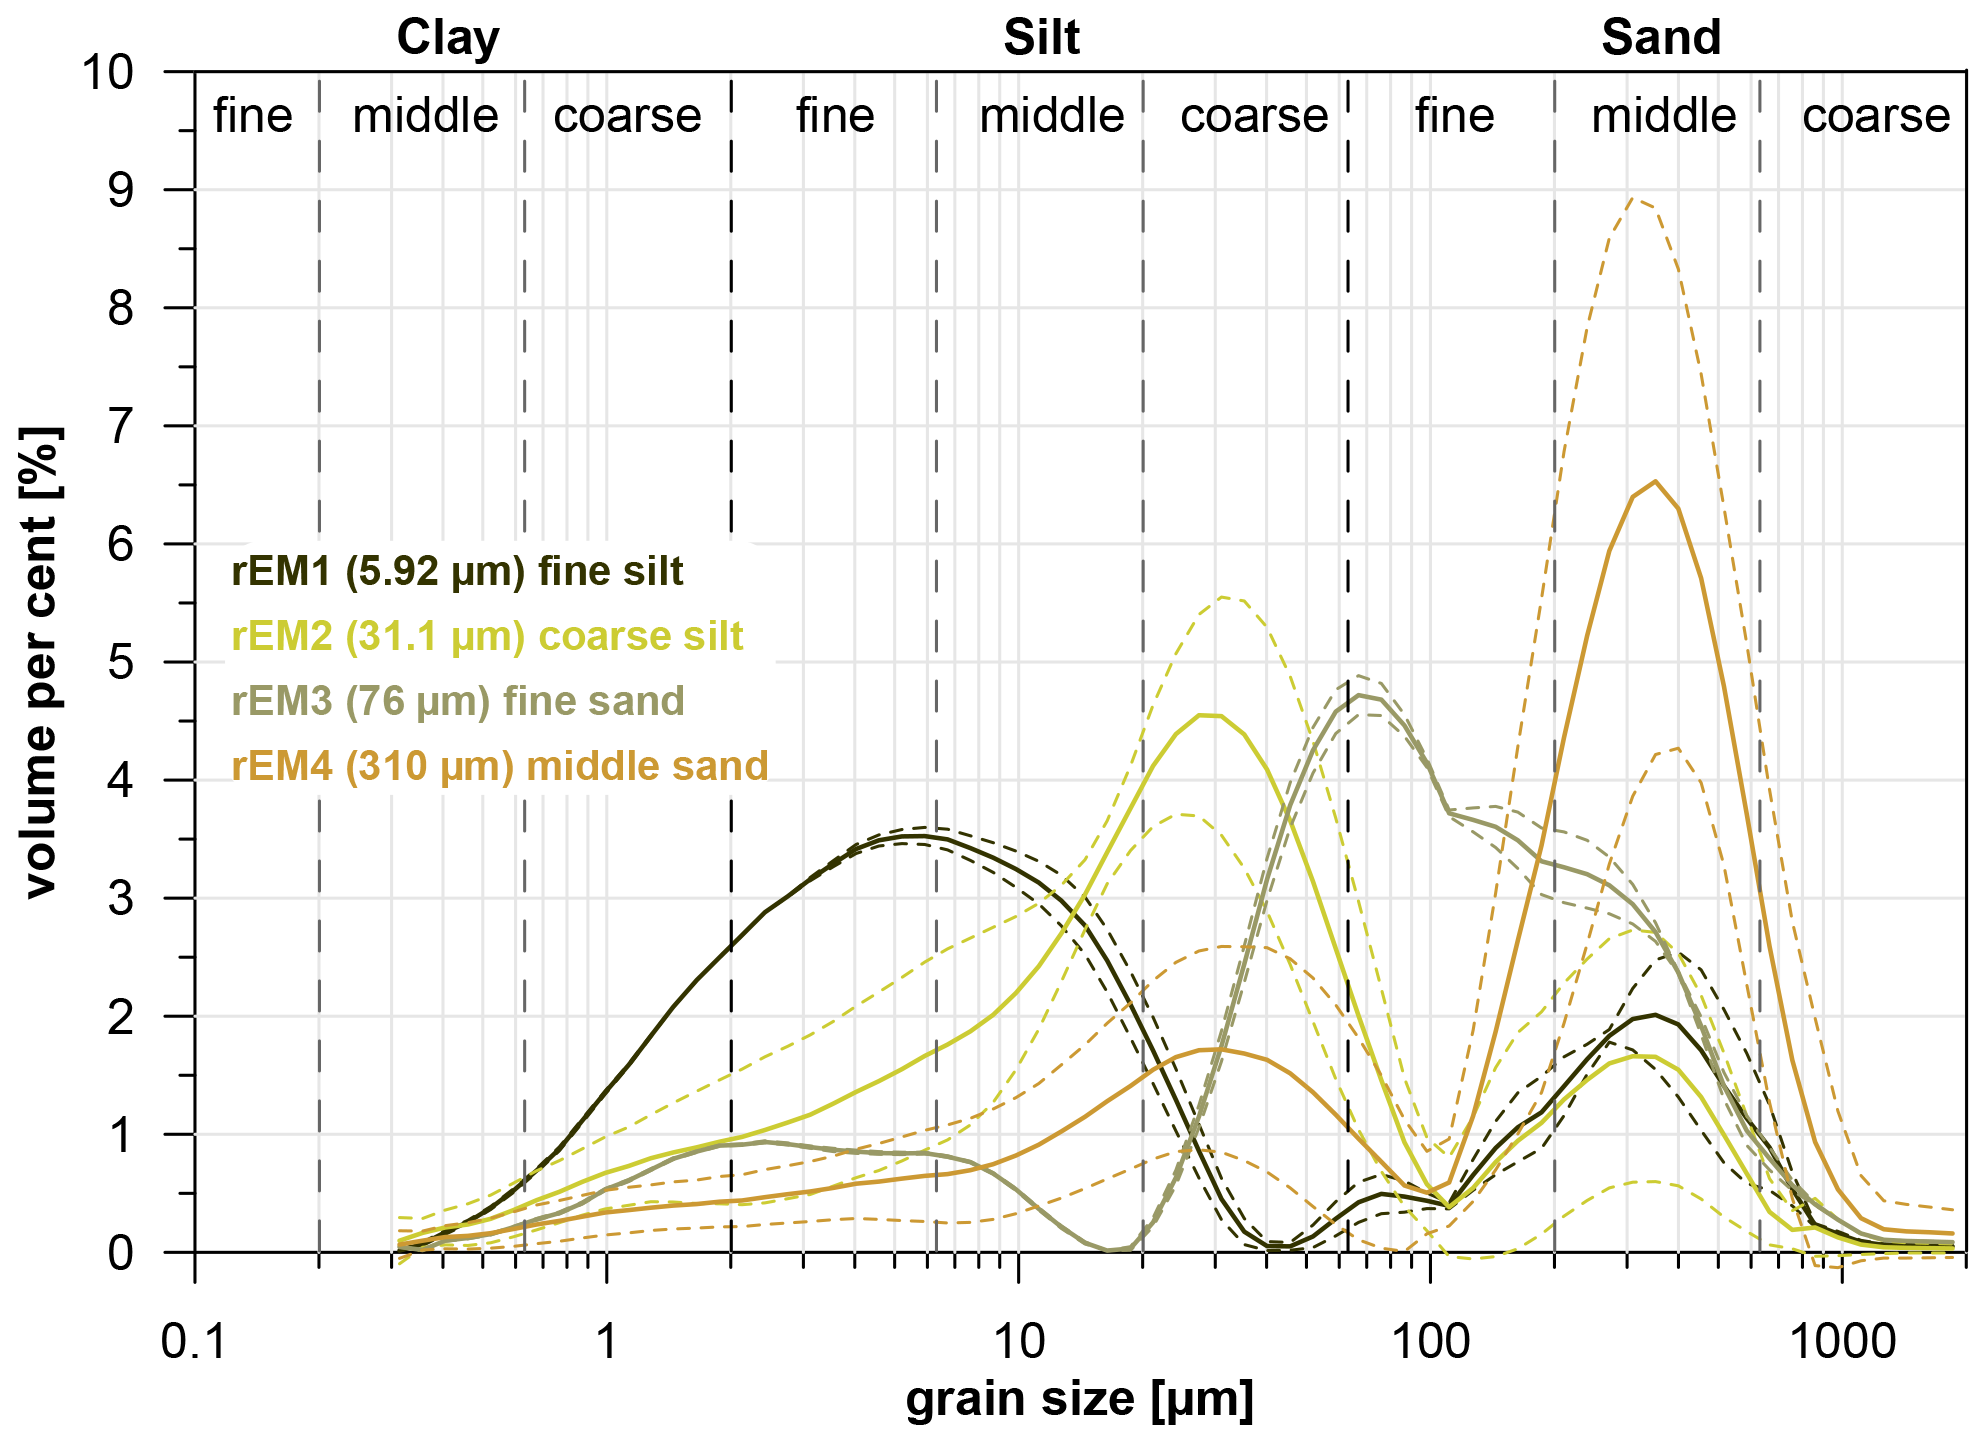
Figure 10Grain-size distribution curves and endmember modelling (EMMA) of both Yedoma IC units A and B from the Sobo-Sise Yedoma cliff. EMMA revealed four robust endmembers (rEMs), rEM1 has its primary mode at 5.91 µm in the fine silt, rEM2 has its primary mode at 31.1 µm in the coarse silt. The rEMs 3 and 4 have their primary modes in the fine sand (76 µm) and middle sand (310 µm), respectively.
5.1.2 Organic-matter stocks and decomposition
The OM characteristics of the Sobo-Sise Yedoma IC differentiate into twofold-higher organic-carbon (TOC mean of 4.5 ± 2.6 wt %) and 50 % higher nitrogen (TN mean of 0.3 ± 0.1 wt %) content in Unit A (MIS 3) if compared to those of Unit B (MIS 2), with mean TOC of 2.1 ± 1.3 wt % and mean TN of 0.2 ± 0.1 wt %. The resulting C∕N ratios are slightly higher in Unit A, with 12.9, than in Unit B, with 10.5 (Table 1). A more productive tundra–steppe environment during MIS 3 (Unit A) with higher OM accumulation at comparable decomposition rates if compared to MIS 2 (Unit B) is deduced.
Furthermore, Unit A has significantly higher carbon and nitrogen densities, with a mean of 29 ± 15 kg carbon m−3 and 2.2 ± 1.0 kg nitrogen m−3 compared to 14 ± 8 kg carbon m−3 and 1.4 ± 0.4 kg nitrogen m−3 in Unit B. Consequently, the OM input into the Lena river by fast erosion of the Yedoma cliff of Sobo-Sise (up to 22.3 m yr−1; Fuchs et al., 2020) is mainly controlled by Unit A, which stores twice the amount of carbon compared to Unit B and which is exposed over about two-thirds of the cliff height (Fig. 4).
The Holocene cover of Unit C shows highest TOC (mean 11.3 ± 9.9 wt %), TN (mean 0.6 ± 0.3 wt %), and C∕N (mean 18.5 ± 8.0) of the record, although with large variability (Table 1) mainly due to the low number of samples (n=4) in Unit C. However, for active-layer samples in the Holocene cover layer of Sobo-Sise, Fuchs et al. (2018) detected mean values with high variability, too, with 6.7 ± 7.4 wt %, 0.4 ± 0.1 wt %, and 15.8 ± 12.3 for TOC, TN, and C∕N, respectively, indicating a general heterogeneity in OM accumulation in the uppermost soil layer. If compared to the neighbouring Yedoma IC sites on Bykovsky Peninsula (Schirrmeister et al., 2002a) and Kurungnakh-Sise Island (Schirrmeister et al., 2003; Wetterich et al., 2008a), the same pattern in OM properties over time from MIS 3 to MIS 1 supports regionally similar variations in palaeoenvironmental conditions.
In relict permafrost, the stable-carbon- and stable-nitrogen-isotope composition of organic matter is strongly controlled by the original botanical composition and further altered by decomposition (Weiss et al., 2016). The latter leads preferentially to loss of isotopically lighter 12C and 14N and thus relatively enriches the fraction of the heavier isotopes 13C and 15N by leaching and mineralization processes (Tahmasebi et al., 2018). This fractionation towards less depleted isotopic carbon and nitrogen compositions over time occurs before the OM enters the perennially frozen state. Thus, the permafrost aggradation rate during distinct periods further influences the rate of OM decomposition. However, the differences seen per unit in the Sobo-Sise Yedoma record are minor for δ15N, with mean values of around 2 ‰ for all three units (Table 1, Fig. 11). The δ13C unit mean values vary over about 2 ‰ (between about −28 ‰ and −26 ‰) and are most depleted for Unit C (MIS 1). Due to these only little variations and the range overlap, no significant differences in OM decomposition can be interpreted from the stable-carbon- and stable-nitrogen-isotope composition for the three units.
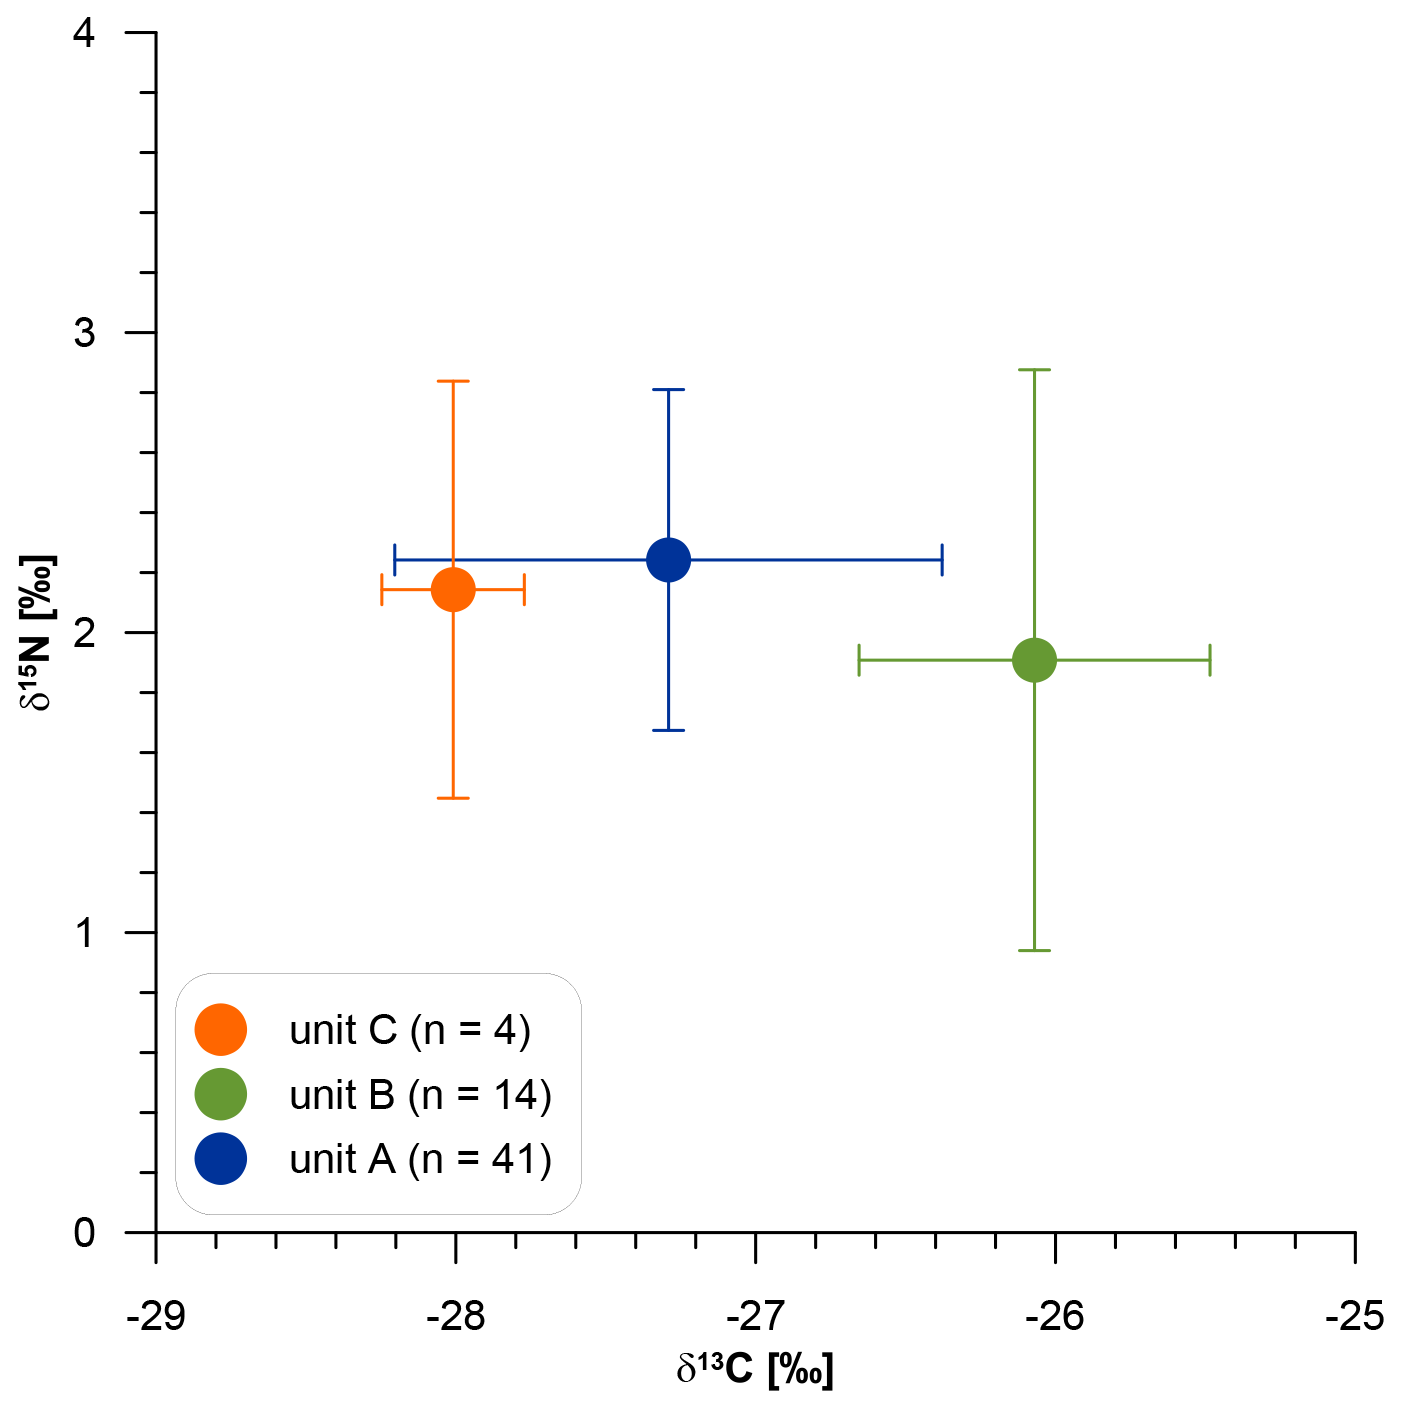
Figure 11Stable-carbon- and stable-nitrogen-isotope composition of organic matter from cryostratigraphic units A, B, and C of the Sobo-Sise Yedoma cliff.
5.1.3 Intra-sedimental ice characteristics
The highest DOC concentrations up to 754 mg L−1 in MIS 3 together with the highest average C∕N ratios indicate OM preservation (Figs. 5, 6). Rapid sediment and OM accumulation rates, as indicated by the radiocarbon-based age–depth relationship, lead to effective syngenetic permafrost formation so that particulate and dissolved OM is rapidly incorporated into permanently frozen deposits. Hence, OM degradation is minimized, and labile or soluble dissolved-organic-matter (DOM) fractions have not been drained or flushed out from rapidly aggrading permafrost.
The stable-water-isotope (δ18O and δD) and major ion compositions as well as DOC concentrations of Sobo-Sise intra-sedimental ice reflect the general cryostratigraphy and have palaeoclimate implications. Preservation of pore water during formation of segregated ice occurs via a wide range of processes. Nevertheless, several studies (e.g. Mackay, 1983; Murton and French, 1994; Kotler and Burn, 2000; Schwamborn et al., 2006; Fritz et al., 2012) have shown that δ18O and δD isotopes in intra-sedimental ice can still reflect environmental and climatic changes when considered with caution and/or focused on pore ice (Porter et al., 2019; Porter and Opel, 2020). Higher δ18O and δD but lower d values are found in MIS 3 compared to MIS 2 (Figs. 6, 9). Relatively warm summers during the MIS 3 interstadial might explain the lower d values in associated intra-sedimental ice due to a higher water loss by evaporation (i.e. kinetic fractionation). This would lead to a water reservoir in polygon ponds and soil moisture that becomes successively depleted in 16O and 1H compared to the original precipitation. Increased temperature and precipitation amplitudes during MIS 3 (Andreev et al., 2011; Pitulko et al., 2017) may have led to frequent drying and re-wetting in polygon tundra and thus to enhanced kinetic fractionation. Another process of kinetic fractionation producing the same pattern are multiple freeze–thaw cycles of soil moisture in the active layer (Throckmorton et al., 2016).
Elevated ion (Mg, Ca, Na, Cl) concentrations with EC up to 5800 µS cm−1 in the MIS 3 record (Unit A; Fig. 6) are likely caused by frequent drying and re-wetting in polygonal tundra in times of higher summer temperature and precipitation amplitudes during the interstadial compared to the MIS 2 stadial (Unit B). Meyer et al. (2002a) found similarly elevated EC values of 5500 µS cm−1 in MIS 3 deposits on Bykovsky Peninsula. Modern surface waters in central Yakutia at high continentality show EC values of up to 5710 µS cm−1 (Wetterich et al., 2008b) and even up to 7744 µS cm−1 (Pestryakova et al., 2018). Ion-rich pore waters have also been found in MIS 3 deposits at Buor Khaya Peninsula (Schirrmeister et al., 2017) but with different composition and including a distinct saline horizon. In contrast, ion composition in the Sobo-Sise Yedoma IC remained stable throughout MIS 2 and MIS 3 and is dominated by Mg, Cl, and Ca in both units. Therefore, we assume that water and sediment sources did not change over time but reflect higher evaporation during warmer summers in MIS 3 if compared to MIS 2.
5.2 Palaeoclimatic implications from regional wedge ice records
Sobo-Sise ice wedge stable isotopes show a complex pattern that at least in parts can be related to the fact that Holocene ice wedges formed epigenetically within older late-Pleistocene deposits and penetrated pre-existing ice wedges. This may be related to subsidence and thermo-erosional processes that thaw permafrost, lower the surface, and complicate the stratigraphic attribution of the wedge ice. The stable-isotope composition of ice wedge profiles sampled in the central (SOB18-02) and western parts (SOB18-08) of the Sobo-Sise cliff allows the differentiation of late-Pleistocene and Holocene wedge ice.
Generally, late-Pleistocene wedge ice is characterized by well-depleted δ18O and δD values (mean values between −30 ‰ and −29 ‰ as well as −232 ‰ and −225 ‰, respectively; Fig. 9c) and low d values (means between 5 ‰ and 7 ‰; Table 2). In contrast, a striking feature of Holocene ice wedges is their significantly elevated mean d values between 11 ‰ and 15 ‰ (Table 2), accompanied by surprisingly low δ18O and δD values (mean values between −28 ‰ and −25 ‰ as well as −207 ‰ and −190 ‰, respectively; Fig. 9b). In some instances, Holocene δ18O and δD values reach the range of the late-Pleistocene ice wedges (Table 2). This is true for both the oldest Holocene ice wedge stage, i.e. the toes of ice wedge SOB14-IW5 at the ice complex alas slope and the late-Holocene to modern ice wedges on the top of the ice complex (e.g. SOB14-IW4). Hence, the isotopic difference between late-Pleistocene and Holocene ice wedges is more pronounced in d than in δ values.
All co-isotopic regression slopes are highly correlated (R2 > 0.97) and vary between 7.16 and 9.43 (Table 2). While the ice wedges of units C (MIS 3) and A (MIS 1) show relatively coherent patterns, the Unit B ice wedge SOB18-02-I sticks out with a value of 9.43 (Fig. 9b and c), likely related to a comparably low internal isotope variability. Hence, we assume that the isotopic composition of all ice wedges carries palaeoclimate information for the winter season and is not significantly altered by secondary-fractionation processes.
The Sobo-Sise ice wedge stable isotopes of units A and B fit mostly well into the regional pattern of the central Laptev Sea coast and the Lena delta (Fig. 1) as well as in the large-scale pattern as presented by Opel et al. (2019) and reflect cold and stable winter climate conditions during the last glacial. Unit A (MIS 3) Sobo-Sise ice wedges (mean δ18O: −29.7 ‰; mean δD: −231.8 ‰) are slightly less depleted compared to those of Bykovsky Peninsula (mean δ18O: −30.8 ‰; mean δD: −242.8 ‰) to the east and Kurungnakh-Sise Island (mean δ18O: −31.6 ‰; mean δD: −247.6 ‰) to the west (Opel et al., 2019). In contrast, ice wedge d values are slightly higher at Sobo-Sise (mean d: 5.7 ‰) compared to Bykovsky (mean d: 3.7 ‰) and Kurungnakh-Sise (mean d: 5.3 ‰). For ice wedges of the MIS 2, the pattern is similar, with slightly less depleted δ values for Sobo-Sise (mean δ18O: −28.8 ‰; mean δD: −224.6 ‰) and slightly higher d values (mean d: 7.4 ‰) compared to Bykovsky (mean δ18O: −30.6 ‰, mean δD: −239.5 ‰; mean d: 5.1 ‰; Meyer et al., 2002a), while no data are available for Kurungnakh-Sise. As the sampled ice wedges likely cover different parts of the MIS 3 and MIS 2 Yedoma IC and therefore different time slices, the slight differences should not be spatially interpreted in terms of winter temperature differences.
The stable-isotope compositions of the studied Sobo-Sise ice wedges do not show any significant differences between ice wedges of units A and B, corresponding to MIS 3 and 2, respectively. This might indicate that the globally cold LGM is not reflected in the Sobo-Sise ice-wedge-based winter climate record and would be in accordance with both the regional scale, when compared to Bykovsky Peninsula (Meyer et al., 2002a) or to other study sites in the Laptev Sea region (Wetterich et al., 2011), and the Arctic scale (Porter and Opel, 2020). In this context, we observe (1) a depositional gap temporally coinciding with peak LGM conditions for the three sites at the regional scale and (2) that extremely depleted LGM ice wedge isotopes have been found only at Bol'shoy Lyakhovsky Island further east (Fig. 1; Wetterich et al., 2011). As such it is not sufficiently resolved yet whether this is due to a less cold LGM climate in the region or whether the LGM cold period is not captured by the studied ice wedge profiles that do not preserve a continuous record.
In accordance with Holocene ice wedge records at Bykovsky and Kurungnakh-Sise, the Sobo-Sise ice wedges of Unit C show distinctly warmer winters and significantly changed moisture generation pattern compared to the late-Pleistocene records. Overall Holocene mean ice wedge δ values on Sobo-Sise are enriched by about 1.8 ‰ to 2.7 ‰ for δ18O and 23 ‰ to 30 ‰ for δD over MIS 2 and MIS 3 ice wedges, respectively. The mean Holocene ice wedge d value (14.2 ‰) is about 7 ‰ and 8 ‰ higher compared to MIS 2 and MIS 3, respectively, indicating substantial changes in the moisture generation and transport patterns (e.g. Meyer et al., 2002a). Similar changes have been observed on Bykovsky Peninsula (Meyer et al., 2002a), while Holocene ice wedges at Kurungnakh-Sise show more enriched mean δ values and lower mean d values (Schirrmeister et al., 2003; Wetterich et al., 2008a). It has to be noted that the Holocene ice wedge stable-isotope compositions for both Sobo-Sise and Bykovsky exhibit significantly more depleted δ values and significantly higher d values compared to other ice wedge study sites along the Siberian Arctic coastal lowlands (Opel et al., 2019). Holocene minimum δ values even fit well into the typical MIS 3 and MIS 2 isotopic range. It is, however, unlikely, that this particular region, i.e. the eastern Lena river delta and the western Tiksi Bay, is characterized by a significantly colder winter climate. Hence, other potential explanations have to be considered, such as regional specifics of the water cycle. The significantly depleted δ values and increased d values of Holocene ice wedges show some similarities to early-winter precipitation (October to December) that is, in particular, characterized by distinctly increased d values (e.g. Kurita, 2011; Bonne et al., 2020). Hence, the Holocene ice wedge stable-isotope composition might be explained by an over-representation of early-winter snow in the meltwater feeding ice wedge cracks. This could be related to specific moisture generation and transport patterns influencing the precipitation in this particular region. A second option could be the contribution of moisture from local sources such as evaporation of isotopically depleted and high-deuterium excess Lena river water (Juhls et al., 2020) in the period of ice build-up, resulting in a substantial snow cover development in the early winter season. Only little mixed-ocean and substantial open-water areas with a mainly freshwater signature could explain why this pattern of low δ and high d values for Holocene ice wedges could so far only be observed in the eastern Lena delta region.
5.3 Chronostratigraphy of the Yedoma IC in the central Laptev Sea coastal region
The geochronological record of the Sobo-Sise Yedoma IC spans the last approximately 52 cal kyr BP based on the stacked age–height modelling. Older parts of the Yedoma IC are likely to be found up to several metres below the modern river level (Fuchs et al., 2020), as has also been reported from other sites in the eastern Lena delta (Pavlova and Dorozhkina, 2000) and from Bykovsky Peninsula (Schirrmeister et al., 2002b). The lowermost sample of the Sobo-Sise record had a finite age of 47 021 ± 646 yr BP (SOB18-06-35) but is beyond the limit of calibration. However, it supports the modelled age range of the record down to 51.8 cal kyr BP. The entire record exhibits three substantial chronological gaps, which are from about 36.7 to 28.4 cal kyr BP, from about 20.4 to 16.8 cal kyr BP, and from about 15.5 to 6.4 cal kyr BP (Fig. 12).
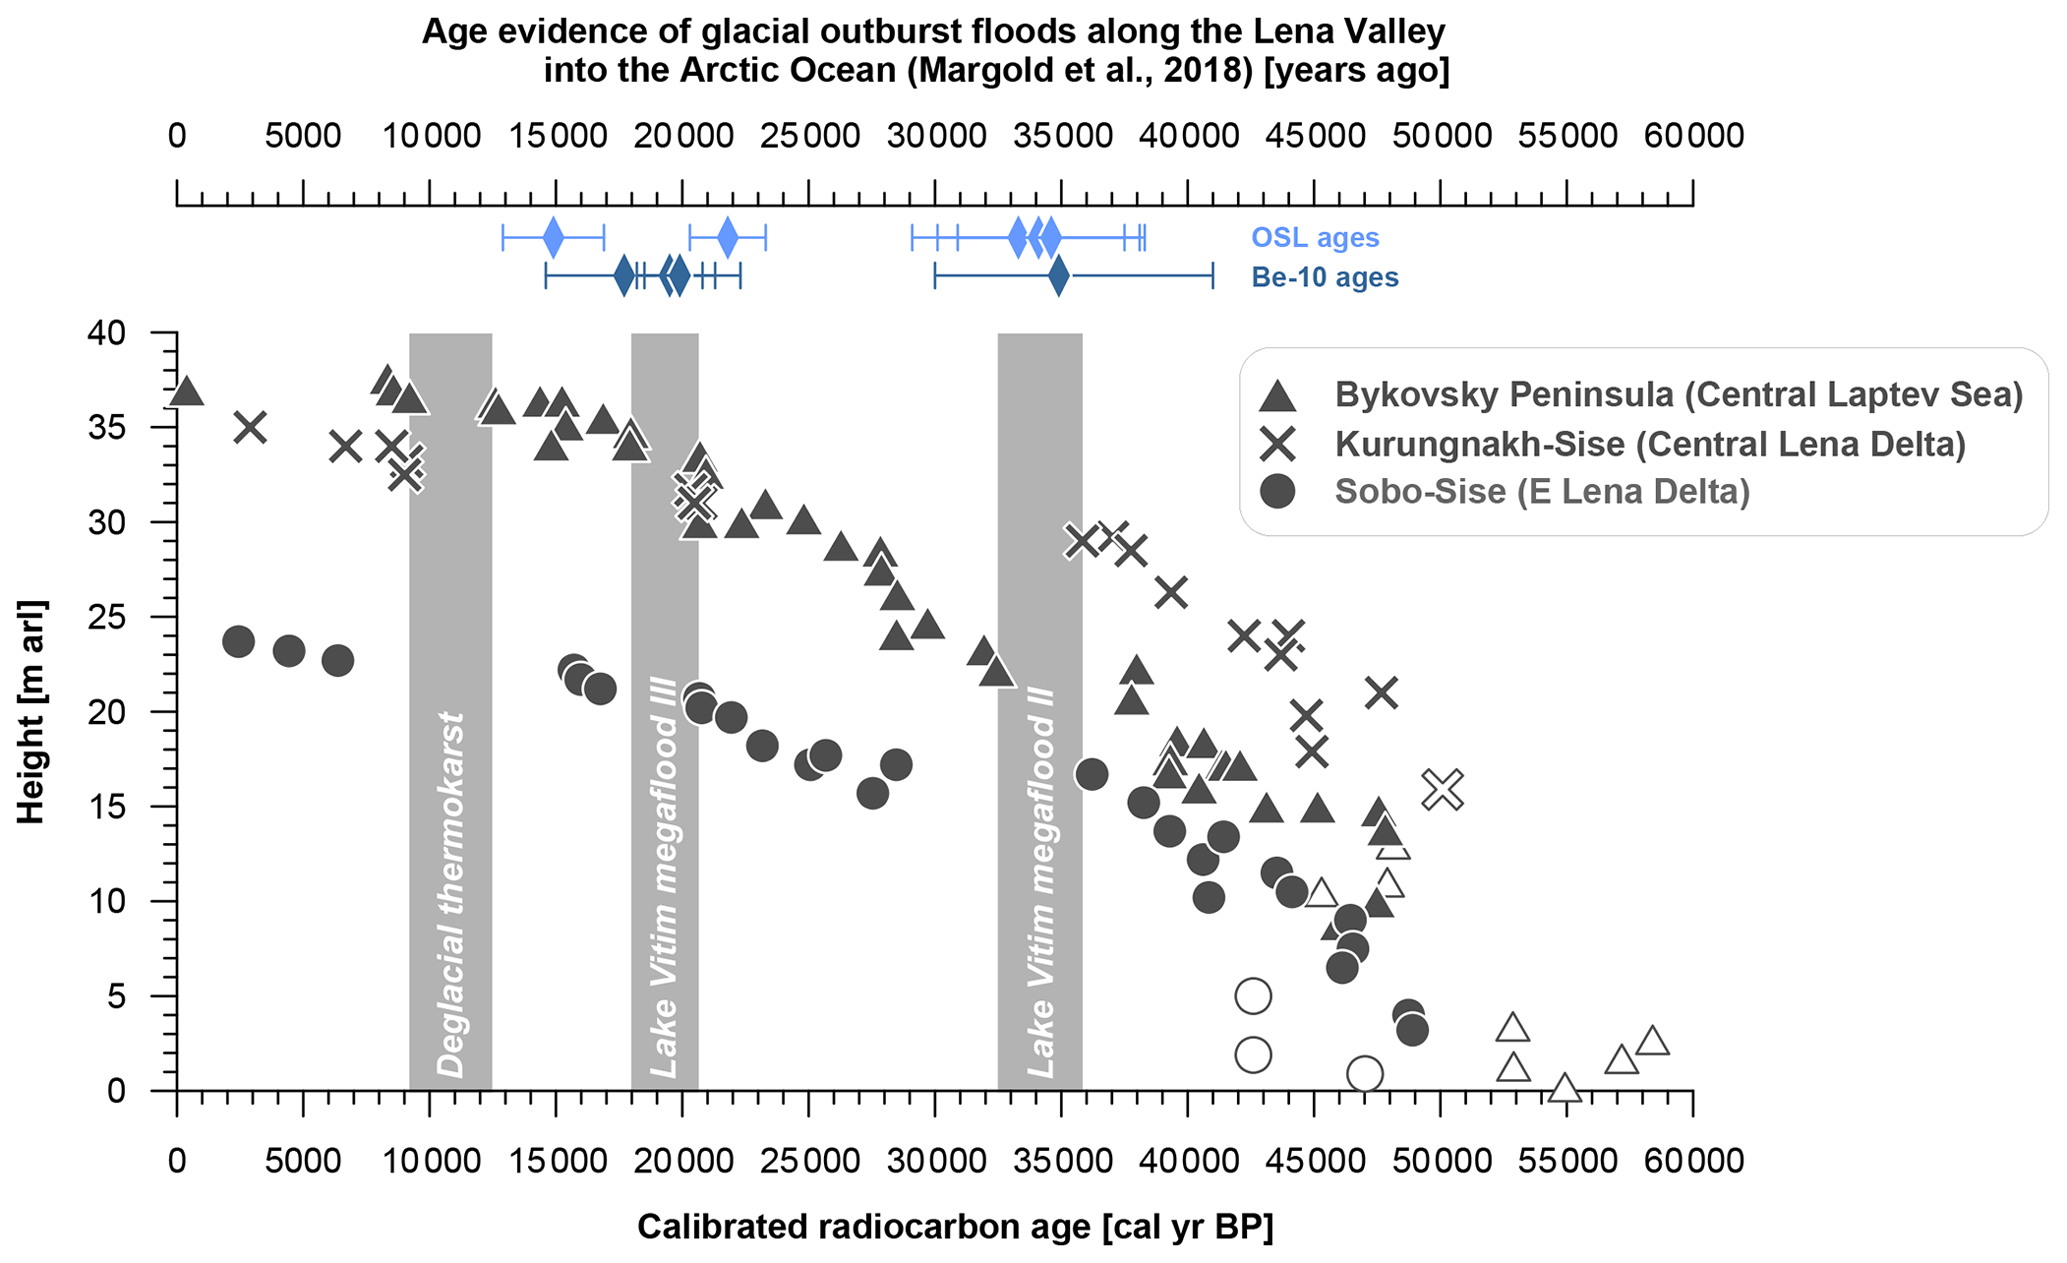
Figure 12Comparison of interpreted chronology gaps (shown as shaded rectangles) in the Yedoma IC records from Bykovsky Peninsula (Mamontovy Khayata; Schirrmeister et al., 2002a, 2011a), Sobo-Sise Island (this study), and Kurungnakh-Sise Island (Schirrmeister et al., 2003; Wetterich et al., 2008a). Infinite radiocarbon dates or dates to be calibrated beyond the limit of 50 cal kyr BP (Reimer et al., 2013) are minimum ages and given as hollow symbols. Age evidence from optically stimulated luminescence (OSL) and Be-10 dating for repeated megafloods (namely numbers II and III) from the glacial Lake Vitim along the Lena valley into the Arctic Ocean (Margold et al., 2018) is shown for comparison.
Taking into account that the exposure conditions and the applied sampling and dating resolution largely define the quality of the resulting geochronological record, we compare our Yedoma IC dataset from Sobo-Sise Island (32 14C dates over 24 m profile length) to similar ones with a resolution much better than 1 m in the vertical dimension, i.e. those from the Mamontovy Khayata site on Bykovsky Peninsula (51 14C dates over 37 m profile length; Schirrmeister et al., 2002a; Grosse et al., 2007) and Kurungnakh-Sise Island in the central Lena delta (19 14C dates over 19 m profile length; Schirrmeister et al., 2003; Wetterich et al., 2008a). However, the sampling approaches differed. On Bykovsky and Kurungnakh-Sise the exposures were sampled during different years at highly dynamic thaw slumps over a rather large lateral extent, i.e. up to several hundreds of metres. Exposed baidzherakhs (thaw mounts of former polygon centres) at different height levels were sampled. In contrast, the permafrost sampling at the vertical Yedoma cliff on Sobo-Sise was performed in three nearby (i.e. within about 120 m) overlapping profiles, resulting in complete coverage of the exposed permafrost sequence.
If compared to nearby studied Yedoma profiles to the east, on Bykovsky Peninsula in the central Laptev Sea, and to the west, on Kurungnakh-Sise Island in the central Lena delta, a similar pattern is striking. In detail, the Bykovsky record spans from about 60 ka BP and shows the smallest gaps of all considered records from 38 to 32.5 cal kyr BP, from 21 to 18 cal kyr BP, and from 12.5 to 9 cal kyr BP (Fig. 12). The Kurungnakh-Sise record shows two large age gaps from 37 to 21 cal kyr BP and from 20 to 9 cal kyr BP (Fig. 12), found in two independent sampling campaigns (Schirrmeister et al., 2003; Wetterich et al., 2008a).
The hiatus overlap recognized at all three Yedoma sites studied in the region, i.e Bykovsky, Sobo-Sise, and Kurungnakh-Sise (Fig. 1), results in three gaps of likely overarching relevance that are found during MIS 3 from 36 to 32.5 cal kyr BP, during MIS 2 from 20.5 to 18 cal kyr BP, and during MIS 2–1 transition from 12.5 to 9 cal kyr BP (Fig. 12).
To explain the observed gaps in the chronological records, two mechanisms that need to be discussed are (1) no or extremely low deposition during a certain period of time, and/or (2) thaw and erosion of a certain sequence after deposition. Both mechanisms might be related to a variety of processes, spanning from global or regional climate variations over time to local geomorphologic-disturbance processes that are not necessarily or solely climate-triggered. To disentangle the general hiatus of three time periods at three Yedoma IC sites in the Lena-Laptev region, the following discussion lines can be drawn.
5.3.1 Interstadial climate variability and consecutive local disturbance vs. fluvial erosion during MIS 3
The proposed regional overlap hiatus in MIS 3 Yedoma IC deposits spans 3500 years (36–32.5 cal kyr BP; Fig. 12). The interstadial climatic variability during MIS 3 deduced from permafrost sequences of NE Siberia was subject to previous studies which assume an MIS 3 climatic optimum expressed by warm summer conditions mainly based on botanic proxy data (e.g. Anderson and Lozhkin, 2001; Andreev et al., 2011; Murton et al., 2015, 2017; Pitulko et al., 2017). The proxy record, however, varies in both duration and timing at different Yedoma IC study sites from the western Laptev coast to the Kolyma lowland (see Fig. 11 in Wetterich et al., 2014). If warmer summer climate conditions during the MIS 3 interstadial led to partial Yedoma IC thaw and to the observed overall depositional gap 36–32.5 cal kyr BP by deepening of the active layer and related surface subsidence, resulting in degradation rates exceeding aggradation rates, the timing of the MIS 3 climatic optimum is of specific interest. The nearby Yedoma IC site on Bykovsky Peninsula allows for proxy-based reconstruction of MIS 3 interstadial environmental conditions. Here, warm conditions with mean summer temperatures > 12 ∘C and the occurrence of standing water are deduced for around 40–39 cal kyr BP from fossil findings of e.g. Callitriche hermaphroditica, which is a temperate aquatic plant (Kienast et al., 2005), supported by findings of diverse ostracod faunae that inhabited low centre polygon ponds during the same time period (Wetterich et al., 2005). However, all evidence from Bykovsky records for the MIS 3 climate optimum predates the observed hiatus by about 7000 to 6000 years, which makes it unlikely that the observed MIS 3 gap was driven by regional climate. The MIS 3 hiatus in the Kurungnakh-Sise Yedoma IC spans even more, from about 37 to 21 cal kyr BP, missing substantial parts of the MIS 3 (Schirrmeister et al., 2003; Wetterich et al., 2008a), but again only after the supposed MIS 3 climatic optimum that is likewise reflected in the Bykovsky Yedoma palaeontological record by warm summer conditions and the presence of low-cantered polygon tundra, providing a broad landscape mosaic of ecological niches for e.g. insects and plants, indicating dry and warm conditions in drained positions and for aquatic organisms inhabiting polygon ponds (Khazin et al., 2019; Wetterich et al., 2008a). The observed MIS 3 hiatus in the Bykovsky, Sobo-Sise, and Kurungnakh Yedoma IC records is not during the MIS 3 climatic optimum but instead falls within a period of late-MIS 3 climate instability as expressed in Dansgaard–Oeschger (D–O) events recorded in the Greenland ice cores (e.g. Dansgaard et al., 1993; NGRIP members, 2004). But it is unknown whether D–O events have impacted the eastern Siberian Arctic, and the lack of deposits and coarse chronology in the Yedoma IC records prevents conclusions on a linkage to these palaeoclimatic events to be drawn.
Another possible explanation for the MIS 3 hiatus is proposed by Margold et al. (2018), who found evidence for repeated cataclysmic outburst floods from the glacial Lake Vitim in southern Siberia into the Vitim river valley and further into the Lena river valley towards the Arctic Ocean. The flooding events were dated by multiple techniques including optically stimulated luminescence dating and cosmogenic nuclide dating (Be-10 bedrock exposures and Be-10 depth profiles). The reconstructed flood chronology spans over the last 60 kyr, of which the timing of megaflood II at around 34 ka fits into the chronologic gap observed in the Yedoma IC chronology of Bykovsky, Sobo-Sise, and Kurungnakh around 36–32.5 cal kyr BP (Fig. 12). Thus, fluvial impact by the proposed megaflood event might have affected the continuity of the Yedoma IC chronologies by eroding considerable parts of the sequences. But except for the chronology gaps, no direct erosional features such as fluvial sand or pebble layers have been observed in the outcrops. Thus, direct erosion seems unlikely at the studied locations, and the flooding events here may have only changed the hydrological regime (e.g. by developing new discharge paths similar to the channels in today's Lena delta) for a certain time period and by doing so prevented the deposition of fluvially transported material in the areas of the studied Yedoma IC outcrops. If so, this could have stopped or minimized Yedoma IC accumulation at the study sites.
5.3.2 LGM climate vs. fluvial erosion during MIS 2
The second distinct overlapping hiatus in the Yedoma IC chronologies of Bykovsky Peninsula, Sobo-Sise, and Kurungnakh-Sise islands occurred during MIS 2 20.5–18 cal kyr BP (Fig. 12) and falls partly in the last-glacial-maximum (LGM) period around 26.5–19 cal kyr BP (Clark et al., 2009). The LGM environments of the Laptev Sea coastal region are characterized by cold and dry summer conditions and represented in pollen records by grass-dominated communities with Caryophyllaceae, Asteraceae, Cichoriaceae, and Selaginella rupestris (Andreev et al., 2011). Further palaeontological evidence for cold and dry summers is provided by plant macrofossils and insect fossil records from the Bykovsky Yedoma IC (Kienast et al., 2005; Sher et al., 2005), while the LGM is almost not captured in the Kurungnakh-Sise Yedoma IC record (Schirrmeister et al., 2003; Wetterich et al., 2008a). The less productive summer conditions most likely hampered OM accumulation, while reduced ice wedge growth might be related to less winter precipitation and stronger wind activity affecting snow drift and sublimation, both leading to reduced Yedoma IC formation during MIS 2 if compared to MIS 3 as also seen in the lower permafrost aggradation rate (see Sect. 5.1.2). However, no permafrost aggradation during MIS 2 at all seems unlikely in the larger study region since it has a good depositional representation at several Yedoma IC sites (Duvanny Yar: Murton et al., 2015; Yana lowland: Pitulko et al., 2004, 2017; Bol'shoy Lyakhovsky: Wetterich et al., 2011; Mamontov Klyk: Schirrmeister et al., 2008; Fig. 1). On Bol'shoy Lyakhovsky Island (north-east of the central Laptev Sea region), a shift from accumulation on top of the MIS 3 Yedoma IC to valley positions was found and explained by a lowered erosion base due to LGM sea level lowstand and associated changes in the hydrological system of areas with higher relief inclination (Wetterich et al., 2011). As seen in Fig. 12, the MIS 2 chronologic time gap is larger in the central Lena delta (about 11 kyr between about 20 and 9 cal kyr BP on Kurungnakh-Sise) if compared to the eastern Lena delta (about 3 kyr between about 20 and 17 cal kyr BP on Sobo-Sise) and to Bykovsky Peninsula (about 3 kyr between about 21 and 18 cal kyr BP at Mamontovy Khayata; site no. 1 in Fig. 1). Additionally, Grosse et al. (2007) reported an observation at the northern end of Bykovsky Peninsula, where the 22 m thick MIS 3–2 Yedoma IC (dated from about 53 to 23 cal kyr BP) is discordantly covered by 3 m thick sand with organic interlayers of probably shallow fluvial origin dated to about 16 cal kyr BP (site B-S in Grosse et al., 2007; site no. 2 in Fig. 1). For the large gap in the Kurungnakh-Sise MIS 2 Yedoma IC record, it might also be possible that the MIS 2 gap likely induced by fluvial erosion of megaflood III (Margold et al., 2018) further combines with the deglacial (MIS 2–1) gap, and any possible deposition in between was eroded by the latter.
5.3.3 Deglacial thermokarst during MIS 2–1
The global late-glacial to early-Holocene warming manifested the transition from glacial to interglacial conditions. The effect of warming on permafrost conditions is largely captured by an increase in ground temperature, a deepening of the seasonally thawed active layer, surface subsidence, and activation of thermokarst and thermo-erosional processes (e.g. Wetterich et al., 2009). The resulting ground ice melt and permafrost thaw led to reorganization of the post-Beringian periglacial landscapes and accumulation areas remaining after the opening of the Bering Strait around 11 cal kyr BP (Jakobsson et al., 2017) and the subsequent Holocene sea level rise and shelf inundation (Bauch et al., 2001; Klemann et al., 2015). The large-scale warming pulse terminated the accumulation of the Yedoma IC during the late-glacial period, as seen in the age gaps of the Yedoma IC records considered here (Fig. 12), leading to an overlap hiatus 12.5–9 cal ka BP. Similar late-glacial Holocene hiatuses are found for many other chronostratigraphic records of Yedoma ICs (Fig. 1) such as in the Kolyma lowland at the Duvanny Yar site (Murton et al., 2015), on the New Siberian Islands (Schirrmeister et al., 2011a; Wetterich et al., 2009, 2014), on Buor Khaya Peninsula (Schirrmeister et al., 2017), and on Mamontov Klyk (Schirrmeister et al., 2008). During the late-glacial to early-Holocene warming, intense thermokarst within the degrading Yedoma IC created new accumulation areas, i.e. thermokarst basins and thermo-erosional valleys, which dominate the modern surface morphology in Arctic lowlands by more than 50 % of the modern surface on Bykovsky Peninsula (Grosse et al., 2005; Fuchs et al., 2018) and on the Sobo-Sise (Fuchs et al., 2018) and Kurungnakh-Sise islands (Morgenstern et al., 2011).
Dated records of thermokarst deposition commonly fit into the hiatus that represents the end of Yedoma IC formation. Late-glacial to early-Holocene thermokarst deposits on Bykovsky Peninsula are dated from about 10 to 1 cal kyr BP (Schirrmeister et al., 2002a), on Kurungnakh-Sise Island from about 15 cal kyr BP to modern times (Morgenstern et al., 2013), and on Sobo-Sise Island from about 7.4 cal kyr BP to modern times (Fuchs et al., 2018). Thermo-erosional valleys as erosional features of Yedoma IC degradation were dated on Bykovsky from 5 to 1 cal kyr BP (Schirrmeister et al., 2002a). However, Holocene cover deposits on top of the Yedoma IC are common and also observed on Sobo-Sise, where they were dated from 9.8 to 1.3 cal kyr BP (Fuchs et al., 2018) and from 6.4 to 2.4 cal kyr BP (Unit C in this study). In summary, overall climate warming at the transition from glacial to interglacial conditions promoted extensive Yedoma IC thaw and created new accumulation areas in thermokarst basins and thermo-erosional valleys. Both the IC degradation and the change in deposition processes caused the hiatus on top of the Yedoma IC of the Laptev Sea coastal region.
Late-Pleistocene permafrost of the Yedoma Ice Complex type is widespread in the eastern Siberian Arctic, but sediment sequences are often discontinuous due to (1) the vulnerability of ice-rich permafrost to thaw under warming conditions, (2) surface erosion in times of arid and windswept conditions, and (3) periglacial processes such as cryoturbation and internal reorganization of polygonal landscapes. We identified three different cryostratigraphic units at the Sobo-Sise Yedoma IC. Unit A (52–28 cal kyr BP) represents the depositional environment during interstadial MIS 3 and is characterized by coarse silt and fine sand, while Unit B (28–15 cal kyr BP), representing the stadial MIS 2 conditions, is dominated by coarse silt and middle sand and lower organic-matter (carbon, nitrogen) content compared to Unit A. In addition, Unit A has higher permafrost aggradation rates (1 m kyr−1) compared to Unit B (0.7 m kyr−1). The sedimentary properties of both units support the hypothesis of multi-process and multi-source regional Yedoma IC formation, here mainly triggered by ice wedge polygon formation under floodplain conditions with varying input shares of cryogenic, fluvial, pedogenic, and aeolian origin. The Yedoma IC is discordantly overlain by organic-rich Holocene deposits of Unit C (7–0 cal kyr BP).
The wedge ice records cover all three cryostratigraphic units as shown by radiocarbon-dated organic matter from inside the ice. The stable-isotope composition of the Sobo-Sise wedge ice in comparison to other regional records shows similar patterns, with, for example, no indication of an LGM cold period in MIS 2 wedge ice. Thus, MIS 3 and MIS 2 ice wedges have rather similar isotopic compositions, as also observed on Bykovsky Peninsula. A further regional peculiarity is low-δ18O and high-deuterium excess in Holocene records that might represent a contribution of a regional isotopically depleted water source, e.g. Lena water.
The chronostratigraphy of the Sobo-Sise cliff revealed three hiatuses, at about 36–29, 20–17, and 15–7 cal kyr BP, which are in accordance with hiatuses, from two other Yedoma IC deposits in close vicinity on Bykovsky Peninsula and Kurungnakh-Sise Island. Similar patterns but different duration found at these locations indicate a regional signal of disturbance, leading to either low accumulation or erosion of deposited material. We hypothesize that the first two regional hiatus overlaps (36–32.5 and 20.5–18 cal kyr BP) are related to megafloods proposed by Margold et al. (2018), although more evidence is needed to confirm this hypothesis. The last overlap hiatus in the regional chronostratigraphy (12.5–9 cal kyr BP) is caused by climate-driven permafrost thaw and consecutive change in accumulation areas during the late-glacial-to-Holocene transition, as was observed in many other Yedoma IC deposits in north-eastern Siberia. Thus, the Sobo-Sise Yedoma record represents a rather typical example of late-Pleistocene ice complex formation under western Beringian conditions, superimposed in its preservation by thaw events that were fluvially triggered during MIS 3–2 and climate-triggered during MIS 2–1.
Original data will be available at PANGAEA after final acceptance of the paper: https://doi.org/10.1594/PANGAEA.919470 (Wetterich et al., 2020).
The supplement related to this article is available online at: https://doi.org/10.5194/tc-14-4525-2020-supplement.
SW conceptualized the research. SW, MiF, TO, and LS designed the fieldwork, which was performed with the help of AK and AA. AK performed the climbing and sediment sampling of the Yedoma cliff, while SW, MiF, TO, and LS performed the wedge ice sampling. Laboratory work and data analyses were carried out by SW, MiF, TO, HaM, LS, GM, JW, MaF, and HeM. SW wrote the paper with input from all co-authors.
The authors declare that they have no conflict of interest.
The fieldwork of this study received great logistic support in summer 2018 from the Tiksi hydrobase (Dmitry Mel'nichenko) and AWI logistics (2018 LENA expedition; Volkmar Assmann and Waldemar Schneider). The laboratory analyses were expertly conducted by Antje Eulenburg, Mikaela Weiner, Lutz Schönicke, and Dyke Scheidemann (AWI Potsdam) as well as by Elizabeth Bonk and Torben Gentz (MICADAS, AWI Bremerhaven). Ingmar Nitze (AWI Potsdam) helped retrieve the cliff edge line for Fig. 2, and Janet Rethemeyer (CologneAMS) provided three radiocarbon dates.
This research has been supported by the Deutsche Forschungsgemeinschaft (DFG
grant no. WE4390/7-1 to Sebastian Wetterich and grant no. OP217/4-1 to Thomas Opel), the Horizon 2020 EU
framework programme for research and innovation (grant
agreement no. 773421, NUNATARYUK project, to Michael Fritz), the NERC-BMBF
project CACOON (grant no. 03F0806A to Matthias Fuchs), the Russian Foundation for Basis Research (RFBR grant no. 8-05-60080 to Alexander Kizyakov), and the Moscow State University (MSU) research programme (grant no. AAAA-A16-116032810095-6 to Alexander Kizyakov).
The article processing charges for this open-access
publication were covered by a Research
Centre of the Helmholtz Association.
This paper was edited by Ylva Sjöberg and reviewed by Martin Margold and one anonymous referee.
Anderson, P. M. and Lozhkin, A. V.: The Stage 3 interstadial complex (Karginskii/middle Wisconsinan interval) of Beringia: variations in paleoenvironments and implications for paleoclimatic interpretations, Quaternary Sci. Rev., 20, 93–125, https://doi.org/10.1016/S0277-3791(00)00129-3, 2001.
Andreev, A., Schirrmeister, L., Tarasov, P. E., Ganopolski, A., Brovkin, V., Siegert, C., Wetterich, S., and Hubberten, H.-W.: Vegetation and climate history in the Laptev Sea region (Arctic Siberia) during Late Quaternary inferred from pollen records, Quaternary Sci. Rev., 30, 2182–2199, https://doi.org/10.1016/j.quascirev.2010.12.026, 2011.
Bauch, H. A., Mueller-Lupp, T., Taldenkova, E., Spielhagen, R. F., Kassens, H., Grootes, P. M., Thiede, J., Heinemeier, J., and Petryashov, V. V.: Chronology of the Holocene transgression at the North Siberian margin, Global Planet. Change, 31, 125–139, https://doi.org/10.1016/S0921-8181(01)00116-3, 2001.
Blaauw, M. and Christen, J. A.: rbacon: Age-Depth Modelling using Bayesian Statistics, R package version 2.3.9.1, available at: https://CRAN.R-project.org/package=rbacon, last access: 15 September 2019.
Blott, S. J. and Pye, K.: GRADISTAT: a grain size distribution and statistics package for the analysis of unconsolidated sediments, Earth Surf. Proc. Land., 26, 1237–1248, https://doi.org/10.1002/esp.261, 2001.
Bockheim, J. G.: Importance of cryoturbation in redistributing organic carbon in permafrost-affected soils, Soil Sci. Soc. Am. J., 71, 1335–1342, https://doi.org/10.2136/sssaj2006.0414N, 2007.
Boike, J., Nitzbon, J., Anders, K., Grigoriev, M., Bolshiyanov, D., Langer, M., Lange, S., Bornemann, N., Morgenstern, A., Schreiber, P., Wille, C., Chadburn, S., Gouttevin, I., Burke, E., and Kutzbach, L.: A 16-year record (2002–2017) of permafrost, active-layer, and meteorological conditions at the Samoylov Island Arctic permafrost research site, Lena River delta, northern Siberia: an opportunity to validate remote-sensing data and land surface, snow, and permafrost models, Earth Syst. Sci. Data, 11, 261–299, https://doi.org/10.5194/essd-11-261-2019, 2019.
Bonne, J.-L., Meyer, H., Behrens, M., Boike, J., Kipfstuhl, S., Rabe, B., Schmidt, T., Schönicke, L., Steen-Larsen, H. C., and Werner, M.: Moisture origin as a driver of temporal variabilities of the water vapour isotopic composition in the Lena River Delta, Siberia, Atmos. Chem. Phys., 20, 10493–10511, https://doi.org/10.5194/acp-20-10493-2020, 2020.
Chen, J., Günther, F., Grosse, G., Liu, L., and Lin, H.: Sentinel-1 InSAR measurements of elevation changes over Yedoma uplands on Sobo-Sise Island, Lena Delta, Remote Sens.-Basel, 10, 1152, https://doi.org/10.3390/rs10071152, 2018.
Clark, P. U., Dyke, A. S., Shakun, J. D., Carlson, A. E., Clark, J., Wohlfarth, B., Mitrovica, J. X., Hostetler, S. W., and McCabe, A. M.: The Last Glacial Maximum, Science 325, 710–714, https://doi.org/10.1126/science.1172873, 2009.
Dansgaard, W.: Stable isotopes in precipitation, Tellus, 16, 436–468, https://doi.org/10.3402/tellusa.v16i4.8993, 1964.
Dansgaard, W., Johnsen, S., Clausen, H. B., Dahl-Jensen, D., Gundestrup, N. S., Hammer, C. U., Hvidberg, C. S., Steffensen, J. P., Sveinbjörnsdottir, A. E., Jouzel, J., and Bond, G.: Evidence for general instability of past climate from a 250-kyr ice-core record, Nature, 364, 218–220, https://doi.org/10.1038/364218a0, 1993.
Davidson, T. A., Wetterich, S., Johansen, K. L., Grønnow, B., Windirsch, T., Jeppesen, E., Syvyränta, J., Olsen, J., González-Bergonzoni, I., Strunk, A., Larsen, N. K., Meyer, H., Søndergard, J., Dietz, R., Eulears, I., and Mosbech, A.: The history of seabird colonies and the North Water ecosystem: Contributions from palaeoecological and archaeological evidence, Ambio, 47, 175–192, https://doi.org/10.1007/s13280-018-1031-1, 2018.
Dereviagin, A. Yu., Chizhov, A. B., Meyer, H., Opel, T., Schirrmeister, L., and Wetterich, S.: Izitopnyi sostav teksturnykh l'dov poberezhi'ya morya Laptevykh (Isotopic composition of texture ices, Laptev Sea coast), Kriosfera Zemli (Earth's Cryosphere), 17, 27–34, 2013 (in Russian).
Dietze, E. and Dietze, M.: Grain-size distribution unmixing using the R package EMMAgeo, E&G Quaternary Sci. J., 68, 29–46, https://doi.org/10.5194/egqsj-68-29-2019, 2019.
Dietze, E., Hartmann, K., Diekmann, B., IJmker, J., Lehmkuhl, F., Opitz, S., Stauch, G., Wünnemann, B., and Borchers, A.: An end-member algorithm for deciphering modern detrital processes from lake sediments of Lake Donggi Cona, NE Tibetan Plateau, China, Sediment. Geol., 243–244, 169–180, https://doi.org/10.1016/j.sedgeo.2011.09.014, 2012.
French, H. and Shur, Y.: The principles of cryostratigraphy, Earth-Sci. Rev. 101, 190–206, https://doi.org/10.1016/j.earscirev.2010.04.002, 2010.
Fritz, M., Wetterich, S., Schirrmeister, L., Meyer, H., Lantuit, H., Preusser, F., and Pollard, W. H.: Eastern Beringia and beyond: late Wisconsinan and Holocene landscape dynamics along the Yukon Coastal Plain, Canada, Palaeogeogr. Palaeocl., 319–320, 28–45, https://doi.org/10.1016/j.palaeo.2011.12.015, 2012.
Fritz, M., Vonk, J. E., and Lantuit, H.: Collapsing Arctic coastlines, Nat. Clim. Change, 7, 6–7, https://doi.org/10.1038/nclimate3188, 2017.
Fuchs, M., Grosse, G., Strauss, J., Günther, F., Grigoriev, M., Maximov, G. M., and Hugelius, G.: Carbon and nitrogen pools in thermokarst-affected permafrost landscapes in Arctic Siberia, Biogeosciences, 15, 953–971, https://doi.org/10.5194/bg-15-953-2018, 2018.
Fuchs, M., Nitze, I., Strauss, J., Günther, F., Wetterich, S., Kizyakov, A., Fritz, M., Opel, T., Grigoriev, M. N., Maximov, G. M., and Grosse, G.: Rapid fluvio-thermal erosion of a yedoma permafrost cliff in the Lena River Delta, Front. Earth Sci., 8, 336, https://doi.org/10.3389/feart.2020.00336, 2020.
Grigoriev, M. N.: Kriomorfogenez ust'evoi oblasti reki Leny (Cryomorphogenesis of the Lena River mouth). RAS SB Publishers, Permafrost Institute Yakutsk, 174 pp., 1993 (in Russian).
Grosse, G., Schirrmeister, L., Kunitsky, V. V., and Hubberten, H.-W.: The use of CORONA images in remote sensing of periglacial geomorphology: an illustration from the NE Siberian coast, Permafrost Periglac., 16, 163-172, https://doi.org/10.1002/ppp.509, 2005.
Grosse, G., Schirrmeister, L., Siegert, C., Kunitsky, V. V., Slagoda, E. A., Andreev, A. A., and Dereviagyn, A. Y.: Geological and geomorphological evolution of a sedimentary periglacial landscape in Northeast Siberia during the Late Quaternary, Geomorphology, 86, 25–51, https://doi.org/10.1016/j.geomorph.2006.08.005, 2007.
Grosse, G., Romanovsky, V., Jorgenson, T., Walter Anthony, K., Brown, J., and Overduin, P. P.: Vulnerability and feedbacks of permafrost to climate change, EOS Trans. AGU, 92, 73–80, https://doi.org/10.1029/2011EO090001, 2011.
Grosse, G., Robinson, J. E., Bryant, R., Taylor, M. D., Harper, W., DeMasi, A., Kyker-Snowman, E., Veremeeva, A., Schirrmeister, L., and Harden, J.: Distribution of late Pleistocene ice-rich syngenetic permafrost of the Yedoma Suite in east and central Siberia, Russia, U.S. Geological Survey Open File Report, 2013-1078, 37 pp., 2013.
Günther, F., Overduin, P. P., Yakshina, I. A., Opel, T., Baranskaya, A. V., and Grigoriev, M. N.: Observing Muostakh disappear: permafrost thaw subsidence and erosion of a ground-ice-rich island in response to arctic summer warming and sea ice reduction, The Cryosphere, 9, 151–178, https://doi.org/10.5194/tc-9-151-2015, 2015.
Günther, F., Grosse, G., Maximov, G., Veremeeva, A., Haghshenas Haghighi, M., and Kizyakov, A.: Repeat LiDAR for tracking extensive thaw subsidence on Yedoma uplands, in: Book of Abstracts, International Symposium 20 Years of Lena-Delta Expeditions, 17–19 October 2018, St. Petersburg, Russia, Arctic and Antarctic Research Institute, St. Petersburg, 22–24, 2018.
Hopkins, D. M.: Cenozoic history of the Bering Land Bridge, Science, 129, 1519–1528, https://doi.org/10.1126/science.129.3362.1519 1959.
Hopkins, D. M.: Aspects of the paleogeography of Beringia during the Late Pleistocene, in: Paleoecology of Beringia, edited by: Hopkins, D. M., Matthews Jr., J. V., Schweger, C. E., Young, S. B., Academic Press, New York, 3–28, 1982.
Jakobsson, M., Pearce, C., Cronin, T. M., Backman, J., Anderson, L. G., Barrientos, N., Björk, G., Coxall, H., de Boer, A., Mayer, L. A., Mörth, C.-M., Nilsson, J., Rattray, J. E., Stranne, C., Semiletov, I., and O'Regan, M.: Post-glacial flooding of the Bering Land Bridge dated to 11 cal ka BP based on new geophysical and sediment rocks, Clim. Past, 13, 991–1005, https://doi.org/10.5194/cp-13-991-2017, 2017.
Juhls, B., Stedmon, C. A., Morgenstern, A., Meyer, H., Hölemann, J., Heim, B., Povazhnyi, V., and Overduin, P. P.: Identifying drivers of seasonality in Lena River biogeochemistry and dissolved organic matter fluxes, Front. Environ. Sci., 8, 53, https://doi.org/10.3389/fenvs.2020.00053, 2020.
Kanevskiy, M., Shur, Y., Fortier, D., Jorgenson, M. T., and Stephani, E.: Cryostratigraphy of late Pleistocene syngenetic permafrost (yedoma) in northern Alaska, Itkillik River exposure, Quaternary Res., 75, 584–596, https://doi.org/10.1016/j.yqres.2010.12.003, 2011.
Kanevskiy, M., Shur, Y., Jorgenson, T., Brown, D. R., Moskalenko, N., Brown, J., Walker, D. A., Raynolds, M. K., and Buchhorn, M.: Degradation and stabilization of ice-wedges: Implications for assessing risk of thermokarst in northern Alaska, Geomorphology, 297, 20–42, https://doi.org/10.1016/j.geomorph.2017.09.001, 2017.
Katasonov, E. M.: Litologiya merzlykh chetvertichnykh otlozhenii (kriolotologiya) yanskoi primorkoi nizmenosti (Lithology of frozen Quaternary deposits (cryolithology) of the Yana lowland), Production and Research Institute for Engineering Surveys and Construction Publishers, Moscow, Russia, 175 pp., 1954/2009 (in Russian).
Khazin, L. B., Khazina, I. V., Kuzmina, O. B., Ayunov, D. E., Golikov, N. A., and Tsibozov, L. V.: A borehole record of late Quaternary permafrost on Kurungnakh Island (Lena Delta, Northeastern Siberia): Reconstruction of deposition environments, Russian Geol. Geophys., 60, 768–780, https://doi.org/10.15372/RGG2019045, 2019.
Kienast, F., Schirrmeister, L., Siegert, C., and Tarasov, P.: Palaeobotanical evidence for warm summers in the East Siberian Arctic during the last cold stage, Quaternary Res., 63, 283–300, https://doi.org/10.1016/j.yqres.2005.01.003, 2005.
Klemann, V., Heim, B., Bauch, H. A., Wetterich, S., and Opel, T.: Sea-level evolution of the Laptev Sea and the East Siberian Sea since the last glacial maximum, Arktos, 1, 8 pp., https://doi.org/10.1007/s41063-015-0004-x, 2015.
Konishchev, V. N.: Reaktsiya vechnoi merzloty na poteplenie klimata (Permafrost response to climate warming), Kriosfera Zemli (Earth's Cryosphere), 15, 13–16, 2011 (in Russian).
Kotler, E. and Burn, C. R.: Cryostratigraphy of the Klondike “muck” deposits, westcentral Yukon Territory, Can. J. Earth Sci., 37, 849–861, https://doi.org/10.1139/e00-013, 2000.
Kunitsky, V. V.: Nival'nyi litogenez i ledovyy kompleks na territorii Yakutii (Nival lithogenesis and ice complex in Yakutia), Summary of the doctoral thesis, Melnikov Permafrost Institute SB RAS, Yakutsk, 23 pp., 2007 (in Russian).
Kunitsky, V. V., Syromyatnikov, I. I., Schirrmeister, L., Skachov, Y. B., Grosse, G., Wetterich, S., and Grigoriev, M. N.: L'distye porody I termodenudatsiya v raione poselka Batagay, Yanskoe ploskogor'e, Vostochnaya Sibir' (Ice-rich permafrost and thermal denudation in the Batagay area, Yana Upland, East Siberia), Kriosfera Zemli (Earth's Cryosphere), 17, 56–58, 2013.
Kurita, N.: Origin of Arctic water vapor during the ice-growth season, Geophys. Res. Lett., 38, L02709, https://doi.org/10.1029/2010GL046064, 2011.
Kuznetsova, T. V., Tumskoy, V. E., Schirrmeister, L., and Wetterich, S.: Paleozoologicheskaya kharakteristika pozdnoneopleistotsenovykh – golotsenovykh otlozhenii Bykokskogo poluostrova (Paleozoological characteristics of late Neopleistocene – Holocene deposits of the Bykovsky Peninsula), Zoologicheskii Zhurnal (Zoological Journal), 98, 1268–1290, https://doi.org/10.1134/S0044513419110102, 2019 (in Russian).
Lachenbruch, A. H.: Mechanics of thermal contraction cracks and ice-wedge polygons in permafrost, Geol. S. Am. S., 70, 69, https://doi.org/10.1130/SPE70-p1, 1962.
Leffingwell, E. D. K.: Ground-ice-wedges: The dominant form of ground-ice on the north coast of Alaska, J. Geol., 23, 635–654, https://doi.org/10.1086/622281, 1915.
Mackay, J. R.: Deformation of ice-wedge polygons, Garry Island, Northwest Territories, Cur. Res. Part A, 80-1a, 287–291, https://doi.org/10.4095/106211, 1981.
Mackay, J. R.: Oxygen isotope variations in permafrost, Tuktoyaktuk Peninsula area, Northwest Territories, Curr. Res. Part B 83-1B, 67–74, 1983.
Margold, M., Jansen, J. D., Codilean, A. T., Preusser, F., Gurinov, A. L., Fujioka, T., and Fink, D.: Repeated megafloods from glacial Lake Vitim, Siberia, to the Arctic Ocean over the past 60,000 years, Quaternary Sci. Rev., 187, 41–61, https://doi.org/10.1016/j.quascirev.2018.03.005, 2018.
Meyer, H., Schönicke, L., Wand, U., Hubberten, H.-W., and Friedrichsen, H.: Isotope studies of hydrogen and oxygen in ground ice – experiences with the equilibration technique, Isot. Environ. Health S., 36, 133–149, https://doi.org/10.1080/10256010008032939, 2000.
Meyer, H., Dereviagin, A. Y., Siegert, C., and Hubberten, H.-W.: Paleoclimate studies on Bykovsky Peninsula, North Siberia – hydrogen and oxygen isotopes in ground ice, Polarforschung, 70, 37–51, 2002a.
Meyer, H., Dereviagin, A. Y., Siegert, C., Schirrmeister, L., and Hubberten, H.-W.: Paleoclimate reconstruction on Big Lyakhovsky Island, North Siberia – hydrogen and oxygen isotopes in ice wedges, Permafrost Periglac., 13, 91–105, https://doi.org/10.1002/ppp.416, 2002b.
Morgenstern, A., Grosse, G., and Schirrmeister, L.: Genetic, morphological, and statistical characterization of lakes in the permafrost-dominated Lena Delta, in: Proceedings of the 9th International Conference on Permafrost, Fairbanks, Alaska, 29 June–3 July 2008, edited by: Kane, D. L. and Hinkel, K. M., Institute of Northern Engineering, University of Alaska Fairbanks, 1239–1244, 2008.
Morgenstern, A., Grosse, G., Günther, F., Fedorova, I., and Schirrmeister, L.: Spatial analyses of thermokarst lakes and basins in Yedoma landscapes of the Lena Delta, The Cryosphere, 5, 849–867, https://doi.org/10.5194/tc-5-849-2011, 2011.
Morgenstern, A., Ulrich, M., Günther, F., Roessler, S., Fedorova, I. V., Rudaya, N. A., Wetterich, S., Boike, J., and Schirrmeister, L.: Evolution of thermokarst in East Siberian ice-rich permafrost: A case study, Geomorphology, 201, 363–379, https://doi.org/10.1016/j.geomorph.2013.07.011, 2013.
Murton, J. B. and French, H. M.: Cryostructures in permafrost, Tuktoyaktuk Coastlands, western Arctic Canada, Canadian J. Earth Sci., 31, 737–747, https://doi.org/10.1139/e94-067, 1994.
Murton, J. B., Goslar, T., Edwards, M. E., Bateman, M. D., Danilov, P. P., Savvinov, G. N., Gubin, S. V., Ghaleb, B., Haile, J., Kanevskiy, M., Lozhkin, A. V., Lupachev, A. V., Murton, D. K., Shur, Y., Tikhonov, A., Vasil'chuk, A. C., Vasil'chuk, Y. K., and Wolfe, S. A.: Palaeoenvironmental interpretation of Yedoma silt (Ice Complex) deposition as cold-climate loess, Duvanny Yar, Northeast Siberia, Permafrost Periglac., 26, 208–288, https://doi.org/10.1002/ppp.1843, 2015.
Murton, J. B., Edwards, M. E., Lozhkin, A. V., Anderson, P. M., Savvinov, G. N., Bakulina, N., Bondarenko, O. V., Cherepanova, M., Danilov, P. P., Boeskorov, V., Goslar, T., Grigoriev, S., Gubin, S. V., Korzun, J., Lupachev, A. V., Tikhonov, A., Tsygankova, V. I., and Zanina, O. G.: Preliminary paleoenvironmental analysis of permafrost deposits at Batagaika megaslump, Yana Uplands, northeast Siberia, Quaternary Res., 87, 314–330, https://doi.org/10.1017/qua.2016.15, 2017.
North Greenland Ice Core Project members: High-resolution record of Northern Hemisphere climate extending into the last interglacial period, Nature, 431, 147–151, https://doi.org/10.1038/nature02805, 2004.
Opel, T., Meyer, H., Wetterich, S., Laepple, T., Dereviagin, A., and Murton, J.: Ice wedges as archives of winter palaeoclimate: a review. Permafrost Periglac., 29, 199–209, https://doi.org/10.1002/ppp.1980, 2018.
Opel, T., Murton, J. B., Wetterich, S., Meyer, H., Ashastina, K., Günther, F., Grotheer, H., Mollenhauer, G., Danilov, P. P., Boeskorov, V., Savvinov, G. N., and Schirrmeister, L.: Past climate and continentality inferred from ice wedges at Batagay megaslump in the Northern Hemisphere's most continental region, Yana Highlands, interior Yakutia, Clim. Past, 15, 1443–1461, https://doi.org/10.5194/cp-15-1443-2019, 2019.
Pavlova, E. Y. and Dorozhkina, M.: Geological-geomorphological studies in the western and central sectors of the Lena Delta, Rep. Polar Mar. Res., 354, 75–90, 2000.
Pestryakova, L. A., Herzschuh, U., Gorodnichev, R., and Wetterich, S.: The sensitivity of diatom taxa from Yakutian lakes (north-eastern Siberia) to electrical conductivity and other environmental variables, Polar Res., 37, 1485625, https://doi.org/10.1080/17518369.2018.1485625, 2018.
Péwé, T. L.: Origin of the upland silt near Fairbanks, Alaska, Geol. Soc. Am. Bull., 66, 699–724, 1955.
Pitulko, V. V., Nikolskiy, P. A., Girya, E. Y., Basilyan, A. E., Tumskoy, V. E., Koulakov, S. A., Astakhov, S. N., Pavlova, E. Y., and Anisimov, M. A.: The Yana RHS site: humans in the Arctic before the last glaciation, Science, 303, 52–56, https://doi.org/10.1126/science.1085219, 2004.
Pitulko, V., Pavlova, E., and Nikolskiy, P.: Revising the archaeological record of the Upper Pleistocene Arctic Siberia: Human dispersal and adaptations in MIS 3 and 2, Quaternary Sci. Rev., 165, 127–148, https://doi.org/10.1016/j.quascirev.2017.04.004, 2017.
Popov, A. I.: Osobennosti litogeneza allyuvial'nykh ravnin v usloviyakh surovogo klimata (Features of lithogenesis of alluvial plains under the conditions of cold climate), Izvestiya AN SSSR, Ser. Geogr., 2, 29–41, 1953 (in Russian).
Porter, C., Morin, P., Howat, I., Noh, M.-J., Bates, B., Peterman, K., Keesey, S., Schlenk, M. Gardiner, J., Tomko, K., Willis, M., Kelleher, C., Cloutier, M., Husby, E., Foga, S., Nakamura, H., Platson, M., Wethington Jr., M., Williamson, C., Bauer, G., Enos, J., Arnold, G., Kramer, W., Becker, P., Doshi, A., D'Souza, C., Cummens, P., Laurier, F., and Bojesen, M.: ArcticDEM, Harvard Dataverse, V1, https://doi.org/10.7910/DVN/OHHUKH, (last access: 9 August 2019) 2018.
Porter, T. J. and Opel, T.: Recent advances in paleoclimatological studies of Arctic wedge and pore ice stable water isotope records. Permafrost and Periglac., 31, 429– 441, https://doi.org/10.1002/ppp.2052, 2020.
Porter, T. J., Schoenemann, S. W., Davies, L. J., Steig, E. J., Bandara, S., and Froese, D. G.: Recent summer warming in northwestern Canada exceeds the Holocene thermal maximum, Nat. Commun., 10, 1631, https://doi.org/10.1038/s41467-019-09622-y, 2019.
Raschke, E. A. and Savelieva, L. A.: Subrecent spore–pollen spectra and modern vegetation from the Lena River Delta, Russian Arctic, Contemp. Probl. Ecol., 10, 395–410, https://doi.org/10.1134/S1995425517040084, 2017.
R Core Team: R: A language and environment for statistical computing, R Foundation for Statistical Computing, Vienna, Austria, available at: https://www.R-project.org/, last access: 15 September 2019.
Reimer, P. J., Bard, E., Bayliss, A., Beck, J. W., Blackwell, P. G., Bronk Ramsey, C., Buck, C. E., Cheng, H., Edwards, R. L., Friedrich, M., Grootes, P. M., Guilderson, T. P., Haflidason, H., Hajdas, I., Hatté, C., Heaton, T. J., Hogg, A. G., Hughen, K. A., Kaiser, K. F., Kromer, B., Manning, S. W., Niu, M., Reimer, R. W., Richards, D. A., Scott, E. M., Southon, J. R., Turney, C. S. M., and van der Plicht, J.: IntCal13 and MARINE13 radiocarbon age calibration curves 0–50000 years cal BP, Radiocarbon, 55, 1869–1887, https://doi.org/10.2458/azu_js_rc.55.16947, 2013.
Rethemeyer, J., Dewald, A., Fülöp, R., Hajdas, I., Höfle, S., Patt, U., Stapper, B., and Wacker, L.: Status report on sample preparation facilities for 14C analysis at the new CologneAMS centre, Nucl. Instrum. Methods Phys. Res. B, 294, 168–172, https://doi.org/10.1016/j.nimb.2012.02.012, 2013.
Romanovskii, N. N.: Chetvertichnye otlozheniya ostrova Bol'shogo Lyakhovskogo I severnoi chasti Yano-Indigirskoi nizmenosti - stratigrafiya i merzlotno-fatsial'nyi analiz (Quaternary deposits of Bol'shoy Lyakhovsky Island and the northern part of the Yana-Indigirka lowland – stratigraphy and cryofacial analysis), Summary of the doctoral thesis, Moscow State University, Faculty of Geology, 23 pp., (in Russian) 1959.
Romanovskii, N. N.: Osnovy kriolitogeneza litosfery (Basic concepts of cryogenesis in the lithosphere), Moscow University Press, Moscow, 336 pp., 1993 (in Russian).
Sanborn, P. T., Smith, C. A. S., Froese, D. G., Zazula, G. D., and Westgate, J. A.: Full-glacial paleosols in perennially frozen loess sequences, Klondike goldfields, Yukon Territory, Canada, Quaternary Res., 66, 147–157, https://doi.org/10.1016/j.yqres.2006.02.008, 2006.
Schirrmeister, L., Siegert, C., Kunitzky, V. V., Grootes, P. M., and Erlenkeuser, H.: Late Quaternary ice-rich permafrost sequences as a paleoenvironmental archive for the Laptve Sea Region in Northern Siberia, Int. J. Earth Sci., 91, 154–167, https://doi.org/10.1007/s005310100205, 2002a.
Schirrmeister, L. Siegert C., Kuznetsova T., Kuzmina S., Andreev A. A., Kienast F., Meyer H., and Bobrov A. A.: Paleoenvironmental and paleoclimatic records from permafrost deposits in the Arctic region of Northern Siberia, Quaternary Int., 89, 97–118, https://doi.org/10.1016/S1040-6182(01)00083-0, 2002b.
Schirrmeister, L., Kunitsky, V. V., Grosse, G., Schwamborn, G., Andreev, A. A., Meyer, H., Kuznetsova, T., Bobrov, A., and Oezen, D.: Late Quaternary history of the accumulation plain north of the Chekanovsky Ridge (Lena Delta, Russia) – a multidisciplinary approach, Polar Geogr., 27, 277–319, https://doi.org/10.1080/789610225, 2003.
Schirrmeister, L., Grosse, G., Kunitsky, V., Magens, D., Meyer, H., Dereviagin, A., Kuznetsova, T., Andreev, A., Babiy, O., Kienast, F., Grigoriev, M., Overduin, P. P., and Preusser, F.: Periglacial landscape evolution and environmental changes of Arctic lowland areas for the last 60,000 years (Western Laptev Sea coast, Cape Mamontov Klyk), Polar Res., 27, 249–272, https://doi.org/10.1111/j.1751-8369.2008.00067.x, 2008.
Schirrmeister, L., Kunitsky, V., Grosse, G., Wetterich, S., Meyer, H., Schwamborn, G., Babiy, O., Derevyagin, A., and Siegert, C.: Sedimentary characteristics and origin of the Late Pleistocene Ice Complex on north-east Siberian Arctic coastal lowlands and islands – a review, Quaternary Int., 241, 3–25, https://doi.org/10.1016/j.quaint.2010.04.004, 2011a.
Schirrmeister, L., Grosse, G., Schnelle, M., Fuchs, M., Krbetschek, M., Ulrich, M., Kunitsky, V., Grigoriev, M., Andreev, A., Kienast, F., Meyer, H., Babiy, O., Klimova, I., Bobrov, A., Wetterich, S., and Schwamborn, G.: Late Quaternary paleoenvironmental records from the western Lena Delta, Arctic Siberia, Palaeogeogr. Palaeocl., 299, 175–196, https://doi.org/10.1016/j.palaeo.2010.10.045, 2011b.
Schirrmeister, L., Froese, D., Tumskoy, V., Grosse, G., and Wetterich, S.: Yedoma: Late Pleistocene ice-rich syngenetic permafrost of Beringia, in: The Encyclopedia of Quarternary Science, edited by: Elias, S. A., Elsevier, Amsterdam, 542–552, https://doi.org/10.1016/B978-0-444-53643-3.00106-0, 2013.
Schirrmeister, L., Schwamborn, G., Overduin, P. P., Strauss, J., Fuchs, M. C., Grigoriev, M., Yakshina, I., Rethemeyer, J., Dietze, E., and Wetterich, S.: Yedoma Ice Complex of the Buor Khaya Peninsula (southern Laptev Sea), Biogeosciences, 14, 1261–1283, https://doi.org/10.5194/bg-14-1261-2017, 2017.
Schirrmeister, L., Dietze, E., Matthes, H., Grosse, G., Strauss, J., Laboor, S., Ulrich, M., Kienast, F., and Wetterich, S.: The genesis of Yedoma Ice Complex permafrost – grain-size endmember modeling analysis from Siberia and Alaska, E&G Quaternary Sci. J., 69, 33–53, https://doi.org/10.5194/egqsj-69-33-2020, 2020.
Schwamborn, G., Meyer, H., Fedorov, G., Schirrmeister, L., and Hubberten, H.: Ground ice and slope sediments archiving late Quaternary paleoenvironment and paleoclimate signals at the margins of El'gygytgyn Impact Crater, NE Siberia, Quaternary Res., 66, 259–272, https://doi.org/10.1016/j.yqres.2006.06.007, 2006.
Schwamborn, G., Schirrmeister, L., Frütsch, F., and Diekmann, B.: Quartz weathering in freeze-thaw cycles; experiment and application to the El'gygytgyn Crater lake record for tracing Siberian permafrost history, Geograf. Ann. A, 94, 481–499, https://doi.org/10.1111/j.1468-0459.2012.00472.x, 2012.
Sher, A. V.: Yedoma as a store of paleoenvironmental records in Beringia, in: Abstracts and Program of the Beringia Paleoenvironmental Workshop, edited by: Elias, S. and Brigham-Grette, J., Florissant, Colorado, 20–23 September 1997, 92–94, 1997.
Sher, A. V., Kuzmina, S. A., Kuznetsova, T. V., and Sulerzhitsky, L. D.: New insights into the Weichselian environment and climate of the East Siberian Arctic, derived from fossil insects, plants, and mammals, Quaternary Sci. Rev., 24, 533–569, https://doi.org/10.1016/j.quascirev.2004.09.007, 2005.
Soloviev P. A.: Kriolitozona severnoy chasti Leno-Amginskogo mezhdurech'ya (The permafrost of the northern part of the Lena-Amga interfluve), Academy of Science Press, Moscow, 142 pp., 1959 (in Russian).
Stapel, J., Schirrmeister, L., Overduin, P., Wetterich, S., Strauss, S., Horsfield, B., and Mangelsdorf, K.: Microbial lipid signatures and substrate potential of the organic matter in permafrost deposits from Buor Khaya: implications for future greenhouse gas production, J. Geophys. Res.-Biogeo., 121, 2652–2666, https://doi.org/10.1002/2016JG003483, 2016.
Strauss, J., Schirrmeister, L., Wetterich, S., Borchers, A., and Davydov, S. P.: Grainsize properties and organic-carbon stock of Yedoma Ice Complex permafrost from the Kolyma lowland, Northeastern Siberia, Global Biochem. Cy., 26, GB3003, https://doi.org/10.1029/2011GB004104, 2012.
Strauss, J., Schirrmeister, L., Grosse, G., Wetterich, S., Ulrich, M., Herzschuh, U., and Hubberten, H.-W.: The deep permafrost carbon pool of the Yedoma region in Siberia and Alaska, Geophys. Res. Lett., 40, 6165–6170, https://doi.org/10.1002/2013GL058088, 2013.
Strauss, J., Schirrmeister, L., Mangelsdorf, K., Eichhorn, L., Wetterich, S., and Herzschuh, U.: Organic-matter quality of deep permafrost carbon – a study from Arctic Siberia, Biogeosciences, 12, 2227–2245, https://doi.org/10.5194/bg-12-2227-2015, 2015.
Strauss, J., Schirrmeister, L., Grosse, G., Fortier, D., Hugelius, G., Knoblauch, C., Romanovsky, V., Schädel, C., Schneider von Deimling, T., Schuur, E. A. G., Shmelev, D., Ulrich, M., and Veremeeva, A.: Deep Yedoma permafrost: A synthesis of depositional characteristics and carbon vulnerability, Earth-Sci. Rev., 172, 75–86, https://doi.org/10.1016/j.earscirev.2017.07.007, 2017.
Tahmasebi, F., Longstaffe, F. J., and Zazula, G.: Nitrogen isotopes suggest a change in nitrogen dynamics between the Late Pleistocene and modern time in Yukon, Canada, Plos One, 13, e0192713, https://doi.org/10.1371/journal.pone.0192713, 2018.
Throckmorton, H. M., Newman, B. D., Heikoop, J. M., Perkins, G. B., Feng, X., Graham, D. E., O'Malley, D., Vesselinov, V. V., Young, J., Wullschleger, S. D., and Wilson, C. J.: Active layer hydrology in an arctic tundra ecosystem: quantifying water sources and cycling using water stable isotopes, Hydrol. Process., 30, 4972–4986, https://doi.org/10.1002/hyp.10883, 2016.
Tumskoy, V. E.: Osobennosti kriolitogeneza otlozhenii severnoi Yakutii v srednem Neopleistotsene e Golotsene (Peculiarities of cryolithogenesis in northern Yakutia from the Middle Neopleistocene to the Holocene), Kriosfera Zemli (Earth's Cryosphere), 16, 12–21, 2012 (in Russian).
Vandenberghe, J.: Grain size of fine-grained windblown sediment: A powerful proxy for process identification, Earth-Sci. Rev., 121, 18–30, https://doi.org/10.1016/j.earscirev.2013.03.001, 2013.
Vasil'chuk, Y. K.: Syngenetic ice wedges: cyclical formation, radiocarbon age and stable-isotope records, Permafrost Periglac., 24, 82–93, https://doi.org/10.1002/ppp.1764, 2013.
Walker, H. J.: Arctic deltas, J. Coastal Res. 14, 719–738, 1998.
Weiss, N., Blok, D., Elberling, B., Hugelius, G., Juncher Jørgensen, C., Siewert, M. B., and Kuhry, P.: Thermokarst dynamics and soil organic matter characteristics controlling initial carbon release from permafrost soils in the Siberian Yedoma region, Sed. Geol., 340, 38–48, https://doi.org/10.1016/j.sedgeo.2015.12.004, 2016
Wetterich, S., Schirrmeister, L., and Pietrzeniuk, E.: Freshwater ostracodes in Quaternary permafrost deposits from the Siberian Arctic, J. Paleolimnol., 34, 363–376, https://doi.org/10.1007/s10933-005-5801-y, 2005.
Wetterich, S., Kuzmina, S., Andreev, A. A., Kienast, F., Meyer, H., Schirrmeister, L., Kuznetsova, T., and Sierralta, M.: Palaeoenvironmental dynamics inferred from Late Quaternary permafrost deposits on Kurungnakh Island, Lena Delta, Northeast Siberia, Russia, Quaternary Sci. Rev., 27, 1523–1540, https://doi.org/10.1016/j.quascirev.2008.04.007, 2008a.
Wetterich, S., Herzschuh, U., Meyer, H., Pestryakova, L., Plessen, B., Lopez, C. M. L., and Schirrmeister, L.: Evaporation effects as reflected in freshwaters and ostracod calcite from modern environments in Central and Northeast Yakutia (East Siberia, Russia), Hydrobiologia, 614, 171–195, https://doi.org/10.1007/s10750-008-9505-y, 2008b.
Wetterich, S., Schirrmeister, L., Andreev, A. A., Pudenz, M., Plessen, B., Meyer, H., and Kunitsky, V. V.: Eemian and Late Glacial/Holocene palaeoenvironmental records from permafrost sequences at the Dmitry Laptev Strait (NE Siberia, Russia), Paleogeogr. Paleoclim., 279, 73–95, https://doi.org/10.1016/j.palaeo.2009.05.002, 2009.
Wetterich, S., Rudaya, N., Tumskoy, V., Andreev, A. A., Opel, T., Schirrmeister, L., and Meyer, H.: Last Glacial Maximum records in permafrost of the East Siberian Arctic, Quaternary Sci. Rev., 30, 3139–3151, https://doi.org/10.1016/j.quascirev.2011.07.020, 2011.
Wetterich, S., Tumskoy, V., Rudaya, N., Andreev, A. A., Opel, T., Meyer, H., Schirrmeister, L., and Hüls, M.: Ice Complex formation in arctic East Siberia during the MIS3 Interstadial, Quaternary Sci. Rev., 84, 39–55, https://doi.org/10.1016/j.quascirev.2013.11.009, 2014.
Wetterich, S., Kizyakov, A., Fritz, M., Aksenov, A., Schirrmeister, L., and Opel, T.: Permafrost research on Sobo-Sise Island (Lena Delta), Rep. Polar Mar. Res., 734, 102–113, https://doi.org/10.2312/BzPM_0734, 2019.
Wetterich, S., Meyer, H., Fritz, M., Opel, T., and Schirrmeister, L.: Cryolithology of the Sobo-Sise Yedoma cliff (eastern Lena Delta), PANGAEA, https://doi.org/10.1594/PANGAEA.919470, 2020.
World Topo Base: available at: https://www.arcgis.com/home/item.html?id=3a75a3ee1d1040838f382cbefce99125, last access: 13 April 2020.
Zimov, S. A., Davydov, S. P., Zimova, G. M., Davydova, A. I., Schuur, E. A. G., Dutta, K., and Chapin, F. S.: Permafrost carbon: Stock and decomposability of a globally significant carbon pool, Geophys. Res. Lett., 33, L20502, https://doi.org/10.1029/2006gl027484, 2006.