the Creative Commons Attribution 4.0 License.
the Creative Commons Attribution 4.0 License.
 | 01 Dec 2020
The catastrophic thermokarst lake drainage events of 2018 in northwestern Alaska: fast-forward into the future
Sarah W. Cooley
Claude R. Duguay
Benjamin M. Jones
Guido Grosse
Northwestern Alaska has been highly affected by changing climatic patterns with new temperature and precipitation maxima over the recent years. In particular, the Baldwin and northern Seward peninsulas are characterized by an abundance of thermokarst lakes that are highly dynamic and prone to lake drainage like many other regions at the southern margins of continuous permafrost. We used Sentinel-1 synthetic aperture radar (SAR) and Planet CubeSat optical remote sensing data to analyze recently observed widespread lake drainage. We then used synoptic weather data, climate model outputs and lake ice growth simulations to analyze potential drivers and future pathways of lake drainage in this region. Following the warmest and wettest winter on record in 2017/2018, 192 lakes were identified as having completely or partially drained by early summer 2018, which exceeded the average drainage rate by a factor of ∼ 10 and doubled the rates of the previous extreme lake drainage years of 2005 and 2006. The combination of abundant rain- and snowfall and extremely warm mean annual air temperatures (MAATs), close to 0 ∘C, may have led to the destabilization of permafrost around the lake margins. Rapid snow melt and high amounts of excess meltwater further promoted rapid lateral breaching at lake shores and consequently sudden drainage of some of the largest lakes of the study region that have likely persisted for millennia. We hypothesize that permafrost destabilization and lake drainage will accelerate and become the dominant drivers of landscape change in this region. Recent MAATs are already within the range of the predictions by the University of Alaska Fairbanks' Scenarios Network for Alaska and Arctic Planning (UAF SNAP) ensemble climate predictions in scenario RCP6.0 for 2100. With MAAT in 2019 just below 0 ∘C at the nearby Kotzebue, Alaska, climate station, permafrost aggradation in drained lake basins will become less likely after drainage, strongly decreasing the potential for freeze-locking carbon sequestered in lake sediments, signifying a prominent regime shift in ice-rich permafrost lowland regions.
- Article
(6041 KB) - Full-text XML
-
Supplement
(1148 KB) - BibTeX
- EndNote


Permafrost is widespread (20 % to 25 % of the land area) in the northern high latitudes (Brown et al., 1997; Obu et al., 2019) and is primarily a result of past and present cold climatic conditions (Shur and Jorgenson, 2007). The rapidly warming Arctic climate is already reducing the stability and distribution of near-surface permafrost. Warming of permafrost at the global scale has been observed over recent decades from borehole temperature measurements (Romanovsky et al., 2010; Biskaborn et al., 2019), while local to regional permafrost degradation has been observed in many studies of varying scales across the permafrost domain (Nitze et al., 2018a). Widespread near-surface permafrost loss or transition from continuous to discontinuous permafrost has, for example, been shown with remote-sensing-supported permafrost modeling in Alaska (Pastick et al., 2015). Permafrost degradation may lead to long-term surface subsidence (Streletskiy et al., 2017), change in hydrological regimes (Liljedahl et al., 2016) and release of greenhouse gases including carbon dioxide (CO2), methane (CH4) and nitrous oxide (N2O) (Elberling et al., 2013; Walter Anthony et al., 2018; Repo et al., 2009). In particular, the release of greenhouse gases from carbon locked away for thousands of years will trigger further warming through the permafrost carbon feedback (Schuur et al., 2015). Furthermore, the stability of permafrost is crucial for local communities which are dependent on ground stability for infrastructure, food security and water supply (Chambers et al., 2007; White et al., 2007; Melvin et al., 2017; Hjort et al., 2018).
Rapid changes in lake area, including expansion and drainage, are strong indicators of permafrost degradation and thaw (Smith et al., 2005; Hinkel et al., 2007; Jones et al., 2011; Grosse et al., 2013; Arp et al., 2018; Nitze et al., 2018a). Natural lake drainage has been associated with near-surface permafrost degradation such as the melting of ice wedges, the formation of thermo-erosional channels, gully headward erosion and internal drainage through permafrost-penetrating taliks (Mackay, 1988; Yoshikawa and Hinzman, 2003; Hinkel et al., 2007; Marsh et al., 2009; Jones et al., 2020a). Other natural lake drainage events have been connected with increased precipitation causing bank overtopping with subsequent drainage channel formation and snow dams and subsequent outburst floods and drainage channel formation (Mackay, 1988; Jones and Arp, 2015).
The southern margin of continuous permafrost in northwestern, western and interior Alaska, as well as adjacent northwestern Canada, has been identified as a region with a high temporal variability in lake area and particularly widespread lake drainage (Jones et al., 2011; Chen et al., 2014; Lantz and Turner, 2015; Nitze et al., 2018a). Over the past few decades, lake drainage has outpaced lake growth by 14.9 % on the Seward Peninsula in western Alaska, largely driven by the drainage of several very large individual lakes (Jones et al., 2011; Nitze et al., 2017). Other transitional permafrost regions around the Arctic are broadly affected by the same pattern with widespread drainage events and net lake area loss (Smith et al., 2005; Nitze et al., 2018a). However, lakes also experience intra-annual (Cooley et al., 2017, 2019) to multiyear (Plug et al., 2008; Karlsson et al., 2014) water level fluctuations linked to precipitation and evaporation dynamics or overall hydrological runoff regimes, which can cause high uncertainty in interpreting temporally sparse observations. In particular, recently shifting weather patterns with warmer air and sea surface temperatures along Arctic coasts driven by reduced sea ice cover (Bhatt et al., 2014) may also have an effect on coastal lowland permafrost (Lawrence and Slater, 2005) and thus potentially lake dynamics (Alexeev et al., 2016; Arp et al., 2019). For example, persistent warm air and sea surface temperatures caused a new sea ice minimum in the Bering Sea west of Alaska resulting in unprecedented largely open seas in winter 2017/2018 (Stabeno and Bell, 2019).
Other regions with cold continuous permafrost (e.g., Arctic Coastal Plain, Tuktoyaktuk Peninsula, coastal lowlands of Siberia) are also affected by lake drainage (Hinkel et al., 2007; Kravtsova and Bystrova, 2009; Karlsson et al., 2012; Lantz and Turner, 2015; Olthof et al., 2015; Nitze et al., 2017, 2018a; Jones et al., 2020a) but to a lesser intensity than the transitional zone towards discontinuous permafrost, particularly in Alaska and western Siberia (Nitze et al., 2017, 2018a).
Several studies suggest that lake drainage might be episodic with drainage events clustered in time and therefore potentially related to specific environmental conditions such as high precipitation events (Marsh et al., 2009; Swanson, 2019; Jones et al., 2020a). Others, in contrast, find more stable-to-decreasing long-term drainage rates, e.g., in northern Alaska and the western Canadian Arctic (Hinkel et al., 2007; Marsh et al., 2009; Jones et al., 2020a).
In western Alaska, a series of major drainage events took place in the mid-2000s, when some of the largest thermokarst lakes on the ground-ice-rich northern Seward Peninsula drained within the short period of a few years (Jones et al., 2011; Swanson, 2019). The recent drainage of several large lakes on the northern Seward Peninsula and the largest lake on the Baldwin Peninsula provides an interesting test bed for analyzing lake drainage progression in high temporal and spatial detail using remote sensing imagery, meteorological data and lake ice characteristics. The geographic proximity to the Bering and Chukchi seas, which have both experienced rapid sea ice loss and climatic shifts in recent years, offers a unique opportunity to study the relationship between changing climate regimes and lake dynamics in permafrost regions on short timescales. In this study, we therefore use temporally high-resolution remote sensing and meteorological data to quantify the following.
-
How much lake area was affected by the recent drainage events in western Alaska in 2018?
-
How do the drainage events documented in 2018 compare to other previous events such as in the mid-2000s in terms of area, spatial distribution and temporal (intra-annual) sequence?
-
What are the primary drivers of the recent drainage events and how may projected future climate scenarios affect lake trajectories in this region?
To answer these questions, we analyzed recent optical and synthetic aperture radar (SAR) satellite imagery (Planet, Sentinel-1) from 2017 and 2018 to map the spatio-temporal lake change dynamics and compared the results to available datasets of past lake dynamics (Nitze et al., 2018a, b) and climatic conditions. Furthermore, we investigated weather and climate data, as well as modeled lake ice conditions, as potential drivers of the widespread lake drainage.
In this study, we focus on the northern Seward Peninsula (NSP) and the Baldwin Peninsula (BP) in western Alaska. The study area covers a total land area (including interior water bodies) of 25 271 km2. It is bounded by the Chukchi Sea and Kotzebue Sound to the north and northwest, different hill ranges to the south, and Selawik Lake, Hotham Inlet and the 161∘ W meridian to the east (Fig. 1). It is part of the Bering Land Bridge region, which was largely unglaciated during the last glacial maximum and is now located at the southern margin of the continuous permafrost zone (Jorgenson et al., 2008; Obu et al., 2019). Measured ground temperatures range between −3.5 and −0.8 ∘C (Biskaborn et al., 2015; GTN-P Ground Temperature Database). Modeled ground temperatures range between −2.8 and +0.5 ∘C with the majority between −1.5 and −2.0 ∘C (Obu et al., 2019).
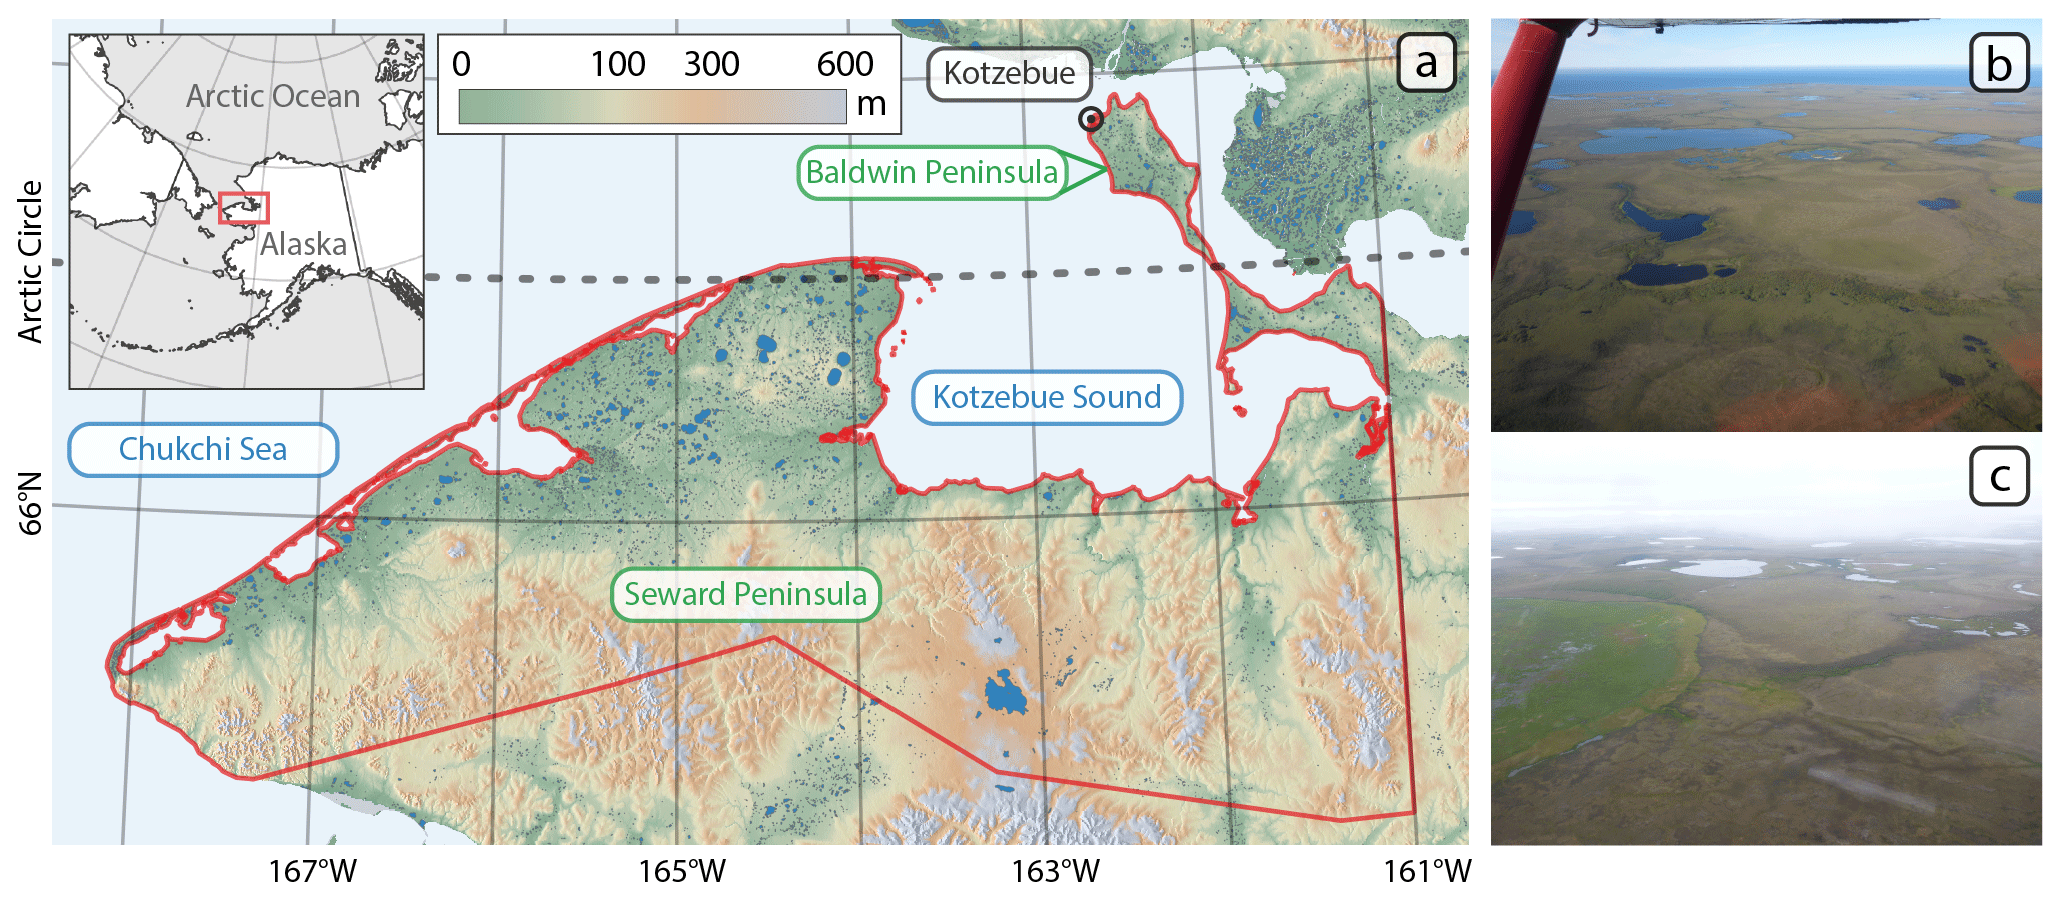
Figure 1(a) Overview of study area with topography and place names. Elevation source: GMTED2010. (b) Oblique aerial photo of the formerly largest lake on the Baldwin Peninsula, which drained in 2018 (photo: Jens Strauss, July 2016). (c) Oblique aerial photo of the northern Seward Peninsula (photo: Guido Grosse, July 2016). Lake-rich permafrost landscape with large drained basin.
The area is characterized by a subarctic continental climate with a mean annual air temperature (MAAT) of −5.1 ∘C and 279 mm precipitation, as reported at the Kotzebue climate station (NOAA, 1981–2010). Snowfall accumulation averages 157 cm per year, considerably more than, for example, in northern Alaska (∼ 95 cm in Utkiaġvik/Barrow). Snow typically persists until the middle to end of May (Macander et al., 2015).
The study region is composed of a strongly degraded ice-rich permafrost landscape with typical permafrost landforms such as thermokarst lakes and drained thermokarst lake basins of several generations (Plug and West, 2009; Jones et al., 2011, 2012), pingos, ice wedge polygon networks, and ice-rich yedoma uplands as remnants of the Pleistocene accumulation plain (Hopkins, 1955; Jongejans et al., 2018). The morphology is variable with mostly flat terrain (< 20 m) in highly degraded permafrost terrain along the coastal margin of the NSP and undulating terrain with steep slopes in the upland regions of the NSP. The mountainous terrain along the southern margin of the NSP reaches up to ∼ 700 m elevation. The Baldwin Peninsula (BP) is characterized by rolling terrain from sea level to ∼ 50 m elevation with a mixture of degraded permafrost with partially drained lake basins and uplands in various stages of degradation (see Fig. 1).
The foothills and mountain ranges of the study area are underlain by bedrock. Furthermore, the NSP is locally affected by late Quaternary volcanism with the presence of four known maar lakes (Devil Mountain, White Fish, North Killeak, South Killeak), which are the largest lakes of the study region and the largest maar lakes globally (Beget et al., 1996). Further volcanic landscape features such as degraded volcanic bedrock cores, young basaltic lava flows and young cinder cones are locally present in the southern portion of the NSP (Hopkins, 1955). In part, deposits of the BP are likely of glacial origin, with a buried terminal moraine covered with yedoma-like, ice-rich sediments (Huston et al., 1990; Jongejans et al., 2018).
The region is one of the major lake districts in Alaska (Arp and Jones, 2009). The lake presence in the selected study area is concentrated on the coastal plains and thermokarst terrain. The majority of lakes are located in drained thermokarst lake basins, have shallow depths of less than 2 m, and are often later generation thermokarst lakes in locations that experienced several previous lake generations (Jones et al., 2012; Lenz et al., 2016). However, first generation thermokarst lakes up to 15 m in depth intersecting the remaining yedoma upland surfaces are still present (Kessler et al., 2012). Yedoma uplands with flat surfaces are speckled with initial thermokarst ponds and small lakes, most notably on the BP (Jongejans et al., 2018). In addition, the four large maar lakes on the NSP reach depths of up to 100 m (Beget et al., 1996).
Vegetation is predominantly composed of shrubby tundra and is located in zones D and E of the Circumpolar Arctic Vegetation Map (CAVM) (Walker et al., 2005). Vegetation is typically abundant in sheltered areas along thermokarst lake margins. Floating vegetation mats may be present on lake margins and persist above water associated with expanding lake margins (Parsekian et al., 2011).
3.1 Data
3.1.1 Lake dataset base layer
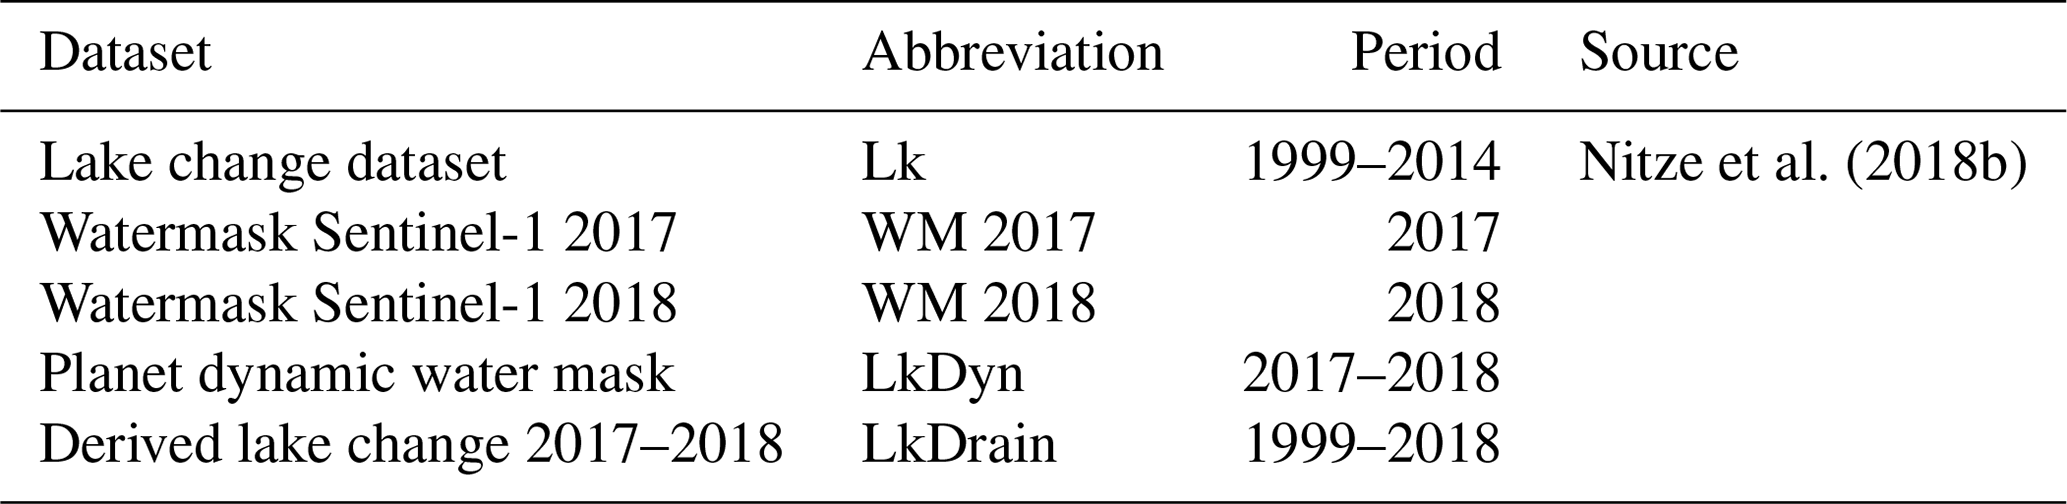
We used the lake change dataset of Nitze et al. (2018a, b) as the base layer for further analysis and for understanding decadal-scale lake dynamics. This dataset contains polygon vectors of the buffered lake extent of individual lakes larger than 1 ha. Water bodies smaller than 1 ha were excluded from the original analysis due to Landsat's spatial resolution of 30 m. The dataset includes spatial attributes and statistics such as individual lake area in 1999 and 2014, net change (gain minus loss), and gross changes (gain, loss) from 1999 to 2014, as well as lake shape parameters such as orientation, eccentricity and solidity. All lakes intersecting the study area (n= 4605) were selected for analysis. We focused on this period due to the availability of this already published and available dataset. Further geographic information system (GIS) and spatial analyses are based on the geometries of this lake dataset (lake change 1999–2014; named Lk hereafter). An overview of the lake change datasets is provided in Table 1.
3.2 Remote sensing analysis
3.2.1 Water masks for 2017 and 2018: Sentinel-1 imagery
We extracted late-summer water masks for the years 2017 and 2018 using Sentinel-1A/B SAR data in Google Earth Engine (GEE) (Gorelick, et al., 2017) (see Fig. 2). We focused on the difference from 2017 to 2018 as this period was previously identified as being strongly affected by lake drainage.
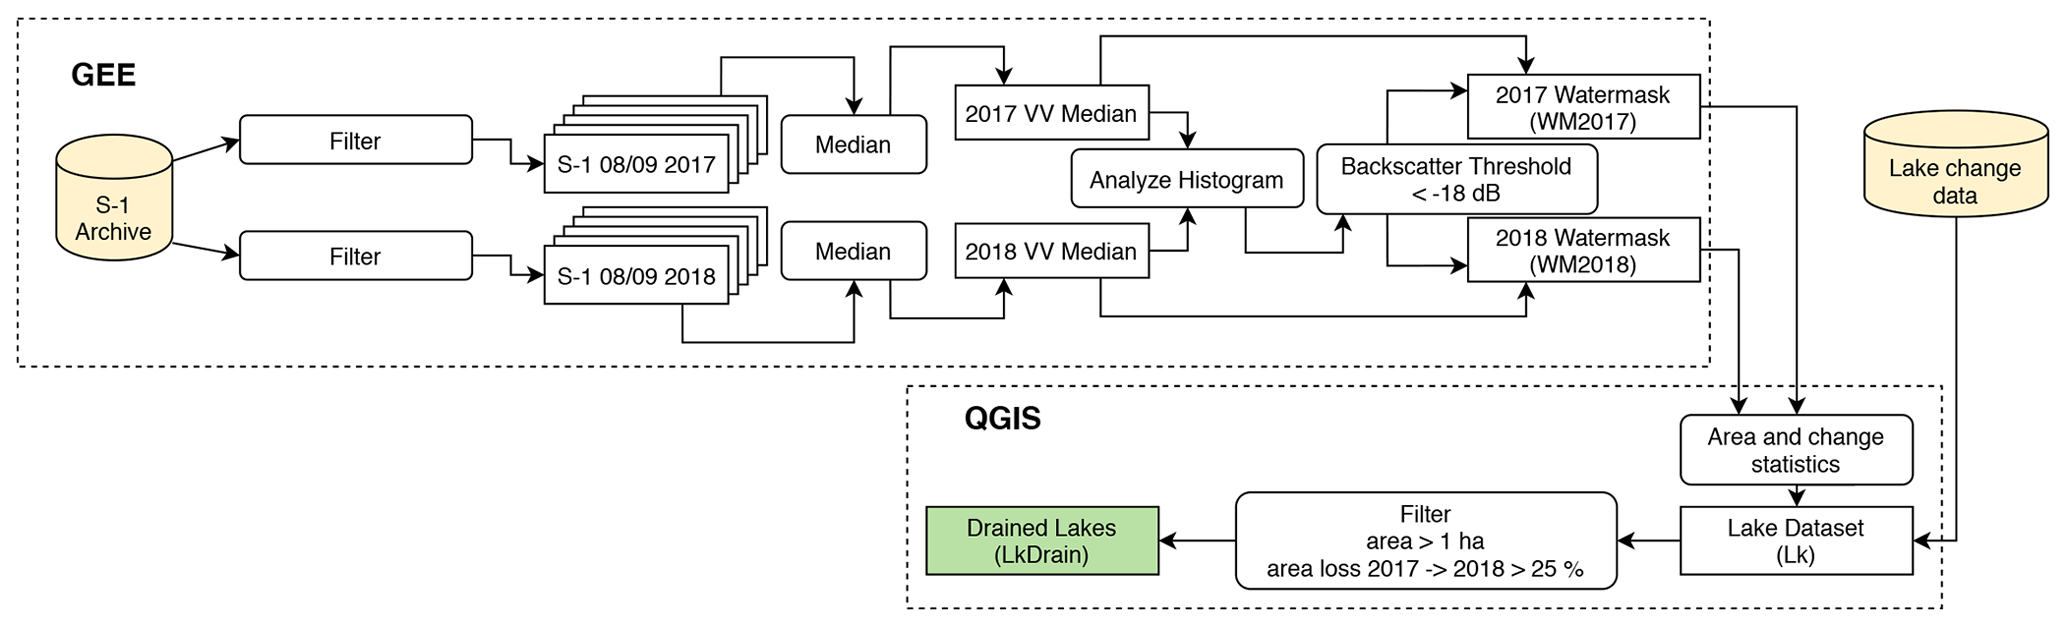
Figure 2Flowchart of lake change detection and drainage assignment based on Sentinel-1 data (Sentinel-1 Archive). Raster data processing was carried out in Google Earth Engine (GEE). Lake vector extraction and calculation of recent and historic (lake change data; Nitze et al., 2018b) lake change statistics were carried out in Quantum GIS (QGIS).
We identified all Sentinel-1A/B images available between 1 August and 30 September in both 2017 and 2018 (Watermask 2017: WM2017, Watermask 2018: WM2018) and selected VV polarization, which was available for all Sentinel-1 data within this period. Erroneous low backscatter values along image margins, which are a common issue for these datasets, were clipped per default with a buffer of 5000 m.
We created a median value composite of the entire image stack to lessen the impact of very high backscatter values caused by windy conditions. After histogram analysis, we determined a backscatter value of −18 dB as the best threshold point between land and water. All backscatter values below −18 dB were added to the surface water masks of 2017 (WM2017) and 2018 (WM2018). We exported the two water masks to raster files with 20 m×20 m grid spacing in UTM3N projection. The water masks WM2017 and WM2018 were intersected with the lake extent base layer (Lk) using zonal statistics in Quantum GIS (QGIS) version 3.6 (QGIS Development Team, 2019) to retrieve lake area extent and zonal statistics values for 2017 and 2018.
Lastly, all lakes with a lake area loss of > 25 % and initial size of > 1 ha, based on the difference of WM2017 and WM2018, were defined as drained lakes. This follows previous studies defining drainage thresholds through lost water area of > 25 % (Hinkel et al., 2007; Olthof et al., 2015; Jones et al., 2020a). The drained lakes dataset is referred to as LkDrain.
Links to the GEE code used for water masking are provided in the Code and Data Availability section.
3.2.2 Timing of drainage in 2017 and 2018: Planet imagery
To determine the drainage patterns and mechanics, as well as to compare long-term versus short-term drainage patterns, we automatically analyzed temporally high-resolution Planet CubeSat imagery (Planet Team, 2017) from 2017 and 2018 and visually inspected the largest drained lakes. With over 120 satellites in orbit, the Planet constellation provides a temporal frequency of observations of less than 1 d at a ground resolution of 3.125 m, which makes Planet data an ideal solution for mapping rapid landscape dynamics at high spatial and temporal resolutions. For mapping individual lake dynamics in 2017 and 2018, we used the automated lake tracking workflow presented in Cooley et al. (2017, 2019). A complete description of the method can be found in Cooley et al. (2019). A brief summary is provided here. First, we downloaded all PlanetScope (3.125 m resolution) and RapidEye Ortho Tiles (5 m resolution) with < 20 % cloud cover available from Planet Labs between 1 May and 1 October for both 2017 and 2018. We then created an initial lake mask which contains the maximum extent of all water bodies in the study area between 2017 and 2018. This initial mask was buffered by 60 m and all rivers were removed to produce a buffered water mask used for both seeding the water classification and tracking changes in lake area.
We then classified all of the images into water or land by applying a histogram-derived threshold to each image's Normalized Difference Water Index (NDWI) – (NIR − green)∕(NIR+green), where NIR signifies near infrared – as described in Cooley et al. (2017, 2019). To track changes in lake area, we used an object-based lake tracking method wherein for every image, we calculated the total amount of water contained within each lake object in the buffered mask. This method allows for the direct comparison between RapidEye and PlanetScope imagery with its different spatial resolution and furthermore is robust against potential minor geolocation uncertainty.
At the time of analysis, Planet Labs imagery did not provide a reliable cloud mask. Therefore, the third and most critical step of the method was the removal of cloudy or poor quality observations using a machine-learning-derived filtering algorithm. To do this, we first created a manual training dataset of valid/invalid lake area observations and then used this dataset to build a Random Forest classifier that automatically removes cloudy or poor quality lake observations. This method is able to accurately classify 97 % of observations as valid or invalid. We then selected the best observation for each day and applied additional outlier and median filters to produce the final time series. While we do not specifically remove ice-covered observations from the analysis, Cooley et al. (2019) demonstrate that most ice-impacted lake area observations are classified as invalid by the Random Forest classifier.
The final lake dynamics dataset, henceforth referred to as LkDyn, includes buffered polygon vectors and seasonal time series of lake area, as well as basic descriptive lake area statistics such as minimum area, maximum area and seasonal dynamics (max–min) for each individual lake. For the analysis of temporal lake drainage patterns, we spatially joined all lakes of LkDyn which intersected LkDrain.
3.2.3 Identifying past lake drainage for 1999–2014
For lake dynamics from 1999 to 2014, we used the lake change dataset (Lk) of Nitze et al. (2018b) to compare recent dynamics to the observed drainage events of 2018. We opted for manual image interpretation based on satellite imagery video animations as there is to our best knowledge no reliable automated method available to determine drainage dates in challenging Arctic environments. We tested the automated LandTrendr method, which automatically determines breakpoints in time series, to retrieve the timing of lake drainage between 1999 and 2018 (Kennedy et al., 2010; Kennedy et al., 2018). Results obtained with this method were highly unstable with insufficient reliability.
We created video animations in GEE for each individual drained lake, with time-stamped frames, and determined the drainage year manually through visual interpretation (for link to code, see below). The drainage year was defined as the point in time of initial clearly visible drainage, which could be (a) visible exposure of lake bottom sediments or (b) a strong increase in vegetation, e.g., due to sudden lake level drop. The entire calculated area loss was assigned to the determined drainage year. Lake area loss of lakes with a longer drainage process > 1 year, e.g., from 2005 until 2009, were counted as full drainage in the initial drainage year (2005). The visual interpretation was aided by plotting the time series of multispectral indices (Tasseled Cap, NDVI, NDWI) for each individual drained lake.
Lakes with data gaps (up to several years) right before the determined drainage year were flagged in the statistics. This frequently applied to years 2005 and 2008, which had several data gaps in the preceding years (see Supplement Fig. S1). Data gaps were caused by limited data availability, frequent cloud cover and shadows, as well as the Landsat-7 Scan Line Corrector (SLC) error. Lakes where the timing could not be detected manually, e.g., in cases of very subtle drainage, were assigned no drainage year (25 of 270 lakes).
Links to the GEE video animation processing code and time-series plotting are provided in the Code and Data Availability section. The videos are accessible at: https://github.com/initze/NW_Alaska_Drainage_Paper/tree/final/animations/lake_animations_drainage_1999-2014 (last access: 10 November 2020).
3.3 Climate and weather analysis
3.3.1 Weather
We analyzed synoptic weather data from the nearest weather station in Kotzebue (see Fig. 1a) that is provided by the National Oceanic and Atmospheric Administration (NOAA). We acquired the GHCN-Daily datasets (Menne et al., 2012) in CSV format through a web search on the NOAA website (https://www.ncdc.noaa.gov/cdo-web/search, last access: 29 July 2020). The dataset provides a daily series of minimum (Tmin) and maximum (Tmax) temperatures (T), precipitation (prcp), and snowfall (sf) since 1897 with continuous observations since 1950. Temperature recordings from 1 May through 3 September 2019 were affected by erroneous measurements and removed by NOAA from reprocessed datasets (as of 29 July 2020). Precipitation and snowfall measurements were not affected and are available for the entire period.
Daily mean temperatures are not available continuously. Therefore, we calculated daily mean temperatures as the mean of daily minimum and daily maximum temperatures. For calculating the influence of winter conditions (T, prcp, sf), we analyzed the weather conditions from 1 July of the preceding year until 30 June on a yearly basis, from here on referred to as “winter year”. Therefore, winter year 2018, for example, is defined as the period from 1 July 2017 through 30 June 2018. In addition to the standard attributes (mentioned above), we calculated freezing degree days (FDDs) as the cumulative sum of negative mean daily temperatures per winter year. Snow accumulation is calculated as the cumulative sum of snowfall per winter year. We calculated climatological means for daily observations and yearly aggregated statistics. For daily values we calculated means and standard deviations of mean temperatures (Tmean) for each calendar day, excluding 29 February, from 1 January 1981 through 31 December 2010. We calculated yearly mean temperature as the mean of daily mean temperatures. We calculated the mean of yearly values between 1981 and 2010 as the climatic mean temperature. For annual statistics of winter years, we calculated values ranging from July 1980 through June 2010, according to the previously stated winter year definition.
For climate and weather data preprocessing and time-series plotting, a python package was developed by Ingmar Nitze, which is available at https://github.com/initze/noaaplotter (last access: 10 November 2020).
3.3.2 Climate prediction
We downloaded decadal SNAP (Scenarios Network for Alaska and Arctic Planning, 2020) ensemble climate model projections (2 km CMIP/AR5) of scenarios RCP4.5, RCP6.0 and RCP8.5 for the study region. This dataset contains decadal (2010–2019, 2020–2029, … , 2090–2099) mean annual, seasonal and monthly air temperature and precipitation. For the analysis, we used annual predictions of temperature (MAAT) and precipitation (MAP). Gridded data are available at a spatial resolution of 2 km across Alaska and parts of western Canada. We clipped the data to the extent of the study area and calculated the mean and standard deviations for the entire study region for projected MAAT and MAP values for each decade.
3.4 Lake ice simulations
We used the Canadian Lake Ice Model (CLIMo; Duguay et al., 2003) to analyze the impact of weather conditions on lake ice growth and permafrost. CLIMo is a 1-D thermodynamic ice model that has been used in several studies (Ménard et al., 2002; Labrecque et al., 2009; Brown and Duguay, 2011; Surdu et al., 2014; Antonova et al., 2016). CLIMo output includes all energy balance components, on-ice snow depth, the temperature profile at an arbitrary (specified) number of levels within the ice and/or snow (or the water temperature if there is no ice) and ice thickness (clear ice and snow ice) on a daily basis, as well as freeze-up and breakup dates and end-of-season clear (congelation) ice, snow ice and total ice thickness. The model output of particular interest to lake ice simulations within the context of this study is the evolution of lake ice growth and maximum ice thickness as they are useful proxies for freezing intensity and the influence of weather conditions on potential ground stability. Thicknesses of snow ice and that of congelation ice layers (referred to hereafter as “top growth” and “bottom growth”, respectively) were also analyzed to account for snow mass and snow insulation effects.
The lake ice model is forced with five meteorological variables consisting of mean daily near-surface air temperature, relative humidity, wind speed, cloud cover and snowfall (or snow depth from a nearby land site when available). Four of the five meteorological variables (all but snowfall) were taken directly or derived from the ERA5 atmospheric reanalysis product from the European Centre for Medium-Range Weather Forecasts (ECMWF). Since ERA5 did not provide adequate snowfall or snow depth values, we obtained snow depth data from NOAA's Global Historical Climate Network Daily (from the nearest weather station at Kotzebue Ralph Wien Memorial Airport) for model simulations.
We performed simulations over nearly a 40-year period (1980–2018) and with the specification of a mixed-layer depth of 2 m. The length of the record was chosen based on the availability of ERA5 data and to be able to place the lake ice model output for winter year 2018 into a broader historical context. Finally, in order to account for the redistribution of snow across lake ice surfaces, which is a process well documented in several studies (e.g., Duguay et al., 2003; Sturm and Liston, 2003; Brown and Duguay, 2011; Kheyrollah Pour et al., 2012), we ran the model with two sets of snow depth scenarios: one with full snow cover (100 % of the amount measured at the Kotzebue weather station) and the other with no snow cover (0 % snow, i.e., snow-free ice surface) to capture the range of snow conditions that one would expect to observe in the field.
3.5 Random Forest feature importance analysis of annual weather variables
In order to analyze the influence of weather conditions on the annual drained lake area, we used the feature importance (FI) measure of the Random Forest machine-learning model (Breiman, 2001). The internal FI metric quantifies the importance of individual input variables as a percentage, in which all individual FI scores sum up to 100 %.
Random Forest is an ensemble of individual decision trees and is a widely used method for classification and regression tasks (Belgiu and Drăguţ, 2016), as well as measuring feature importance (Nitze et al., 2015). We used annual (winter year) weather attributes as input features (mean temperature, cumulative precipitation, cumulative snowfall, freezing days, freezing degrees of the winter year) and annual drained lake area (1999–2014, 2018) as the target variable. As the FI requires a high number of individual decision trees, we carried out our analysis with 1000 trees with the scikit-learn package in python. For evaluating the model performance, we used the r2 on the training data and unbiased r2 based on the internal out-of-bag estimator and leave-one-out cross-validation.
4.1 Lake changes
4.1.1 Lake drainage 2018
Lake area loss was severe in 2018, in which 192 of 4605 lakes larger than 1 ha lost more than 25 % of their initial size (LkDrain). These lakes lost an accumulated water area of 1622.04 ha between late summer 2017 and 2018. Total net lake area loss, including all lakes, was 2062.56 ha (4 % of the total lake area in the study domain).
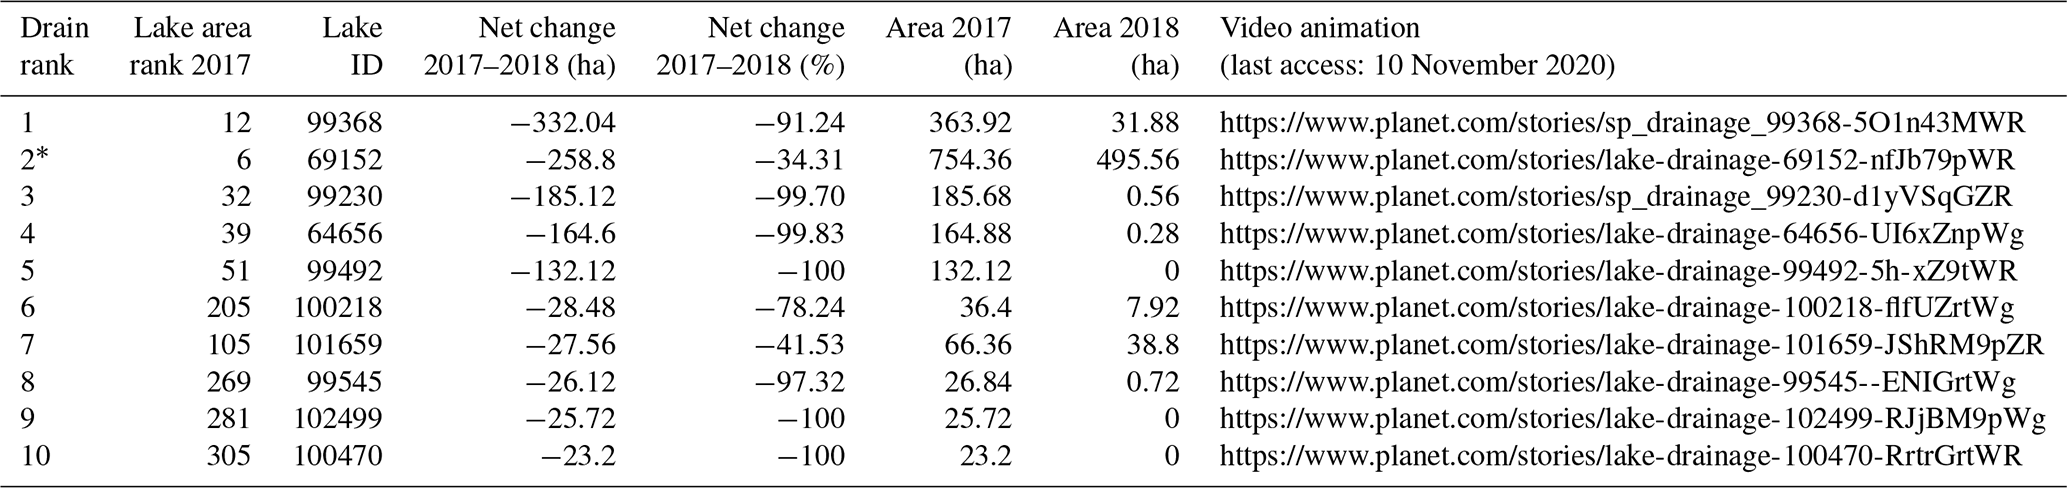
Lake drainage clustered around two types of lake sizes. Five very large lakes (> 100 ha) lost 1072.68 ha or 66.1 % of the total drained lake area (LkDrain), while the remaining 190 lakes accounted for 549.36 ha or 34.9 %, in which the largest lake had an initial size of 28.5 ha in 2017 (Table 2). Of the five large drained lakes, four are of thermokarst origin, and the largest is a lagoon on the BP, which likely is affected by episodic flooding and drying. The five large lakes that drained were some of the largest thermokarst lakes in the entire study area before drainage (size rank 6, 12, 32, 39, 51). The only other larger lakes in the study region were formed or affected by late Quaternary volcanic activity (four maar lakes and Imuruk Lake) and therefore are less prone to lake drainage caused by permafrost degradation.
Table 2Lakes ranked by largest area loss from 2017 to 2018 with lake area rank 2017, Lake ID, net change area and percentage, as well as lake area in 2017 and 2018. For full dataset, see Supplement Table S1 and datasets LkDrain. * Lagoon connected to the sea/Kotzebue Sound.
Spatially, the highest density of lake drainage events is located in the Cape Espenberg region in the northeastern part of the NSP (see Fig. 3). On the BP, two spatial clusters of lake drainage prevail. The first cluster is located in the center of the northern part of the BP, which encompasses the now drained formerly largest lake (Lake ID 64656) and its neighboring basins. The second cluster is located in the southern part of the BP, where several partially drained lakes form a nearly linear structure. Smaller clusters or individual lake drainage events are scattered predominantly along coastal and lowland areas of the entire study region and across different landscape units such as uplands, thermokarst basins, coastal depressions and river floodplains. Lake drainage in the southern more mountainous region of the study area was scarce.
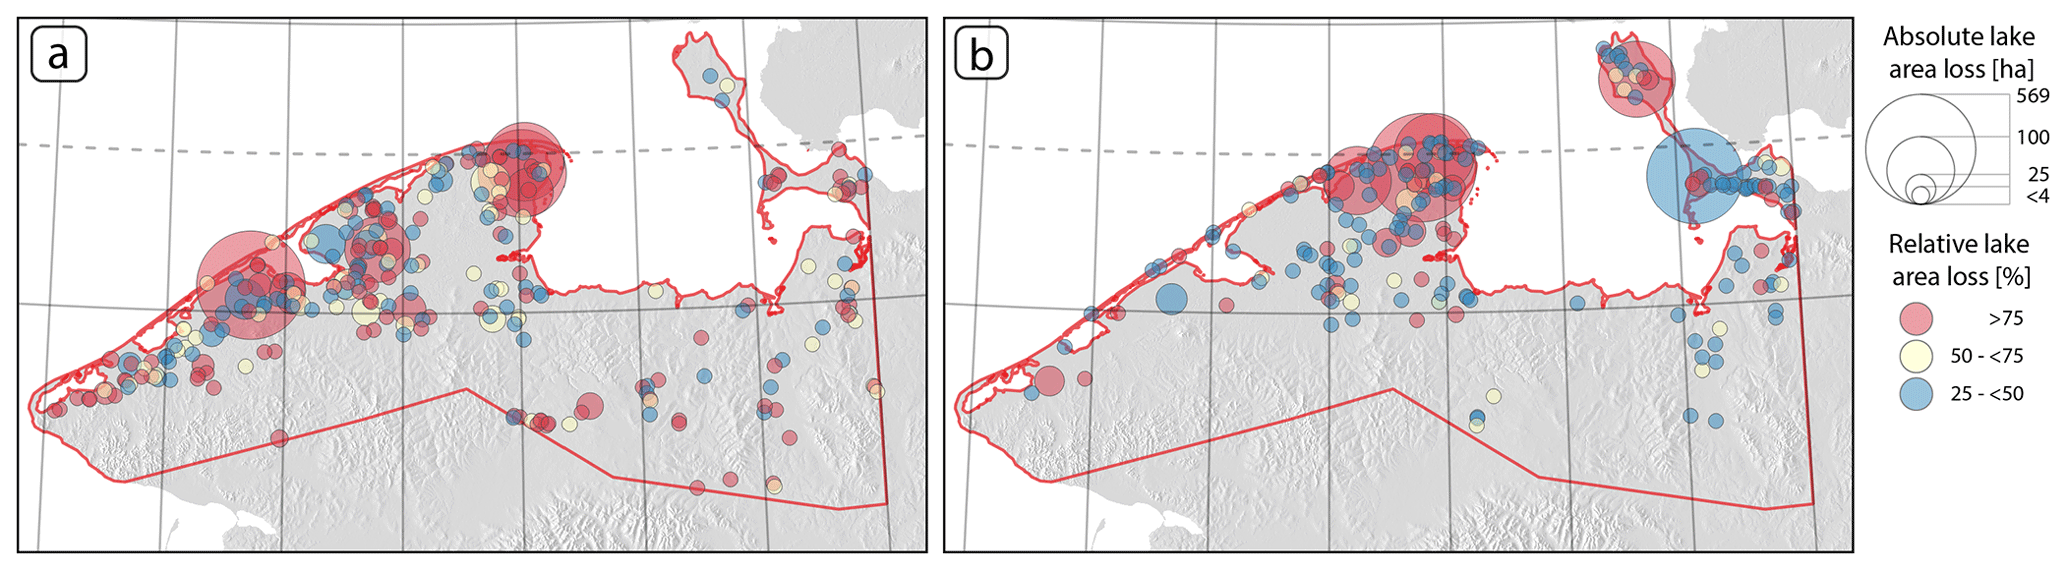
Figure 3Spatial patterns, size and percentage of drained lakes. (a) 1999–2014 and (b) 2017–2018. Shaded relief (hillshade) background layer based on the GMTED2010 elevation dataset.
4.1.2 Intra-annual lake drainage dynamics
Temporal patterns
The analyzed lakes exhibit various distinct seasonal patterns of lake area loss or drainage. The ice breakup period in late May and early June 2018 was the most dominant period of lake drainage. A total of 9 of the largest 10 lakes (see Table 3) exhibit a strong decline in lake area before July 2018, and one rapid drainage event in early July (Lake ID 101359). In the majority of these cases (n=8), the first valid observation of 2018 already showed a significant decline compared to the last observation of 2017, which indicates drainage during snow-melt and ice breakup when data observations were still masked due to the presence of ice and snow. During June 2018, weather conditions were favorable for optical remote sensing, and observations for persistently ice-free lakes are available. From July, lake area only decreased slowly and gradually among the analyzed lakes (LkDrain) without further distinct drainage peaks. A detailed example of a representative lake drainage event is presented in Fig. 4.
Table 3Lakes with largest area loss from 1999 to 2014 with net change area and percentage, as well as lake areas of 1999 and 2014 (Nitze et al., 2018b). For full datasets, see Supplement Table S2 and datasets Lk.
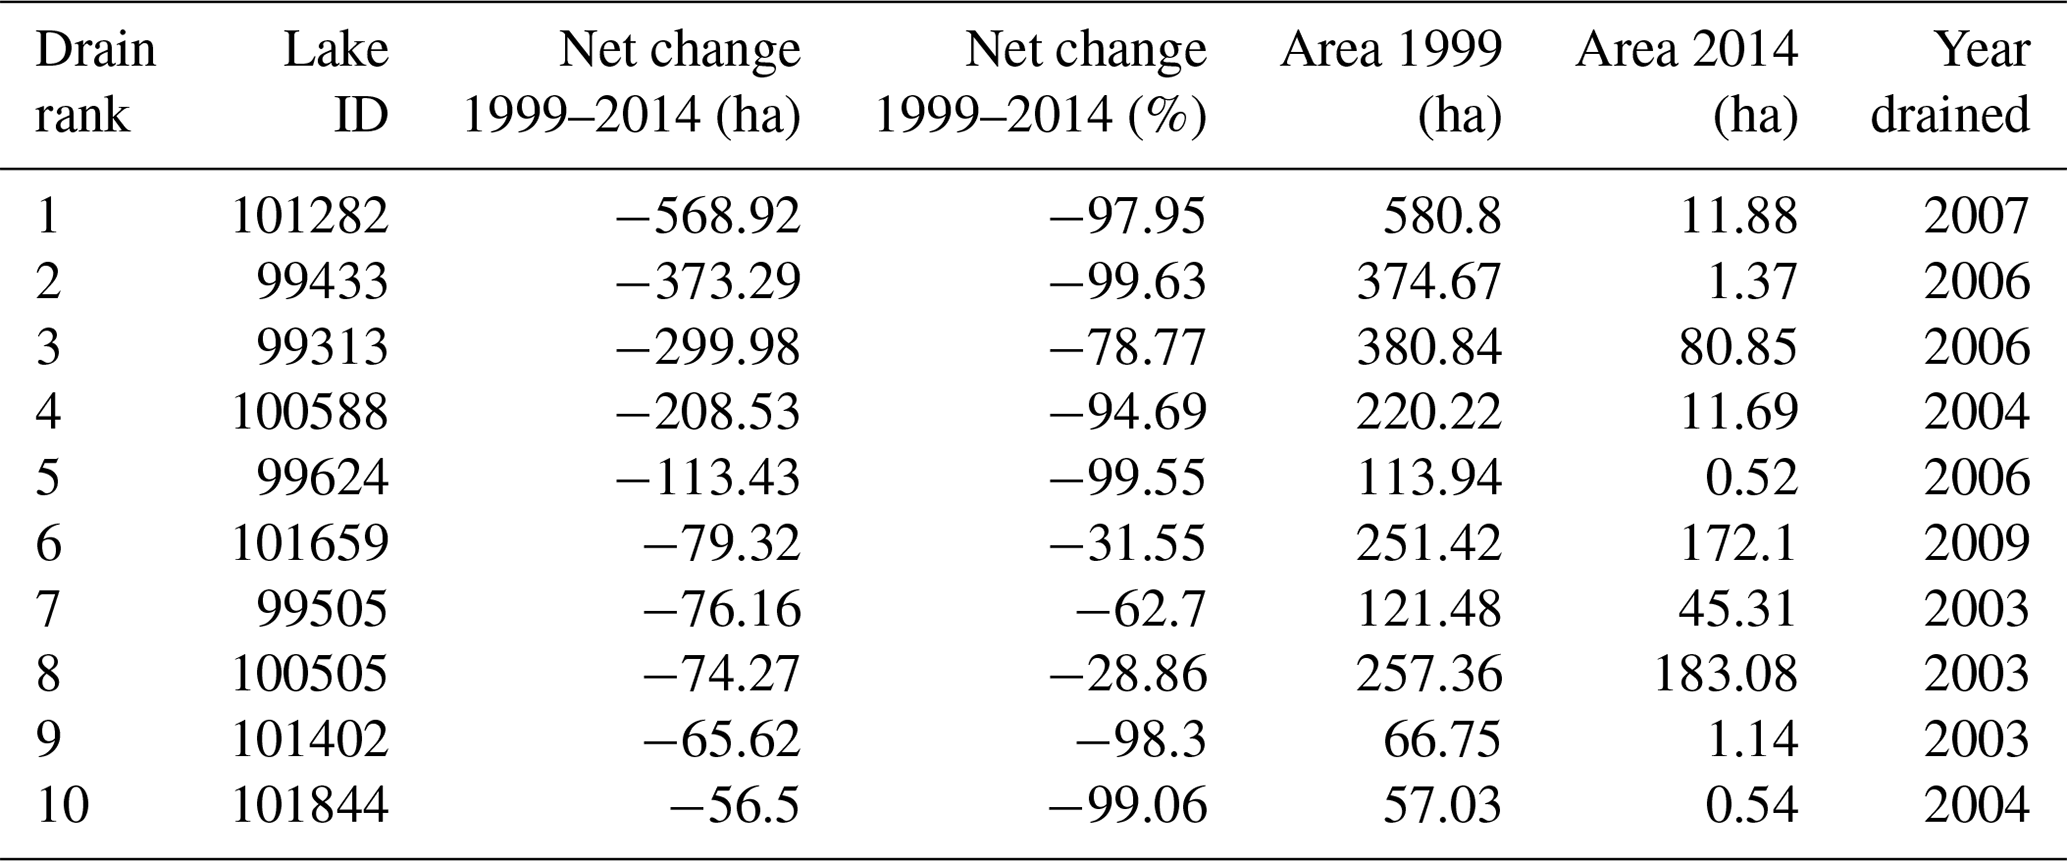
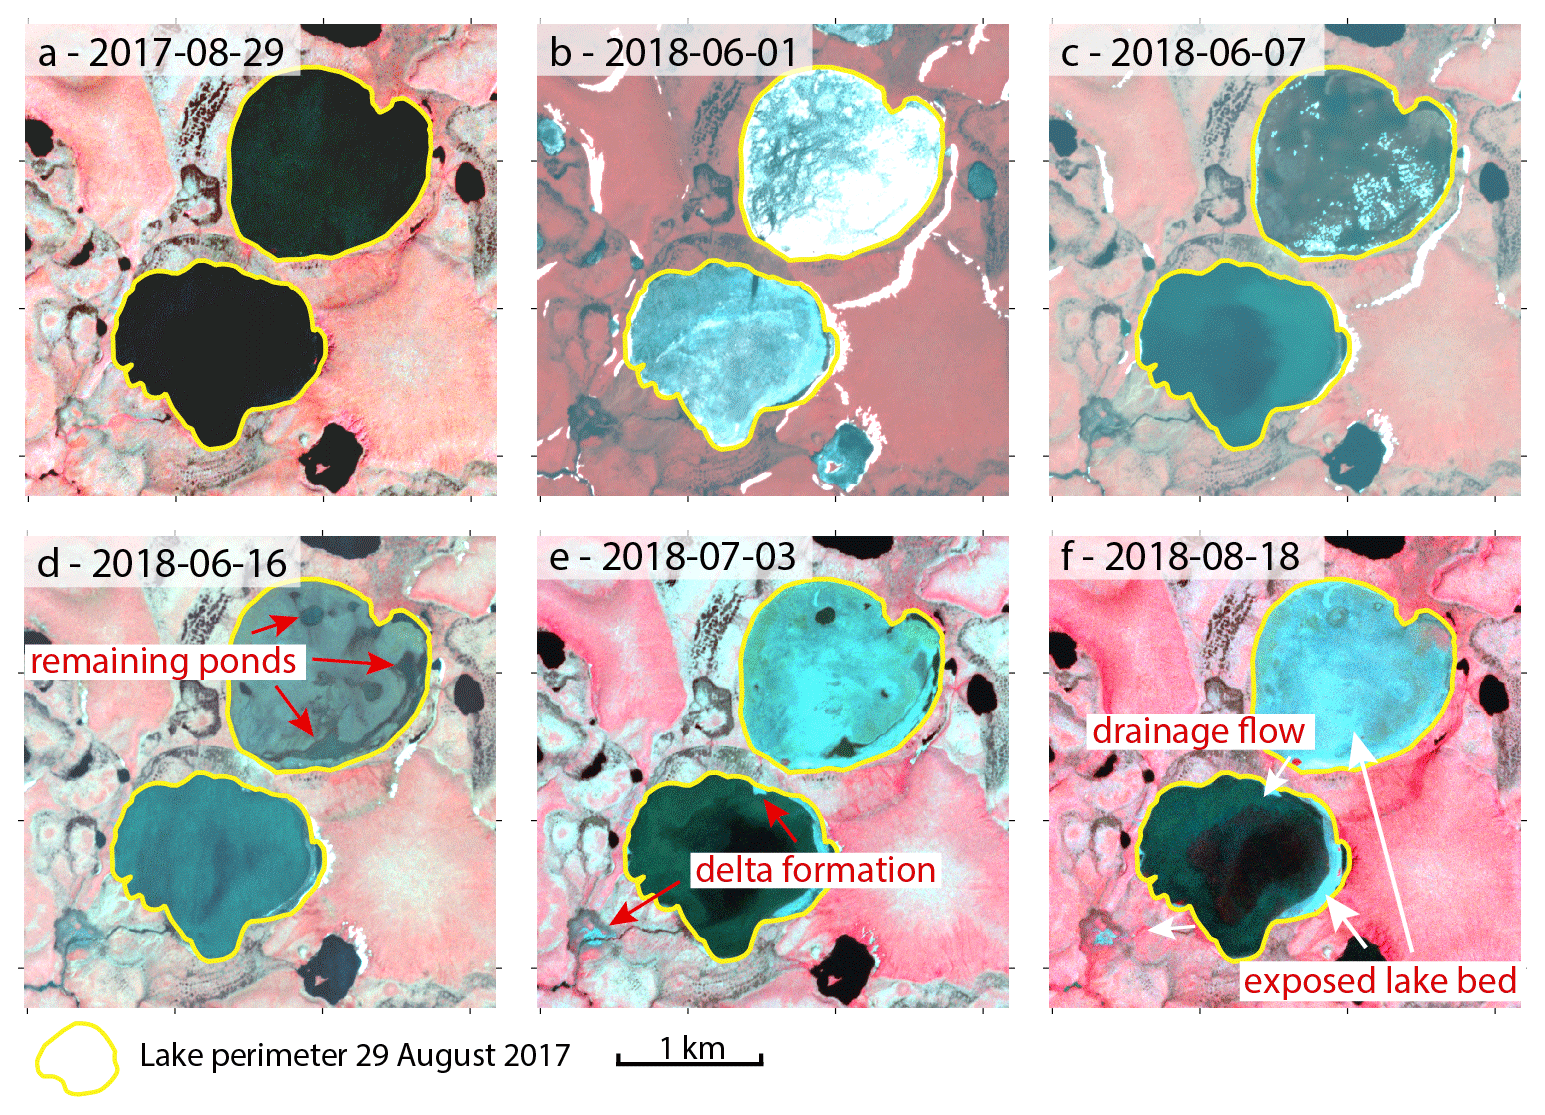
Figure 4PlanetScope (Planet Team, 2017) satellite time series of cascaded lake drainage of lakes 99492 (north) and 99522 (south) (66.45∘ N, 164.75∘ W) from 29 August 2017 until 18 August 2018 with annotations of drainage-related features. (a) Lakes before drainage. (b) Ice breakup with initial drainage pattern visible on the northern lake. (c) After ice breakup with reduced water level in the northern lake. (d) Northern lake nearly completely drained with few remaining ponds. (e) Partial drainage of the southern lake with visible delta formation. (f) Final stage of lake drainage with dried out ponds (northern lake) and lake level stabilization (southern lake).
Apart from the general regional dynamics, individual lake drainages followed variable patterns of drainage velocity and duration and timing. Drainage patterns included sudden complete lake area loss (e.g., Lake IDs 99230, 64656), multiple recurring drainage events (Lake IDs 72420, 100644, 99583), gradual loss (Lake IDs 99756, 100218) and initial loss followed by partial refilling (Lake IDs 99381, 99465, 99532) (see Supplement).
Supplementary figures are available at: https://github.com/initze/NW_Alaska_Drainage_Paper/tree/final/figures/lake_drainage/planet_lake_area (last access: 10 November 2020).
Quantification
The early season lake drainage affected the largest lakes and therefore the largest area. The time-series animation of the 10 largest lakes can be accessed by video (see Table 2). The third largest drained lake (Lake ID 99230), for example, started draining on 2 June and lost the majority of its water within the following 2 weeks. During the summer months, the remaining shallow ponds dried out further, while only a few apparently deeper ponds remained. Imagery from spring 2019 showed the development of vegetation, which follows the typical thermokarst lake cycle of this region (lake, lake drainage, drying of exposed lake bottom, vegetation emergence; Jones et al., 2012) (see Table 2 for video). The largest drained lakes follow a similar trajectory of rapid drainage around ice breakup and further drying of the drained lake basin during peak summer.
Spatial patterns
A total of 9 out of the 10 largest drained lakes are second generation thermokarst lakes which are typically located within a complex of previously drained lake basins. The second largest “lake” is actually a lagoon, which is likely influenced by sea water inundation. Each of the lakes had a significant fraction of their shoreline within the former drained lake basin. These are typically covered by wet tundra and underlain by terrestrial peat overlying lacustrine sediments (Jones et al., 2012). Based on visual image interpretation, all lakes drained through previously established drainage pathways, which are located in flat basin terrain and suggest that these likely are “weak spots” for full drainage.
During these drainage events, new channels formed or existing channels deepened. In several instances (Lake IDs 99368, 64656, 99492, 102499), new drainage channels are evident based on new sediment fans that formed downstream. In the case of several lakes, the drainage caused a chain reaction, in which hydrologically connected lakes, both up- and downstream of the initially drained lake, drained as well. Due to the widespread presence of these surface drainage indicators, talik penetration to a groundwater layer can be excluded for the study area.
4.2 Lake drainage 1999–2014
From 1999 through 2014, we observed 268 lakes larger than 1 ha that lost more than 25 % of their area, resulting in a total water area loss of 3245.74 ha during the observed period within this group of lakes. The net lake loss of the study region including all lakes was 3677.43 ha or 6.0 % of the overall lake area. The six largest drained lakes accounted for more than half of the lost lake area (50.6 %) and were each among the 33 largest lakes (size rank 9, 12, 13, 26, 29, 33) of the study area (Table 3). Each of these lakes was apparently of thermokarst origin.
These drained and partially drained lakes predominantly occur along the near coastal zone of the NSP and around Shishmaref Inlet (see Fig. 3). Within this region, lake drainages are distributed uniformly with no distinct clusters. The BP and southern Kotzebue Sound do not show major drainage activity in this period with only three lakes that fulfill the defined criteria. The vicinity of Imuruk Lake had four drained lakes.
Timing of drainage
The analysis of drained lakes revealed a period of widespread lake drainage with up to 21 confirmed events per year from 2002 until 2007 and 2009 (see Supplement Fig. S2). The number of detected drained lakes in 2005 was exceptionally high with 56, but the majority (n=33) did not have sufficient observations in the preceding years of 2004 or even 2003 to confirm the correct drainage year. This number of drained lakes is therefore associated with a high degree of uncertainty. Years 2003, 2007, 2009 and 2012 also have more than five lakes which have an uncertain drainage date.
Although the number of drained lakes is relatively stable over time, drained lake area spiked in 2006 and 2007 with 922 ha (uncertain: 6.35 ha) and 631 ha (uncertain: 15.57 ha) net lake area loss, respectively. The significant uptick in 2006 was driven by the drainage of very large lakes, particularly in the Cape Espenberg region of the NSP. The years 2003 and 2004 follow with lake area loss of 323.65 ha (uncertain: 41.58 ha) and 413.06 ha (uncertain: 3.91 ha), respectively. The numbers are conservative and might be even higher (see uncertainty 2005) due to low data coverage during this period.
4.3 Weather and climate
4.3.1 Weather observations
The preceding winter and spring of 2017/2018 (winter year 2018) was the warmest, wettest and second snowiest on record at this time. Compared to the entire weather record, this winter was highly exceptional (Fig. 5, Table 4). Mean daily air temperatures exceeded the climatological means persistently and frequently with 127 d above 1 standard deviation from the climatological mean, only interrupted by a short cold snap in January 2018 (Fig. 6). On several days, air temperatures were close to 0 ∘C, which is 15 to 20 ∘C above the climatological mean. Exceptional warmth lasted continuously from October 2017 until December 2019. Winter 2019 even largely surpassed 2018 in temperatures until the temperature measurement failure on 1 May 2019. The mean temperature was 1.11 ∘C higher than the previous winter year's period from 1 July through 30 April, which projects to a MAAT of −0.21 ∘C. The cumulative precipitation was lower with 279 mm. Cumulative snowfall was 155 cm.
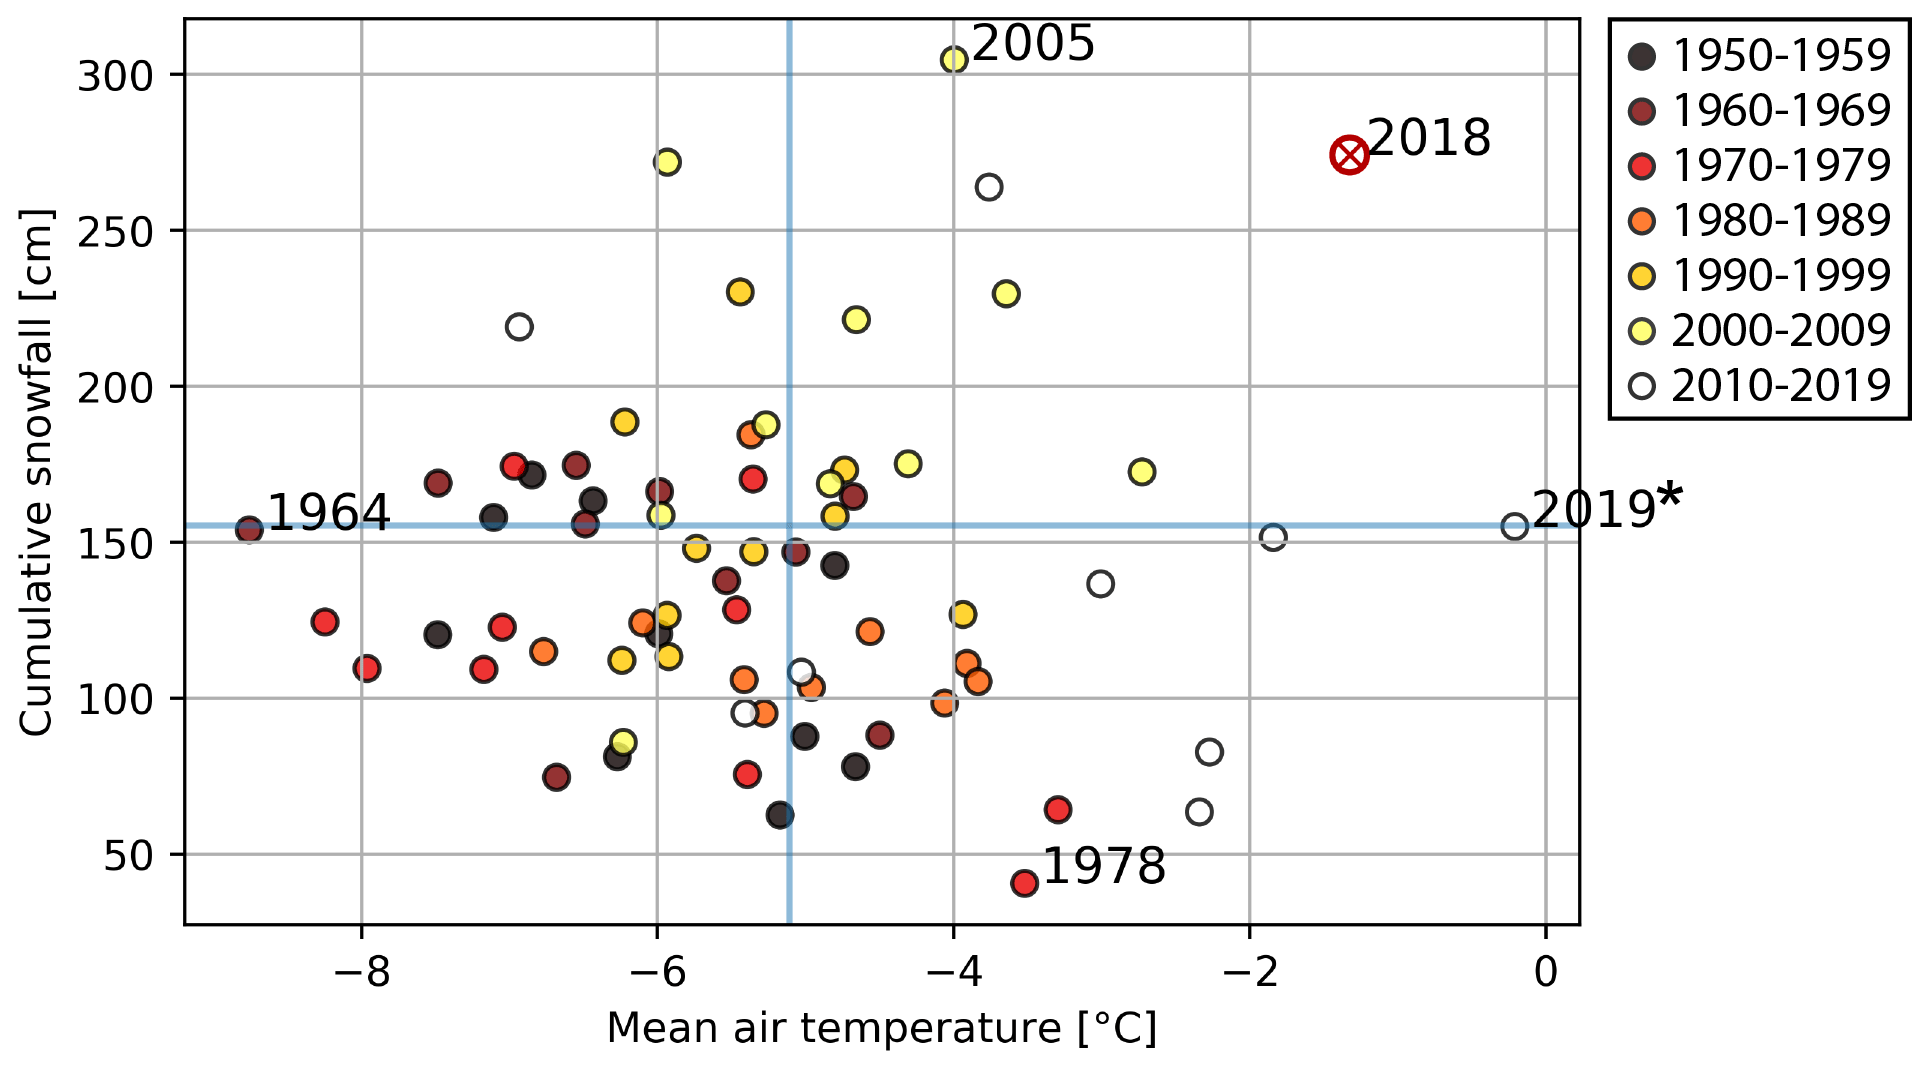
Figure 5Scatterplot of mean air temperature and cumulative snowfall per winter year (July to June) from 1950 through 2019. Winter year 2017/2018 is highlighted with a circled red cross. Extreme years are indicated by number. Blue lines indicate climatic means of MAAT and cumulative snowfall (1981–2010). Dot colors indicate the decade. * Mean air temperature of 2019 interpolated to entire winter year due to missing data from 1 May through 3 September 2019.
Table 4Annually aggregated observations of mean air temperature, cumulative precipitation, cumulative snowfall, cumulative freezing degree days and freezing days per winter year (1 July until 30 June) for climate station Kotzebue, sorted by mean air temperature. The 10 warmest and 5 coldest years are included. * Mean air temperatures for winter year 2019 are interpolated due to erroneous temperature measurements from 1 May through 3 September 2019. For full data (1950–2019), see Supplement Table S3.
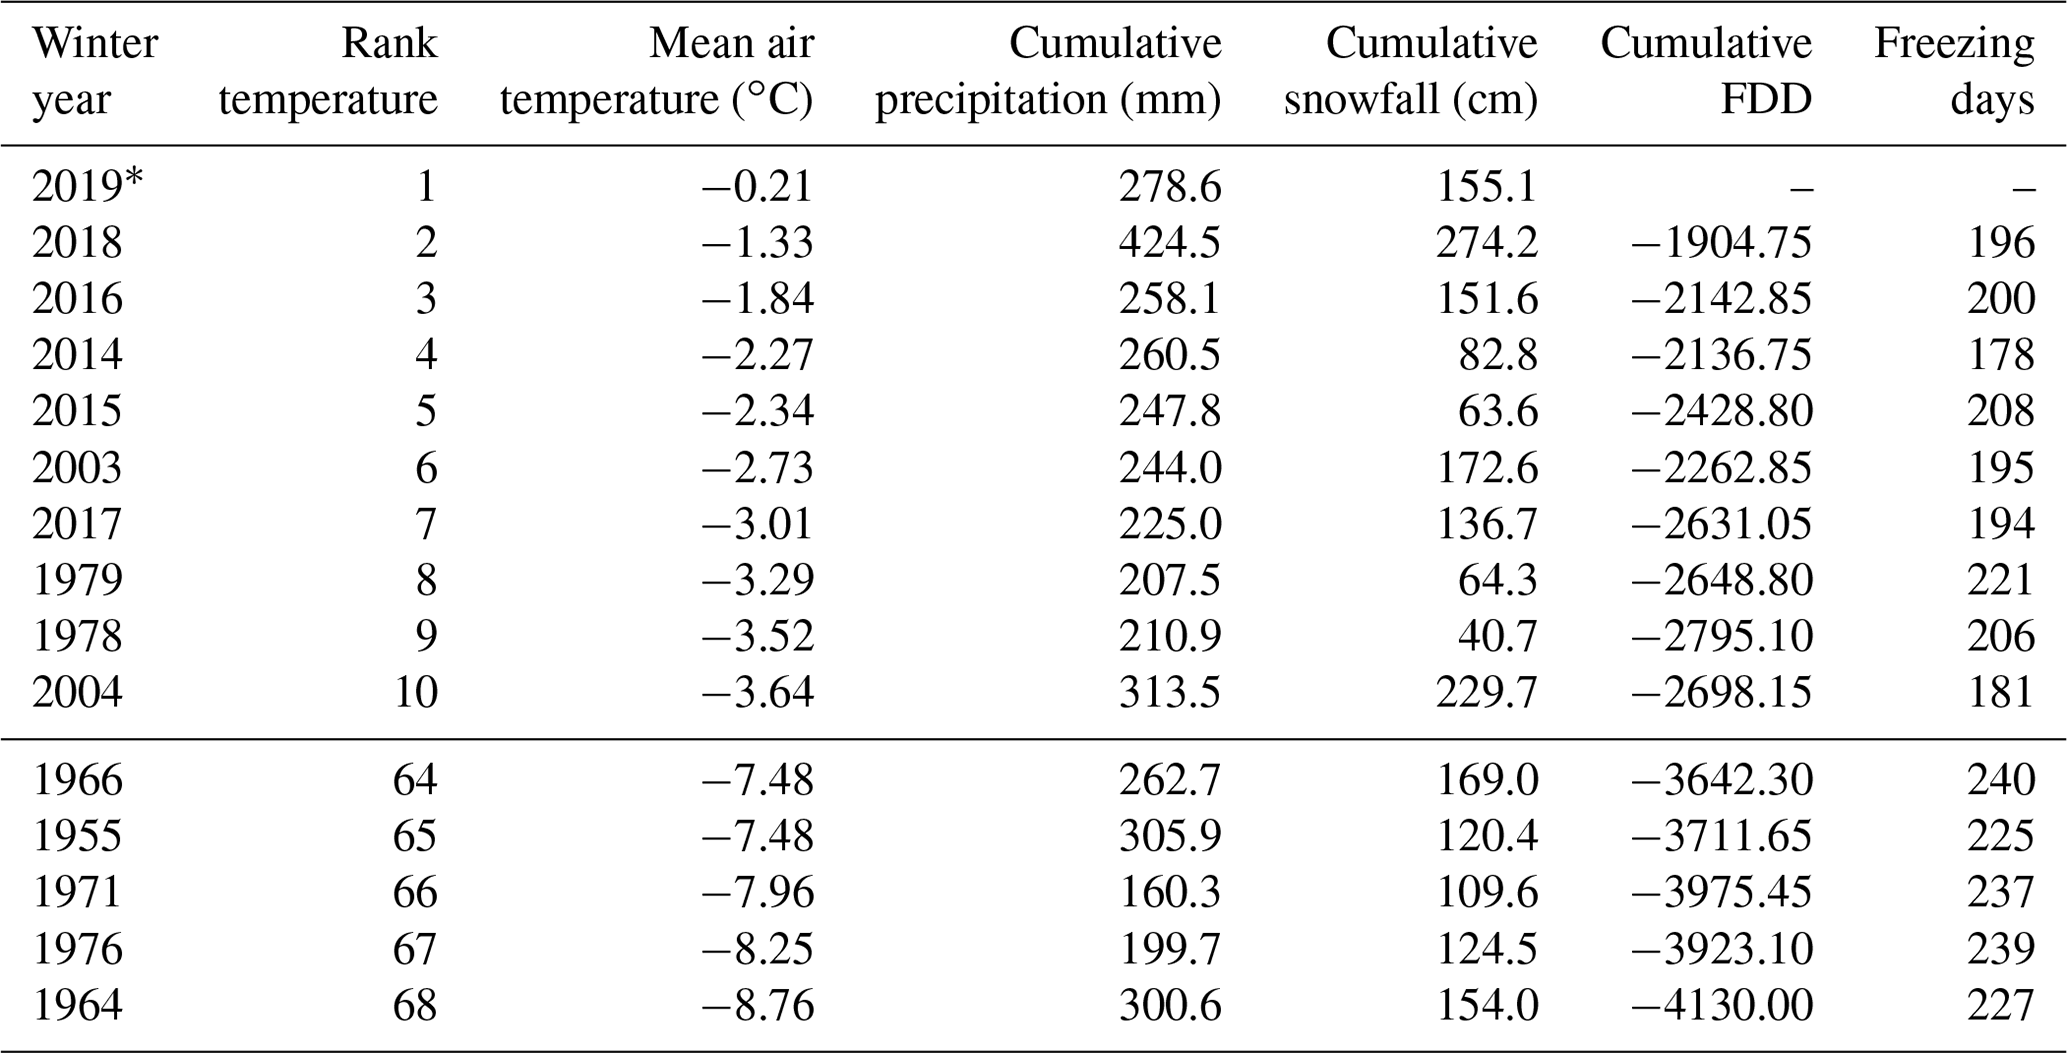
During winter year 2018, weather station Kotzebue recorded only 1905 cumulative freezing degree days (FDDs; the sum of average daily degrees below 0 ∘C) and an annual air temperature of −1.3 ∘C, which exceeded the previous record by 0.53 ∘C and 238 FDD. The 10 warmest and 5 coldest years are shown in Table 4. Accumulated snowfall was the second highest on record with 274 cm and was only exceeded in 2005 (305 cm). Overall precipitation of the winter year 2018 was the highest on record with 424.5 mm, exceeding the very wet but much colder winter years of 2013 (402 mm, −5.41 ∘C) and 1995 (393.7, −5.92 ∘C). Precipitation, mostly as snowfall, was particularly strong from October through February, with the exception of January.
All indicators highlight the exceptional conditions of winter 2017/2018 in western Alaska. Weather data from Nome (ca. 300 km south of Kotzebue) on the southern SP indicate a similar picture of extreme weather conditions with the second warmest and third-snowiest winter year on record. Climate reanalysis data (GHCNv4) confirm a larger regional pattern of exceptionally warm conditions across the Bering Strait (see Supplement Fig. S2).
4.3.2 Climate model projections
The UAF SNAP climate model ensemble consistently projects an increase in temperature and precipitation for western Alaska with a plateau after around 2070 for RCP4.5 and continuous increase for the remaining scenarios in the 21st century. They predict an increase to a regional MAAT of −0.39 ± 0.38 ∘C (RCP4.5), +0.44 ± 0.37 ∘C (RCP6.0) and +3.00 ± 0.38 ∘C (RCP8.5) during the 2090s, which marks an increase of 3.7 to 6.6 ∘C compared to the period from 2010 to 2019 (Supplement Fig. S3). MAP is projected to increase by around 12 % (RCP4.5), 20 % (RCP6.0) and 32 % (RCP8.5) on average.
4.4 Lake ice simulations
Modeled maximum lake ice thickness of the winter year 2018 was 1.14 (100 % snow) to 1.32 m (no snow). It was below average compared to 1981–2017 (1.31 m ± 0.14 m for 100 % snow; 1.68 m ± 0.12 m for no snow) but thicker than the absolute minimum of 0.99 m (100 % snow) in 2014. Lake ice thickness of 2018 was primarily determined by top ice growth (snow-ice formation), which is strongly dependent on snow mass on the ice surface. Snow-ice formation correlates well with high snowfall years such as 2005 or 2011. The bottom (congelation) ice growth of 2018 reached a new extreme low at only 0.32 m (100 % snow) to 1.32 m (no snow) (see Fig. 7). This compares to 0.87 m ± 0.23 m (100 % snow) and 1.68 m ± 0.12 m (no snow) from 1981 to 2017. Low bottom ice growth indicates strongly decreasing freezing activity (negative heat flux) in the lake and potentially in the ground of the surrounding terrain. The exceptional combination of high temperatures and high snowfall, as experienced in the 2017–2018 ice season, are the strongest factors for these patterns.
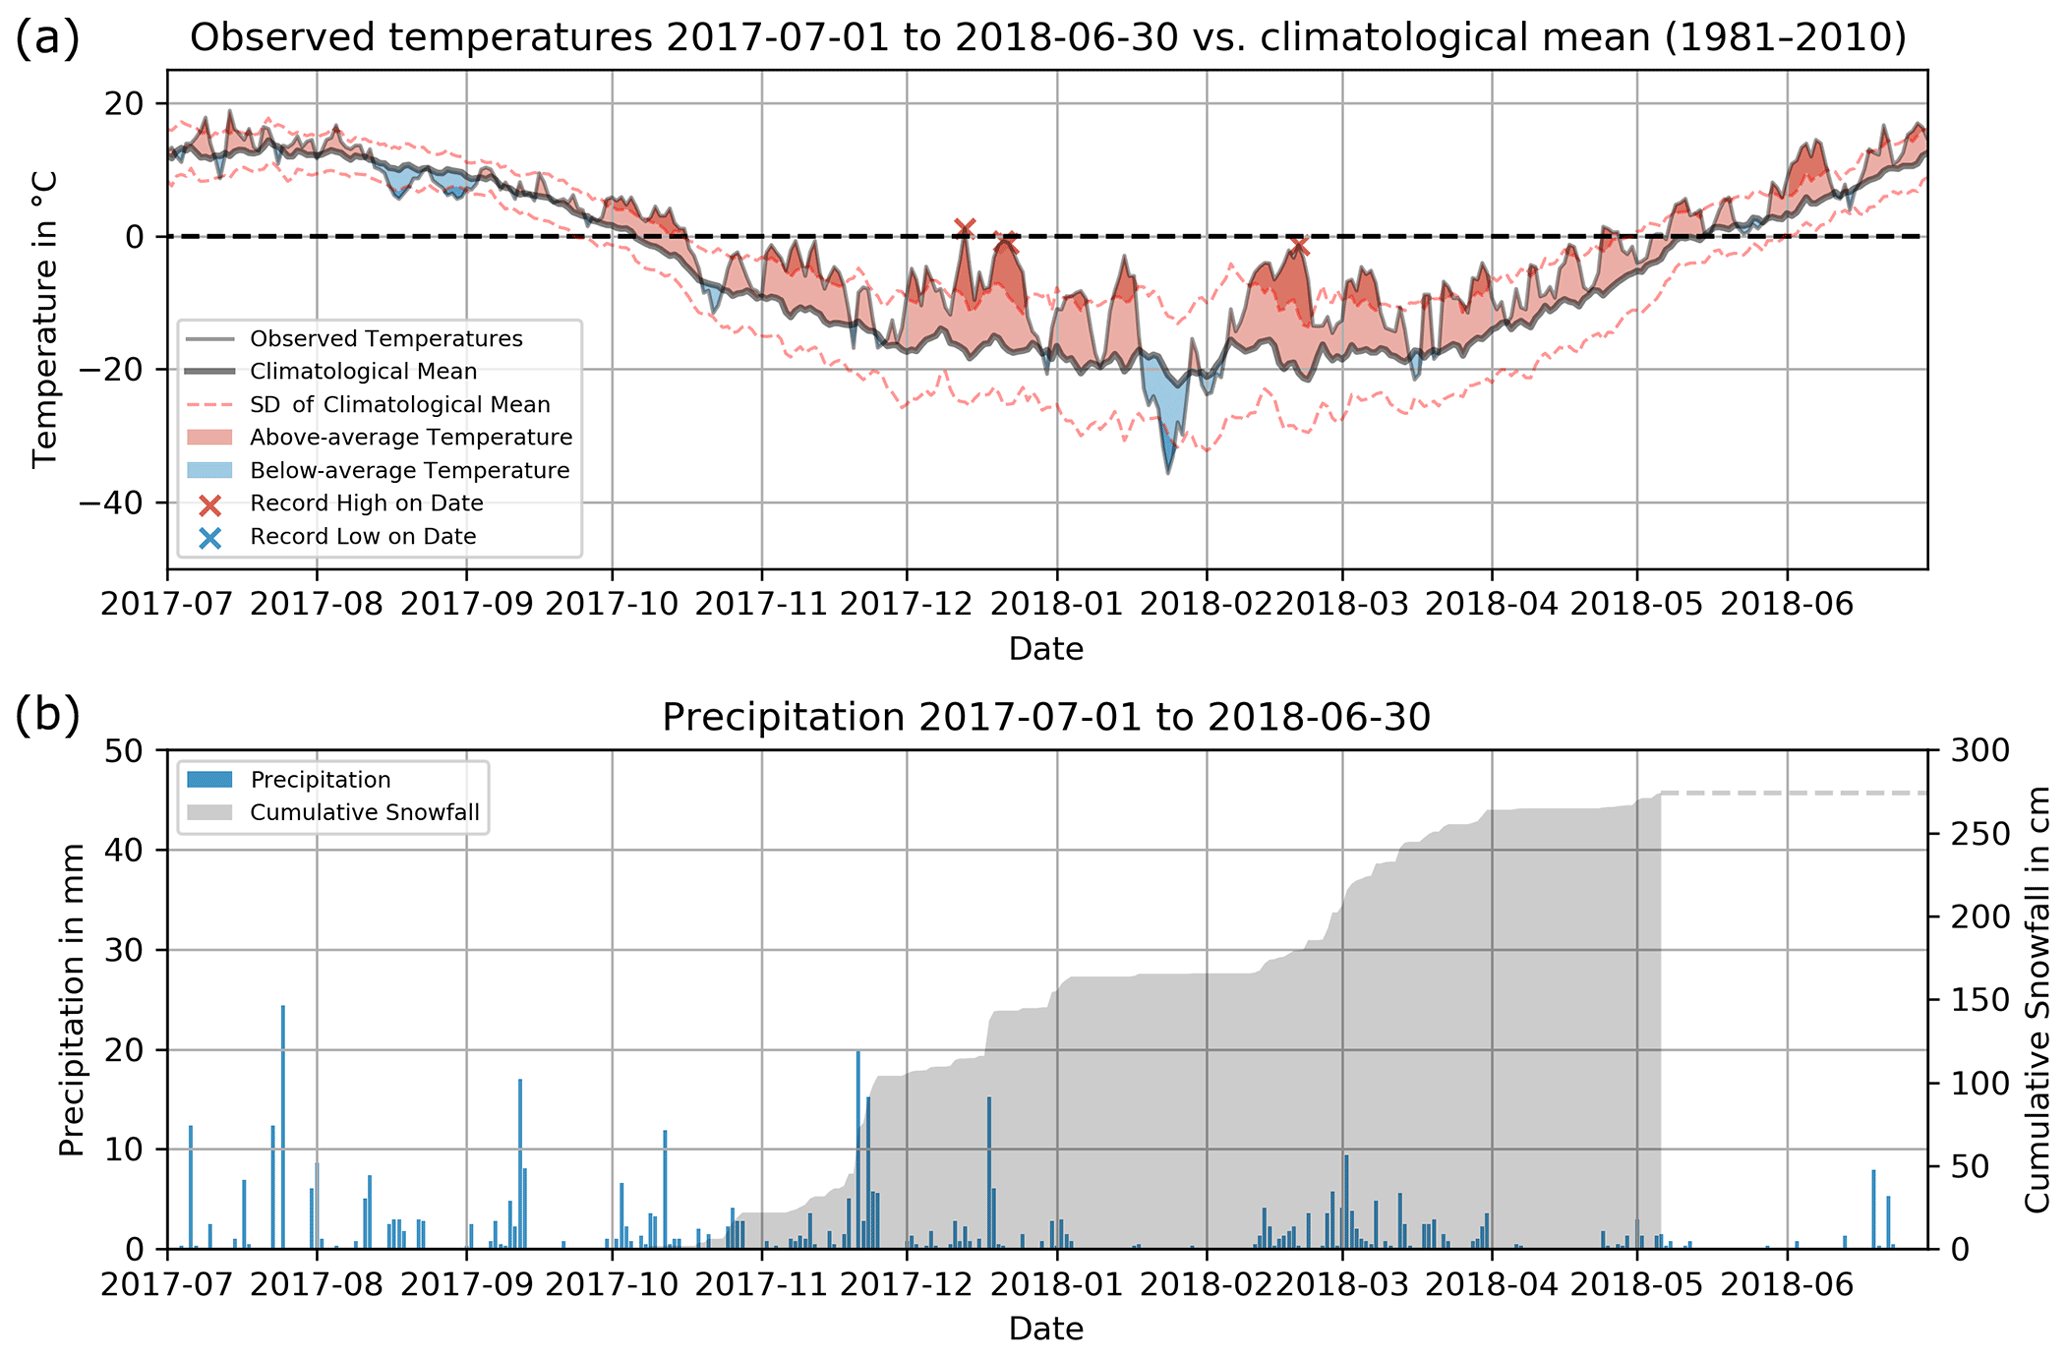
Figure 6Overview of winter weather conditions at Kotzebue climate station from 1 July 2017 through 30 June 2018. (a) Observed temperatures (in ∘C) with anomalies (red: warmer, blue: colder) from climatological means (1981–2010). Dark color shades indicate deviation of > 1 standard deviation from the mean. Record temperatures for particular days are marked with an “x”. (b) Daily precipitation and cumulative snowfall.

Figure 7Simulated cumulative top and bottom ice growth per winter year for 100 % snow scenario (in cm). Winter year 2017/2018 highlighted in red.
4.5 Random Forest feature importance analysis of annual weather variables
The feature importance analysis based on a Random Forest machine-learning regression and annual weather variables revealed that the number of freezing days are the strongest predictor of drained lake area. It yielded a feature importance (FI) of 29.7 %. Cumulative freezing degree days, annual winter year temperatures and cumulative precipitation have a similar impact with an FI of 21.8 %, 19.5 % and 18.8 %, respectively. Cumulative snowfall yielded an FI score of 10.3 %. The model performance on the training data was very good with an R2 of 0.85. However, the predictive power of the model on unseen data was poor with an R2 of −0.18. The model prediction of extreme drainage events (2006, 2018) was particularly poor with the independent validation.
5.1 Lake drainage in western Alaska in a historical context
The massive drainage of many lakes in early summer 2018 in western Alaska was an extreme event which dwarfs previous lake drainage events within this region since the availability of remote sensing data. Although the study area experienced widespread lake drainage during the mid-2000s (Jones et al., 2011, Nitze et al., 2018a; Swanson, 2019), the year 2018 exceeded average annual lake drainage rates of 1999–2014 by a factor of 7.5 in area and 10.9 in number of lakes, clearly indicating a response of the system to extreme weather conditions. Recent lake drainage in 2018 even doubled the previous record year of 2006 in drained area and 10-fold in the number of drained lakes. From 1950 until 2006/2007, lake drainage and lake expansion rates on the NSP were fairly stable. The strong influence of large lakes on drainage rates in 2018 confirmed previous findings (Jones et al., 2011). A recent study by Swanson (2019) identified the same exceptional event for the national parks of northwestern Alaska, which partially overlaps with our study area.
The high level of permafrost degradation, apparent from a large fraction of drained basins of several generations (Jones et al., 2012; Regmi et al., 2012), shows the general susceptibility of the landscape to rapid thermokarst lake dynamics, including drainage, within the study region. This landscape underwent intense thermokarst development over the past millennia, with the onset of thermokarst development during the early Holocene (Wetterich et al., 2012; Farquharson et al., 2016; Lenz et al., 2016).
Available data of historic lake drainage are sparse. Therefore, a comparison of recent drainage rates with long-term development is difficult due to a lack of consistent observations, in particular for the pre-remote-sensing period.
5.2 Local context
The BP stands out in particular with a strong increase in lake drainage events in 2018, including its largest lake, relative to the period from 1999 to 2014. However, as evidenced by newly forming and expanding ponds, which are widely dotting the landscape, active thermokarst lake expansion prevailed during the preceding decades but rarely triggered drainage events. A recent study by Jones et al. (2020b) found a significant expansion of beaver dam building activities on the Baldwin Peninsula during the period from 2019 to 2019. Beavers strongly influence local hydrological regimes by damming up thermo-erosional valleys, outlet streams and drained lake basins, which leads to water level increase, as well as pond and lake formation, and could potentially factor into lake drainage dynamics.
On the SP, lake drainage was concentrated on the coastal lowland region, particularly the Cape Espenberg lowlands, which have also been hot spots of lake drainage events during the past decades. The location of recently drained lakes follows patterns of strong Holocene thermokarst and lake drainage activity (Jones et al., 2012; Lenz et al., 2016) in the same area. The highly degraded surface morphology in this region indicates active and pervasive thermokarst processes.
5.3 Influencing factors
The exceptional weather conditions in western Alaska are likely the main cause of the significant lake drainage events of summer 2018. Abundant snowfall with the second highest cumulative snowfall on record created a thicker than usual insulation layer for the ground, which kept cold winter temperatures from penetrating the ground. This situation in combination with record high winter temperatures, often just below freezing, likely led to an unfavorable energy balance for the stability of near-surface permafrost that is already rather warm in the study region. Both snow cover and winter temperatures are known to be important factors for near-surface permafrost conditions (Stieglitz et al., 2003; Ling and Zhang, 2003; Osterkamp, 2007). The abundant early winter snowfall in October and November in our study area further increased the already strong snow insulation effect (Ling and Zhang, 2003). The severe combination of both negative influencing factors very likely restricted the refreezing of the active layer and thus potentially caused a landscape-wide talik development between the active layer and permafrost in 2018. A multiple regression analysis of annual weather conditions of the past decades revealed the relatively strong importance (negative correlation) of freezing days on the lake area drained. However, this approach was not able to accurately predict drained lake area using annual weather conditions alone. We conclude that the variability of individual lake area, surrounding landscape morphology and permafrost properties are additional important influence factors.
Thinning of lake ice during the ice growth season, also due to increased snow depth and warmer winter temperatures, has been identified as a responsible factor for the shift from bedfast ice to floating ice on shallow lakes in several regions and has been linked to the formation of new taliks underneath lakes that previously were underlain by permafrost on the Alaska North Slope (Surdu et al., 2014; Arp et al., 2016; Engram et al., 2018). The observed amounts of snowfall in our study region and our results from lake ice modeling clearly indicate that lake ice must have been much thinner in the 2017/2018 winter compared to previous years. Particularly the bottom growth of ice, which is driven by negative heat flux, was affected by warm temperatures and snow cover. A similar effect likely affected the terrestrial area. Thin ice, caused by warm temperatures and thick snow cover, enhances lake talik growth, and stronger lateral seepage following higher runoff by the melting of thicker than usual snow may have initiated many drainage events by thermo-erosion. In addition, a later freeze-up in the fall period leads to a longer exposure of the shore and near-shore lake bed to liquid water, which likely increases permafrost destabilization and talik growth along shores. Initial research from the Fairbanks region in interior Alaska, which had a similar pattern of mild and snow-rich winter weather conditions, suggests that at various sites the active layer did not refreeze completely during winter 2017/2018 (Farquharson et al., 2019b). This type of landscape-wide talik formation would alter hydrological dynamics in lake-rich permafrost lowlands substantially. Another, so far rarely considered factor for lake dynamics in permafrost regions could be a change in biological agents. The recent movement of beavers from the treeline to tundra regions in northwestern Alaska may also be contributing to lake dynamics in the eastern and southern portions of the study region, which requires further attention (Tape et al., 2018; Jones et al., 2020b).
5.4 Temporal sequence and causes
The occurrence of lake drainage around (during or shortly after) ice breakup indicates drainage driven by bank overtopping or breaching in combination with rapid thermo-erosion during outflow. High water levels due to high precipitation in fall and winter, the rapid melting of abundant snow, in combination with destabilized lake margins, and possible talik formation have very likely led to bank overflow or breaching of lake shores and subsequent thermo-erosion and deepening of outflow channels. The location of lakes within older drained lake basins enhanced the susceptibility of lakes to erosion and drainage in addition to the weather-induced driver. These basins are characterized by comparably unstable peaty and fine-grained substrates with high intra-sedimentary ground ice contents and well-developed ice wedge networks.
Under current weather/climatic conditions with a MAAT around 0.5 ∘C above normal (1981–2010), permafrost aggradation in the freshly exposed lake beds might be slowed or even prevented with consequences for basin hydrology and biogeochemical cycling. After lake drainage, the lake bed typically refreezes, and permafrost soils can redevelop, which locks in carbon stored in lacustrine sediments and terrestrial peat (Walter Anthony et al., 2014). In situ measurements and continued observations are necessary to test this hypothesis and determine whether this is happening now already on the SP and BP.
5.5 Spatial comparison and considerations
Western Alaska has been previously identified as one of the regions with the most intensive lake dynamics on a decadal scale (Nitze et al., 2017, 2018a; Jones et al., 2011; Swanson, 2019; Jones et al., 2020b). Other regions along the boundary of continuous permafrost in interior Alaska (Chen et al., 2014; Roach et al., 2013; Cooley et al., 2019) or the southern Yamal Peninsula or western Siberia (Nitze et al., 2018a; Smith et al., 2005) are also highly affected by strong lake dynamics, most notably lake drainage. Lake drainage is a common process in the continuous permafrost of colder climates such as the Arctic coastal plain of Alaska (Hinkel et al., 2007; Nitze et al., 2017; Jones et al., 2020a), Tuktoyaktuk Peninsula (Plug et al., 2008; Olthof et al., 2015), Old Crow Flats (Labrecque et al., 2009; Lantz and Turner, 2015) and the Kolyma lowlands (Nitze et al., 2017). However, lake dynamics tend to be of higher magnitude in warmer permafrost regions (Nitze et al., 2018a). In this context, the drainage event of summer 2018 in our study region in western Alaska exceeded the average extent of lake area loss by a factor of 7.5 and the previously most extreme year by 2.
5.6 Data quality discussion
The application of different methods and sensors, different temporal scales, and varying spatial resolutions (long-term Landsat datasets vs. Sentinel-1 water masks vs. Planet multi-temporal water masks) may introduce minor differences in masking water and the delineation of water bodies. In a long-tailed distribution as observed here, the widely used threshold of > 25 % lake area loss strongly influences the number of drained lakes. For example, a threshold of > 20 % lake area loss leads to an increase from 192 to 279 drained lakes. However, the influence of total lake area loss remains low.
Due to the presence of lake ice, the automated intra-annual lake tracking algorithm did not detect the early drainage events reliably; however, the integration of multiannual data into one analysis will highly benefit the automated lake tracking. With the exponential growth of available data due to new satellite constellations (Sentinel-1, Sentinel-2, Planet), processing platforms and techniques, more reliable, better comparable and spatially more extensive lake extent datasets will likely become available in the near future.
5.7 Outlook
The extreme weather conditions of the winter year 2018 in western Alaska were driven by massively reduced sea ice cover in the Bering and Chukchi seas resulting in much warmer and moister weather conditions than usual, which may have caused an unprecedented spatial and temporal clustering of lake drainage events in our study region. As climate models all predict a significant increase in both mean annual air temperature and precipitation for northern and western Alaska, the dramatic lake dynamics described here provide an early glimpse of the potentially massive changes in hydrology, permafrost and topography to be expected in a warmer Arctic in similarly ice-rich permafrost landscapes. With MAAT around 0 ∘C, the years 2017 to 2019 already matched the MAAT projected for this region in ∼ 2060 (RCP8.5) to beyond 2100 (RCP4.5) and precipitation projections for ∼ 2080 (RCP8.5). This mismatch indicates that local to regional permafrost landscapes may experience much more severe and earlier impacts in a warming Arctic than what climate models are capable of predicting at fine scales. Permafrost degradation in northern Canada shows that drastic changes in the Arctic climate system can lead to processes which were projected to happen several decades later (Farquharson et al., 2019a).
The recent events potentially show the fate of lake-rich landscapes in continuous permafrost along its current southern margins, where near-surface permafrost degradation is accelerating and permafrost will become discontinuous in the next decades. The colder, less dynamic lake-rich coastal plain of northern Alaska may become more dynamic. Current climate zones will move further northwards over the course of the 21st century. Temperatures are predicted to rapidly approach 0 ∘C at the beginning of the next century (MAAT 2090–2099; −2.6 ∘C) on the southern Arctic Coastal Plain in a RCP8.5 climate scenario.
The lake-rich northern Seward and Baldwin peninsulas in northwestern Alaska were affected by unprecedented lake drainage in 2018 which dwarfed previous lake changes in this historically dynamic permafrost landscape. As mean annual air temperatures reached values close to 0 ∘C in combination with exceptional precipitation in recent years, near-surface permafrost is likely already in a phase of degradation and destabilization around the lake margins. These weather conditions matched average model projections for the years 2060 (RCP8.5) to 2100 (RCP4.5), suggesting that on these local to regional scales, our climate forecast capabilities are not sufficient to project the full consequences of warming scenarios. These extreme weather conditions in combination with the rapid availability of excess surface water likely caused the rapid drainage of nearly 200 lakes during or shortly after ice breakup in 2018. The drainage events included some of the largest lakes of the region that have likely persisted for several millennia. Under a rapidly warming and wetting climate in conjunction with ongoing sea ice loss in the Bering Strait, we expect a further intensification of permafrost degradation, a reshaping of the landscape, a transition from continuous to discontinuous permafrost and significant changes in hydrology and ecology. The impact on habitat and landscape characteristics will be drastic in these formerly lake-rich regions. The recent processes observed in northwestern Alaska will potentially be a precedent for lake dynamics of rapidly warming lake-rich permafrost landscapes approaching the MAAT threshold of 0 ∘C.
Data
-
Supplementary data publication on PANGAEA at: https://doi.org/10.1594/PANGAEA.922808 (Nitze et al., 2020a).
-
Supplementary datasets on github at:
https://github.com/initze/NW_Alaska_Drainage_Paper (Nitze et al., 2020b)
-
Lake datasets:
https://github.com/initze/NW_Alaska_Drainage_Paper/tree/final/lake_datasets (last access: 10 November 2020)
-
Intra-annual lake area plots:
https://github.com/initze/NW_Alaska_Drainage_Paper/tree/final/figures/lake_drainage/planet_lake_area (last access: 10 November 2020)
-
Weather and climate plots at:
https://github.com/initze/NW_Alaska_Drainage_Paper/tree/final/figures/weather_and_climate (last access: 10 November 2020)
-
Lake drainage animations at:
https://github.com/initze/NW_Alaska_Drainage_Paper/tree/final/animations/lake_animations_drainage_1999-2014 (last access: 10 November 2020)
Code
-
Sentinel-1 Watermasks Google Earth Engine script at:
https://code.earthengine.google.com/7d2367758eead1614202efcfa6bed2b5 (Nitze, 2020a)
-
Landsat Video Animation Google Earth Engine script at:
https://code.earthengine.google.com/c879add607322305b8293904bea6d781 (Nitze, 2020b)
-
noaaplotter weather plotting package at: https://github.com/initze/noaaplotter (Nitze, 2020c)
Lake drainage animations can be accessed at: https://github.com/initze/NW_Alaska_Drainage_Paper/tree/final/animations/lake_animations_drainage_1999-2014 (last access: 10 November 2020, Nitze et al., 2020b).
Supplementary figure and table data can be found in the Supplement. The supplement related to this article is available online at: https://doi.org/10.5194/tc-14-4279-2020-supplement.
IN designed the study, processed the Landsat long-term lake change datasets and Sentinel-1 short-term lake change datasets, performed the overall data analysis, and led the writing and editing of the paper. SWC processed the short-term PlanetScope lake change datasets. CRD processed lake ice modeling datasets. GG and BMJ provided important background knowledge and were involved in the study design. All authors contributed to writing and editing the paper.
The authors declare that they have no conflict of interest.
We acknowledge help during field work by Josefine Lenz, Matthias Fuchs, and Jens Strauss. We thank the pilots Jim Webster (in memoriam) and Jim Kincaid for safe transportation and enabling and actively supporting field work. We thank all developers and supporters of the open-source tools and software packages used.
This research has been supported by the European Research Council (grant no. 338335), the European Space Agency (grant GlobPermafrost and grant CCI+ Permafrost), the Helmholtz Association (grant AI-CORE), the National Science Foundation's Office of Polar Programs (grant no. 1806213), the National Science Foundation (graduate research fellowship), and the Natural Sciences and Engineering Research Council of Canada (grant no. RGPIN-05049-2017).
The article processing charges for this open-access
publication were covered by a Research
Centre of the Helmholtz Association.
This paper was edited by Ketil Isaksen and reviewed by David K. Swanson and one anonymous referee.
Alexeev, V. A., Arp, C. D., Jones, B. M., and Cai, L.: Arctic sea ice decline contributes to thinning lake ice trend in northern Alaska, Environ. Res. Lett., 11, 074022, https://doi.org/10.1088/1748-9326/11/7/074022, 2016.
Antonova, S., Duguay, C., Kääb, A., Heim, B., Langer, M., Westermann, S., and Boike, J.: Monitoring Bedfast Ice and Ice Phenology in Lakes of the Lena River Delta Using TerraSAR-X Backscatter and Coherence Time Series, Remote Sens., 8, 903, https://doi.org/10.3390/rs8110903, 2016.
Arp, C. D. and Jones, B. M.: Geography of Alaska Lake Districts: Identification, description, and analysis of lake-rich regions of a diverse and dynamic state, U.S. Geological Survey Scientific Investigations Report 2008-5215, 40 pp., 2009.
Arp, C. D., Jones, B. M., Grosse, G., Bondurant, A. C., Romanovsky, V. E., Hinkel, K. M., and Parsekian, A. D.: Threshold sensitivity of shallow Arctic lakes and sublake permafrost to changing winter climate, Geophys. Res. Lett., 43, 6358–6365, https://doi.org/10.1002/2016gl068506, 2016.
Arp, C. D., Jones, B. M., Engram, M., Alexeev, V. A., Cai, L., Parsekian, A., Hinkel, K., Bondurant, A. C., and Creighton, A.: Contrasting lake ice responses to winter climate indicate future variability and trends on the Alaskan Arctic Coastal Plain. Environ. Res. Lett., 13, 125001, https://doi.org/10.1088/1748-9326/aae994, 2018.
Arp, C. D., Whitman, M. S., Jones, B. M., Nigro, D. A., Alexeev, V. A., Gädeke, A., Fritz, S., Daanen, R., Liljedahl, A. K., Adams, F. J., Gaglioti, B. V., Grosse, G., Heim, K. C., Beaver, J. R., Cai, L., Engram, M., and Uher-Koch, H. R.: Ice roads through lake-rich Arctic watersheds: Integrating climate uncertainty and freshwater habitat responses into adaptive management, Arct. Antarct. Alp. Res., 51, 9–23, https://doi.org/10.1080/15230430.2018.1560839, 2019.
Begét, J. E., Hopkins, D. M., and Charron, S. D.: The Largest Known Maars on Earth, Seward Peninsula, Northwest Alaska, Arctic, 49(1), https://doi.org/10.14430/arctic1184, 1996.
Belgiu, M. and Drăguţ, L.: Random forest in remote sensing: A review of applications and future directions, ISPRS J. Photogramm., 114, 24–31, 2016.
Bhatt, U. S., Walker, D. A., Walsh, J. E., Carmack, E. C., Frey, K. E., Meier, W. N., Moore, S. E., Parmentier, F.-J. W., Post, E., Romanovsky, V. E., and Simpson, W. R.: Implications of Arctic Sea Ice Decline for the Earth System, Annu. Rev. Env. Resour., 39, 57–89, 2014.
Biskaborn, B. K., Lanckman, J.-P., Lantuit, H., Elger, K., Streletskiy, D. A., Cable, W. L., and Romanovsky, V. E.: The new database of the Global Terrestrial Network for Permafrost (GTN-P), Earth Syst. Sci. Data, 7, 245–259, https://doi.org/10.5194/essd-7-245-2015, 2015.
Biskaborn, B. K., Smith, S. L., Noetzli, J., Matthes, H., Vieira, G., Streletskiy, D. A., Schoeneich, P., Romanovsky, V. E., Lewkowicz, A. G., Abramov, A., Allard, M., Boike, J., Cable, W. L., Christiansen, H. H., Delaloye, R., Diekmann, B., Drozdov, D., Etzelmüller, B., Grosse, G., Guglielmin, M., Ingeman-Nielsen, T., Isaksen, K., Ishikawa, M., Johansson, M., Johannsson, H., Joo, A., Kaverin, D., Kholodov, A., Konstantinov, P., Kröger, T., Lambiel, C., Lanckman, J.-P., Luo, D., Malkova, G., Meiklejohn, I., Moskalenko, N., Oliva, M., Phillips, M., Ramos, M., Sannel, A. B. K., Sergeev, D., Seybold, C., Skryabin, P., Vasiliev, A., Wu, Q., Yoshikawa, K., Zheleznyak, M., and Lantuit, H.: Permafrost is warming at a global scale, Nat. Commun., 10, 264, https://doi.org/10.1038/s41467-018-08240-4, 2019.
Breiman, L.: Random forests, Mach. Learn., 45, 5–32, 2001.
Brown, J., Ferrians Jr., O. J., Heginbottom, J. A., and Melnikov, E. S.: Circum-Arctic Map of Permafrost and Ground-Ice Conditions, National Snow and Ice Data Center/World Data Center for Glaciology, Boulder, CO, 1997.
Brown, L. C. and Duguay, C. R.: The fate of lake ice in the North American Arctic, The Cryosphere, 5, 869–892, https://doi.org/10.5194/tc-5-869-2011, 2011.
Chambers, M., White, D., Busey, R., Hinzman, L., Alessa, L., and Kliskey, A.: Potential impacts of a changing Arctic on community water sources on the Seward Peninsula, Alaska, J. Geophys. Res. 112, G04S52, https://doi.org/10.1029/2006JG000351, 2007.
Chen, M., Rowland, J. C., Wilson, C. J., Altmann, G. L., and Brumby, S. P.: Temporal and spatial pattern of thermokarst lake area changes at Yukon Flats, Alaska, Hydrol. Process., 28, 837–852, 2014.
Cooley, S., Smith, L., Stepan, L., and Mascaro, J.: Tracking dynamic northern surface water changes with high-frequency planet CubeSat imagery, Remote Sens., 9, 1306, https://doi.org/10.3390/rs9121306, 2017.
Cooley, S. W., Smith, L. C., Ryan, J. C., Pitcher, L. H., and Pavelsky, T. M.: Arctic-Boreal lake dynamics revealed using CubeSat imagery, Geophys. Res. Lett. 46, 2111–2120, 2019.
Duguay, C. R., Flato, G. M., Jeffries, M. O., Ménard, P., Morris, K., and Rouse, W. R.: Ice-cover variability on shallow lakes at high latitudes: model simulations and observations, Hydrol. Process., 17, 3465–3483, 2003.
Elberling, B., Michelsen, A., Schädel, C., Schuur, E. A. G., Christiansen, H. H., Berg, L., Tamstorf, M. P., and Sigsgaard, C.: Long-term CO2 production following permafrost thaw, Nat. Clim. Change, 3, 890–894, 2013.
Engram, M., Arp, C. D., Jones, B. M., Ajadi, O. A., and Meyer, F. J.: Analyzing floating and bedfast lake ice regimes across Arctic Alaska using 25 years of space-borne SAR imagery, Remote Sens. Environ., 209, 660–676, 2018.
Farquharson, L. M., Walter Anthony, K. M., Bigelow, N. H., Edwards, M. E., and Grosse, G.: Facies analysis of yedoma thermokarst lakes on the northern Seward Peninsula, Alaska, Sediment. Geol., 340, 25–37, https://doi.org/10.1016/j.sedgeo.2016.01.002, 2016.
Farquharson, L. M., Romanovsky, V. E., Cable, W. L., Walker, D. A., Kokelj, S., and Nicolsky, D.: Climate change drives widespread and rapid thermokarst development in very cold permafrost in the Canadian High Arctic, Geophys. Res. Lett., 46, 6681–6689, https://doi.org/10.1029/2019GL082187, 2019a.
Farquharson, L. M., Romanovsky, V. E., Kholodov, A. L., Nicolsky, D., Cable, W., Walker, D. A., and Kokelj, S. V.: Long-term monitoring of permafrost degradation documents two forms of landscape response, in: Proceedings of AGU Fall meeting, San Francisco, USA, 9–13 December 2019, abstract #C22C-03, 2019b.
Gorelick, N., Hancher, M., Dixon, M., Ilyushchenko, S., Thau, D., and Moore, R.: Google Earth Engine: Planetary-scale geospatial analysis for everyone, Remote Sens. Environ., 202, 18–27, 2017.
Grosse, G., Jones, B. M., and Arp, C. D.: Thermokarst lakes, drainage, and drained basins, chap. Treatise on Geomorphology, 8, 325–353, https://doi.org/10.1016/B978-0-12-374739-6.00216-5, 2013.
GTN-P Ground Temperature Database: available at: http://gtnpdatabase.org/boreholes, last access: 30 September 2019.
Hinkel, K. M., Jones, B. M., Eisner, W. R., Cuomo, C. J., Beck, R. A., and Frohn, R.: Methods to assess natural and anthropogenic thaw lake drainage on the western Arctic coastal plain of northern Alaska, J. Geophys. Res.-Earth, 112, F02S16, https://doi.org/10.1029/2006JF000584, 2007.
Hjort, J., Karjalainen, O., Aalto, J., Westermann, S., Romanovsky, V. E., Nelson, F. E., Etzelmüller, B., and Luoto, M.: Degrading permafrost puts Arctic infrastructure at risk by mid-century, Nat. Commun., 9, 5147, https://doi.org/10.1038/s41467-018-07557-4, 2018.
Hopkins, D. M.: Permafrost and ground water in Alaska, US Government Printing Office, 1955.
Huston, M. M., Brigham-Grette, J., and Hopkins, D. M.: Paleogeographic significance of middle Pleistocene glaciomarine deposits on Baldwin Peninsula, northwest Alaska, Ann. Glaciol., 14, 111–114, 1990.
Jones, B. M. and Arp, C. D.: Observing a catastrophic thermokarst lake drainage in northern Alaska, Permafrost Periglac., 26, 119–128, 2015.
Jones, B. M., Grosse, G., Arp, C. D., Jones, M. C., Walter Anthony, K., and Romanovsky, V. E.: Modern thermokarst lake dynamics in the continuous permafrost zone, northern Seward Peninsula, Alaska, J. Geophys. Res.-Biogeo., 116, G00M03, https://doi.org/10.1029/2011JG001666, 2011.
Jones, B. M., Arp, C. D., Grosse, G., Nitze, I., Lara, M. J., Whitman, M. S., Farquharson, L. M., Kanevskiy, M., Parsekian, A. D., Breen, A. L., Ohara, N., Rangel, R. C., and Hinkel, K. M.: Identifying historic and future potential lake drainage events on the western Arctic Coastal Plain of northern Alaska. Permafrost Periglac., 31, 110–127, https://doi.org/10.1002/ppp.2038, 2020a.
Jones, B. M., Tape, K. D., Clark, J. A., Nitze, I., Grosse, G., and Disbrow, J.: Increase in beaver dams controls surface water and thermokarst dynamics in an Arctic tundra region, Baldwin Peninsula, northwestern Alaska, Environ. Res. Lett., 15, 075005, https://doi.org/10.1088/1748-9326/ab80f1, 2020b.
Jones, M. C., Grosse, G., Jones, B. M., and Walter Anthony, K.: Peat accumulation in drained thermokarst lake basins in continuous, ice-rich permafrost, northern Seward Peninsula, Alaska, J. Geophys. Res.-Biogeo., 117, G00M07, https://doi.org/10.1029/2011JG001766, 2012.
Jongejans, L. L., Strauss, J., Lenz, J., Peterse, F., Mangelsdorf, K., Fuchs, M., and Grosse, G.: Organic matter characteristics in yedoma and thermokarst deposits on Baldwin Peninsula, west Alaska, Biogeosciences, 15, 6033–6048, https://doi.org/10.5194/bg-15-6033-2018, 2018.
Jorgenson, M. T., Yoshikawa, K., Kanevskiy, M., Shur, Y., Romanovsky, V., Marchenko, S., Grosse, G., Brown, J., and Jones, B.: Permafrost characteristics of Alaska, in: Proceedings of the Ninth International Conference on Permafrost, University of Alaska, Fairbanks, 29, 121–122, 2008.
Karlsson, J. M., Lyon, S. W., and Destouni, G.: Thermokarst lake, hydrological flow and water balance indicators of permafrost change in Western Siberia, J. Hydrol., 464–465, 459–466, 2012.
Karlsson, J. M., Lyon, S. W., and Destouni, G.: Temporal behavior of lake size-distribution in a thawing permafrost landscape in northwestern Siberia. Remote Sens., 6, 621–636, 2014.
Kennedy, R., Yang, Z., Gorelick, N., Braaten, J., Cavalcante, L., Cohen, W., and Healey, S.: Implementation of the LandTrendr Algorithm on Google Earth Engine, Remote Sens., 10, 691, https://doi.org/10.3390/rs10050691, 2018.
Kennedy, R. E., Yang, Z., and Cohen, W. B.: Detecting trends in forest disturbance and recovery using yearly Landsat time series: 1. LandTrendr – Temporal segmentation algorithms, Remote Sens. Environ., 114, 2897–2910, 2010.
Kessler, M. A., Plug, L., and Walter Anthony, K.: Simulating the decadal to millennial scale dynamics of morphology and sequestered carbon mobilization of two thermokarst lakes in NW Alaska, J. Geophys. Res., 117, G00M06, https://doi.org/10.1029/2011JG001796, 2012.
Kheyrollah Pour, H., Duguay, C. R., Martynov, A., and Brown, L. C.: Simulation of surface temperature and ice cover of large northern lakes with 1-D models: a comparison with MODIS satellite data and in situ measurements, Tellus A, 64, 17614, https://doi.org/10.3402/tellusa.v64i0.17614, 2012.
Kravtsova, V. I. and Bystrova, A. G.: Changes in thermokarst lake size in different regions of Russia for the last 30 years, Kriosfera Zemli, 13, 16–26, 2009.
Labrecque, S., Lacelle, D., Duguay, C. R., Lauriol, B., and Hawkings, J.: Contemporary (1951–2001) evolution of lakes in the Old Crow Basin, northern Yukon, Canada: remote sensing, numerical modeling, and stable isotope analysis, Arctic, 62, 225–238, 2009.
Lantz, T. C. and Turner, K. W.: Changes in lake area in response to thermokarst processes and climate in Old Crow Flats, Yukon, J. Geophys. Res.-Biogeo., 120, 513–524, 2015.
Lawrence, D. M. and Slater, A. G.: A projection of severe near-surface permafrost degradation during the 21st century, Geophys. Res. Lett., 32, 1–5, https://doi.org/10.1029/2005GL025080, 2005.
Lenz, J., Grosse, G., Jones, B. M., Walter Anthony, K. M., Bobrov, A., Wulf, S., and Wetterich, S.: Mid-Wisconsin to Holocene Permafrost and Landscape Dynamics based on a Drained Lake Basin Core from the Northern Seward Peninsula, Northwest Alaska, Permafrost Periglac., 27, 56–75, 2016.
Liljedahl, A. K., Boike, J., Daanen, R. P., Fedorov, A. N., Frost, G. V., Grosse, G., Hinzman, L. D., Iijma, Y., Jorgenson, J. C., Matveyeva, N., Necsoiu, M., Raynolds, M. K., Romanovsky, V. E., Schulla, J., Tape, K. D., Walker, D. A., Wilson, C. J., Yabuki, H., and Zona, D.: Pan-Arctic ice-wedge degradation in warming permafrost and its influence on tundra hydrology, Nat. Geosci., 9, 312–318, 2016.
Ling, F. and Zhang, T.: Impact of the timing and duration of seasonal snow cover on the active layer and permafrost in the Alaskan Arctic, Permafrost Periglac., 14, 141–150, 2003.
Macander, M. J., Swingley, C. S., Joly, K., and Raynolds, M. K.: Landsat-based snow persistence map for northwest Alaska, Remote Sens. Environ., 163, 23–31, 2015.
Mackay, J. R.: Catastrophic lake drainage, Tuktoyaktuk Peninsula area, District of Mackenzie, Current Research, Part D. Geological Survey of Canada, 83–90, 1988.
Marsh, P., Russell, M., Pohl, S., Haywood, H., and Onclin, C.: Changes in thaw lake drainage in the Western Canadian Arctic from 1950 to 2000, Hydrol. Process., 23, 145–158, 2009.
Melvin, A. M., Larsen, P., Boehlert, B., Neumann, J. E., Chinowsky, P., Espinet, X., Martinich, J., Baumann, M. S., Rennels, L., Bothner, A., and Nicolsky, D. J.: Climate change damages to Alaska public infrastructure and the economics of proactive adaptation, P. Natl. Acad. Sci. USA, 114, E122–E131, 2017.
Ménard, P., Duguay, C. R., Flato, G. M., and Rouse, W. R.: Simulation of ice phenology on Great Slave Lake, Northwest Territories, Canada, Hydrol. Process., 16, 3691–3706, 2002.
Menne, M. J., Durre, I., Korzeniewski, B., McNeal, S., Thomas, K., Yin, X., Anthony, S., Ray, R., Vose, R. S., Gleason, B. E., and Houston, T. G.: Global Historical Climatology Network – Daily (GHCN-Daily), Version 3, NOAA National Climatic Data Center, https://doi.org/10.7289/V5D21VHZ, 2012.
Nitze, I.: Sentinel-1 water mask processing script in Google Earthengine, available at: https://code.earthengine.google.com/7d2367758eead1614202efcfa6bed2b5, last access: 16 November 2020a.
Nitze, I.: Video animation script for detecting lake drainage in Google Earthengine, available at: https://code.earthengine.google.com/c879add607322305b8293904bea6d781, last access: 16 November 2020b.
Nitze, I.: noaaplotter: A python package to create fancy plots with NOAA weather data, available at: https://github.com/initze/noaaplotter, last access: 16 November 2020c.
Nitze, I., Barrett, B., and Cawkwell, F.: Temporal optimisation of image acquisition for land cover classification with Random Forest and MODIS time-series, Int. J. Appl. Earth Obs., 34, 136–146, 2015.
Nitze, I., Grosse, G., Jones, B. M., Arp, C., Ulrich, M., Fedorov, A., and Veremeeva, A.: Landsat-based trend analysis of lake dynamics across northern permafrost regions, Remote Sens., 9, 640, https://doi.org/10.3390/rs9070640, 2017.
Nitze, I., Grosse, G., Jones, B. M., Romanovsky, V. E., and Boike, J.: Remote sensing quantifies widespread abundance of permafrost region disturbances across the Arctic and Subarctic, Nat. Commun., 9, 5423, https://doi.org/10.1038/s41467-018-07663-3, 2018a.
Nitze, I., Grosse, G., Jones, B. M., Romanovsky, V. E., and Boike, J.: Remote sensing quantifies widespread abundance of permafrost region disturbances across the Arctic and Subarctic, Datasets, PANGAEA, https://doi.org/10.1594/PANGAEA.894755, 2018b.
Nitze, I., Cooley, S. W., Duguay, C. R., Jones, B. M., and Grosse, G.: Spatial lake dynamics and lake-ice datasets of the Northern Seward and Baldwin Peninsulas in Alaska. Alfred Wegener Institute, Helmholtz Centre for Polar and Marine Research, Bremerhaven, PANGAEA, https://doi.org/10.1594/PANGAEA.922808, 2020a.
Nitze, I., Cooley, S. W., Duguay, C. R., Jones, B. M., and Grosse, G.: Supplementary datasets and illustrations to Nitze et al., 2020, GitHub, available at: https://github.com/initze/NW_Alaska_Drainage_Paper, last access: 10 November 2020b.
Obu, J., Westermann, S., Bartsch, A., Berdnikov, N., Christiansen, H. H., Dashtseren, A., Delaloye, R., Elberling, B., Etzelmüller, B., Kholodov, A., and Khomutov, A.: Northern Hemisphere permafrost map based on TTOP modelling for 2000–2016 at 1 km2 scale, Earth-Sci. Rev., 193, 299–316, https://doi.org/10.1016/j.earscirev.2019.04.023, 2019.
Olthof, I., Fraser, R. H., and Schmitt, C.: Landsat-based mapping of thermokarst lake dynamics on the Tuktoyaktuk Coastal Plain, Northwest Territories, Canada since 1985, Remote Sens. Environ., 168, 194–204, 2015.
Osterkamp, T. E.: Characteristics of the recent warming of permafrost in Alaska, J. Geophys. Res., 112, F02S02, https://doi.org/10.1029/2006JF000578, 2007.
Parsekian, A. D., Jones, B. M., Jones, M., Grosse, G., Walter Anthony, K. M., and Slater, L.: Expansion rate and geometry of floating vegetation mats on the margins of thermokarst lakes, northern Seward Peninsula, Alaska, USA, Earth Surf. Proc. Land., 36, 1889–1897, 2011.
Pastick, N. J., Jorgenson, M. T., Wylie, B. K., Nield, S. J., Johnson, K. D., and Finley, A. O.: Distribution of near-surface permafrost in Alaska: Estimates of present and future conditions, Remote Sens. Environ., 168, 301–315, 2015.
Planet Team: Planet Application Program Interface: In Space for Life on Earth, San Francisco, CA, available at: https://api.planet.com (last access: 4 December 2019), 2017.
Plug, L. J. and West, J. J.: Thaw lake expansion in a two-dimensional coupled model of heat transfer, thaw subsidence, and mass movement, J. Geophys. Res., 114, F01002, https://doi.org/10.1029/2006JF000740, 2009.
Plug, L. J., Walls, C., and Scott, B. M.: Tundra lake changes from 1978 to 2001 on the Tuktoyaktuk Peninsula, western Canadian Arctic, Geophys. Res. Lett., 35, L03502, https://doi.org/10.1029/2007GL032303, 2008.
QGIS Development Team: QGIS Geographic Information System. Open Source Geospatial Foundation Project, available at: https://qgis.osgeo.org (last access: 10 November 2020), 2019.
Regmi, P., Grosse, G., Jones, M. C., Jones, B. M., and Walter Anthony, K. M.: Characterizing Post-Drainage Succession in Thermokarst Lake Basins on the Seward Peninsula, Alaska with TerraSAR-X Backscatter and Landsat-based NDVI Data, Remote Sensing, 4, 3741–3765, https://doi.org/10.3390/rs4123741, 2012.
Repo, M. E., Susiluoto, S., Lind, S. E., Jokinen, S., Elsakov, V., Biasi, C., Virtanen, T., and Martikainen, P. J.: Large N2O emissions from cryoturbated peat soil in tundra, Nat. Geosci., 2, 189–192, 2009.
Roach, J. K., Griffith, B., and Verbyla, D.: Landscape influences on climate-related lake shrinkage at high latitudes, Glob. Change Biol., 19, 2276–2284, 2013.
Romanovsky, V. E., Smith, S. L., and Christiansen, H. H.: Permafrost thermal state in the polar Northern Hemisphere during the international polar year 2007–2009: a synthesis, Permafrost Periglac., 21, 106–116, 2010.
Shur, Y. L. and Jorgenson, M. T.: Patterns of permafrost formation and degradation in relation to climate and ecosystems, Permafrost Periglac., 18, 7–19, 2007.
Schuur, E. A., McGuire, A. D., Schädel, C., Grosse, G., Harden, J. W., Hayes, D. J., Hugelius, G., Koven, C. D., Kuhry, P., Lawrence, D. M., and Natali, S. M.: Climate change and the permafrost carbon feedback, Nature, 520, 171–179, 2015.
Scenarios Network for Alaska and Arctic Planning: University of Alaska, available at: http://ckan.snap.uaf.edu/dataset?q=decadal+2km&tags=annual&tags=AR5%2FCMIP5&tags=climate&sort=score+desc %2C +metadata_modified+desc, last access: 10 January 2020.
Smith, L. C., Sheng, Y., MacDonald, G. M., and Hinzman, L. D.: Disappearing arctic lakes, Science, 308, 1429–1429, 2005.
Stabeno, P. J. and Bell, S. W.: Extreme Conditions in the Bering Sea (2017–2018): Record-Breaking Low Sea-Ice Extent, Geophys. Res. Lett., 46, 8952–8959, https://doi.org/10.1029/2019GL083816, 2019.
Stieglitz, M., Déry, S. J., Romanovsky, V. E., and Osterkamp, T. E.: The role of snow cover in the warming of arctic permafrost, Geophys. Res. Lett., 30, 54-1–54-4, https://doi.org/10.1029/2003GL017337, 2003.
Streletskiy, D. A., Shiklomanov, N. I., Little, J. D., Nelson, F. E., Brown, J., Nyland, K. E., and Klene, A. E.: Thaw Subsidence in Undisturbed Tundra Landscapes, Barrow, Alaska, 1962–2015, Permafrost Periglac., 28, 566–572, 2017.
Sturm, M. and Liston, G. E.: The snow cover on lakes of the Arctic Coastal Plain of Alaska, USA, J. Glaciol., 49, 370–380, 2003.
Surdu, C. M., Duguay, C. R., Brown, L. C., and Fernández Prieto, D.: Response of ice cover on shallow lakes of the North Slope of Alaska to contemporary climate conditions (1950–2011): radar remote-sensing and numerical modeling data analysis, The Cryosphere, 8, 167–180, https://doi.org/10.5194/tc-8-167-2014, 2014.
Swanson, D. K.: Thermokarst and precipitation drive changes in the area of lakes and ponds in the National Parks of northwestern Alaska, 1984–2018, Arct. Antarc. Alp. Res., 51, 265–279, 2019.
Tape, K. D., Jones, B. M., Arp, C. D., Nitze, I., and Grosse, G.: Tundra be dammed: Beaver colonization of the Arctic, Glob. Change Biol., 24, 4478–4488, 2018.
Walker, D. A., Raynolds, M. K., Daniëls, F. J., Einarsson, E., Elvebakk, A., Gould, W. A., and Moskalenko, N. G.: The circumpolar Arctic vegetation map, J. Veg. Sci., 16, 267–282, 2005.
Walter Anthony, K., Zimov, S. A., Grosse, G., Jones, M. C., Anthony, P. M., Chapin III, F. S., and Frolking, S.: A shift of thermokarst lakes from carbon sources to sinks during the Holocene epoch, Nature, 511, 452–456, 2014.
Walter Anthony, K., von Deimling, T. S., Nitze, I., Frolking, S., Emond, A., Daanen, R., Anthony, P., Lindgren, P., Jones, B., and Grosse, G.: 21st-century modeled permafrost carbon emissions accelerated by abrupt thaw beneath lakes, Nat. Commun., 9, 3262, https://doi.org/10.1038/s41467-018-05738-9, 2018.
Wetterich, S., Grosse, G., Schirrmeister, L., Andreev, A. A., Bobrov, A. A., Kienast, F., Bigelow, N. H., and Edwards, M. E.: Late Quaternary environmental and landscape dynamics revealed from a pingo sequence on the Seward Peninsula, Alaska, Quaternary Sci. Rev., 39, 26–44, https://doi.org/10.1016/j.quascirev.2012.01.027, 2012.
White, D. M., Gerlach, S. C., Loring, P., Tidwell, A. C., and Chambers, M. C.: Food and water security in a changing arctic climate, Environ. Res. Lett., 2, 045018, https://doi.org/10.1088/1748-9326/2/4/045018, 2007.
Yoshikawa, K. and Hinzman, L. D.: Shrinking thermokarst ponds and groundwater dynamics in discontinuous permafrost near Council, Alaska, Permafrost Periglac., 14, 151–160, 2003.