the Creative Commons Attribution 4.0 License.
the Creative Commons Attribution 4.0 License.
 | 10 Sep 2020
A model for interaction between conduits and surrounding hydraulically connected distributed drainage based on geomorphological evidence from Keewatin, Canada
Emma L. M. Lewington
Stephen J. Livingstone
Chris D. Clark
Andrew J. Sole
Robert D. Storrar
We identify and map visible traces of subglacial meltwater drainage around the former Keewatin Ice Divide, Canada, from high-resolution Arctic Digital Elevation Model (ArcticDEM) data. We find similarities in the characteristics and spatial locations of landforms traditionally treated separately (i.e. meltwater channels, meltwater tracks and eskers) and propose that creating an integrated map of meltwater routes captures a more holistic picture of the large-scale drainage in this area. We propose the grouping of meltwater channels and meltwater tracks under the term meltwater corridor and suggest that these features in the order of 10s–100s m wide, commonly surrounding eskers and transitioning along flow between different types, represent the interaction between a central conduit (the esker) and surrounding hydraulically connected distributed drainage system (the meltwater corridor). Our proposed model is based on contemporary observations and modelling which suggest that connections between conduits and the surrounding distributed drainage system within the ablation zone occur as a result of overpressurisation of the conduit. The widespread aerial coverage of meltwater corridors (5 %–36 % of the bed) provides constraints on the extent of basal uncoupling induced by basal water pressure fluctuations. Geomorphic work resulting from repeated connection to the surrounding hydraulically connected distributed drainage system suggests that basal sediment can be widely accessed and evacuated by meltwater.
- Article
(24087 KB) - Full-text XML
- BibTeX
- EndNote


Variations in the configuration of subglacial hydrological systems are key to understanding some of the most dynamic ice sheet behaviour at a range of spatial and temporal scales (e.g. Zwally et al., 2002; Das et al., 2008; Joughin et al., 2008; van de Wal et al., 2008; Shepherd et al., 2009; Palmer et al., 2011; Fitzpatrick et al., 2013; Doyle et al., 2014). Once water reaches the bed, its impact on ice flow is determined by the hydraulic efficiency of the subglacial hydrological system. Theory developed at alpine glaciers suggests that increasing water pressure results in enhanced ice motion owing to reduced ice–bed contact (Lliboutry, 1968; Bindschadler, 1983) and, where sediment is present, enhanced sediment deformation (e.g. Englehardt et al., 1978; Hodge, 1979; Iken and Bindschadler, 1986; Fowler, 1987; Iverson et al., 1999; Bingham et al., 2008). Water pressure at the bed depends on water supply to, storage within and discharge through the subglacial hydrological system (Iken et al., 1983; Kamb et al., 1985; Nienow et al., 1998). The configuration of the subglacial hydrological system is key to this, with a hydraulically efficient drainage system able to accommodate and evacuate an equivalent water flux without causing spikes in basal water pressure which have been linked to transient ice accelerations (e.g. Tedstone et al., 2013).
Traditionally the subglacial hydrological system has been conceptualised as a binary model comprising (i) inefficient distributed drainage – taking the form of thin films of water (Weertman, 1972), linked cavities (Lliboutry, 1968; Walder, 1986; Kamb, 1987), groundwater flow (Boulton et al., 1995) and/or wide shallow canals (Walder and Fowler, 1994) and (ii) efficient channelised drainage with conduits cut either up into the ice (Röthlisberger channel) or down into the bed (Nye channel) (e.g. Rothlisberger, 1972; Shreve, 1972; Nye,1973; Hooke et al., 1990). These two systems interact with each other over a range of spatial and temporal scales (e.g. Andrews et al., 2014; Hoffman et al., 2016; Rada and Schoof, 2018; Downs et al., 2018; Davison et al., 2019), resulting in (i) a moulin-connected channelised system which remains hydraulically connected to surface meltwater inputs throughout the melt season, (ii) an active hydraulically connected distributed system strongly influenced by the channelised system and therefore surface inputs across a range of spatial and temporal scales (e.g. Hubbard et al., 1995), and (iii) a weakly connected distributed system largely isolated from the channelised system and only rarely – if ever – affected by surface meltwater inputs (Fig. 1; Andrews et al., 2014; Hoffman et al., 2016; Rada and Schoof, 2018).
In theory, in a steady-state system, water flows from surrounding high-pressure distributed regions into lower pressure conduits. Borehole measurements of subglacial water pressure, modelling and ice velocity proxy data (e.g. Hubbard et al., 1995; Gordon et al., 1998; Bartholomaus et al., 2008; Werder et al., 2013; Tedstone et al., 2014) suggest, however, that given a sufficiently large and rapid spike in water delivery to a subglacial conduit, the hydraulic gradient can be reversed such that water is forced out of and laterally away from the conduit into the hydraulically connected distributed drainage system. This has been variously termed a variable pressure axis (VPA) (Hubbard et al., 1995), an efficient subsystem (Rada and Schoof, 2018) and an efficient core (e.g. Davison et al., 2019). Here, we use the term hydraulically connected distributed drainage which we consider to be the lateral limit of the influence of pressure variations that originate in a subglacial conduit and cause the flow of water in or out of the conduit. This mechanism has implications for overlying ice sheet dynamics; for example, overpressurisation overwhelms the conduit and can elicit ice flow acceleration and ice sheet surface uplift (e.g. van de Wal et al., 2008; Bartholomew et al., 2011; Doyle et al., 2014; Tedstone et al., 2015). The extent of this dynamic effect is much greater than the area of the bed directly affected by the meltwater.
Beyond the hydraulically connected distributed drainage system, the remaining distributed drainage system – likely composed of linked cavities – is largely isolated or disconnected from surface meltwater inputs (Andrews et al., 2014; Hoffman et al., 2016; Rada and Schoof, 2018). This area may exhibit some slow leakage into the hydraulically connected distributed drainage system (Hoffman et al., 2016; Rada and Schoof, 2018), and it is possible that pressure perturbations within the conduit also increase connections between these weakly connected parts of the bed and the hydraulically connected distributed drainage system. Weakly connected drainage areas potentially cover a large percentage of the bed, and their gradual drainage over time is hypothesised to reduce regional basal water pressure, thereby increasing ice–bed contact and reducing ice velocity (e.g. Sole et al., 2013; Andrews et al., 2014; Bougamont et al., 2014; Tedstone et al., 2015; Hoffman et al., 2016).
Although we now have a better appreciation for the heterogeneous nature of the subglacial hydrological system, a lack of direct observations means that the reality of this interaction – its spatial and temporal occurrence, its expression, and its impact – remains speculative. For example, is the transition between the connected and isolated parts of the distributed drainage system abrupt (e.g. Hoffman et al., 2016) or transitional (e.g. Hubbard et al., 1995; Downs et al., 2018)? How does the extent of the hydraulically connected distributed drainage system vary over space and time? Does the forcing of pressurised water out of the conduit have implications for sediment erosion rates?
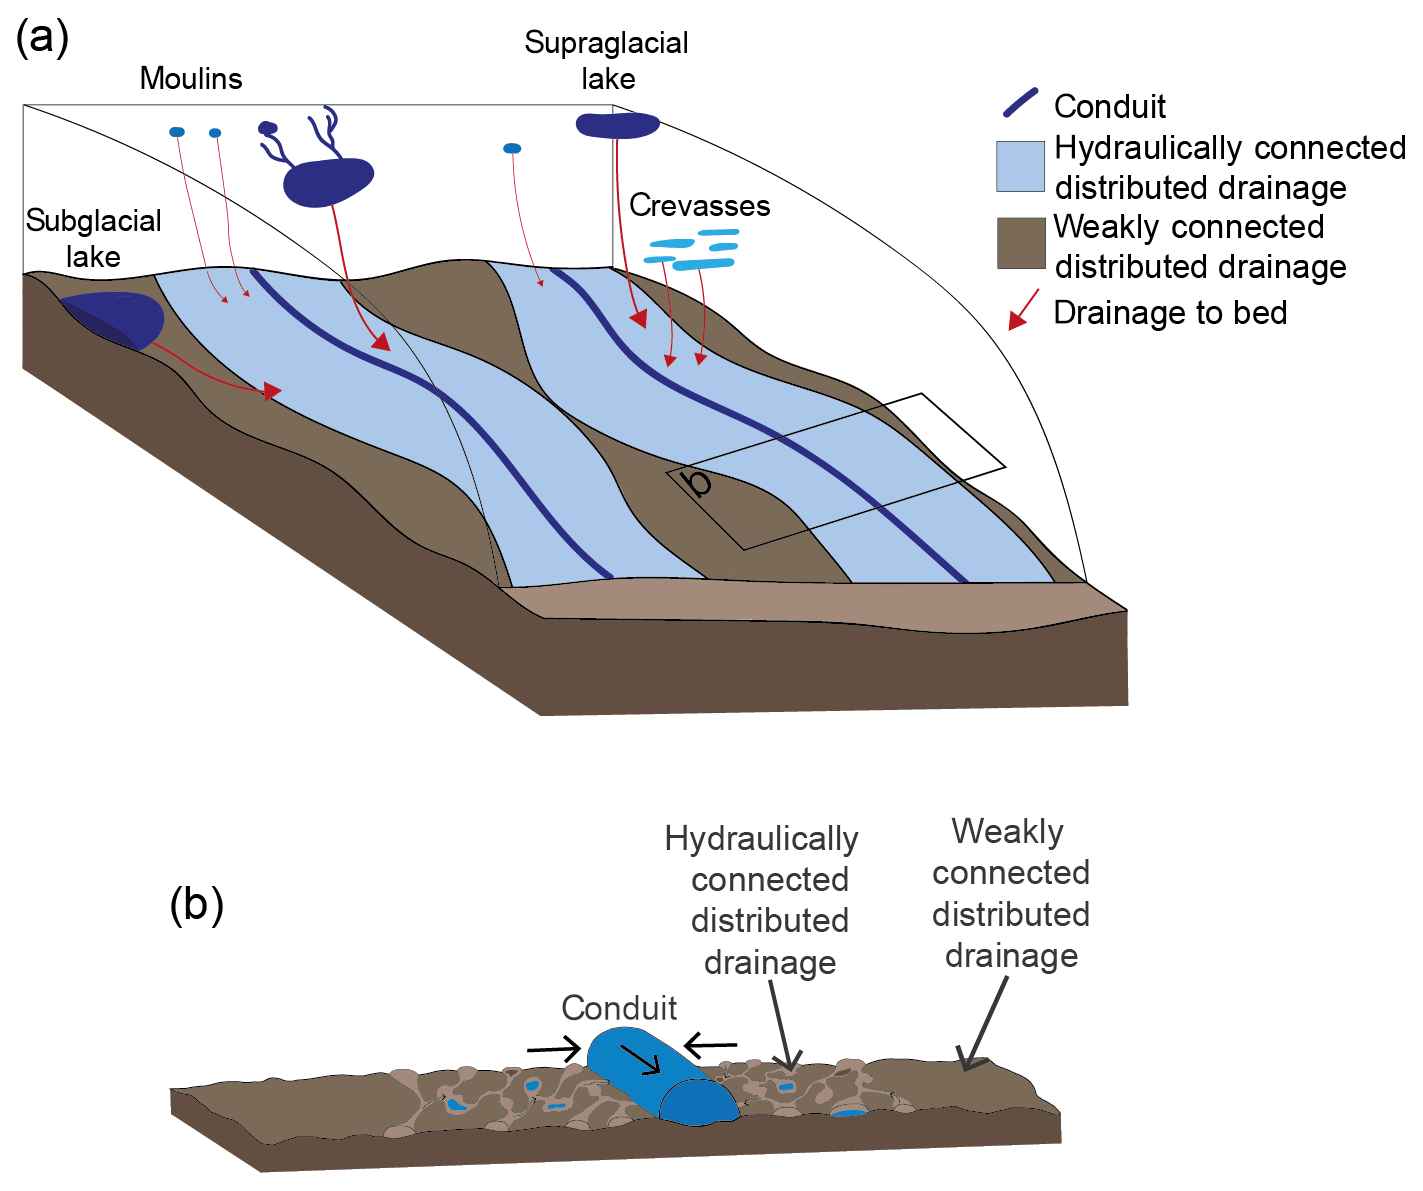
Figure 1(a) Ice sheet hydrological system with varying surface and basal inputs and (b) a three-system drainage model. In the three-system drainage model, the hydraulically connected distributed drainage system (light blue in a) is influenced regularly by surface meltwater inputs through the conduit. The weakly connected distributed drainage system (dark brown) is largely isolated and rarely or never impacted by surface meltwater inputs. At present, the relative coverage of each is not yet known, nor is the precise configuration or relation between each component.
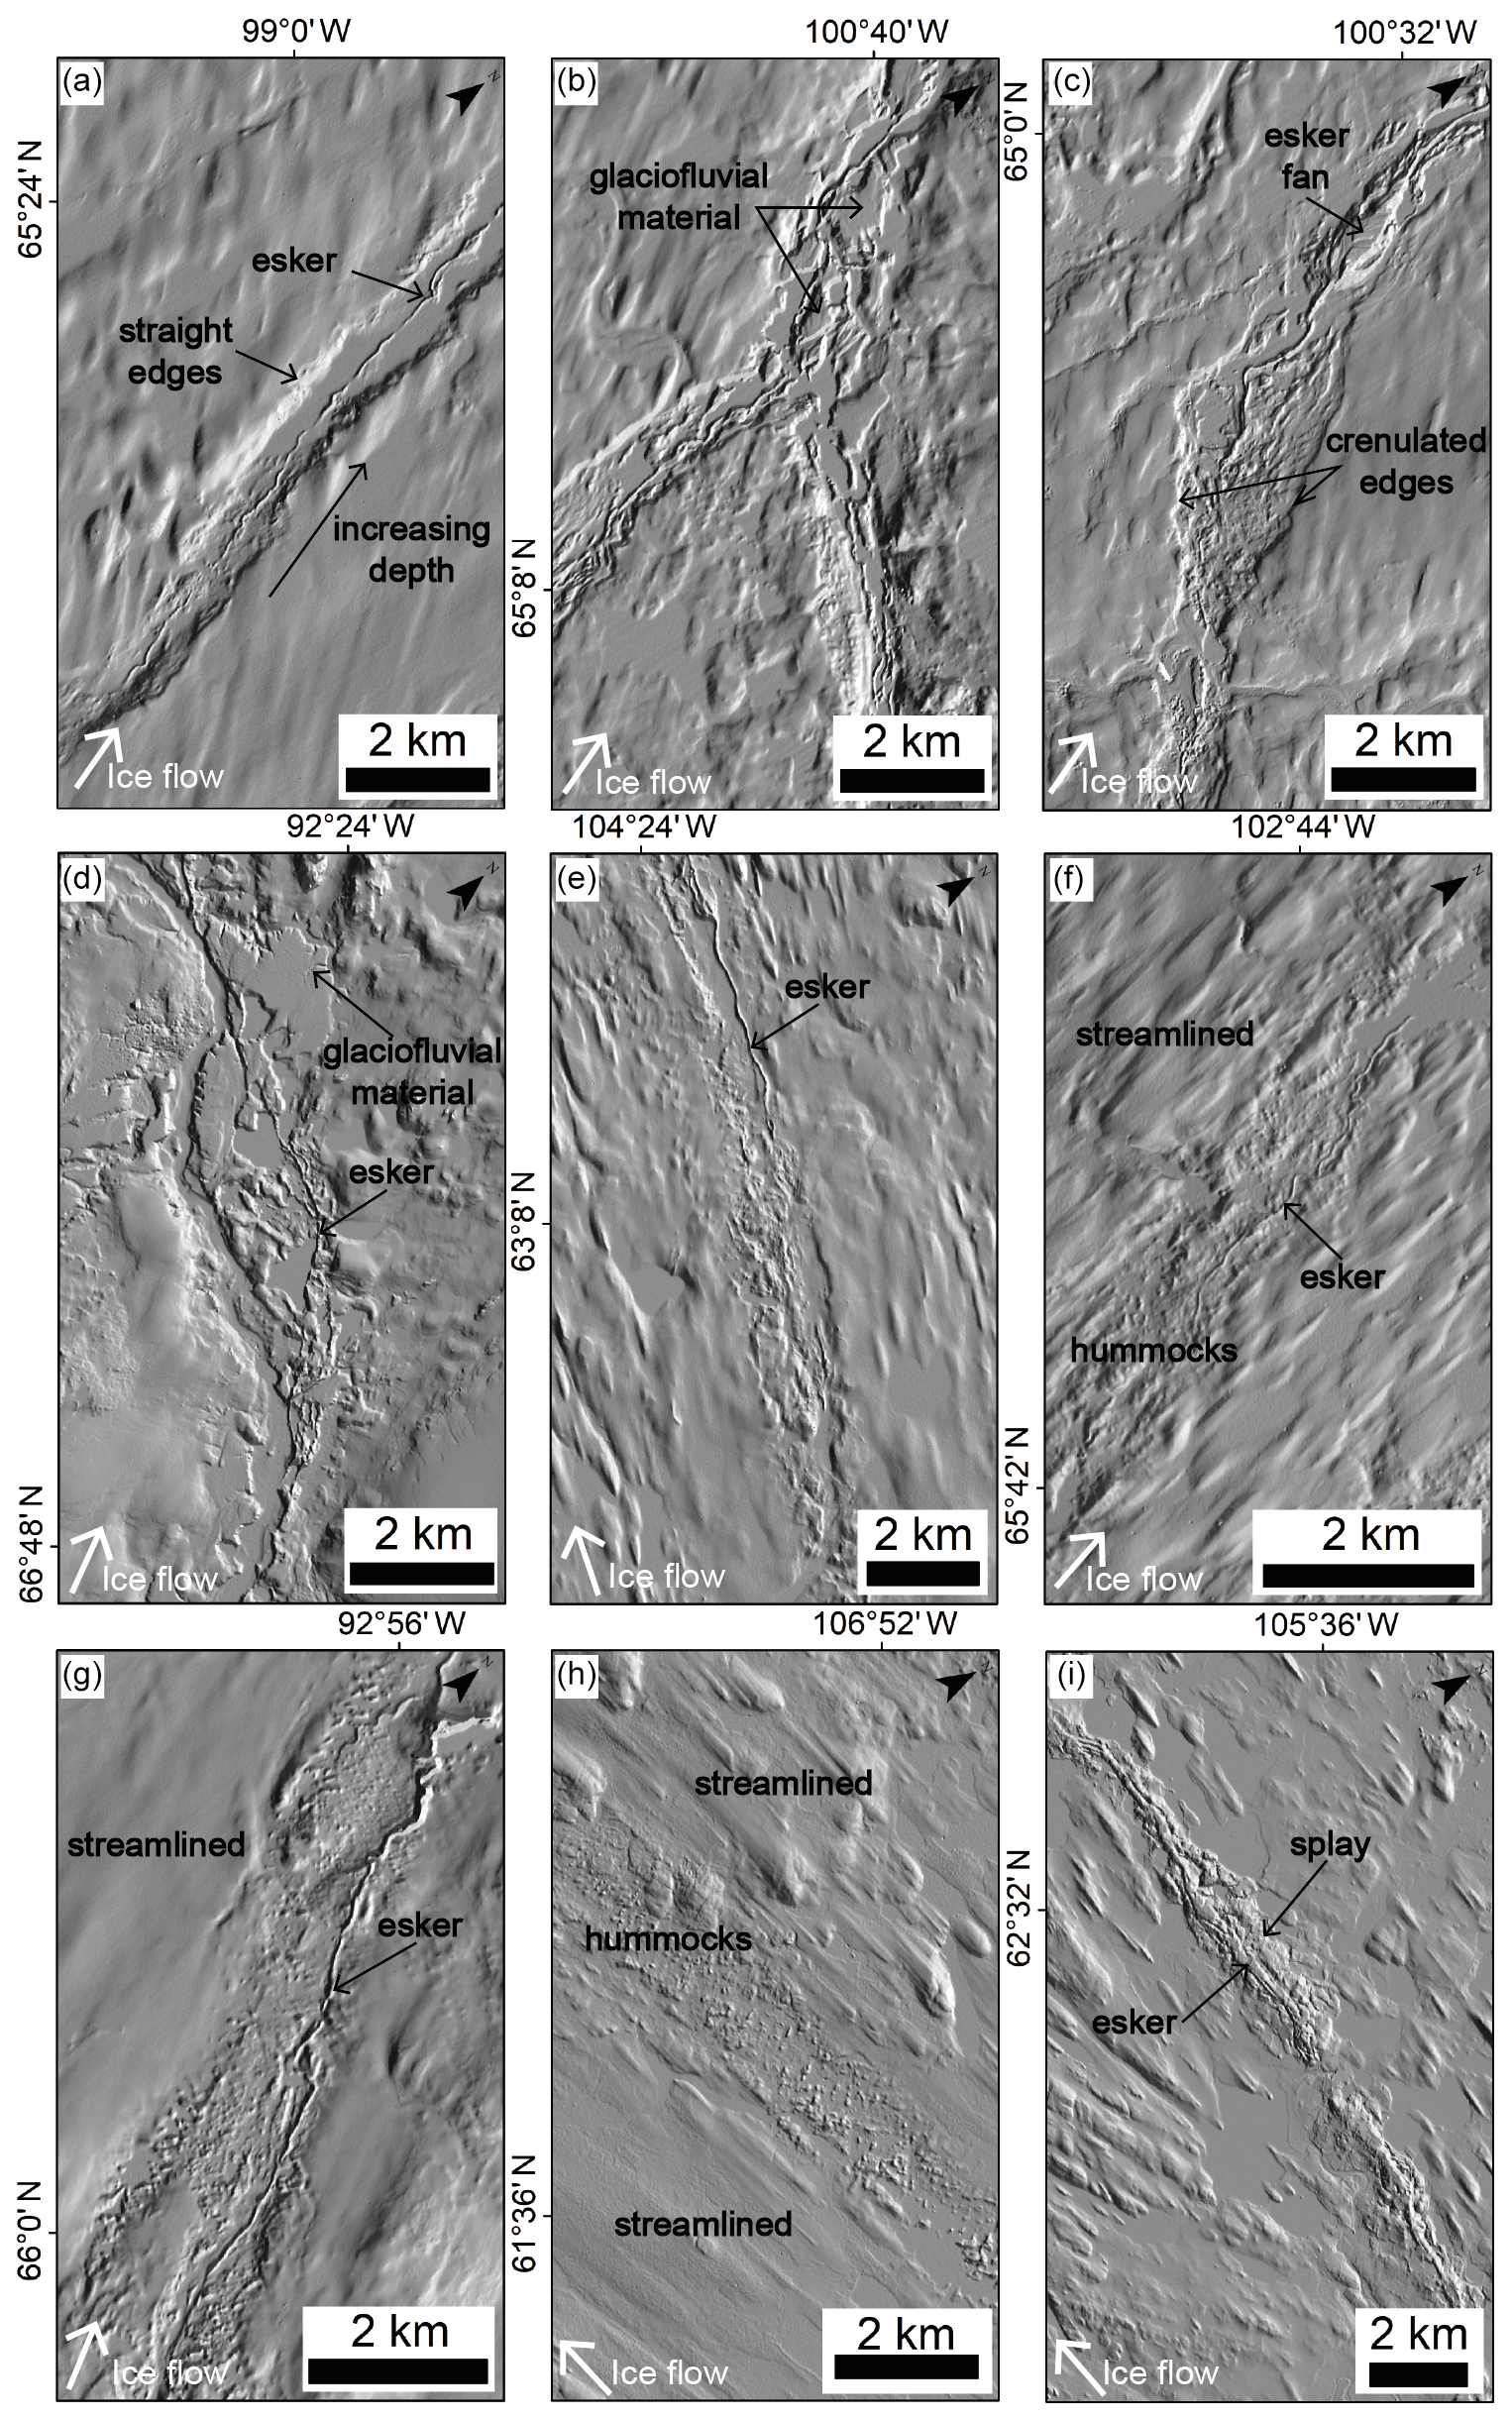
Figure 2Varying geomorphic expressions of subglacial meltwater flow: (a) increasing depth hummock corridor transitioning into a tunnel valley; (b–d) hummock corridors with negative relief containing eskers, esker fans and glaciofluvial deposits. Corridor edges vary in straightness; (e–h) hummock corridors with more subdued relief, largely detectable by the elongated tracts of hummocks which stand out from the surrounding streamlined terrain and often surround an esker; (i) an esker surrounded by lateral fans, i.e. esker splays.
Palaeo-meltwater landforms
Palaeo-meltwater landforms have been fundamental in inspiring and guiding conceptual and numerical models of how water self-organises into drainage systems beneath present day ice masses because they can be easily observed and investigated (Fig. 2). Such landforms are therefore key to contextualising spatially and temporally limited contemporary observations and are commonly used to support and develop the theory of ice sheet hydrological systems (e.g. Shreve, 1985; Clark and Walder, 1994; Boulton et al., 2007a, b, 2009; Beaud et al., 2018a, b; Hewitt and Creyts, 2019). Much of this focus has been on landforms such as eskers, meltwater channels and tunnel valleys which indicate efficient channelised subglacial drainage (e.g. Shreve, 1985; Brennand, 1994, 2000; Clark and Walder, 1994; Punkari, 1997; Boulton et al., 2007a, b, 2009; Storrar et al., 2014a; Livingstone and Clark, 2016). We will now discuss each of these in more detail.
1.1 Eskers
Eskers are linear depositional landforms made up of glaciofluvial sand and gravel deposited from meltwater flowing through or beneath an ice mass in conduits metres to tens of metres in width and height. They exist as individual segments that often align to form networks extending up to several hundreds of kilometres (e.g. Shreve, 1985; Aylsworth and Shilts, 1989; Brennand, 2000; Storrar et al., 2014a; Stroeven et al., 2016) and are typically taken to record the former position and characteristics of Röthlisberger channels (R channels) thermally eroded into the base of the ice by turbulent water flow. While most studies reduce esker mapping to a single crest line and consider the classic single straight-to-sinuous undulating ridge to be pervasive, more complex esker morphologies also occur (e.g. Banerjee and McDonald, 1975; Rust and Romanelli, 1975; Hebrand and Amark, 1989; Gorrell and Shaw, 1991; Warren and Ashley, 1994; Brennand, 2000; Mäkinen, 2003; Perkins et al., 2016; Storrar et al., 2019). These include fine-grained sandy fan shape elements or “splays”, alongside and associated with the coarse gravelly central ridge (e.g. Cummings et al., 2011a; Prowse, 2017). These splays are an order of magnitude wider and more gently sloped than the main ridge (Cummings et al., 2011a). They are proposed to form in proglacial environments, representing subaqueous outwash fans deposited by sediment-laden plumes exiting a subglacial conduit into a proglacial lake (e.g. Powell, 1990; Hoyal et al., 2003; Cummings et al., 2011b), supraglacial environments (e.g. Prowse, 2017) and subglacial environments, with sedimentation in subglacial cavities alongside the main esker ridge during periods of high water pressure within the conduit (e.g. Gorrell and Shaw, 1991; Brennand, 1994).
1.2 Meltwater channels and tunnel valleys
Erosional subglacial meltwater channels, or Nye channels (N channels), incised into bedrock or sediment substrate range in size from metres to tens of metres wide (e.g. Sissons, 1961; Glasser and Sambrook Smith, 1999; Piotrowski, 1999) to large tunnel valleys several kilometres in width and tens of kilometres long (e.g. Kehew et al., 2012; van der Vegt et al., 2012; Livingstone and Clark, 2016). Tunnel valleys are observed to occur at various developmental stages from mature and clearly defined to indistinct valleys often associated with hummocky terrain or as a series of aligned depressions (e.g. Kehew et al., 1999; Sjogren et al., 2002). Their formation has been linked to subglacial meltwater erosion at the ice–bed interface (cf. Ó Cofaigh, 1996; Kehew et al., 2012; van der Vegt et al., 2012) with the assumption that channels transported large volumes of sediment and water. However, their precise mechanism of formation is still debated with the main arguments focussing on (i) catastrophic outburst formation with rapid erosion following the release of sub- or supraglacially stored water (e.g. Piotrowski, 1994; Cutler et al., 2002; Hooke and Jennings, 2006; Jørgensen and Sandersen, 2006), (ii) gradual steady-state formation with headward erosion of soft sediments in low-water-pressure conduits (e.g. Boulton and Hindmarsh, 1987; Mooers, 1989; Praeg, 2003; Boulton et al., 2009) and (iii) formation from seasonal meltwater flow (Beaud et al., 2016, 2018b).
Here, we use the term meltwater channel to refer to palaeo-evidence of erosional channelised flow preserved on the ice sheet bed (i.e. the outline of the path the water took) at all scales from N channels through to tunnel valleys. We use the term conduit to refer to the active channelised flow beneath a contemporary ice mass (i.e. the enclosed, sediment or ice walled, pipe carrying water at the ice–bed interface).
1.3 Meltwater tracks
Detailed mapping in northern Canada and Scandinavia has identified the presence of linear tracks variously termed “hummock corridors”, “glaciofluvial corridors”, “washed zones” and “esker corridors”, typically a few hundred metres to several kilometres wide and a few kilometres to hundreds of kilometres long (e.g. St-Onge, 1984; Dredge et al., 1985; Rampton, 2000; Utting et al., 2009; Burke et al., 2012; Kerr et al., 2014a, b; Sharpe et al., 2017; Peterson et al., 2017; Peterson and Johnson, 2018; Lewington et al., 2019). These features often contain eskers and hummocks which vary in size, shape, and relief (Peterson and Johnson, 2018) as well as patches of glaciofluvial deposits and areas of exposed bedrock. While a subglacial meltwater origin is largely agreed upon, their precise mode of formation is not yet known. These features are collectively termed meltwater tracks herein.
Meltwater landforms are typically mapped and interpreted individually (e.g. Clark and Walder, 1994; Brennand, 2000; Storrar et al., 2013; Burke et al., 2015; Livingstone and Clark, 2016; Mäkinen et al., 2017) rather than as a holistic drainage signature (cf. Storrar and Livingstone, 2017). As such, it is not yet clear whether or how differing expressions of subglacial drainage are interrelated and to what extent variations in drainage or background conditions (e.g. bed substrate, geology and local topography) control the preserved geomorphic signature we see today. This study aims to identify and map all discernible evidence of subglacial meltwater drainage across the Keewatin District of northern Canada from the Arctic Digital Elevation Model (ArcticDEM). We collectively refer to these as meltwater routes. Producing an integrated map of all visible subglacial meltwater evidence allows us to quantify the varying dimensions and geomorphological expressions of these features, to investigate associations between features traditionally treated separately, and to explore potential controls on expression and formation. Importantly, we note this is a minimum map as some landforms – particularly tunnel valleys – may be fully or partially buried (e.g. Jørgensen and Sandersen, 2006).
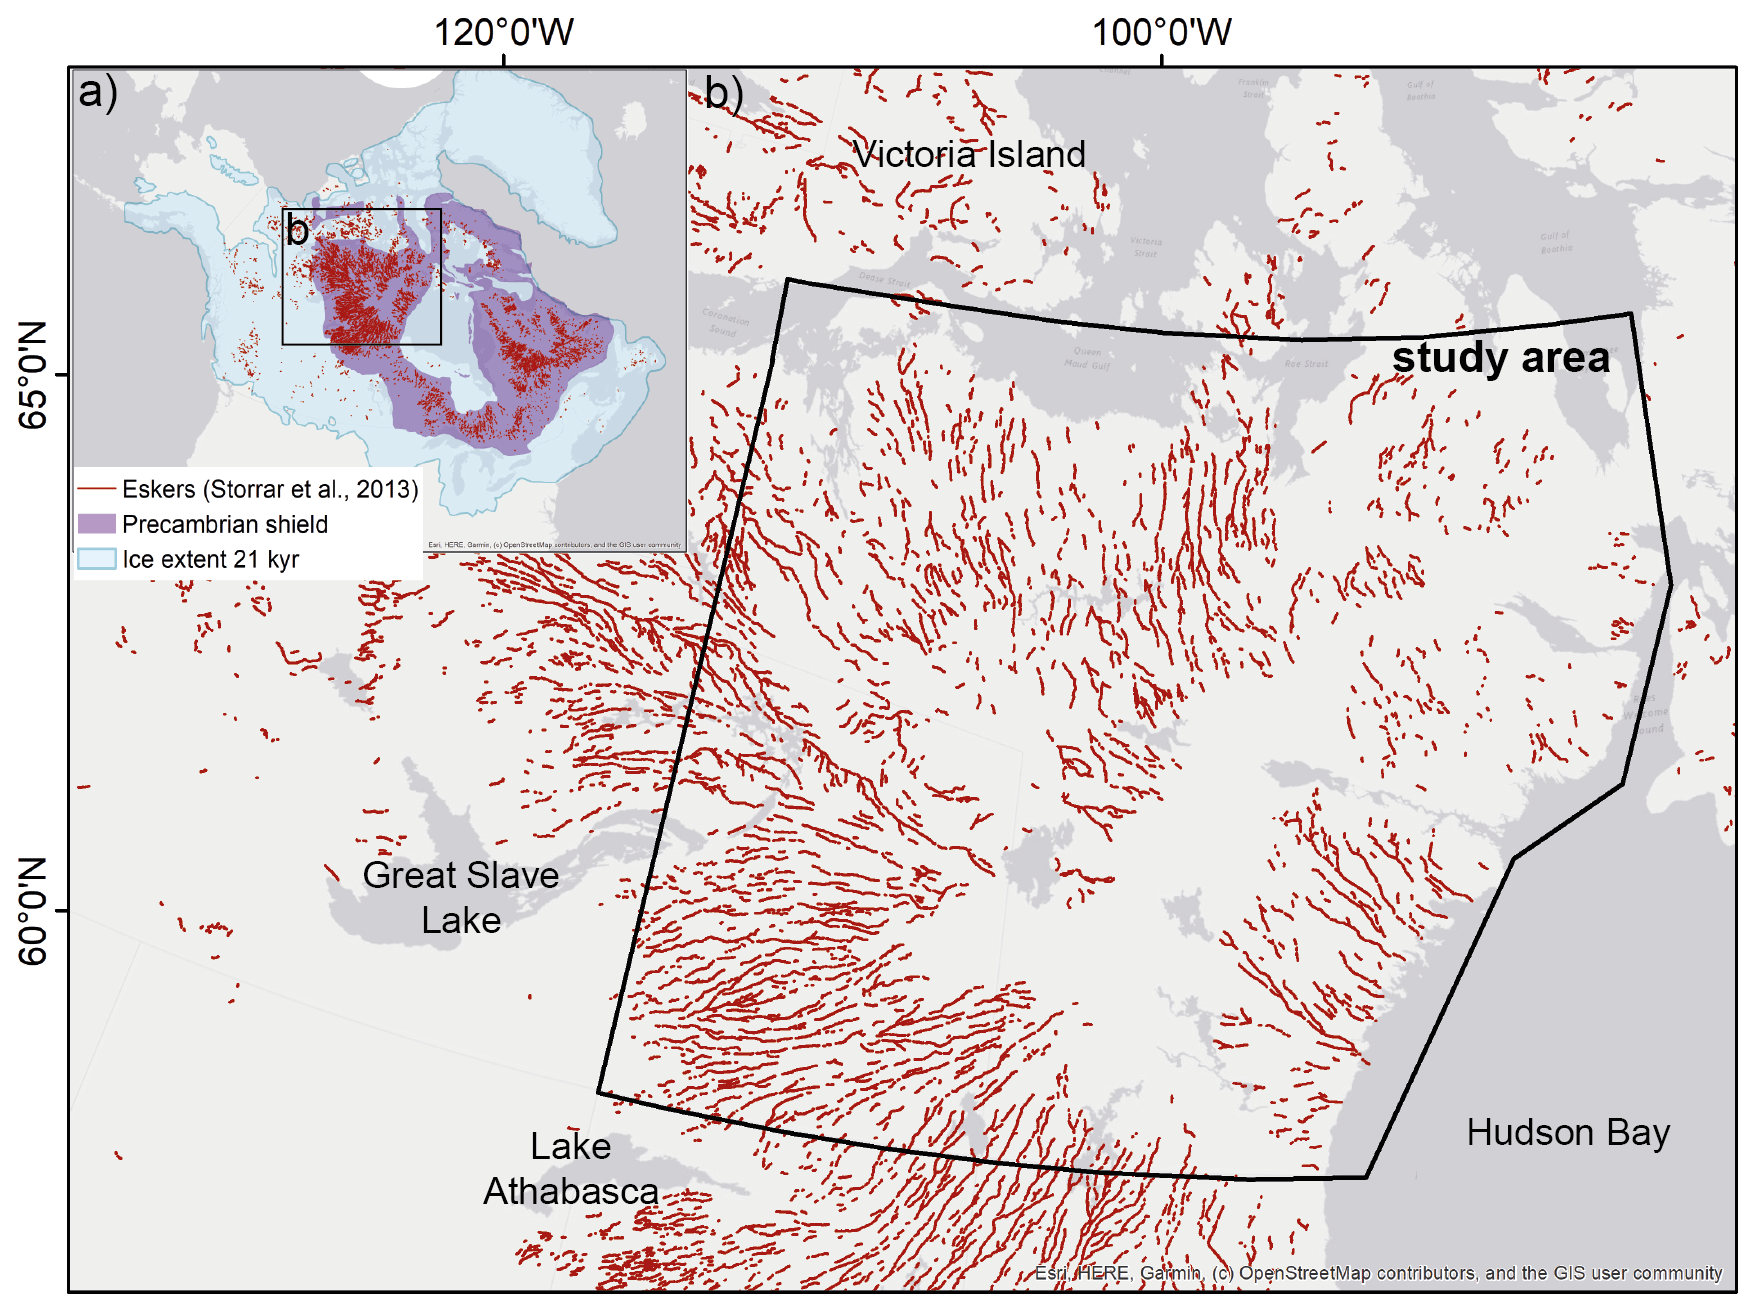
Figure 3(a) Large-scale distribution of eskers around Hudson Bay (Storrar et al., 2013). The Laurentide Ice Sheet extent displayed in the inset is the Last Glacial Maximum (LGM) at 18 ka (14C; 21.4 ka cal BP) (Dyke et al., 2003) and the extent of the Precambrian shield is also mapped (Wheeler et al., 1996). (b) Zoomed-in location of the study area focussed on the area around the former Keewatin Ice Divide.
This study focusses on an area approximately 1 million km2 to the west of Hudson Bay in northern Canada, surrounding the location of the former Keewatin Ice Divide of the Laurentide Ice Sheet (LIS) (Fig. 3) (Lee et al., 1957; McMartin et al., 2004). The area generally exhibits negligible local relief and is underlain by resistant Precambrian bedrock that is either exposed or covered by till ranging from thin and discontinuous (typically < 2 m) to thick and pervasive (typically > 2 m) (e.g. Clark and Walder, 1994).
Traditionally, eskers have been identified as the predominant meltwater landform within the Keewatin area, although meltwater tracks (e.g. St-Onge, 1984; Aylsworth and Shilts, 1989; Rampton, 2000; Utting et al., 2009; Sharpe et al., 2017; Lewington et al., 2019) and meltwater channels (e.g. Storrar and Livingstone, 2017) have also been recorded. At a large scale, eskers radiate out from the ice divide, beneath which they are rare (Shilts et al., 1987; Aylsworth and Shilts, 1989; Storrar et al., 2013, 2014a). At a local to regional scale, they exhibit a dendritic pattern and 12–15 km quasi-uniform spacing (e.g. Banerjee and McDonald, 1975; St-Onge, 1984; Shilts et al., 1987; Bolduc, 1992; Storrar et al., 2014a).

Figure 4(a) Ice-margin estimates (Dyke et al., 2003) for the Keewatin sector of the LIS; (b) intersection points between mapped meltwater routes and ice-margin estimates used for sample locations; (c) a zoomed-in example of meltwater routes, margin isochrones and intersections from the SW of the study area; (d) method for recording meltwater route characteristics; and (e) lateral spacing.
3.1 Data sources and mapping
High-resolution digital elevation data, made available through the ArcticDEM (10 m) (freely available at https://www.pgc.umn.edu/data/arctcidem, last access: 31 August 2020), and generated by applying stereo and auto-correlation techniques to overlapping pairs of high-resolution optical satellite images (Noh and Howat, 2015; Porter et al., 2018), were used in this study to identify and map meltwater landforms. In addition, eskers mapped by Storrar et al. (2013) from 30 m resolution Landsat ETM+ multispectral imagery were used to inform further high-resolution esker mapping from the 10 m resolution ArcticDEM. The automatic mapping approach developed in Lewington et al. (2019) was used to create a first pass map of hummock corridors – classified as meltwater tracks here (Fig. A1) – to augment the improved esker map. Together, these were used to create an integrated map of meltwater routes by manually mapping centrelines of all visible traces of subglacial meltwater drainage including meltwater tracks, meltwater channels and eskers. Multiple orthogonal hillshades were generated to avoid azimuth bias (Smith and Clark, 2005), and mapping was undertaken at a range of spatial scales to maximise the number of features captured (Chandler et al., 2018).
3.2 Classification and morphometry
The meltwater routes were used to explore the occurrence and morphology of different types of meltwater landforms. Former ice-margin estimates from Dyke et al. (2003) were used as transects (Fig. 4). These transects are spaced approximately 30–40 km apart and in the study area cover ca. 1000 years of deglaciation between 9.7 and 8.6 ka. This period encompasses the final stages of deglaciation when the ice sheet was experiencing a strongly negative surface mass balance with associated increasing rates of meltwater production (e.g. Carlson et al., 2008, 2009). Retreat rates were generally between 100 and 200 m yr−1 from 13 to 9.5 ka, increasing rapidly between 9.5 and 9 ka to around 400 m yr−1, after which the retreat rate decreased briefly before another increase from ∼ 8.5 ka (Dyke et al., 2003).
When a meltwater route intersected a transect, an intersection point was added and the following information recorded:
-
landform type (i.e. esker ridge, esker with lateral splay, meltwater track or meltwater channel),
-
width of landform (or landforms if an esker ridge was present within a meltwater track, meltwater channel or surrounded by a lateral splay), and
-
bed substrate and geology (Fulton, 1995; Wheeler et al., 1996).
Spacing between adjacent meltwater route centrelines was calculated along each transect with centrelines at the end of each transect and those separated by clear breaks (e.g. due to the coincidence of a lake) discounted. The total length of meltwater route centrelines was calculated automatically in a geographic information system (GIS).
3.3 Testing controls on meltwater route width and expression
This study takes a large-scale approach to exploring controls on meltwater route width and expression. While this approach results in a compromise in terms of data resolution available for the surface substrate and geology maps, it also increases statistical confidence in the results due to the larger sample size. Before the analysis was undertaken, three test sites were selected from the study area to allow for more detailed mapping and comparisons (Figs. A2 and A3).
To explore substrate and geological controls on meltwater route occurrence, distribution and properties, the overall length of meltwater routes overlying each substrate type (Fulton, 1995) and geology (Wheeler et al., 1996) within the three test sites was calculated. The total area of each basal unit within the test sites was also calculated and values were converted to percentages. Following this, the percentage area was subtracted from the percentage of meltwater routes for each individual substrate and geology type, giving a positive (over-represented) or negative (under-represented) value. Next, meltwater routes were split and classified by feature type (i.e. esker, esker with lateral splay, meltwater channel and meltwater track). The above analysis was then repeated by feature type to explore whether geomorphological expression is controlled by surface substrate or geology. It is important to note that categorisations along meltwater routes were not always independent as the same section was sometimes coded as a meltwater track and an esker with splay as often positive features are situated within wider erosional corridors.
It was noted that landform type varies both across adjacent meltwater routes and along individual meltwater route centrelines. To assess any potential relationship between landform type and background controls in more detail, individual centrelines were selected and sampled with a higher frequency (1 km intervals). At each sample location the width of the meltwater track or meltwater channel, the presence or absence of an esker (and its width if present), surface substrate, bed geology and elevation were recorded.
The transfer of surface meltwater to the bed via moulins is thought to be strongly controlled and largely fixed by bed topography; ice flow over bedrock ridges can cause elevated tensile stresses resulting in crevassing (Catania and Neumann, 2010), while the transfer of bed topography to the ice-surface preconditions where surface lakes form (e.g. Gudmundsson, 2003; Karlstrom and Yang, 2016; Crozier et al., 2018; Ignéczi et al., 2018). To investigate the spatial coincidence between subglacial meltwater pathway density and basal roughness, we initially applied a circular median filter with a 2 km diameter to the bed topography (the 10 m resolution resampled to 100 m). This was based on the understanding that bed perturbations below 1–3 times the ice thickness are not transferred to the surface (Gudmundsson, 2003; Ignéczi et al., 2018) and that the LIS ice thickness was typically 500–2000 m thick. Standard deviation was then calculated over a 20 km diameter window as per Ignéczi et al. (2018), who found this smoothing distance matched the requirements that the smoothing window should not exceed 10 times the ice thickness (Gudmundsson, 2003) while still capturing longer-scale variations and dampening rapid changes in local topography (Ng et al., 2018).
Finally, ice stream locations (Margold et al., 2015) were quantitatively compared to the distribution of meltwater routes. This allowed us to determine whether or not there was a difference in expression of subglacial meltwater pathways between ice stream and non-ice stream areas.
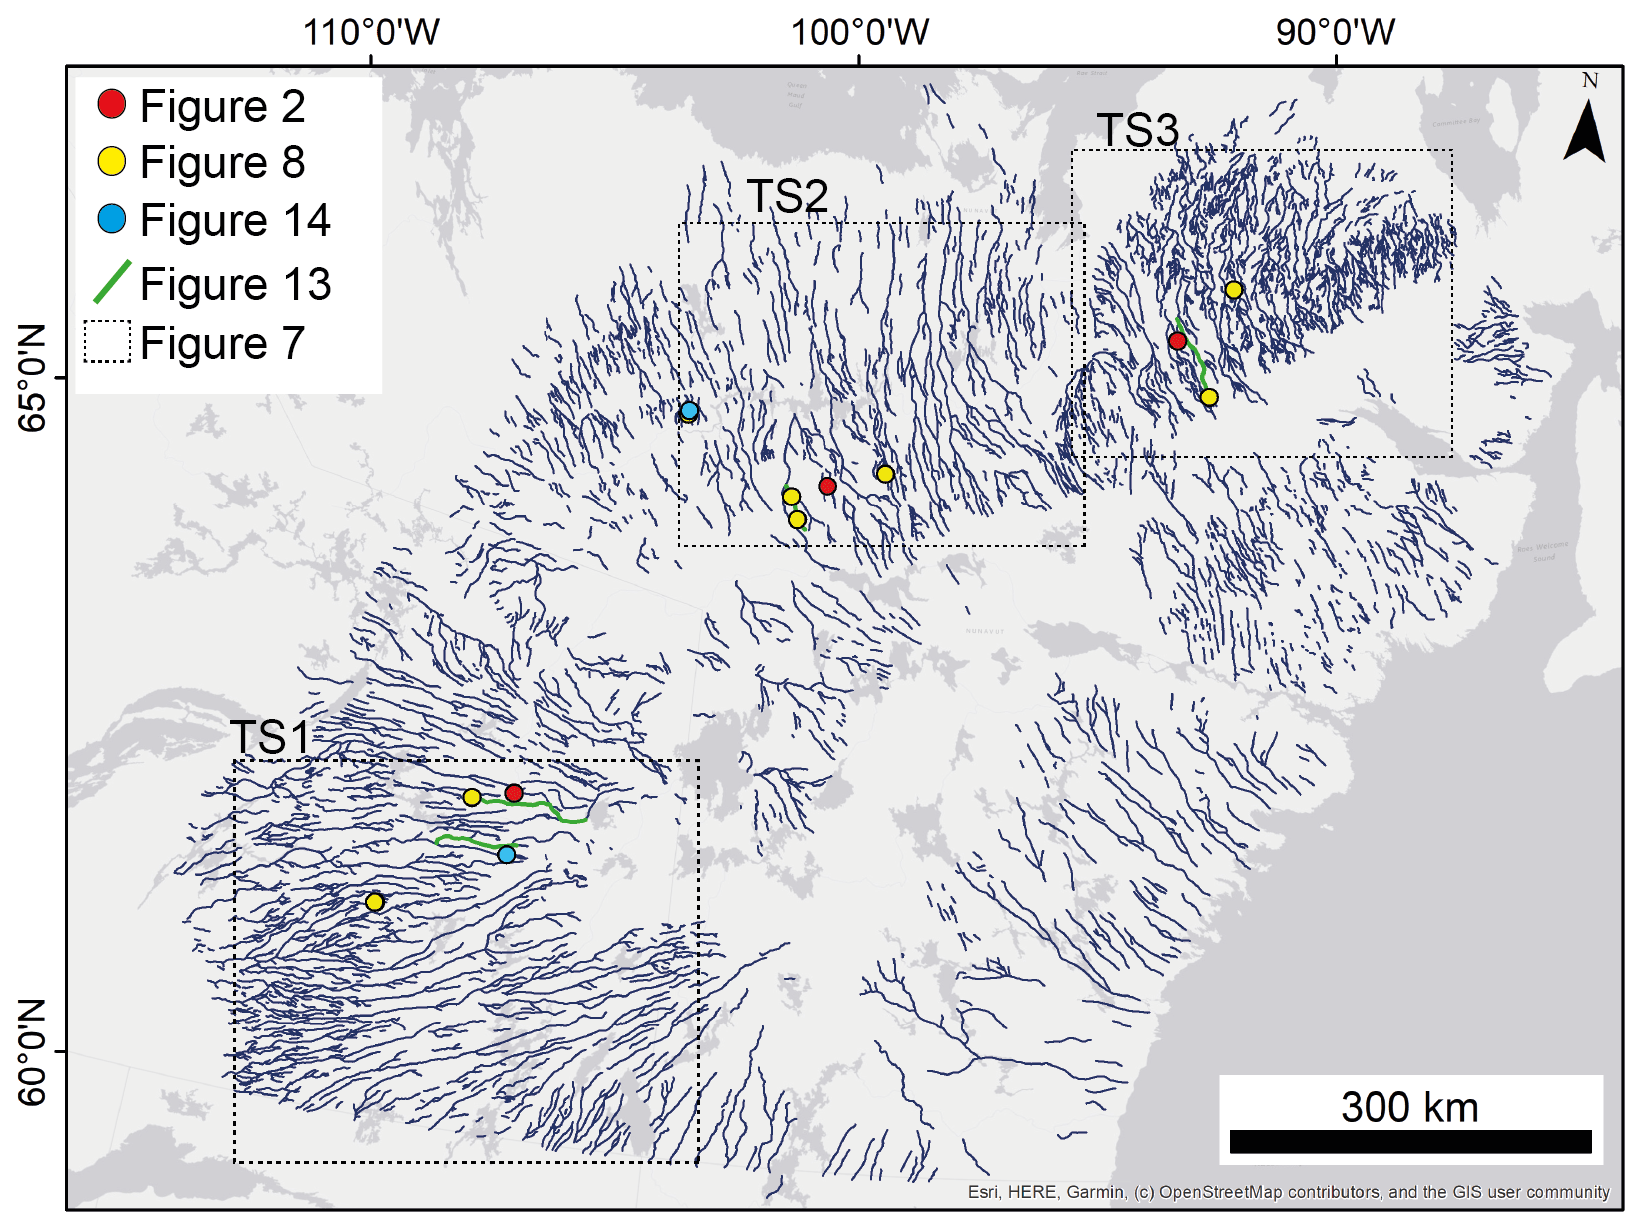
Figure 5Integrated map of meltwater routes. Note how meltwater routes in this new map are less fragmented and denser than the existing esker map (Fig. 2b). Points and boxes represent locations of other figures.
4.1 An integrated drainage signature
Mapping all traces of meltwater drainage reveals the ubiquity of former subglacial drainage across the study area (Fig. 5). A total of ∼ 3000 meltwater routes were mapped over a ∼ 1 million km2 area with a total length of almost 55 000 km. The meltwater routes exhibit a similar overall pattern to earlier esker maps (e.g. Aylsworth and Shilts, 1989; Storrar et al., 2013) radiating out from the former Keewatin Ice Divide. More than 90 % of mapped esker ridges in this region are estimated to occur along a meltwater route and therefore form part of the same network. In terms of the large-scale pattern, there are no obvious trends in meltwater route density, width or feature type associated with margin retreat. However, the study area only covers approximately 1000 years, associated with a period of intense meltwater production and rapid retreat
Within the study area, 84 % of sample locations captured a meltwater track (65 %) or meltwater channel (19 %). The remaining samples captured an esker ridge alone (6 %), captured an esker ridge with a lateral splay (6 %) or were deemed unclassified (4 %). However, subglacial meltwater signatures were not always mutually exclusive and often esker ridges or sometimes even eskers with lateral splay were recorded within the meltwater tracks and channels. Esker mapping by Storrar et al. (2013) was updated in the study area. Due to the higher-resolution data available and the smaller spatial area covered, smaller features which may have been missed could be included. A comparison between the updated esker map and the new meltwater routes map confirms the large-scale association between eskers and wider meltwater features which often flank and connect intervening segments. Eskers were recorded at 43 % of all sample locations. Where they were recorded, 87 % of the time they were flanked by a meltwater track, channel or splay.
Table 1Summary statistics for meltwater routes in the study area.
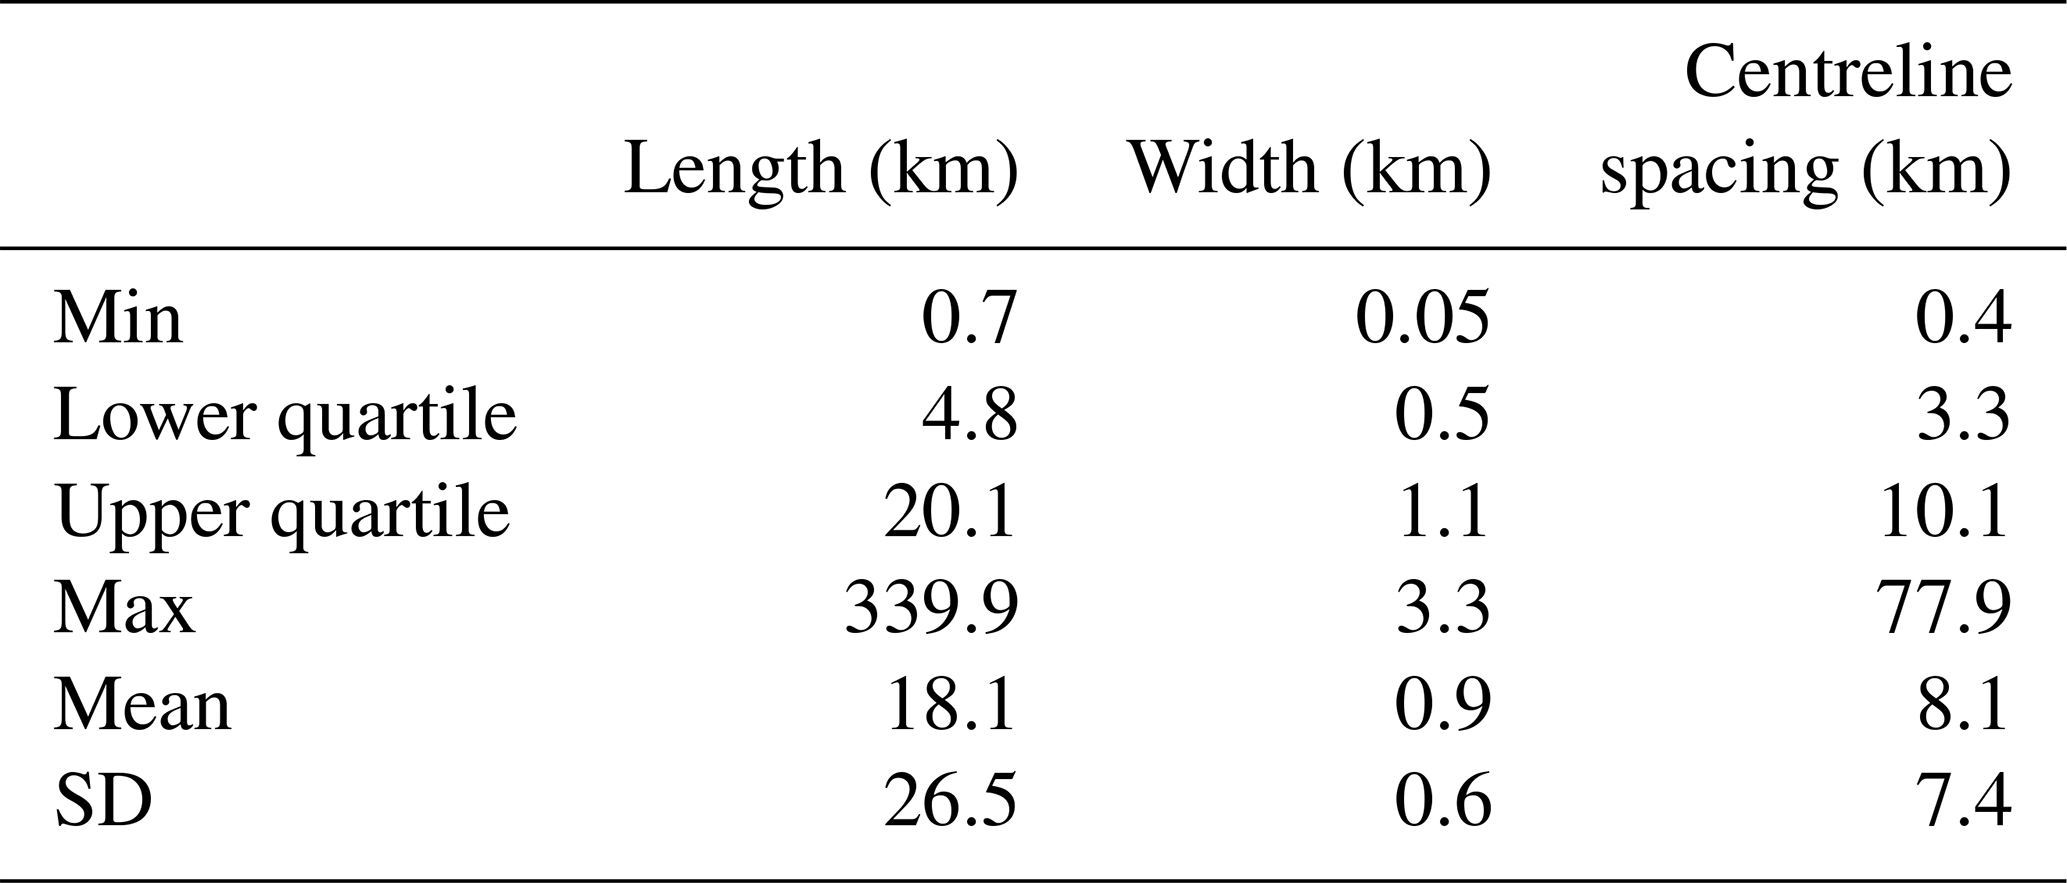
Meltwater routes reach a maximum of 3.3 km in width and 340 km in length (Table 1) but are noted to reach up to 760 km when they extend beyond the limits of the study area (Storrar et al., 2014a). Meltwater channels and meltwater tracks are typically an order of magnitude wider (mean width: 900 m) than the eskers which they often contain (mean width: 97 m). Meltwater routes appear to vary in width across the study area and along individual centrelines but show no clear trend from the ice divide towards the margin. If these landforms are assumed to have formed time transgressively, this would suggest no clear trend in width during deglaciation. Within the study area, adjacent centrelines are spaced on average 8 km apart (Table 1). This is at the lower end of the range reported in the literature (Fig. 6) (e.g. Banerjee and McDonald, 1975; St-Onge, 1984; Shilts et al., 1987; Hebrand and Amark, 1989; Bolduc, 1992; Boulton et al., 2009; Hewitt, 2011). This is not surprising given that we mapped all traces of subglacial meltwater flow including meltwater tracks not containing eskers. Like variations in width, there appears to be no coherent change in spacing during deglaciation (Fig. 4) if we assume time-transgressive formation.
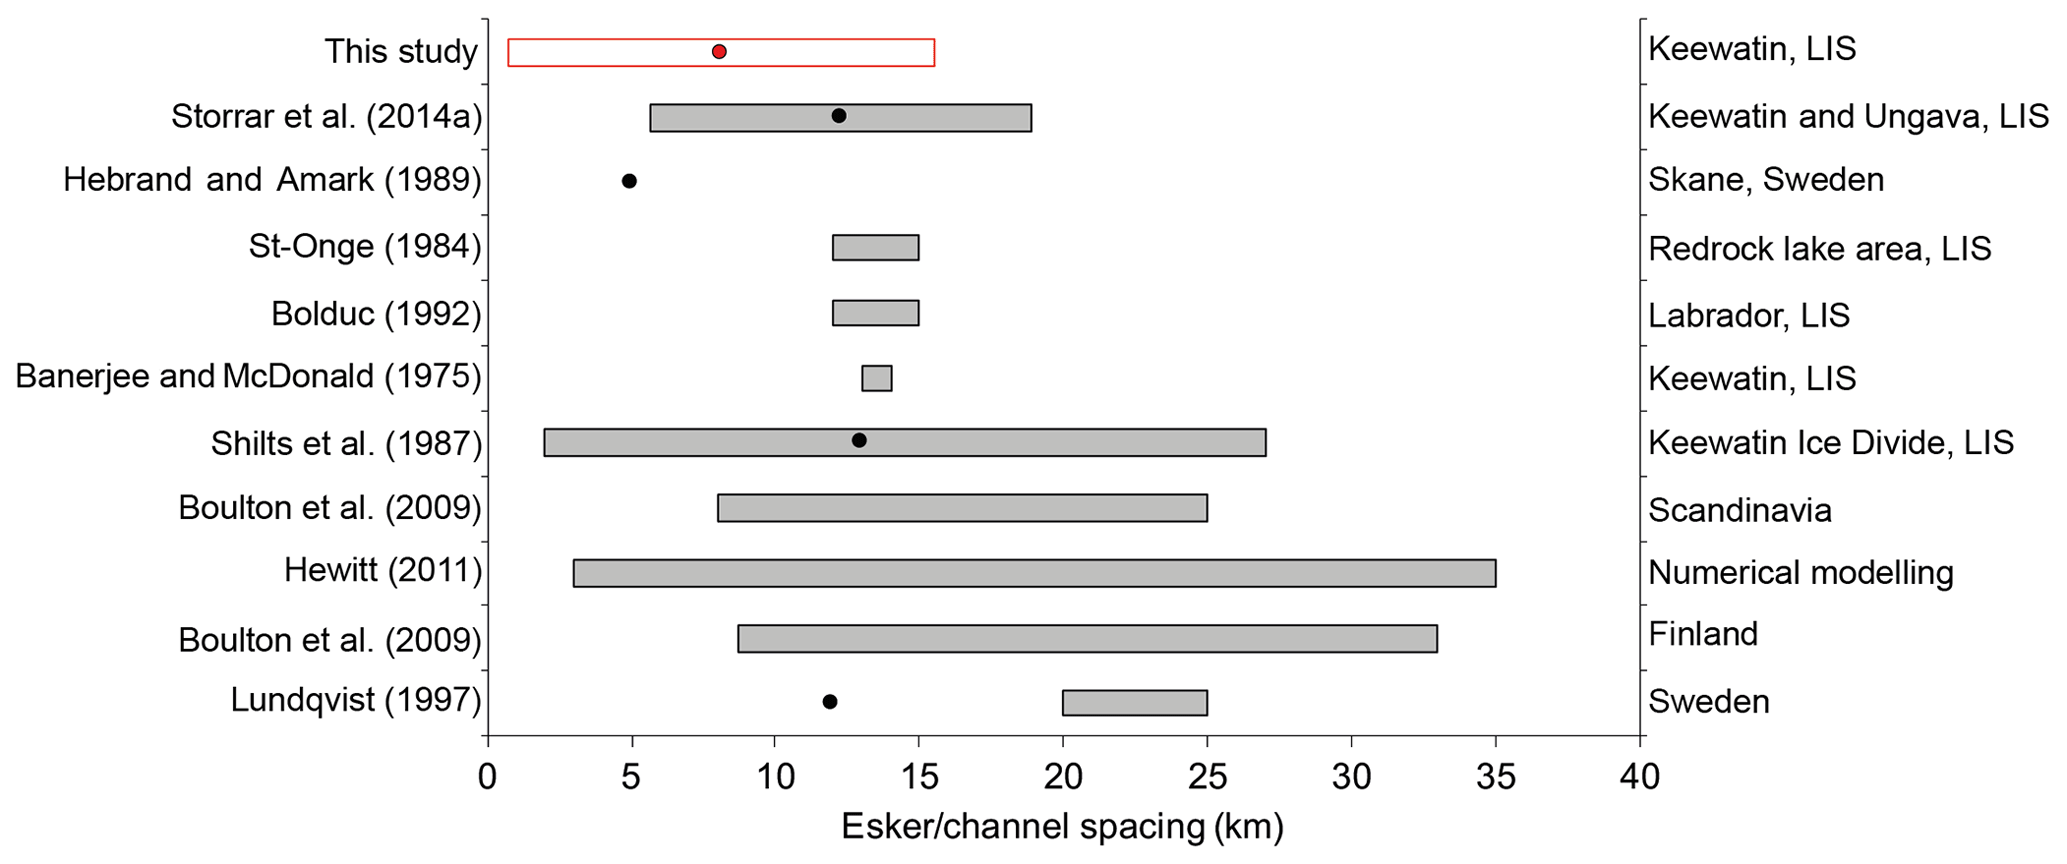
Figure 6Examples of esker and subglacial channel spacing quoted in the literature with bars representing maximum and minimum and the points the mean (Storrar et al. 2014a). The top two bars represent a large-scale esker sample taken from an area which includes this study (Storrar et al., 2014a) and the spacing recorded by all visible traces of subglacial meltwater (i.e. eskers and meltwater corridors). For these two, the bars represent standard deviation and the points the mean. (Modified from Storrar et al., 2014a).
Eskers have been widely mapped in northern Canada. Initial mapping was largely undertaken by the Geological Survey of Canada using aerial photography and field observations (e.g. Aylsworth and Shilts, 1989). This included mapping of esker systems – comprising a series of hummocks or short, flat-topped segments which phase downstream into relatively continuous esker ridges or occasionally beaded eskers – across 1.3 million km2 of the Keewatin sector of the LIS (Aylsworth and Shilts, 1989; Aylsworth et al., 2012). Discontinuous esker ridges are connected to areas of outwash, meltwater channels or belts of bedrock stripped free of drift. More recently, increasing availability of remotely sensed data allowed Storrar et al. (2013) to digitise eskers at an ice sheet scale for the LIS (including the Keewatin sector) using Landsat 7 ETM+ imagery. From this, a secondary dataset was derived by interpolating a straight line between successive aligned esker ridges, creating a continuous pathway, which reflects the location of the major conduits in which the eskers formed (Storrar et al., 2014a). This paper extends earlier work, which recognises links between eskers and broader traces of subglacial meltwater flow but does not explicitly describe or formally quantify them (e.g. Aylsworth and Shilts, 1989; Storrar et al., 2014a). It is encouraging that, despite different datasets and mapping procedures, the overall patterns are similar (Fig. 7).
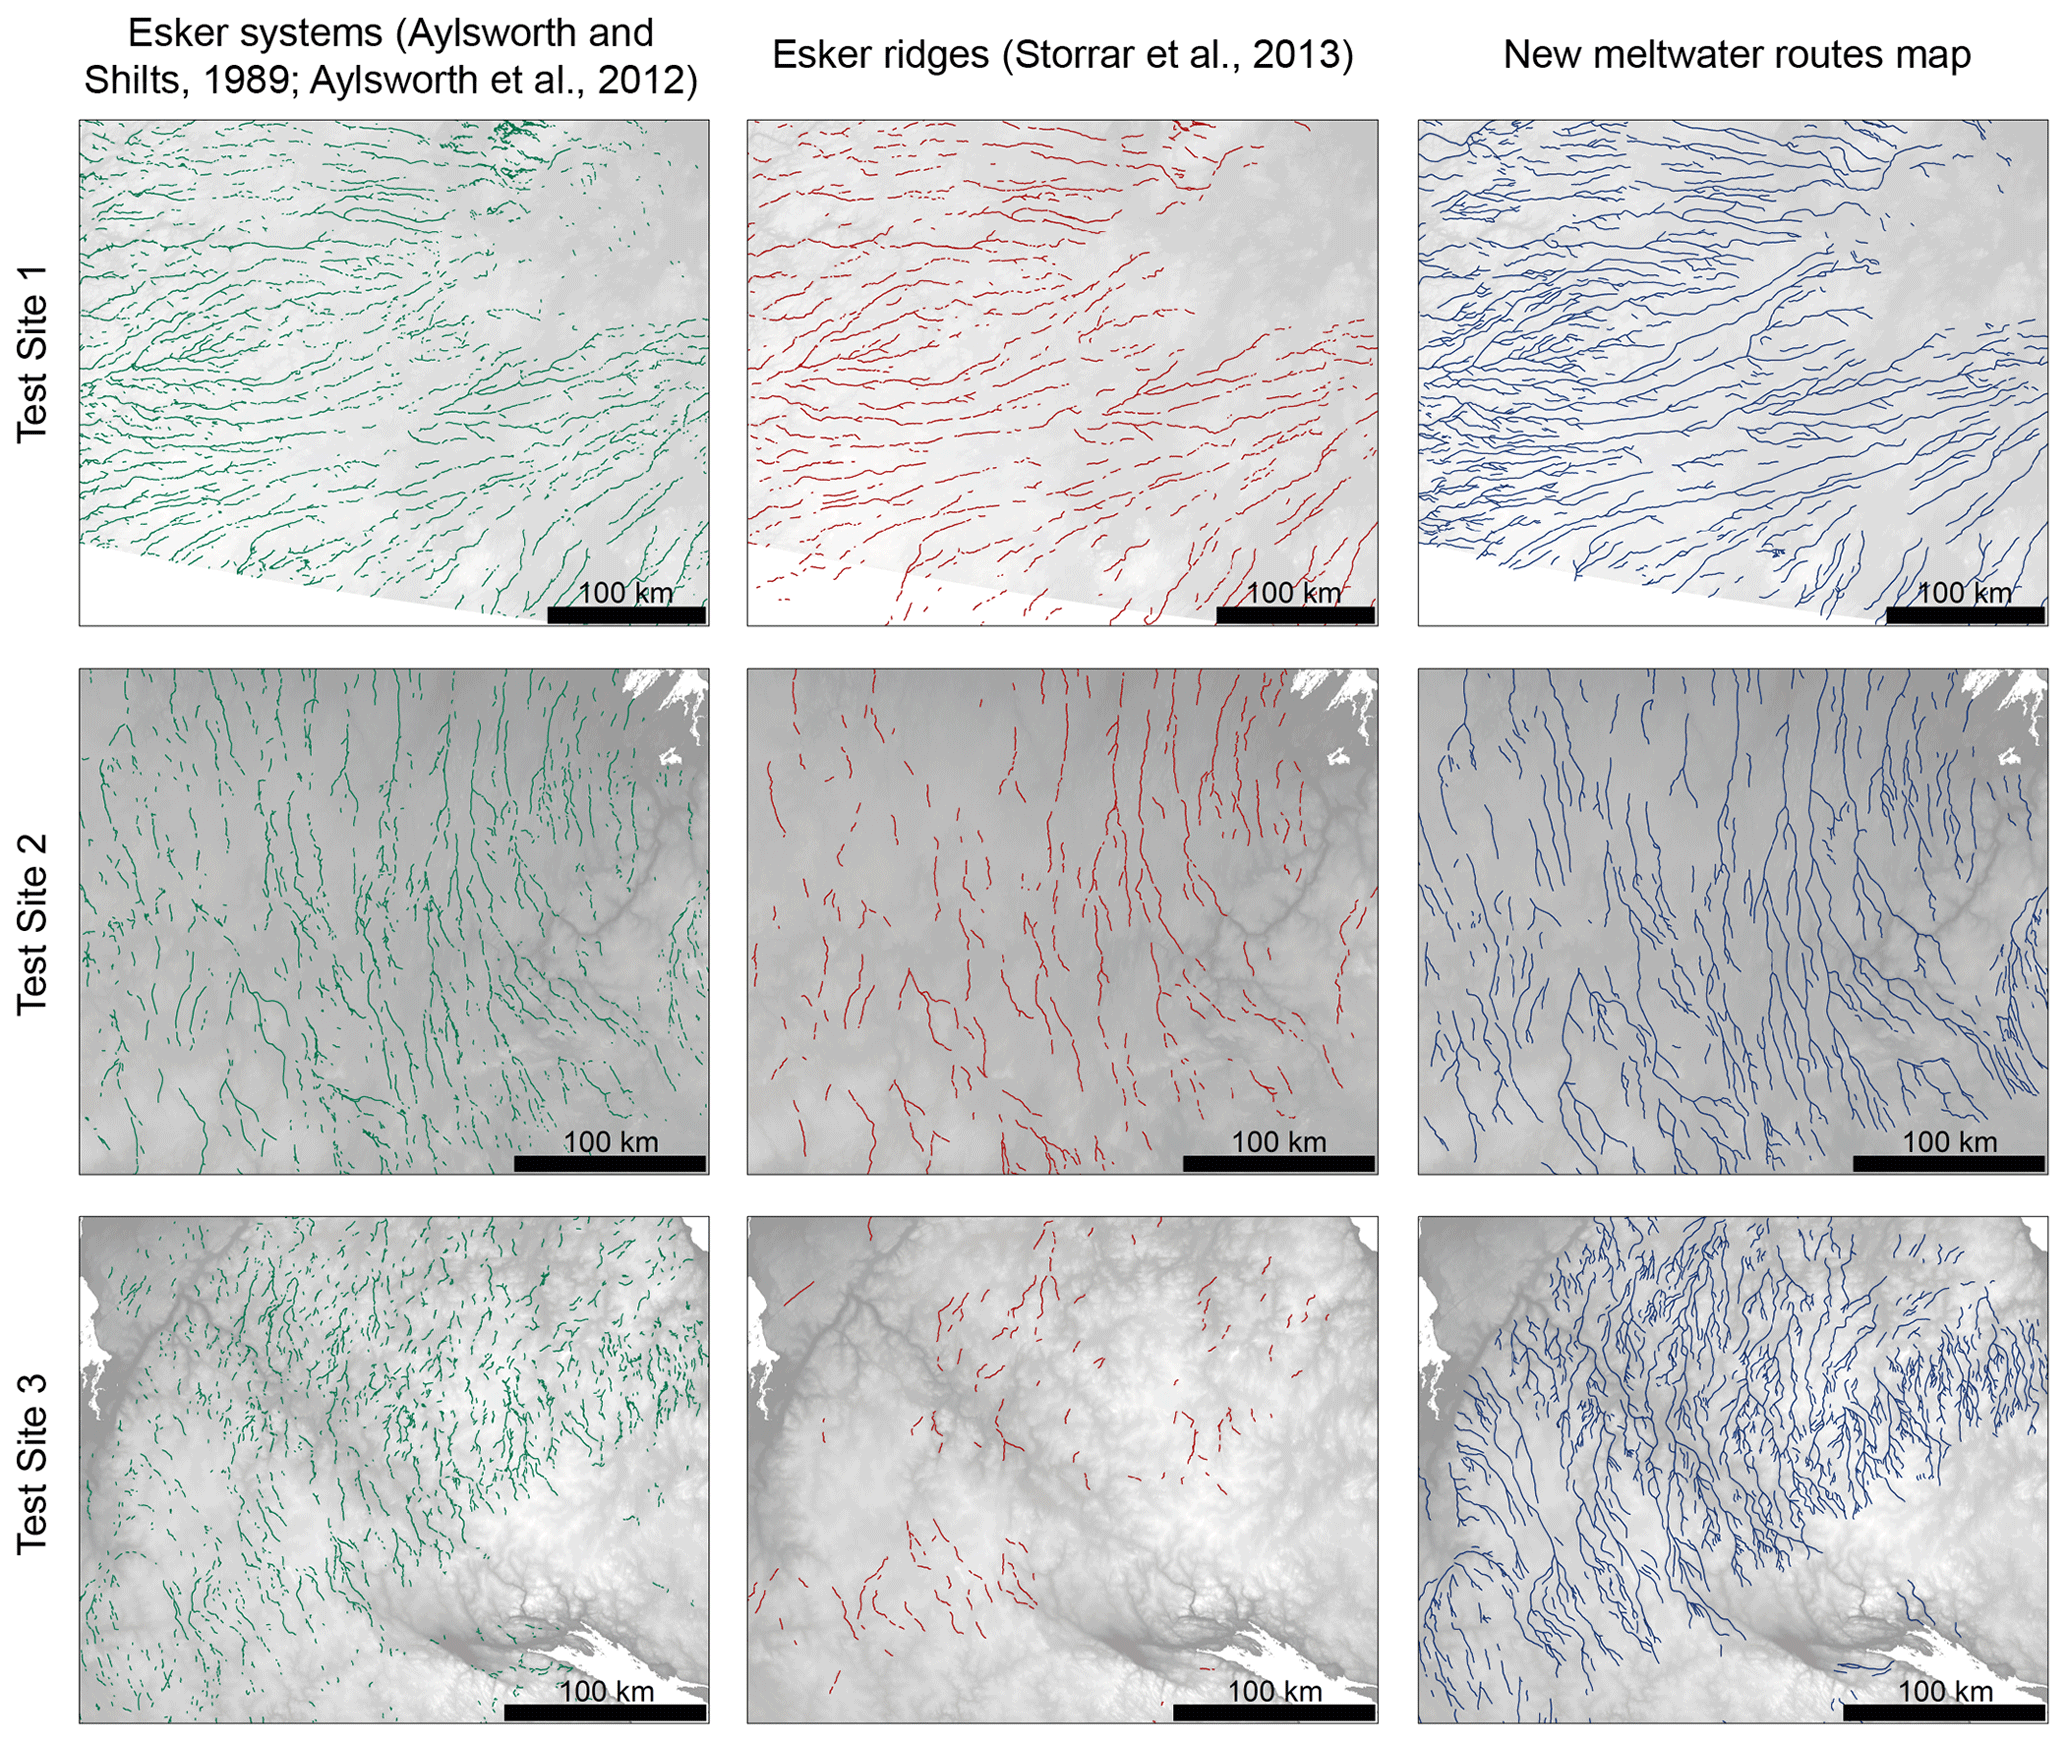
Figure 7Comparison of existing maps of esker systems (green) from air photo interpretation (Aylsworth and Shilts, 1989; Aylsworth et al., 2012), esker ridges (red) from Landsat imagery (Storrar et al., 2013) and the new meltwater routes from the ArcticDEM (blue). Mapping of meltwater routes includes all traces of subglacial meltwater flow (eskers, eskers with lateral splays, meltwater tracks and meltwater channels). The locations of test site 1, test site 2 and test site 3 are identified in Fig. 5. Digital elevation models (DEMs) created from the Canadian Digital Elevation Model (CDEM). © Ottawa, ON: Natural Resources Canada (2015).
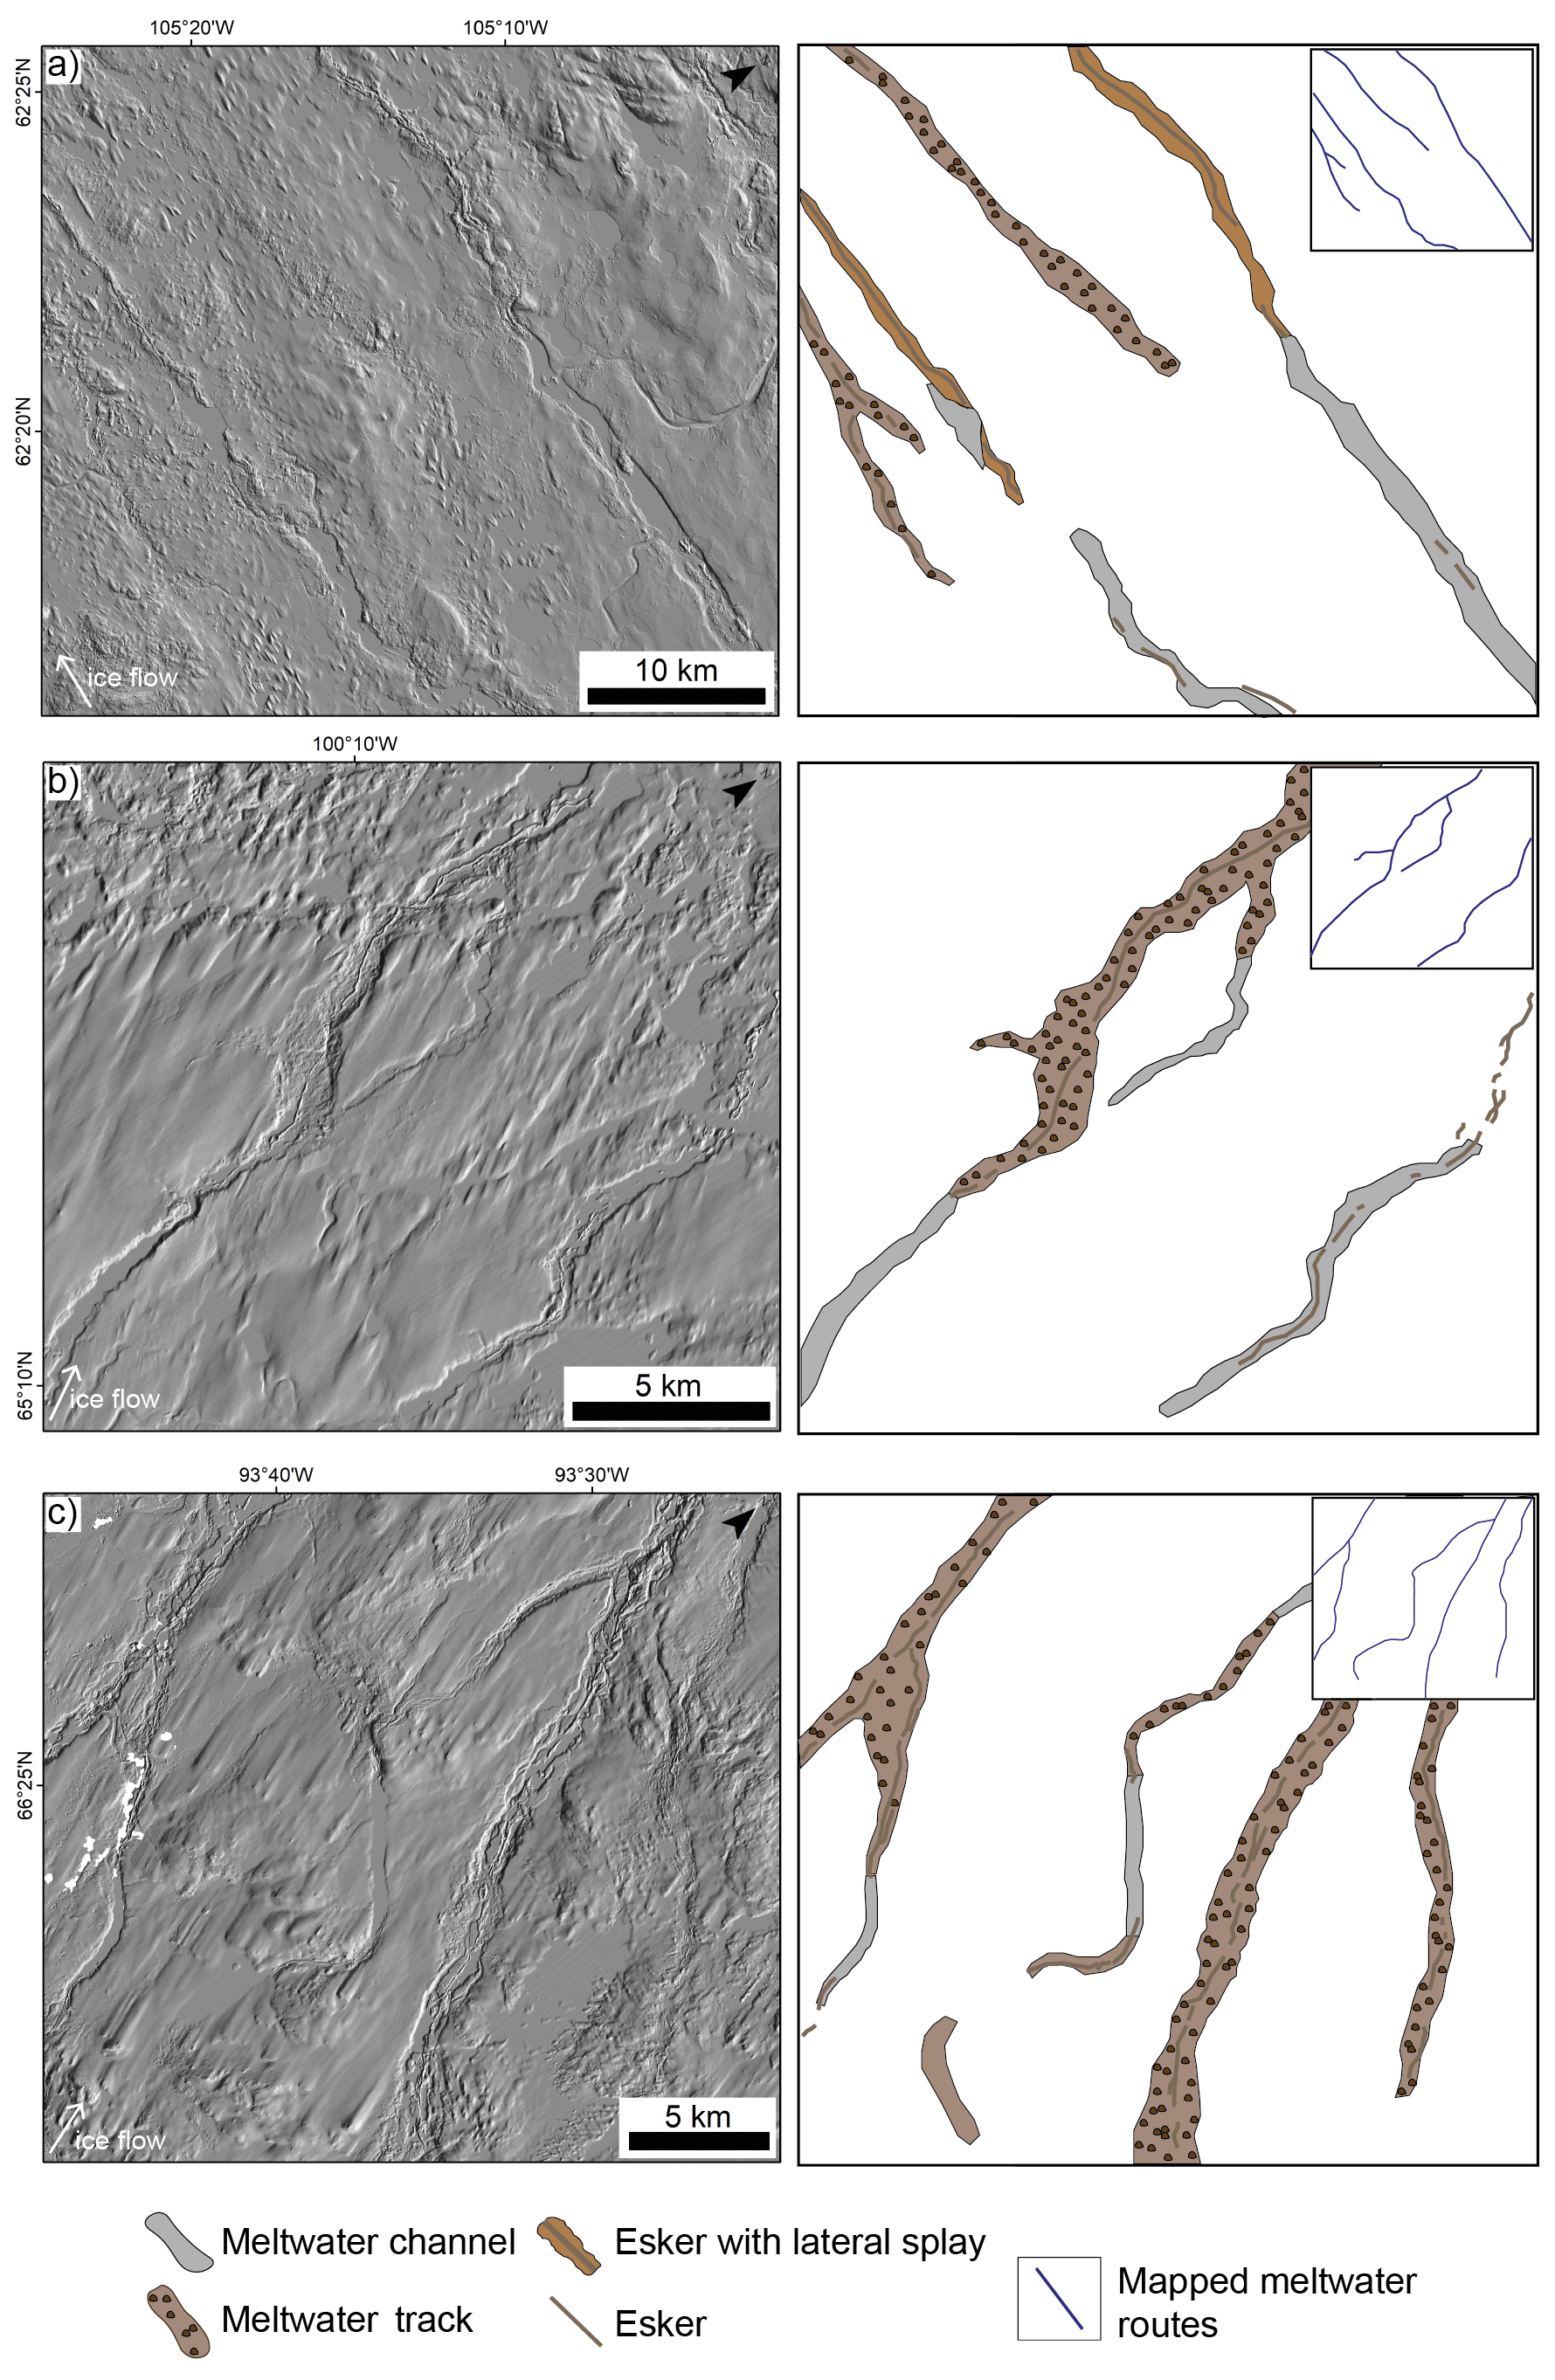
Figure 8Examples of transitions and associations along meltwater routes. The left panel shows the DEM and the right panel shows an interpretation of the feature types with an inset (top right) showing how meltwater routes are mapped as single lines through all types. White patches in the DEM represent areas of missing data due to the presence of hydrological features (e.g. lakes and rivers) or in areas of cloud cover and shadow. © DEM(s) created by the Polar Geospatial Center from DigitalGlobe, Inc. imagery.
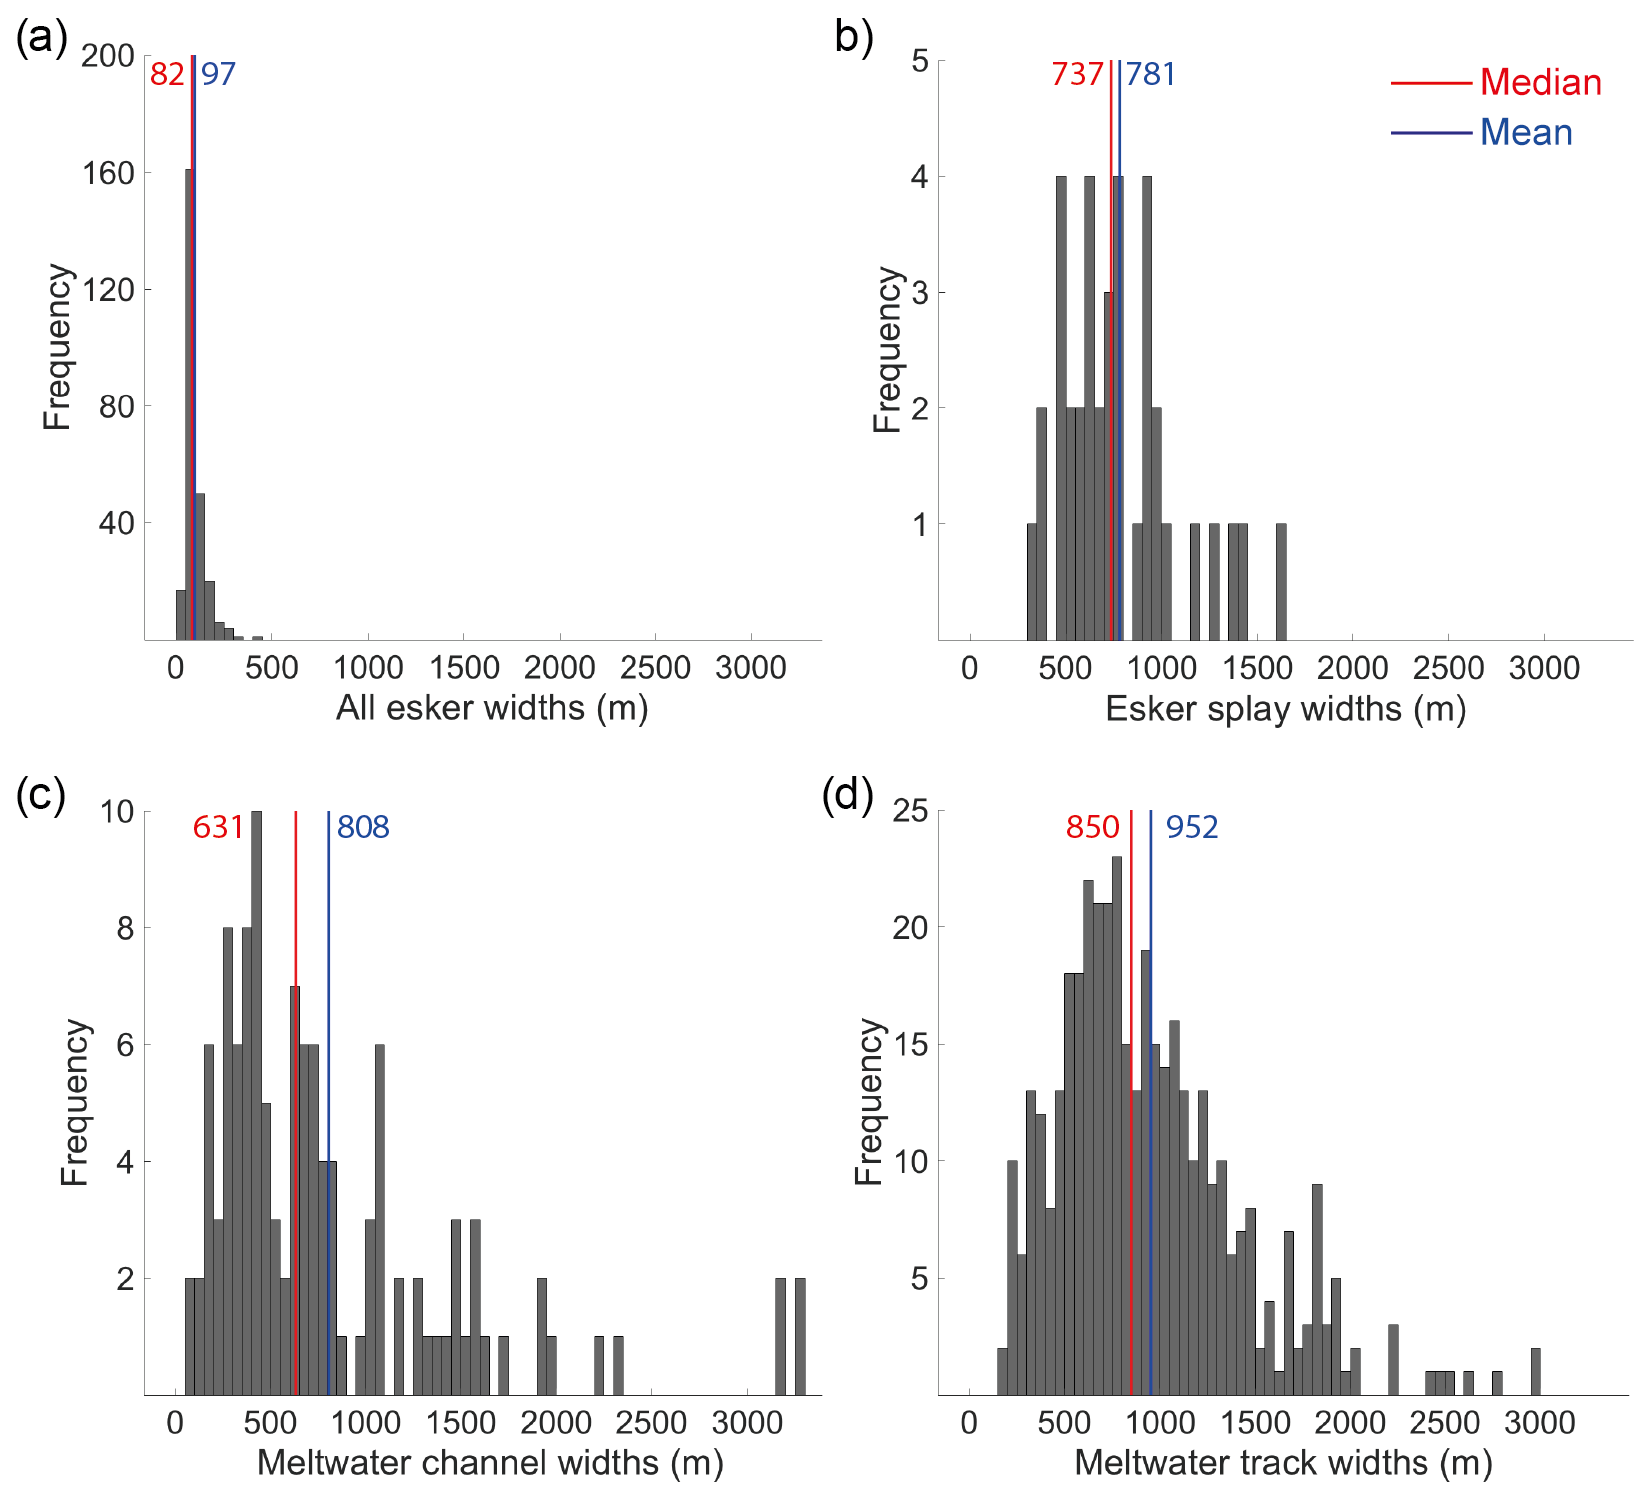
Figure 9Width distributions (in metres) of (a) all esker ridges (n=259), (b) eskers with lateral splays (n=37), (c) meltwater channels (n=118) and (d) meltwater tracks (n=408) from the whole study area. The median is marked in red and the mean in blue.
4.2 Geomorphological variations
Landforms along meltwater routes exhibit a high degree of geomorphic variability and each of the palaeo-meltwater landforms outlined in Sect. 1.1 (meltwater channels, meltwater tracks and eskers) are identified in the study area. Meltwater channels exhibit negative relief down to ∼ 30 m below their immediate surroundings (e.g. Fig. 2a). Meltwater tracks exhibit less pronounced (e.g. Fig. 2b–d) or even negligible relief (e.g. Fig. 2e–h), with the latter being identified due to the presence of elongated tracts of hummocks. Meltwater route edges vary from straight (e.g. Fig. 2a, e, h) to crenulated (e.g. Fig. 2c) and may be discontinuous along sections. A variety of landforms are found within the meltwater tracks and channels. These include hummocks of varying size, shape, and relief (e.g. Fig. 2e–h) as well as eskers and associated glaciofluvial material (e.g. Fig. 2a–d). In places, till may be entirely eroded, revealing patches of bedrock. Eskers display a high degree of variability along the meltwater routes with single, continuous ridges the exception rather than the norm. Meltwater routes vary in geomorphological expression both across flow, between adjacent routes, and along flow, with multiple transitions to and from different feature types (Fig. 8).
Despite variations in expression (e.g. relief, definition, and the presence or absence of hummocks, glaciofluvial material, and eskers), meltwater tracks and meltwater channels are both associated with eskers (Fig. 2) and form an integrated and coherent large-scale spatial pattern (Fig. 5). Furthermore, both features have a qualitatively similar width range of several hundred metres to ∼ 3 km (Fig. 9). However, the null hypothesis that the data in each pairing are from the same continuous distribution using the two-sample Kolmogorov-Smirnov test could not be rejected for any pairings (esker, esker with splay, meltwater channel and meltwater track) at the 5 % significance level.

Figure 10Substrate control on geomorphological expression. Occurrence (percentage of length) and relative abundance of different meltwater features over varying surface substrates (Fulton, 1995) and background geology (Wheeler et al., 1996). “Other” includes marine, lacustrine and glaciofluvial sediments. Blue represents over representation and red represents under representation.
4.3 Controls on the width and expression of meltwater landforms
Most subglacial meltwater landforms occur within areas of till (Fig. 10). Meltwater tracks, meltwater channels and eskers with lateral splays are over-represented in areas of till blanket, while esker ridges are strongly under-represented. Meltwater features appear most commonly over areas of metamorphic bedrock, although meltwater channels (incisional features) are over-represented on more erodible sedimentary rocks.
Figure 11 reveals high topographic variability in the NE of the study area. This coincides with the highest density of meltwater routes. Palaeo-ice streams are rare in the Keewatin District region (Stokes and Clark, 2003a, b; Margold et al., 2018), but where they do occur, meltwater routes are noticeably sparser (Fig. 12). Comparing the spatial density of meltwater routes inside and outside of the ice streams (calculated simply as total length of meltwater routes per unit area) shows that the two datasets are statistically different (p=0.03). On the bed of the Dubawnt Lake Ice Stream, meltwater routes also exhibit a more dendritic arrangement and extend further towards the ice divide.
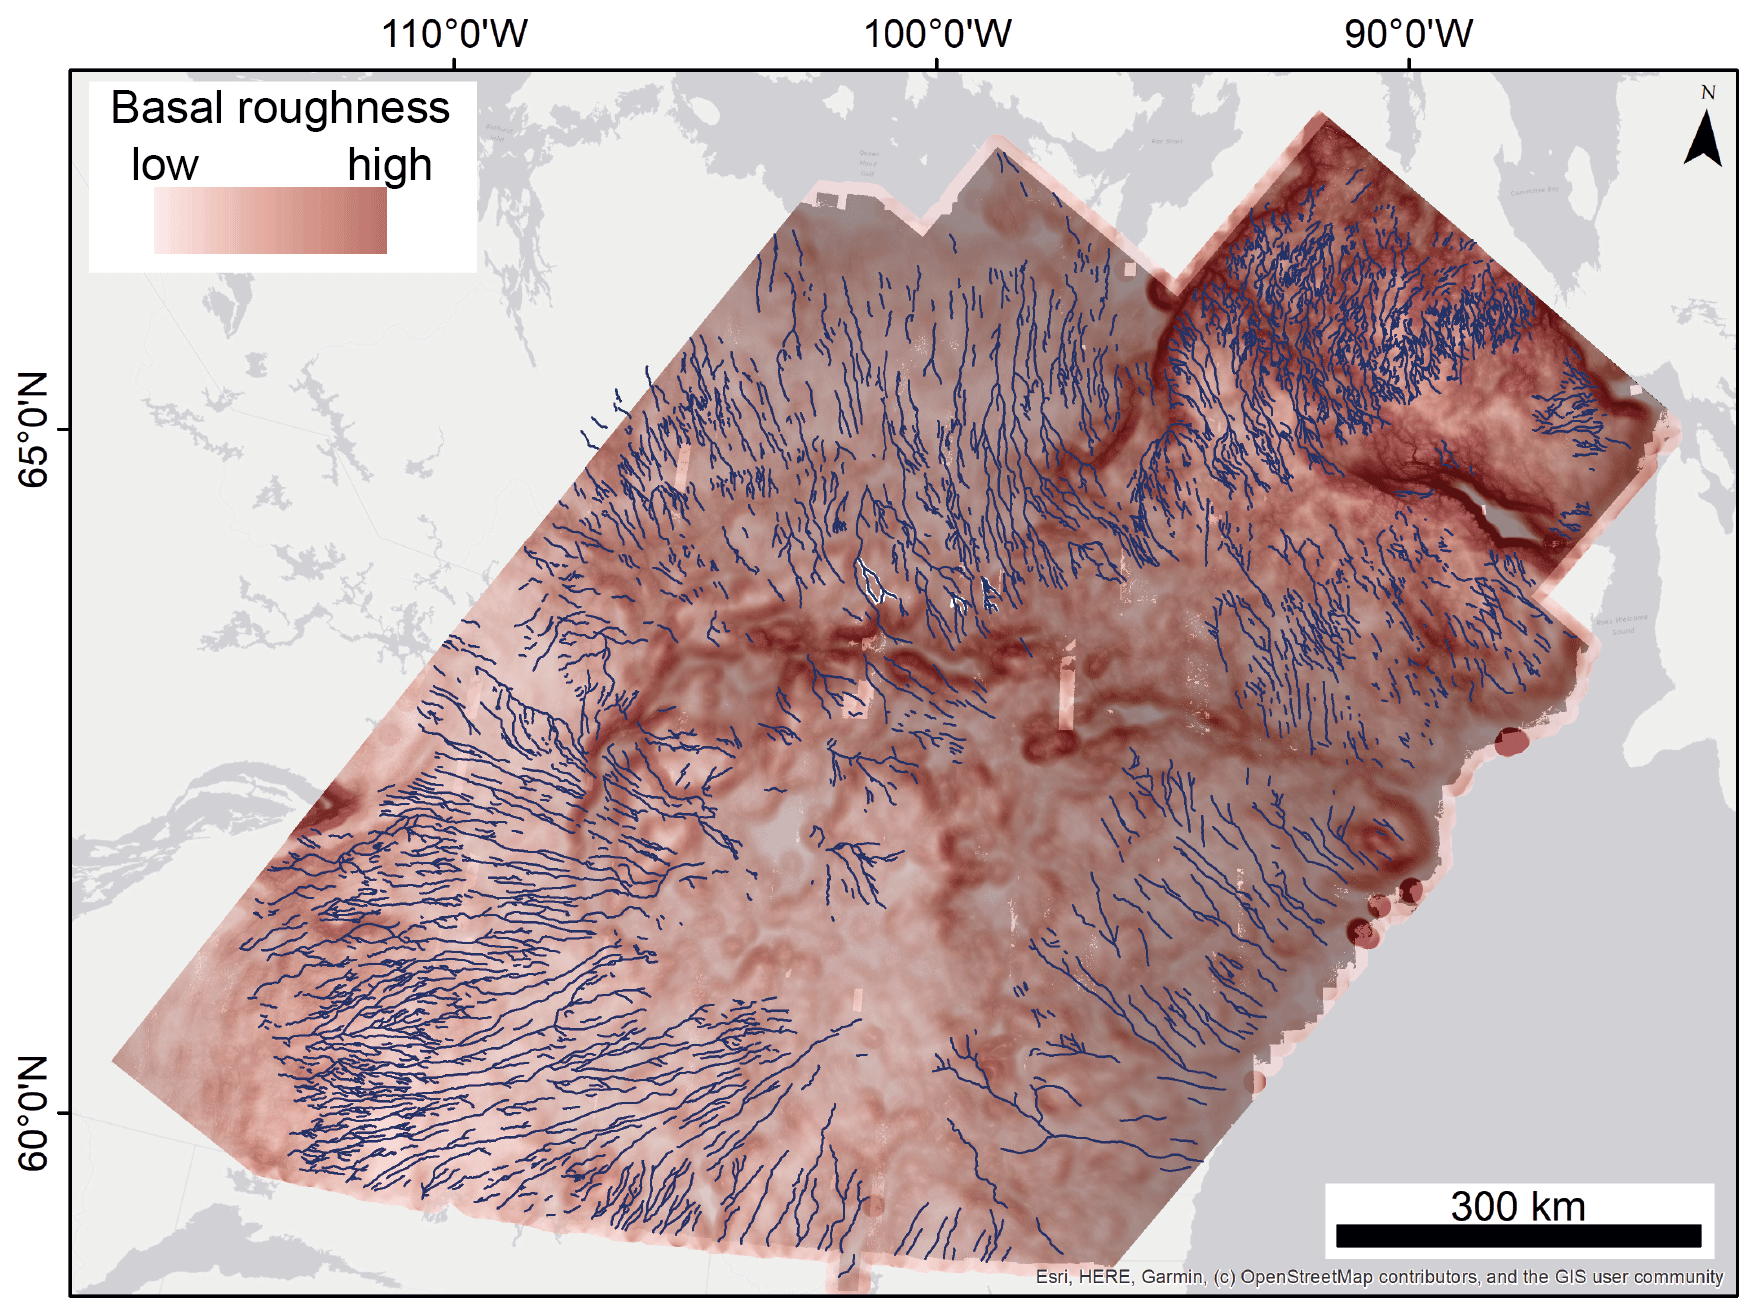
Figure 11Meltwater routes overlain on local bed roughness calculated for the approximate wavelength expected to be relevant for the transfer of basal undulations to the ice surface. This is where the densest surface meltwater networks and ponding is likely to occur given sufficient melt conditions (Ignéczi et al., 2018). © DEM created by the Polar Geospatial Center from DigitalGlobe, Inc. imagery.
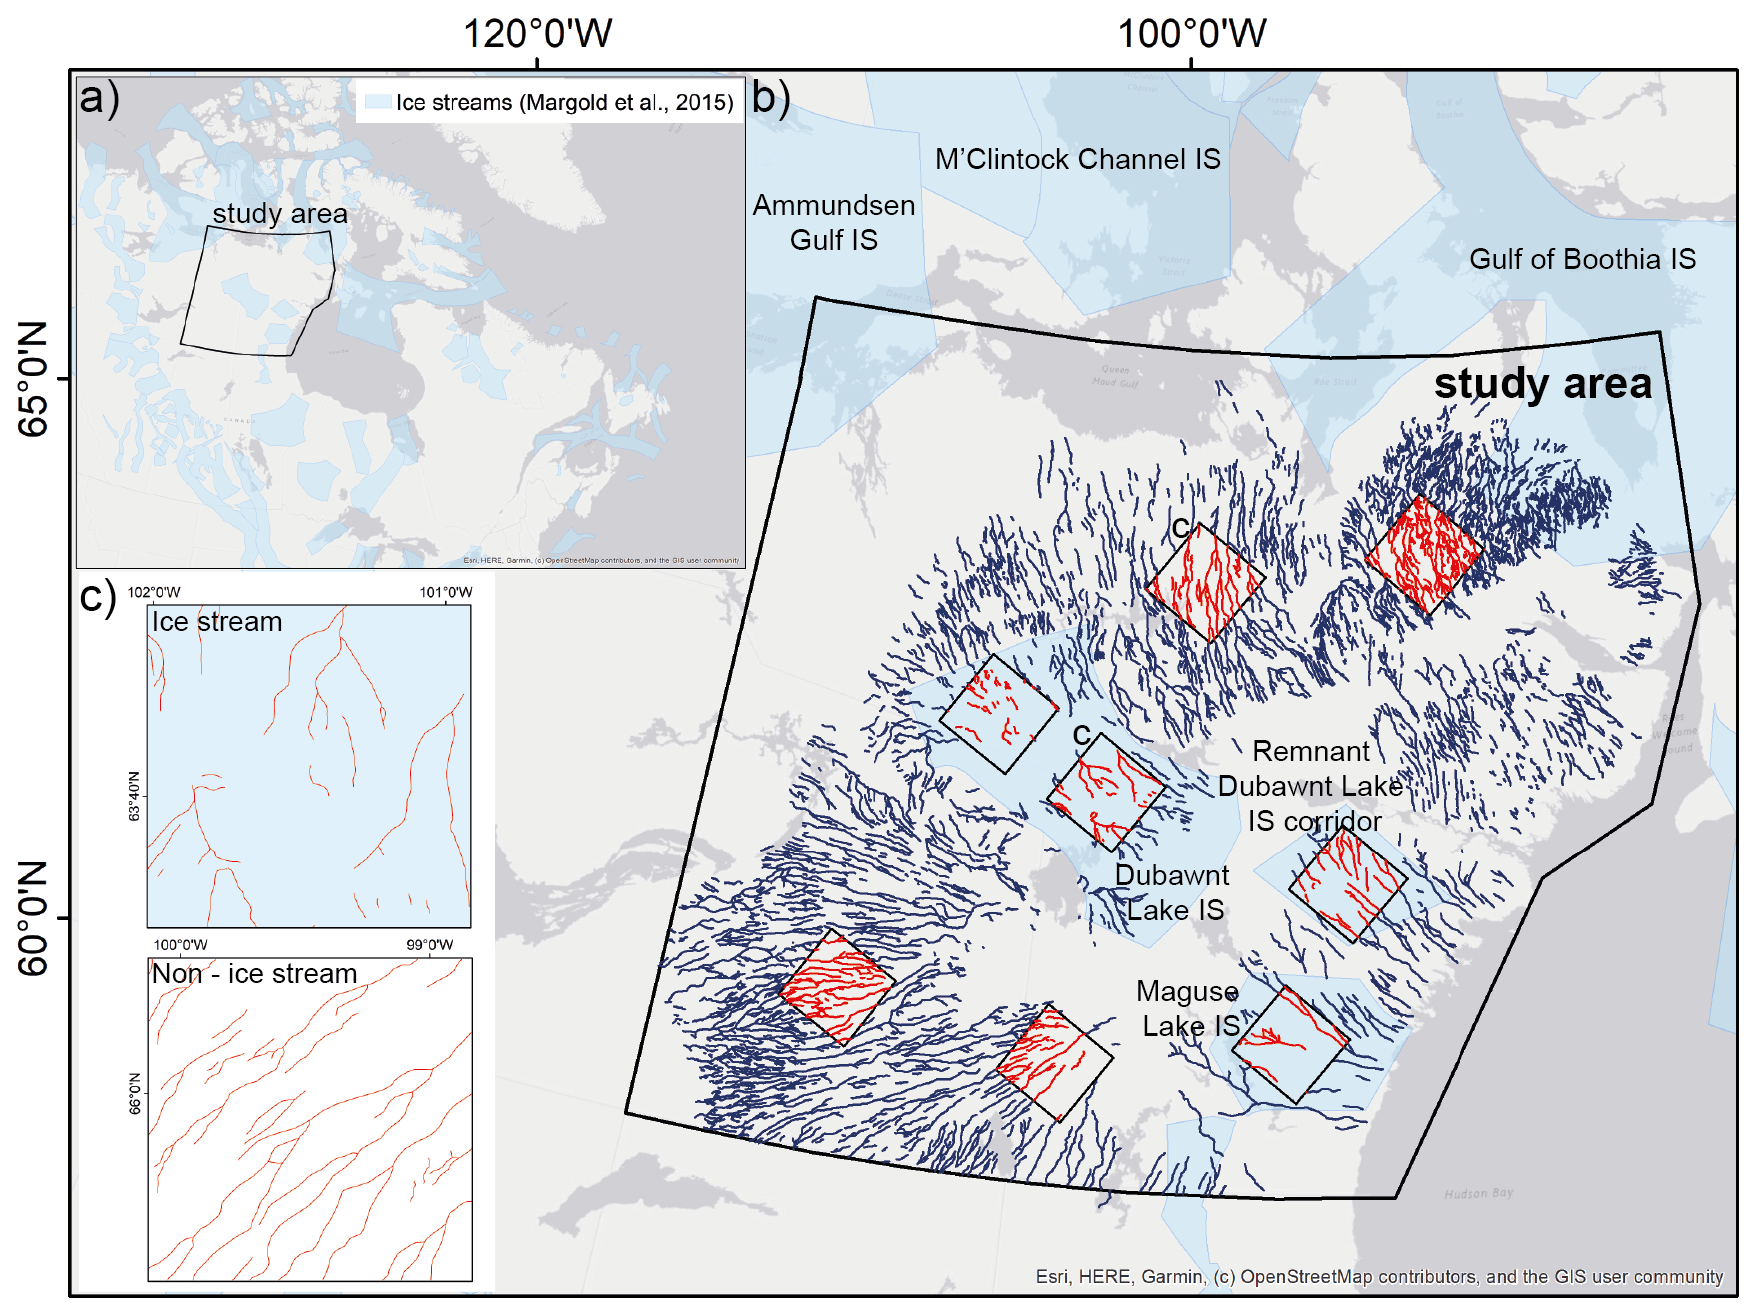
Figure 12(a) Comparison of meltwater routes and palaeo-ice streams (Margold et al., 2015); (b) spatial density was calculated for each of the randomly placed sample boxes (100×100 km). Ice stream density was compared to the non-ice stream density using a two-sample t test. The null hypothesis is rejected at the 5 % significance level (p=0.03); (c) visual comparison between meltwater routes in ice stream and non-ice stream areas.
To explore potential controls that govern how meltwater landform expression changes with variable background conditions (e.g. substrate, geology, topography), measurements of width, feature type and substrate were extracted along individual meltwater routes (Fig. 13). Although there is not a consistent ratio between esker width and the associated width of the meltwater track or meltwater channel when measured at the same location, there is a general positive relationship between the two, specifically when following topographic steps (e.g. Fig. 13a and d) and after the merging of tributaries (e.g. Fig. 13b and d). In Fig. 13a for example, a large increase in width (883–1550 m) is associated with an increase in elevation (∼ 70 m over 6 km), which also coincides with a transition from a strongly negative feature (a meltwater channel) to a positive relief depositional feature (esker with lateral splay). This sharp transition may be related to the emergence of the meltwater route out of the Thelon sedimentary basin.
Our new meltwater routes map shows that meltwater tracks and meltwater channels, which flank and connect (in an along-flow direction) esker ridges, are a dominant part of the landscape across the former Keewatin sector of the LIS. Mapping complete drainage pathways means we are better able to identify regional meltwater drainage patterns and unravel controls on feature expression.
The large-scale distribution and pattern of meltwater tracks and meltwater channels exhibit several key similarities, including width, spacing, association with eskers, and occurrence within an integrated network characterised by transitions to and from different expressions along individual meltwater routes (Fig. 8). Together, this provides strong evidence that these meltwater landforms are varying expressions of the same phenomenon, and we therefore group these features with widths in the order of hundreds to thousands of metres and term them meltwater corridors (Table 2). This is consistent with previous conceptual work linking meltwater landforms. For example, Sjogren et al. (2002) identify various tunnel valley (meltwater channel) expressions that they attribute to different developmental stages, from discontinuous through to fully developed valleys. Peterson and Johnson (2018) suggest that negative relief hummock corridors (meltwater tracks) are a type of tunnel valley and positive relief hummock corridors are equivalent to glaciofluvial corridors in Canada (e.g. Utting et al., 2009).
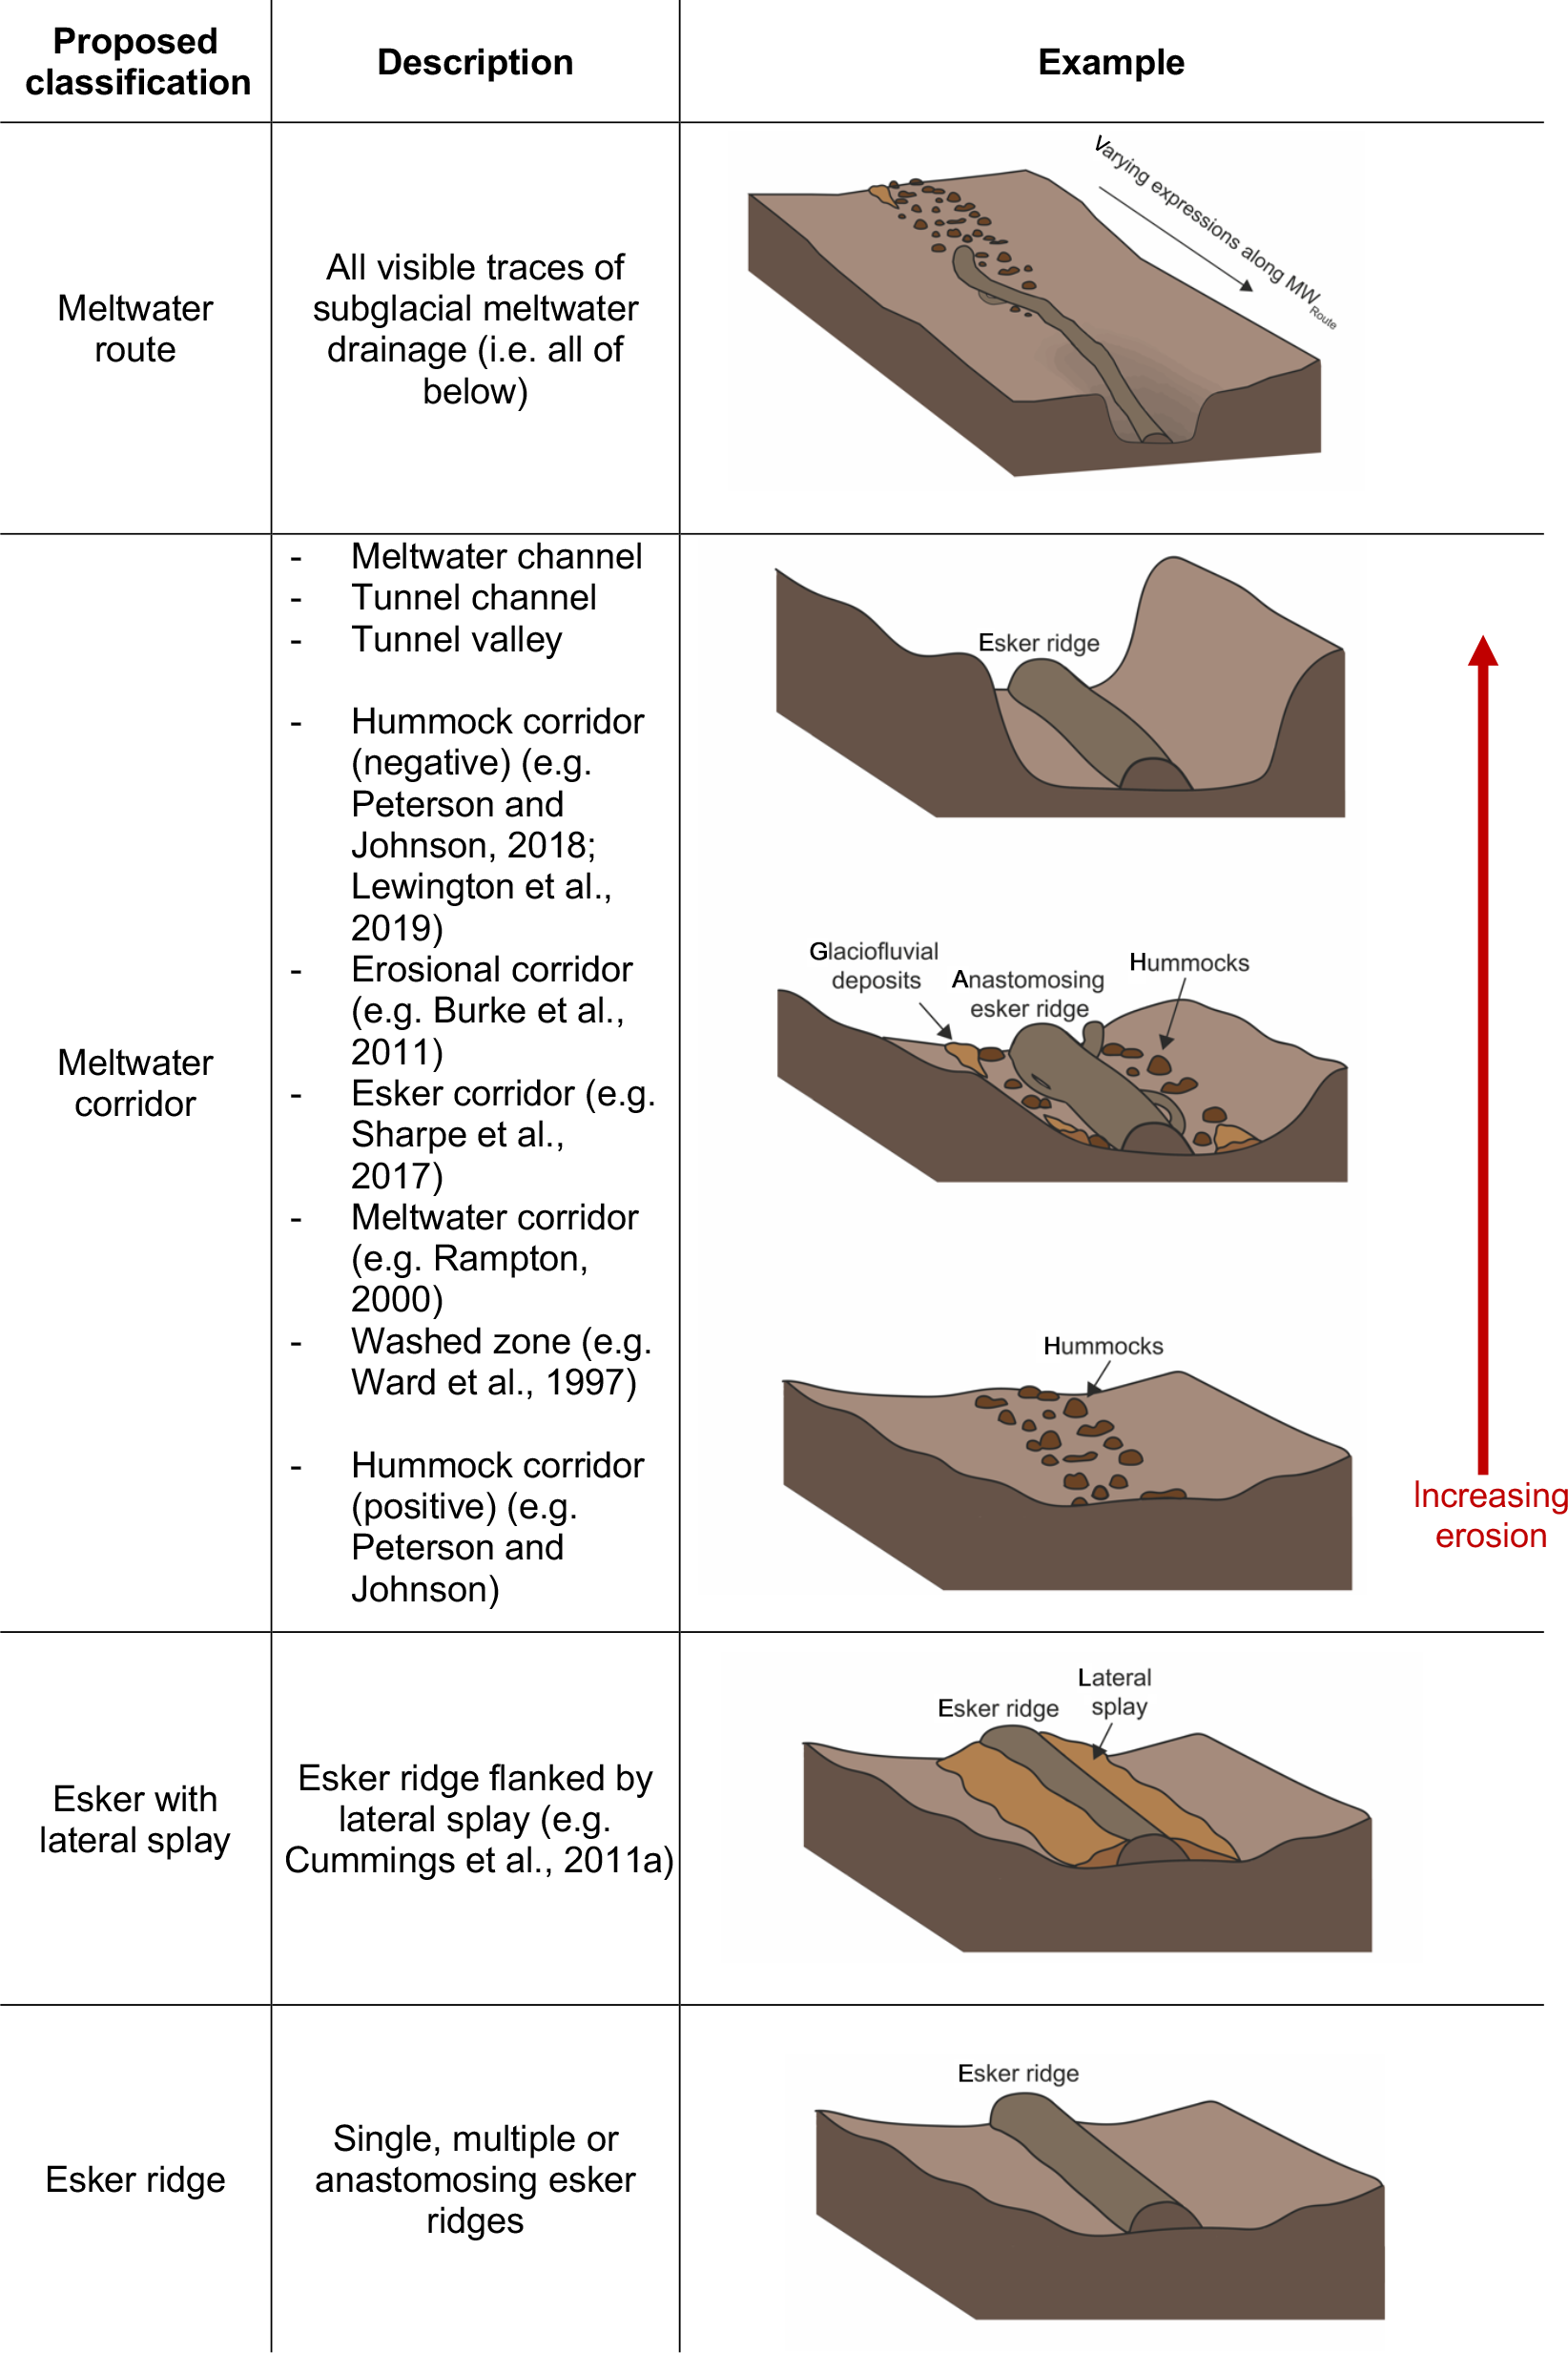
Table 2Proposed classification for subglacial meltwater traces observed on palaeo-ice-sheet beds. Meltwater routes encompass all visible evidence and consist of negative and negligible relief meltwater corridors with widths in the order of hundreds of metres and esker ridges with widths in the order of tens of metres.
Esker splays also have similar widths and a close spatial association with meltwater corridors (e.g. transitions along flow or occurring within meltwater corridors). However, it is possible that some or even all of these features were deposited marginally (e.g. Hebrand and Amark, 1989) rather than in subglacial cavities. In fact, marginal deposition is supported by the fact that some of the esker splays align across flow in line with estimated ice sheet isochrones (Dyke et al., 2003). Nonetheless, it is difficult to constrain their formation from geomorphology alone.
While recognised previously in local case studies (e.g. St-Onge, 1984; Rampton, 2000; Utting et al., 2009), we confirm that across this 1 million km2 area of the former LIS, meltwater corridors of varying geomorphic expression are widespread (captured at 84 % of all sample points) rather than an isolated phenomenon. Esker ridges are captured at just 43 % of sample locations; however, we do note that the presence or absence of an esker at the sample point may not be indicative of the entire length of the meltwater route as in many cases the esker ridges within a meltwater corridor are fragmented. Nonetheless, we suggest that the model of R channels across the Canadian Shield (e.g. Clark and Walder, 1994) is an oversimplification and may under-represent the modes and thus coverage of drainage in this sector and fail to capture important processes recorded on the bed.
Holistic mapping of meltwater routes including features cut up into the ice (i.e. eskers) and features cut down into the bed (i.e. meltwater corridors) creates a more complete and less fragmented drainage map than mapping individual features (Fig. 7). The broad-scale pattern of palaeo-drainage radiating out from the former Keewatin Ice Divide, which remains noticeably absent of meltwater evidence (Fig. 5), is consistent with previous studies (Shilts et al., 1987; Aylsworth and Shilts, 1989; Storrar et al., 2013, 2014a), but our mapping results in a greater density, narrower spacing (Fig. 6) and higher number of tributaries.
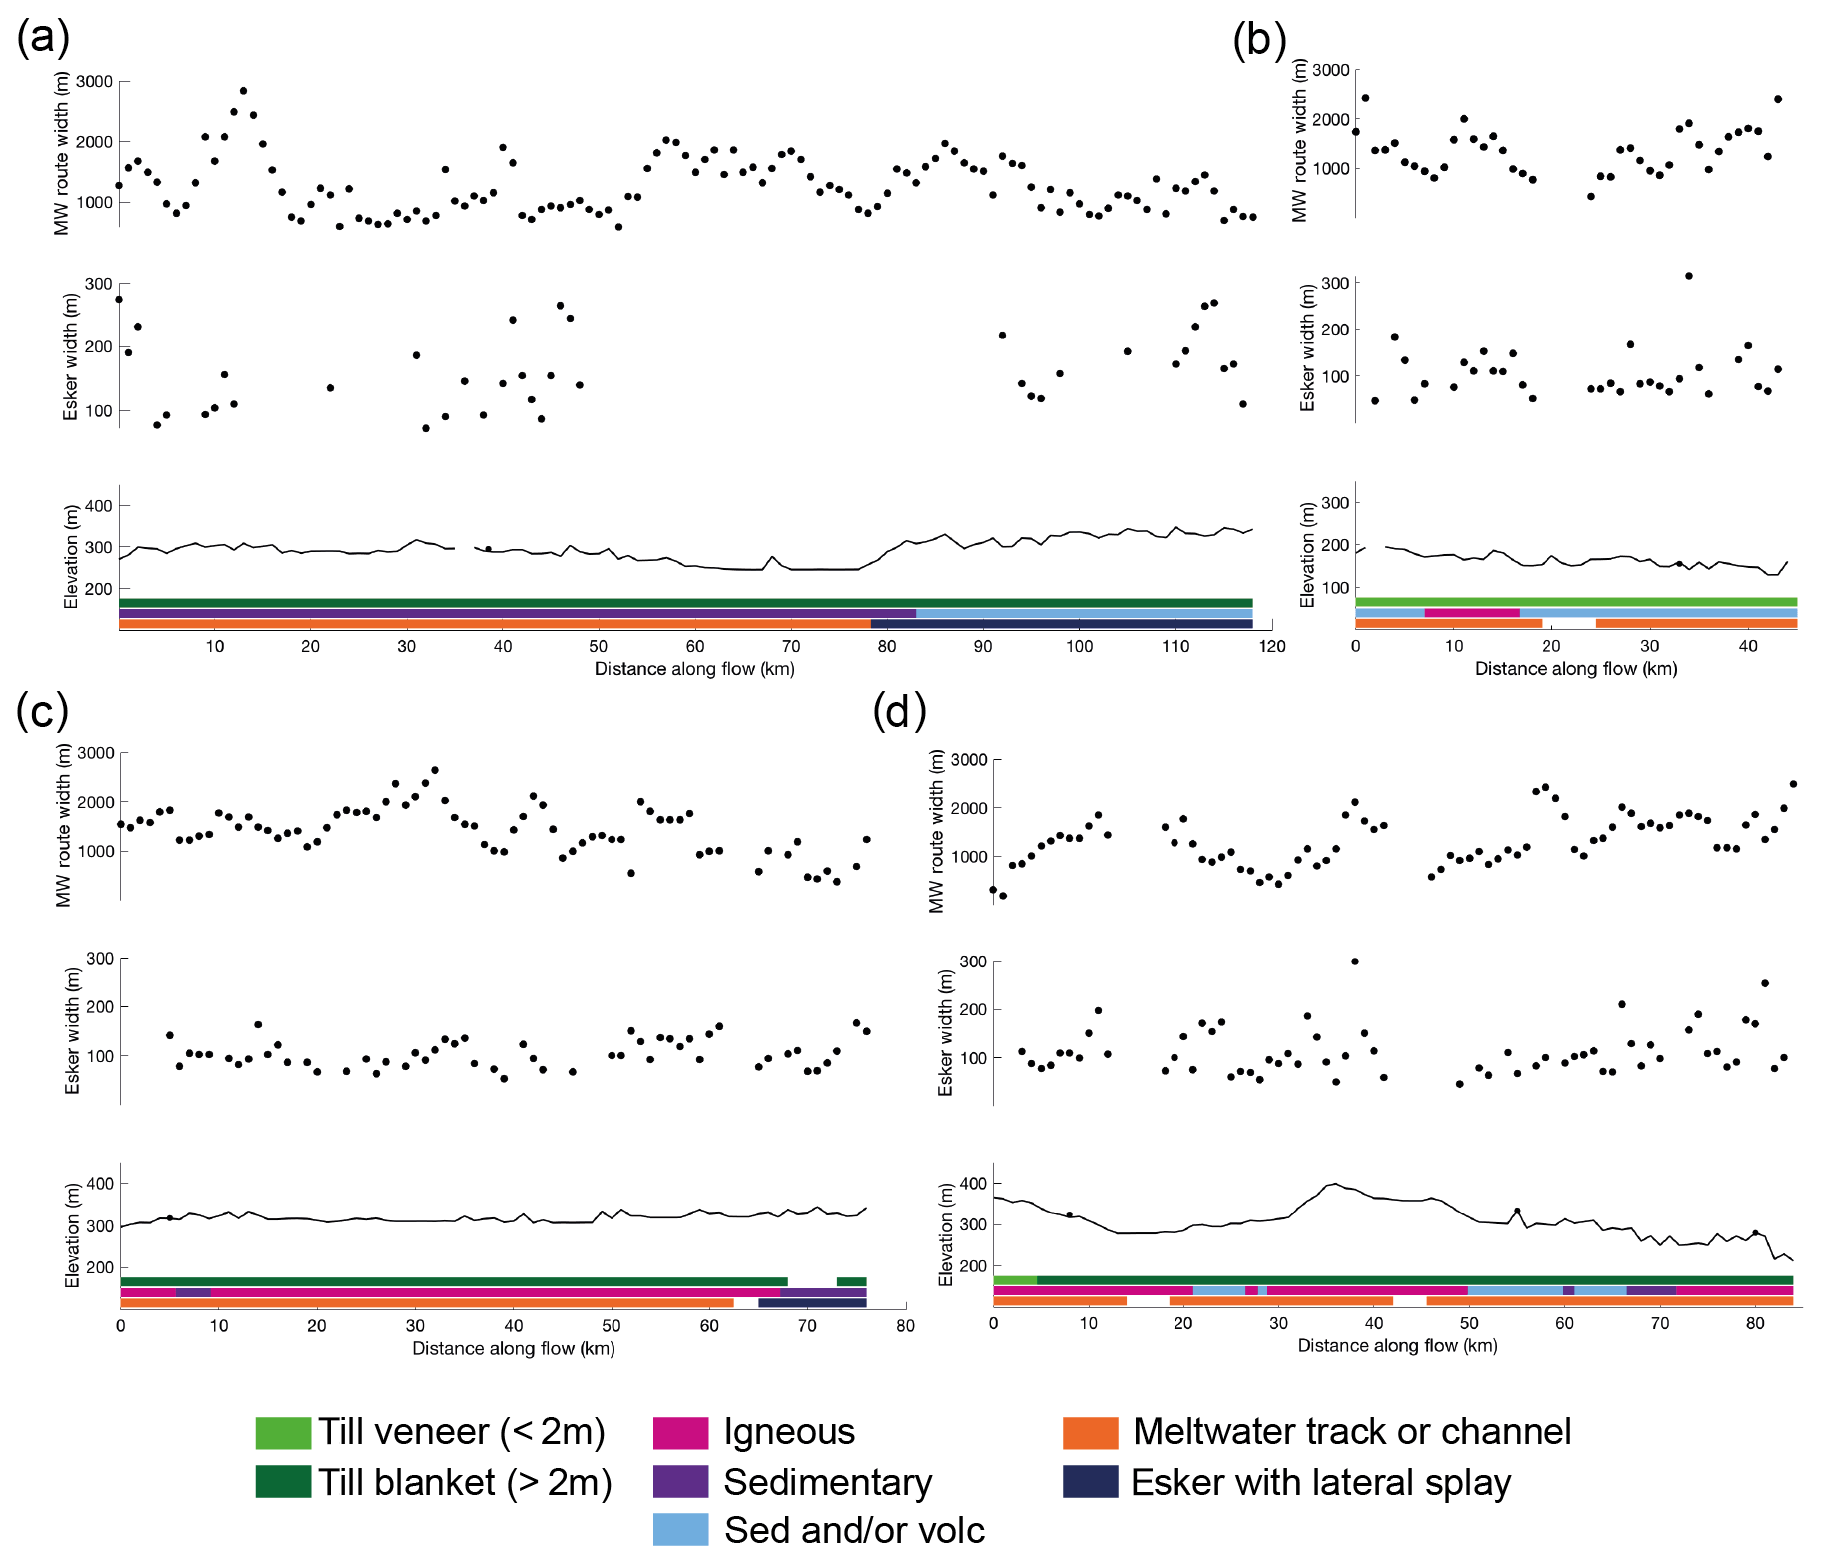
Figure 13Exploring local-scale controls on meltwater route width and type. Detailed profiles (sampled at 1 km intervals along individual meltwater routes; location identified in green in Fig. 5) show how esker width, elevation, feature expression and surface substrate vary along flow from the interior (left) to the exterior (right). Black points on the elevation plot represent the location of joining tributaries.
5.1 Proposed model for meltwater corridor formation
To interpret palaeo-landforms and reconstruct subglacial meltwater behaviour an understanding of the processes that formed the landforms is needed. This is the “glacial inversion” problem (e.g. Kleman and Borgström, 1996). One approach to understanding glacial processes is through contemporary observations. In this section, we demonstrate how contemporary observations and modelling of the hydraulically connected distributed drainage system (e.g. Hubbard et al., 1995; Bartholomaus et al., 2008; Andrews et al., 2014; Hoffman et al., 2016) is consistent with the form and distribution of mapped meltwater corridors and can explain the range of depositional to erosional signatures observed in the study area.
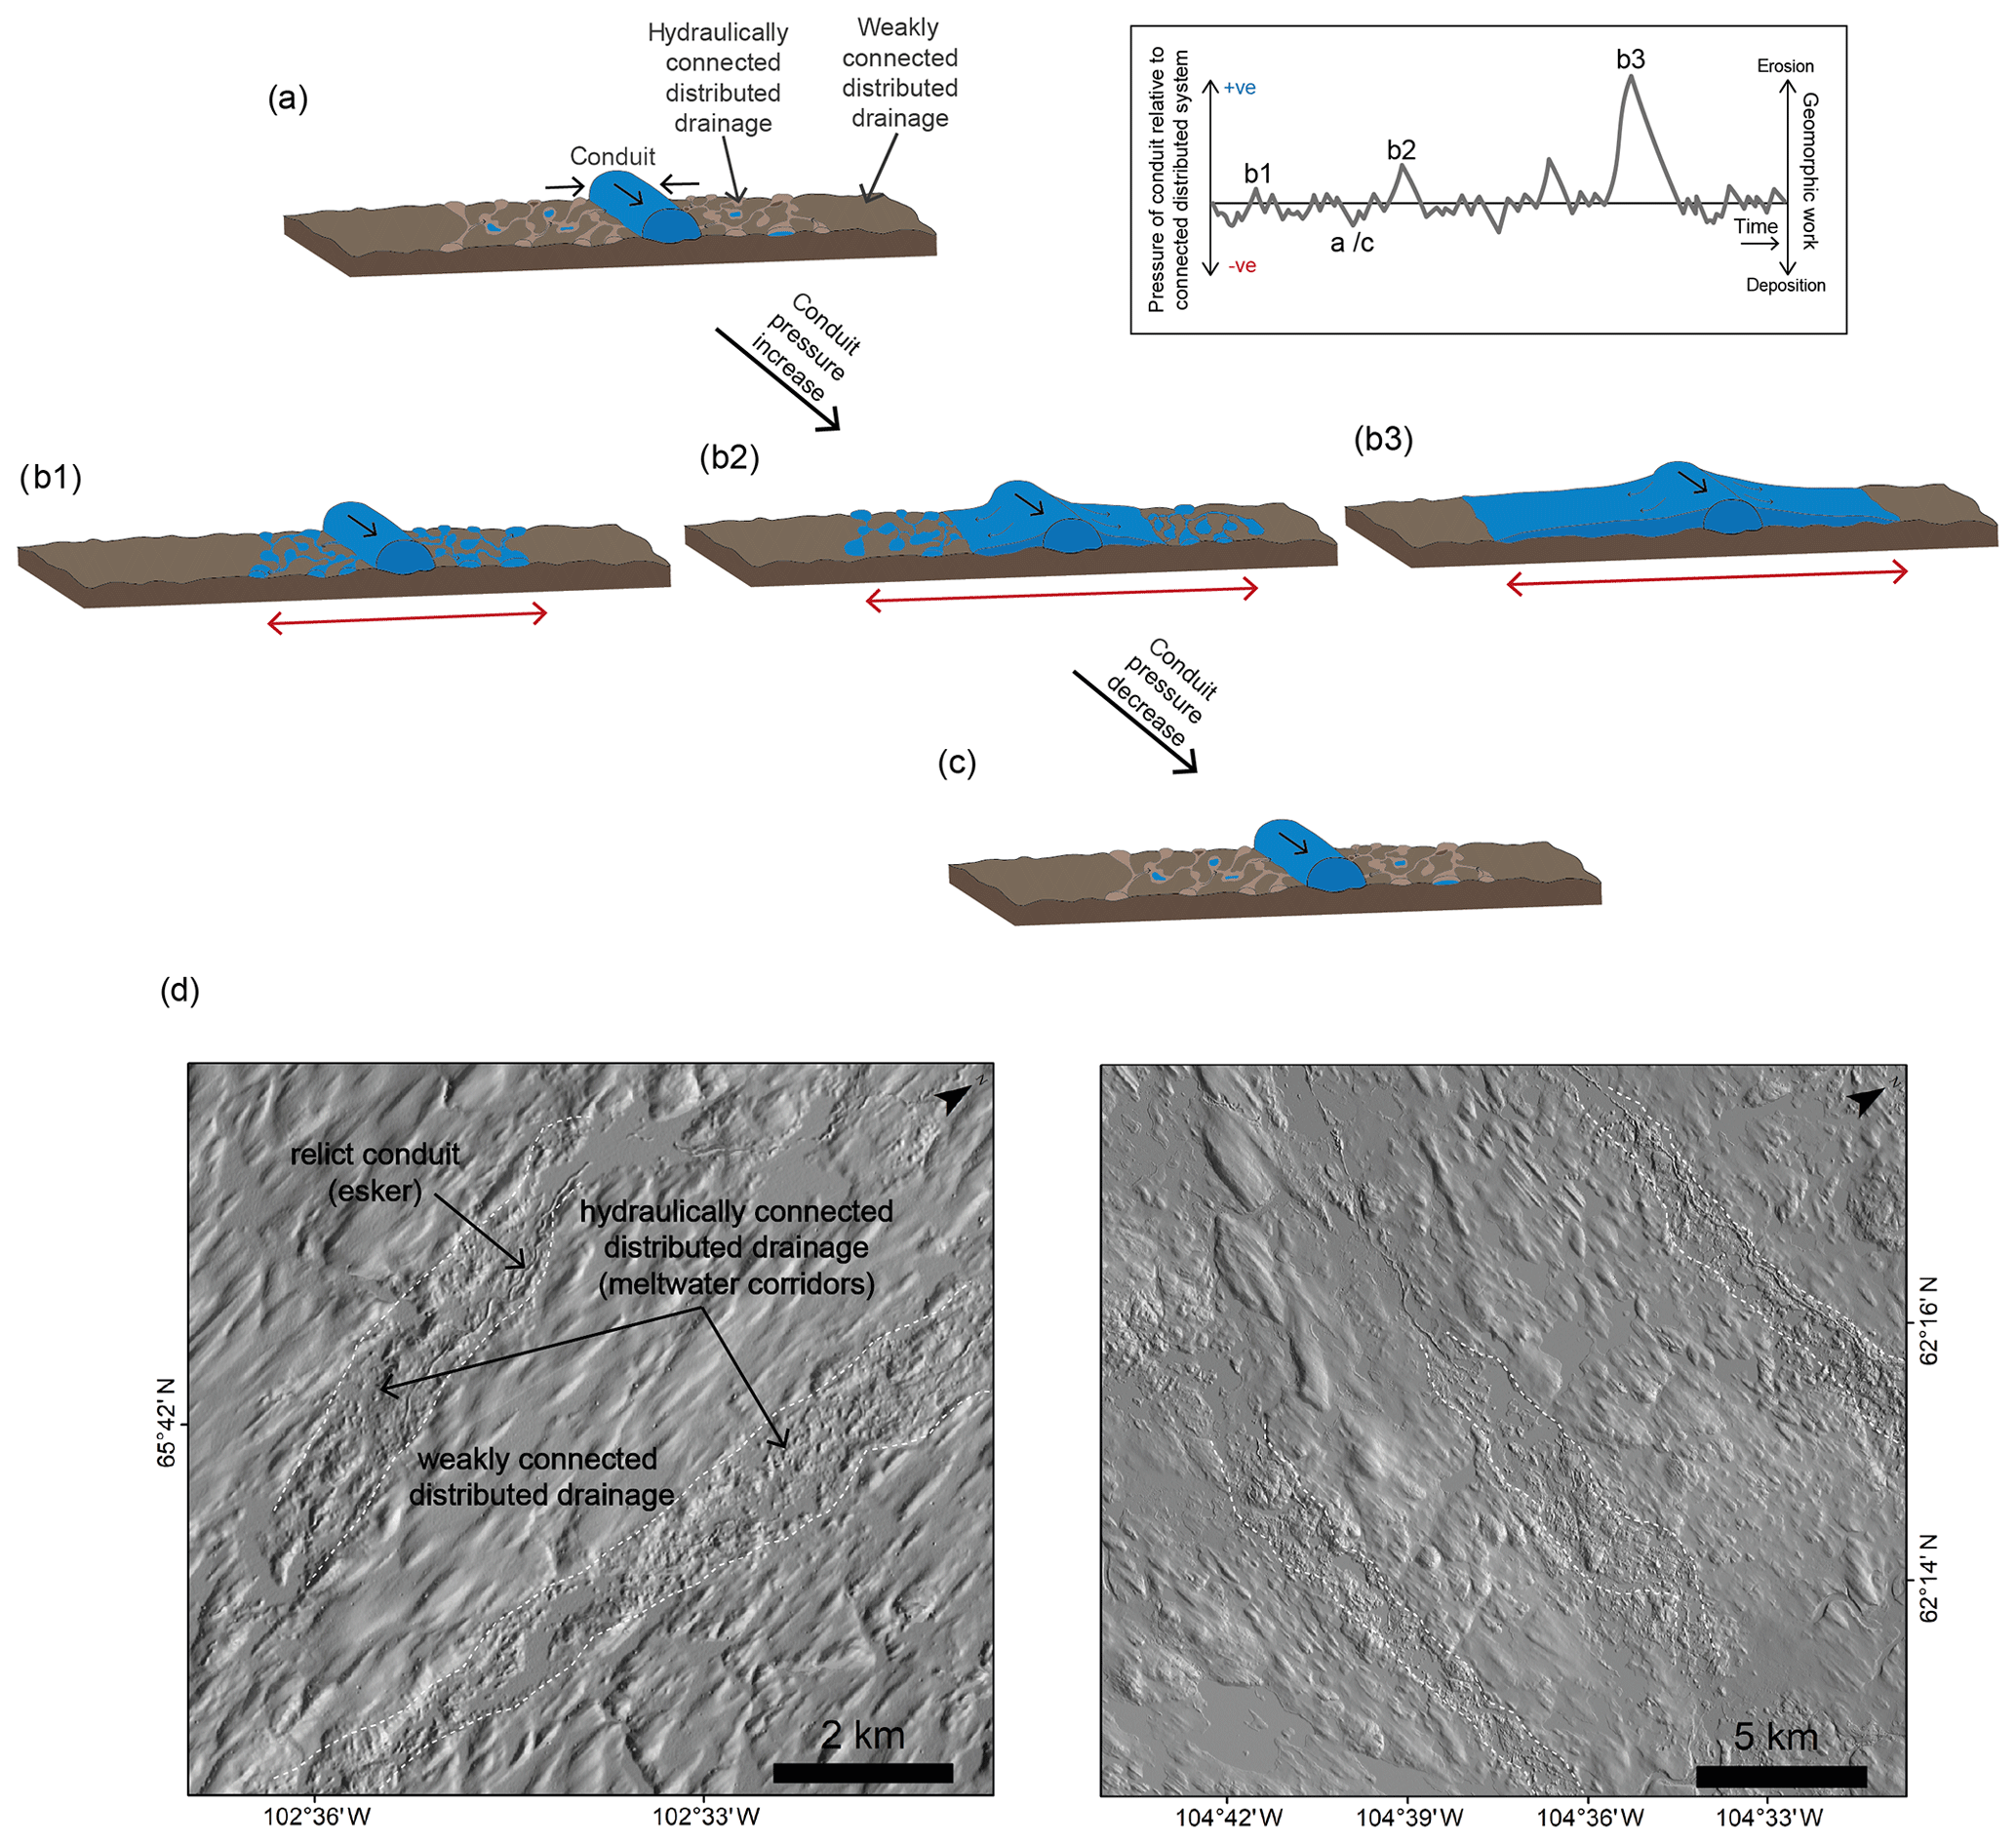
Figure 14Effects of pressure perturbations on the hydraulic conductivity within the conduit connected distributed subsystem: (a) steady state – water is drawn in from across the connected distributed system into the conduit (low pressure) down the pressure gradient, and geomorphic work is limited to the conduit, although there may be some lateral sapping (e.g. Boulton and Hindmarsh, 1987); (b) during overpressurisation events water is forced out of the conduit across and into the surrounding hydraulically connected distributed drainage system. The width and form (i.e. flood or cavity expansion) this takes likely depends on the magnitude of the pressure perturbation. Geomorphic work (erosion and deposition) likely occurs during this phase; (c) return to steady state as meltwater input decreases or the conduit expands to accommodate a sustained increase in input; (d) proposed cumulative geomorphic imprint of the process over time, creating the meltwater corridors (white dashed lines) preserved on the landscape today. The inset in the upper-right corner demonstrates that pressure perturbations within the conduit fluctuate throughout the melt season and vary in size from regular diurnal fluctuations (e.g. b1) to irregular larger events (e.g. b2 and b3), which may represent precipitation or supra/subglacial lake drainages.
Although hydrological theory dictates that a conduit in a steady state will operate at lower pressure than the surrounding distributed system, large or relatively rapid fluctuations in surface meltwater inputs (compared to the rate at which conduits expand from melting caused by turbulent heat dissipation) during the melt season mean the system is rarely in a steady state (Bartholomew et al., 2012). Once a conduit system has evolved gradually to accommodate high meltwater fluxes (Cowton et al., 2013), it is likely to operate at lower pressure than the surrounding high-pressure weakly connected system during periods of low meltwater input (e.g. at night and later in the melt season), thus drawing water in (Fig. 14a and c). During this phase, the geomorphic work in the hydraulically connected distributed drainage system is likely limited by the small cross-sectional area of passage and slow water movement (Willis et al., 1990; Alley et al., 1997). However, there could be migration of finer sediments into the central conduit contributing to gradual lateral channel growth over time; this has been invoked to explain steady-state growth of tunnel valleys for example (e.g. Boulton and Hindmarsh, 1987).
Variations in borehole water pressure measurements observed at glaciers in the Alps (e.g. Hubbard et al., 1995; Gordon et al., 1998), Canada (e.g. Rada and Schoof, 2018), and Alaska (e.g. Bartholomaus et al., 2008); ice velocity measurements taken from the Greenland Ice Sheet (e.g. Tedstone et al., 2014); and numerical modelling (e.g. Werder et al., 2013) suggest that large or rapid meltwater inputs can cause spikes in conduit water pressure (Cowton et al., 2013). This temporarily reverses the hydraulic potential gradient and causes water to flow out of the conduit and into the surrounding hydraulically connected distributed drainage system (Fig. 14b).
The width of the hydraulically connected distributed drainage system affected and the form the drainage takes likely depends on the magnitude of the pressure perturbation, determined by the volume and rate of meltwater input, basal substrate and antecedent conduit conditions (e.g. Iken and Bindschadler, 1986; Andrews et al., 2014; Rada and Schoof, 2018; Nanni et al., 2020). For example, the hydraulically connected distributed drainage system is widest during the early melt season when the hydrological system is less developed and the system can be easily overpressurised. Later during the summer, the same magnitude meltwater input does not cause the same degree of overpressurisation as conduits have increased their capacity to accommodate fluctuations in surface meltwater inputs (e.g. Rada and Schoof, 2018). The magnitude of the pressure perturbation is also likely to result in different forms of drainage through the hydraulically connected distributed drainage system. This may range from expansion of linked cavities during smaller magnitude events (Fig. 14b1) to drainage reorganisation into braided canals (e.g. Catania and Paola, 2001) or anastomosing conduits (e.g. Gulley et al., 2012) (Fig. 14b2) and finally to narrow sheet floods (e.g. Russell et al., 2007) (Fig. 14b3). While water flows laterally out of the conduit down the pressure gradient during these high-pressure events, the dominant flow direction is still parallel to the main conduit (i.e. downflow). Fluctuations in pressure within the subglacial conduits may therefore be key to understanding how sediment is accessed and eroded and for explaining variations in sediment flux.
The hydrological system is responsible for transporting the majority of subglacial sediment (e.g. Walder and Fowler, 1994; Richards and Moore, 2003). This is influenced by access to sediment (e.g. Willis et al., 1996; Burke et al., 2015) and subglacial water velocity (e.g. Walder and Fowler, 1994; Ng, 2000). Water flow through the distributed system is slow and inefficient with limited sediment mobilisation and restricted transport (e.g. Willis et al., 1990; Alley et al., 1997). Faster and more turbulent water flow within conduits is more efficient at eroding and transporting sediment, and this capability increases rapidly with increased discharge (Alley et al., 1997). However, conduits cover only a small fraction of the bed, which restricts their ability to erode and transport sediment across large areas (Alley et al., 2019). Thus, there is a need for an additional mechanism(s) to access surrounding sediments. While deformation of till into channels (e.g. Boulton and Hindmarsh, 1987) and lateral conduit migration (e.g. Beaud et al., 2018b) have been proposed, our model focusses on the connection of the hydraulically connected distributed drainage system to the conduit in a range of forms (Fig. 14b). This idea is grounded in the wider glaciofluvial literature, which suggests that rapid increases in water input create high water pressures that overwhelm the conduit and surrounding drainage system, causing both increased access and high enough water velocities to carry sediment (e.g. Swift et al., 2002, 2005b; Gimbert et al., 2016; Delaney et al., 2018). This enhanced sediment transport typically occurs at the start of the melt season (e.g. Liestøl, 1967; Hooke et al., 1985; Collins, 1989, 1990) but also during large meltwater events (e.g. precipitation, Delaney et al., 2018). An extreme example is during the 1996 Icelandic jökulhlaup, when a subglacial flood evacuated sediment creating a large tunnel valley (Russell et al., 2007). Thus, fluctuations in subglacial conduit pressure within the ablation zone of ice sheets are likely to be a key mechanism by which sediment on either side of the conduit is accessed and mobilised.
In our proposed model, meltwater corridor relief is caused by localised turbulent flow enhancing erosion (e.g. Rampton, 2000). Sedimentological evidence suggests that hummocks within the corridors occur as a result of both erosional and depositional processes. Our proposed model can account for either process, with hummocks forming as a result of (i) erosion by high-energy turbulent water flow along conduits and across the hydraulically connected distributed system (e.g. Rampton, 2000; Peterson et al., 2018) or (ii) deposition during waning stages of the flood within cavities either melted up into the overlying ice by turbulent floods (e.g. Utting et al., 2009) or minor conduits and linked cavities alongside the conduit (e.g. Brennand, 1994). Hummocks may also form as a combination of processes akin to the interpretation of triangular-shaped landforms (“murtoos”), which are attributed to subglacial till transported by creep and subsequently eroded and shaped by subglacial meltwater (Mäkinen et al., 2017; Ojala et al., 2019).
In areas of thicker sediment, pressure-driven drainage reorganisation, which takes the form of cavity expansion or sheet floods in other areas, may result in braiding across the hydraulically connected distributed system (e.g. Catania and Paola, 2001). This is consistent with braided meltwater channels identified within tunnel valleys in the North Sea (Kirkham et al., 2020), while the spacing and shape of the hummocky topography observed along meltwater corridors has been interpreted as remnants of braided conduits and intervening bars (e.g. Dahlgren, 2013; Peterson et al., 2018). Likewise water driven from the conduit into the hydraulically connected distributed system during discrete recharge from moulins has been recognised to form anastomosing conduits (Gulley et al., 2012). Thus, anastomosing or braided conduits moving around at the bed and formed during conduit overpressurisation may produce an erosional signature wider than the individual conduit.
While we fully expect to see transient conduit migration and reconfiguration during conduit overpressurisation, we also do not rule out the possibility that individual conduits could migrate laterally across the bed over longer periods of time, for instance due to changes in ice thickness, subglacial topography, and regional and local basal water pressure. This theory has been invoked to explain the formation of some tunnel valleys by the lateral merging of a series of smaller discrete drainage events over time (e.g. Jørgensen and Sandersen, 2006; Kehew et al., 2012; Beaud et al., 2018b). Indeed, seismic tremor observations suggest that areas with low hydraulic gradients (i.e. flatter parts of the bed, higher up the ice sheet) are characterised by quasi-stable conduit configurations where water is less restricted and can flow through multiple conduits, which alternate and migrate on multiday timescales (Vore et al., 2019). In contrast, the same research suggests that, nearer the margin where the hydraulic gradient is steeper, conduits are relatively stable in space (Vore et al., 2019). This fits with esker sinuosity studies which demonstrate that eskers are often very straight (median sinuosity 1.04 on the Canadian Shield) with esker segments aligning over distances of tens of kilometres (Storrar et al., 2014a). If the conduit migrated extensively in the marginal zone, we would expect to find more sinuous eskers or esker sections which are offset. Our work and earlier studies indicate that esker ridges can be superimposed on hummocks within meltwater corridors, but to date there are no examples of hummocks overlying eskers (e.g. Peterson et al., 2018). Together, this suggests that the formation of eskers is separated in time from the meltwater corridors in which they often occur (e.g. Beaud et al., 2018a; Hewitt and Creyts, 2019; Livingstone et al., 2020). This supports the notion that palaeo-ice-sheet beds are a composite picture of geomorphic effects, combining different stages and potentially different subglacial drainage regimes (Greenwood et al., 2016).
Using an inland limit of 60 km for subglacial channelisation (e.g. Chandler et al., 2013), and minimum and maximum retreat rates in the study area (∼ 230 to ∼ 540 m yr−1), we estimate the time likely spent beneath the channelised zone influenced by surface meltwater inputs at between ∼ 110 and ∼ 260 years. We therefore suggest that meltwater corridors reflect the geomorphic work arising from repeated pressure perturbations in the ablation zone over tens to hundreds of years. The most significant erosion likely occurred where fluctuating surface meltwater inputs were clustered (e.g. Alley et al., 2019) or where cumulative upstream drainage produced the threshold shear stresses required to erode and transport the substrate, which may have occurred upstream of the peak local meltwater input. While the location of surface meltwater drainage and discrete water input points (crevasses and moulins) are important controls on the distribution of subglacial drainage at the bed (e.g. Decaux et al., 2019), observations suggest that both supraglacial networks (e.g. Koziol et al., 2017) and moulin locations (e.g. Catania and Neumann, 2010) are relatively stable, at least over decadal timescales. Where changes in surface meltwater input areas are observed, this occurs over relatively short distances (∼ 300 m2) with the new routes likely occurring along the same drainage axes and thus not resulting in significant subglacial drainage system reorganisation (Decaux et al., 2019). This is consistent with geomorphological evidence, which reveals a coherent drainage network (Fig. 5) with individual meltwater corridors extending hundreds of kilometres (Table 1).
The variable extent to which the hydraulically connected drainage system (and thus the meltwater corridor width) is affected by conduit overpressurisation may be influenced by ambient variations in the conduits' lateral hydropotential gradient (e.g. narrower meltwater corridors within a steep hydropotential valley). However, we suggest the key control will be the magnitude of the pressure perturbation, which will vary depending on meltwater input and antecedent subglacial drainage conditions. If a corridor represents a single maximum flow, meltwater corridor widths in this study (0.05–3.3 km, mean 0.9 km) are comparable to measurements in alpine settings (∼ 140 m, Hubbard et al., 1995; Gordon et al., 1998) and modelled ice sheet settings (∼ 2 km, Werder et al., 2013).
5.2 Exploring potential controls on network patterns and variations in expression of meltwater routes
In this section, we explore spatial controls governing the overall pattern of the subglacial hydrologic network, as well as variations in meltwater landform expression (i.e. the patterns of and balance between erosion and deposition and the resulting geomorphic expression) along individual meltwater routes. Erosional and depositional features are frequently observed along the same meltwater route and even at the same location; for example, eskers with lateral splays occurring within meltwater corridors.
There is a high degree of channelisation across the Keewatin sector of the ice sheet bed, but channelisation is not uniform, and the densest areas of meltwater routes coincide with the “roughest” basal topography (Fig. 11). This may be the result of subglacial drainage route fragmentation around bed obstacles, with a greater number of tributaries and broken patterns common in regions of high bed roughness (e.g. Test Site 3). Basal topography also preconditions the large-scale spatial structure of surface drainage (Ignéczi et al., 2018), and the association between rough areas and dense clusters of meltwater routes could be a response to more surface water penetrating to the bed as the result of extensive crevassing. For a typical melt season in west Greenland, crevasses capture a significant amount of surface water – more than moulins or the hydrofracture of surface lakes (Koziol et al., 2017). Surface meltwater inputs are thought to be an important control on the distribution of drainage across the bed (e.g. Gulley et al., 2012; Banwell et al., 2016) and the formation and evolution of subglacial meltwater landforms (e.g. Banerjee and McDonald, 1975; St-Onge, 1984; Hooke and Fastook, 2007; Storrar et al., 2014b; Livingstone et al., 2015; Peterson et al., 2017).
There are significantly fewer meltwater routes coinciding with palaeo-ice-stream locations – particularly the Dubawnt Lake Ice Stream (Fig. 12). In addition, the network pattern of meltwater routes corresponding with the location of the Dubawnt Lake Ice Stream are more dendritic and extend further towards the ice divide. These observations are consistent with Livingstone et al. (2015), who find fewer eskers on palaeo-ice-stream beds where modelled subglacial meltwater drainage is greatest. We suggest the scarcity of meltwater routes beneath palaeo-ice streams could be the result of (i) lower ice-surface slopes and hydraulic potential gradients, which favour distributed rather than channelised drainage (e.g. Kamb, 1987; Bell, 2008); or (ii) a lack of preservation beneath fast-flowing ice (Boulton, 1996). Where channelised drainage does occur beneath palaeo-ice streams, networks are typically more dendritic, which may also be the result of shallower hydraulic gradients and lower relief bed topography enabling greater lateral water flow.
Dynamic ice mass loss via streaming or surging (and subsequent melting and iceberg calving) has implications for ice sheet stability (e.g. Bell, 2008; Christianson et al., 2014; Christoffersen et al., 2014). The Keewatin sector of the LIS had a relatively low spatial density of ice streams compared to the western and southern margins (Margold et al., 2015; Stokes et al., 2016). This may be partially attributed to the low relief; resistant bed of the shield, which was unable to provide the fine-grained sediments required to lubricate ice flow; and the fact that the margin reached this position later during deglaciation when the remaining ice sheet was much smaller (e.g. Margold et al., 2015; Stokes et al., 2016). Nonetheless, we also suggest that efficient evacuation of meltwater through the dense channelised network, which developed in this region during the final stages of deglaciation, as the climate warmed (Storrar et al., 2014b), could have inhibited the development of fast flow and potentially contributed to the shutdown of existing ice streams. This is consistent with recent physical modelling (Lelandais et al., 2018) and modern temporal observations that link decadal-scale ice-flow decelerations with more pervasive and efficient drainage channelisation driven by increased surface meltwater inputs to the bed (Sole et al., 2013; Tedstone et al., 2014; van de Wal et al., 2015; Davison et al., 2019) and vice versa (Williams et al., 2020). If this hypothesis is correct we would expect to see this large-scale inverse spatial relationship between channelisation and ice streaming in other palaeo-ice-sheet settings. This potential drainage control on ice-sheet velocity and stability may also influence the pace of deglaciation; we note slower retreat rates (∼ 230 m yr−1) in the northwest of the study area, which coincide with the highest density of meltwater routes, compared to much faster retreat rates (∼ 540 m yr−1) associated with the sparsest meltwater routes. This conclusion is tentative given uncertainty in the region deglacial chronology (Dyke et al., 2003) and the many other factors that can influence retreat rate and thus requires further testing.
At a large scale, there is a general tendency for meltwater routes to preferentially form on till, which is more easily eroded than bedrock and where geomorphic evidence is likely to be better developed. Eskers are over-represented on harder, more resistant rock (Fig. 10d) where R channels are more likely to form (Clark and Walder, 1994; Storrar, 2014a), while there is a slight tendency for meltwater channels (i.e. incisional features) to form on the softer, more erodible sedimentary rock (Fig. 10b). Eskers with lateral splays (i.e. depositional features) appear preferentially on till blankets (Fig. 10c) where there is an abundance of sediment that may overwhelm and clog up the conduit (e.g. Burke et al., 2015), while isolated esker ridges favour thin till and are under-represented on thick till. Though detailed long profiles (Fig. 13) hint at local relationships between bed substrate changes and the resultant landform expression, we caution against the assumption that this is a widespread occurrence rather than an isolated coincidence.
5.3 Implications
Western sectors of the contemporary Greenland Ice Sheet are broadly analogous to our study area: both are underlain by resistant Precambrian shield rocks and both experience(d) rapid retreat and high meltwater production rates. This is also similar to southern Sweden, which lay beneath the palaeo-Scandinavian Ice Sheet, where similar geomorphic features to those described here occur extensively (e.g. Peterson et al., 2017; Peterson and Johnson, 2018). This study therefore has potential implications for our understanding of the impact of subglacial hydrology on overlying ice dynamics and ice flow regulation of past, current and future ice sheets.
The interaction between a subglacial conduit and the surrounding hydraulically connected distributed drainage system is believed to be widespread in contemporary glaciological settings (e.g. Hubbard et al., 1995; Gordon et al., 1996; Bartholomaus et al., 2008; Werder et al., 2013; Tedstone et al., 2014) and has been identified as key to understanding ice velocity variations and predicting future ice sheet mass loss (Davison et al., 2019). However, the true extent and influence of the hydraulically connected distributed drainage system beneath the Greenland Ice Sheet is unknown due to the challenge of observing contemporary subglacial environments. Palaeo-studies, such as this one, offer the potential to reveal new insights into the nature and configuration of the subglacial hydrological system at an ice sheet scale and potential quantification of how much of the bed and ice-surface dynamics were affected by subglacial meltwater.
Based on our proposed model, we estimate the coverage of each drainage element across the bed of the Keewatin Ice Sheet. Conduits (i.e. eskers) cover ∼ 0.5 % of the bed based on an average esker width of 100 m and spacing of 18.8 km (Storrar et al., 2014a). The coverage of conduits and the surrounding hydraulically connected distributed drainage system (i.e. meltwater corridors) increases to an average of ∼ 13 % using the average width and spacing of meltwater routes in this study but could realistically vary between 5 % (lower quartile width and upper quartile spacing) and 36 % (upper quartile width and lower quartile spacing). This represents an area 25 times greater than the conduits (eskers) alone but assumes that all meltwater routes were active at the same time.
Based on the above and while we propose a significant increase in the area of the bed influenced by surface meltwater inputs, these findings also fit with the hypothesis that the weakly connected distributed system covers a large percentage of the subglacial bed (Hoffman et al., 2016). Our results suggest that somewhere between 64 % and 95 % of the bed existed within the weakly connected distributed system where there are no visible traces of subglacial meltwater flow. This finding is similar to Hodge (1979), who suggested that 90 % of the bed at the South Cascade Glacier in Washington was hydraulically isolated. Quantifying the relative coverage of the inactive hydraulically isolated regions of the bed and better understanding how they regulate the active drainage regions and modulate basal traction are likely to be important for understanding ice sheet dynamics (Hoffman et al., 2016).
In contemporary settings, the hydraulically connected distributed drainage system is strongly linked to surface meltwater inputs and conduit overpressurisation. The LIS is expected to have exhibited strong surface melting during the period of retreat over this area (estimated at −0.85 m yr−1 for 9 ka), with surface ablation accounting for much of this (Carlson et al., 2009). The widespread presence of meltwater corridors across Keewatin thus complements their interpretation and reveals a geomorphic signature of this interaction.
Finally, there are large uncertainties as to how sediment is accessed by subglacial meltwater and transported to conduits (Alley et al., 2019). We suggest that the overpressurisation of conduits and their interaction with the surrounding hydraulically connected distributed drainage is a key driver of sediment erosion and entrainment within the ablation zone and may help address this question. As a result, conduits may be less sediment limited than previously thought, and, much like the evolution of the subglacial drainage system (e.g. Schoof, 2010), rates of subglacial fluvial erosion may be strongly controlled by melt supply variability rather than the overall input of meltwater into the system.
We used the ArcticDEM to identify and map all visible traces of subglacial meltwater drainage in the Keewatin sector of the former LIS. We found that wider meltwater features (meltwater tracks and meltwater channels) on the order of hundreds to thousands of metres flanking or joining up intervening segments of esker ridges were common. These have previously been termed and described as different features. However, as they form part of the same integrated network and display similarities in spacing and morphometry, we propose collectively grouping these features under the term meltwater corridor (Table 2). Combing esker ridges and all varying geomorphic expressions of meltwater corridors within a single meltwater routes map, we have created the first large-scale holistic map of subglacial meltwater drainage for this area.
Based on our observations and modern analogues, we propose a new model, which accounts for the formation and geomorphic variations of meltwater corridors. In this model, we propose that a principal conduit (i.e. the esker) interacts with the surrounding hydraulically connected distributed drainage network (i.e. the meltwater corridor) with the extent and intensity of this interaction, determined by the magnitude of water pressure fluctuations within the conduit. The geomorphic expression (i.e. net erosion or deposition) is likely governed by a combination of glaciological (i.e. relative water pressure fluctuation) and background controls (i.e. topography, basal substrate and geology). Eskers likely represent the final depositional imprint of channelised drainage within the large-scale meltwater routes network close to the ice margin, while meltwater corridors represent a composite imprint of drainage formed over tens to hundreds years. If our model is correct, the drainage footprint of the hydraulically connected distributed drainage system in this sector is 25 times greater than previously assumed from eskers alone, which only account for the central conduit.
Our results suggest that the overall distribution and pattern of drainage is influenced by background topography, with greater relief resulting in denser channelised networks, possibly due to fragmentation of subglacial drainage around basal obstacles and the result of more spatially distributed meltwater delivery to the bed. Channelised drainage is relatively rare beneath palaeo-ice streams, which instead favour distributed drainage configurations due to the lower ice-surface slopes and subglacial hydraulic gradients and likely also exhibit reduced landform preservation potential. The style of meltwater drainage may influence ice dynamics, with the high degree of channelisation observed in the region able to efficiently dewater the bed, leading to slower ice-flow and limited ice stream activity.
Finally, our results suggest that conduit overpressurisation events and the subsequent connection between conduits and the surrounding hydraulically connected distributed drainage system may be important for understanding how sediment is accessed and entrained at the bed. While conduits (eskers) alone cover ∼ 0.5 % of the bed, the connected distributed drainage system (meltwater corridors) cover 5 %–36 % of the bed, providing a greater area for sediment erosion and likely the high velocity flows required to do so.
Further research should focus on determining how common the proposed interaction between conduits and the surrounding distributed drainage system is beneath other palaeo- and contemporary ice sheets and the controls governing its variability. We hypothesise that where less surface meltwater is delivered to the bed or ice-surface slopes are shallower, the geomorphic expression will be less extensive and more indistinct. This is because conduits are less likely to evolve due to lower hydraulic gradients, and their interaction with the surrounding distributed system is limited because of invariant melt supply. Understanding where this interaction and signature occurs will help confirm or refute our proposed model and develop understanding of how meltwater drainage evolves and influences ice dynamics and mass balance over long timescales.

Figure A1Automatic mapping output (cleaned up) for test site using code associated with Lewington et al. (2019).
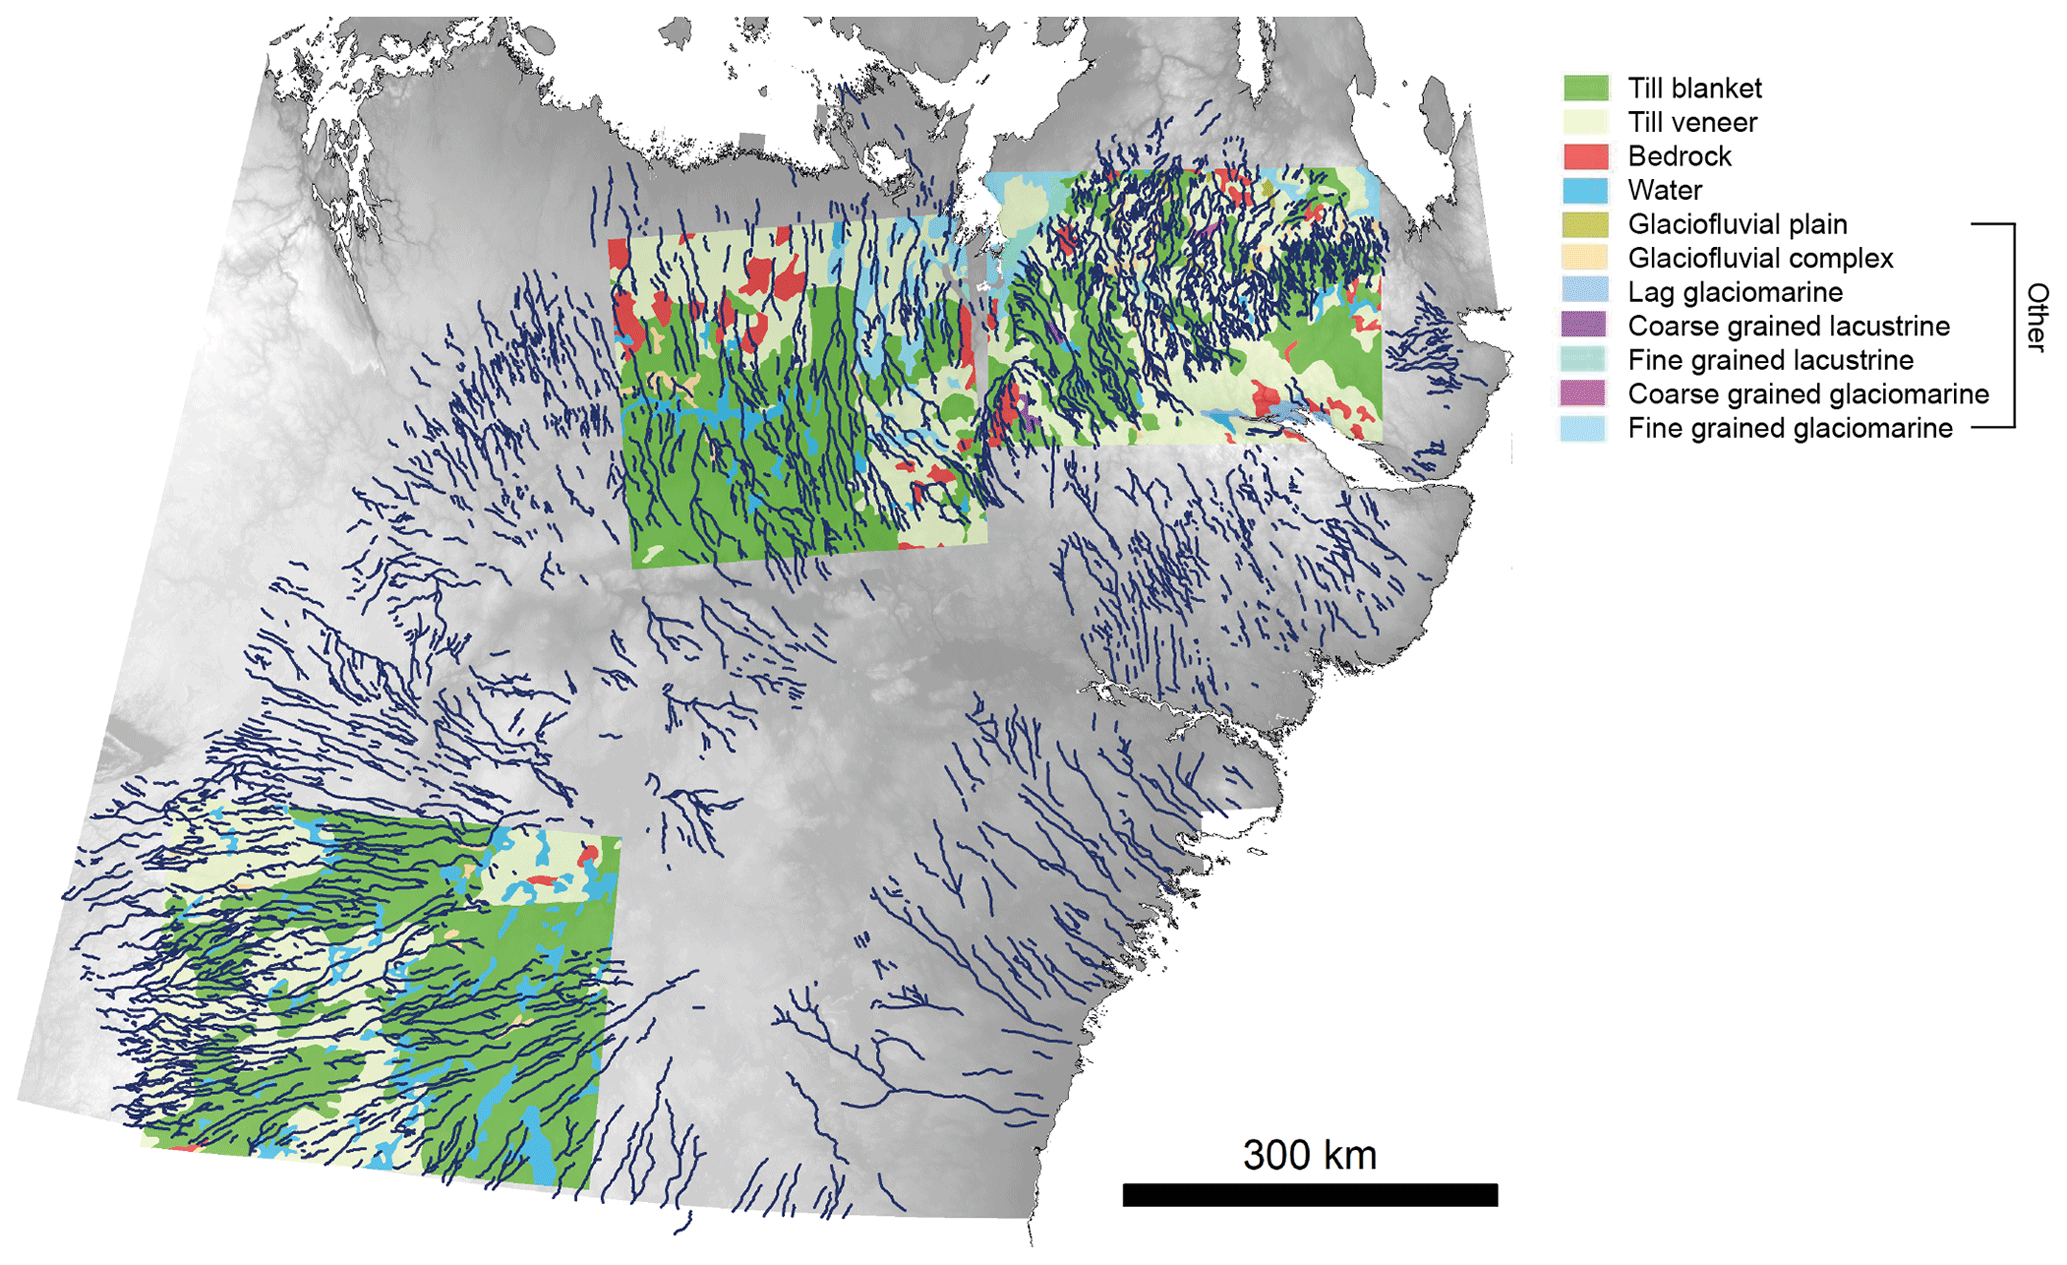
Figure A2Surface substrate across the three test sites (left–right) used for analysis in Sect. 3.3.

Figure A3Bed geology across the three test sites (left–right) used for analysis in Sect. 3.3.
The mapping of meltwater corridors is archived at https://doi.org/10.15131/shef.data.12752987.v1 (Lewington et al., 2020).
SL, CDC and AJS conceived the project. ELML carried out the meltwater route mapping and analysed the results. ELML wrote the initial paper with substantial contributions from all authors. All authors contributed to data interpretation and writing of the final paper.
The authors declare that they have no conflict of interest.
DEMs were provided by the Polar Geospatial Center under NSF-OPP awards 1043681, 1559691 and 1542736. We would like to thank an anonymous reviewer and Flavien Beaud for their valuable comments, which have significantly improved the manuscript and have helped us to clarify our proposed model.
This work was funded through Adapting to the Challenges of a Changing Environment (ACCE) and a NERC-funded doctoral training partnership ACCE DTP (NE/L002450/1). This work also benefitted from the PALGLAC team of researchers who received funding from the European Research Council (ERC) under the European Union's Horizon 2020 research and innovation programme (grant agreement no. 787263). This research has been supported by the National Environment Research Council (NERC) (grant no. NE/L002450/1).
This paper was edited by Ginny Catania and reviewed by Flavien Beaud and one anonymous referee.
Alley, R. B., Cuffey, K. M., Evenseon, E. B., Strasser, J. C., Lawson, D. E., and Larson, G. J.: How glaciers entrain and transport basal sediment : physical constraints, Quatern. Sci. Rev., 16, 1017–1038,1997.
Alley, R. B., Cuffey, K. M., and Zoet, L. K.: Glacial erosion: status and outlook, Ann. Glaciol., 60, 1–13, 2019.
Andrews, L. C., Catania, G. A., Hoffman, M. J., Gulley, J. D., Lüthi, M. P., Ryser, C., Hawley, R. L. and Neumann, T. A. : Direct observations of evolving subglacial drainage beneath the Greenland Ice Sheet, Nature, 514, 80–83, 2014.
Aylsworth, J. M. and Shilts, W. W.: Glacial features around the Keewatin Ice Divide: Districts of Mackenzie and Keewatin, Geological Survey of Canada, Map 24-1987, 1 : 1 000 000, 1989.
Aylsworth, J. M., Shilts, W. W., Russel, H. A. J., and Pyne, D. M.: Eskers around the Keewatin Ice Divide: Northwest Territories and Nunavut, Geological Survey of Canada, Open File, 7047, 2012.
Banerjee, I. and McDonald, B. C.: Nature of esker sedimentation, in: Glaciofluvial and Glaciolacustrine Sedimentation, edited by: Jopling, A. V. and McDonald, B. C., vol. 23, Society of Economic Palaeonologists and Mineralogists, Special Publication, 304–320, 1975.
Banwell, A., Hewitt, I., Willis, I., and Arnold, A.: Moulin density controls drainage development beneath the Greenland ice sheet, J. Geophys. Res.-Earth Surf., 121, 2248–2269, 2016.
Bartholomaus, T. C., Anderson, R. S., and Anderson, S. P.: Response of glacier basal motion to transient water storage, Nat. Geosci., 1, 33–37, 2008.
Bartholomew, I., Nienow, P., Sole, A., Mair, D., Cowton, T., Palmer, S., and Wadham, J.: Supraglacial forcing of subglacial drainage in the ablation zone of the Greenland ice sheet, Geophys. Res. Lett., 38, L08502, https://doi.org/10.1029/2011GL047063, 2011.
Bartholomew, I., Nienow, P., Sole, A., Mair, D., Cowton, T., and King, M. A.: Short-term variability in Greenland Ice Sheet motion forced by time-varying meltwater drainage: Implications for the relationship between subglacial drainage system behaviour and ice velocity, J. Geophys. Res., 117, F03002, https://doi.org/10.1029/2011JF002220, 2012.
Beaud, F., Flowers, G., and Venditti, J. G.: Efficacy of bedrock erosion by subglacial water flow, Earth Surf. Dynam., 4, 125–145, 2016.
Beaud, F., Flowers, G., and Venditti, J. G.: Modeling sediment transport in ice-walled subglacical channels and its implications for esker formation and proglacial sediment yields, J. Geophys. Res.-Earth Surf., 123, 3206–3227, 2018a.
Beaud, F., Venditti, J. G., Flowers, G. E., and Koppes, M.: Excavation of subglacial bedrock channels by seasonal meltwater flow, Earth Surf. Proc. Land., 43, 1960–1972, 2018b.
Bell, R. E.: The role of subglacial water in ice-sheet mass balance, Nat. Geosci., 1, 297–304, 2008.
Bindschadler, R. A.: The importance of pressurized subglacial water in seperation and sliding at the glacier bed, J. Glaciol., 57, 929–941, 1983.
Bingham, R. G., Hubbard, A. L., Nienow, P. W., and Sharp, M. J.: An investigation into the mechanisms controlling seasonal speedup events at a High Arctic glacier, J. Geophys. Res., 113, F02006, https://doi.org/10.1029/2007JF000832, 2008.
Bolduc, A. M.: The formation of eskers based on their morphology, stratigraphy and lithologic composition, Labrador, Canada, Unpublished PhD thesis, Lehigh University, 1992.
Bougamont, M., Christoffersen, P., Hubbard, A. L., Fitzpatrick, A. A., Doyle, S. H., and Carter, S. P.: Sensitive response of the Greenland Ice Sheet to surface meltwater drainage over a soft bed, Nat. Commun., 5, 5052, https://doi.org/10.1038/ncomms6052, 2014.
Boulton, G. S.: Theory of glacial erosion, transport and deposition as a consequence of subglacial sediment deformation, J. Glaciol., 42, 43–62, 1996.
Boulton, G. S. and Hindmarsh, R. C. A.: Sediment deformation beneath glaciers: rheology and geological consequences, J. Geophys. Res., 92, 9059–9082, 1987.
Boulton, G. S., Caban, P. E., and Van Gijssel, K.: Groundwater flow beneath ice sheets: part I – large scale patterns, Quatern. Sci. Rev., 14, 545–562, 1995.
Boulton, G. S., Lunn, R., Vidstrand, P., and Zatspein, S.: Subglacial drainage by groundwater-channel coupling, and the origin of esker systems: Part I – Glaciological observaations, Quatern. Sci. Rev., 26, 1067–1090, 2007a.
Boulton, G. S., Lunn, R., Vidstrand, P., and Zatspein, S.: Subglacial drainage by groundwater-channel coupling, and the origin of esker systems: Part II – Theory and simulation of a modern system, Quatern. Sci. Rev., 26, 1091–1105, 2007b.
Boulton, G. S., Hagdorn, M., Maillot, P. B., and Zatsepin, S.: Drainage beneath ice sheets: groundwater-channel coupling, and the origin of esker systems from former ice sheets, Quatern. Sci. Rev., 28, 621–638, 2009.
Brennand, T. A.: Macroforms, large bedforms and rhythmic sedimentary sequences in subglacial eskers, south-central Ontario: implications for esker genesis and meltwater regime, Sediment. Geol., 91, 9–55, 1994.
Brennand, T. A.: Deglacial meltwater drainage and glaciodynamics: Inferences from Laurentide eskers, Canada, Geomorphology, 32, 263–293, 2000.
Burke, M. J., Brennand, T. A., and Perkins, A. J.: Erosional corridor evolution in south-central British Columbia: insights from ground penetrating radar surveys. In proceedings of Geohydro2011: Joint meeting of the CANQUA and IAH-CNC, Quebec City, 28–31 August 2011.
Burke, M. J., Brennand, T. A., and Perkins, A. J.: Evolution of the subglacial hydrologic system beneath the rapidly decaying Cordilleran Ice Sheet by ice-dammed lake drainage: implications for meltwater-induced ice acceleration, Quatern. Sci. Rev., 50, 125–140, 2012.
Burke, M. J., Brennand, T. A., and Sjogren, D. B.: The role of sediment supply in esker formation and ice tunnel evolution, Quatern. Sci. Rev., 115, 50–77, 2015.
Carlson, A. E., Legrande, A. N., Oppo, D. W., Came, R. E., Schmidt, G. A., Anslow, F. S., Licciardi, J. M., and Obbink, E. A.: Rapid early Holocene deglaciatin of the Laurentide ice sheet, Nat. Geosci., 1, 620–624, 2008.
Carlson, A. E., Anslow, F. S., Obbink, E. A., LeGrande, A. N., Ullman, D. J., and Licciardi, J. M.: Surface melt driven Laurentide Ice Sheet retreat during the early Holocene, Geophys. Res. Lett., 36, L24502, https://doi.org/10.1029/2009GL040948, 2009.
Catania, G. and Paola, C.: Braiding under glass, Geology, 29, 259–262, 2001.
Catania, G. A., Neumann, T. A. Persistent englacial drainage features in the Greenland Ice Sheet. Geophysical Research Letters.37 (2010).
Chandler, B. M. P., Lovell, H., Boston, C. M., Lukas, S., Barr, I. D., Benn, D. I., Clark, C. D., Darvill, C. M., Evans, D. J. A., Ewertowski, M., Loibl, D., Margold, M., Otto, J., Roberts, D. H., Stokes, C. R., Storrar, R. D., and Stroeven, A.: Glacial geomorphological mapping: a review of approaches and frameworks for best practice, Earth-Sci. Rev., 185, 806–846, 2018.
Chandler, D. M., Wadham, J. L., Lis, G. P., Cowton, T., Sole, A., Bartholomew, I., Telling, J., Nienow, P., Bagshaw, E. B., Mair, D., Vinen, S., and Hubbard, A.: Evolution of the subglacial drainage system beneath the Greenland Ice Sheet revealed by tracers, Nat. Geosci., 6, 195–198, 2013.
Christianson, K., Peters, L. W., Alley, R. B., Anandakrishnan, S., Jacobel, R. W., Riversman, K. W., Muto, A., and Keisling, B. A.: Dilatant till facilitates ice-stream flow in northeast Greenland, Earth Planet. Sc. Lett., 401, 57–69, 2014.
Christoffersen, P., Bougamont, M., Carter, S. P., Fricker, H. A., and Tulaczyk, S.: Significant groundwater contribution to Antarctic streams hydrologic budget, Geophys. Res. Lett., 41, 2003–2010, 2014.
Clark, P. U. and Walder, J. S.: Subglacial drainage, eskers, and deforming beds beneath the Laurentide and Eurasian ice sheets, Geol. Soc. Am. Bull., 106, 304–314, 1994.
Collins, D. N.: Seasonal development of subglacial drainage and suspended sediment delivery to meltwater beneath an Alpine glacier, Ann. Glaciol., 13, 45–50, 1989.
Collins, D. N.: Seasonal and annual variations of suspended sediment transport in meltwaters draining from an Alpine glacier, Int. Assoc. Hydrol. Sci. P., 193, 439–446, 1990.
Cowton, T., Nienow, P., Sole, A., Wadham, J., Lis, G., Bartholomew, I., Mair, D., and Chandler, D.: Evolution of drainage system morphology at a land-terminating Greenlandic outlet glacier, J. Geophys. Res.-Earth Surf., 118, 29–41, 2013.
Crozier, J., Karlstrom, L., and Yang, K.: Basal control of supraglacial meltwater catchments on the Greenland Ice Sheet, The Cryosphere, 12, 3383–3407, https://doi.org/10.5194/tc-12-3383-2018, 2018.
Cummings, D. I., Kjarsgaard, B. A., Russell, H. A. J., asnd Sharpe, D. R.: Eskers as mineral exploration tools, Earth Sci. Rev., 109, 32–43, 2011a.
Cummings, D. I., Gorrell, G., Guilbault, J.-P., Hunter, J. A., Logan, C., Ponomarenko, D., André, J.-M. P., Pullan, S. E., Russell, H. A. J., and Sharpe, D. R.: Sequence stratigraphy of a glaciated basin fill, with a focus on esker sedimentation, GSA Bulletin, 123, 1478–1496, https://doi.org/10.1130/B30273.1, 2011b.
Cutler, P. M., Colgan, P. M., and Mickelson, D. M.: Sedimentological evidence for outburst floods from the Laurentide Ice Sheet margin in Wisonsin, USA: implications for tunnel-channel formation, Quatern. Int., 90, 23–40, 2002.
Dahlgren, S.: Subglacially meltwater eroded hummocks, MSc Thesis, Department of Earth Sciences, University of Gothenburg, 2013.
Das, S. B., Joughin, I., Behn, M. D., Howat, I. M., King, M. A., Lizarralde, D., and Bhatia, M. P.: Fracture propagation to the base of the Greenland Ice Sheet during supraglacial lake drainage, Science, 320, 963–964, 2008.
Davison, B. J., Sole, A. J., Livingstone, S. J., Cowton, T. W., and Nienow, P. W.: The influence of hydrology on the dynamics of land-terminating sectors of the Greenland Ice Sheet, Front. Earth Sci., 7, 10, https://doi.org/10.3389/feart.2019.00010, 2019.
Decaux, L., Grabiec, M., Ignatiuk, D., and Jania, J.: Role of discrete water recharge from supraglacial drainage systems in modeling patterns of subglacial conduits in Svalbard glaciers, The Cryosphere, 13, 735–752, https://doi.org/10.5194/tc-13-735-2019, 2019.
Delaney, I., Bauder, A., Werder, M. A., and Farinotti, D.: Regional and annual variability in subglacial sediment transport by water for two glaciers in the Swiss Alps, Front. Earth Sci., 6, 175, https://doi.org/10.3389/feart.2018.00175, 2018.
Downs, J. Z., Johnsson, J. V., Harper, J. T., Meierbachtol, T., and Werder, M. A.: Dynamic hydraulic conductivity reconciles mismatch between modeled and observed winter subglacial water pressure, J. Geophys. Res.-Earth Surf., 123, 818–836, 2018.
Doyle, S. H., Hubbard, A., Fitzpatrick, A. A. W., van As, D., Mikkelsen, A. B., Pettersson, R., and Hubbard, B.: Persistant flow acceleration within the interior of the Greenland ice sheet, Geophys. Res. Lett., 41, 899–905, 2014.
Dredge, L., Nixon, F., and Richardson, R.: Surficial Geology, Northwestern Manitoba: Geological Survey of Canada, Series Map 1608A, 1 : 500 000, 1985.
Dyke, A. S., Moore, A., and Robertson, I.: Deglaciation of North America, Geological Survey of Canada, Open File, 1574, 2003.
Englehardt, H., Harrison, W., and Kamb, B.: Basal sliding and conditions at the glacier bed as revealed by bore-hole photography, J. Glaciol., 20, 469–508, 1978.
Fitzpatrick, A. A., Hubbard, A., Joughin, I., Quincey, D. J., Van As, D., Mikkelsen, A. P., Doyle, S. H., Hasholt, B., and Jones, G. A.: Ice flow dynamics and surface meltwater flux at a land-terminating sector of the Greenland ice sheet, J. Glaciol., 59, 687–696, 2013.
Fowler, A.: Sliding with cavity formation, J. Glaciol., 33, 131–141, 1987.
Fulton, R. J.: Surficial materials of Canada. Geological Survey of Canada, Series Map 1880A, 1 : 5 000 000, 1995.
Gimbert, F., Tsai, V. C., Amundson, J. M., Bartholomaus, T. C., and Walter, J. I.: Subseasonal changes observed in subglacial channel pressure, size and sediment transport, Geophys. Res. Lett., 43, 3786–3794, 2016.
Gordon, S., Sharp, M., Hubbard, B., Smart, C., Ketterling, B., and Willis, I.: Seasonal reorganization of subglacial drainage inferred from measurements in boreholes, Hydrol. Proc., 12, 105–133, 1998.
Gorrell, G. and Shaw, J.: Deposition in an esker, bead and fan complex, Lanark, Ontario, Canada, Sediment. Geol., 72, 285–314, 1991.
Greenwood, S. L., Clason, C. C., Helanow, C., and Margold, M.: Theoretical, contemporary observational and palaeo-perspectives on ice sheet hydrology: Processes and products, Earth Sci. Rev., 155, 1–27, 2016.
Glasser, N. F. and Sambrook Smith, G. H.: Glacial meltwater erosion of the Mid-Cheshire Ridge: implications for ice dynamics during the Late Devensian glaciation of northwest England, J. Quatern. Sci., 14, 703–710, 1999.
Gudmundsson, G. H.: Transmission of basal variability to a glacier surface, J. Geophys. Res.-Sol. Earth, 108, 2253, https://doi.org/10.1029/2002JB002107, 2003.
Gulley, J. D., Grabiec, M., Martin, J. B., Jania, J., Catania, G., and Glowacki, P.: The effect of discrete recharge by moulins and heterogenity in flow-path efficiency at glacier beds on subglacial hydrology, J. Glaciol., 58, 926–940, 2012.
Hebrand, M. and Amark, M.: Esker formation and glacier dynamics in eastern Skane and adjacecnt areas, southern Sweden, Boreas, 18, 67–81, 1989.
Hewitt, I. J.: Modelling distributed and channelized subglacial drainage: the spacing of channels, J. Glaciol., 57, 302–314, 2011.
Hewitt, I. H. and Creyts, T. T.: A model for the formation of eskers, Geophys. Res. Lett., 46, 6673–6680, 2019.
Hodge, S. M.: Direct measurements of basal water pressures: progress and problems, J. Glaciol., 23, 309–319, 1979.
Hoffman, M. J. Andrews, L. C., Price, S. A., Catania, G. A., Neumann, T. A., Luthi, M. P., Gulley, J., Ryser, C., Hawley, R. L., and Morriss, B.: Greenland subglacial drainage evolution regulated by weakly connected regions of the bed, Nat. Commun., 7, 13903, https://doi.org/10.1038/ncomms13903, 2016.
Hooke, R. L. and Fastook, J.: Thermal conditions at the bed of the Laurentide ice sheet during deglaciation: implications for esker formation, J. Glaciol., 53, 646–658, 2007.
Hooke, R. L. and Jennings, C. E.: On the formation of the tunnel valleys of the southern Laurentide ice sheet, Quatern. Sci. Rev., 25, 1364–1372, 2006.
Hooke, R., Laumann, T., and Kohler, J.: Subglacial water pressures and the shape of subglacial conduits, J. Glaciol., 36, 67–71, 1990.
Hooke, R. L., Wold, B., and Hagen, J. O.: Subglacial hydrology and sediment transport at Bondhusbreen, southwest Norway, Geol. Soc. Am. Bull., 96, 388–397, 1985.
Hoyal, D. C. J. D., Van Wagoner, J. C., Adair, N. L., Deffenbaugh, M., Li, D., Sun, T., Huh, C., and Griffin, D. E.: Sedimentation from jets: A depositional model for clastic deposits of all scales and environments: Salt Lake City, Utah, Search and Discovery Article No. 40082, American Association of Petroleum Geologists Annual Meeting, 14 May, 2003.
Hubbard, B. P., Sharp, M. J., Willis, I. C., Nielsen, M. K., and Smart, C. C.: Borehole water-level variation and the structure of the subglacial hydrological system of Haut Glacier d'Arolla, Valais, Switzerland, J. Glaciol., 41, 572–583, 1995.
Ignéczi, A., Sole, A. J., Livingstone, S. J., Ng, F. S. L., and Yang, K.: Greenland ice sheet surface topography and draiange structure controlled by transfer of basal variability, Front. Earth Sci., 6, 101, https://doi.org/10.3389/feart.2018.00101, 2018.
Iken, A. and Bindschadler, R. A.: Combined measurements of subglacial water pressure and surface velocity of Findelengletscher, Switzerland: conclusions about drainage system and sliding mechanisms, J. Glaciol., 32, 101–119, 1986.
Iken, A., Rothlisberger, H., Flotron, A., and Harberli, W.: The uplift of Unteraargletscher at the beginning of the melt season – a consequnce of water sorage at the bed?, J. Glaciol., 29, 28–47, 1983.
Iverson, N. R., Baker, R. W., Hooke, R. L., Hanson, B., and Jansson, P.: Coupling between a glacier and a soft bed: I. A relation between effective pressure and local shear stress determined from till elasticity, J. Glaciol., 45, 31–40, 1999.
Jørgensen, F. and Sandersen, P. B. E.: Buried and open tunnel valleys in Denmark – erosion beneath multiple ice sheets, Quatern. Sci. Rev., 25, 1339–1363, 2006.
Joughin, I., Das, S. B., King, M., Smith, B. E., Howat, I. M., and Moon, T.: Seasonal speedup along the western flank of the Greenland Ice Sheet, Science, 320, 781–783, 2008.
Kamb, B.: Glacier surge mechanism based on linked cavity configuration of the basal water conduit system, J. Geophys. Res.-Sol. Ea., 92, 9038–9100, 1987.
Kamb, B., Raymond, C., Harrison, W., Engelhardt, H., Echelmeyer, K., Humphrey, N., Brugman, M. M., and Pfeffer, T.: Glacier surge mechanism: 1982–1983 surge of Variegated Glacier, Alaska, Science, 227, 469–479, 1985.
Karlstrom, L. and Yang, K.: Fluvial supraglacial landscape evolution on the Greenland Ice Sheet, Geophys. Res. Lett., 43, 2638–2692, 2016.
Kehew, A. E., Nicks, L. P., and Straw, W. T.: Palimpsest tunnel valleys: evidence for relative timing of advances in an interlobate area of the Laurentide ice sheet, Ann. Glaciol., 28, 47–52, 1999.
Kehew, A. E., Piotrowski, J. A., and Jørgensen, F.: Tunnel valleys: Concepts and controversies – A review, Earth-Sci. Rev., 113, 33–58, 2012.
Kerr, D., Knight, R., Sharpe, D., and Cummings, D.: Reconnaissance surficial geology, Lynx Lake, Northwest Territories, NTS 75-J, Geological Survey of Canada, 1 : 125 000, 2014a.
Kerr, D., Knight, R., Sharpe, D., and Cummings, D.: Reconnaissance surficial geology, Walmsley Lake, Northwest Territories, NTS 75-N, Canadian Geoscience Map-140, Geological Survey of Canada, 1 : 125 000, 2014b.
Kirkham, J., Hogan, K., Larter, R., Self, E., Games, K., Huuse, M., Stewart, M., Ottesen, D., Arnold, N., and Dowdeswell, J.: New insights into North Sea tunnel valley infill and genesis from high-resolution 3D seismic data, EGU General Assembly 2020, EGU2020-118, 2020.
Kleman, J. and Borgström, I.: Reconstruction of palaeo-ice sheets: the use of geomorphological data, Earth Surf. Proc. Land., 21, 893–909, 1996.
Koziol, C., Arbold, A., Pope, A., and Colgan, W.: Uantifying supraglacil meltwater pathways in the Paakitsoq region, West Greenland, J. Glaciol., 63, 464–476, 2017.
Lee, H. A., Craig, B. G., and Fyles, J. G.: Keewatin ice divide, Geol. Soc. Am. Bull., 68, 1760–1761, 1957.
Lelandais, T., Ravier, É., Pochat, S., Bourgeois, O., Clark, C., Mourgues, R., and Strzerzynski, P.: Modelled subglacial floods and tunnel valleys control the life cycle of transitory ice streams, The Cryosphere, 12, 2759–2772, https://doi.org/10.5194/tc-12-2759-2018, 2018.
Lewington, E. L. M., Livingstone, S., Sole, A. J., Clark, C. D., and Ng, F.: An automated method for mapping geomorphological expressions of former subglacial meltwater pathways (hummock corridors) from high resolution digital elevation data, Geomorphology, 339, 70–86, 2019.
Lewington, E., Livingstone, S., Clark, C., Sole, A., and Storrar, R.: Mapping of meltwater pathways around the Keewatin sector of the Laurentide ice sheet from ArcticDEM data. The University of Sheffield, Dataset, https://doi.org/10.15131/shef.data.12752987.v1, 2020.
Liestøl, O.: Storbreen Glacier in Jotunheimen, Norway, Norsk Polarinstitutt Skrifter, 141 pp., 1967.
Livingstone, S. J. and Clark, C. D.: Morphological properties of tunnel valleys of the southern sector of the Laurentide ice sheet and implications for their formation, Earth Surf. Dynam., 4, 567–589, 2016.
Livingstone, S. J., Storrar, R. D., Hillier, J. K., Stokes, C. R., and Tarasov, L.: An ice-sheet scale comparison of eskers with modelled subglacial drainage routes, Geomorphology, 246, 104–112, 2015.
Livingstone, S. J., Lewington, E. L. M., Clark, C. D., Storrar, R. D., Sole, A. J., McMartin, I., Dewald, N., and Ng, F.: A quasi-annual record of time-transgressive esker formation: implications for ice-sheet reconstruction and subglacial hydrology, The Cryosphere, 14, 1989–2004, https://doi.org/10.5194/tc-14-1989-2020, 2020.
Lliboutry, L.: General theory of subglacial cavitation and sliding of temperate glaciers, J. Glaciol., 7, 21–58, 1968.
Lundqvist, J. A. N.: Structure and rhythmic pattern of glaciofluvial deposits north of Lake Vänern, south-central Sweden, Boreas, 26, 127–140, 1997.
Mäkinen, J.: Time-transgressive deposits of repeated depositional sequences within interlobate glaciofluvial (esker) sediments in Köyliö, SW Finalnd, Sedimentology, 50, 337–360, 2003.
Mäkinen, J., Kajutti, K., Palmu, J.-P., Ojala, A., and Ahokangas, E.: Triangular-shaped landforms reveal subglacial drainage routes in SW Finland, Quatern. Sci. Rev., 164, 37–53, 2017.
Margold, M., Stokes, C. R., and Clark, C. D.: Ice streams in the Laurentide Ice Sheet: Identification, characteristics and comparison to modern ice sheets, Earth Sci. Rev., 143, 117–146, 2015.
Margold, M., Stokes, C. R., and Clark, C. D.: Reconciling records of ice streaming and ice margin retreat to produce a palaeographic reconstruction of the deglaciation of the Laurentide Ice Sheet, Quatern. Sci. Rev., 189, 1–30, 2018.
McMartin, I. and Henderson, P. J.: Evidence from Keewatin (central Nunavut) for paleo-ice divide migration, Geogr. Phys. Quatern., 58, 163–186, 2004.
Mooers, H. D.: On the formation of the tunnel valleys of the Superior Lobe, Central Minnesota, Quatern. Res., 32, 24–35, 1989.
Nanni, U., Gimbert, F., Vincent, C., Gräff, D., Walter, F., Piard, L., and Moreau, L.: Quantification of seasonal and diurnal dynamics of subglacial channels using seismic observations on an Alpine glacier, The Cryosphere, 14, 1475–1496, https://doi.org/10.5194/tc-14-1475-2020, 2020.
Ng, F. S. L.: Canals under sediment-based ice sheets, Ann. Glaciol., 30, 146–152, 2000.
Ng, F., Ignéczi, A., Sole, A. J., and Livingstone, S. J.: Response of surface topography to basal variability along glacial flowlines, J. Geophys. Res.-Earth Surf., 123, 2319–2340, 2018.
Nienow, P., Sharp, M., and Willis, I.: Seasonal changes in the morphology of the subglacial drainage system, Haut Glacier d'Arolla, Switzerland, Earth Surf. Proc. Land., 23, 825–884, 1998.
Noh, M. J. and Howat, I. M.: Automated stereo-photogrammetric DEM generation at high lattitudes: Surface Extraction with TIN-based Search-space Minimisation (SETSM) validation and demonstration over glaciated regions, GISci. Remote Sens., 52, 198–217, 2015.
Nye, J.: Water at the bed of a glacier, IASH Publications 95, Symposium at Cambridge 1969 – Hydrology of Glaciers, 189–194, 1973.
Ó Cofaigh, C.: Tunnel valley genesis, Progr. Phys. Geogr., 20, 1–19, 1996.
Ojala, A. E. K., Peterson, G., Mäkinen, J., Johnson, M. D., Kajutti, K., Palmu, J.-P., Ahokangas, E., and Öhrling, C.: Ice-sheet scale distribution and morphometry of triangular shaped hummocks (murtoos): a subglacial landform produced during rapid retreat of the Scandinavian Ice Sheet, Ann. Glaciol., 60, 115–126, 2019.
Palmer, S., Shepherd, A., Nienow, P., and Joughin, I.: Seasonal speed-up of the Greenland ice sheet linked to routing of surface water, Earth Planet. Sc. Lett., 302, 423–428, 2011.
Perkins, A. J., Brennand, T. A., and Burke, M. J.: Towards a morphogenetic classification of eskers: Implications for modelling ice sheet hydrology, Quatern. Sci. Rev., 134, 19–38, 2016.
Peterson, G. and Johnson, M. D.: Hummock corridors in the south-central sector of the Fennoscandian ice sheet, morphometry and pattern, Earth Surf. Proc. Land., 43, 919–929, 2018.
Peterson, G., Johnson, M. D., and Smith, C. A.: Glacial geomorphology of the south swedish uplands – focus on the spatial distribution of hummock tracts, J. Maps, 13, 534–544, 2017.
Peterson, G., Johnson, M. D., Dahlgren, S., Passe, T., and Alexanderson, H.: Genesis of hummocks found in tunnel valleys: an example from Horda, southern Sweden, GFF, 140, 189–544, 2018.
Piotrowski, J. A.: Tunnel-valley formation in north west Germany – geology, mechanisms of formation and subglacial bed conditions for the Bornhoved tunnel valley, Sediment. Geol., 89, 107–141, 1994.
Piotrowski, J. A.: Channelized subglacial drainage under soft-bedded ice sheets: evidence from small N-channels in Central European lowland, Geol. Q., 43, 153–162, 1999.
Porter, C., Morin, P., Howat, I., Noh, M.J., Bates, B., Peterman, K., Keesey, S., Schlenk, M., Gardiner, J., Tomko, K. Willis, M., Kelleher, C., Cloutier, M., Husby, E., Foga, S., Nakamura, H., Platson, M., Wethington, M. J., Williamson, C., Bauer, G., Enos, J., Arnold, G., Kramer, W., Becker, P., Doshi, A., D’Souza, C., Cummens, P., Laurier, F., and Bojesen, M.: ArcticDEM, Harvard Dataverse, V1, https://doi.org/10.7910/DVN/OHHUKH, 2018.
Powell, R. D.: Glacimarine processes at grounding-line fans and their growth to ice-contact deltas, Geo. Soc. S. P., 53, 53–73, 1990.
Praeg, D.: Seismic imaging of mid-Pleistocene tunnel valleys in the North Sea Basin – high resolution from low frequencies, J. App. Geophys., 53, 273–298, 2003.
Prowse, N. D.: Morphology and Sedimentology of Eskers in the Lac de Gras Area, Northwest Territories, Canada, PhD Thesis, Carleton University, Ottawa, Canada, 2017.
Punkari, M.: Glacial and glaciofluvial deposits in the interlobate areas of the Scandinavian Ice Sheet, Quatern. Sci. Rev., 16, 741–753, 1997.
Rada, C. and Schoof, C.: Channelized, distributed, and disconnected: subglacial drainage under a valley glacier in the Yukon, The Cryosphere, 12, 2609–2636, https://doi.org/10.5194/tc-12-2609-2018, 2018.
Rampton, V. N.: Large-scale effects of subglacial meltwater flow in the southern Slave Province, Northwest Territories, Canada, Can. J. Earth Sci., 37, 81–93, 2000.
Richards, G. and Moore, R. D.: Suspended sediment dynamics in a steep, glacier-fed mountain stream, Place Creek, Canada, Hydrol. Proc., 17, 1733–1753, 2003.
Rothlisberger, H.: Water pressure in Intra-and Subglacial Channels, J. Glaciol., 11, 177–203, 1972.
Russell, A. J., Gregory, A. R., Large, A. R., Fleisher, P. J., and Harris, T. D.: Tunnel channel formation during the November 1996 jökulhlaup, Skeiðarárjökull, Iceland, Ann. Glaciol., 45, 95–103, 2007.
Rust, B. R. and Romanelli, R.: Late quaternary subaqueous outwash deposits near Ottawa, Canada, in: Glaciofluvial and Glaciolacustrine Sedimentation, edited by: Jopling, A. V. and McDonald B. C., Soc. Econ. Paleontol. Mineral., Spec. Publ. 177–192, 1975.
Schoof, C.: Ice sheet acceleration driven by melt supply variability, Nature, 468, 803–806, 2010.
Sharpe, D., Kjarsgaard, B., Knight, R. D., Russell, H. A. J., and Kerr, D. E.: Glacial dispersal and flow history, East Arm area of Great Slave Lake, NWT, Canada, Quatern. Sci. Rev., 165, 49–72, 2017.
Shepherd, A., Hubbard, A., Nienow, P., King, M., McMillan, M., and Joughin, I.: Greenland ice sheet motion coupled with daily melting in lare summer, Geophys. Res. Lett., 36, 2–5 2009.
Shilts, W. W., Aylsworth, J. M., Kaszycki, C. A., and Klasson, R. A.: Canadian Shield, in: Geomorphi Systems of North America, edited by: Graf, W. L., Geological Society of America, Boulder, Colorado, Centennial Special Volume 2, 119–161, 1987.
Shreve, R. L.: Movement of water in glaciers, J. Glaciol., 11, 205–214, 1972.
Shreve, R. L.: Esker characteristics in terms of glacial physics, Katahdin esker system, Maine, Geol. Soc. Am. Bull., 96, 639–646, 1985.
Sissons, J. B.: A subglacail drainage system by the Tinto Hills, Lankashire, Trans Edinb. Geol. Soc., 18, 175–192, 1961.
Sjogren, D. B., Fisher, T. G., Taylor, L. D., Jol, H. M., and Munro-Stasiuk, M. J.: Incipient tunnel channels, Quaternary Int., 90, 41–56, 2002.
Smith, M. J. and Clark, C. D.: Methods for the cisualisation of digital elevation models for landform mapping, Earth Surf. Proc. Land., 30, 885–900, 2005.
Sole, A., Nienow, P., Bartholomew, I., Mair, D., Cowton, T., Tedstone, A., and King, M. A.: Winter motion mediates dynamic response of the Greenland Ice Sheet to warmer summers, Geophys. Res. Lett., 40, 3940–3944. 2013.
Stokes, C. R. and Clark, C. D.: TheDubawnt Lake palaeo-ice stream: evidence for dynamic ice sheet behaviour on the Canadian Shield and insights regarding the controls on ice-stream location and vigour, Boreas, 32, 263–279, 2003a.
Stokes, C. R. and Clark, C. D.: Laurentide ice streaming on the Canadian Shield: A conflict with the soft-bedded ice stream paradigm?, Geology, 31, 347–350, 2003b.
Stokes, C. R., Margold, M., Clark, C. D., and Tarasov, L.: Ice stream activity scaled to ice sheet volume during Laurentide Ice Sheet deglaciation, Nature, 530, 322–326, 2016.
St-Onge, D. A.: Surficial deposits of the Redrock Lake area, District of Mackenzie, in: Current Research, Part A, Geological Survey of Canada, Paper 84, 271–278, 1984.
Storrar, R. D.: Reconstructing subglacail meltwater dynamics from the spatial and temporal variation in the form and pattern of eskers, Doctoral thesis, Durham University, 2014.
Storrar, R. D., Ewertowski, M., Tomczyk, A., Barr, I. D., Livingstone, S. J., Ruffell, A., Stoker, B., and Evans, D. J. A.: Equifinality and preservation potential of complex eskers, Boreas, 49, 211–231, 2019.
Storrar, R. D. and Livingstone, S. J.: Glacial geomorphology of the northern Kivalliq region, Nunavut, Canada, with an emphasis on meltwater drainage systems, J. Maps, 13, 153–164, 2017.
Storrar, R. D., Stokes, C. R., and Evans, D. J. A.: A map of large Canadian eskers from Landsat imagery, J. Maps, 3, 456–473, 2013.
Storrar, R. D., Stokes, C. R., and Evans, D. J. A.: Morphometry and pattern of a large sample (> 20 000) of Canadian eskers and implications for subglacial drainage beneath ice sheets, Quatern. Sci. Rev., 105, 1–25, 2014a.
Storrar, R. D., Stokes, C. R. Evans, D. J. A.: Increased channelization of subglacial drainage during deglaciation of the Laurentide Ice Sheet, Geology, 42, 239–242, 2014b.
Stroeven, A. P., Hättestrand, C., Kleman, J., Heyman, J., Fabel, D., Fredin, O., Goodfellow, B. W., Harbor, J. M., Jansen, J. D., Olsen, L., Caffee, M. W., Fink, D., Lundqvist, J., Rosqvist, G. C., Strömberg, B. and Jansson, K. N.: Deglaciation of Fennoscandia, Quatern. Sci. Rev., 147, 91–121, 2016.
Swift, D. A., Nienow, P. W., Spedding, N., and Hoey, T. B.: Geomorphic implications of subglacial drainage configuration: rates of basal sediment evacuation controlled by seasonal drainage system evolution, Sediment. Geol., 149, 5–19, 2002.
Swift, D. A., Nienow, P. W., Hoey, T. B., and Mair, D. W. F.: Seasonal evolution of runoff from Haut Glacier d'Arolla, Switzerland and implications for glacial geomorphic processes, J. Hydrol., 309, 133–148, 2005b.
Tedstone, A. J., Nienow, P. W., Gourmelen, N., Dehecq, A., Goldberg, D., and Hanna, E.: Decadal slow-down of a land-terminating sector of the Greenland Ice Sheet despite warming, Nature, 526, 692–695, 2015.
Tedstone, A. J., Nienow, P. W., Gourmelen, N., and Sole, A. J.: Greenland ice sheet annual motion insensitive to spatial variations in subglacial hydraulic structure, Geophys. Res. Lett., 41, 8910–8917, 2014.
Tedstone, A. J., Nienow, P. W., Sole, A. J., Mair, D. W., Cowton, T. R., Bartholomew, I. D., and King, M. A.: Greenland ice sheet motion insensitive to exceptional meltwater forcing, P. Natl. Acad. Sci. USA, 110, 19719–19724, 2013.
Utting, D. J., Ward, B. C., and Little, E. C.: Genesis of hummocks in glaciofluvial corridors near the Keewatin Ice Divide, Canada, Boreas, 38, 471–481, 2009.
Van der Vegt, P., Janszen, A., and Moscariello, A.: Tunnel valleys: current knowledge and future perspectives, Geol. Soc. Sp., 368, 75–97, 2012.
van de Wal, R. S. W., Boot, W., Van den Broeke, M. R., Smeets, C. J. P. P., Reijmer, C. H., Donker, J. J. A., and Oerlemans, J.: Large and rapid melt-induced velocity changes in the ablation zone of the Greenland Ice Sheet, Science, 321, 111–113, 2008.
van de Wal, R. S. W., Smeets, C. J. P. P., Boot, W., Stoffelen, M., van Kampen, R., Doyle, S. H., Wilhelms, F., van den Broeke, M. R., Reijmer, C. H., Oerlemans, J., and Hubbard, A.: Self-regulation of ice flow varies across the ablation area in south-west Greenland, The Cryosphere, 9, 603–611, https://doi.org/10.5194/tc-9-603-2015, 2015.
Vore, M. E., Bartholomaus, T. C., Winberry, J. P., Walter, J. I., and Amundson, J. M.: Seismic tremor reveals spatial organisation and temporal changes of subglacial water system, J. Geophys. Res., 124, 427–446, 2019.
Walder, J. S.: Hydraulics of subglacial cavities, J. Glaciol., 32, 439–445, 1986.
Walder, J. S. and Fowler, A.: Channelized subglacial drainage over a deformable bed, J. Glaciol., 40, 3–15, https://doi.org/10.3189/S0022143000003750, 1994.
Ward, B. C., Dredge, L. A., and Kerr, D. E.: Surficial geology, Lac de Gras, District of Mackenzie, Northwest Territories (NTS 76-D), Geological Survey of Canada, 1 : 125 000, 1997.
Warren, W. P. anf Ashley, G. M.: Origins of the ice-contact stratified ridges (eskers) of Ireland, J. Sediment. Res., 64, 433–449, 1994.
Weertman, J.: General theory of water flow at the base of a glacier or ice sheet, Rev. Geophys. Space Phys., 10, 287–333, 1972.
Werder, M. A. Hewitt, I. J., Schoof, C. G., and Flowers, G. E.: Modeling channelized and distributed subglacial drainage in two dimensions, J. Geophys. Res.-Earth Surf., 118, 2140–2158, 2013.
Wheeler, J. O., Hoffman, P. F., Card, K. D., Davidson, A., Sanford, B. V., Okulitch, A. V., and Roest, W. R.: Geological Map of Canada, Geological Survey of Canada, map 1860A, 1996.
Williams, J. J., Gourmelen, N., and Nienow, P.: Dynamic response of the Greenland ice sheet to recent cooling, Sci. Rep., 10, 1647, https://doi.org/10.1038/s41598-020-58355-2, 2020.
Willis, I. C., Sharp, M. J., and Richards, K. S.: Configuration of the drainage system of Midtdalsbreen, Norway, as indicated by dye-tracing experiments, J. Glaciol., 36, 89–101, 1990.
Willis, I. C., Richards, K. S., and Sharp, M. J.: Links between proglacial stream suspended sediment dynamics, glacier hydrology and glacier motion at Midtdalsbreen, Norway, Hydrol. Proc., 10, 629–648, 1996.
Zwally, H. J., Abdalati, W., Herring, T., Larson, K., Saba, J., anf Steffen, K.: Surface melt induced acceleration of the Greenland Ice Sheet flow, Science, 297, 218–222, 2002.