the Creative Commons Attribution 4.0 License.
the Creative Commons Attribution 4.0 License.
 | 03 Sep 2020
Soil respiration of alpine meadow is controlled by freeze–thaw processes of active layer in the permafrost region of the Qinghai–Tibet Plateau
Junfeng Wang
Qingbai Wu
Ziqiang Yuan
Hojeong Kang
Freezing and thawing action of the active layer plays a significant role in soil respiration (Rs) in permafrost regions. However, little is known about how the freeze–thaw processes affect the Rs dynamics in different stages of the alpine meadow underlain by permafrost in the Qinghai–Tibet Plateau (QTP). We conducted continuous in situ measurements of Rs and freeze–thaw processes of the active layer at an alpine meadow site in the Beiluhe permafrost region of the QTP and divided the freeze–thaw processes into four different stages in a complete freeze–thaw cycle, comprising the summer thawing (ST) stage, autumn freezing (AF) stage, winter cooling (WC) stage, and spring warming (SW) stage. We found that the freeze–thaw processes have various effects on the Rs dynamics in different freeze–thaw stages. The mean Rs ranged from 0.12 to 3.18 µmol m−2 s−1 across the stages, with the lowest value in WC and highest value in ST. Q10 among the different freeze–thaw stages changed greatly, with the maximum (4.91±0.35) in WC and minimum (0.33±0.21) in AF. Patterns of Rs among the ST, AF, WC, and SW stages differed, and the corresponding contribution percentages of cumulative Rs to total Rs of a complete freeze–thaw cycle (1692.98±51.43 g CO2 m−2) were 61.32±0.32 %, 8.89±0.18 %, 18.43±0.11 %, and 11.29±0.11 %, respectively. Soil temperature (Ts) was the most important driver of Rs regardless of soil water status in all stages. Our results suggest that as climate change and permafrost degradation continue, great changes in freeze–thaw process patterns may trigger more Rs emissions from this ecosystem because of a prolonged ST stage.
- Article
(6685 KB) - Full-text XML
- BibTeX
- EndNote


Soil respiration (Rs) is a significant source in estimating the terrestrial carbon budget under climate change. It is the second-largest source of carbon emissions to the atmosphere from the terrestrial ecosystem on a global scale (Bond-Lamberty and Thomson, 2010; Schlesinger and Andrews, 2000). In permafrost regions, Rs not only depends on the distribution of vegetation and the content of soil organic matter (Ping et al., 2008; Grogan and Chapin, 2000; Phillips et al., 2011; Jobbágy and Jackson, 2000) but also is regulated by the freeze–thaw process of the active layer (Hollesen et al., 2011). Many studies have shown that the wintertime emissions contribute significantly to the annual CO2 balances. For example, the Arctic tundra ecosystem is becoming a consistent source of CO2 because CO2 emission in winter offsets its uptake in the growing season with progressive permafrost thaw and active-layer thickening (Celis et al., 2017). In Alaska, emissions of CO2 from tundra during early winter seasons have increased by about 73 % since 1975, and the Arctic ecosystem has been a net source of CO2 due to rising temperatures (Commane et al., 2017). For the subarctic tundra ecosystem, the wintertime CO2 loss has also been increasing due to sustained tundra warming, and as a result the ecosystem's historical function is shifting away from a carbon sink to a carbon source (Lüers et al., 2014; Webb et al., 2016). In permafrost regions in the Northern Hemisphere, the amount of soil organic carbon (SOC) stored reaches 1832 Pg (Ding et al., 2015; Tarnocai, 2009), of which about 689 Pg is distributed in the 0–1 m depth, 1035±150 Pg in the 0–3 m depth, and 648 Pg in the 3–25 m depth (Hugelius et al., 2014; Tarnocai et al., 2009). Due to its high sensitivity to global warming and direct contribution to the atmosphere greenhouse gas content, carbon emission from permafrost regions has received worldwide attention (Tarnocai, 2009; Zimov et al., 2009).
Both the active layer and the whole permafrost distributed in the Arctic and midlatitude alpine regions are undergoing significant changes due to global warming (Jorgenson and Osterkamp, 2005). The active layer, which acts as a buffer between permafrost and the atmosphere, is highly sensitive and responsive to climate change (Li et al., 2012). The exchange of energy and water in permafrost regions between the land and the atmosphere mainly occurs through the active layer. However, in a whole freeze–thaw cycle, the active layer will undergo a series of cooling, initial freezing to full freezing, dropping in temperature, rising in temperature but still in a frozen state, initial thawing to full thawing, and rising in temperature but in a thawed state (Jiao and Li, 2014). At different developing stages of freeze–thaw cycling, the heat distribution and transmission in the active layer show significantly different characteristics (Zhao et al., 2000). Thus the soil physicochemical properties, microbial activities, and biogeochemical processes at different freeze–thaw stages are also different from each other (Henry, 2007). As such, the dynamics of Rs emission at different freeze–thaw stages may show apparent differences. Furthermore, the thawing of permafrost and the deepening of the active layer will expose frozen organic carbon to microbial decomposition and cause the previously frozen SOC to become available for mineralization (Walz et al., 2017). This may accelerate a positive permafrost carbon feedback to climate change (Schuur et al., 2008). A 6-year study of CO2 flux in moist acidic tundra has shown that the active-layer thickness is a key driver of net ecosystem exchange (NEE), gross primary productivity (GPP), and ecosystem respiration (Celis et al., 2017). In high-altitude mountain regions, permafrost thawing has caused the alpine tundra to release CO2 from organic carbon stored for a long time to the atmosphere, exacerbating climate change (Knowles et al., 2019). Therefore, permafrost must be playing a significant role in carbon–climate feedbacks due to its intensity of climate forcing and the size of its carbon pools (MacDougall et al., 2012; Schneider von Deimling et al., 2012).
The strength and timing of permafrost carbon feedback essentially depend on the freeze–thaw process of the active layer and the distribution of SOC in permafrost regions. Therefore, understanding the effects of freeze–thaw actions on Rs at different freeze–thaw stages is critical for better predicting future climate changes. However, it is still unclear how the freeze–thaw actions at different stages regulate the Rs.
The Qinghai–Tibet Plateau (QTP) of China has the largest extent of permafrost in the low to middle latitudes of the world and is very sensitive to global climate change (Liu and Chen, 2000; Wu et al., 2010). Soil organic carbon (SOC) pools in the permafrost regions of the QTP were estimated to be 160±87 Pg, which is approximately 8.7 % of those in the northern circumpolar permafrost region (Mu et al., 2015). Recent years have witnessed dramatic changes in freeze–thaw occurrence, active-layer thickness, and near-surface permafrost temperature in the QTP. In the permafrost regions distributed in the alpine meadow ecosystem in the QTP between 2002 and 2012, the average onset of spring thawing at a 50 cm depth advanced by at least 16 d; the duration of thaw increased by at least 14 d; the active-layer thickness increased by ∼ 4.26 cm a−1, and the near-surface permafrost temperature at 6 and 10 m depths increased by ∼ 0.13 and ∼ 0.14 ∘C, respectively (Wu et al., 2015). Therefore, the Rs of the alpine meadow is anticipated to be influenced and changed dramatically due to the variations in freeze–thaw occurrence, active-layer thickness, and near-surface permafrost temperature.
We took in situ measurements of Rs and the freeze–thaw process of the active layer in an alpine meadow from January 2017 to December 2018. The objectives were (1) to determine the dynamics of the Rs during a complete freeze–thaw process of the active layer, (2) to compare the Rs patterns among the different freeze–thaw stages and their contribution to total Rs emission in a complete freeze–thaw cycle in this region, and (3) to establish a preferable Rs model to accurately predict the soil CO2 emission of each freeze–thaw stage.
Table 1Biomass and soil properties at the experiment setup.
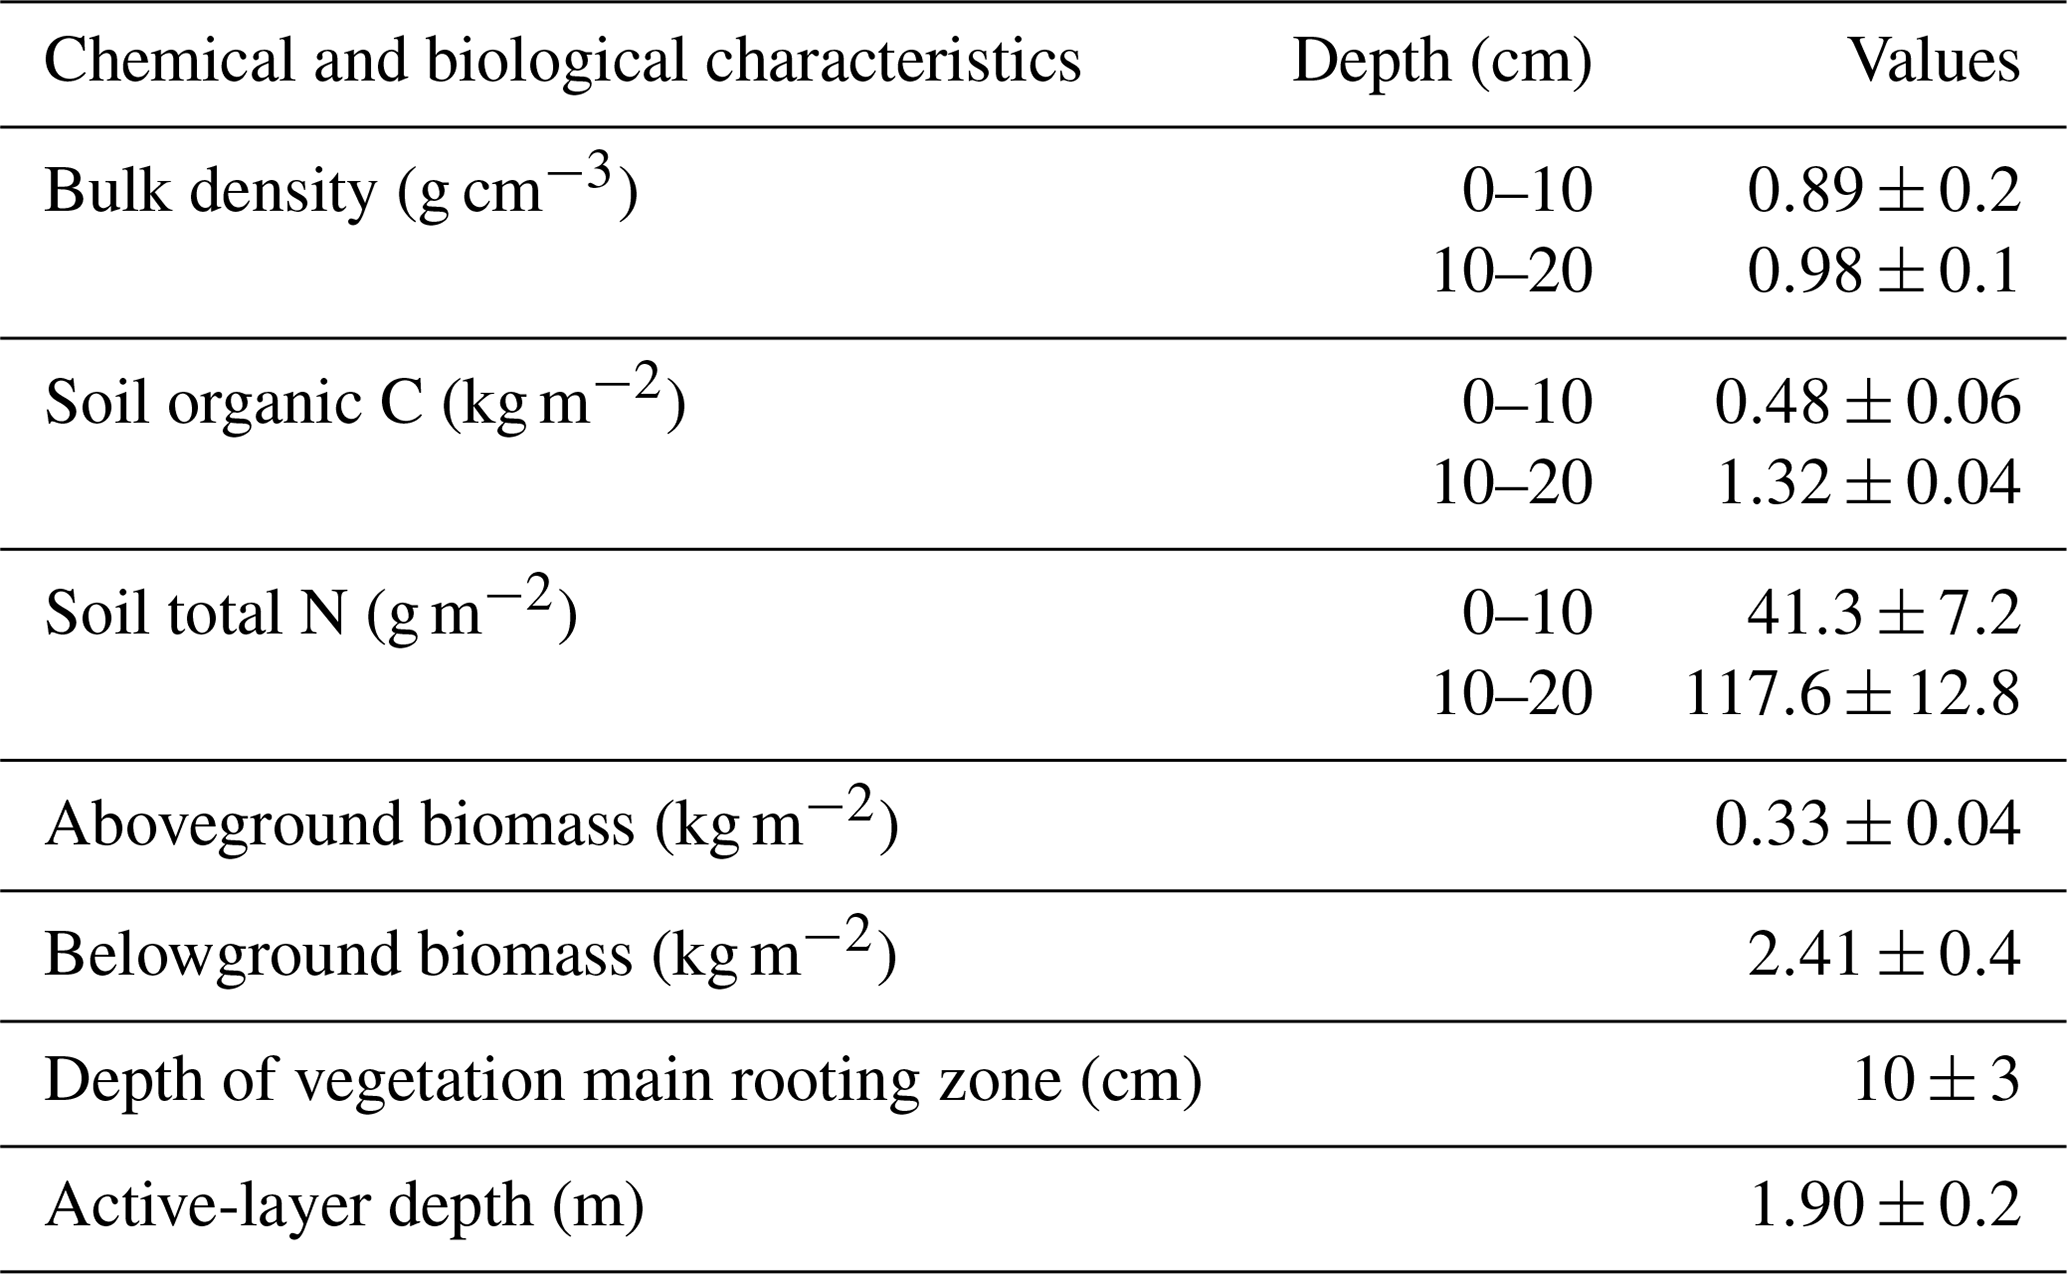
Values are means (n=5) ± standard deviation (SD).
2.1 Study site
The experiment was conducted in an alpine meadow ecosystem of the Beiluhe region (34∘49′25.8′′ N, 92∘55′45.1′′ E), in the hinterland of the QTP, China. The study site represents an area of 151.6 km2, with an altitude of 4600–4800 m, which is underlain by continuous permafrost with an active layer of 1.1–2.3 m. The soil types in the study site are primarily classified as MatticGelic Cambisols (alpine meadow soil) in Chinese taxonomy or as Cambisols in the Food and Agriculture Organization of the United Nations (FAO) and UN Educational, Scientific and Cultural Organization taxonomy (Wang et al., 2014). The mean annual temperature is −3.60 ∘C, which is lower than that of most other areas in the QTP (Yin et al., 2017). The mean annual precipitation is 423.79 mm, 80 % of which falls as rain, sometimes mixed with small hailstones during the growing season (from May to September). In winter, a little snow falls but is quickly blown away and sublimated off due to high wind and low air temperature, so the study site is not persistently covered by snow. The air pressure is approximately 550 hPa. The alpine meadow represents the most common vegetation type in the QTP and covers more than 70 % of whole area (Wang and Wu, 2013; Y. Zhang et al., 2015). The alpine meadow ecosystem mainly consists of cold mesoperennial herbs that grow in conditions where a moderate amount of water is available, such as Kobresia pygmaea C. B. Clarke, Kobresia humilis C. A. Mey. ex Trautv., Sergievskaya, Kobresia capillifolia (Decne.) C. B. Clarke, Kobresia myosuroides (Villars) Fiori, Kobresia graminifolia C. B. Clarke, Carex atrofusca Schkuhr subsp. minor (Boott) T. Koyama, and Carex scabriostris Kukenthal (Chen et al., 2017). On-site surveying and sampling of the experiment setup showed that soil bulk density, soil organic carbon, and total N content at the 10–20 cm depth were higher than those at the 0–10 cm depth. The depth of the active layer was about 1.9 m. The belowground biomass was much greater than that above ground. The average depth of the vegetation main rooting zone was around 10 cm (Table 1).
2.2 Measurement of the freeze–thaw process of the active layer
In the study site, one flat terrain with vegetation coverage of above 70 % was selected to establish the active-layer observation site. According to active-layer lithology and practical conditions, soil temperature and soil moisture probes were installed at different depths. The installation depths for the soil temperature probes were 5, 20, 50, 80, 120, 150, 180, and 230 cm, and the depths for the soil moisture probes were 5, 20, 50, 80, 120, 150, and 180 cm. Soil temperature was measured using thermistors made by the State Key Laboratory of Frozen Soil Engineering (SKLFSE, China) with an accuracy of ±0.05 ∘C. Soil moisture was measured using calibrated soil moisture sensors (EC-5, Decagon, USA) with an accuracy of ±0.02 m3 m−3. Soil moisture measured using the EC-5 probe represents the volumetric water content of liquid water per total soil volume. These measurements were collected automatically every 30 min each day by a data logger (CR3000, Campbell Scientific, USA).
Utilizing the measurements collected by soil temperature probes and a data logger, the soil hourly mean temperature (Tavg), maximum temperature (Tmax), and minimum temperature (Tmin) of each day at different depths were calculated. Assuming that the soil particle surface energy and the salinity of soil have no influence on the soil freezing temperature (Jiao and Li, 2014), the date on which hourly Tavg continued to be lower or higher than 0 ∘C was regarded as the onset freezing or onset thawing date, respectively, according to the Tavg values (Yang et al., 2002). If Tmax was greater than 0 ∘C and Tmin was less than 0 ∘C in a single day, it was regarded that the soil was undergoing a daily freeze–thaw process. That is, the soil absorbs heat and thaws during the daytime, and releases heat and freezes during the nighttime, showing a daily freeze–thaw cycling phenomenon. Based on these criteria, the whole freeze–thaw process of the active layer can be divided into different stages.
To calculate the freezing or thawing thickness of the active layer in the freeze–thaw process, freeze or thaw depth was estimated by linearly interpolating soil temperature profiles between two neighboring points above and below the 0 ∘C isotherm (Wu et al., 2010). The freezing or thawing thickness of the active layer was estimated from daily soil temperature measurements.
2.3 Soil respiration measurement
For the measurements of Rs, six 5 m × 5 m plots were randomly selected around the active-layer observation site, and one polyvinyl chloride (PVC) collar (20 cm in internal diameter and 10 cm in height) was inserted into each plot to a depth of 8 cm into the soil with a chamber offset of 2 cm before the soil froze. All the PVC collars were left in place until the end of the study. Rs flux was measured using an LI-8100A automated soil gas flux system (LI-COR Inc., Lincoln, NE, USA). A standard LI-COR® 20 cm head was applied for measurements with a 10 ppm range set, and the offset of the program was adjusted to 2 cm. A typical survey measurement protocol was adopted with an observation length of 2 min, deadband of 25 s, prepurge of 30 s, and postpurge of 45 s. The chamber volume and the infrared gas analyzer (IRGA) volume were automatically calculated by the program. Living plants inside the collar were removed carefully on the soil surface at least 1 d before the measurement. Rs flux was measured for 2 years covering a complete freeze–thaw cycle of the active layer between 2017 and 2018.
Rs flux was determined once every 2 or 3 d during the thawing period and once every 7 d during the freezing period due to harsh environmental conditions and lack of human resources. Measurements were taken between 09:00 and 11:30 local time on every sampling day to represent the daily average flux based on the diurnal measurements (T. Zhang et al., 2015). At the same time, soil temperature (Ts) and soil volumetric water content (SWC) at a 5 cm depth were determined besides the collars using the thermocouple probe and the ECH2O soil moisture sensor (Decagon Devices Inc., WA, USA) connected to the LI-8100A.
2.4 Temperature sensitivity and scaling for Rs at different freeze–thaw stages
For each freeze–thaw stage, the relationship between Rs flux and soil temperature or soil water content was determined by fitting to exponential and polynomial functions given in Eqs. (1) and (2), respectively (T. Zhang et al., 2015).
where Rs is the measured soil respiration rate (µmol m−2 s−1); T and SWC are soil temperature and water content at a 5 cm depth, respectively; and β0, β1, a, b, and c are coefficients. The exponential relationship is commonly used to represent soil respiration and soil carbon efflux as functions of temperature (Janssens and Pilegaard, 2003; Davidson et al., 1998). Q10 represents the temperature sensitivity of Rs, which is a measure of change in reaction rate at intervals of 10 ∘C and is based on Van 't Hoff's empirical rule (Lloyd and Taylor, 1994). Q10 based on Eq. (1) was calculated as Eq. (3) (Davidson and Janssens, 2006; Davidson et al., 1998).
The daily average Rs flux for the different freeze–thaw stages was obtained based on the best fitting Eqs. (1) or (2) and the corresponding daily average soil temperatures or soil water contents at a 5 cm depth measured by a data logger set up at the study site. The cumulative Rs emission at the different freeze–thaw stage was calculated by computing the sum of products of the average flux rate and the start–stop time of the different freeze–thaw stages of the active layer as follows (Zhang et al., 2017):
where k and m are the corresponding onset date and end date of each freeze–thaw stage, respectively, and Rmk is the daily Rs emission over the specific freeze–thaw stage.
2.5 Statistical analysis
Repeated measures ANOVA was applied for testing the statistical significance of the differences among freeze–thaw stages. Regression analysis was performed between Rs and soil temperature and soil moisture. At different freeze–thaw stages, the fitting equations with higher R2 values were selected as the preferable models to predict the daily soil CO2 emission. To evaluate the reliability of the Rs models at the different freeze–thaw stages, root mean square error (RMSE) analysis was performed. All statistical analyses were carried out at a significance level of 0.05 and were completed using SPSS 16.0 (SPSS Inc., Chicago, IL, USA).
3.1 Division of different freeze–thaw stages of the active layer
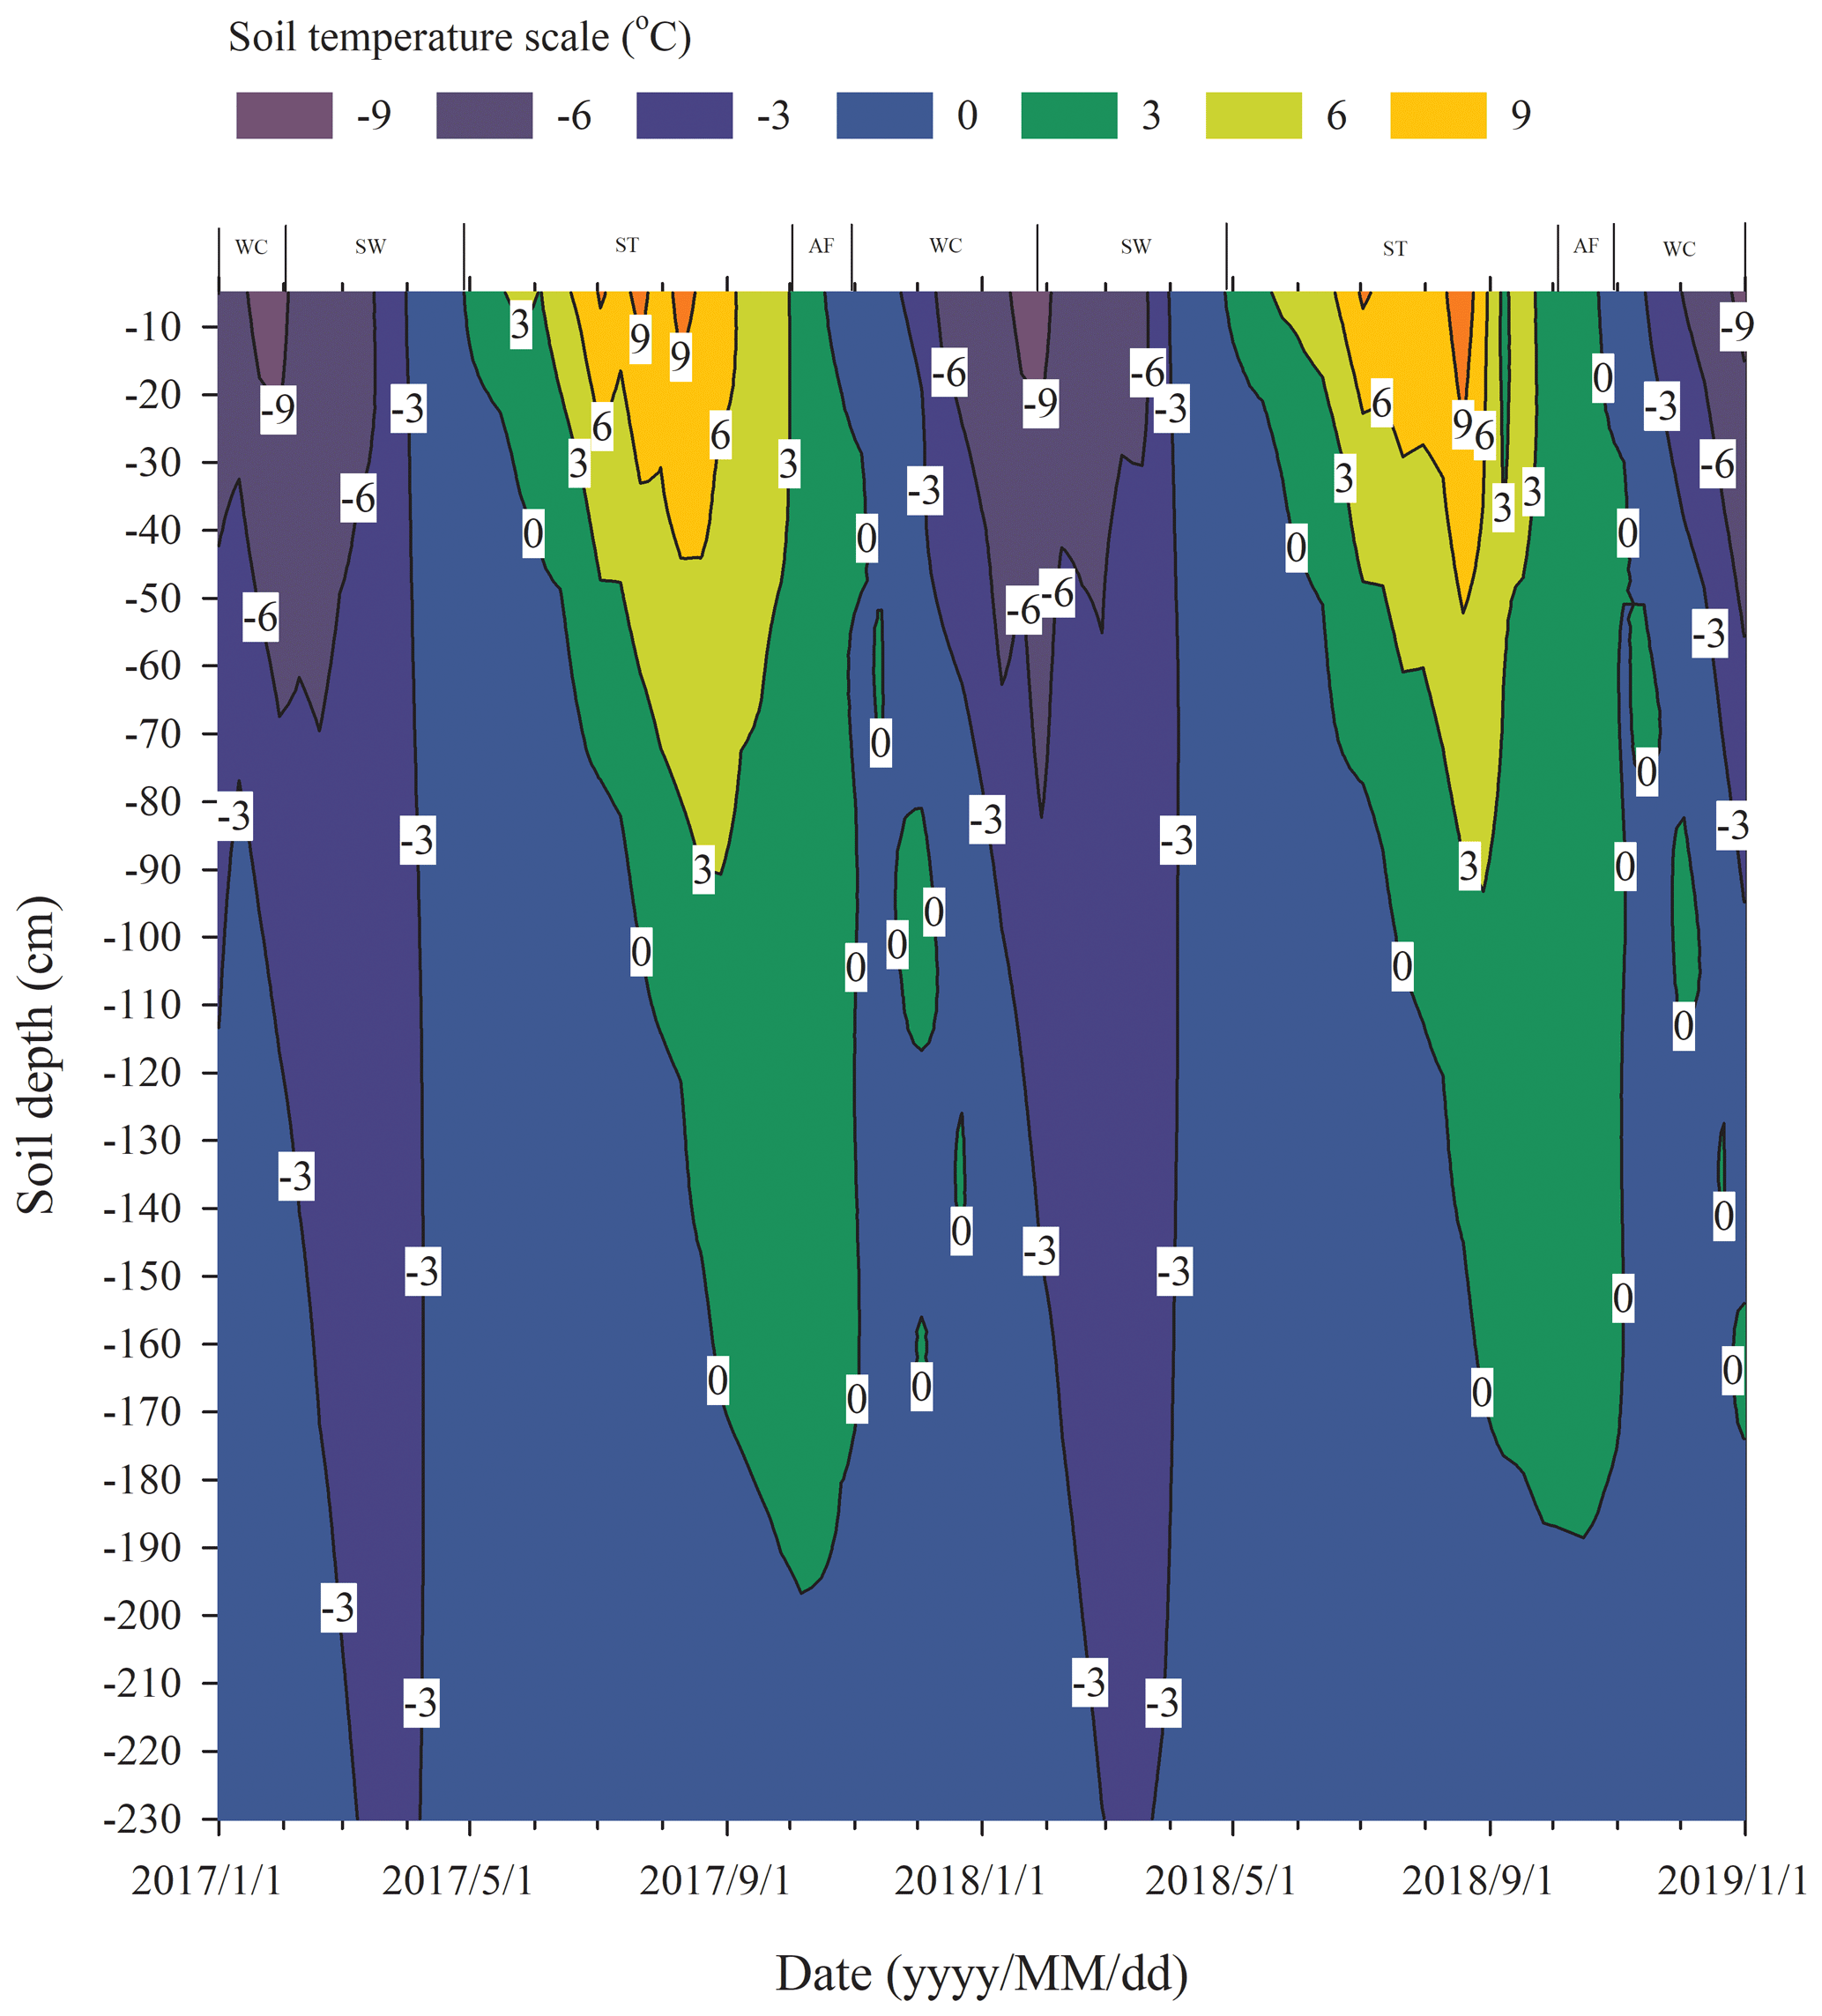
We assumed that the soils began to freeze when the temperature dropped lower than 0 ∘C and to thaw when the temperature was continuously greater than 0 ∘C, based on the fact that the effects of the surface energy of soil particles and salinity in soil on freezing temperatures are negligible. Continuous observation for 2 years of the freezing and thawing of the active layer in the study site showed that the contour outline of 0 ∘C began to slowly develop downwards from the soil surface from late April and reached the maximum depth in early October (Fig. 1). The maximum thawing depth of the active layer was 1.98 m in 2017 and 1.89 m in 2018. During this thawing period, the isotherm of 0 ∘C changed gently. However, the isotherm of 0 ∘C changed rapidly from early October to late November, indicating that the whole active layer froze from the surface to the bottom in a short period of time. According to the variations in soil temperature and soil water content in the active layer, the freezing and thawing cycle process of the active layer was divided into four distinctive stages; summer thawing (ST) stage, autumn freezing (AF) stage, winter cooling (WC) stage, and spring warming (SW) stage.
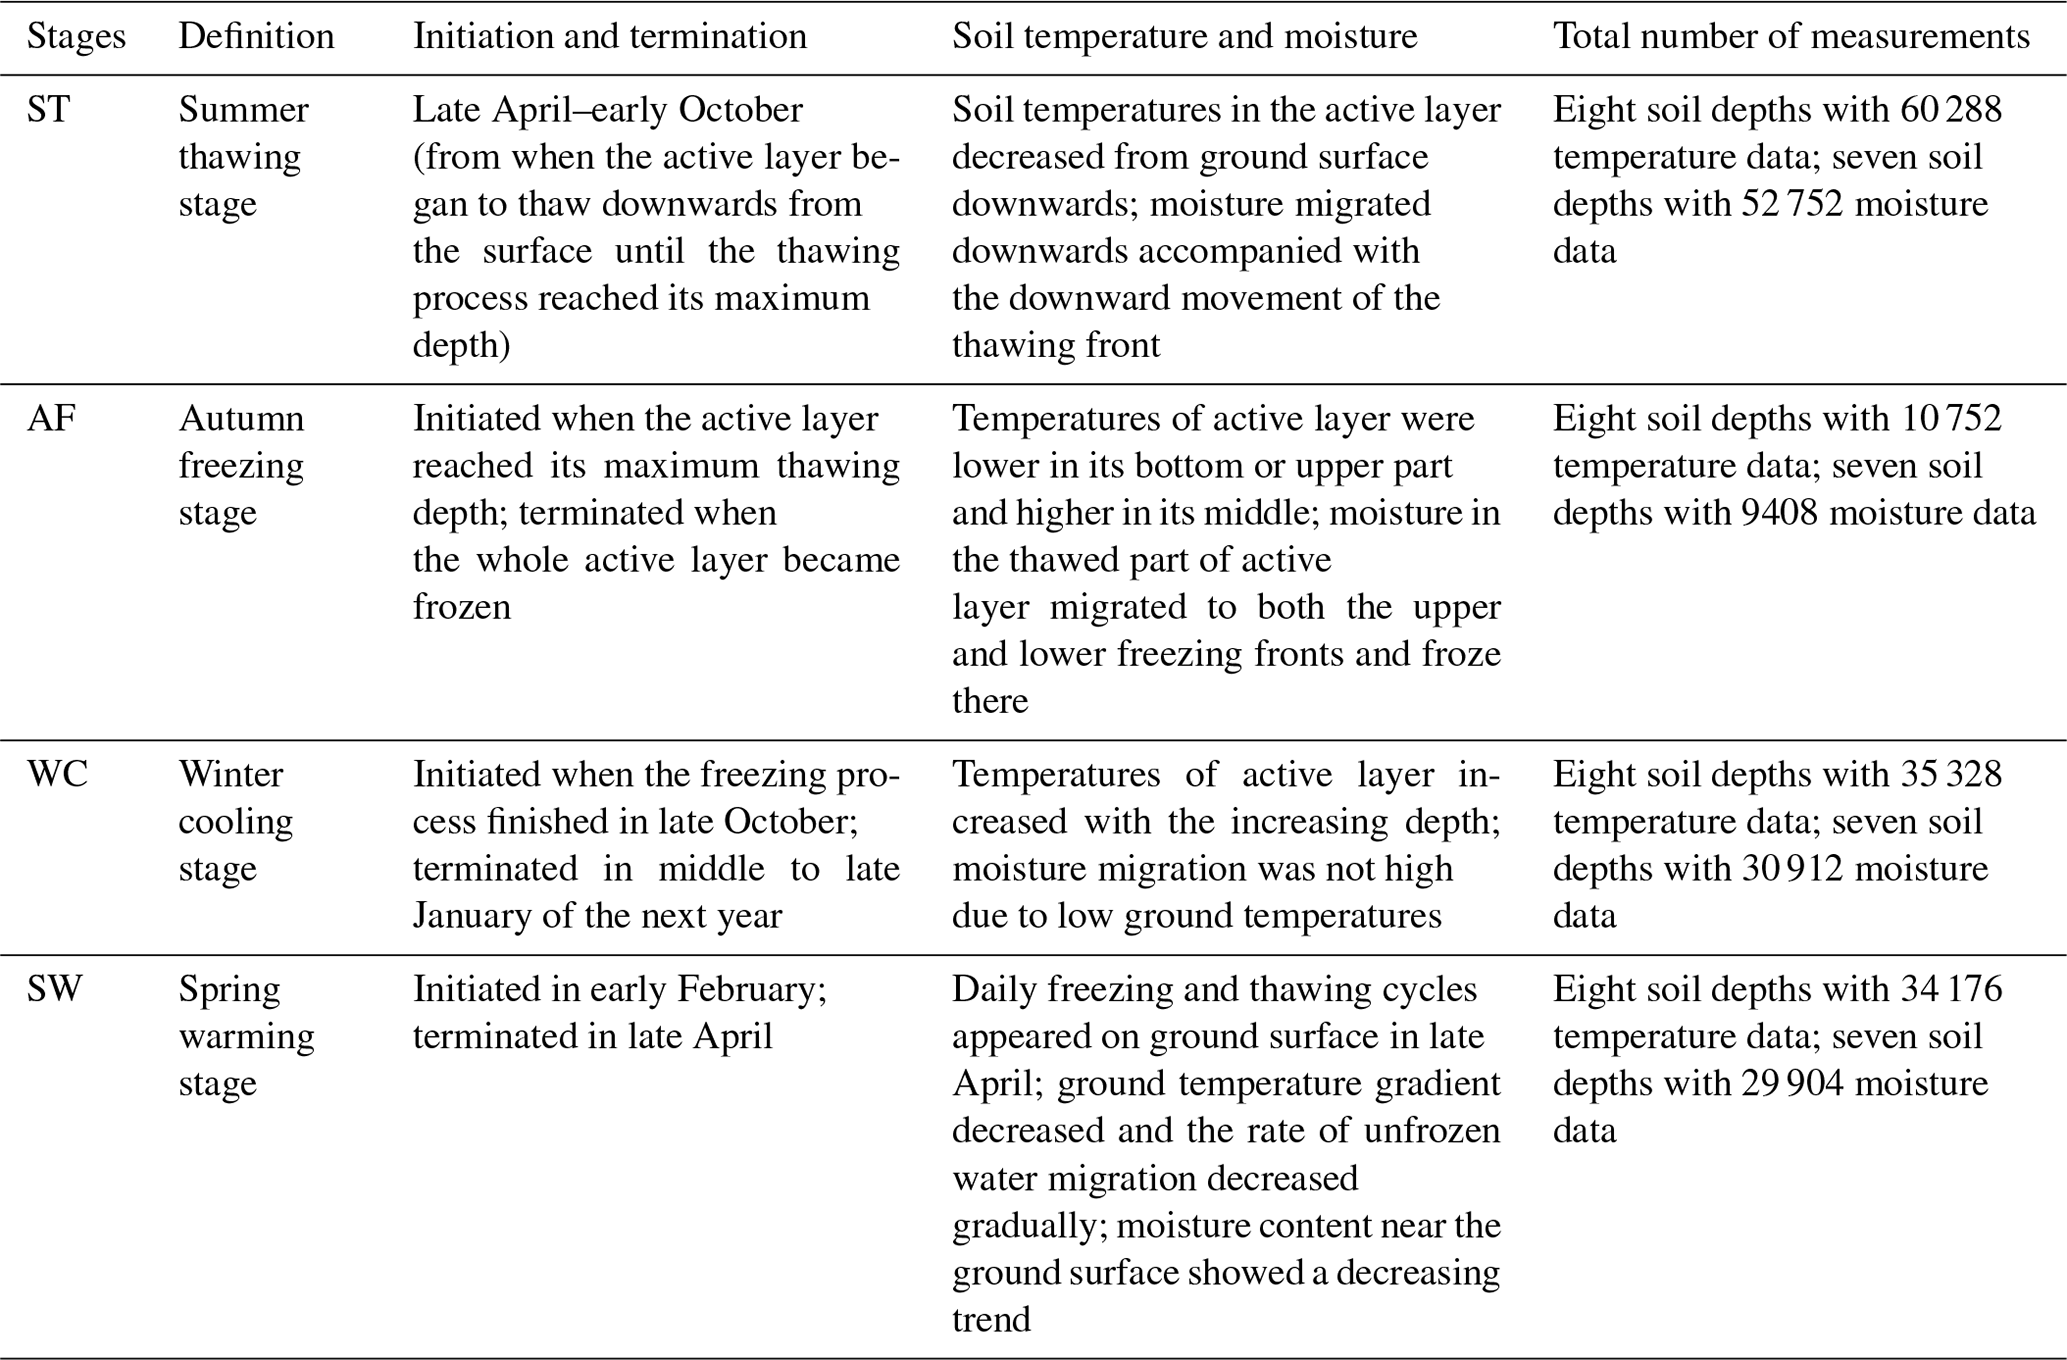
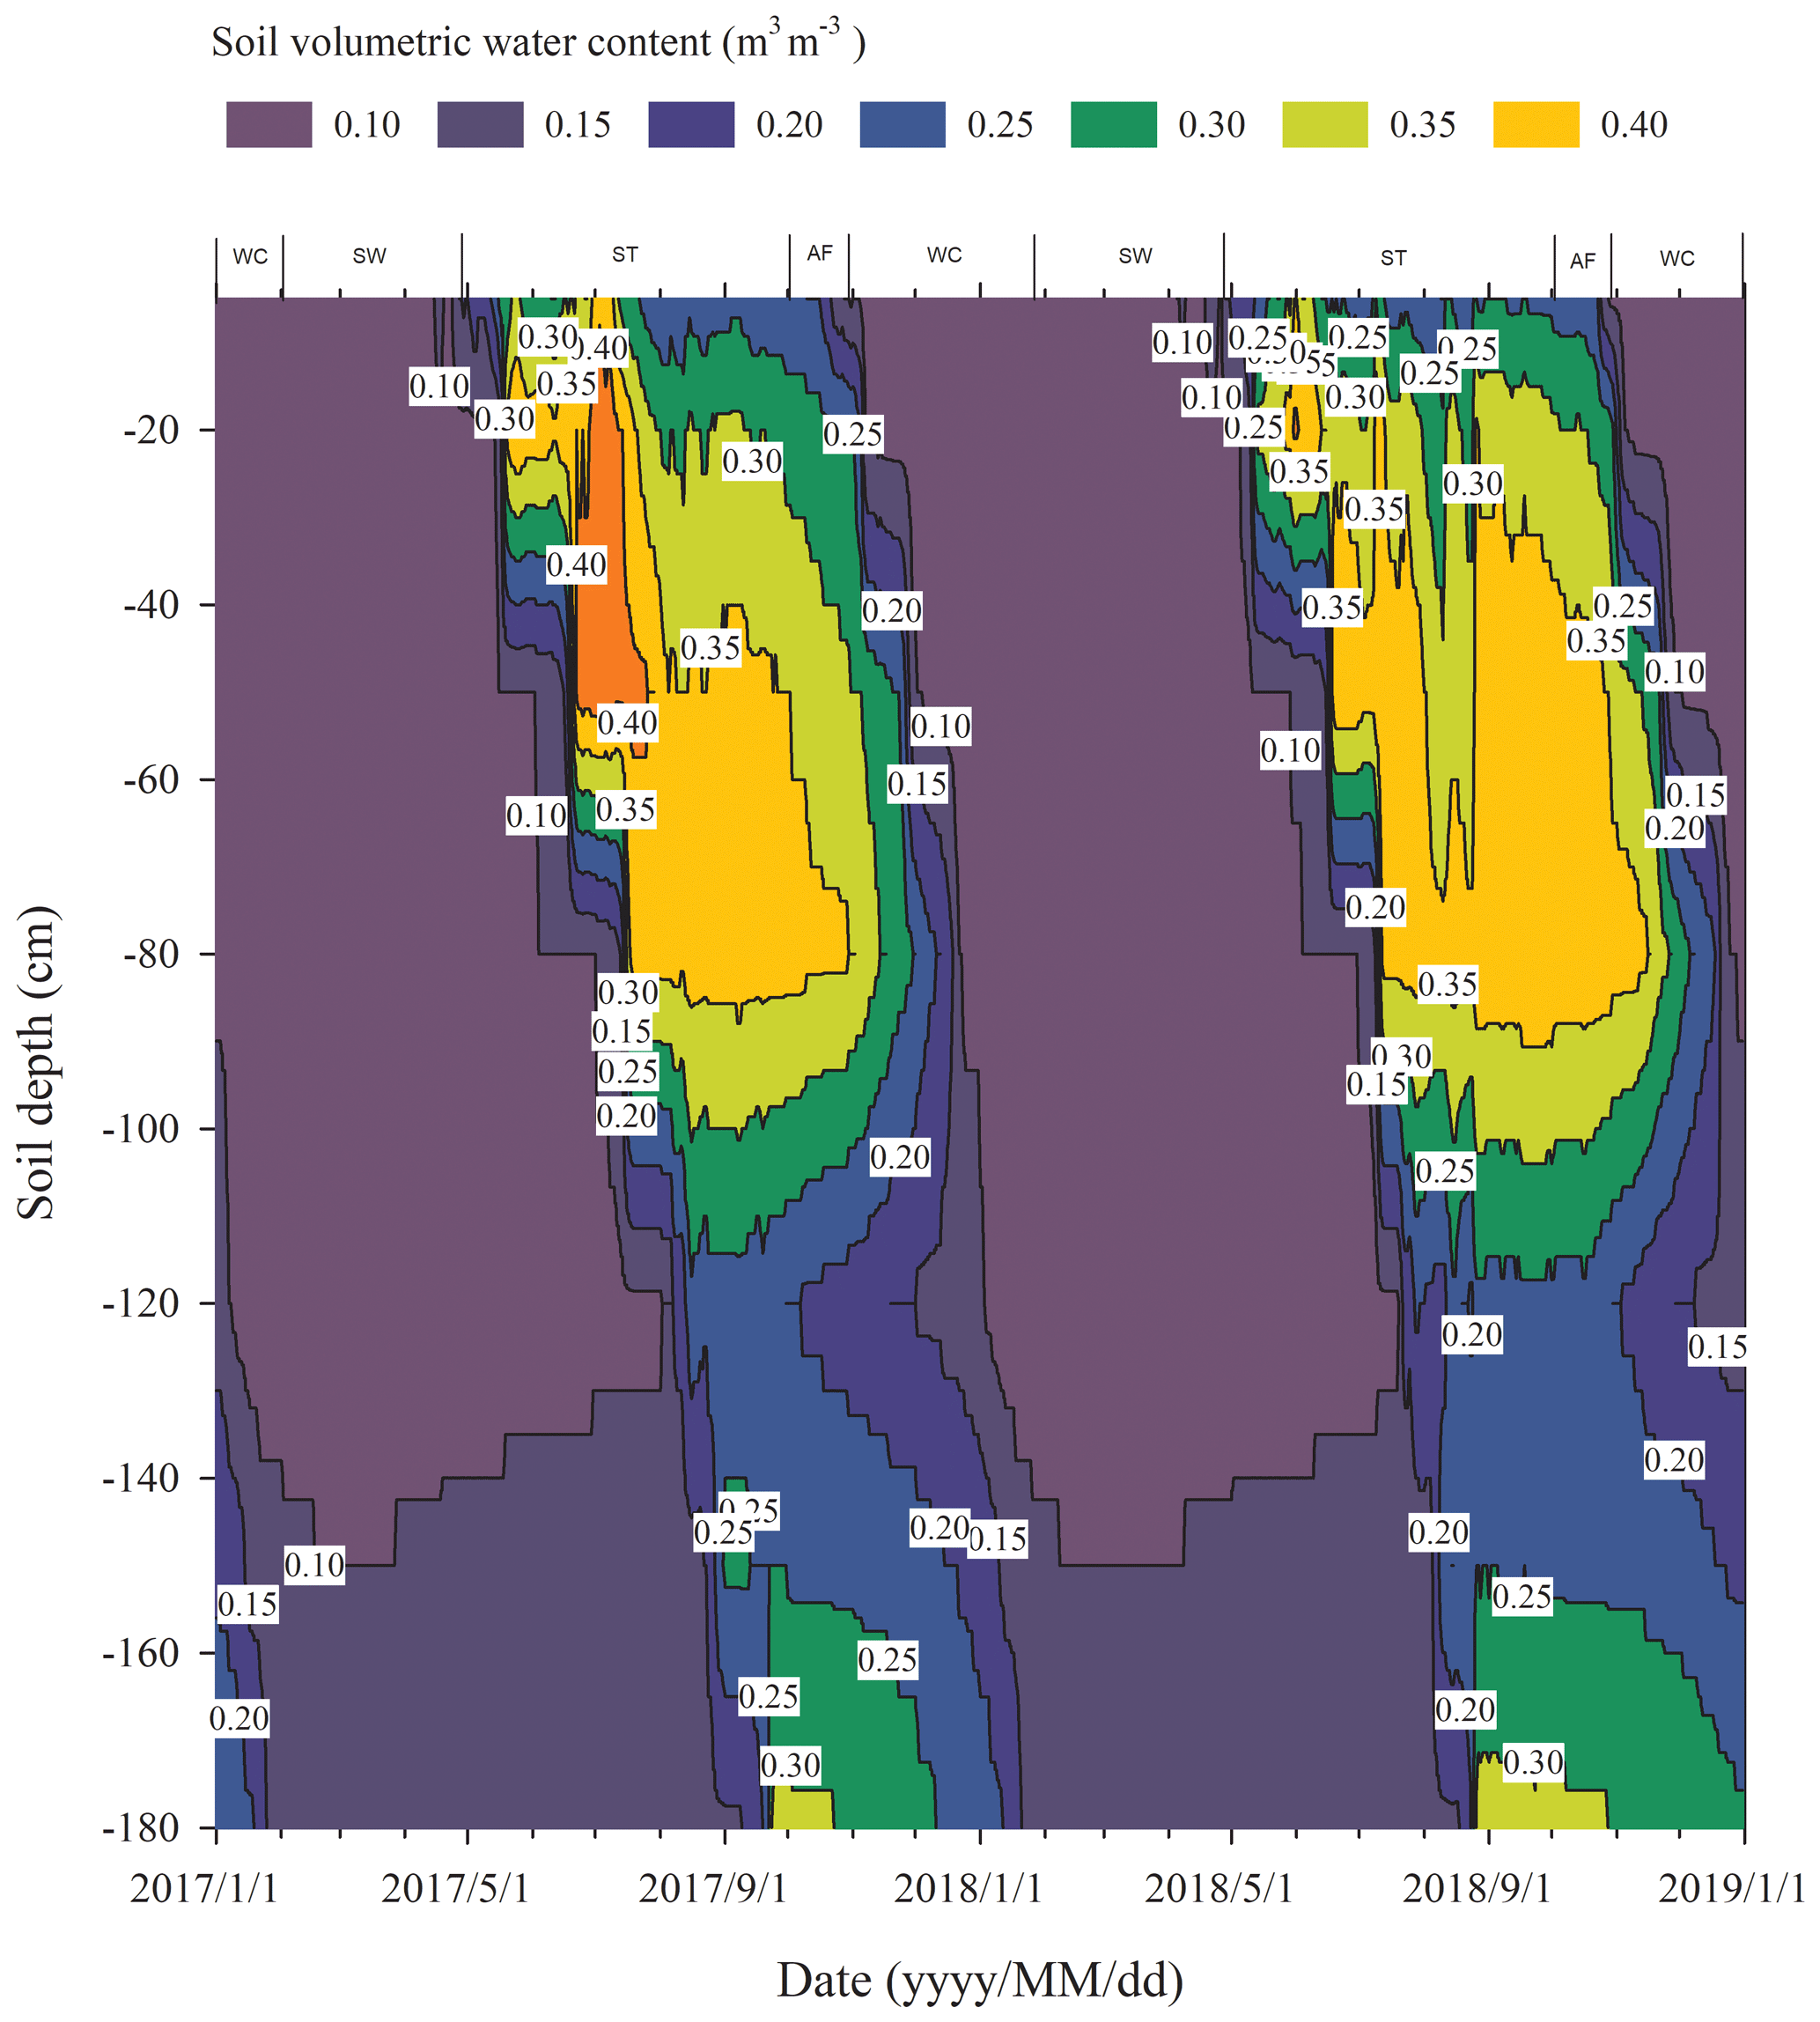
The process of the ST stage started when the active layer began to thaw downwards from the surface in late April and proceeded to early October when the thawing depth reached the maximum. At this stage, soil temperature decreased along with the soil depth and soil water was mainly transported downward. The whole active layer was in an endothermic process where the heat transferred downwards continuously and the soil thawing front also slowly migrated downwards. At the AF stage, once the thawing depth reached the maximum, the soil began to freeze upwards from the bottom of the active layer. Thus, AF lasted until the whole active layer was frozen. At the AF stage, soil water, being driven by the temperature gradient, migrated to both sides of the freezing front from the thawing layer and froze there. During AF, the slope of 0 ∘C isotherm was flat. In particular, the 0 ∘C isotherm almost paralleled the axis of ordinate between the depth of 50 cm and 160 cm. This phenomenon appeared because the onsets of freezing at different depths had no apparent differences and the whole active layer completed the freezing process in a short time as the AF process started. Once the whole freezing process was completed, the WC stage quickly started and lasted until middle to late January of the next year. During this process, the soil temperatures were relatively lower in the upper active layer but higher at the bottom; a small amount of soil water near the surface evaporated, and the unfrozen water in the active layer tended to migrate upward (Fig. 2). However, the amount of soil water migration was small because the lower ground temperature limited the content and activity of the unfrozen water. The SW stage began in late January as the air temperature rose, and temperature gradients in the active layer gradually decreased. During the SW stage, surface soil usually underwent daily freezing and thawing cycles in late April. The amount of soil water evaporation near the surface increased, and the amount of water migration inside the active layer decreased gradually. After the four above-described freeze–thaw stages were finished, the active layer had completed a single freeze–thaw cycle. The main characteristics of soil temperature and moisture migration at different freeze–thaw stages are summarized in Table 2.
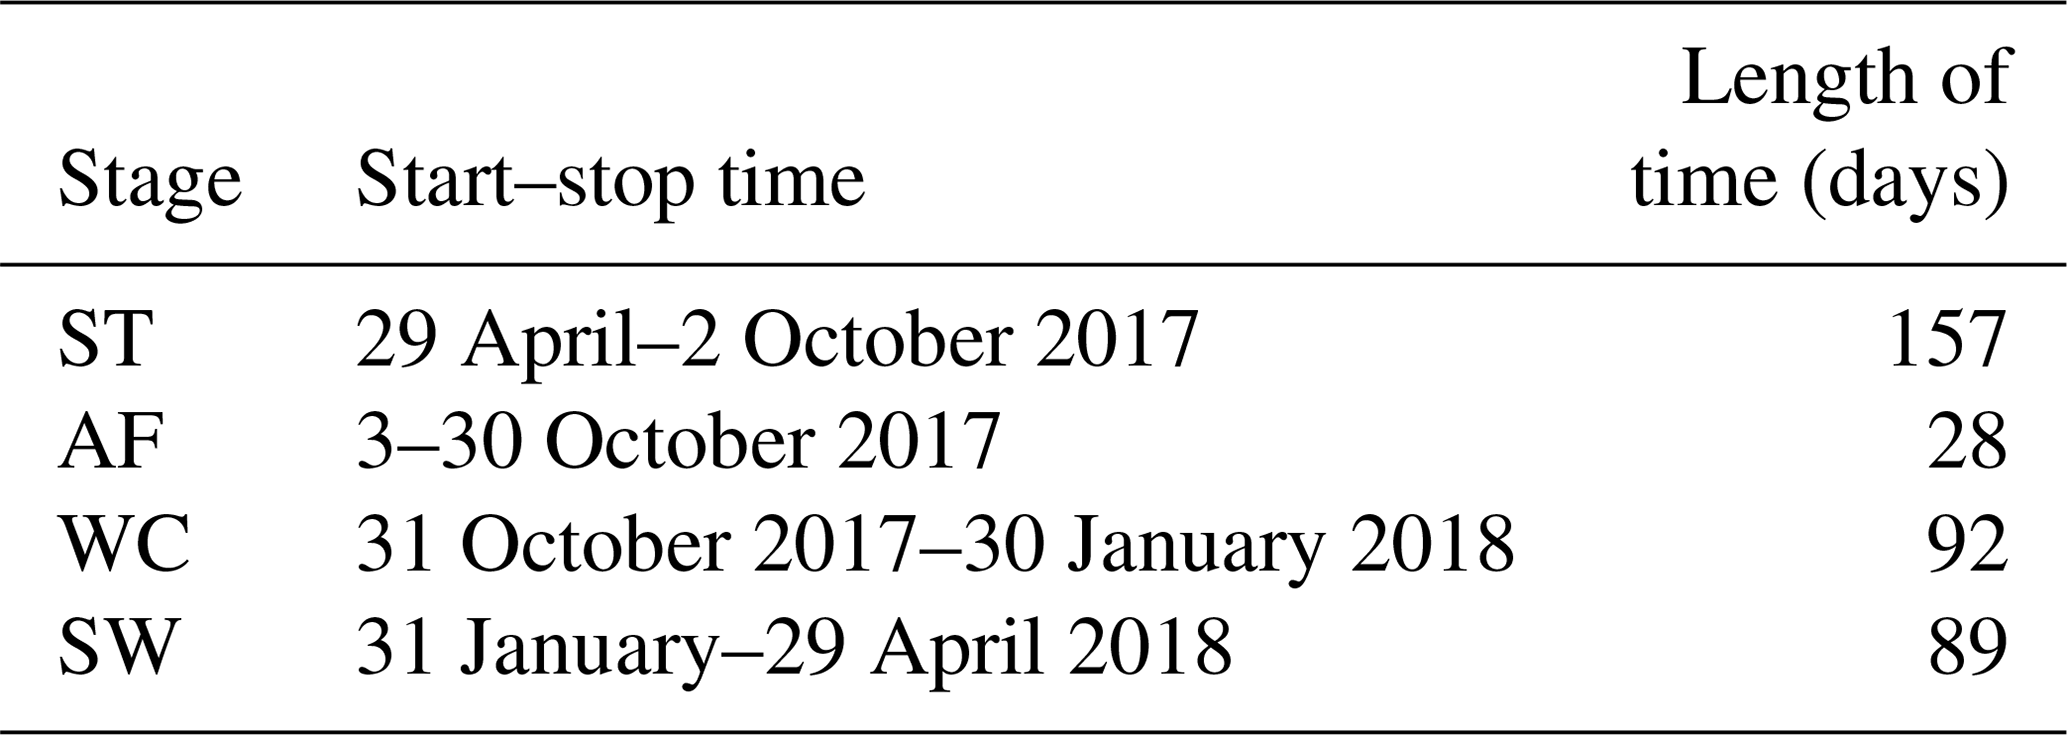
Based on the observation data obtained from the experimental site in 2017 and 2018, the initiation and termination points and the corresponding duration of each stage were calculated (Table 3). The ST stage started on 29 April 2017 and ended on 2 October 2017, lasting 157 d. Meanwhile, the AF stage was much shorter, lasting about 28 d. WC and SW had a similar duration of 92 and 89 d, respectively.
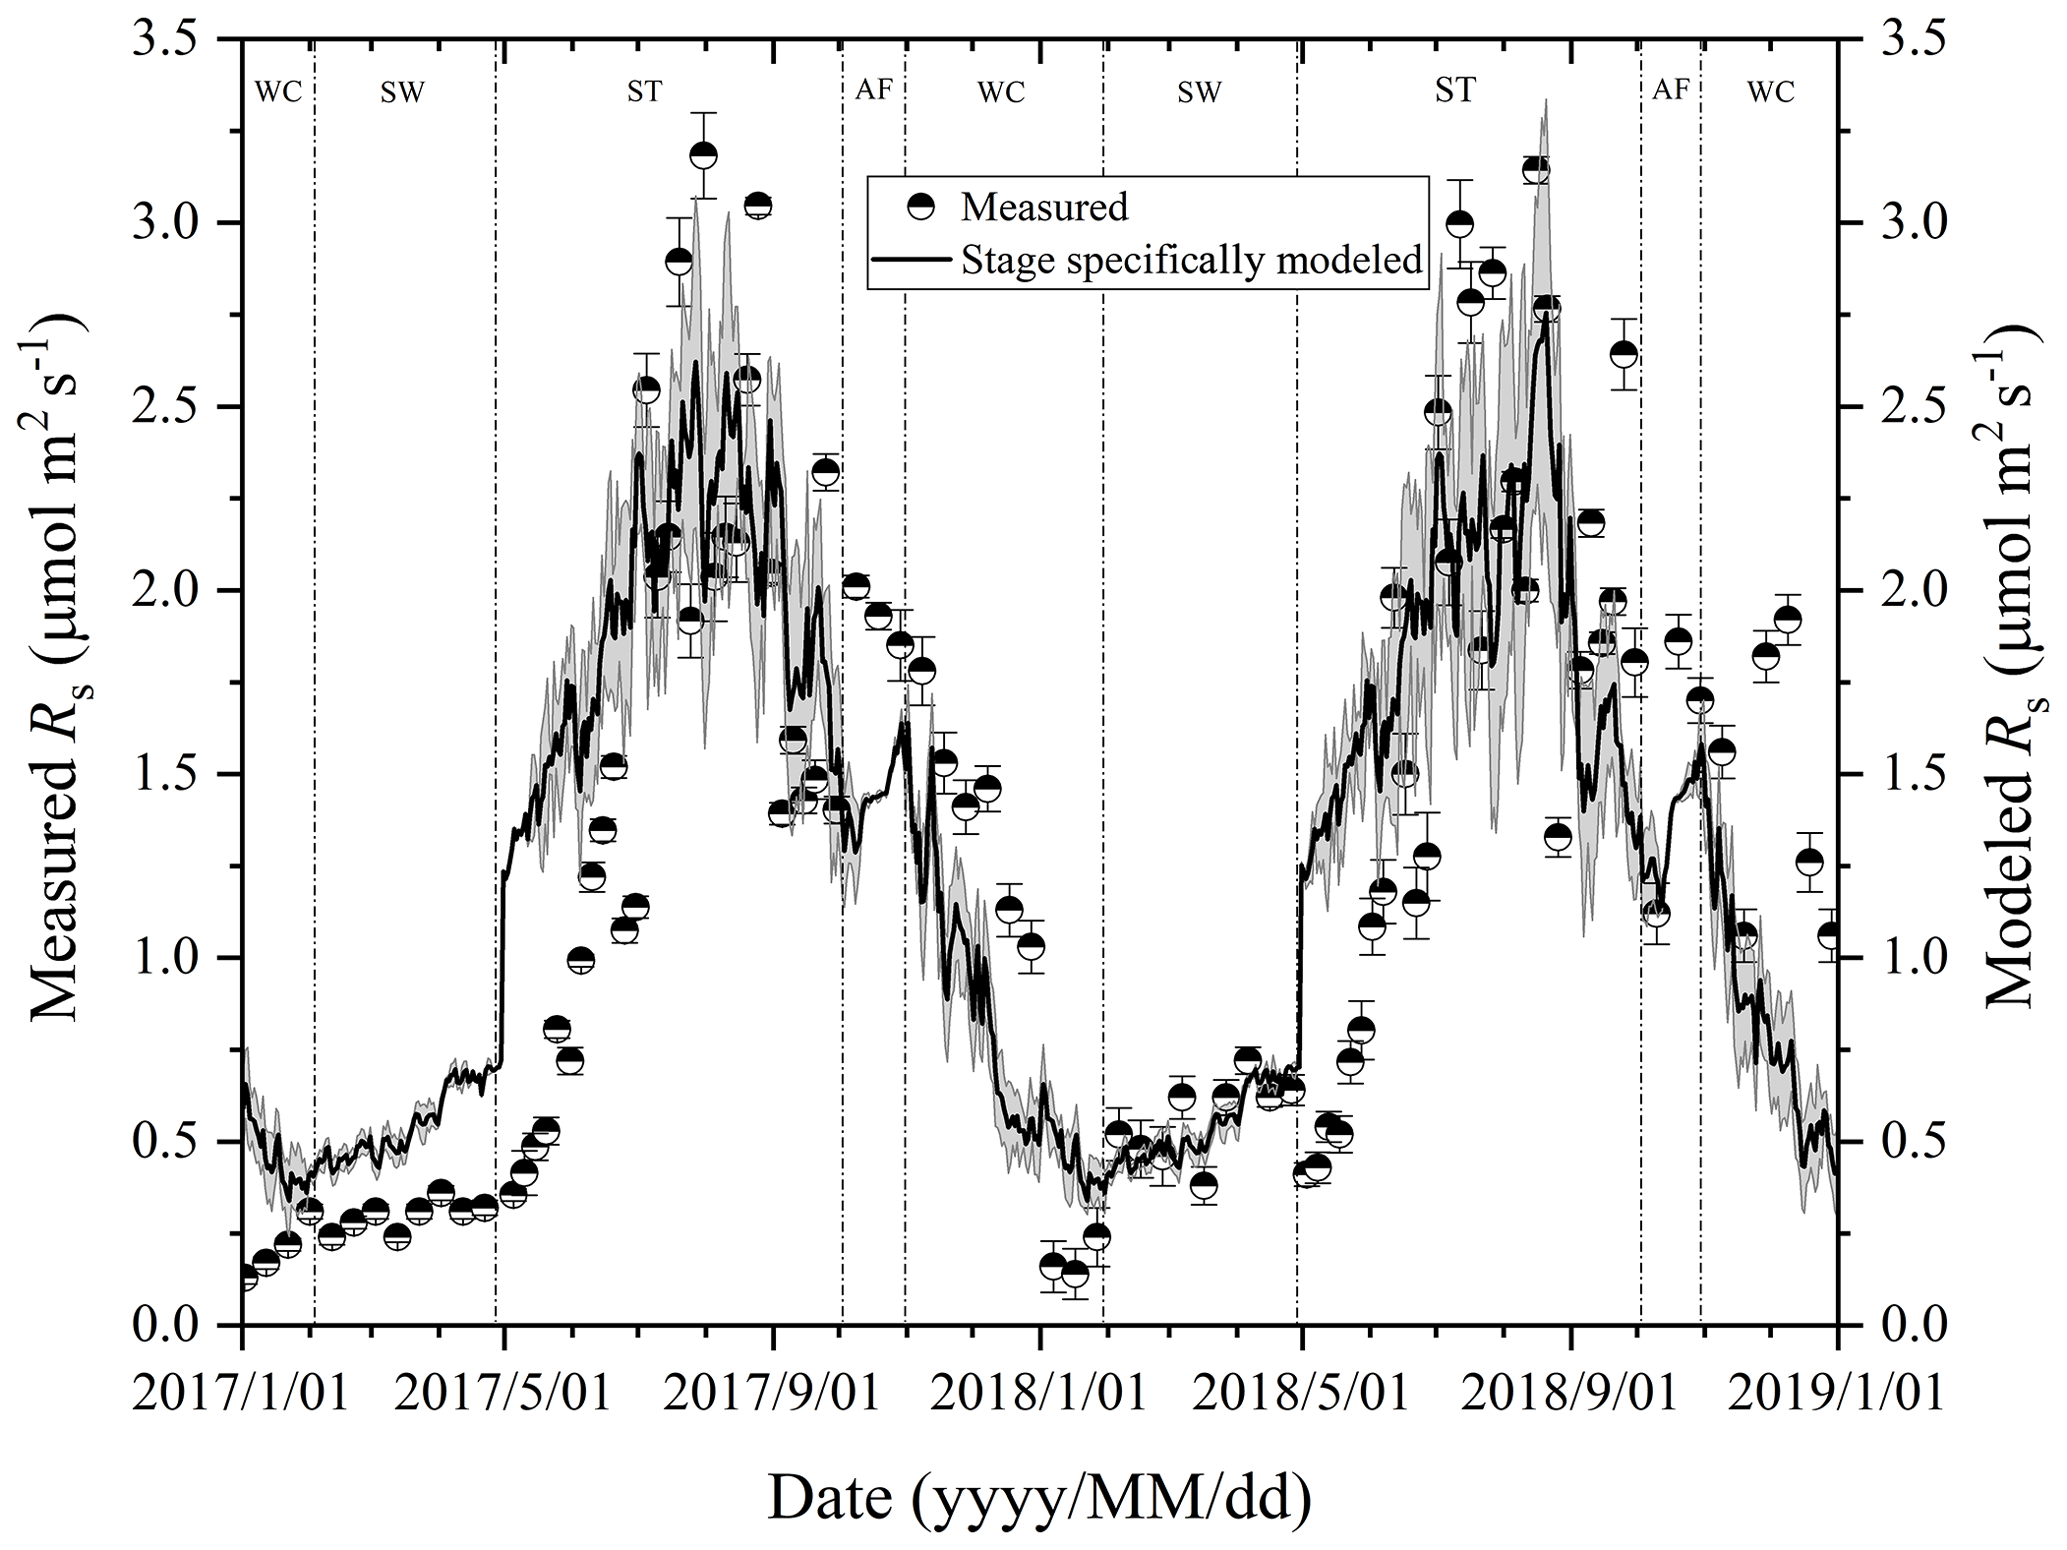
Figure 3Variations in measured and modeled Rs flux at different freeze–thaw stages in 2017 and 2018. Error bars show standard error in measured Rs (n=6).
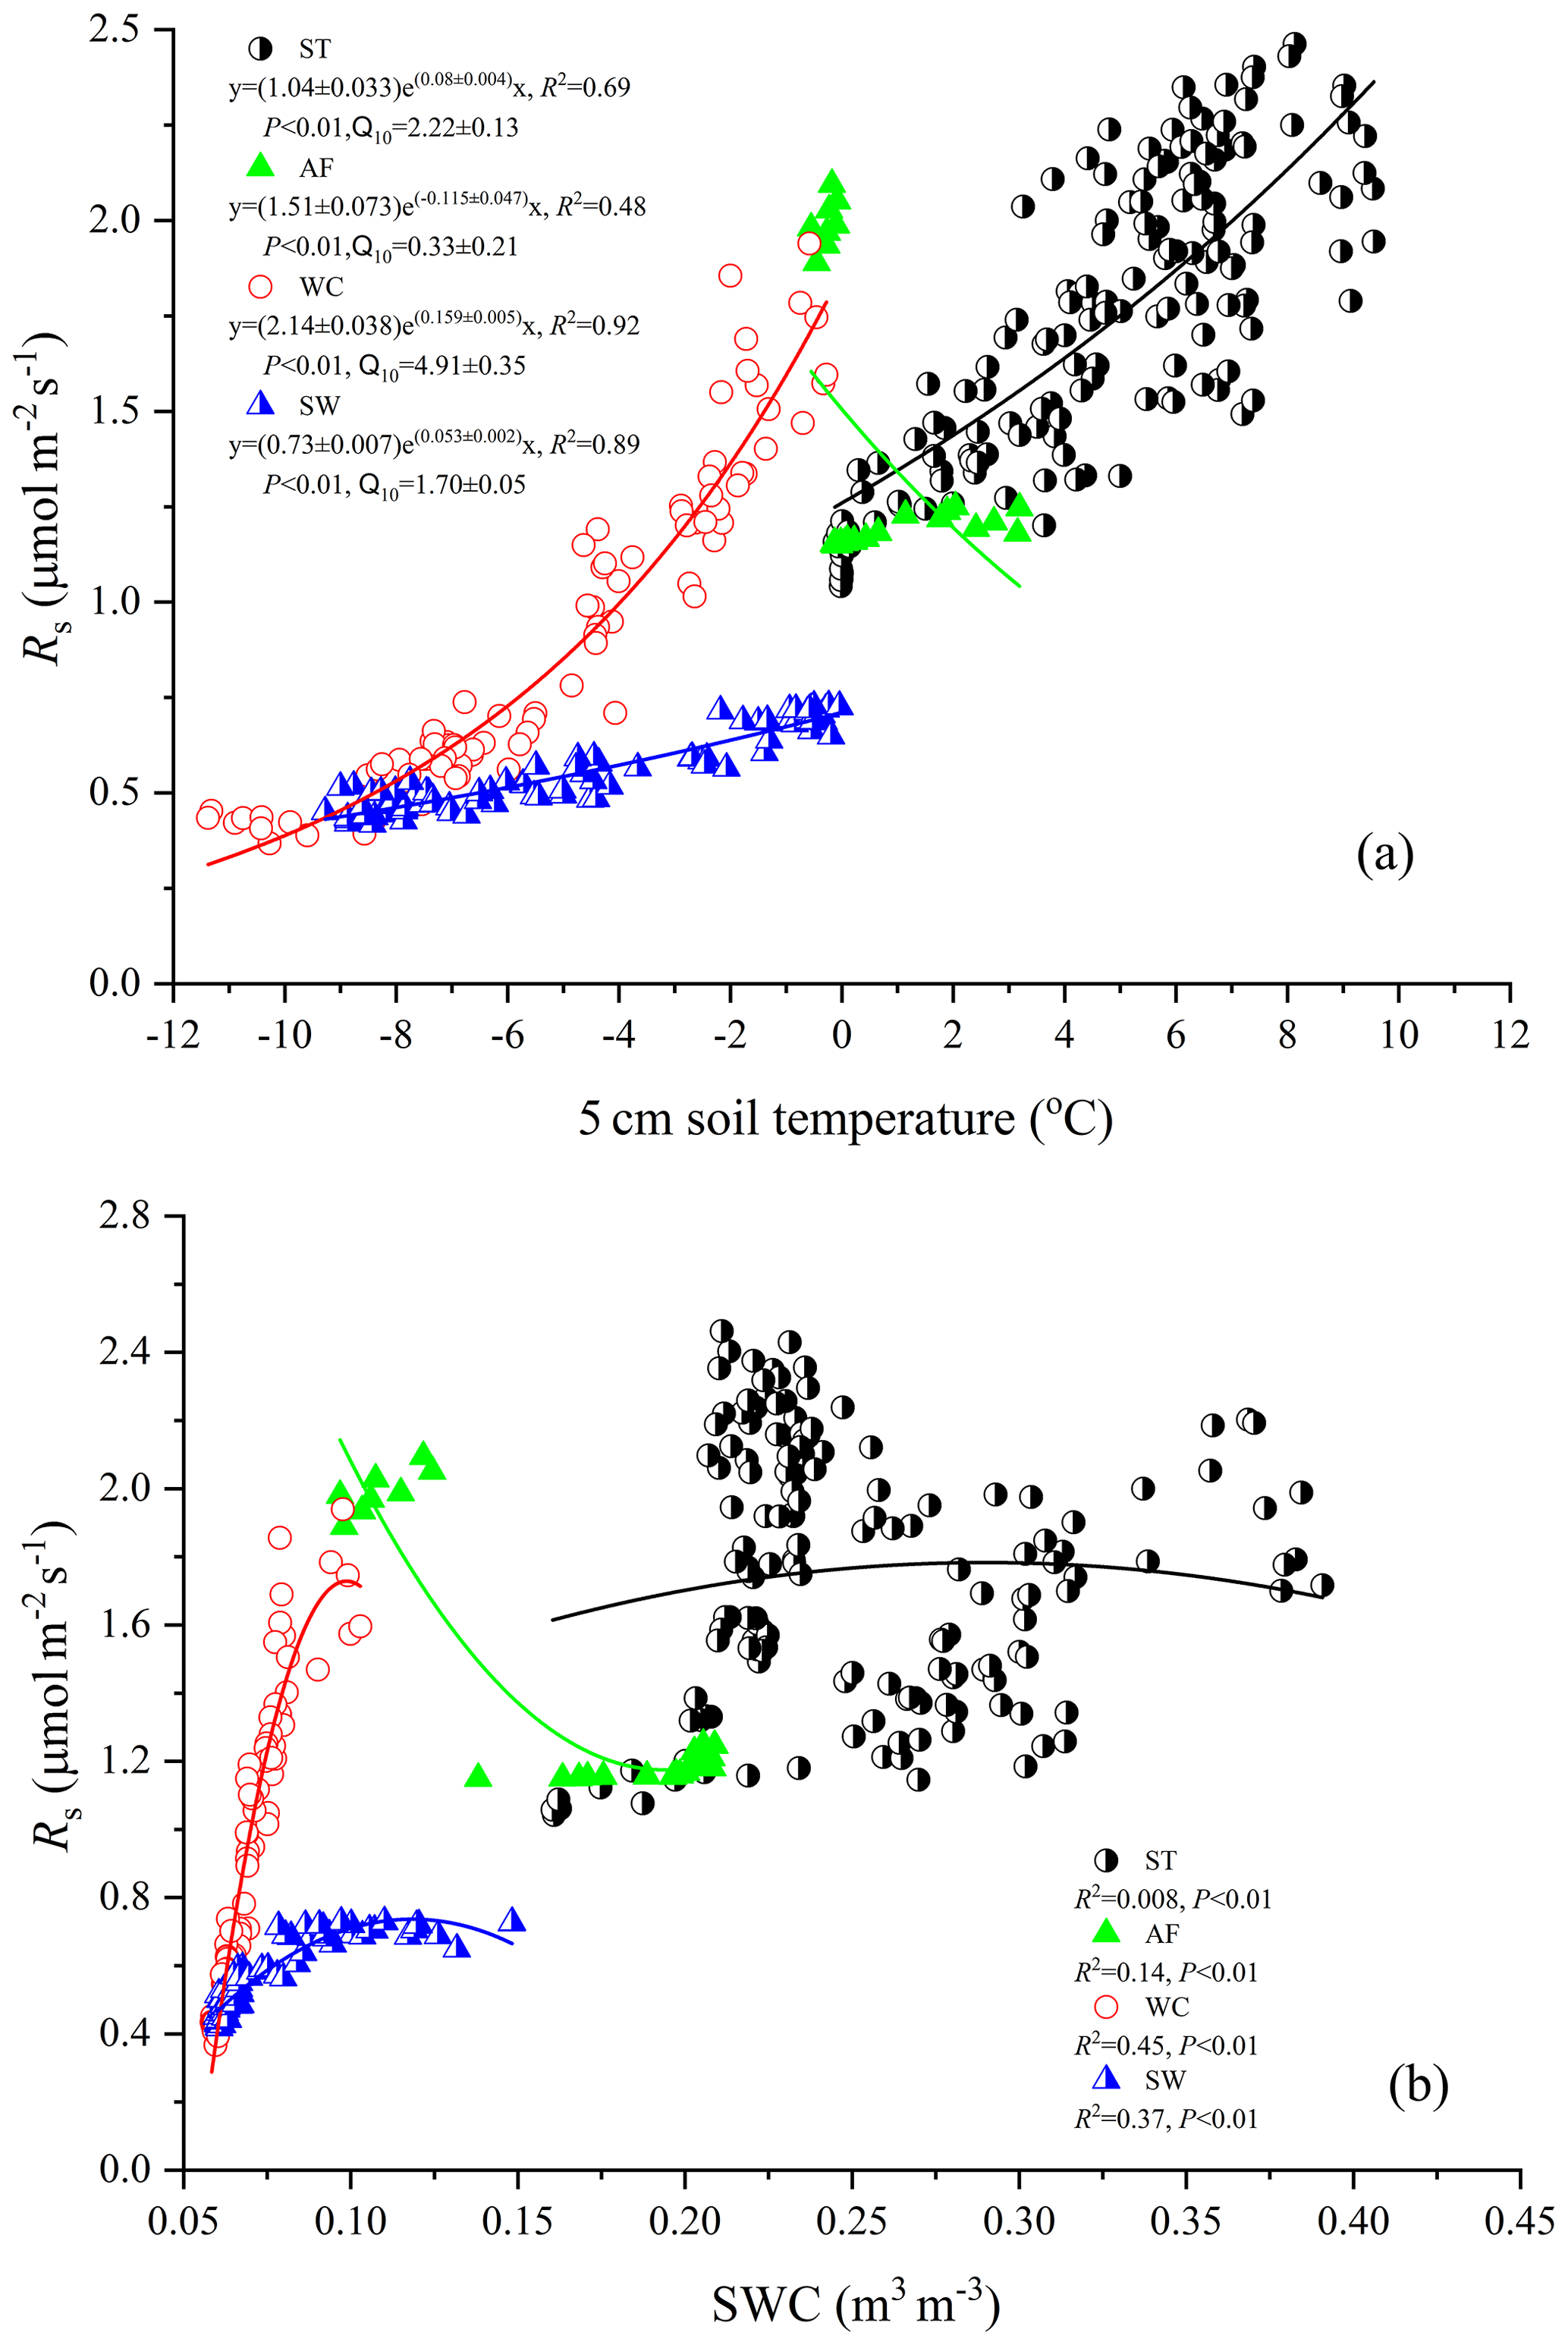
Figure 4Relationship between soil temperature (a) and moisture (b) at a 5 cm depth and measured Rs flux for the summer thawing stage (ST), autumn freezing stage (AF), winter cooling stage (WC), and spring warming stage (SW).
3.2 Dynamics of Rs fluxes in different freeze–thaw stages of the active layer
At the Beiluhe experimental site, Rs flux changed as the freeze–thaw processes of the active layer developed, showing distinct dynamics in different freeze–thaw stages of the active layer (Fig. 3). Rs flux showed a rapidly increasing trend as the thawing of the active layer intensified in the ST stage. The Rs flux rate rose from 0.26 to 2.77 µmol m−2 s−1 in 2017 and from 0.53 to 2.82 µmol m−2 s−1 in 2018. In the AF stage, Rs flux fluctuated between 1.49 and 2.01 µmol m−2 s−1, although the number of observations was much smaller due to the short duration of the stage. In the following stage of WC, Rs flux also decreased rapidly due to the prolonged lowered soil temperature, reaching the minimum values of 0.12 in 2017 and 0.13 µmol m−2 s−1 in 2018 by the end of the stage. Then Rs flux began to increase gradually the as SW stage proceeded. During the SW stage, Rs appeared as a small emission peak when the surface of the active layer underwent daily freezing and thawing cycles. Following the small emission peak, Rs flux dropped a little and then started to ascend again quickly once ST arrived.
Table 3The start–stop time and duration of different freeze–thaw stages of the active layer.
3.3 Contribution of Rs in different freeze–thaw stages of the active layer
Rs fluxes had significant correlations with soil temperature at a 5 cm depth, and the exponential models explained the variations effectively except for in the AF stage (Fig. 4a). In contrast, soil water content was a poor predictor of Rs with a varying relationship for each freeze–thaw stage (Fig. 4b). Meanwhile, daily average Rs fluxes modeled by the exponential models for specific freeze–thaw stages were well matched with measured fluxes (Fig. 3). In addition, RMSE analysis showed that the exponential models of soil respiration were preferable for Rs prediction at different freeze–thaw stages (RMSE < 0.67, Fig. 5). As such, we calculated Rs models, the temperature sensitivity (Q10), and the sum of Rs (SR) based on Eqs. (1)–(3) in four freeze–thaw stages during a complete freeze–thaw cycle from 29 April 2017 to 28 April 2018 (Table 4). The SR emission during the ST stage (1041.85±23.83 g CO2 m−2) was much higher than that during the other three stages (150.54±6.80 to 310.69±12.33 g CO2 m−2). The relative contribution of SR during each freeze–thaw stage to the total Rs emission in a complete freeze–thaw cycle (Rcycle) ranged from 8.89±0.18 % to 61.32±0.32 %. The SR at the AF stage was the lowest (150.54±6.80 g CO2 m−2), and its contribution rate to Rcycle was only 8.89±0.18 %.
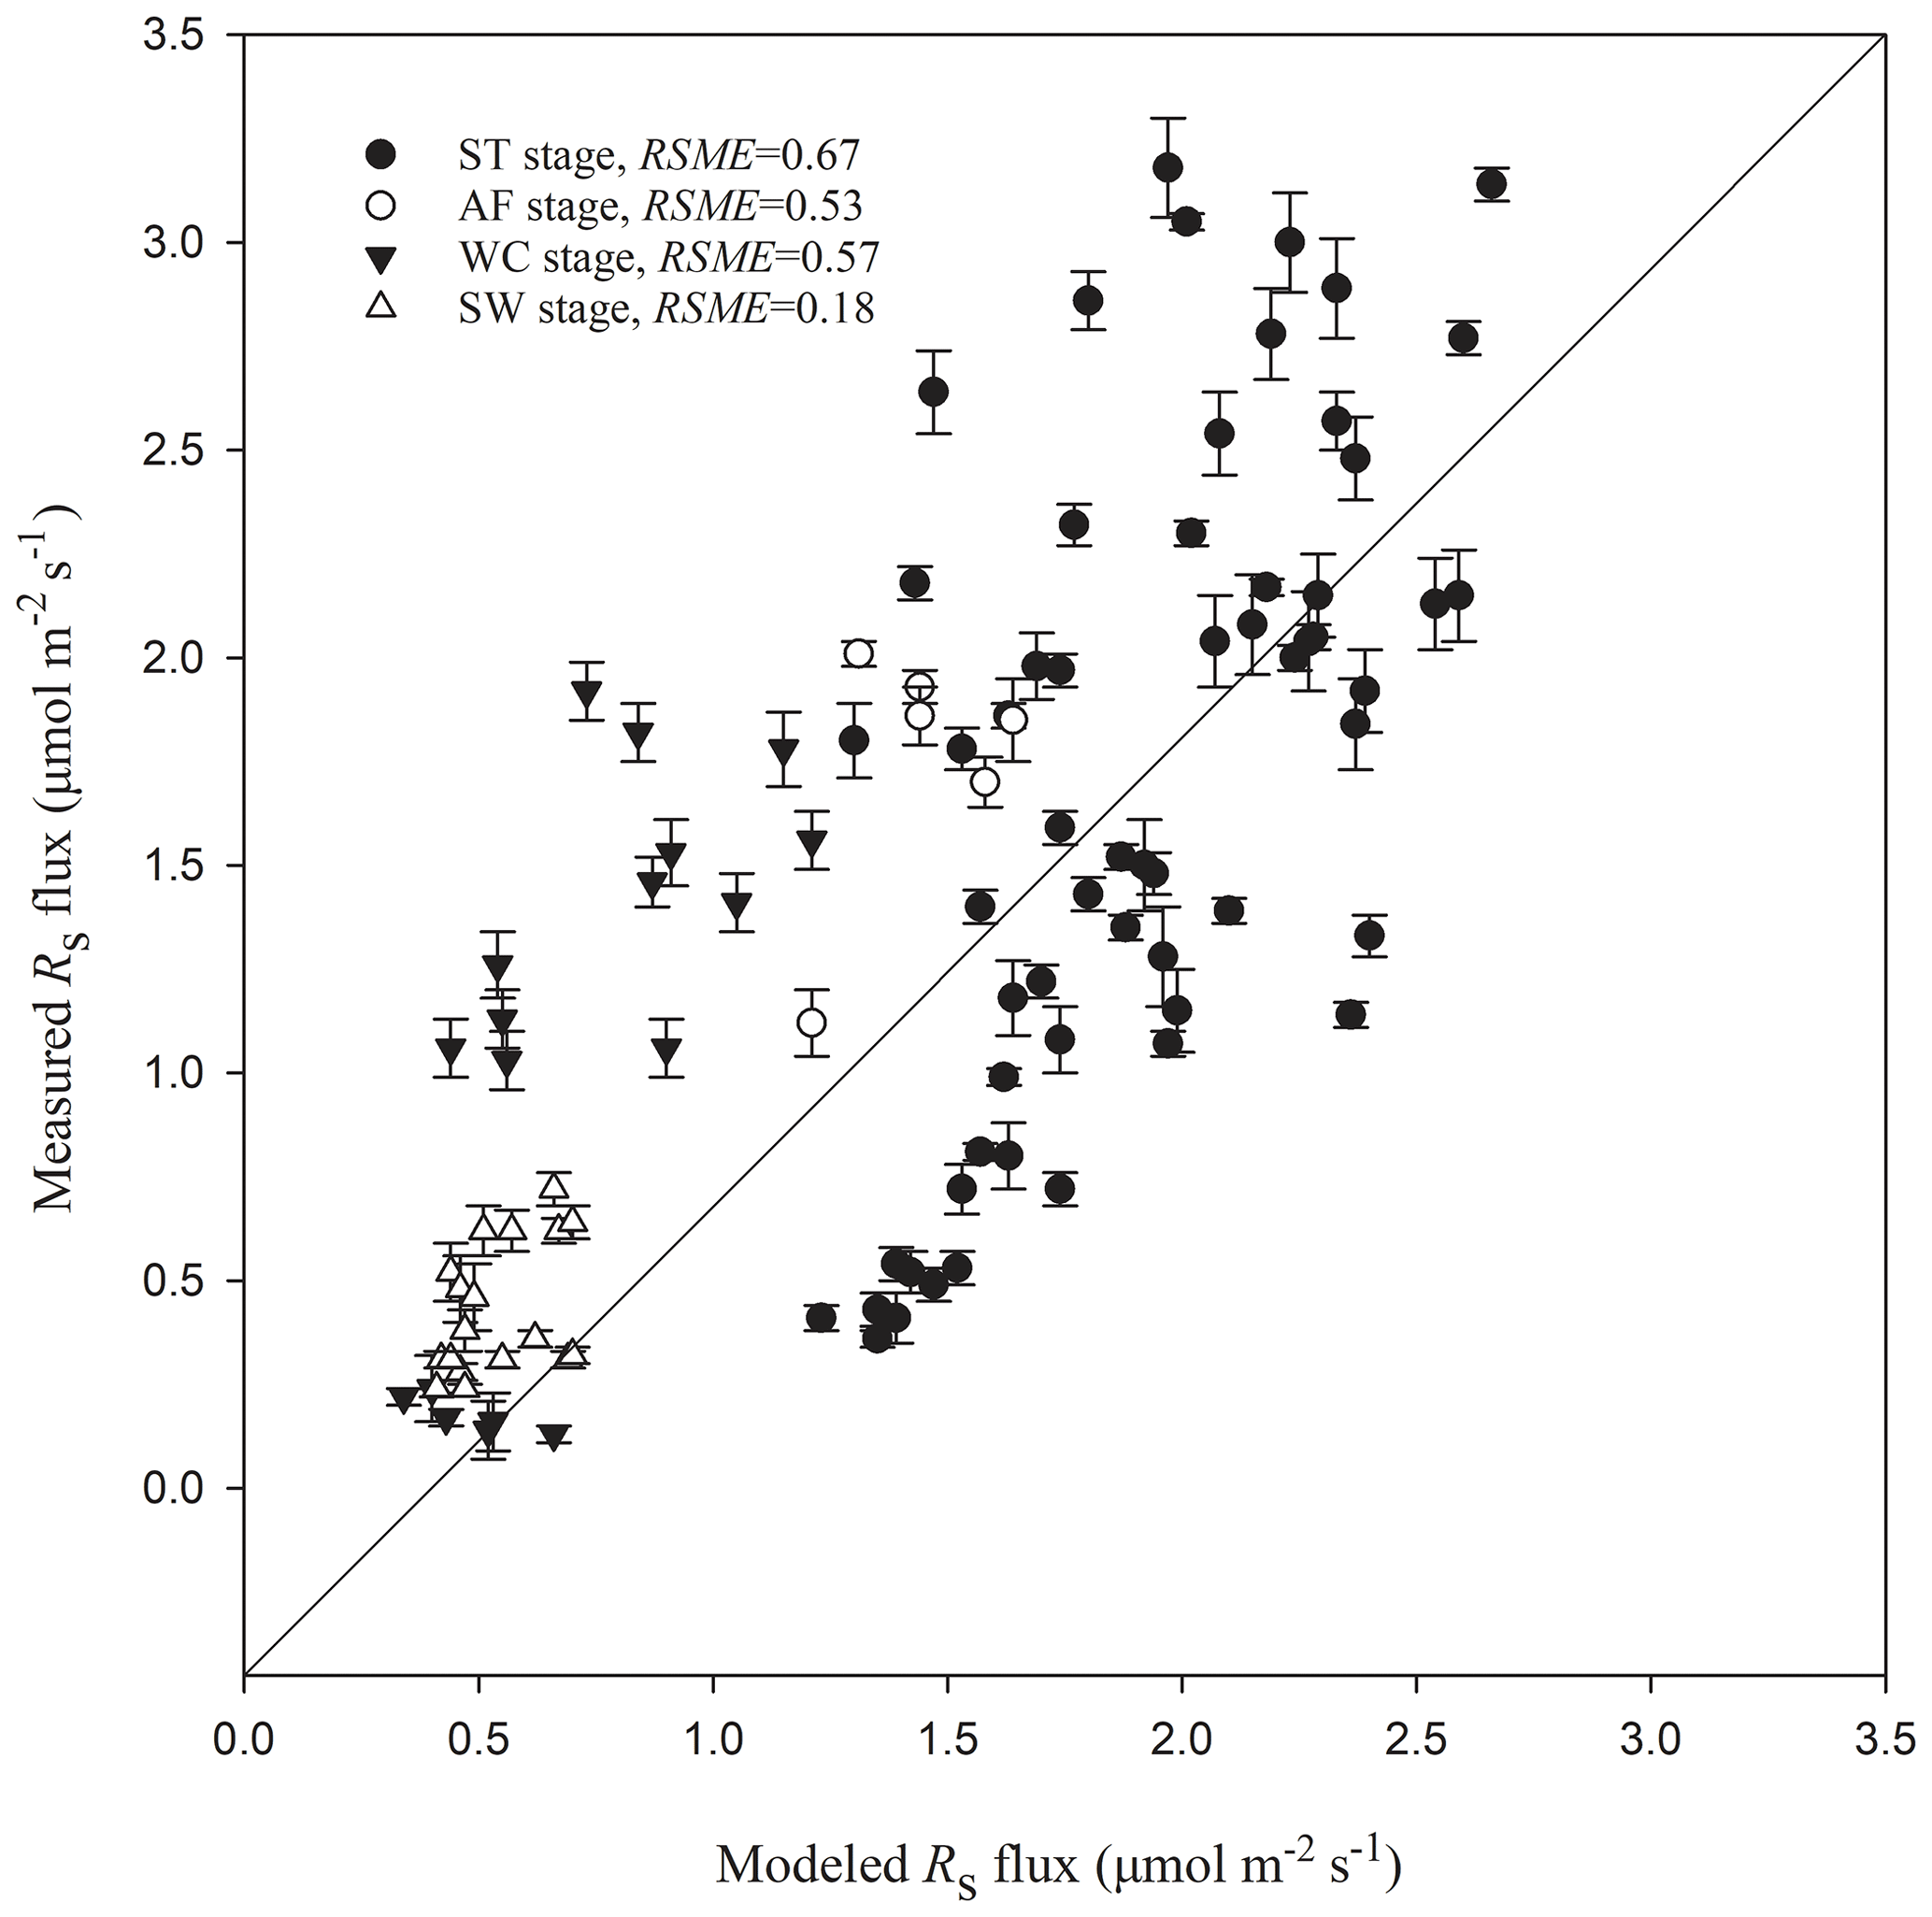
Figure 5Modeled vs. measured Rs fluxes at different freeze–thaw stages. Error bars represent standard errors in measured Rs flux (n=6). The solid line is a 1 : 1 line.
Table 4The Rs model, Q10 value, and SR and its contribution to Rcycle in different freeze–thaw stages.
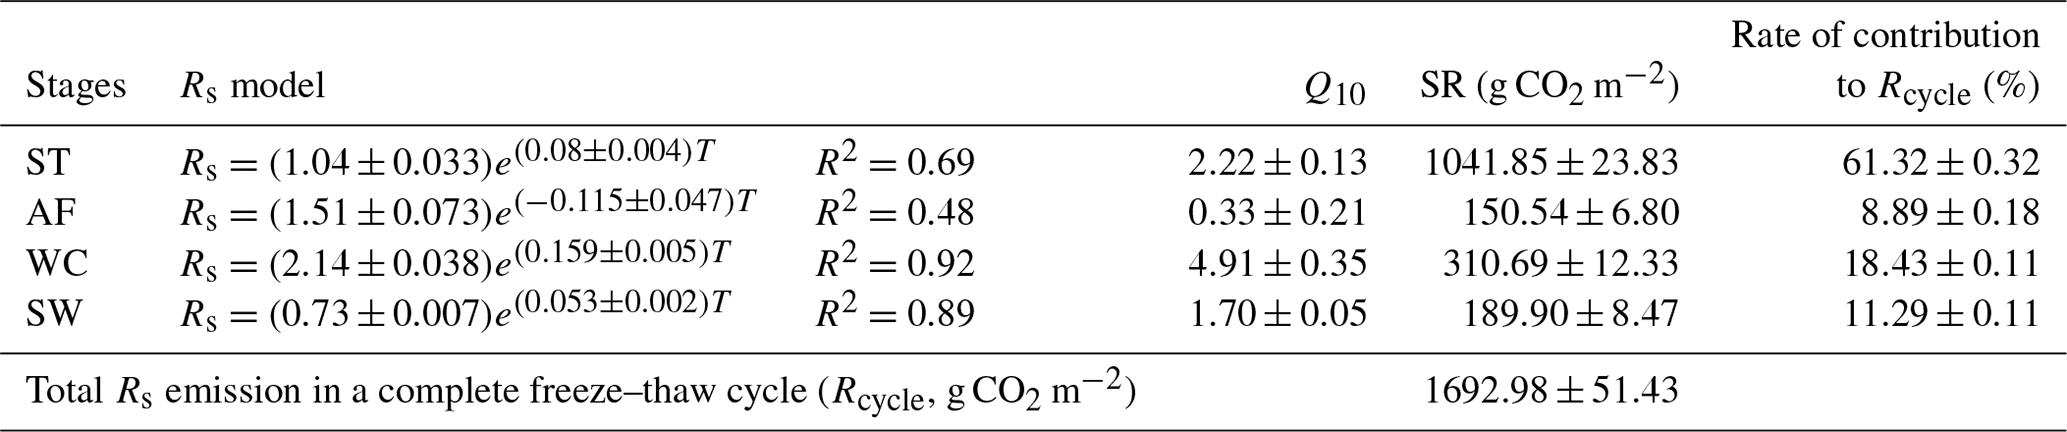
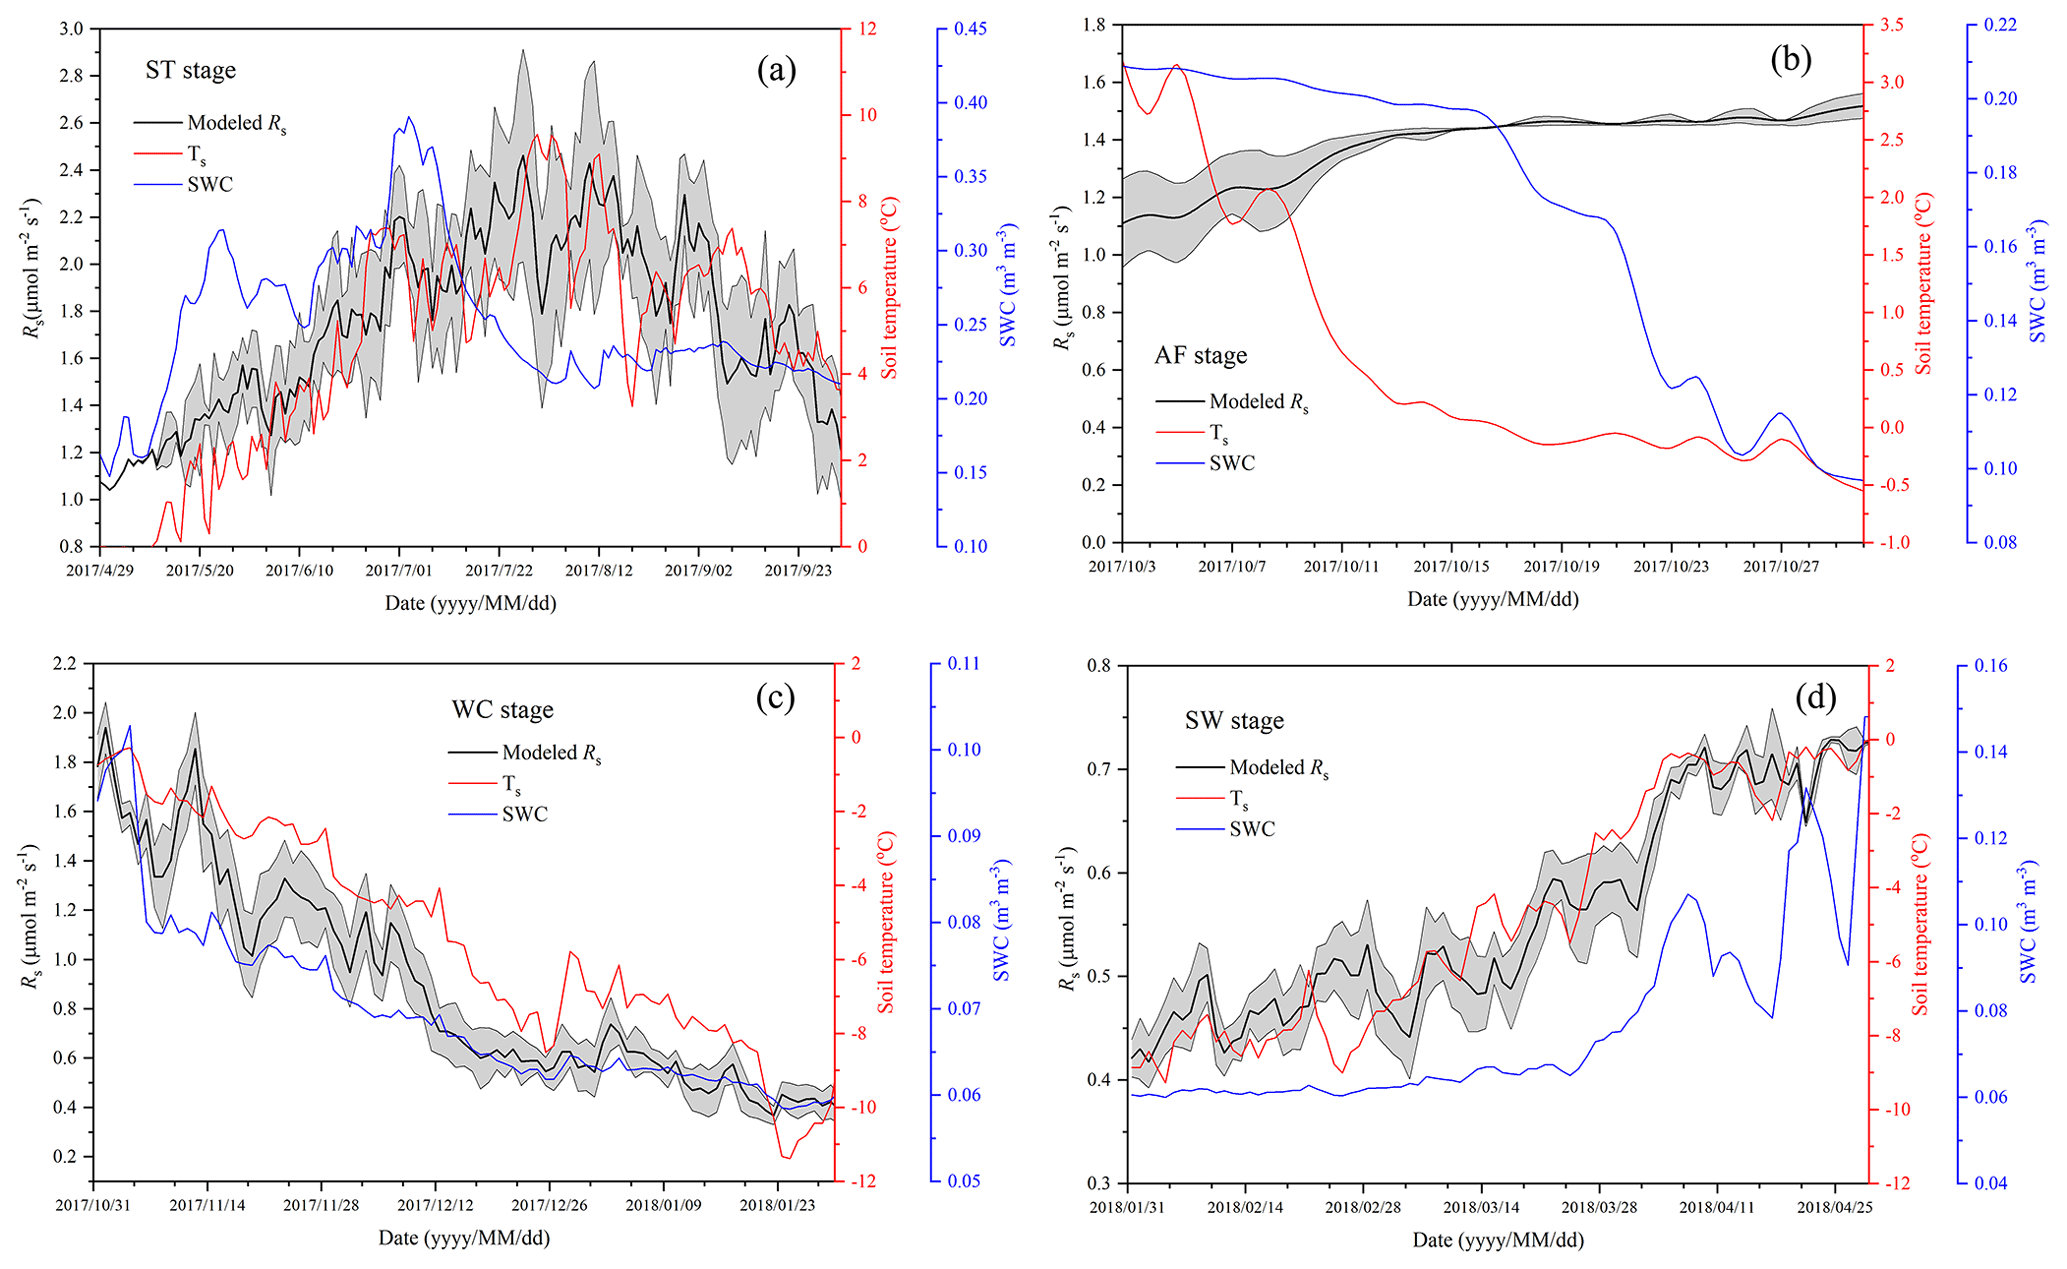
Figure 6Variations in modeled soil respiration (Rs), soil temperature (Ts), and soil water content (SWC) for the four freeze–thaw stages comprising ST (a), AF (b), WC (c), and SW (d) in a complete freeze–thaw cycle from later April 2017 to late April 2018. The SWC unit stands for water volume per total soil volume. The error band of modeled Rs stands for the 95 % confidence interval.
3.4 Factors affecting Rs fluxes in different freeze–thaw stages
Rs was positively correlated to soil temperatures, following an exponential relationship with the 5 cm soil temperatures regardless of soil water status during the freeze–thaw stages. When calculated on the basis of the dataset of each stage, the Q10 values were 2.22±0.13 (R2=0.69), 0.33±0.21 (R2=0.48), 4.91±0.35 (R2=0.92), and 1.70±0.05 (R2=0.89) for ST, AF, WC, and SW with soil temperatures ranging from −0.13 to 9.55 ∘C, −0.55 to 3.19 ∘C, −11.38 to −0.28 ∘C, and −9.28 to −0.04 ∘C, respectively (Table 4). The variations in Rs fluxes, determined by the exponential models we developed, exhibited different characteristics at each freeze–thaw stage during a complete freezing and thawing circle (Fig. 6). In the ST stage (Fig. 6a), for example, the variations in Rs, Ts, and SWC were basically consistent. Rs showed an increasing trend as Ts and SWC at 5 cm rose due to the active layer thawing from the surface and reached the maximum (2.66±0.16 µmol m−2 s−1) by August. Then Rs decreased with fluctuations as Ts and SWC dropped. As AF began (Fig. 6b), however, Rs flux did not decrease any longer when it reached its lowest level (1.11±0.15 µmol m−2 s−1) even though Ts and SWC dropped sharply in response to soil freezing. As the freeze–thaw process developed, Rs flux increased slightly and reached a relatively stable state (1.47±0.15 µmol m−2 s−1), although the Ts and SWC continued to lower with fluctuations. When the WC stage started (Fig. 6c), Rs decreased again with fluctuations as Ts and SWC continuously decreased, although the active layer was completely frozen. At the end of WC, Rs flux decreased to its lowest level (0.39±0.06 µmol m−2 s−1). In the SW stage (Fig. 6d), Rs flux began to increase with fluctuations as the Ts rose in response to soil warming, while SWC had no change as the surface soil still remained frozen in the earlier stage and fluctuated wildly due to the daily freeze–thaw process in the later stage.
4.1 Impacts of freeze–thaw process on Rs in different stages
The freeze–thaw process plays a significant role in soil biogeochemical processes in most high-latitude and high-altitude ecosystems (Grogan et al., 2004; P. Liu et al., 2016). Furthermore, freeze–thaw effects on soil nutrient transformations may substantially influence the C balance of seasonally cold ecosystems (Grogan et al., 2004; Weih, 1998). Although many studies have shown that freeze–thaw events affect Rs in tundra, boreal, and temperate soils (B. Liu et al., 2016; Du et al., 2013), variations in Rs in different freeze–thaw stages of the active layer have not been studied in permafrost regions on the Qinghai–Tibet Plateau. Our observations clearly demonstrated that the freeze–thaw process of the active layer strongly affected the Rs dynamics and that Rs emission models were significantly different for each of the freeze–thaw stages (P<0.01).
In the ST stage, the active layer was mainly in a heat-absorbing and thawing condition, where heat was transferred from top to bottom and the thawing front also gradually migrated downwards (Zhao et al., 2000; Jiao and Li, 2014). We observed that Rs was restrained by the low-temperature onset of the stage and then increased following an exponential correlation with soil thawing (Fig. 6a and Table 4). Such increments of CO2 fluxes after thawing were also observed in forests, alpine tundra, and arctic heath ecosystems (Wu et al., 2010; Brooks et al., 1997; Elberling and Brandt, 2003). The rapid increase in Rs flux may be due to the activation of root respiration and rhizospheric microbial respiration as well as to heterotrophic respiration by enhanced microbial activities in bulk soil with greater C availability by the expansion of thawing depth (Gaumont-Guay et al., 2006). In this stage, the dynamic changes in Rs flux were not always associated with surface soil moisture content, which is reflected in a weak correlation between Rs flux and moisture content (R2=0.008, Fig. 4b). Rs flux even reduced instead when soil moisture content increased quickly. The declining of the Rs flux in high-soil-moisture-content conditions may be attributed to the increased free water in the soil clogging the soil pores as the thawed water accumulates at the thawing front (Zhao et al., 2000) and to the rainy season of the Tibet Plateau (Ye, 1981). This hampers the two-way exchange of gases involved in respiration, with CO2 passing upward from the soil to the atmosphere and oxygen moving in the opposite direction (Stepniewski et al., 1994). Although Rs was hindered by a large increase in soil moisture content to some extent, more organic carbon and soluble matrices were exposed and became available to soil microbes as thawing deepened (Ping et al., 2008). As such, higher metabolic rates of soil organisms were stimulated and more soil carbon was released during this wet and humid ST stage (Keith et al., 1997). Furthermore, 10 consecutive years of observation has found that the near-surface permafrost is warming in the alpine ecosystem regions underlain by permafrost on the Qinghai–Tibet Plateau, increasing the duration of thawing by at least 14 d (Wu et al., 2015), which would emit significantly more Rs in the ST stage.
In the AF stage, the Rs flux showed a slightly increasing trend at initiation and came to a relatively stable state in the end, although the surface soil temperature declined sharply and the freezing process developed quickly (Fig. 6b). When AF first began, the active layer was still basically an open system. It exchanged air and moisture with the atmosphere at least for some duration during the day, and the upper part of the active layer absorbed heat from the atmosphere during the daytime and released it at night (Zhao et al., 2000). So although the reduction in soil temperature had some impacts on the soil microbial activities, some of the soil microbes were still active (Monson et al., 2006) and more nutrient matrices were decomposed and made available due to diurnal freezing and thawing actions (P. Liu et al., 2016). Furthermore, the freezing and thawing actions could initiate the activity of soil microorganisms and promoted soil respiration (Grogan et al., 2004; Contosta et al., 2013).
For these reasons, Rs flux was maintained in a relatively stable state accompanied by a slight increase at the initiation of AF. Although the soil of the top and bottom of the active layer became frozen as the freezing process developed, the soil heterotrophic respiration rate was still higher in the thawing layer between the two freezing fronts, because the soil remained warm and unfrozen water was present (Olsson et al., 2003). As the two-way freezing process was carried out and moisture migrated towards the freezing fronts (Zhao et al., 2000), the soil pores were constantly filled with ice and as a result squeezed out and released the trapped CO2 in the soil pores. Consequently, the Rs still showed a relatively stable dynamic in the later period of AF.
In the WC stage, once the freezing process of the active layer was completed, a sudden decline in soil temperature appeared along with a continuous decrease in soil water content (Fig. 2). The soil respiration at this cooling stage was influenced substantially because the continued decrease in soil temperature and liquid water content resulted in a partial death of microbes (Walker et al., 2006), lowered microbial activities, and the reduction in substrate affinity (Nedwell, 1999). This appears to cause a continuous decline in the Rs flux. However, we observed that the Rs rate never reached zero although the Rs flux continuously declined at this stage (Fig. 6c), indicating that the soil microorganisms could maintain their activities at extremely low temperatures (Panikov et al., 2006) and verifying the results of previous studies (Kurganova et al., 2007; Panikov and Dedysh, 2000). Furthermore, not all cells in the soil were killed or irreversibly damaged by the sustained low temperature and the dropping of soil water content (Walker et al., 2006), and the cold-adapted microflora still breathed and consumed the limited liberated nutrients in the frozen soil (Kurganova et al., 2007). Consequently, Rs still maintained a detectable rate.
In the SW stage, Rs was still restrained by a lower soil temperature and fluctuated at a low rate although the warming process of the active layer had begun as the air temperature increased (Jiao and Li, 2014) before late March (Fig. 6d). However, the rapid increase in Rs flux started after late March, likely as a result of the activation of soil microorganisms (Grogan et al., 2004) and the availability of nutrient matrices with increased soil water content (P. Liu et al., 2016). This happened when the diurnal freezing–thawing process within the surface soil initiated and the surface soil water content increased due to thawing snow in this period (Zhao et al., 2000). This result was consistent with the reports on the Fenghuoshan region of the Qinghai–Tibet Plateau (T. Zhang et al., 2015).
4.2 Dependence of Rs on soil temperature in different freeze–thaw stages
Soil respiration is generally known to be controlled by soil temperature, soil moisture, or a combination of the two. When the soil moisture is not limited, soil respiration is mainly dependent on soil temperature (T. Zhang et al., 2015). In the present study, the variations in soil temperature explained 48 %–92 % of the freeze–thaw stage-specific variabilities in Rs fluxes. Q10 values that reflect the quantitative relationship between Rs and soil temperature differ at each freeze–thaw stage (Table 4). Q10 values were higher at the WC and SW stages when soil temperatures were lower than other stages (Fig. 1) and at the ST stage with higher soil moisture content (Fig. 2). This result is consistent with a report from a temperate plantation forest where Q10 values tended to be higher under lower-temperature and higher-soil-moisture conditions (Yan et al., 2019). Negative correlations with soil temperature and positive correlations with soil moisture of Q10 values were also reported in a subalpine forest of the eastern Qinghai–Tibet Plateau (Chen et al., 2010) and in a temperate cropland (He et al., 2016). However, the Q10 value was minimal and Rs flux showed weak correlations both with soil temperature (R2=0.48, P<0.01) and soil moisture (R2=0.14, P<0.01) at the AF stage. This is mostly likely due to the fact that the active layer became an incomplete open system and hindered and even blocked the free exchanges of gas and moisture between the active layer and atmosphere during the later period of AF. The Qinghai–Tibet Plateau is anticipated to be warmer and wetter under global warming (Li et al., 2010), accelerating permafrost thaw. This will enhance the temperature sensitivities of soil respiration at different freeze–thaw stages, resulting in a much stronger response of the site to global warming in terms of CO2 emissions.
As another influencing factor of soil respiration, soil moisture has been reported to exhibit positive, negative, or null effects on Rs fluxes in various ecosystems (Gaumont-Guay et al., 2006; Balogh et al., 2011; T. Zhang et al., 2015). In the present study, Rs flux exhibited a low quadratic (positive) relationship with soil water content at the different freeze–thaw stages. Soil water content as an independent variable explained 0.8 %–45 % of the variances in Rs only (Fig. 4b), suggesting that soil temperature was the main factor controlling variables for Rs flux regardless of soil water status in all stages.
4.3 Cumulative Rs in different stages and contributions to total C emission of a complete freeze–thaw cycle
The high determination coefficients of exponential equations for Rs fluxes (R2≥0.48) and the low RMSE values (RMSE ≤ 0.67) between the measured and modeled Rs fluxes suggest that the freeze–thaw stage-specific Rs models proposed in this paper are accurate predictors of soil CO2 emissions, at least in this region. The large amount of carbon emitted via soil respiration during the processes of the freezing–thawing cycle of the active layer suggests that Rs of the Qinghai–Tibet alpine meadow ecosystem leads to a significant carbon loss and may play an important role in the global carbon cycle. According to the phenological changes in vegetation and the division between growing season and nongrowing season of the Qinghai–Tibet Plateau (X. Xu et al., 2008; Xu et al., 2005), heterotrophic respiration was most likely the main component of Rs at the AF, WC, and SW stages, which lie in nongrowing seasons (from October to the next April); it accounted for almost two-thirds of the ST stage, which belongs to a growing season (May to September). Because Rs in a growing season differs substantially from those in nongrowing seasons, not only in quantity but also in key controlling variables, stage-specific carbon processes should be taken into consideration for accurate estimation of carbon sinks and sources of the Qinghai–Tibet alpine ecosystem.
At the ST stage, the modeled Rs fluxes ranged from 1.23 to 2.66 µmol m−2 s−1 and the cumulative Rs (1018.02–1068.68 g CO2 m−2) was approximately estimated to be 61 % of the total Rs emission in a complete freeze–thaw cycle (1641.55 to 1744.41 g CO2 m−2). The cumulative Rs of the ST stage and its contribution to the total Rs emission in a complete freeze–thaw cycle in our study were both higher than those at the Fenghuoshan region on the Qinghai–Tibet Plateau or those from Arctic tundra (T. Zhang et al., 2015; Elberling, 2007). This is likely due to the longer duration (157 d) of the ST stage at our study site and the unique seasonal climate of the plateau. More specifically, the Tibetan alpine meadow receives more than 60 %–90 % of its total precipitation during the ST stage, with less than 10 % in the other stages (Z. Xu et al., 2008). In addition, higher soil temperature and water content in wet and humid summers stimulate microbial activity, inducing higher metabolic rates of soil organisms and roots (Keith et al., 1997). Furthermore, observations made in 10 consecutive years in the alpine ecosystem regions underlain by permafrost on the Qinghai–Tibet Plateau have found that warming of the near-surface permafrost increased the duration of thawing by at least 14 d (Wu et al., 2015), emitting a significantly greater amount of Rs in the ST stage.
At the AF stage, exponential regression analysis was carried out with fewer measured Rs values because the duration was shorter than those of other stages. The modeled Rs fluxes were generally lower than those measured during this stage (Fig. 3). These biases between the measured and modeled Rs fluxes were likely to be caused by the sampling scheme. The low sampling frequency (two occasions for daily average data) in the period of the AF could increase the variance in aggregated estimates (Ryan and Law, 2005). In addition, measurements during this stage were usually restricted to daytime and dry days, and the sampling would inevitably miss the pulse of microbial or root activity immediately following occasional precipitation (Doff sotta et al., 2004). Thus, the cumulative Rs (143.74 to 157.34 g CO2 m−2) calculated by an exponential model only accounted for about 8.89 % of the total Rs emission in a complete freeze–thaw cycle, which probably underestimated the Rs emission during this stage. Although the active layer gradually became a closed system in this stage, it is noteworthy that a proportion of respired soil CO2 can still be transported via vascular plants, which may function as a conduit for CO2 from deeper soil layers (Ström et al., 2005). Furthermore, the diurnal freezing and thawing actions occurring in this stage also played an important role in the Rs emissions (Contosta et al., 2013). Therefore, more frequent observations with automated chambers incorporating a vegetation function are warranted to refine the estimated Rs at the AF stage in this study.
At the WC stage, Rs fluxes continuously descended with fluctuation from 1.92 to 0.13 µmol m−2 s−1 and the cumulative Rs (298.36–323.02 g CO2 m−2) was estimated to be 18.43±0.11 % of the total Rs emission in a complete freeze–thaw cycle. The continued decrease in soil temperature and liquid water content appeared to lead to the decline in soil respiration. However, little is known regarding the root function of the alpine meadow and soil microbial activities at this stage. It is generally assumed that lowering soil temperature may hinder microbial activities, but laboratory-based experiments have found that microbial activities can still be substantial at low temperatures of −6 to −10 ∘C (Panikov and Dedysh, 2000; Walker et al., 2006). Further research on the physiology and roles of such psychrophilic microorganisms in soil respiration at the WC stage is necessary.
At the SW stage, the modeled Rs fluxes showed a rising trend in the ranges from 0.42 to 0.72 µmol m−2 s−1 and were generally higher than those measured in 2017 (Fig. 3). These biases may also be caused by low sampling frequency and simple averaging for daily average data in regression analysis (Ryan and Law, 2005). The diurnal freezing–thawing process during this stage also stimulated the activities of soil microorganisms and promoted the Rs emissions, but the low sampling frequency and the restricted sampling time (between 09:00 and 11:30 local time) probably missed the peaks and pulses of Rs fluxes over a day. Therefore, the measured Rs flux may underestimate the actual emission rate in this stage. However, it is also reported that biases of chamber-based estimates of Rs can be reduced by using a regression model which is extrapolated with soil temperature and moisture (Ryan and Law, 2005). In addition, the smaller value of RMSE at this stage also testified to the temperature-driven model being preferable for the Rs prediction (Fig. 5). Thus, the cumulative Rs (181.43–198.37 g CO2 m−2) calculated by the exponential model was estimated to be 11.29±0.11 % of the total Rs emission in a complete freeze–thaw cycle. Despite the possible biases between the modeled and measured Rs fluxes, our model is still a reliable estimate of Rs emission during this stage, which is further supported by the same trends in the variations between the two values. The increasing trend in Rs fluxes can be caused by the following mechanisms. First, the activation of soil respiration was mediated by increased soil microbial activities as soil temperature and water content increased. Furthermore, as spring proceeds with the warming of soil, the mobilization of stored carbohydrates enhanced soil respiration (Davidson et al., 2006). Finally, daily freeze–thaw actions in late April may have further enhanced the soil respiration quickly.
The freezing and thawing process of the active layer significantly controlled the soil respiration of the alpine meadow in the permafrost region of the Qinghai–Tibet Plateau. The soil temperature was the key factor affecting soil respiration regardless of soil water status during each freeze–thaw stage. The cumulated soil respiration in different freeze–thaw stages ranged from 150.54 to 1041.85 g CO2 m−2, and the cumulated soil respiration in ST, AF, WC, and SW stages contributed about 61.32 %, 8.89 %, 18.43 %, and 11.29 % to the total Rs emissions in a complete freeze–thaw cycle, respectively. The Q10 values were higher at the WC and SW stages with lower soil temperatures and at the ST stage with higher soil moisture content. As the Qinghai–Tibet Plateau becomes warmer and wetter (Li et al., 2010), soil respiration at different freeze–thaw stages is predicted to be more sensitive to temperature. Furthermore, in the future climate of warmer temperatures, great changes in freeze–thaw process patterns may have important impacts on Rs. Further research is required to define the regulatory mechanism and its key processes acting on Rs in different freeze–thaw stages of the active layer. In addition, due to the short duration of the AF, more frequent observations should be carried out in order to more accurately evaluate the contribution of Rs at this stage.
The data are available through the corresponding authors and will be made publicly available through the State Key Laboratory of Frozen Soil Engineering Data Center in the near future (http://sklfse.nieer.ac.cn/).
JW and QW designed the research. JW and ZY performed data analysis and calculations and drafted the paper. QW, HK, and JW contributed to the interpretation of the results and to the text. All authors contributed to writing the paper.
The authors declare that they have no conflict of interest.
We are grateful to Yali Liu and Yu Gao for their help in the field measurement of soil CO2 flux. We gratefully thank the reviewers for their comments. We also thank Jiyoung Kang for English correction of an earlier version of this paper.
This research has been supported by the National Natural Science Foundation of China (grant nos. 41771080, 41701066, 41003032), the Fund of the State Key Laboratory of Frozen Soil Engineering (grant no. SKLFSE-ZT-36), and the National Research Foundation of Korea (grant nos. 2019K1A3A1A74107424, 2020R1l1A2072824).
This paper was edited by Christian Beer and reviewed by two anonymous referees.
Balogh, J., Pintér, K., Fóti, S., Cserhalmi, D., Papp, M., and Nagy, Z.: Dependence of soil respiration on soil moisture, clay content, soil organic matter, and CO2 uptake in dry grasslands, Soil Biol. Biochem., 43, 1006–1013, 2011.
Bond-Lamberty, B. and Thomson, A.: Temperature-associated increases in the global soil respiration record, Nature, 464, 579–582, 2010.
Brooks, P. D., Schmidt, S. K., and Williams, M. W.: Winter production of CO2 and N2O from alpine tundra: environmental controls and relationship to inter-system C and N fluxes, Oecologia, 110, 403–413, 1997.
Celis, G., Mauritz, M., Bracho, R., Salmon, V. G., Webb, E. E., Hutchings, J., Natali, S. M., Schädel, C., Crummer, K. G., and Schuur, E. A. G.: Tundra is a consistent source of CO2 at a site with progressive permafrost thaw during 6 years of chamber and eddy covariance measurements, J. Geophys. Res.-Biogeo., 122, 1471–1485, https://doi.org/10.1002/2016jg003671, 2017.
Chen, B., Liu, S., Ge, J., and Chu, J.: Annual and seasonal variations of Q10 soil respiration in the sub-alpine forests of the Eastern Qinghai-Tibet Plateau, China, Soil Biol. Biochem., 42, 1735–1742, 2010.
Chen, X., Wang, G., Zhang, T., Mao, T., Wei, D., Hu, Z., and Song, C.: Effects of warming and nitrogen fertilization on GHG flux in the permafrost region of an alpine meadow, Atmos. Environ., 157, 111–124, 2017.
Commane, R., Lindaas, J., Benmergui, J., Luus, K. A., Chang, R. Y. W., Daube, B. C., Euskirchen, E. S., Henderson, J. M., Karion, A., Miller, J. B., Miller, S. M., Parazoo, N. C., Randerson, J. T., Sweeney, C., Tans, P., Thoning, K., Veraverbeke, S., Miller, C. E., and Wofsy, S. C.: Carbon dioxide sources from Alaska driven by increasing early winter respiration from Arctic tundra, P. Natl. Acad. Sci. USA, 114, 5361–5366, https://doi.org/10.1073/pnas.1618567114, 2017.
Contosta, A. R., Frey, S. D., Ollinger, S. V., and Cooper, A. B.: Soil respiration does not acclimatize to warmer temperatures when modeled over seasonal timescales, Biogeochemistry, 112, 555–570, 2013.
Davidson, E. A. and Janssens, I. A.: Temperature sensitivity of soil carbon decomposition and feedbacks to climate change, Nature, 440, 165–173, 2006.
Davidson, E. A., Belk, E., and Boone, R. D.: Soil water content and temperature as independent or confounded factors controlling soil respiration in a temperate mixed hardwood forest, Glob. Change Biol., 4, 217–227, 1998.
Davidson, E. A., Richardson, A., Savage, K., and Hollinger, D.: A distinct seasonal pattern of the ratio of soil respiration to total ecosystem respiration in a spruce-dominated forest, Glob. Change Biol., 12, 230–239, 2006.
Ding, J., Zhang, Y., Wang, M., Sun, X., Cong, J., Deng, Y., Lu, H., Yuan, T., Van Nostrand, J. D., and Li, D.: Soil organic matter quantity and quality shape microbial community compositions of subtropical broadleaved forests, Molec. Ecol., 24, 5175–5185, 2015.
Doff sotta, E., Meir, P., Malhi, Y., Donato nobre, A., Hodnett, M., and Grace, J.: Soil CO2 efflux in a tropical forest in the central Amazon, Global Change Biology, 10, 601-617, 2004.
Du, E., Zhou, Z., Li, P., Jiang, L., Hu, X., and Fang, J.: Winter soil respiration during soil-freezing process in a boreal forest in Northeast China, J. Plant Ecol., 6, 349–357, 2013.
Elberling, B.: Annual soil CO2 effluxes in the High Arctic: the role of snow thickness and vegetation type, Soil Biol. Biochem., 39, 646–654, 2007.
Elberling, B. and Brandt, K. K.: Uncoupling of microbial CO2 production and release in frozen soil and its implications for field studies of arctic C cycling, Soil Biol. Biochem., 35, 263–272, 2003.
Gaumont-Guay, D., Black, T. A., Griffis, T. J., Barr, A. G., Jassal, R. S., and Nesic, Z.: Interpreting the dependence of soil respiration on soil temperature and water content in a boreal aspen stand, Agr. Forest Meteorol., 140, 220–235, 2006.
Grogan, P. and Chapin III, F.: Initial effects of experimental warming on above-and belowground components of net ecosystem CO2 exchange in arctic tundra, Oecologia, 125, 512–520, 2000.
Grogan, P., Michelsen, A., Ambus, P., and Jonasson, S.: Freeze–thaw regime effects on carbon and nitrogen dynamics in sub-arctic heath tundra mesocosms, Soil Biol. Biochem., 36, 641–654, 2004.
He, X., Du, Z., Wang, Y., Lu, N., and Zhang, Q.: Sensitivity of soil respiration to soil temperature decreased under deep biochar amended soils in temperate croplands, Appl. Soil Ecol., 108, 204–210, 2016.
Henry, H. A.: Soil freeze–thaw cycle experiments: trends, methodological weaknesses and suggested improvements, Soil Biol. Biochem., 39, 977–986, 2007.
Hollesen, J., Elberling, B., and Jansson, P.-E.: Future active layer dynamics and carbon dioxide production from thawing permafrost layers in Northeast Greenland, Glob. Change Biol., 17, 911–926, 2011.
Hugelius, G., Strauss, J., Zubrzycki, S., Harden, J. W., Schuur, E. A. G., Ping, C.-L., Schirrmeister, L., Grosse, G., Michaelson, G. J., Koven, C. D., O'Donnell, J. A., Elberling, B., Mishra, U., Camill, P., Yu, Z., Palmtag, J., and Kuhry, P.: Estimated stocks of circumpolar permafrost carbon with quantified uncertainty ranges and identified data gaps, Biogeosciences, 11, 6573–6593, https://doi.org/10.5194/bg-11-6573-2014, 2014.
Janssens, I. A. and Pilegaard, K.: Large seasonal changes in Q10 of soil respiration in a beech forest, Glob. Change Biol., 9, 911–918, 2003.
Jiao, Y. and Li, R.: Processes of soil thawing-freezing and features of soil moisture migration in the permafrost active layer, J. Glaciol. Geocryol., 36, 237–247, 2014.
Jobbágy, E. G. and Jackson, R. B.: The vertical distribution of soil organic carbon and its relation to climate and vegetation, Ecol. Appl., 10, 423–436, 2000.
Jorgenson, M. and Osterkamp, T. E.: Response of boreal ecosystems to varying modes of permafrost degradation, Can. J. Forest Res., 35, 2100–2111, 2005.
Keith, H., Jacobsen, K., and Raison, R.: Effects of soil phosphorus availability, temperature and moisture on soil respiration in Eucalyptus pauciflora forest, Plant Soil, 190, 127–141, 1997.
Knowles, J. F., Blanken, P. D., Lawrence, C. R., and Williams, M. W.: Evidence for non-steady-state carbon emissions from snow-scoured alpine tundra, Nat. Commun., 10, 1306, https://doi.org/10.1038/s41467-019-09149-2, 2019.
Kurganova, I., Teepe, R., and Loftfield, N.: Influence of freeze-thaw events on carbon dioxide emission from soils at different moisture and land use, Carbon balance and management, 2, 2, https://doi.org/10.1186/1750-0680-2-2, 2007.
Li, L., Yang, S., Wang, Z., Zhu, X., and Tang, H.: Evidence of warming and wetting climate over the Qinghai-Tibet Plateau, Arct. Antarct. Alp. Res., 42, 449–457, 2010.
Li, R., Zhao, L., Ding, Y., Wu, T., Xiao, Y., Du, E., Liu, G., and Qiao, Y.: Temporal and spatial variations of the active layer along the Qinghai-Tibet Highway in a permafrost region, Chinese Sci. Bull., 57, 4609–4616, 2012.
Liu, B., Mou, C., Yan, G., Xu, L., Jiang, S., Xing, Y., Han, S., Yu, J., and Wang, Q.: Annual soil CO2 efflux in a cold temperate forest in northeastern China: effects of winter snowpack and artificial nitrogen deposition, Sci. Rep., 6, 18957, https://doi.org/10.1038/srep18957, 2016.
Liu, P., Zha, T., Jia, X., Wang, B., Guo, X., Zhang, Y., Wu, B., Yang, Q., and Peltola, H.: Diurnal freeze-thaw cycles modify winter soil respiration in a desert shrub-land ecosystem, Forests, 7, 161, https://doi.org/10.3390/f7080161, 2016.
Liu, X. and Chen, B.: Climatic warming in the Tibetan Plateau during recent decades, Int. J. Climatol., 20, 1729–1742, 2000.
Lloyd, J. and Taylor, J.: On the temperature dependence of soil respiration, Funct. Ecol., 315–323, 1994.
Lüers, J., Westermann, S., Piel, K., and Boike, J.: Annual CO2 budget and seasonal CO2 exchange signals at a high Arctic permafrost site on Spitsbergen, Svalbard archipelago, Biogeosciences, 11, 6307–6322, https://doi.org/10.5194/bg-11-6307-2014, 2014.
MacDougall, A. H., Avis, C. A., and Weaver, A. J.: Significant contribution to climate warming from the permafrost carbon feedback, Nat. Geosci., 5, 719–721, 2012.
Monson, R. K., Lipson, D. L., Burns, S. P., Turnipseed, A. A., Delany, A. C., Williams, M. W., and Schmidt, S. K.: Winter forest soil respiration controlled by climate and microbial community composition, Nature, 439, 711–714, 2006.
Mu, C., Zhang, T., Wu, Q., Peng, X., Cao, B., Zhang, X., Cao, B., and Cheng, G.: Editorial: Organic carbon pools in permafrost regions on the Qinghai–Xizang (Tibetan) Plateau, The Cryosphere, 9, 479–486, https://doi.org/10.5194/tc-9-479-2015, 2015.
Nedwell, D. B.: Effect of low temperature on microbial growth: lowered affinity for substrates limits growth at low temperature, FEMS Microbiol. Ecol., 30, 101–111, 1999.
Olsson, P. Q., Sturm, M., Racine, C. H., Romanovsky, V., and Liston, G. E.: Five stages of the Alaskan Arctic cold season with ecosystem implications, Arct. Antarct. Alp. Res., 35, 74–81, 2003.
Panikov, N., Flanagan, P., Oechel, W., Mastepanov, M., and Christensen, T.: Microbial activity in soils frozen to below −39 ∘C, Soil Biol. Biochem., 38, 785–794, 2006.
Panikov, N. S. and Dedysh, S.: Cold season CH4 and CO2 emission from boreal peat bogs (West Siberia): Winter fluxes and thaw activation dynamics, Global Biogeochem. Cy., 14, 1071–1080, 2000.
Phillips, C. L., Nickerson, N., Risk, D., and Bond, B. J.: Interpreting diel hysteresis between soil respiration and temperature, Glob. Change Biol., 17, 515–527, 2011.
Ping, C.-L., Michaelson, G. J., Jorgenson, M. T., Kimble, J. M., Epstein, H., Romanovsky, V. E., and Walker, D. A.: High stocks of soil organic carbon in the North American Arctic region, Nat. Geosci., 1, 615–619, 2008.
Ryan, M. G. and Law, B. E.: Interpreting, measuring, and modeling soil respiration, Biogeochemistry, 73, 3–27, 2005.
Schlesinger, W. H. and Andrews, J. A.: Soil respiration and the global carbon cycle, Biogeochemistry, 48, 7–20, 2000.
Schneider von Deimling, T., Meinshausen, M., Levermann, A., Huber, V., Frieler, K., Lawrence, D. M., and Brovkin, V.: Estimating the near-surface permafrost-carbon feedback on global warming, Biogeosciences, 9, 649–665, https://doi.org/10.5194/bg-9-649-2012, 2012.
Schuur, E. A., Bockheim, J., Canadell, J. G., Euskirchen, E., Field, C. B., Goryachkin, S. V., Hagemann, S., Kuhry, P., Lafleur, P. M., and Lee, H.: Vulnerability of permafrost carbon to climate change: Implications for the global carbon cycle, BioScience, 58, 701–714, 2008.
Stepniewski, W., Gliński, J., and Ball, B.: Effects of compaction on soil aeration properties, in: Developments in agricultural engineering, Elsevier, 167–189, 1994.
Ström, L., Mastepanov, M., and Christensen, T. R.: Species-specific effects of vascular plants on carbon turnover and methane emissions from wetlands, Biogeochemistry, 75, 65–82, 2005.
Tarnocai, C.: The impact of climate change on Canadian peatlands, Can. Water Resour. J., 34, 453–466, 2009.
Tarnocai, C., Canadell, J., Schuur, E. A., Kuhry, P., Mazhitova, G., and Zimov, S.: Soil organic carbon pools in the northern circumpolar permafrost region, Global Biogeochem. Cy., 23, GB2023, https://doi.org/10.1029/2008GB003327, 2009.
Walker, V. K., Palmer, G. R., and Voordouw, G.: Freeze-thaw tolerance and clues to the winter survival of a soil community, Appl. Environ. Microbiol., 72, 1784–1792, 2006.
Walz, J., Knoblauch, C., Böhme, L., and Pfeiffer, E.-M.: Regulation of soil organic matter decomposition in permafrost-affected Siberian tundra soils-Impact of oxygen availability, freezing and thawing, temperature, and labile organic matter, Soil Biol. Biochem., 110, 34–43, 2017.
Wang, G., Mao, T., Chang, J., and Du, J.: Impacts of surface soil organic content on the soil thermal dynamics of alpine meadows in permafrost regions: data from field observations, Geoderma, 232, 414–425, 2014.
Wang, J. and Wu, Q.: Impact of experimental warming on soil temperature and moisture of the shallow active layer of wet meadows on the Qinghai-Tibet Plateau, Cold Reg. Scie. Technol., 90, 1–8, 2013.
Webb, E., Schuur, E., Natali, S., Oken, K., Bracho, R., Krapek, J., Risk, D., and Nickerson, N.: Increased wintertime CO2 loss as a result of sustained tundra warming, J. Geophys. Res.-Biogeosci., 121, 249–265, https://doi.org/10.1002/2014JG002795, 2016.
Weih, M.: Seasonality of nutrient availability in soils of subarctic mountain birch woodlands, Swedish Lapland, Arctic Alpine Res., 30, 19–25, 1998.
Wu, Q., Zhang, T., and Liu, Y.: Permafrost temperatures and thickness on the Qinghai-Tibet Plateau, Glob. Planet. Change, 72, 32–38, 2010.
Wu, Q., Hou, Y., Yun, H., and Liu, Y.: Changes in active-layer thickness and near-surface permafrost between 2002 and 2012 in alpine ecosystems, Qinghai–Xizang (Tibet) Plateau, China, Glob. Planet. Change, 124, 149–155, 2015.
Xu, S., Zhao, X., Fu, Y., Zhao, L., Li, Y., Cao, G., Gu, S., Wang, Q., and Du, M.: Characterizing CO2 fluxes for growing and non-growing seasons in a shrub ecosystem on the Qinghai-Tibet Plateau, Sci. China Ser. D, 48, 133–140, 2005.
Xu, X., Chen, H., and Levy, J. K.: Spatiotemporal vegetation cover variations in the Qinghai-Tibet Plateau under global climate change, Chinese Sci. Bull., 53, 915–922, 2008.
Xu, Z., Gong, T., and Li, J.: Decadal trend of climate in the Tibetan Plateau—regional temperature and precipitation, Hydrol. Proc. J., 22, 3056–3065, 2008.
Yan, T., Song, H., Wang, Z., Teramoto, M., Wang, J., Liang, N., Ma, C., Sun, Z., Xi, Y., and Li, L.: Temperature sensitivity of soil respiration across multiple time scales in a temperate plantation forest, Sci. Total Environ., 688, 479–485, 2019.
Yang, M., Yao, T., He, Y., Zhang, X., and Ma, Y.: The water cycles between land surface and atmosphere in northern part of Tibetan Plateau, Sci. Geogr. Sin., 22, 29–33, 2002.
Ye, D.: Some characteristics of the summer circulation over the Qinghai-Xizang (Tibet) Plateau and its neighborhood, B. Am. Meteorol. Soc., 62, 14–19, 1981.
Yin, G., Niu, F., Lin, Z., Luo, J., and Liu, M.: Effects of local factors and climate on permafrost conditions and distribution in Beiluhe basin, Qinghai-Tibet Plateau, China, Sci. Total Environ., 581, 472–485, 2017.
Zhang, T., Wang, G., Yang, Y., Mao, T., and Chen, X.: Non-growing season soil CO2 flux and its contribution to annual soil CO2 emissions in two typical grasslands in the permafrost region of the Qinghai-Tibet Plateau, Eur. J. Soil Biol., 71, 45–52, 2015.
Zhang, T., Wang, G., Yang, Y., Mao, T., and Chen, X.: Grassland types and season-dependent response of ecosystem respiration to experimental warming in a permafrost region in the Tibetan Plateau, Agr. Forest Meteorol., 247, 271–279, 2017.
Zhang, Y., Gao, Q., Dong, S., Liu, S., Wang, X., Su, X., Li, Y., Tang, L., Wu, X., and Zhao, H.: Effects of grazing and climate warming on plant diversity, productivity and living state in the alpine rangelands and cultivated grasslands of the Qinghai-Tibetan Plateau, Rangeland J., 37, 57–65, 2015.
Zhao, L., Cheng, G., Li, S., Zhao, X., and Wang, S.: Thawing and freezing processes of active layer in Wudaoliang region of Tibetan Plateau, Chinese Sci. Bull., 45, 2181–2187, 2000.
Zimov, N., Zimov, S., Zimova, A., Zimova, G., Chuprynin, V., and Chapin III, F.: Carbon storage in permafrost and soils of the mammoth tundra-steppe biome: Role in the global carbon budget, Geophys. Res. Lett., 36, L02502, https://doi.org/10.1029/2008GL036332, 2009.