the Creative Commons Attribution 4.0 License.
the Creative Commons Attribution 4.0 License.
 | 28 Aug 2020
Quantifying the impact of synoptic weather types and patterns on energy fluxes of a marginal snowpack
Andrew J. Schwartz
Hamish A. McGowan
Alison Theobald
Nik Callow
Synoptic weather patterns are investigated for their impact on energy fluxes driving melt of a marginal snowpack in the Snowy Mountains, southeast Australia. K-means clustering applied to ECMWF ERA-Interim data identified common synoptic types and patterns that were then associated with in situ snowpack energy flux measurements. The analysis showed that the largest contribution of energy to the snowpack occurred immediately prior to the passage of cold fronts through increased sensible heat flux as a result of warm air advection (WAA) ahead of the front. Shortwave radiation was found to be the dominant control on positive energy fluxes when individual synoptic weather types were examined. As a result, cloud cover related to each synoptic type was shown to be highly influential on the energy fluxes to the snowpack through its reduction of shortwave radiation and reflection/emission of longwave fluxes. As single-site energy balance measurements of the snowpack were used for this study, caution should be exercised before applying the results to the broader Australian Alps region. However, this research is an important step towards understanding changes in surface energy flux as a result of shifts to the global atmospheric circulation as anthropogenic climate change continues to impact marginal winter snowpacks.
- Article
(8747 KB) - Full-text XML
- BibTeX
- EndNote


1.1 Synoptic weather influences on snowpack processes
Water generated in mountainous regions is a commodity that over 50 % of the world's population depends on for daily life (Beniston, 2003). Arguably, the most important role in the generation and regulation of these water resources is that of montane snowpacks. These have been referred to as “water towers” (Viviroli et al., 2007) due to their capabilities for storage and slow releases of meltwater. Many snowpacks are undergoing reductions in spatial and temporal extent as a result of anthropogenic climate change (Pachauri et al., 2014). Understanding the physical drivers of snowpack ablation, including synoptic-scale influences, is critical to help assess future water resource availability in mountainous regions as climate change continues.
Snowfall has been related to synoptic weather types in numerous studies globally including in Athens (Prezerakos and Angouridakis, 1984), the central and eastern United States (Goree and Younkin, 1966), the Tibetan Plateau (Ueno, 2005), Budapest (Bednorz, 2008a), and the central European lowlands (Bednorz, 2011). However, work on relationships between snowmelt and synoptic weather types is relatively scarce. Bednorz (2008b) identified increased air temperature and rain-on-snow events as causes for rapid snowmelt (> 5 cm d−1) in the Polish–German lowlands as a result of west-southwest airflows over central Europe during positive phases of the North Atlantic Oscillation (NAO). Similar work has been conducted in North America by Grundstein and Leathers (1998), who were able to identify three main synoptic weather types responsible for significant snowmelt events on the northern Great Plains, all of which included cyclonic influence with different low-pressure center locations and warm air advection to the region. While some knowledge exists on synoptic drivers of snowpack ablation, further research is needed to understand synoptic effects on ablation processes over snowpacks with varying characteristics.
Marginal snowpacks are characterized by high snow density and internal temperatures, making them susceptible to melt from energy input throughout much of the season and particularly sensitive to even subtle shifts in available energy. Anthropogenic climate change has led to changes in snowpack and precipitation properties globally (Adam et al., 2009; Stewart, 2009), and regions that have been historically categorized as having lower temperatures have begun developing marginal characteristics as temperatures increase. However, research related to synoptic influences on the surface energy balance over marginal snowpacks as defined by Bormann et al. (2013) is rare. Hay and Fitzharris (1988) studied the influence of different synoptic weather types on glacier ablation and snowpack melt, while Neale and Fitzharris (1997) used surface energy flux measurements to determine which synoptic types resulted in the highest ablation in the Southern Alps, New Zealand. These studies found net radiation was the dominant term in ablation, but they also noted that the contributions made by each term varied largely depending on the synoptic type and its meteorology. A common characteristic between these studies and others in various regions is that they focused primarily on the surface meteorology for synoptic classifications rather than multiple level analysis, which enables insight into the potential influence of mid- and upper-level atmospheric conditions on surface–atmosphere energy exchanges. Regardless, no analysis at any level exists on synoptic type influence on snowpack ablation within Australia.
1.2 The Australian snowpack
Characteristics of the snowpack in the Australian Alps have been examined in a number of studies with focus on spatial and temporal snow cover variability (Budin, 1985; Duus, 1992), influence on catchment hydrology (Costin and Gay, 1961), the energetics of snowpack melt (Bilish et al., 2018), and isotopic composition of precipitation (Callow et al., 2014). Given observed declines in snow cover, climate change has become a central focus of this research (Chubb et al., 2011; Hennessy et al., 2008; Nicholls, 2005; Reinfelds et al., 2014; Whetton et al., 1996) as any changes to energy flux over the region will significantly impact the already marginal snowpack. Di Luca et al. (2018) showed that snow cover extent in the Australian Alps is expected to undergo reductions of 15 % by 2030 and 60 % by 2070 due to decreases in snowfall quantity and increases in temperature. Observations indicate that reduction in snow cover is already occurring with shortened annual periods of wintertime precipitation. Nicholls (2005) found reductions of 10 % and 40 % in the maximum snow depth and snow depth at the first October measurement respectively from 1962 to 2002. In addition, wintertime precipitation was shown to have decreased by an average of 43 % in high-elevation regions from 1990 to 2009 (Chubb et al., 2011), though much of this could have been due to several severe droughts that occurred during the study period. Fiddes et al. (2015a) showed that snowfall, snow accumulation, and snow depth were highly correlated with temperature and that warming, as a result of climate change, could lead to further reductions in the southeast Australia (SEA) snowpack. The importance of the water generated in the Australian Alps, reduction in wintertime precipitation amounts and frequency, and high spatiotemporal variability of snow accumulation and ablation (Budin, 1985) warrants an understanding of the energetics of Australia's snowpack as they pertain to the influences of shifting synoptic-scale circulations.
1.3 Synoptic weather types and trends in the Australian Alps
The Australian Alps is a marginal snowpack environment (Bilish et al., 2018, 2019), where precipitation is crucial to agriculture, the generation of hydroelectric energy, and recreation. Water generated in the Australian Alps contributes to agriculture in the Murray–Darling Basin that accounts for 62 % of Australia's water use for irrigation (Australian Bureau of Statistics, 2020). A maximum in precipitation in the Australian Alps typically occurs during the cooler months of June to September when it falls as snow at elevations above 1400 m and accounts for twice as much precipitation as during the warmer periods of the year (Chubb et al., 2011). While the snowpack typically exists for relatively short periods compared to those of other regions where winter temperatures are lower and higher snowfall amounts occur such as parts of the European Alps and Rocky Mountains, USA, it is still a vital resource for SEA.
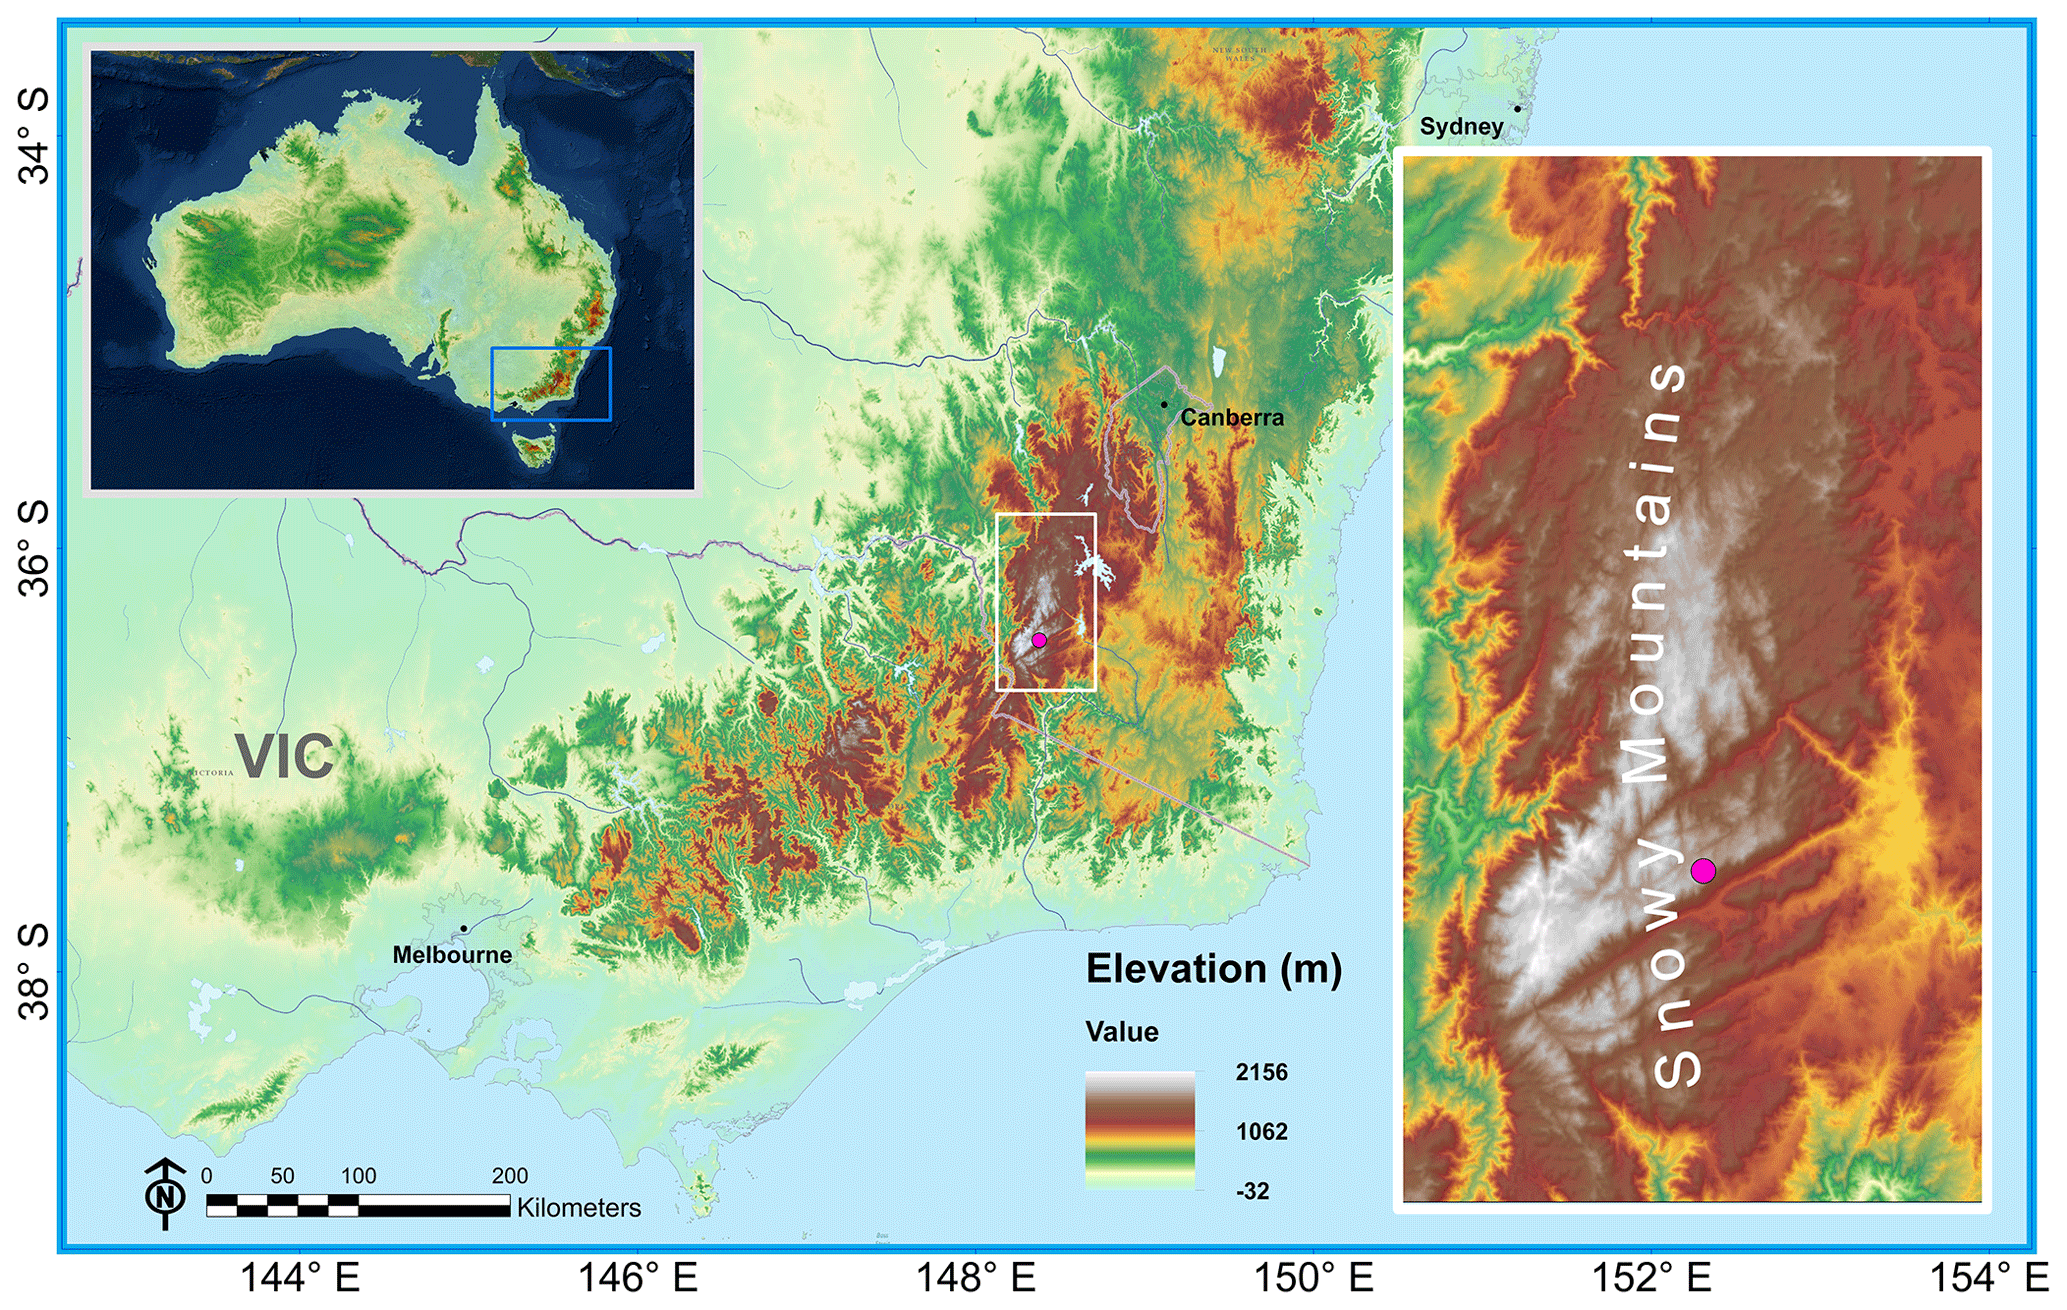
Figure 1Map of southeast Australia and the Snowy Mountains. The pink dot represents the location of the energy balance instrumentation site. Map layer source copyright: ESRI, USGS, NOAA, DigitalGlobe, GeoEye, Earthstar Geographics, CNE S/A Airbus DS, USDA, AeroGRID, IGN, and the GIS user community.
Synoptic weather types in SEA have been changing in recent decades in response to the impact of climate change on background climate states (Theobald et al., 2016). Pepler et al. (2019) noted anticyclone increases of 20 %–30 % in southern Australia and 31 %–36 % in the Tasman Sea during 1960–1979 and 1979–2014 with higher increases during the cool season (May–October). In addition, atmospheric fronts are expected to shift southward (Catto et al., 2014), and predicted global-warming-driven increases in Southern Annular Mode (SAM) value will result in the poleward shift of general synoptic systems (Cai et al., 2005). This would likely result in significant reductions to snowpack as SAM has been shown to have the highest impact on snow depth and snow season length at Spencers Creek in the Australian Alps with reductions of up to 32 % during years where the June–September SAM is greater than 0.7 (Pepler et al., 2015).
Significant work has been conducted on identification of patterns and trends in Australian synoptic climatology as it pertains to precipitation variability (Chubb et al., 2011; Fiddes et al., 2015b; Pook et al., 2006, 2010, 2012, 2014; Theobald et al., 2016). However, impacts on surface energy fluxes as a result of synoptic types have not been explored as they have in other regions. The objective of this study is to identify the synoptic weather types that contribute the highest amounts of energy to the Pipers Creek catchment headwaters snowpack. This is accomplished through (1) the identification and classification of common synoptic types during periods of homogeneous snow cover, (2) attribution of snowpack energy flux characteristics to each synoptic type, and (3) construction of energy balance patterns as they pertain to common synoptic patterns/progressions.
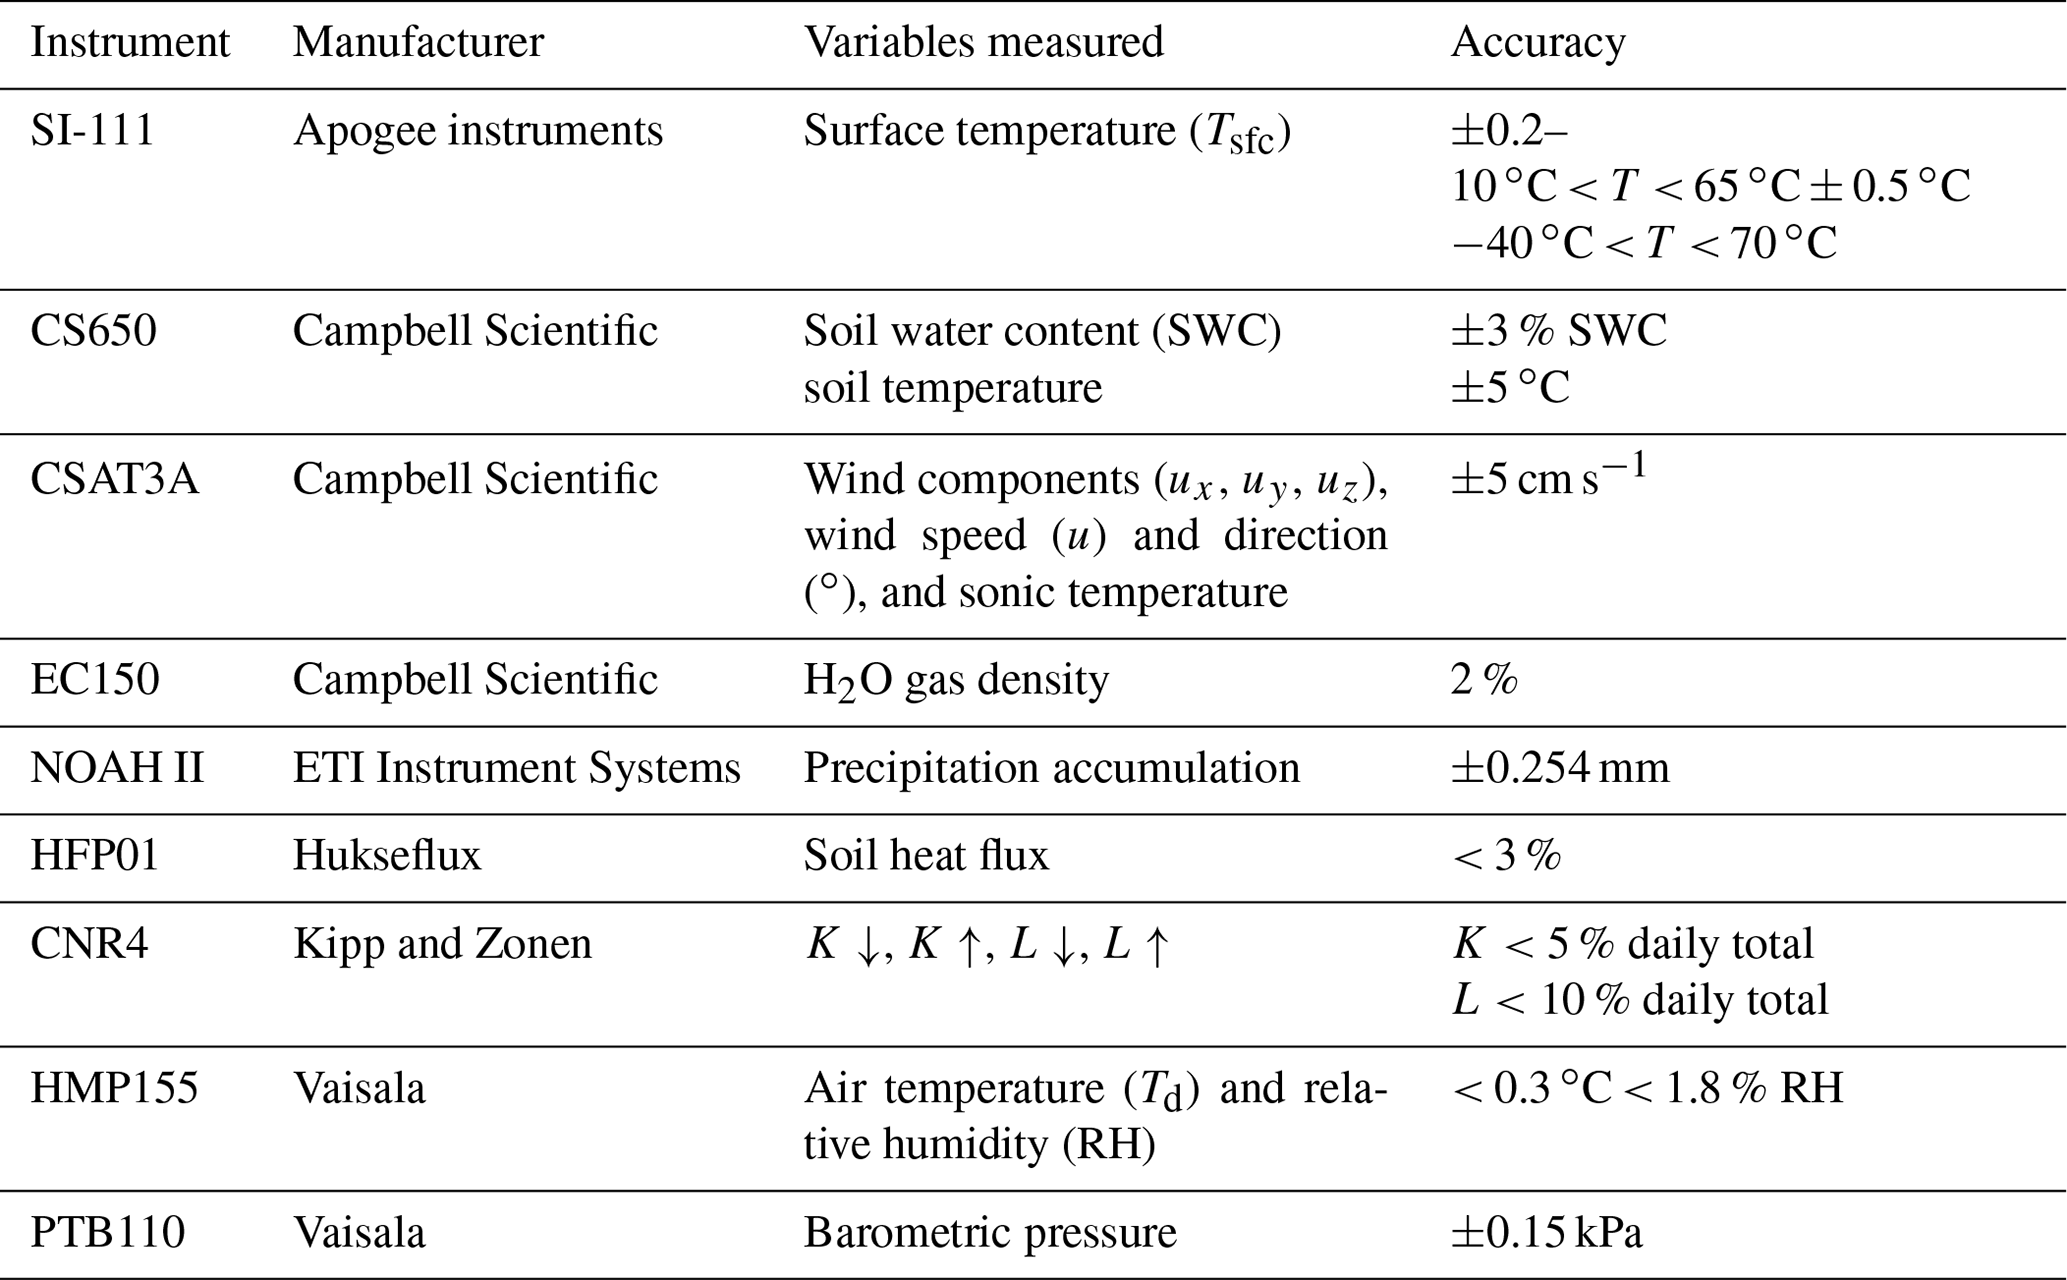
Table 1Information on instruments used at the Pipers Creek catchment site.
2.1 Study site and climate
Energy flux measurements were made 16 km west of Lake Jindabyne at the Pipers Creek catchment headwaters (36.417∘ S, 148.422∘ E) at an elevation of 1828 m in the Snowy Mountains, Kosciuszko National Park, New South Wales (NSW), Australia (Fig. 1). The surrounding areas contain a mixture of living and dead Eucalyptus pauciflora (snow gum) trees and open grassland areas with fens and alpine bogs. Many of the snow gums were impacted by fire in 2003 and have experienced slow regrowth. The site chosen at the Pipers Creek catchment headwaters contains alpine bog and eucalypt woodland that are “the two most common types in the broader region, together representing 47 % of the total area above 1400 m elevation” (Bilish et al., 2018, p. 3839). Gellie (2005) showed that the E. pauciflora woodland was present in five of the 15 dominant vegetation formations that cover 57 % of area within the broader region, while Alpine grassland/bog (including herb fields) accounts for another 8 %. The area's mixed characteristics of forested and open grasslands with alpine wetlands within the Pipers Creek study catchment and immediately surrounding the flux tower site used in this study are representative of those found throughout the Australian Alps.
The Snowy Mountains are characterized by relatively mild weather conditions compared to other mountain ranges. Winter temperatures are typically around 0 ∘C with mean low temperatures during July (the coldest month) at −5 ∘C and mean high temperatures between 2 and 4 ∘C (BOM, 2018b) that readily allow for melt of the snowpack. As such, snowpack properties in the catchment are consistent with those of maritime snowpacks that are associated with basal melting, high temperatures, and high wind speeds (Bilish et al., 2018; Sturm et al., 1995).
The nature of single-site energy balance studies in complex terrain means that measurements may not be truly representative of the larger area. Terrain-induced flows and aspect/slope at the measurement site can alter radiative exchange and turbulent fluxes, resulting in different energy balances over short distances. Therefore, we suggest caution when applying the Pipers Creek catchment headwaters energy balance to the wider area of the Australian Alps. While this is a drawback to single-site studies, this paper aims to take the first step towards broad-scale understanding of synoptic weather on the Snowy Mountains snowpack.
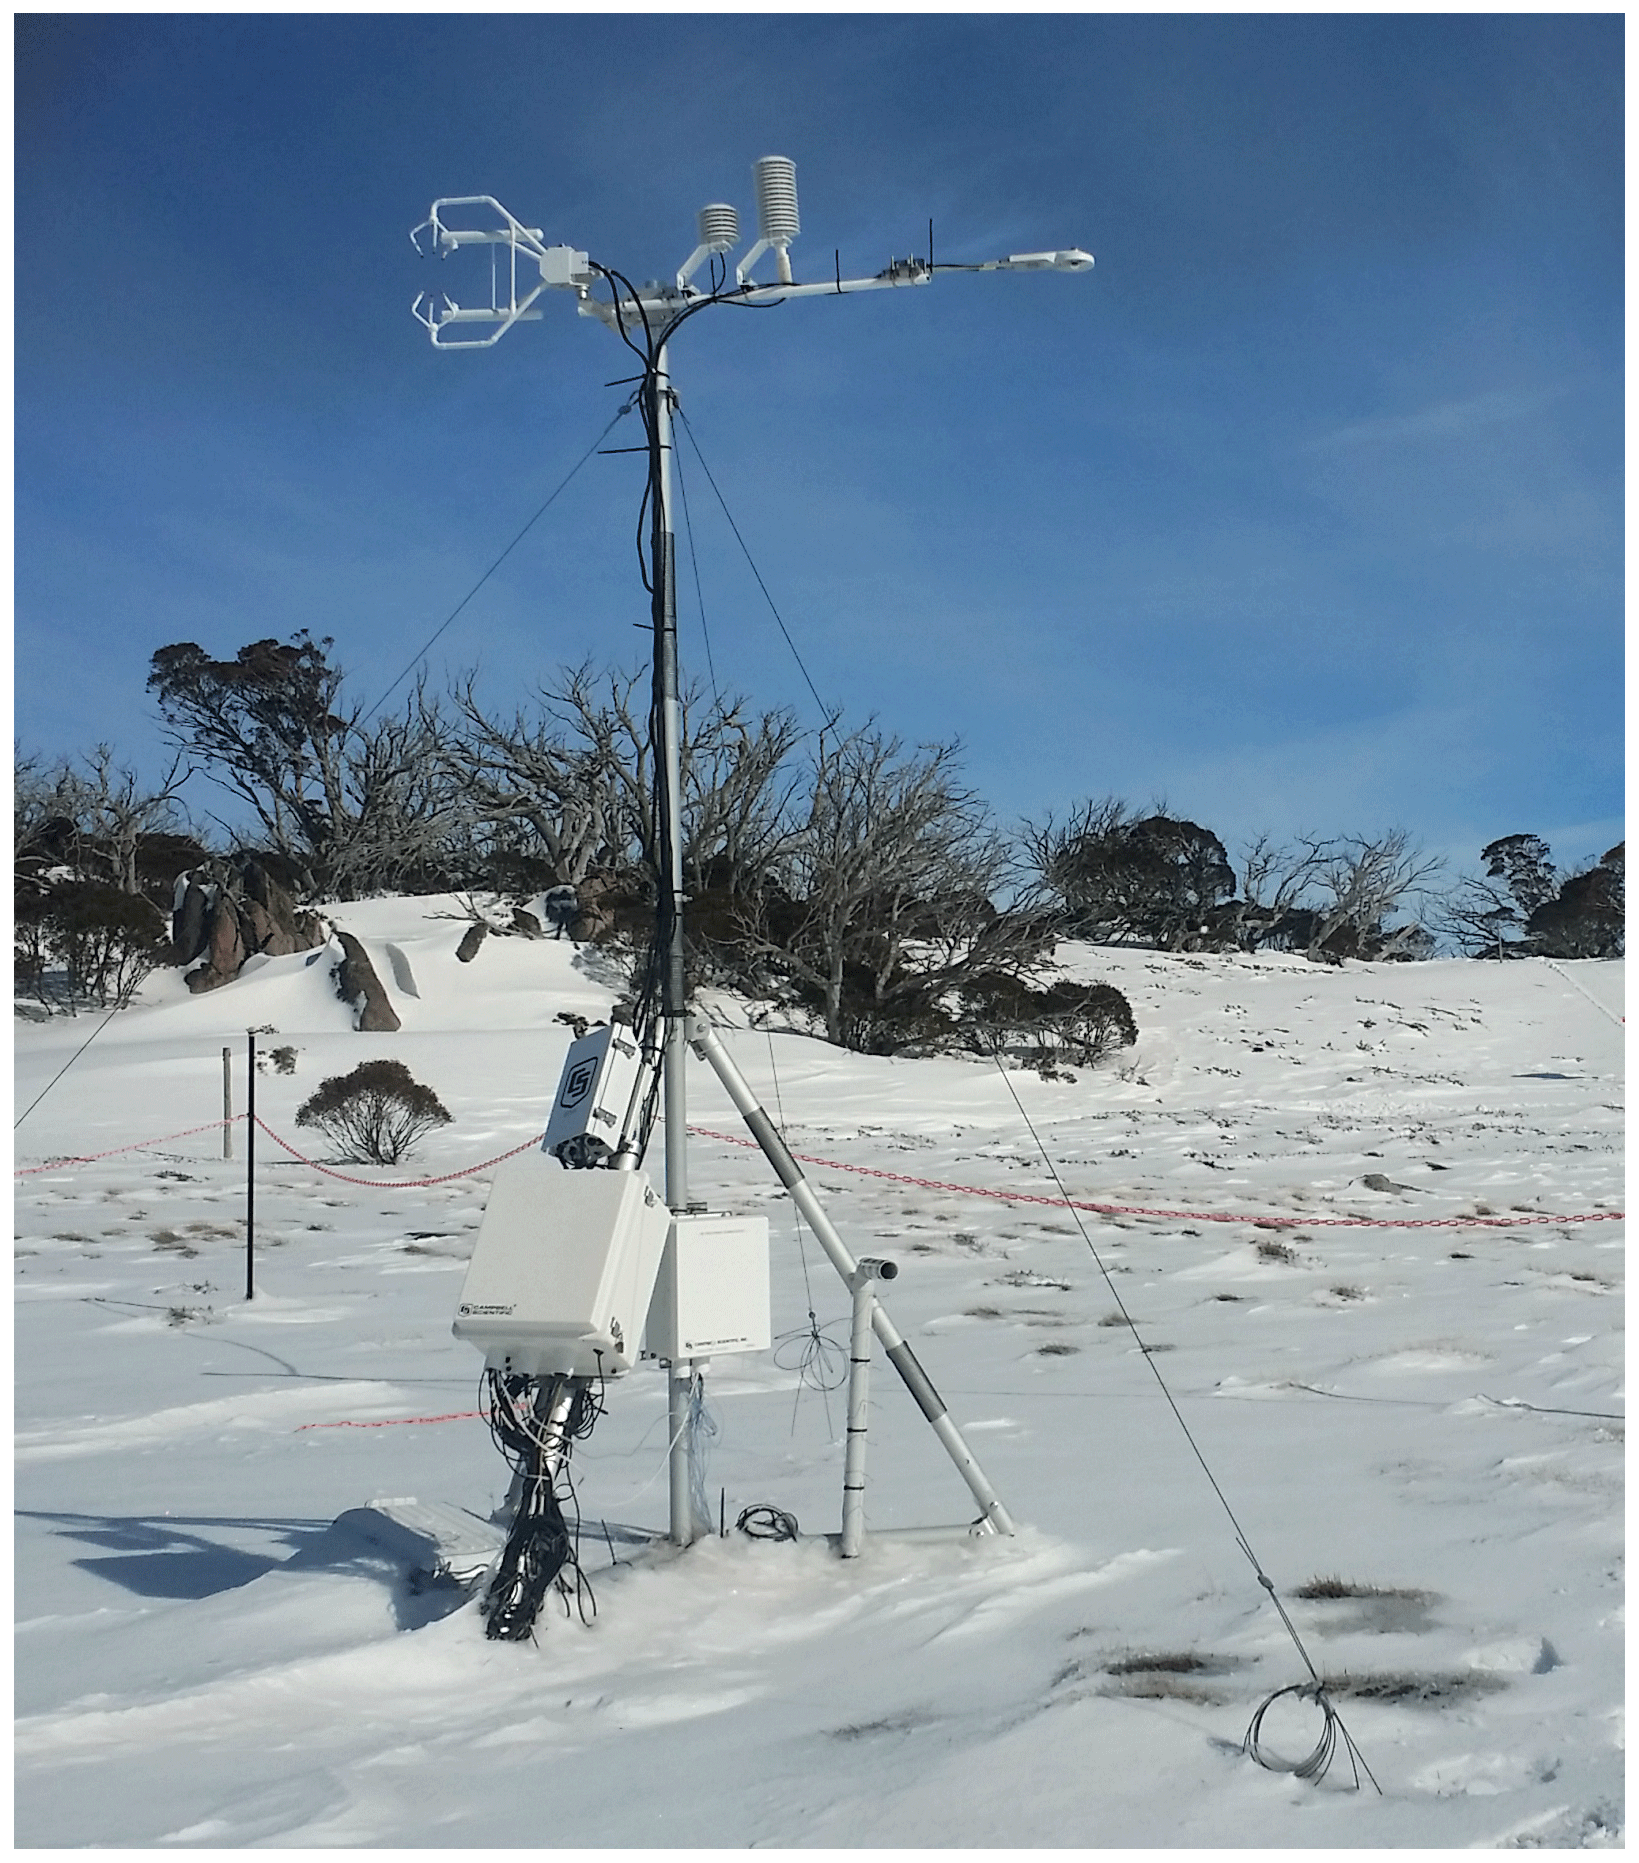
Figure 2Energy balance field site with eddy covariance instrumentation at Pipers Creek catchment headwaters.
2.2 Instrumentation
The Pipers Creek site (Fig. 2) was established on 10 June 2016 and collected data for the 2016 and 2017 winter seasons. The site consisted of a Campbell Scientific eddy covariance (EC) system to measure fluxes of latent (Qe) and sensible (Qh) heat at 10 Hz at a height of 3.0 m above ground level (a.g.l.). A Kipp and Zonen CNR4 radiometer (3.0 m a.g.l.) was used to measure incoming and outgoing shortwave (K) and longwave (L) radiation to allow for comparisons of all radiation components rather than simply net all-wave radiation (Q*). Ambient air temperature and relative humidity were measured at the top of the mast by a Vaisala HMP155 probe at ∼ 3.1 m above ground level. A Hukseflux heat flux plate measured ground heat flux (Qg) at a depth of 5 cm and was placed approximately 0.5 m from the center of the mast to minimize any influence the mast could have on snow accumulation above the sensor. Surface temperatures were monitored using an Apogee Instruments SI-111 infrared radiometer at approximately 2 m from the center of the mast. Details on the instruments used for each measurement are shown in Table 1.
Precipitation data from an ETI Instrument Systems NOAH II weighing gauge located approximately 1 km to the northwest of the energy balance site at an elevation of 1761 m were supplied by Snowy Hydro Limited (SHL). A 6 m diameter Double Fence Intercomparison Reference (DFIR) shield was used around the gauge in order to prevent wind-related under-catch of snowfall (Rasmussen et al., 2012) and was additionally sheltered by vegetation to the west.
2.3 Identification of snow cover periods
Homogeneous snow cover is crucial to accurate measurement and analysis of snowpack energy balance (Reba et al., 2009). Snow cover was considered to be homogeneous when no grass or bush was protruding from the snow surface with the exception of distant patches of E. pauciflora trees. Periods with homogeneous snow cover were determined using data from the Pipers Creek instrumentation site and were cross referenced to manual snow measurements made at the Spencers Creek snow course 6.6 km northwest of the Pipers Creek field site (Snowy Hydro Ltd, 2018). Periods with surface temperatures above 1.5 ∘C as measured by the SI-111 infrared radiometer that did not correspond to rain-on-snow events and periods with albedo measurements less than 0.40 (Robock, 1980) were considered to have heterogeneous snow cover and were eliminated.
2.4 Synoptic classification of snow cover days
Synoptic weather type classification of homogeneous snow cover days was conducted using synoptic typing methods adapted from Theobald et al. (2015). European Centre for Medium-Range Weather Forecasts (ECMWF) ERA-Interim reanalysis data (Dee et al., 2011) with a resolution were obtained for each day from 10 June 2016 through 31 October 2017. This date range was chosen to ensure inclusion of all potential dates with snow cover during the 2016 and 2017 snow seasons after the initial instrument tower installation on 10 June 2016. Variables included in the reanalysis data consisted of mean daily values of mean sea level pressure (MSLP); temperature and relative humidity at 850, 700, 500, and 250 hPa; wind vectors at 10 m a.g.l., 850, 700, 500, and 250 hPa; and 1000–500 hPa geopotential heights. The domain of the included variables was limited to 20–46∘ S and 120–160∘ E, ensuring coverage of synoptic-scale systems affecting the Australian Alps.
Focus was placed on analysis of temperature (Td) and relative humidity (RH) values because of their impact on Qe, Qh, and radiative fluxes (Allan et al., 1999; Reba et al., 2009; Ruckstuhl et al., 2007; Webb et al., 1993). Relative humidity values at 850, 700, and 500 hPa were used to investigate the potential influence of cloud cover. MSLP and wind vector analysis at the 850, 700, 500, and 250 hPa levels allowed for the identification of Td and RH advection (Pook et al., 2006) into the Australian Alps. Thickness between 1000 and 500 hPa was used to determine frontal positions relative to the Australian Alps (Pook et al., 2006) and accordingly the Pipers Creek field site.
The method used for synoptic comparison of energy flux characteristics was adopted from the approach of similar types of studies that used “days” as the temporal period for analysis in the Snowy Mountains region (Chubb et al., 2011; Fiddes et al., 2015b; Theobald et al., 2015, 2016) and glacier/snowpack energy balance (Hay and Fitzharris, 1988; Neale and Fitzharris, 1997). “Days”, periods lasting 24 h from 00:00 to 23:59 Z, were considered optimal to determine radiative flux characteristics (diurnal radiation cycle) that may be missed on smaller timescales. While the use of UTC days meant that the synoptic characteristics corresponded to local days by an offset by 10 h (00:00 UTC = 10:00 AEST), the effects of the synoptic conditions on terrain-induced flows would be the same regardless of whether they aligned with the local day. Overall, the use of UTC days allowed for determination of short-term energy fluxes that can also be easily compared over several months, thus being most appropriate for the entire snow season. Examination of higher-temporal-resolution snowpack energy balance at a collocated site can be found in Bilish et al. (2018).
Days within the ERA-Interim data that matched snow cover days were extracted and analyzed using the k-means clustering algorithm developed by Theobald et al. (2015). The algorithm was tested for 1–20 clusters, and an elbow plot of the cluster distances was used to identify the optimum number of clusters (Theobald et al., 2015), which was seven. The identification of an elbow in the plot at seven clusters indicates a reduction to the benefit of adding additional clusters as the sum of distances for additional clusters fails to yield significant reductions beyond that point (Wilks, 2011).
Clustering of the synoptic conditions for each day was verified through manual analysis of MSLP and 500 hPa charts from the Australian Bureau of Meteorology (BOM) (Bureau of Meteorology, 2018a). Cloud cover for each type was investigated and verified through the use of visible and infrared band Himawari-8 satellite data (https://www.ncdc.noaa.gov/gibbs/, last access: 17 June 2020) at 3 h increments from 00:00 to 21:00 Z, (10:00–07:00 AEST) with one of three categories assigned to each day studied: (1) no cloud cover, (2) partial cloud cover, or (3) complete cloud cover. Cloud cover was investigated throughout the days to ensure that all effects of cloud cover on energy balance were represented.
Manual verification of the k-means clustering algorithm using BOM synoptic charts identified 4 d (2.45 %) out of the 163 classified during the 2016 and 2017 seasons that had been classified incorrectly, and they were subsequently moved to their correct synoptic type. Three of the four misclassified days were early (7 June 2016) or late (19 and 22 September 2016) in the snowpack seasons with the fourth occurring in the middle of winter on 31 July 2017. Synoptic characteristics from these days tended to be complicated with no discernible dominant features that matched those of classified types. This is likely due to shifting synoptic conditions between seasons related to poleward or equatorial shifts in westerly winds.
2.5 Snowpack energy accounting
Accurate measurement of snowpack energy balance and associated melt can be difficult due to snowpack heterogeneity (Reba et al., 2009) and problems with energy balance closure (Helgason and Pomeroy, 2012). The basic snowpack energy balance can be expressed as
where the energy available for snowmelt (Qm) is equal to the sum of Q∗, Qh and Qe, Qg and the energy flux to the snowpack from liquid precipitation (Qr) (Male and Granger, 1981; McKay and Thurtell, 1978). It is important to note that all terms used in the calculation of the snowpack energy balance are net terms (Marks and Dozier, 1992; Stoy et al., 2018; Welch et al., 2016). Using net terms allows for conservation of energy within the (ideally) closed energy balance system of the snowpack and aids in more accurately determining contributions of each term to the energy balance.
Internal energy storage and melt processes can make calculation of the snowpack energy balance particularly difficult when internal measurements of the snowpack are not available due to problems closing the energy balance (Helgason and Pomeroy, 2012). This is particularly difficult over Australia's snowpack due to its marginal characteristics that result in nearly constant internal snowpack melt. Therefore, Qm can be more accurately expressed as a residual energy term (Qres) that is defined as the sum of the measured terms in Eq. (1) plus any error in energy balance closure (Qec):
While Q∗ can be used for basic analysis of the snowpack energy balance, a decomposition into its individual components is necessary to understand the role of short- and longwave radiation exchange in snowpack energetics (Bilish et al., 2018). Therefore, net radiation should be broken into its net flux terms:
which quantify the net shortwave (K∗) and net longwave (L∗) components.
The approach taken within this paper is to examine net radiative flux components individually, similar to the methods used by Bilish et al. (2018), to be precise in the identification of synoptic-scale effects on snowpack energy fluxes through differences in temperature, relative humidity, and cloud cover. Qres calculation and comparisons of snowpack energy flux terms were performed using the terms in Eq. (1), but with the net radiation terms K∗ and L∗ used rather than summed as Q∗ only. This research uses the energy flux convention where positive values are flux to the snowpack and negative values are flux away from the snowpack.
2.6 Energy flux measurements of synoptic types
Coordinate rotation for EC systems is typically used to account for errors introduced into flux data due to imprecise instrumentation leveling. However, complex terrain can complicate EC measurements through local-scale processes such as thermally induced anabatic and katabatic flows, modification and generation of complex terrain-induced flows, and inhomogeneity of terrain. In these areas, coordinate rotation is used to align the eddy covariance coordinate system with the sloping surface and to identify and remove larger-scale motions that may be measured with the microscale flows. The Pipers Creek catchment site is located on predominantly level terrain; however, double coordinate rotation was used to process the EC data to ensure terrain-induced influences on airflow were removed (Stiperski and Rotach, 2016).
Frequency corrections were made to the EC data to account for sensor response delay, volume averaging, and the separation distance of the sonic anemometer and gas analyzer when calculating fluxes. Finally, Webb, Pearman, and Leuning (WPL) air density corrections (Webb et al., 1980) were made to account for vertical velocities that exist as a result of changing air mass density through fluxes of heat and water vapor. Quality flags were calculated for Qh and Qe using the methods of Mauder and Foken (2011) that assigned a number from 0 to 2 based on the quality of the fluxes. High-quality data that are able to be used for fundamental research were assigned a 0, fluxes assigned a 1 are less accurate but can still be used for long-term observations, and fluxes assigned a 2 needed to be removed and gap-filled.
Qh and Qe fluxes were calculated using the EC equations:
where ρ is air density (kg m−3), Cp is the specific heat of air (1005 J kg−1 deg−1), is the average covariance between the vertical wind velocity w (m s−1) and potential temperature θ (K), Lv is the latent heat of sublimation or vaporization of water (J kg−1), and is the average covariance between the vertical wind velocity w (m s−1) and specific humidity q (kg kg−1) (Reba et al., 2009).
The calculation of Qr followed Bilish et al. (2018) and was determined using three separate calculations to establish approximate wet bulb temperature (Tw) (Stull, 2011), the fraction of precipitation falling as rain (1−Psnow) (Michelson, 2004), and total rain heat flux (Qr) based on precipitation accumulation over a 30 min period.
2.7 Energy flux data quality control and gap-filling
In addition to removing EC measurements assigned a quality flag of 2, Qe and Qh values were also removed when water vapor signal strength, a unitless number calculated from the fraction of beam received compared to that emitted, from the gas analyzer was < 0.70 in order to remove erroneous readings during periods of precipitation (Campbell Scientific, 2018; Gray et al., 2018). A seven-point moving-median filter was implemented over three iterations to de-spike the data and remove values more than 3.0 standard deviations away from the median values.
Preexisting gaps and gaps introduced into the data by the quality control procedures were filled using linear interpolation described by Falge et al. (2001a, b) and the random forest regression technique (Breiman, 2001). Linear interpolation of missing Qe and Qh values was used for gaps up to 90 min in length. Traditionally, mean diurnal variation values are also used for gap-filling procedures (Bilish et al., 2018; Falge et al., 2001a, b). However, it was determined that using mean values would likely obscure any unique energy balance characteristics of the synoptic types being investigated and, therefore, was not included as a gap-fill strategy for the data.
The R programming package randomForest (Liaw and Wiener, 2002) was used to fill gaps in Qe and Qh longer than 90 min in length. The random forest regression trained to determine Qe and Qh flux values was developed using 26 atmospheric and soil variables collected in addition to EC measurements. Mean squared errors (MSEs) were examined for forests with 1–500 trees, and it was determined that 150 trees were sufficient to build an accurate model for both Qe and Qh. Tests were then conducted to determine the optimal number of variables to be randomly selected at each node, which showed 13 variables were optimal for determination of Qh and 14 variables should be used for Qe. The Qe and Qh random forest regression models were tested for their ability to predict values that had been used to train the models by comparing the measured Qe and Qh values with the predicted values. Root-mean-squared error (RMSE) and the coefficient of determination (R2) were determined for each advective flux. Predicted values showed high correlation to measured values with both variables showing R2 values higher than 0.97. The Qe regression had a RMSE of 2.56 W m−2 and had lower uncertainty than the Qh regression that had a RMSE of 4.67 W m−2.
Following quality control procedures, 2571 of the initial 7756 records (33 %) remained in the Qe data, and 4019 records (52 %) remained in the Qh data. Linear interpolation yielded an addition of 910 Qe values (12 %) and 928 Qh values (12 %). The random forest regression models were the largest source of gap-filled data with the contribution of an additional 4275 Qe values (55 %) and 2809 Qh values (36 %).
Identification of homogeneous snow cover days for the 2016 and 2017 snow seasons (June–October) resulted in 163 total days with 90 d occurring in 2016 and 73 d in 2017. July, August, and September had the highest number of classifiable days during the period. June and October still had periods with homogenous snow cover, but they became intermittent, and fewer classifiable days were in each of the months. This led to fewer periods of study at the beginning and end of the snow seasons when the snowpack was variable, with more in the late winter and early spring months when snow cover was more consistent. Mean surface and cloud characteristics and median daily energy flux characteristics of synoptic types identified during the two seasons are presented in Table 2.
3.1 Synoptic types
3.1.1 Surface characteristics
The dominance of the subtropical ridge in Australia's midlatitudes is evident in the synoptic types. Four of the types (T1, T2, T5, and T7) display dominant surface high-pressure systems, each with slightly different orientation and pressure center locations (Fig. 3a) resulting in different energy flux characteristics. Dominant south-southwesterly winds from T1 are the result of the high-pressure center being located to the northwest of the study area. T2 has a predominantly zonal flow resulting from an elongated high to the north-northeast. T5 and T7 are characterized by north-northwesterly flow from high-pressure centers over the New South Wales (NSW) and Queensland (QLD) coast and directly over the Snowy Mountains region, respectively.
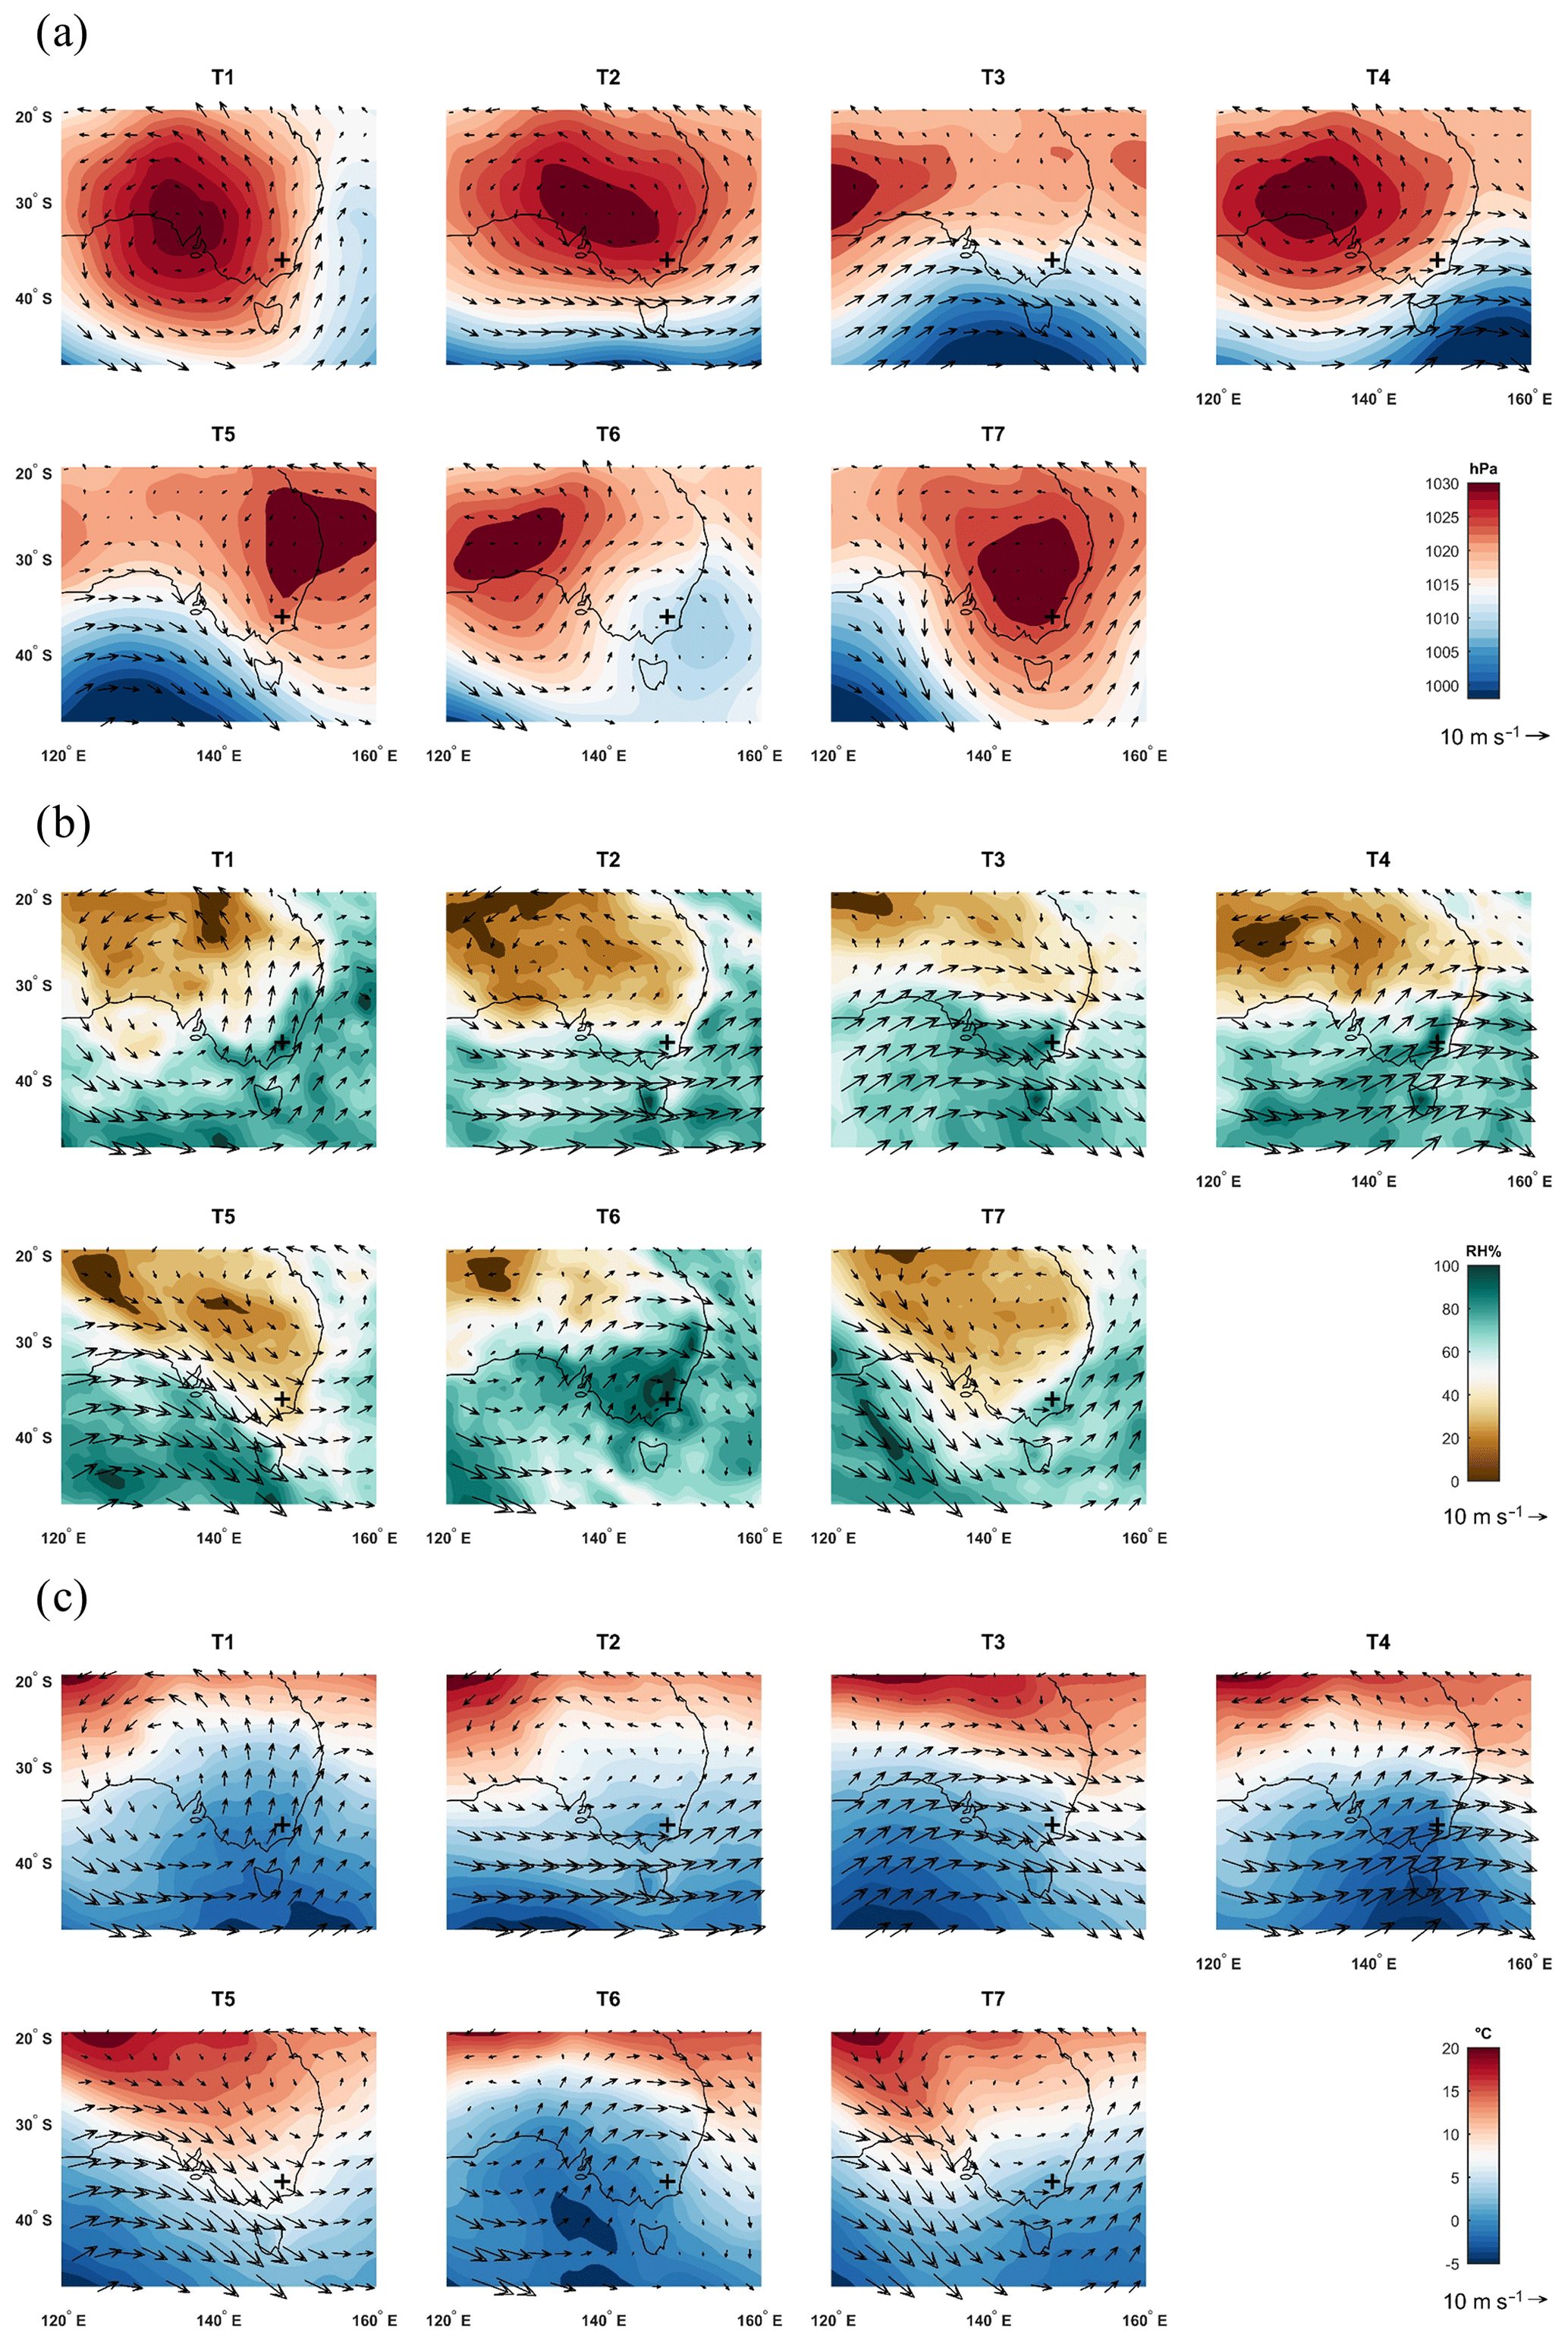
Figure 3Mean synoptic type MSLP and 10 m wind vectors (a), 850 hPa RH and wind vectors (b), and 850 hPa Td and wind vectors (c) over the southeast Australian region for the 2016 and 2017 seasons. The location of the surface energy balance site is marked with “+”.
T3 is characterized as having dominant northwest winds along a trough axis that is positioned over SEA with a secondary coastal trough extending from southern NSW to the NSW–QLD border. T4 shows a transition from a surface trough that has moved to the east of the study region to a high-pressure system that is moving into the area with winds from both features that converge over the Snowy Mountains region. The only synoptic type to have dominant influence from a surface low was T6 that had weak south-southwesterly flow over the region from a weak cutoff low to the east. For the purposes of this research, the identification of cutoff lows follows the characteristics outlined by Chubb et al. (2011) that omit the presence of a closed circulation, but include a cold anomaly aloft that was cut off from the westerly wind belt.
Though characterization of synoptic types is purely statistical, T1, T4, T5, and T6 are considered to be “transition types” as they have surface pressure characteristics that indicate a change in pressure regime (low–high or high–low) in the upcoming days. T1, T4, and T6 are post-frontal transition types that show high-pressure ridging into the region following the passage of a trough that has either moved to the east (T1 and T4) or developed into a weak lee-side cutoff low (T6). T5 shows the approach of a trough from the west and an associated transition to a low-pressure system. T2 and T7 show the area under the influence of zonal flow as a result of high-pressure systems centered over the area, while T3 shows SEA under the influence of a trough at the time of observations.
3.1.2 Relative humidity and cloud cover
Understanding RH values associated with different synoptic types provides the ability to track types that are favorable for high Qe exchange with the snowpack. In addition, RH values at all tropospheric levels can have impacts on snowpack energy flux through influences on K∗ and L∗ exchange via changes to insolation and the absorption and emission of L. The identification of RH characteristics and associated cloud cover is necessary to fully develop energy flux characteristics for each type.
Many of the synoptic types display local RH maxima in the Snowy Mountains region at 850 hPa (Fig. 3b), and, while T5 has the lowest RH values of all types, it still has slightly higher RH values over the area. The elevation in RH values in the region is most likely caused by changes of air mass thermodynamic properties due to orographic forcing of the mountains (Ahrens, 2012). T4 and T6 had the highest RH values over the region at 850 hPa, with both being widespread and higher than 90 %. T6 shows strong southerly advection of elevated RH values from the tropics along the NSW and QLD coast ahead of troughs at 700 and 500 hPa that are associated with the surface cutoff low.
Identification of cloud cover, conducted following the procedures outlined in Sect. 2.4, agreed with the mean RH characteristics of T4 and T6 with both types having 100 % cloud cover between partial and complete cloud cover days (Table 2). However, T1, T3, and T5 also had 100 % cloud cover occurrence, and two of the three (T1 and T3) had RH values above 80 %. T5 was the only synoptic type with 100 % cloud cover and a RH value below 80 %. T6 showed the highest RH values of any type with values greater than 90 % over the region at the 700 and 500 hPa levels. While not definitive, this would suggest that T6 has deeper or more cloud layers than T4, which likely only has clouds at lower altitudes. T2 and T7 had the lowest percentage of days, with any cloud cover, which is confirmed by their low RH values at 700 hPa (< 20 % and < 30 %) and 500 hPa (< 30 % and < 40 %), respectively. In addition, they were the only two types with cloud-free days with T2 having clear sky 25 % of the time and T7 having 16 % of its days without cloud.
3.1.3 Temperature
Temperature characteristics of synoptic types at low levels and mid-levels in the atmosphere are crucial to identify those with the highest surface sensible heat flux characteristics. The highest mean temperatures and strongest warm air advection (WAA) in the Snowy Mountains region at 850 hPa (Fig. 3c) was found to be from T5 and is driven by converging winds on the back of a high-pressure circulation to the east and the leading edge of a trough to the west. T2 and T3 have the second and third highest temperatures, respectively, but have different advection characteristics. T2 shows relatively weak WAA into the Snowy Mountains region associated with zonal flows at 850 hPa resulting from the high-pressure circulations located to the north (similar to T7). However, T3 shows cold air advection (CAA) associated with dominant winds from the west-northwest.
Overall, CAA at 850 hPa can be identified in four of the seven types (T1, T3, T4, and T6), and warm air advection exists in the other three synoptic types (T2, T5, and T7). Of the four CAA types, T1 and T4 advection is being generated through south-southwest and west-southwest winds, respectively, related to high-pressure centers to the northwest. Despite a stronger southerly component of dominant CAA winds in T1, temperatures are lower in T4, which has a higher westerly component to the wind. T6 shows CAA related to converging winds on the back of a trough to the east and a high to the northwest.
Table 2Synoptic, energy flux, and occurrence characteristics for each synoptic type. Mean daily surface and cloud cover characteristics are mean values, and daily energy flux values are median values.
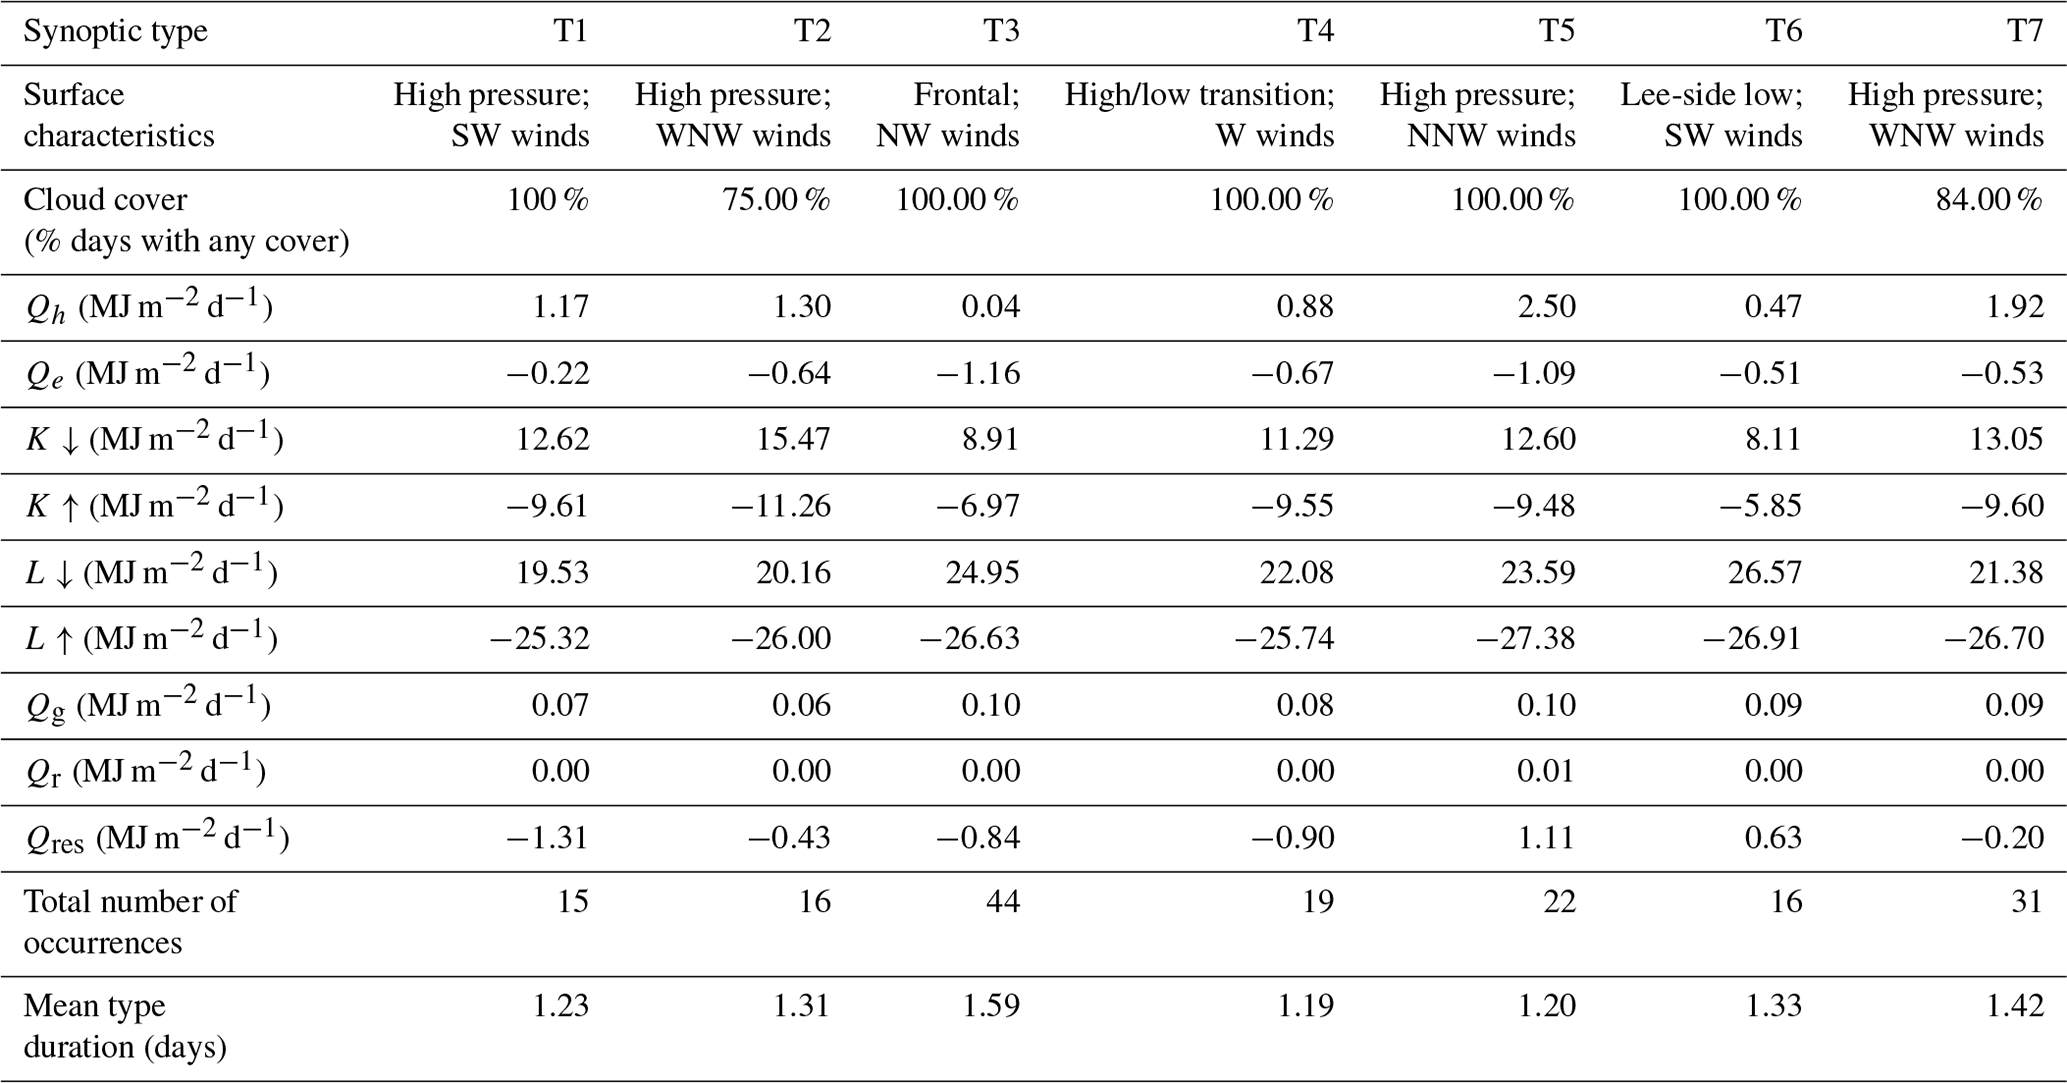
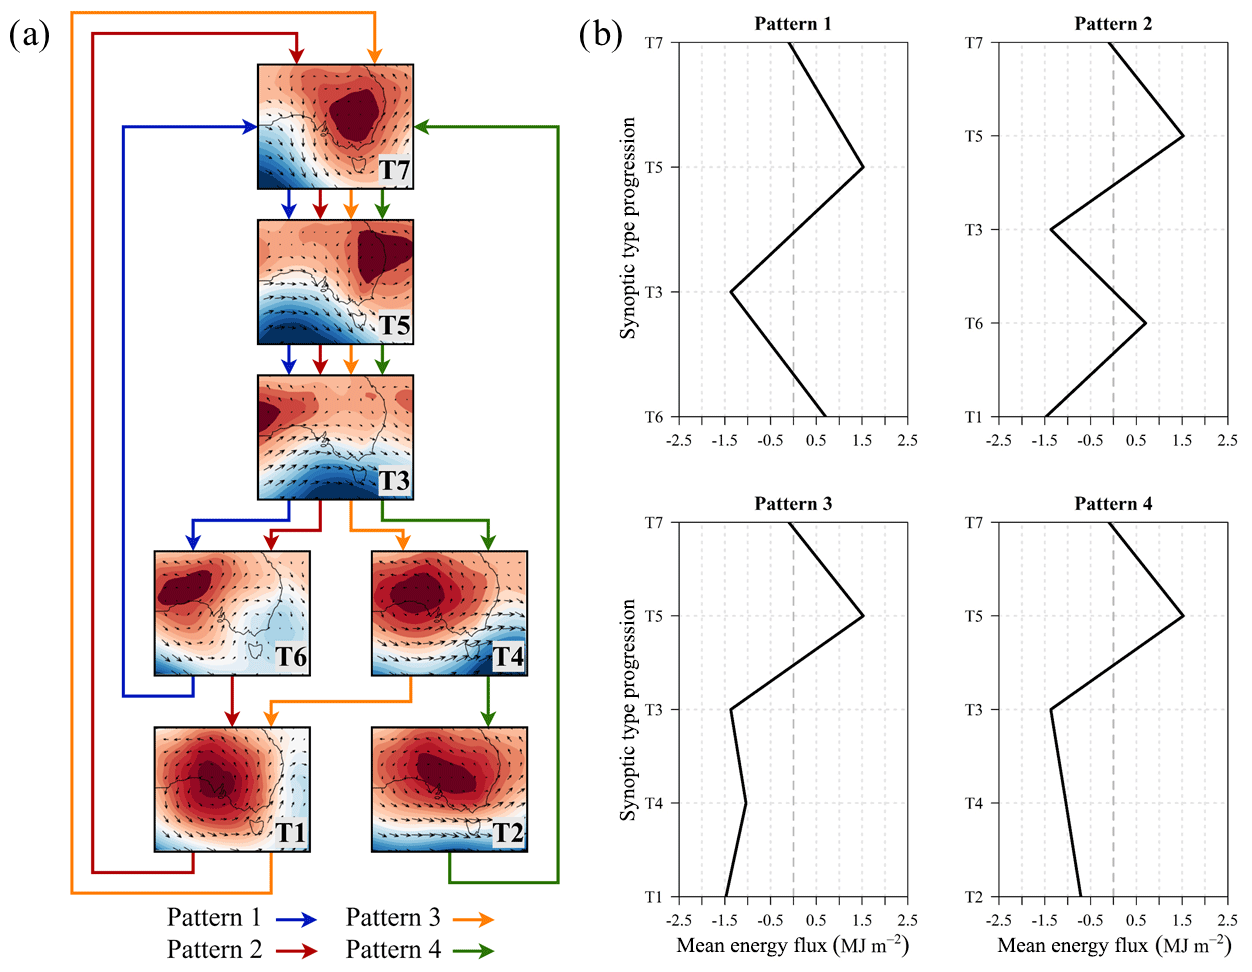
Figure 4Flowchart of four primary synoptic type patterns/progressions based on probability of transition for the 2016 and 2017 seasons (a) and calculated synoptic pattern snowpack fluxes based on median daily values and mean duration of synoptic type (b).
3.1.4 Frequency and duration
The frequency of each synoptic type during the 2016 and 2017 snowpack seasons is shown in Table 2. T3 and T7 occurred most frequently with 26.99 % (44 d) and 19.02 % (31 d), respectively. The higher number of days in T3 and T7 is reflected in the mean type duration that shows these types with the longest duration. This is likely due to these synoptic types occurring in a slower progressing synoptic pattern over multiple days as seen in the mean type duration data (Table 2).
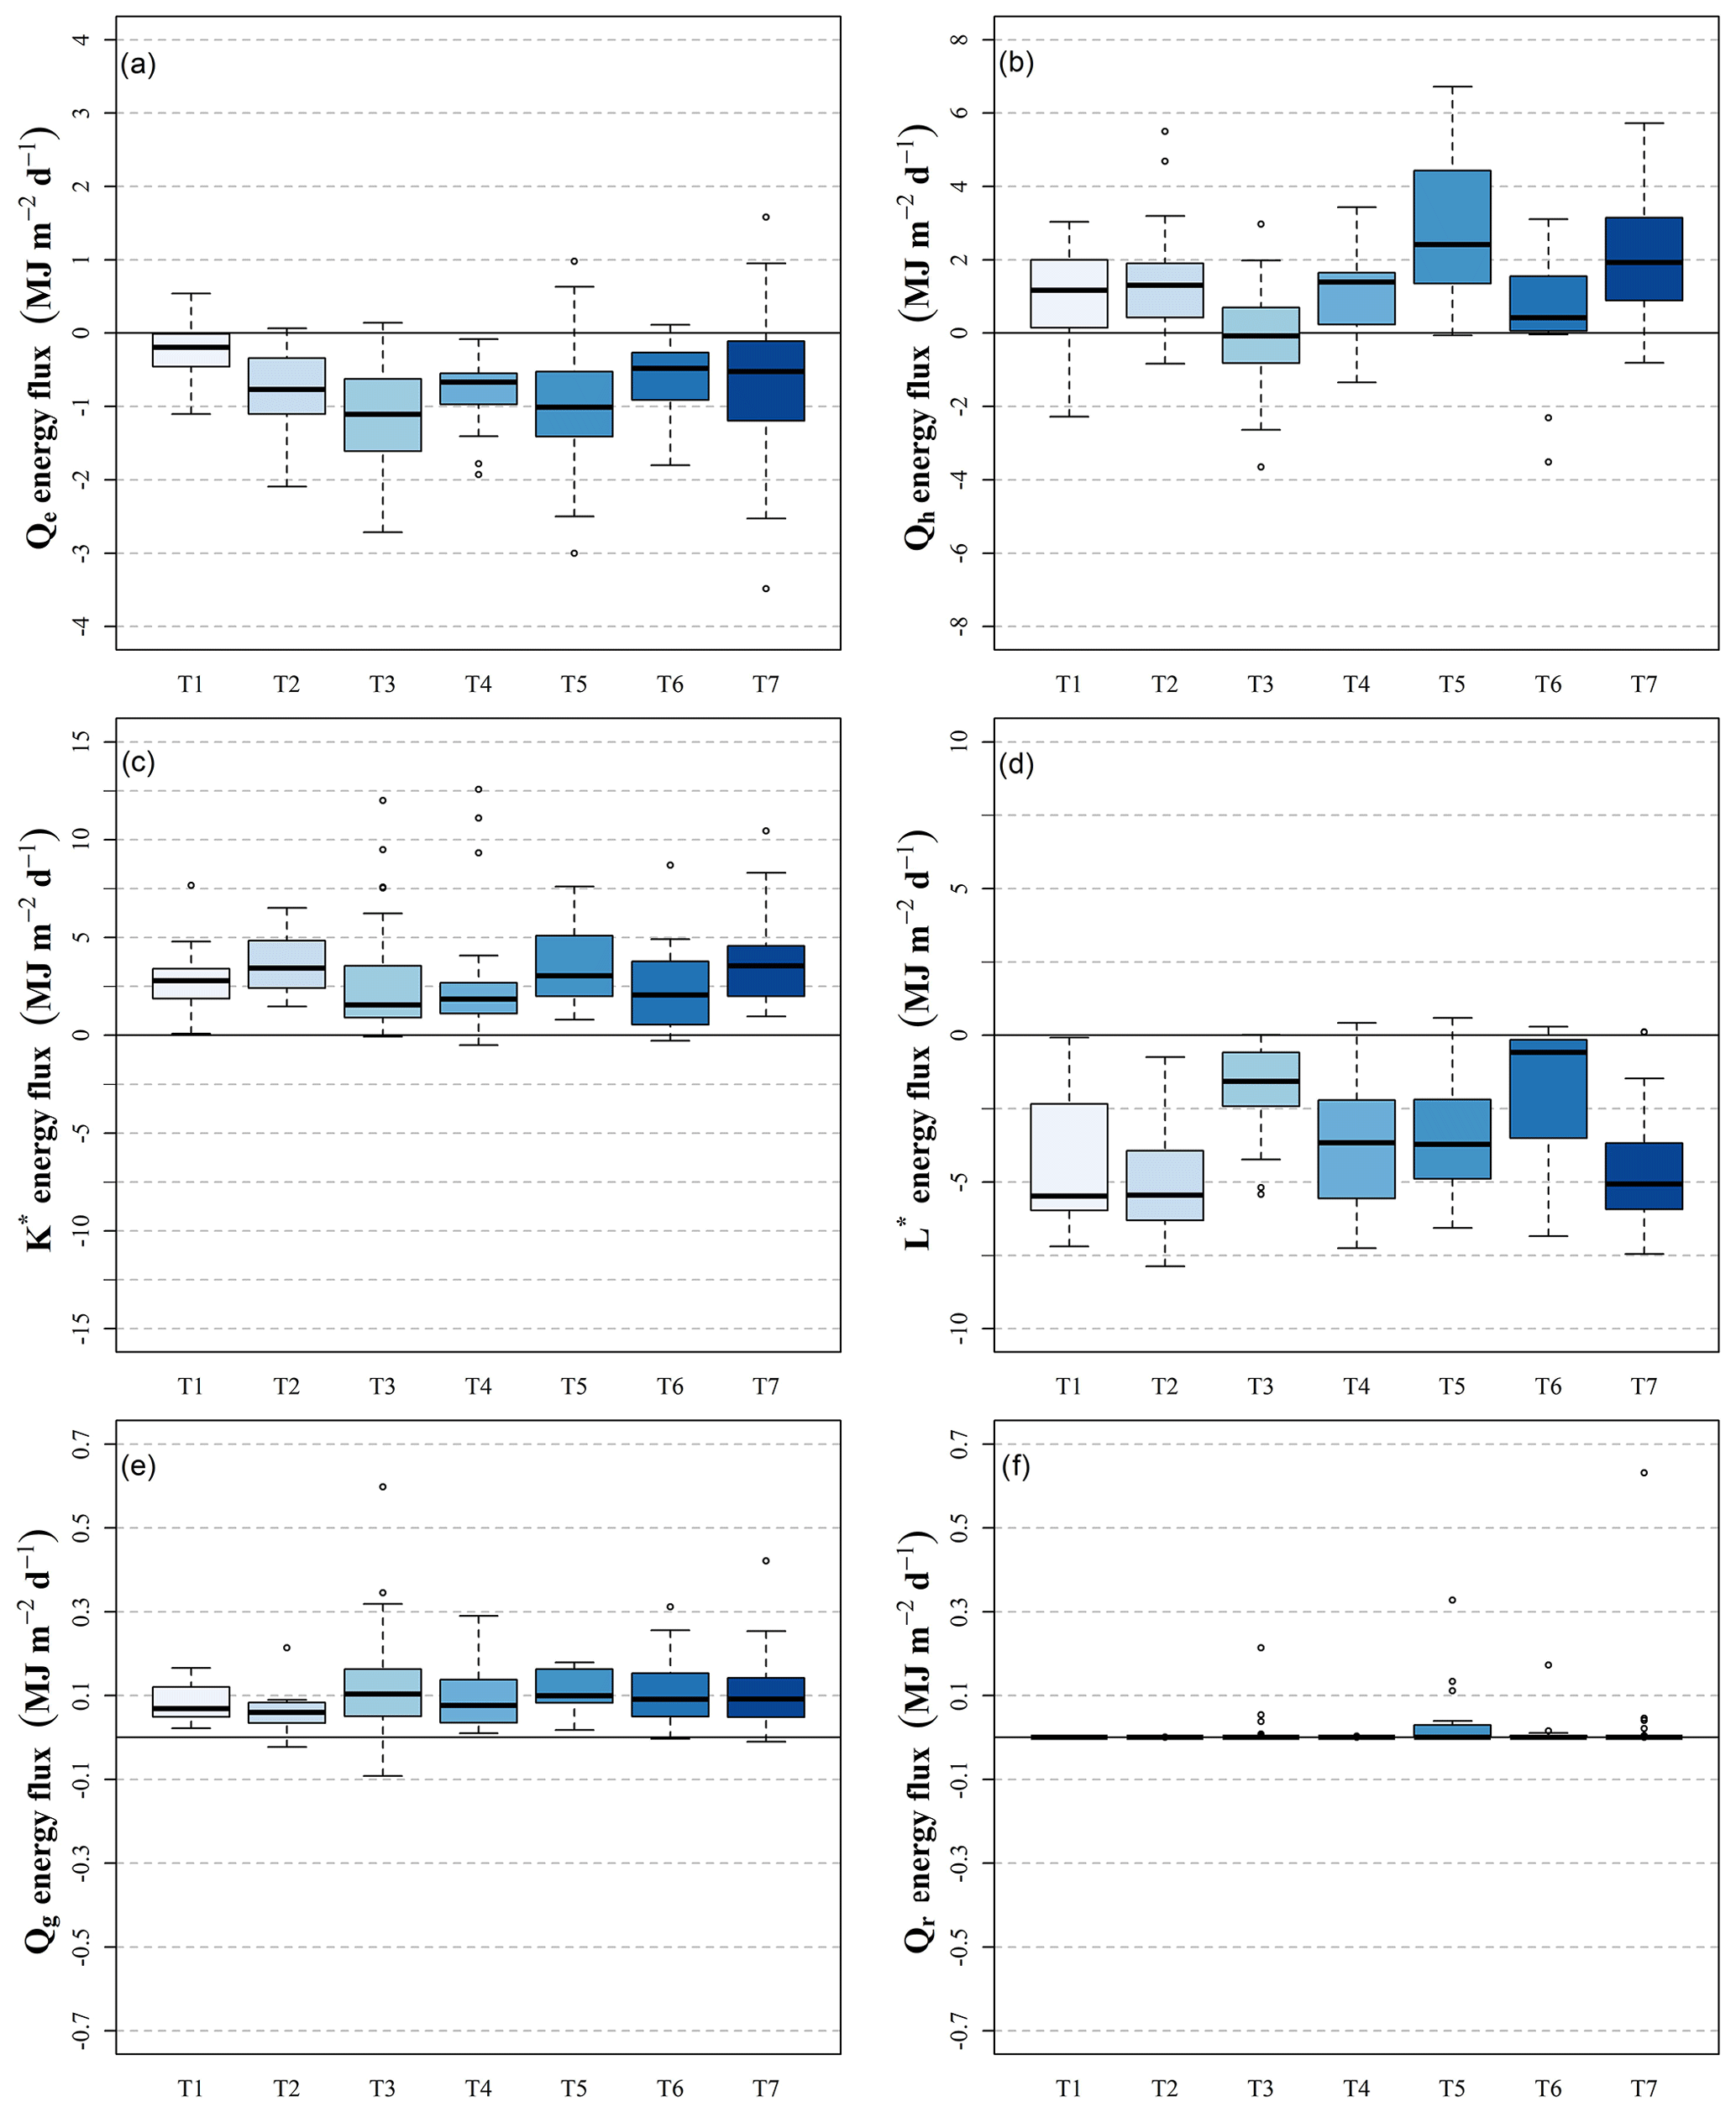
Figure 5Box plots of daily snowpack latent heat (a), sensible heat (b), net shortwave radiation (c), net longwave radiation (d), ground heat flux (e), and liquid precipitation (f) energy fluxes for each synoptic type during the 2016 and 2017 seasons.
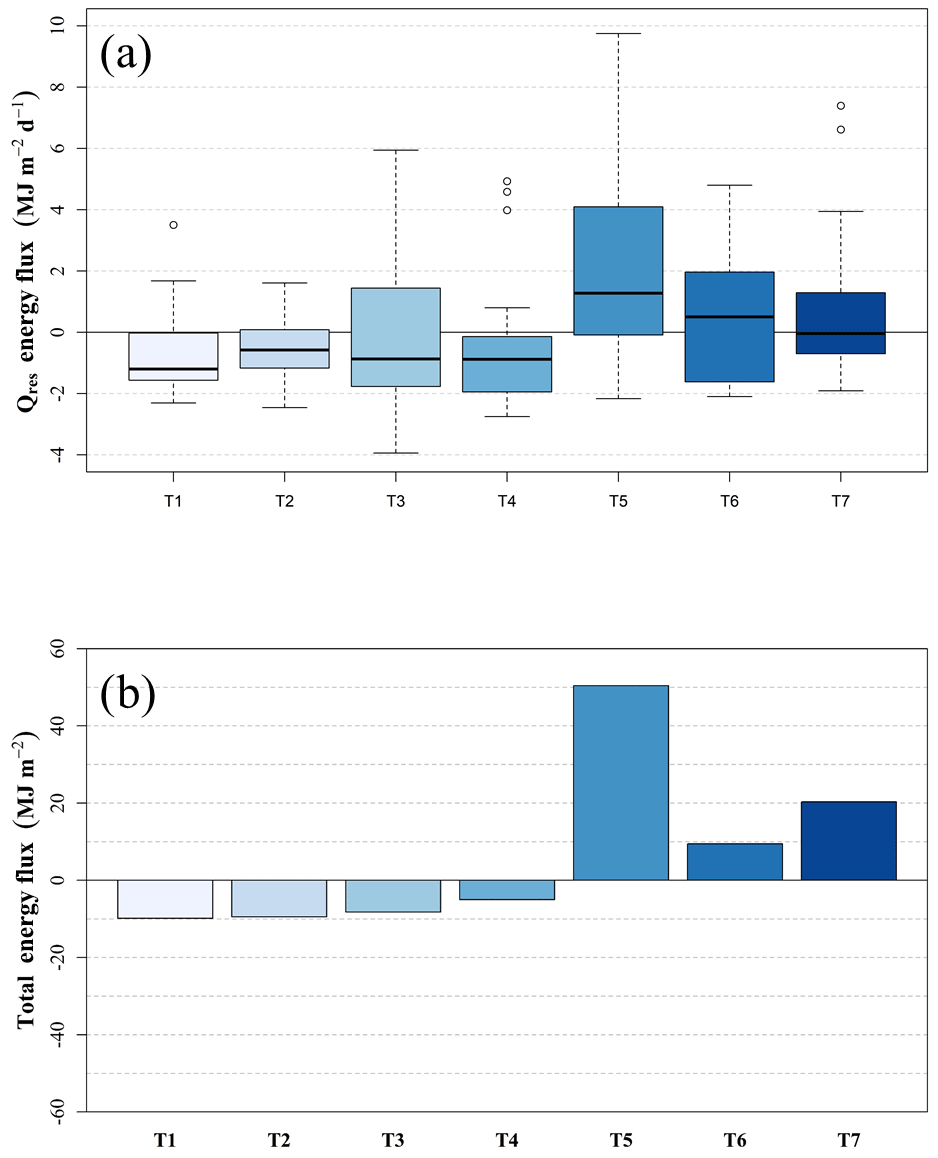
Figure 6Box plot of daily residual snowpack energy fluxes (a) and bar chart of total summed energy flux (b) by synoptic type for the 2016 and 2017 seasons.
Identification of common synoptic circulations, which are comprised of a progression of several synoptic types, and their impact on surface energy balance can aid in the understanding and forecasting of snowpack ablation based on synoptic conditions. In order to identify common synoptic circulations, analysis on common transitions between synoptic types was conducted. Transition probabilities for the 2016 and 2017 seasons were developed similar to those used by Kidson (2000) that detail the likelihood of a synoptic type occurring on the following day given an initial type. The highest transition probabilities were identified for each type, and a flowchart was developed based on the most likely synoptic type progressions (Fig. 4a). If the highest transition probabilities were within < 0.05 of each other, two paths were plotted. The flowchart shows what would be expected for a basic synoptic-scale circulation at midlatitudes: a trough propagating eastward into the Snowy Mountains region in T7, T5, and T3, either continued eastward movement of the surface trough (T4) or the development of a weak cutoff low (T6) and then transitioning to dominant high pressure over the region again (T2, T1, or T7).
3.2 Energy flux characteristics of synoptic types
It is important to consider the effects of synoptic type frequency when determining primary sources of energy fluxes over long periods, as synoptic types that contribute the most to snowpack ablation may simply have a higher rate of occurrence and lower daily energy flux values than other types. In order to obtain a more detailed understanding of each type's energy flux, median daily energy flux calculated for each type was determined to be a better method of comparison. Therefore, both median daily and total snowpack fluxes over the two seasons (Figs. 5 and 6) are presented in megajoules per square meter to show synoptic type energy flux contributions made at short and longer temporal scales. While initial measurements were made in watts per square meter, the use of megajoules per square meter in this paper allows for easier comparison to other energy balance works conducted on this region (Bilish et al., 2018) as well as research on synoptic weather and energy fluxes in other locations (Burles and Boon, 2011; Ellis et al., 2011; Granger and Gray, 1990; Hay and Fitzharris, 1988; McGregor and Gellatly, 1996; Neale and Fitzharris, 1997; Welch et al., 2016).
3.2.1 Latent and sensible heat flux
Daily Qe was negative for each of the seven synoptic types (Fig. 5a), and the magnitude of the values was shown to correspond to the mean 850 hPa RH values for each type, reflecting the site elevation of 1828 m a.s.l. Two of the three types with the lowest RH values (T2 and T5) showed the greatest negative Qe values, and those with the higher RH values (T1 and T6) showed the least amount of Qe, which is consistent with conditions needed for evaporation from the snowpack. T5 had the second largest negative Qe values of any type with a median value of −1.00 MJ m−2 d−1, which corresponds to its low 850 hPa RH values, the highest observed surface mean daily ambient temperature of 3.5 ∘C, and the second lowest observed surface mean RH value of 65 % with only T2 being lower (60 %). T3 showed the largest release of Qe from the snowpack with a median value of −1.11 MJ m−2 d−1.
Overall, negative Qe was offset by positive Qh for most synoptic types with the exception of T3 that had mean surface temperatures below zero (−0.83 ∘C) and a measured surface RH value below 90 % resulting in more Qe loss than Qh gain by the snowpack. Similar to trends seen in Qe, the highest daily median Qh values (Fig. 5b) were associated with synoptic types with the highest temperatures at 850 hPa (T5, T7, and T2), which coincided with observed temperatures from the energy flux tower (3.48, 1.46, and 1.89 ∘C). T5 showed the highest daily Qh values as a result of having the highest temperatures and also showed the second lowest Qe value that is associated with having the lowest RH of any type (60 %). Ultimately, when both turbulent terms are considered, T5 had the highest amount of energy flux into the snowpack (1.49 MJ m−2 d−1) followed by T7 (1.40 MJ m−2 d−1) and T1 (1.00 MJ m−2 d−1).
3.2.2 Radiation flux
The largest contribution of radiative energy to the snowpack from all synoptic types was K∗, which accounted for 53 %–97 % of total positive flux (Fig. 5c). By comparison, L∗ accounted for 61 %–95 % of negative energy flux from the snowpack (Fig. 5d), with the highest amounts of loss belonging to the types with the lowest percentage of cloud cover (T1, T2, and T7). Total radiation flux varied largely by synoptic type and was found to be positive in types T3 and T6 and negative for the rest of the types. The two types with positive net radiation had the highest incoming longwave radiation flux values mostly balancing outgoing longwave values. This meant that incoming shortwave radiation was able to dominate Q* for these types, which resulted in the positive values. The largest loss in Q* was exhibited by T1, which was 31 % higher than the next closest type (T4). The types with net radiation loss (T1, T2, T4, T5, and T7) had values that ranged from −0.67 MJ m−2 d−1 (T5) to −2.78 MJ m−2 d−1 (T1). However, T4 had dissimilar cloud and RH characteristics to T2 and T7, which had the two lowest cloud cover percentages and two of the lowest RH values. T4 had 100 % cloud cover and had an associated reduction in incoming shortwave radiation that allowed the outgoing longwave radiation term to become more dominant than in T2 or T7 and, therefore, gave it the highest Q* loss of the three.
3.2.3 Ground and precipitation heat flux
Energy fluxes from ground and Qr (Fig. 5e and f) were the smallest of any term for all synoptic types, with Qg and Qr accounting for less than 1 % of median daily energy fluxes for all synoptic types. Ground heat flux characteristics were similar between all synoptic types and varied little. While Qr was small when examined as a daily median value, it does show a high degree of variation primarily associated with T5 and T3. This is due to several large rain events that occurred during 2016 (18 July, 21 and 22 July, and 31 August) and one during 2017 (15 August). Despite relatively low energy flux contributions by rainfall, it is interesting to note that the 10 d with the highest rainfall fluxes (> 0.05 MJ m−2 d−1) consisted of 4 T5 days, 3 T3 days, 2 T7 days, and 1 T6 day, showing a significant clustering of high-precipitation days in types T5 and T3.
3.2.4 Total daily net energy flux
Overall, two synoptic types (T5 and T6) had positive median daily net energy flux to the snowpack (Fig. 6a). Of these, T5 had the largest energy flux that was related to its relatively high temperatures that contributed to the highest Qh value of any synoptic type and increased solar radiation from less cloud cover. Contrary to the reduction in cloud cover that aided T5 in having the highest total energy flux contributions, T6 had the highest cloud cover and yet had the second highest energy flux to the snowpack that was primarily due to increased incoming longwave radiation. T7 was close to having neutral energy fluxes with a median value of only −0.04 MJ m−2 d−1 as a result of the relatively low percentage of cloud cover resulting in strongly negative L∗ as well as the second highest Qh term of any type.
T1 and T4 showed the greatest negative median daily net energy flux of all synoptic types (Fig. 6a), which could be attributed to their negative L∗ and to having low K∗ terms. T3 has a similar net energy flux to T4 but is negative primarily due to having the only negative Qh of any type. T2 also had a net negative median daily energy flux but to a lesser extent than T1, T3, or T4. Relative humidity values lower than any other type were the primary driver behind T2's negative net value as it resulted in the highest longwave radiation loss from the snowpack through having the lowest cloud cover, as well as Qe loss.
The synoptic type T5 contributed the most energy to the snowpack during the two seasons (Fig. 6b) due to a moderate number of occurrences (22), an interquartile range (IQR) that was higher than the other synoptic types, higher maximum values, and having the largest positive fluxes from high Qh values. Much of the energy flux of T5 was associated with strong WAA ahead of the passage of cold fronts. While T6 was the only other type to have positive median daily energy flux contributions to snowpack energy flux, T7 contributed a higher amount of energy flux during the two winter periods. This occurred because it had the second highest number of occurrences, and the distribution of occurrences around the median shows that events were either near-neutral or positive in their energy fluxes. T6 was the only other type to have a positive energy flux contribution to the snowpack over the two seasons, and it was smaller than that of T5 or T7. Similar magnitude was seen in the negative flux contributions of T1, T2, and T4, with T2 having the most significant negative flux. T1 and T4 also showed negative fluxes, but T3 showed a nearly neutral contribution to snowpack energy flux over the two winter seasons. As T3 is associated with a surface trough, it is possible that pre-frontal and post-frontal characteristics are both incorporated in the energy balance of T3 and act to cancel each other out when averaged over a longer period.
All synoptic types had variation in median daily net energy that can be attributed to the classification conducted by the k-means clustering technique. Each type consisted of classified days that had similar synoptic characteristics, but differences in system strength and position affected energy fluxes for individual days. Therefore, it is important to remember that each synoptic type is associated with a range of daily energy flux values in addition to the median daily energy flux for each type.
3.2.5 Energy balance closure
Daily site energy balance closure was determined by calculating snow water equivalent (SWE) from automated snow depth measurements and median snowpack density and comparing the energy flux required for measured decreases in SWE to the Qres value for the same period. Closure was calculated for days where 50 % or more daytime periods had snowmelt and outliers were removed. A drawback of this method is that it does not distinguish between types of ablation (melt, evaporation/sublimation, wind scour), and any removal of snow through a process other than melt will result in higher error in calculation of closure. Evaporation and sublimation are already included in the calculation of energy balance closure as they are represented by measured latent heat flux. Therefore, the only process that needs to be acknowledged as a potential source of snow removal in addition to melt when interpreting the results of the closure calculations is wind scour.
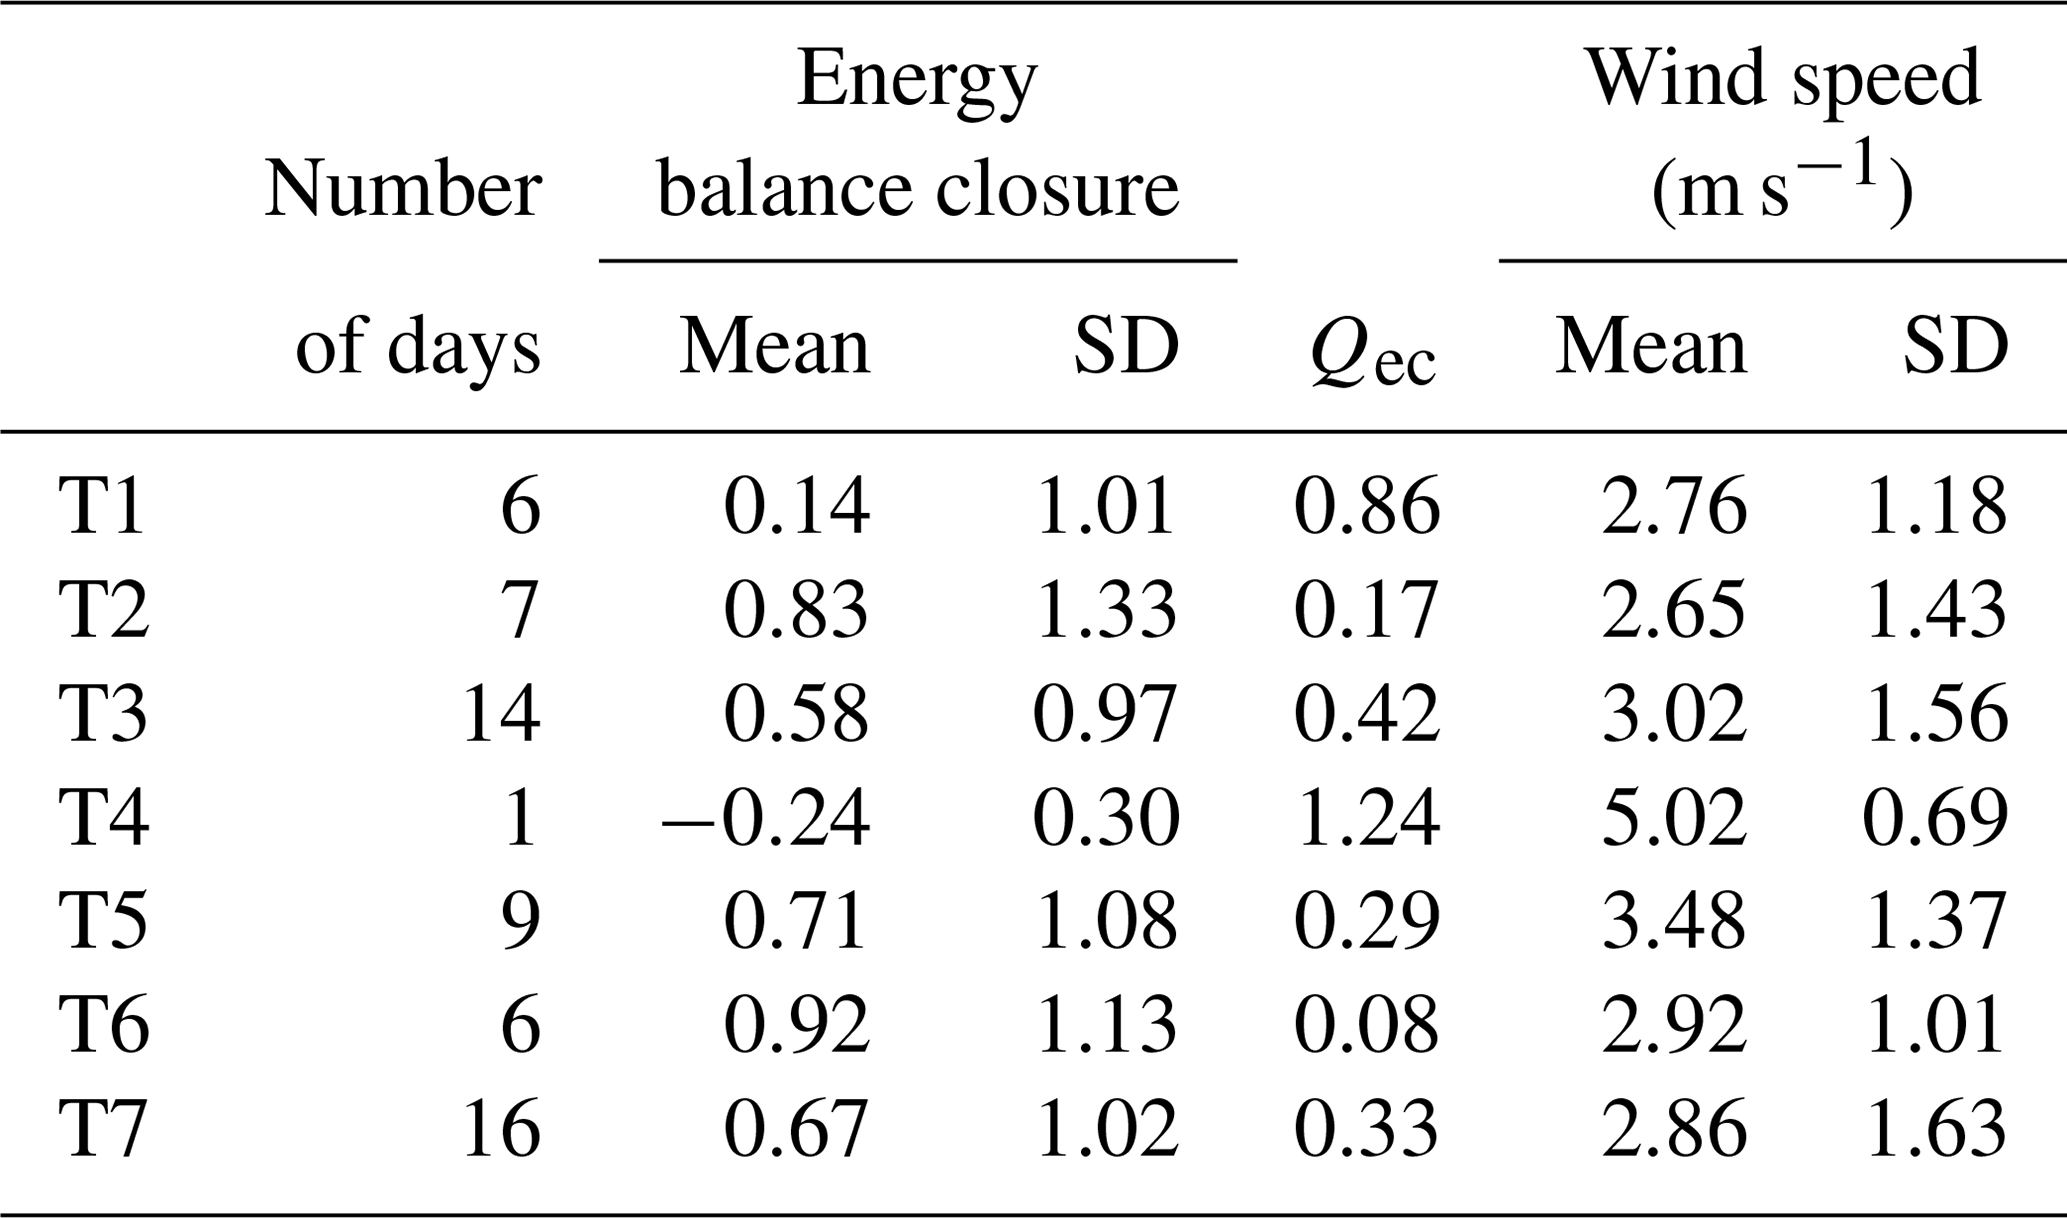
Mean energy balance closure for all periods and synoptic types was 0.62±0.72, and, as Qec is a measure of error in energy balance closure, it represented approximately 38 % of total fluxes during the study. T4 had the only negative closure () (Table 3) that was likely the result of strong winds scouring fresh snow from T3; however, only 1 d of analysis existed for T4 and the results may not be applicable to the broader number of days. T6 had the highest closure of any type (0.92±1.13) but also showed one of the largest variations in closure with only T2 (0.83±1.33) having a larger standard deviation. Overall, mean values of wind speed and energy balance closure of each synoptic type showed significant correlation (, R2=0.54), suggesting that wind scour of the snowpack did have an impact on the calculation of energy balance closure.
4.1 Properties of synoptic type energy balance
Net shortwave radiation flux contributed the largest amount of energy to the snowpack for all synoptic types ranging from 53 % to 97 % of median daily energy flux, with T5 being the only synoptic type below 60 % contribution (53 %) of K∗ to the snowpack. These results agree with those of Fayad et al. (2017), who noted that radiative fluxes are the dominant source of snowpack melt energy in mountain ranges with Mediterranean climates. Net Qh contributed the second highest percentage of median daily energy flux to the snowpack accounting for 16 %–44 % of positive fluxes, with the exception of T3 that had a Qh term that accounted for 4 % of its negative fluxes. The largest contributions of Qh to the snowpack are associated with synoptic types T2, T4, T5, and T7 that are characterized by high pressure and northwesterly or westerly winds that are associated with WAA. Hay and Fitzharris (1988) noted that, while radiative terms were responsible for the majority of energy contributions to glacier melt in New Zealand's Southern Alps, turbulent fluxes contributed significant amounts of energy to melt. Similarly, despite Qh not being the dominant energy flux to the snowpack for any synoptic type, it does account for nearly half of the energy flux to the snowpack for T5 (44 %) and over a third for T7 (35 %), and it is still a significant source of energy flux to the snowpack for nearly all synoptic types.
Table 3Statistics on energy balance closure, error in energy balance closure (Qec), and wind speed during energy balance closure analysis periods for each synoptic type.
Median daily energy loss from the snowpack was from Qe and Q*, which dominated T1, T2, and T4, resulting in negative median daily energy fluxes from the snowpack. Net longwave radiation was the most influential term in the emission of energy from the snowpack, accounting for 61 %–95 % of energy loss, with net Qe flux accounting for 5 %–39 % of outgoing energy flux. Though the methodology of this paper distinguishes between shortwave and longwave fluxes in order to better examine the effects of synoptic-scale features such as RH or cloud cover on radiative transfers similar to that of more recent works such as Cullen and Conway (2015), many historical works have not made the same distinction in terms (Hay and Fitzharris, 1988; Moore and Owens, 1984; Neale and Fitzharris, 1997; Stoy et al., 2018). It should be noted that had Q∗ been used for comparison, the results of this paper would agree with several studies (Bednorz, 2008b; Moore and Owens, 1984; Sade et al., 2014) that found that turbulent fluxes were the dominant fluxes when examining the energy flux characteristics on snowpacks in climates similar to that of the Snowy Mountains in the Australian Alps.
Median daily Qg values were found to account for only a small fraction of total energy flux to the snowpack consisting of 1 %–5 % of daily positive energy fluxes. Similarly, energy flux to the snowpack from Qr has been shown to only contribute < 1 % of total seasonal energy flux for five of the seven synoptic types, which agrees with the findings of other studies (Bilish et al., 2018; Mazurkiewicz et al., 2008). However, precipitation was responsible for > 1 % of the daily median energy flux of the two synoptic types primarily associated with rain-on-snow events, T5 and T3. Although fluxes imparted on the snowpack from rainfall are relatively small when compared to all positive fluxes, the accompanying energy flux characteristics of T5 associated with rain-on-snow events are responsible for two of the three largest contributions of overall snowpack energy fluxes.
The results show a significant agreement with previous research conducted in this region by Bilish et al. (2018) when methods from that work are used to calculate relative contributions of positive energy fluxes to the snowpack. Overall, incoming longwave radiation was shown to be the highest positive flux to the snowpack, accounting for 75 %–86 % of incoming energy flux. Shortwave radiation was responsible for an additional 8 %–14 % of incoming energy flux, with Qh accounting for 0 %–9 % of incoming fluxes, Qe generating 0 %–4 %, Qg attributing 0.3 %, and Qr accounting for 0.1 %. Despite methodological differences that can be attributed to the need to highlight different processes within atmosphere–snowpack interaction, results from both papers show similar overall energy fluxes.
Energy balance closure at the site was similar to other research into snowpack energy balance (Welch et al., 2016), and total error in closure was 38 % during the entirety of the study. Though the method used to calculate energy balance closure offered a good approximation, wind scour is a significant source of error with this method. Therefore, energy balance closure methods that incorporate internal measurements of snowpack energy are preferable when possible.
4.2 Synoptic patterns and energy flux
Snowpack energy flux characteristics recorded at the Pipers Creek catchment headwaters have been related to synoptic weather types that occurred during the 2016 and 2017 snow seasons. The resulting analysis reveals a maximum in positive energy flux as pre-frontal troughs approach the Snowy Mountains, followed by cold front conditions during the T7 → T5 → T3 common progression pattern identified here. Several factors cause high positive energy flux during these periods that include an increase in temperatures due to WAA and the associated increase in positive Qh, decrease in negative L∗ due to an increase in cloud cover, a decrease in Qe following frontal passage and associated increase in RH, and progressively increasing Qr as the trough approaches and immediately after passage.
Synoptic types characterized by surface high pressure as their primary influence (T1, T2, T4, and T7) had four of the five negative daily contributions to snowpack energy flux. In T1 and T7, net shortwave radiation terms (K∗) were positive and varied by ∼ 4 %–10 % for these types; however, low RH and cloud cover allowed for highly negative L∗ terms that were not compensated for by change in K∗. In contrast, T4 had higher cloud cover and increased RH that were due to advection of moisture from the Tasman Sea. The higher RH in T4 and low mean air temperature (−2.06 ∘C) resulted in Qe and Qh terms of similar magnitudes, but opposite signs that nearly canceled out. This resulted in a L∗ term that was of lesser magnitude than those of T1, T2, and T7 but still the dominant term in its energy exchange.
Four primary synoptic circulation patterns were identified during the study period. Each of the four patterns and their associated energy flux values calculated from median daily flux and mean type duration can be seen in Fig. 4a and b. While each pattern differs towards the end of the cycle, each one has the T7 → T5 → T3 progression in common. Unsurprisingly, the highest contribution of median energy flux to the snowpack (0.75 MJ m−2) is from Pattern 1, which has only two synoptic types with negative flux (T3 and T7), whereas the others all contain three or four negative flux types. Pattern 3 had the largest negative snowpack energy flux (−2.44 MJ m−2) due to it containing types with the highest net energy loss (T1 and T4).
Changing synoptic regimes in the Snowy Mountains suggest an increase in anticyclonic conditions (Hendon et al., 2007; Pepler et al., 2019), such as types T1, T2, T4, and T7, as a result of poleward shift in the subtropical ridge (Cai et al., 2005). Under these conditions, snowpack energy exchange in the Australian Alps would be expected to decrease as synoptic types related to anticyclonic conditions have negative energy fluxes to the snowpack. While these results may seem counterintuitive regarding a generally warming climate, they agree with the findings of Theobald et al. (2016), who showed reductions in cool-season precipitation amounts and frequency due, in part, to reductions in the occurrence of dominant cold front systems. The reduction in cold-frontal systems in the Australian Alps region is associated with declines in the pre-frontal WAA that has been shown to be the primary driver of positive snowpack energy flux. However, potential reductions in energy fluxes to the snowpack will not likely lead to increases in snowpack duration or depth, as reductions in precipitation are associated with the shifts to anticyclonic synoptic patterns (Theobald et al., 2015, 2016).
The synoptic effects on snowpack energy balance identified in this paper represent those experienced within the Pipers Creek catchment headwaters and are an important first step towards a more comprehensive understanding of synoptic influences on the energy balance of the Snowy Mountains snowpack. As synoptic-scale effects on the wider region likely differ from those described here, caution should be exercised before upscaling the Pipers Creek catchment headwaters measurements to the broader Snowy Mountains region. Pomeroy et al. (2003) noted that differing slope and aspect of three proximal energy balance sites showed significant control on whether daily net radiation was positive or negative and that daily incoming solar radiation varied by as much as 26 % as a result. Similar effects of complex terrain on turbulent fluxes exist, as terrain-induced flows will contribute to measurements of turbulent fluxes in addition to measured effects of synoptic patterns. Therefore, consideration of an area's slope, aspect, and surrounding terrain is crucial to understanding synoptic-scale effects on its energy balance.
4.3 Distribution of gap-filled eddy covariance fluxes
One of the disadvantages of the random forest regression method to gap-fill missing EC data is that exact results are not reproducible due to the method's random handling and sub-setting of predictor variables. Methods of developing models and predicting values were evaluated over 20 iterations to determine the amount of variability in RMSE when generating a random forest from the same dataset. Some variability in RMSE was noted between tests for Qe and Qh but was small with a standard deviation of 0.01 W m−2 in Qe and 0.03 W m−2 in Qh. Small differences in RMSEs between model development runs and data filling indicate that RMSE values for gap-filled data are 2.56±0.01 W m −2 for Qe and 4.67±0.03 W m−2 for Qh.
Gap-filling of Qh and Qe can introduce uncertainty into measurements that may affect the ability to thoroughly compare datasets such as those pertaining to the different synoptic types compared within this work. As such, it is important to note that not all synoptic types had equal amounts of gap-filling for their Qe and Qh fluxes. Distribution of gap-filled data within synoptic types depended largely on the quantity of precipitation associated with each type. The most significant concentrations of gap-filled data were in T3 (Qe: 74 %, Qh: 55 %), T5 (Qe: 57 %, Qh: 39 %), and T6 (Qe: 81 %, Qh: 73 %). Differences in the quantity of gap-filled data between synoptic types can create uncertainty when making comparisons between fluxes in each. However, uncertainty introduced through gap-filling procedures is relatively low and should have a minimal impact during comparison of fluxes.
Overall, periods of pre-cold-frontal passage contribute the most energy fluxes to snowpack melt due to WAA ahead of the front, a reduction in cloud cover allowing for higher incoming shortwave radiation, and the gradual development of precipitation that often contributes to rain-on-snow events. While this work was conducted solely on the Australian snowpack, snowpacks in other regions such as New Zealand (Hay and Fitzharris, 1988; Neale and Fitzharris, 1997), Canada (Romolo et al., 2006a, b), the Spanish Pyrenees (Lopez-Moreno and Vicente-Serrano, 2007), and the Arctic (Drobot and Anderson, 2001) see similar synoptic-scale effects on snowpack energy to those presented here. Snowpack energy fluxes in the Australian Alps would likely decrease under climate change progression as a result of reductions to primary cold-frontal systems and associated pre-frontal WAA. However, as this study developed relationships between synoptic patterns and snowpack energy fluxes based on single-site measurements in the Pipers Creek catchment headwaters, their applicability may be limited, and caution should be exercised before applying them to the broader region.
The understanding of synoptic-scale processes on snowpack energy balances will likely become applicable to broader regions as climate change continues and snowpacks develop warmer properties (Adam et al., 2009; Cai et al., 2005; Catto et al., 2014; Chubb et al., 2011; Pepler et al., 2019; Stewart, 2009; Theobald et al., 2016). An increased burden on freshwater systems for agriculture, drinking water, and energy production will continue as these changes occur (Parry et al., 2007). Therefore, continued work on marginal snowpack ablation processes, such as those within the forested regions of Australia's Snowy Mountains, will be important to resource management and should be explored.
Energy flux data used in this study are available at https://doi.org/10.14264/uql.2019.691 (McGowan et al., 2019). ERA-Interim reanalysis data are freely available from the European Centre for Medium-Range Weather Forecasts (https://www.ecmwf.int/en/forecasts/datasets/reanalysis-datasets/era-interim, last access: 6 December 2018, Dee et al., 2011). Precipitation data used in this study were supplied by Snowy Hydro Limited via restricted access; these data can be obtained by contacting Snowy Hydro Ltd.
AS, HM, AT, and NC designed the experiments and AS conducted them. AT developed the k-means clustering and synoptic typing code. AS developed the code related to energy balance and eddy covariance measurements. AS wrote the manuscript with input from all authors.
The authors declare that they have no conflict of interest.
The authors would like to thank Shane Bilish for establishment of the Pipers Creek snowpack research catchment, Michael Gray for installation and maintenance of the energy balance tower, and the Weather and Water team at Snowy Hydro Limited for their contributions of data and field support during the data collection and analysis process.
This research has been supported by Snowy Hydro Limited. Andrew Schwartz was supported by the University of Queensland's School of Earth and Environmental Sciences and an Australian Government Research Training Program (RTP) Scholarship.
This paper was edited by Mark Flanner and reviewed by two anonymous referees.
Adam, J. C., Hamlet, A. F., and Lettenmaier, D. P.: Implications of global climate change for snowmelt hydrology in the twenty-first century, Hydrol. Process., 23, 962–972, 2009.
Ahrens, C. D.: Meteorology today: an introduction to weather, climate, and the environment, Cengage Learning, 2012.
Allan, R. P., Shine, K. P., Slingo, A., and Pamment, J.: The dependence of clear-sky outgoing long-wave radiation on surface temperature and relative humidity, Q. J. Roy. Meteorol. Soc., 125, 2103–2126, 1999.
Australian Bureau of Statistics: Water Use on Australian Farms, 2018–19, available at: https://www.abs.gov.au/ausstats/abs@.nsf/mf/4618.0, access: 4 June 2020.
Bednorz, E.: Synoptic conditions of snow occurrence in Budapest, Meteorol. Z., 17, 39–45, https://doi.org/10.1127/0941-2948/2008/0262, 2008a.
Bednorz, E.: Synoptic reasons for heavy snowfalls in the Polish–German lowlands, Weather and Climate Extremes, 92, 133–140, 2008b.
Bednorz, E.: Synoptic conditions of the occurrence of snow cover in central European lowlands, Int. J. Climatol., 31, 1108–1118, 2011.
Beniston, M.: Climatic Change in Mountain Regions: A Review of Possible Impacts, Clim. Change, 59, 5–31, https://doi.org/10.1023/a:1024458411589, 2003.
Bilish, S. P., McGowan, H. A., and Callow, J. N.: Energy balance and snowmelt drivers of a marginal subalpine snowpack, Hydrol. Process., 32, 3837–3851, 2018.
Bilish, S. P., Callow, J. N., McGrath, G. S., and McGowan, H. A.: Spatial controls on the distribution and dynamics of a marginal snowpack in the Australian Alps, Hydrol. Process., 33, 1739–1755, https://doi.org/10.1002/hyp.13435, 2019.
BOM: Analysis Chart Archive, Bureau of Meteorology, available at: http://www.bom.gov.au/australia/charts/archive/, last access: 15 September 2018a.
BOM: Climate Statistics for Australian Locations, Bureau of Meteorology, available at: http://www.bom.gov.au/climate/data/, last access: 13 December 2018b.
Bormann, K. J., Westra, S., Evans, J. P., and McCabe, M. F.: Spatial and temporal variability in seasonal snow density, J. Hydrol., 484, 63–73, 2013.
Breiman, L.: Random Forests, Machine Learn., 45, 5–32, https://doi.org/10.1023/a:1010933404324, 2001.
Budin, G.: Interannual variability of Australian snowfall, Aust. Met. Mag, 33, 145–159, 1985.
Burles, K. and Boon, S.: Snowmelt energy balance in a burned forest plot, Crowsnest Pass, Alberta, Canada, Hydrol. Process., 25, 3012–3029, https://doi.org/10.1002/hyp.8067, 2011.
Cai, W., Shi, G., Cowan, T., Bi, D., and Ribbe, J.: The response of the Southern Annular Mode, the East Australian Current, and the southern mid-latitude ocean circulation to global warming, 32, L23706, https://doi.org/10.1029/2005GL024701, 2005.
Callow, N., McGowan, H., Warren, L., and Speirs, J.: Drivers of precipitation stable oxygen isotope variability in an alpine setting, Snowy Mountains, Australia, J. Geophys. Res.-Atmos., 119, 3016–3031, https://doi.org/10.1002/2013JD020710, 2014.
Campbell Scientific: EC150 CO2/H2O Open-Path Gas Analyzer, available at: https://www.campbellsci.com/manuals, last access: 24 October 2018.
Catto, J. L., Nicholls, N., Jakob, C., and Shelton, K. L.: Atmospheric fronts in current and future climates, Geophys. Res. Lett., 41, 7642–7650, https://doi.org/10.1002/2014gl061943, 2014.
Chubb, T. H., Siems, S. T., and Manton, M. J.: On the Decline of Wintertime Precipitation in the Snowy Mountains of Southeastern Australia, J. Hydrometeorol., 12, 1483–1497, https://doi.org/10.1175/Jhm-D-10-05021.1, 2011.
Costin, A. B. and Gay, D.: Studies in Catchment Hydrology in the Australian Alps, MPKV, Maharastra, 1961.
Cullen, N. J. and Conway, J. P.: A 22 month record of surface meteorology and energy balance from the ablation zone of Brewster Glacier, New Zealand, J. Glaciol., 61, 931–946, 2015.
Dee, D. P., Uppala, S. M., Simmons, A. J., Berrisford, P., Poli, P., Kobayashi, S., Andrae, U., Balmaseda, M. A., Balsamo, G., Bauer, P., Bechtold, P., Beljaars, A. C. M., van de Berg, I., Biblot, J., Bormann, N., Delsol, C., Dragani, R., Fuentes, M., Greer, A. J., Haimberger, L., Healy, S. B., Hersbach, H., Holm, E. V., Isaksen, L., Kallberg, P., Kohler, M., Matricardi, M., McNally, A. P., Mong-Sanz, B. M., Morcette, J.-J., Park, B.-K., Peubey, C., de Rosnay, P., Tavolato, C., Thepaut, J. N., and Vitart, F.: The ERA-Interim reanalysis: Configuration and performance of the data assimilation system, Q. J. Roy. Meteorol. Soc., 137, 553–597, https://doi.org/10.1002/qj.828, 2011.
Di Luca, A., Evans, J. P., and Ji, F.: Australian snowpack in the NARCliM ensemble: evaluation, bias correction and future projections, Clim. Dynam., 51, 639–666, https://doi.org/10.1007/s00382-017-3946-9, 2018.
Drobot, S. D. and Anderson, M. R.: Comparison of interannual snowmelt-onset dates with atmospheric conditions, Ann. Glaciol., 33, 79–84, 2001.
Duus, A. L.: Estimation and analysis of snow cover in the Snowy Mountains between 1910 and 1991, Aust. Meteorol. Mag., 40, 195–204, 1992.
Ellis, C. R., Pomeroy, J. W., Essery, R. L. H., and Link, T. E.: Effects of needleleaf forest cover on radiation and snowmelt dynamics in the Canadian Rocky Mountains, Can. J. Forest Res., 41, 608–620, https://doi.org/10.1139/X10-227, 2011.
Falge, E., Baldocchi, D., Olson, R., Anthoni, P., Aubinet, M., Bernhofer, C., Burba, G., Ceulemans, G., Clement, R., Dolman, H., Granier, A., Gross, P., Grunwald, T., Hollinger, D., Jensen, N. O., Katul, G., Keronen, P., Kowalski, A., Lai, C. T., Law, B. E., Meyers, T., Moncrieff, J., Moors, E., Munger, J. W., Pilegaard, K., Rannik, U., Rebmann, C., Suyker, A., Tenhunen, J., Tu, K., Verma, S., Vesala, T., Wilson, K., and Wofsy, S.: Gap filling strategies for long term energy flux data sets, Agr. Forest Meteorol., 107, 71–77, https://doi.org/10.1016/S0168-1923(00)00235-5, 2001a.
Falge, E., Baldocchi, D., Olson, R., Anthoni, P., Aubinet, M., Bernhofer, C., Burba, G., Ceulemans, R., Clement, R., Dolman, H., Granier, A., Gross, P., Grunwald, T., Hollinger, D., Jensen, N. O., Katul, G., Keronen, P., Kowalski, A., Lai, C. T., Law, B. E., Meyers, T., Moncrieff, H., Moors, E., Munger, J. W., Pilegaard, K., Rannik, U., Rebmann, C., Suyker, A., Tenhunen, J., Tu, K., Verma, S., Vesala, T., Wilson, K., and Wofsy, S.: Gap filling strategies for defensible annual sums of net ecosystem exchange, Agr. Forest Meteorol., 107, 43–69, https://doi.org/10.1016/S0168-1923(00)00225-2, 2001b.
Fayad, A., Gascoin, S., Faour, G., López-Moreno, J. I., Drapeau, L., Le Page, M., and Escadafal, R.: Snow hydrology in Mediterranean mountain regions: A review, J. Hydrol., 551, 374–396, 2017.
Fiddes, S. L., Pezza, A. B., and Barras, V.: A new perspective on Australian snow, Atmos. Sci. Lett., 16, 246–252, https://doi.org/10.1002/asl2.549, 2015a.
Fiddes, S. L., Pezza, A. B., and Barras, V.: Synoptic climatology of extreme precipitation in alpine Australia, Int. J. Climatol., 35, 172–188, 2015b.
Gellie, N.: Native vegetation of the Southern Forests, Cunninghamia, 9, 219–254, 2005
Goree, P. A. and Younkin, R. J.: Synoptic Climatology of Heavy Snowfall Over the Central and Eastern United States, Mon. Weather Rev., 94, 663–668, https://doi.org/10.1175/1520-0493(1966)094<0663:Scohso>2.3.Co;2, 1966.
Granger, R. J. and Gray, D. M.: A Net-Radiation Model for Calculating Daily Snowmelt in Open Environments, Nord Hydrol., 21, 217–234, 1990.
Gray, M. A., McGowan, H. A., Lowry, A. L., and Guyot, A.: Surface energy exchanges over contrasting vegetation types on a sub-tropical sand island, Agr. Forest Meteorol., 249, 81–99, https://doi.org/10.1016/j.agrformet.2017.11.018, 2018.
Grundstein, A. J. and Leathers, D. J.: A case study of the synoptic patterns influencing midwinter snowmelt across the northern Great Plains, Hydrol. Process. 12, 2293–2305, https://doi.org/10.1002/(SICI)1099-1085(199812)12:15<2293::AID-HYP797>3.0.CO;2-9, 1998.
Hay, J. E. and Fitzharris, B. B.: The synoptic climatology of ablation on a New Zealand glacier, J. Climatol., 8, 201–215, https://doi.org/10.1002/joc.3370080207, 1988.
Helgason, W. and Pomeroy, J.: Problems Closing the Energy Balance over a Homogeneous Snow Cover during Midwinter, J. Hydrometeorol., 13, 557–572, https://doi.org/10.1175/Jhm-D-11-0135.1, 2012.
Hendon, H. H., Thompson, D. W. J., and Wheeler, M. C.: Australian Rainfall and Surface Temperature Variations Associated with the Southern Hemisphere Annular Mode, 20, 2452–2467, https://doi.org/10.1175/jcli4134.1, 2007.
Hennessy, K. J., Whetton, P. H., Walsh, K., Smith, I. N., Bathols, J. M., Hutchinson, M., and Sharples, J.: Climate change effects on snow conditions in mainland Australia and adaptation at ski resorts through snowmaking, Clim. Res., 35, 255–270, https://doi.org/10.3354/cr00706, 2008.
Kidson, J. W.: An analysis of New Zealand synoptic types and their use in defining weather regimes, Int. J. Climatol., 20, 299–316, 2000.
Liaw, A. and Wiener, M.: Classification and Regression by randomForest, R News, 2, 18–22, 2002.
Lopez-Moreno, J. I. and Vicente-Serrano, S. M.: Atmospheric circulation influence on the interannual variability of snow pack in the Spanish Pyrenees during the second half of the 20th century, Nord Hydrol., 38, 33–44, https://doi.org/10.2166/nh.2007.030, 2007.
Male, D. H. and Granger, R. J.: Snow Surface-Energy Exchange, Water Resour. Res., 17, 609–627, https://doi.org/10.1029/WR017i003p00609, 1981.
Marks, D. and Dozier, J.: Climate and Energy Exchange at the Snow Surface in the Alpine Region of the Sierra-Nevada .2. Snow Cover Energy-Balance, Water Resour. Res., 28, 3043–3054, https://doi.org/10.1029/92wr01483, 1992.
Mauder, M. and Foken, T.: Documentation and instruction manual of the eddy-covariance software package TK3, available at: https://epub.uni-bayreuth.de/id/eprint/342 (last access: 13 August 2020), 2011.
Mazurkiewicz, A. B., Callery, D. G., and McDonnell, J. J.: Assessing the controls of the snow energy balance and water available for runoff in a rain-on-snow environment, J. Hydrol., 354, 1–14, 2008.
McGowan, H., Schwartz, A., and Callow, N.: Synoptic Weather Energy Balance in the Australia's Snowy Mountains, The University of Queensland, Data Collection, https://doi.org/10.14264/uql.2019.691, 2019.
McGregor, G. R. and Gellatly, A. F.: The Energy Balance of a Melting Snowpack in the French Pyrenees During Warm Anticyclonic Conditions, Int. J. Climatol., 16, 479–486, https://doi.org/10.1002/(SICI)1097-0088(199604)16:4<479::AID-JOC17>3.0.CO;2-W, 1996.
McKay, D. C. and Thurtell, G. W.: Measurements of the energy fluxes involved in the energy budget of a snow cover, J. Appl. Meteorol., 17, 339–349, 1978.
Michelson, D. B.: Systematic correction of precipitation gauge observations using analyzed meteorological variables, J. Hydrol., 290, 161–177, 2004.
Moore, R. and Owens, I.: Controls on advective snowmelt in a maritime alpine basin, J. Climate Appl. Meteorol., 23, 135–142, 1984.
Neale, S. M. and Fitzharris, B. B.: Energy balance and synoptic climatology of a melting snowpack in the Southern Alps, New Zealand, Int. J. Climatol., 17, 1595–1609, https://doi.org/10.1002/(SICI)1097-0088(19971130)17:14<1595::AID-JOC213>3.0.CO;2-7, 1997.
Nicholls, N.: Climate variability, climate change and the Australian snow season, Aust. Meteorol. Mag., 54, 177–185, 2005.
Pachauri, R. K., Allen, M. R., Barros, V. R., Broome, J., Cramer, W., Christ, R., Church, J. A., Clarke, L., Dahe, Q., and Dasgupta, P.: Climate change 2014: synthesis report, Contribution of Working Groups I, II and III to the fifth assessment report of the Intergovernmental Panel on Climate Change, IPCC, 2014.
Parry, M., Parry, M. L., Canziani, O., Palutikof, J., Van der Linden, P., and Hanson, C.: Climate change 2007-impacts, adaptation and vulnerability: Working group II contribution to the fourth assessment report of the IPCC, Cambridge University Press, 2007.
Pepler, A., Hope, P., and Dowdy, A.: Long-term changes in southern Australian anticyclones and their impacts, Clim. Dynam., 53, 4715–4715, https://doi.org/10.1007/s00382-019-04931-w, 2019.
Pepler, A. S., Trewin, B., and Ganter, C.: The influences of climate drivers on the Australian snow season, Aust. Meteorol. Ocean, 65, 195–205, https://doi.org/10.22499/2.6502.002, 2015.
Pomeroy, J. W., Toth, B., Granger, R. J., Hedstrom, N. R., and Essery, R. L. H.: Variation in surface energetics during snowmelt in a subarctic mountain catchment, J. Hydrometeorol., 4, 702–719, https://doi.org/10.1175/1525-7541(2003)004<0702:Viseds>2.0.Co;2, 2003.
Pook, M. J., McIntosh, P. C., and Meyers, G. A.: The synoptic decomposition of cool-season rainfall in the southeastern Australian cropping region, J. Appl. Meteorol. Climatol., 45, 1156–1170, 2006.
Pook, M. J., Risbey, J., and McIntosh, P.: East coast lows, atmospheric blocking and rainfall: a Tasmanian perspective, IOP Conf. Ser.: Earth Environ. Sci., 11, 012011, https://doi.org/10.1088/1755-1315/11/1/012011, 2010.
Pook, M. J., Risbey, J. S., and McIntosh, P. C.: The synoptic climatology of cool-season rainfall in the central wheatbelt of Western Australia, Mon. Weather Rev., 140, 28–43, 2012.
Pook, M. J., Risbey, J. S., and McIntosh, P. C.: A comparative synoptic climatology of cool-season rainfall in major grain-growing regions of southern Australia, Theor. Appl. Climatol., 117, 521–533, https://doi.org/10.1007/s00704-013-1021-y, 2014.
Prezerakos, N. G. and Angouridakis, V. E.: Synoptic consideration of snowfall in Athens, J. Climatol., 4, 269–285, https://doi.org/10.1002/joc.3370040305, 1984.
Rasmussen, R., Baker, B., Kochendorfer, J., Meyers, T., Landolt, S., Fischer, A. P., Black, J., Theriault, J. M., Kucera, P., Gochis, D., Smith, C., Nitu, R., Hall, M., Ikeda, K., and Gutmann, E.: How Well Are We Measuring Snow? The NOAA/FAA/NCAR Winter Precipitation Test Bed, B. Am. Meteorol. Soc., 93, 811–829, https://doi.org/10.1175/Bams-D-11-00052.1, 2012.
Reba, M. L., Link, T. E., Marks, D., and Pomeroy, J.: An assessment of corrections for eddy covariance measured turbulent fluxes over snow in mountain environments, Water Resour. Res., 45, W00D38, https://doi.org/10.1029/2008wr007045, 2009.
Reinfelds, I., Swanson, E., Cohen, T., Larsen, J., and Nolan, A.: Hydrospatial assessment of streamflow yields and effects of climate change: Snowy Mountains, Australia, J. Hydrol., 512, 206–220, https://doi.org/10.1016/j.jhydrol.2014.02.038, 2014.
Robock, A.: The seasonal cycle of snow cover, sea ice and surface albedo, Mon. Weather Rev., 108, 267–285, 1980.
Romolo, L., Prowse, T. D., Blair, D., Bonsal, B. R., Marsh, P., and Martz, L. W.: The synoptic climate controls on hydrology in the upper reaches of the Peace River Basin. Part II: Snow ablation, Hydrol. Process., 20, 4113–4129, https://doi.org/10.1002/hyp.6422, 2006a.
Romolo, L., Prowse, T. D., Blair, D., Bonsal, B. R., and Martz, L. W.: The synoptic climate controls on hydrology in the upper reaches of the Peace River Basin. Part I: snow accumulation, Hydrol. Process., 20, 4097–4111, https://doi.org/10.1002/hyp.6421, 2006b.
Ruckstuhl, C., Philipona, R., Morland, J., and Ohmura, A.: Observed relationship between surface specific humidity, integrated water vapor, and longwave downward radiation at different altitudes, J. Geophys. Res.-Atmos., 112, D03302, https://doi.org/10.1029/2006JD007850, 2007.
Sade, R., Rimmer, A., Litaor, M. I., Shamir, E., and Furman, A.: Snow surface energy and mass balance in a warm temperate climate mountain, J. Hydrol., 519, 848–862, 2014.
Snowy Hydro Limited: Snow Depths Calculator, available at: https://www.snowyhydro.com.au/our-energy/water/inflows/snow-depths-calculator/, last access: 3 August 2018.
Stewart, I. T.: Changes in snowpack and snowmelt runoff for key mountain regions, Hydrol. Process., 23, 78–94, https://doi.org/10.1002/hyp.7128, 2009.
Stiperski, I. and Rotach, M. W.: On the Measurement of Turbulence Over Complex Mountainous Terrain, Bound.-Lay. Meteorol., 159, 97–121, https://doi.org/10.1007/s10546-015-0103-z, 2016.
Stoy, P. C., Peitzsch, E., Wood, D., Rottinghaus, D., Wohlfahrt, G., Goulden, M., and Ward, H.: On the exchange of sensible and latent heat between the atmosphere and melting snow, Agr. Forest Meteorol., 252, 167–174, 2018.
Stull, R.: Wet-Bulb Temperature from Relative Humidity and Air Temperature, J. Appl. Meteorol. Clim., 50, 2267–2269, https://doi.org/10.1175/Jamc-D-11-0143.1, 2011.
Sturm, M., Holmgren, J., and Liston, G. E.: A seasonal snow cover classification system for local to global applications, J. Climate, 8, 1261–1283, 1995.
Theobald, A., McGowan, H., Speirs, J., and Callow, N.: A Synoptic Classification of Inflow-Generating Precipitation in the Snowy Mountains, Australia, J. Appl. Meteorol. Clim., 54, 1713–1732, https://doi.org/10.1175/Jamc-D-14-0278.1, 2015.
Theobald, A., McGowan, H., and Speirs, J.: Trends in synoptic circulation and precipitation in the Snowy Mountains region, Australia, in the period 1958–2012, Atmos. Res., 169, 434–448, https://doi.org/10.1016/j.atmosres.2015.05.007, 2016.
Ueno, K.: Synoptic conditions causing nonmonsoon snowfalls in the Tibetan Plateau, Geophys. Res. Lett., 32, L01811, https://doi.org/10.1029/2004GL021421, 2005.
Viviroli, D., Durr, H. H., Messerli, B., Meybeck, M., and Weingartner, R.: Mountains of the world, water towers for humanity: Typology, mapping, and global significance, Water Resour. Res., 43, W07447 https://doi.org/10.1029/2006wr005653, 2007.
Webb, E. K., Pearman, G. I., and Leuning, R.: Correction of flux measurements for density effects due to heat and water vapour transfer, Q. J. Roy. Meteorol. Soc., 106, 85–100, 1980.
Webb, M., Slingol, A., and Stephens, G.: Seasonal variations of the clear-sky greenhouse effect: The role of changes in atmospheric temperatures and humidities, Clim. Dynam., 9, 117–129, 1993.
Welch, C. M., Stoy, P. C., Rains, F. A., Johnson, A. V., and McGlynn, B. L.: The impacts of mountain pine beetle disturbance on the energy balance of snow during the melt period, Hydrol. Process., 30, 588–602, https://doi.org/10.1002/hyp.10638, 2016.
Whetton, P. H., Haylock, M. R., and Galloway, R.: Climate change and snow-cover duration in the Australian Alps, Clim. Change, 32, 447–479, https://doi.org/10.1007/Bf00140356, 1996.
Wilks, D. S.: Cluster analysis, in: International geophysics, Elsevier, 603–616, 2011.