the Creative Commons Attribution 4.0 License.
the Creative Commons Attribution 4.0 License.
 | 27 Jul 2020
Using a composite flow law to model deformation in the NEEM deep ice core, Greenland – Part 1: The role of grain size and grain size distribution on deformation of the upper 2207 m
Ernst-Jan N. Kuiper
Johannes H. P. de Bresser
Daniela Jansen
Gill M. Pennock
The effect of grain size on strain rate of ice in the upper 2207 m in the North Greenland Eemian Ice Drilling (NEEM) deep ice core was investigated using a rheological model based on the composite flow law of Goldsby and Kohlstedt (1997, 2001). The grain size was described by both a mean grain size and a grain size distribution, which allowed the strain rate to be calculated using two different model end-members: (i) the microscale constant stress model where each grain deforms by the same stress and (ii) the microscale constant strain rate model where each grain deforms by the same strain rate. The model results predict that grain-size-sensitive flow produces almost all of the deformation in the upper 2207 m of the NEEM ice core, while dislocation creep hardly contributes to deformation. The difference in calculated strain rate between the two model end-members is relatively small. The predicted strain rate in the fine-grained Glacial ice (that is, ice deposited during the last Glacial maximum at depths of 1419 to 2207 m) varies strongly within this depth range and, furthermore, is about 4–5 times higher than in the coarser-grained Holocene ice (0–1419 m). Two peaks in strain rate are predicted at about 1980 and 2100 m depth. The prediction that grain-size-sensitive creep is the fastest process is inconsistent with the microstructures in the Holocene age ice, indicating that the rate of dislocation creep is underestimated in the model. The occurrence of recrystallization processes in the polar ice that did not occur in the experiments may account for this discrepancy. The prediction of the composite flow law model is consistent with microstructures in the Glacial ice, suggesting that fine-grained layers in the Glacial ice may act as internal preferential sliding zones in the Greenland ice sheet.
- Article
(6977 KB) - Full-text XML
- Companion paper
- BibTeX
- EndNote


Ice sheets regulate global mean sea level (GMSL) by storing large amounts of fresh water in the form of ice on land. As a consequence of increased anthropogenic global warming, the contribution of the Greenland and the Antarctic ice sheets to GMSL rise is likely to increase in the next few centuries (IPCC, 2014). It is therefore important to improve the implementation of ice flow in ice sheet models that calculate the discharge of ice into the ocean, since the amount of water stored in ice sheets is enough to raise GMSL by about 70 m (Alley et al., 2005; Church et al., 2013). The mass balance of an ice sheet depends on the accumulation of snow on the surface, release of meltwater by runoff, and the solid discharge via floating ice shelves and calving of icebergs into the ocean (e.g., Petrenko and Withworth, 1999; Marshall, 2006). In the coldest parts of Antarctica, sublimation and wind erosion can be important ablation mechanisms as well (Bintanja, 2009). The amount of ice available for calving and melting depends on the flow of ice from the interior towards the margins of the ice sheet. This flow of ice is controlled by two processes: sliding of the ice over the bedrock, which includes various subglacial processes (Zwally et al., 2002; Vaughan and Arthern, 2007; Thoma et al., 2010; Wolovick and Creyts, 2016), and the internal deformation of the polycrystalline ice, which is governed by various processes like dislocation creep, grain boundary migration (strain-induced grain boundary migration, SIBM, using the terminology of Faria et al., 2014b) and grain boundary sliding (GBS) (e.g., Duval et al., 1983; Alley, 1992; Goldsby and Kohlstedt, 1997, 2001; Montagnat and Duval, 2000, 2004; Schulson and Duval, 2009; Faria et al., 2014a).
For large-scale flow models, the deformation of the ice polycrystal is approximated in a homogenized way by continuum mechanics principles. Together with balance equations for mass, momentum and energy, continuum mechanics uses the relation between stress and strain rate given by a constitutive relation, also called the “flow law”. The most commonly used flow law in ice sheet models is Glen's flow law (Glen, 1952, 1955; Paterson, 1994), which describes the flow of polycrystalline ice during deformation by a power law relating equivalent strain rate () to equivalent stress (σ) according to
where n=3 for Glen's flow law. Although Glen found different n values during his laboratory experiments (Glen, 1952, 1953, 1955), a value of n=3 is most often used in ice sheet models (e.g., Paterson, 1994). In the following we thus always refer to Glen's flow law with n=3. In Glen's flow law, grain-size-insensitive (GSI) dislocation creep is assumed to be the dominant deformation mechanism. Variants of this type of strain rate–stress relation with different values for the stress exponent n have been used, ranging from n=1.5 to 4.0, based on experiments at different conditions (Weertman, 1983). However, at the relatively low driving stresses of <0.3 MPa (equal to an equivalent stress of about 0.5 MPa using Eq. 12) in terrestrial ice sheets (e.g., Sergienko et al., 2014), Glen's flow law has proved to be inaccurate (e.g., Thorsteinsson et al., 1999; Huybrechts, 2007) and predicts strain rates that are too slow in both the deeper and the fine-grained parts of the polar ice sheets. Laboratory experiments (Mellor and Testa, 1969a; Pimienta and Duval, 1987; Duval and Castelnau, 1995; Goldsby and Kohlstedt, 1997, 2001; De La Chapelle et al., 1999; Duval et al., 2000) and flow analysis of ice sheets (Dahl-Jensen and Gundestrup, 1987; Alley, 1992) have shown that under these low-stress conditions, ice deformation is best described by a flow law with a stress exponent lower than 3.0. However, most polar ice cores are drilled at low-stress locations like domes or ridges (e.g., Faria et al., 2014b), where the ice might deform by different deformation mechanisms and therefore be described by a different stress exponent than ice along the flanks or the margins of the ice sheet. The exact deformation mechanism of ice at these low driving stresses is still unclear.
Pimienta and Duval (1987) proposed that in the low-stress regime with n<3, fine-grained ice deformed by glide of dislocations on the basal slip plane accommodated by grain boundary migration. A quantitative model for this mechanism was developed by Montagnat and Duval (2000). This model is consistent with a stress exponent n=2 and also indicates that deformation of ice at low stress is likely to be grain size sensitive (Montagnat et al., 2003; Duval and Montagnat, 2006).
During experiments with very fine-grained ice (with a grain diameter between 3 and 90 µm), Goldsby and Kohlstedt (1997) found a transition from a GSI creep regime with a power law stress exponent of n=4 at high equivalent stress (σ>3 MPa) to a grain-size-sensitive (GSS) creep regime with n=1.8 and a grain size exponent (p) of 1.4 at medium equivalent stress (1–3 MPa). At low equivalent stresses (<1 MPa) and with the finest-grained samples, Goldsby and Kohlstedt found a third creep regime, which was again grain size independent but with n=2.4. Recent studies (Saruya et al., 2019) have confirmed the occurrence of GSS creep in fine-grained ice, with n=2 and p=1.4. According to Goldsby and Kohlstedt, the GSI regime with n=4 is governed by dislocation creep using the easy slip systems in ice (basal slip) rate-limited by the hard slip systems (i.e., non-basal slip). In the GSS regime with n=1.8, basal slip is thought to be rate-limited by grain boundary sliding (GBS), while the opposite holds for the low-stress GSI regime with n=2.4, where GBS is rate-limited by basal slip. The accommodating mechanisms are required to maintain strain progression and compatibility (e.g., avoid creation of pore space or voids). They are enabling the major mechanism and are the slowest mechanism (Durham and Stern, 2001) and are thus rate-controlling. At even lower stresses a fourth creep regime, diffusion creep, is expected. This creep regime is expected to dominate the flow behavior of ice at very small grain sizes (≪1 mm), low temperature and very low equivalent stresses. This creep regime was not reached during the experiments of Goldsby and Kohlstedt (2001) and is assumed to be irrelevant for terrestrial ice sheets (Goldsby and Kohlstedt, 2001; Durham et al., 2010). Therefore, diffusion creep will not be considered in the remainder of this paper.
The hypothesis of Goldsby and Kohlstedt (1997, 2001) concerning the role of GBS in ice has been seriously questioned by Duval and Montagnat (2002), who noted that deformation by dominant GBS is inconsistent with the strong crystallographic preferred orientations (CPOs) found in polar ice, which can be explained by deformation involving basal slip accommodated by grain boundary migration (Pimenta and Duval, 1987; Montagnat and Duval, 2000). In response, Goldsby and Kohlstedt (2002) noted that a CPO could develop in the case of GBS accommodated by easy basal slip. While the detailed deformation mechanisms are controversial, there is actually a consensus that the low stress deformation of ice involves slip on the easy basal slip system accommodated by grain boundary processes (Goldsby and Kohlstedt, 2002; Duval and Montagnant, 2002) and that deformation in the low-stress regime is likely to be grain size sensitive (Montagnant et al., 2003; Duval and Montagnat, 2006).
The recent study by Saruya et al. (2019) confirms the occurrence of GSS creep in fine-grained ice and proposes a different mechanism, where grain boundaries enhance creep by acting as sinks for dislocations. We emphasize that even though the exact mechanisms involved in GSS flow are not understood in detail, there is good experimental evidence for GSS creep in ice and the available flow laws provide a reasonable basis to investigate the role of these mechanisms in polar ice sheets.
Goldsby and Kohlstedt (2001), Goldsby (2006), and Durham et al. (2010) suggested that Glen's flow law actually represents a combination of deformation mechanisms at the stress range 0.1–1.0 MPa (Glen, 1952, 1955) rather than just dislocation creep. This forms a possible explanation for a lack of accuracy in calculating ice strain rates when using Glen's flow law with fixed n=3 at very low stress (e.g., Peltier et al., 2000; Durham and Stern, 2001; Durham et al., 2010). For instance, Schulson and Duval (2009) claim that the n=4 regime applies to tertiary creep, which was the same stress exponent found in the high-pressure experiments (Durham et al., 1983; Kirby et al., 1987). Analysis also indicates that a power law with a stress exponent of n=4 best describes the observed state of the northern part of the Greenland ice sheet (Bons et al., 2018). Other factors that are often linked to polar ice being softer than predicted by Glen's flow law at low stress are the anisotropy of ice, impurity content and the softening of ice caused by a small grain size (e.g., Fisher and Koerner, 1986; Dahl-Jensen and Gundestrup, 1987; Paterson, 1991; Cuffey et al., 2000a). Attempts have been made to account for these softening factors by introducing a pre-exponential enhancement factor (e.g., Martin et al., 2009; Seddik et al., 2008; Greve, 1997). When adjusted for anisotropy and grain size, this pre-exponential factor can be as high as 20 (Azuma, 1994). Instead of using an enhancement factor to artificially speed up Glen's flow law, with an assumed value of n=3, a flow law that is directly based on the actual behavior of ice at steady state or in tertiary creep may be used. Evidence for a stress exponent nearer to 4 has often been reported (Glen, 1953; Peltier et al., 2000; Qi et al., 2017; Treverrow et al., 2012).
The different GSS and GSI creep regimes recognized by Goldsby and Kohlstedt (1997, 2001) have been combined by these authors in the form of one composite flow law. The major advantage of such a composite flow law is that it explicitly denotes the components of the different creep mechanisms, rather than just describing bulk behavior. This provides the opportunity to calculate the relative importance of the GSS and GSI deformation mechanisms over the range of temperatures, differential stresses and grain sizes found in ice sheets and compare their contribution to the total strain rate. This is not possible with the flow law developed by Baker (1981), for example, which adds a factor to the preexisting Glen's flow law to account for the effect of grain size.
It is well known that grain size varies throughout both the Greenland and Antarctic ice sheets (e.g., Gow et al., 1997; Faria et al., 2014b; Binder, 2014; Fitzpatrick et al., 2014). However, the effect of grain size on strain rate is usually not considered in ice sheet models that apply flow laws of the type of Glen's flow law. Furthermore, the grain size is often expressed as a single mean grain size, which is generally not a good representation for a grain size distribution (Kipfstuhl et al., 2009). For instance, small grains in a distribution might contribute differently to the overall behavior than large grains, with a given set of GSS and GSI mechanisms. Ter Heege et al. (2004) showed that using a mean grain size instead of a full grain size distribution in composite flow laws can lead to an overestimate or underestimate of the strain rates of natural rocks.
In the NEEM ice core in northwestern Greenland (77.45∘ N, 51.06∘ W, core length 2540 m) (NEEM community members, 2013) and other Greenland ice cores, the dominant deformation mechanism in the Holocene ice is thought to be dislocation creep (e.g., Thorsteinsson et al., 1997; De La Chapelle et al., 1998; Weikusat et al., 2017). Studies of microstructures by light microscopy suggested that rotation recrystallization was active in the Holocene ice (De La Chapelle et al., 1998), although recent work shows that strain-induced grain boundary migration (SIBM) and grain dissection processes are important in maintaining a constant grain size with depth (Faria et al., 2014b; Steinbach et al., 2017). In the Glacial ice (deposited as snow in the Glacial period) the strong crystallographic preferred orientations (CPOs) indicate that large strains are accommodated by basal slip (Thorsteinsson et al., 1997; Montagnat et al., 2014), while subgrain development and clusters of grains with similar orientation have been interpreted as evidence for rotation recrystallization (Thorsteinsson et al., 1997; De La Chapelle et al., 1998; Obbard et al., 2006). These features suggest that dislocation creep is dominant throughout the entire section of Holocene and Glacial ice in Greenland (e.g., De La Chapelle et al., 1998). In contrast, Goldsby and Kohlstedt (2002) interpreted the occurrence of straight grain boundaries and equant grains in Glacial ice from the GRIP ice core as evidence for GBS; however, this interpretation was not accepted by most members of the ice community. More recently, Faria et al. (2014a, b) noted that if strain is high in impurity-rich, fine-grained cloudy bands in the Glacial ice, flow is likely to be accommodated by GSS deformation, and Saruya et al. (2019) have suggested that ice sheet microstructures with straight grain boundaries could deform by GSS creep with stress exponent of n=2 and grain size exponent p=1.4, while microstructures with irregular grain boundaries and high subgrain density deform by GSI dislocation creep with n=3.
In this paper, the composite flow law is used to investigate the effect of grain size, grain size distribution and different microscale models on the dominant deformation mechanism and the predicted strain rate down to 2207 m depth in the NEEM deep ice core, and the results are compared to results obtained with Glen's flow law. The grain size data are described using both a mean grain size and a grain size distribution to evaluate the natural variability in grain size and the effect of grain size variation on predicted strain rate in polar ice. The deformation mechanisms predicted from the composite flow law are compared with the mechanisms inferred from microstructural and CPO studies of the ice cores. The actual variation in strain rate with depth is currently being investigated by continuing borehole logging studies (Dahl-Jansen et al., 2016; Dorthe Dahl-Jansen, personal communication, 2019) in the NEEM bore hole. Preliminary results (Greve et al., 2017) indicate that enhanced strain rates occur in the NEEM Glacial age layers. This study is in progress and will provide important information on the effect of grain size, CPO and impurity content on ice deformation by providing strain rate measurements with depth to compare with those predicted by the model presented here.
2.1 Study site and ice microstructure
The NEEM deep ice core was chosen because a comprehensive light microscope dataset was available (Kipfstuhl, 2010) enabled by a fast line scan technique with microscopic resolution (LASM, Large Area Scanning Macroscope; Krischke et al., 2015). From these LM images the grain size distribution is available (Binder et al., 2013). The NEEM ice core was drilled between 2008 and 2012 and is located close to an ice ridge (NEEM community members, 2013). The flow at the NEEM ice core is mainly parallel to the ridge, with a small divergent component perpendicular to the line of the ridge (Montagnat et al., 2014). The top 1419 m of the NEEM deep ice core consists of ice deposited during the Holocene (Holocene ice), which shows a steadily increasing crystallographic preferred orientation (CPO) towards a vertical c axis single maximum with a tendency towards a great circle “girdle” distribution (Fig. 1a; Eichler et al., 2013; Montagnat et al., 2014). The mean grain area increases from submillimeter size at the surface to about 5 mm2 at about 400 m depth, after which it remains approximately constant for the remainder of the Holocene ice (Montagnat et al., 2014). At the transition from the Holocene ice to ice from the last Glacial period (Glacial ice), a sharp decrease in mean grain area to 1–2 mm2 is observed and the c axis vertical clustering is further strengthened. At a depth of 2207 m, which is the transition from the Glacial ice to the ice deposited during the Eemian period, the grain area increases sharply to hundreds of square millimeters and the shape of the CPO varies strongly with depth (NEEM community members, 2013). Figure 1c shows that the temperature in the Holocene ice is constant at 244 K, after which the temperature starts to increase in the Glacial and Eemian ice almost reaching pressure-melting point close to the bedrock.
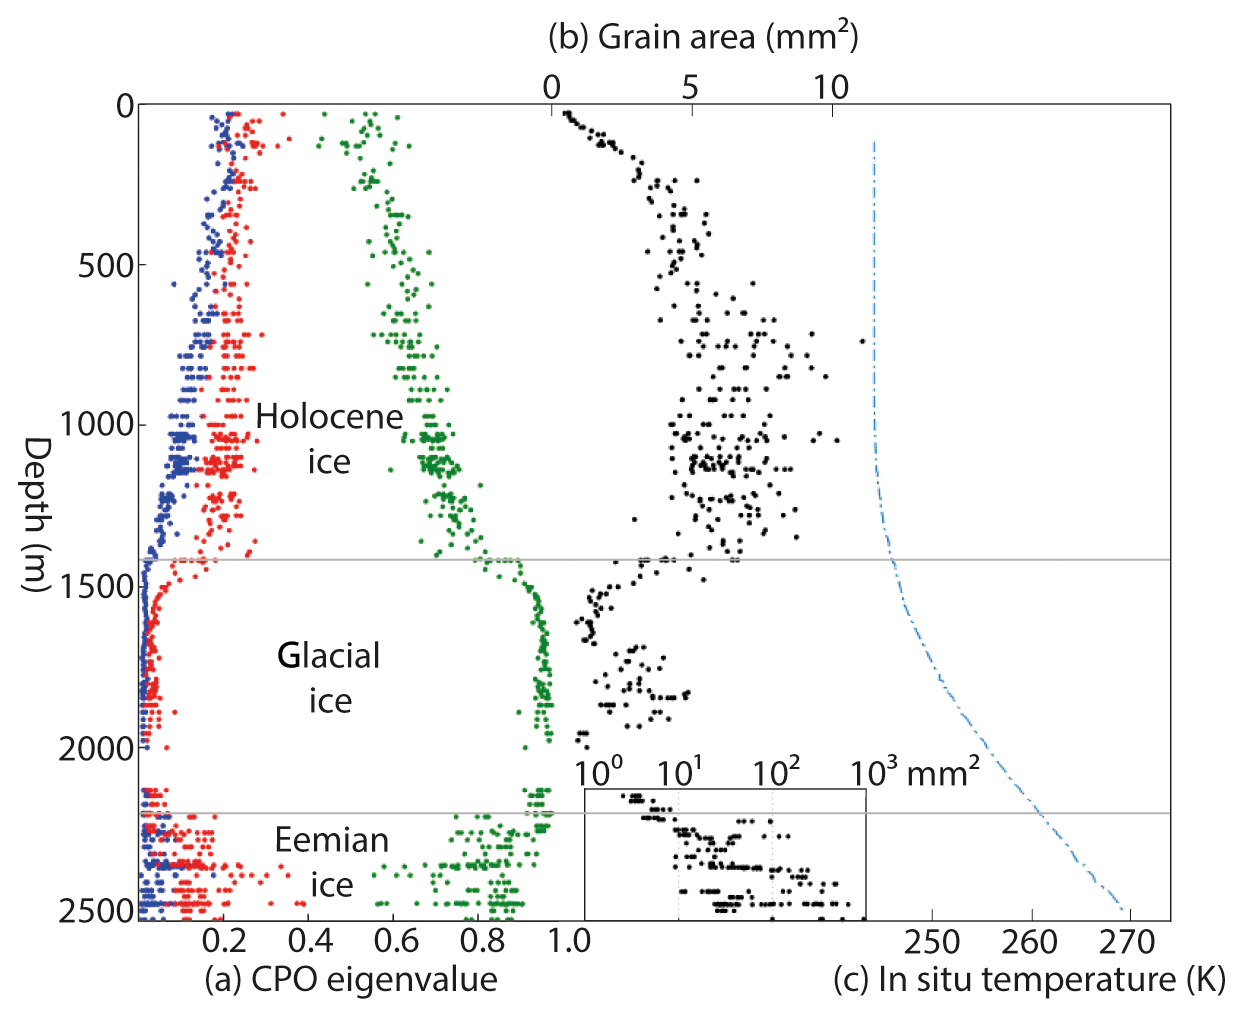
Figure 1Compilation of microstructure and borehole data of the NEEM ice core: (a) orientation tensor eigenvalue from light microscopy studies (blue, red, green) (Eichler et al., 2013), (b) mean grain area (black dots) (Eichler et al., 2013) and (c) the in situ temperature (broken blue line) (Sheldon et al., 2014).
The difference in microstructure between the Holocene ice and the Glacial ice of the NEEM ice core is shown in Fig. 2. The Holocene ice core section (Fig. 2a) was taken from a depth of 921 m and contains coarse grains with an aspect ratio of about 1:1 and has a relatively irregular grain boundary structure. The ice core section from the Glacial ice (Fig. 2b) is taken from a depth of 1977 m and is one of the finest-grained ice core sections that was used in this study. The LM image shows very fine-grained subhorizontal bands with numerous quadruple junctions. The grains in these fine-grained bands are flattened and have an aspect ratio of about 2:1. The fine-grained subhorizontal bands contain many grains with aligned grain boundaries.
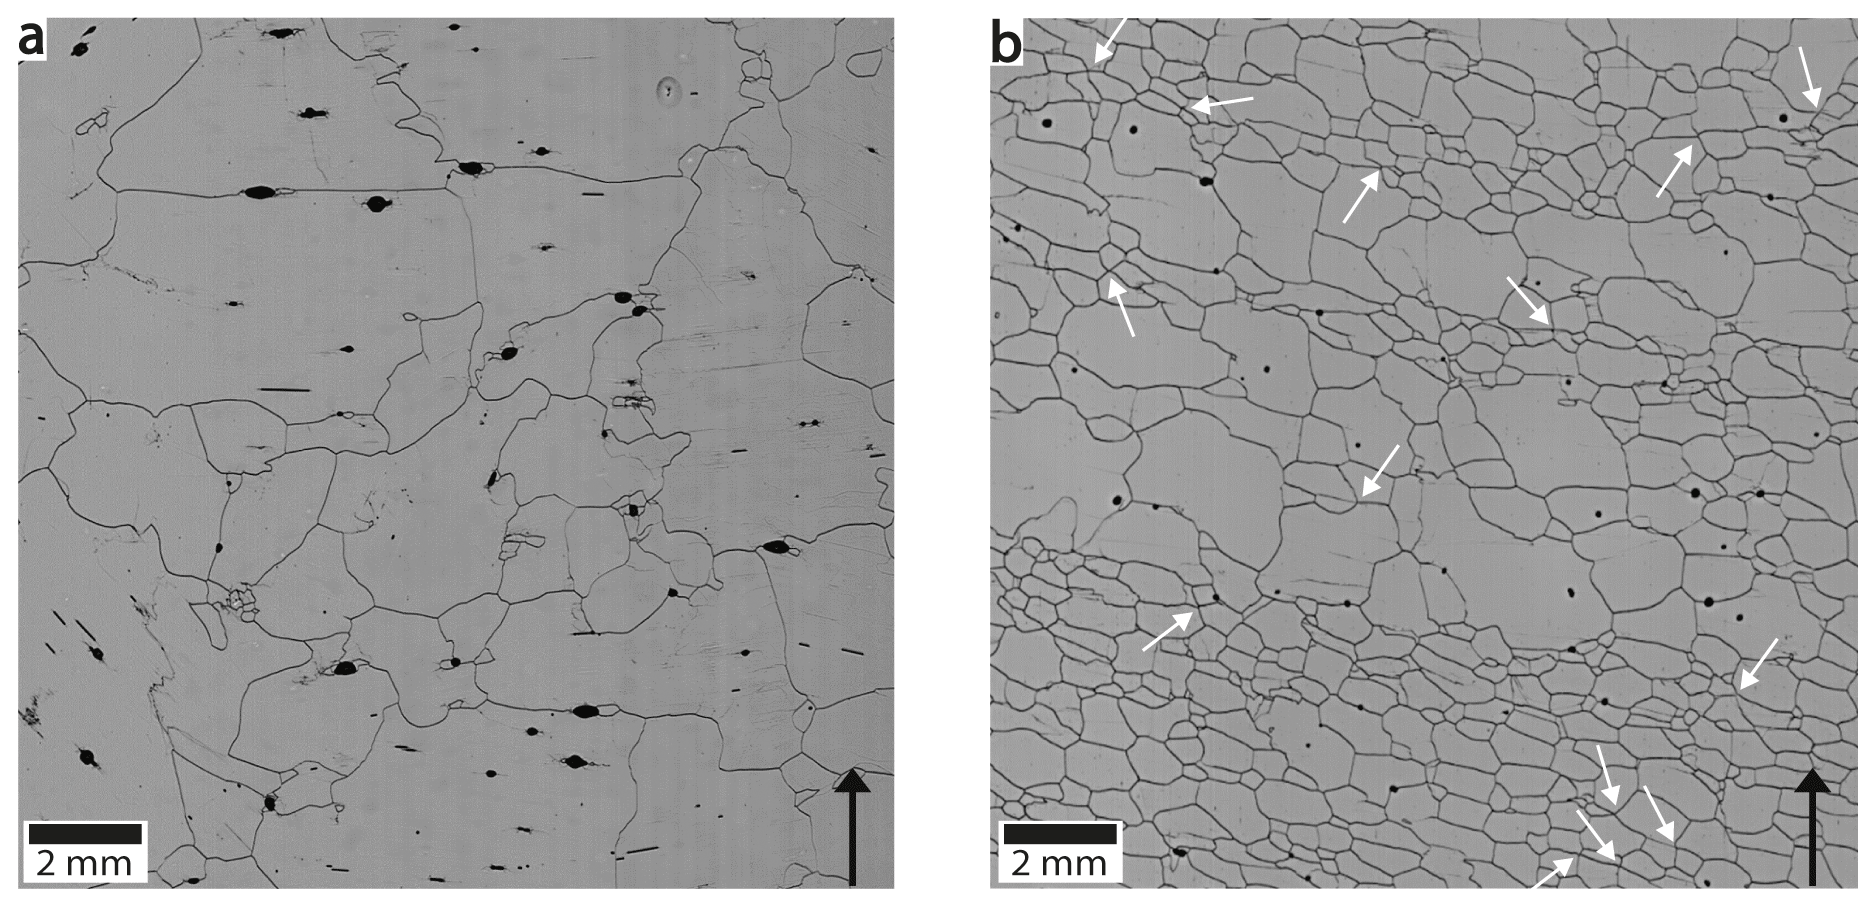
Figure 2Reflected LM images of ice core sections at (a) 921 m depth in the Holocene ice and (b) 1977 m depth in the Glacial ice of the NEEM ice core. The black arrows indicate the top of the ice core. The Glacial ice core section contains layers with coarse and relatively fine grains that are distributed in subhorizontal bands. These fine-grained subhorizontal bands have many aligned grain boundaries and quadruple junctions that are indicated by white arrows. Images taken from Kipfstuhl (2010) (https://doi.pangaea.de/10.1594/PANGAEA.743296).
In this study, 615 LM images of the Holocene and Glacial ice were used to determine the evolution of the grain size with depth in the NEEM ice core. These LM images were made of sections that were cut parallel to the long (vertical) axis of the ice core (Kipfstuhl et al., 2006). Each LM image is about 90 mm long and about 55 mm wide and was digitally analyzed using the Ice-image software (https://www.ice-image.org, last access: 15 April 2020) (Binder et al., 2013; Binder, 2014), which automatically detects the grain area of each grain in the cut sample surface by counting the pixels enclosed by grain boundaries. A lower cutoff grain size diameter of 0.3 mm was used to exclude the small features that are produced as results of sample relaxation around air bubbles and segmentation by the analysis software (Fig. 3). Grains with grain boundaries that were interrupted by the edge of the sample, such as the white grain in the upper-right corner of Fig. 3b, were excluded from the grain size data.
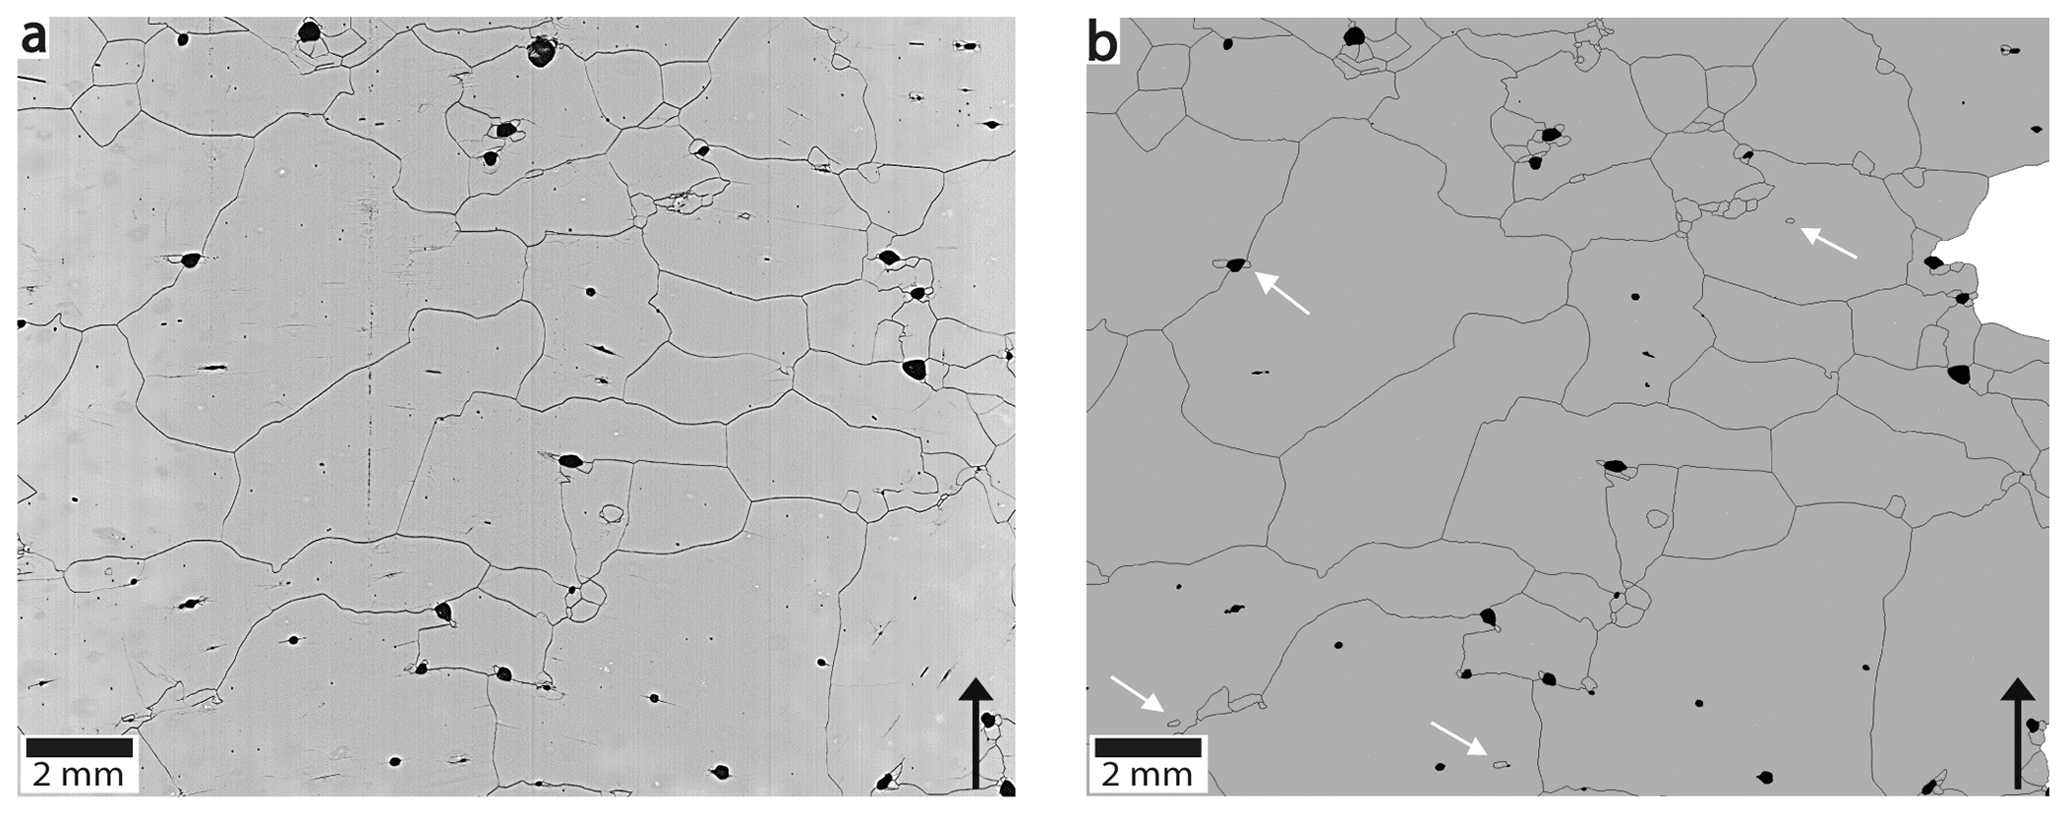
Figure 3Reflected LM image (a) and the segmented image (b) of an ice core section at 756 m depth. The black arrows indicate the top of the ice core. White arrows indicate examples of artifacts with a diameter <0.3 mm that were not included in the grain size data. Images taken from Kipfstuhl (2010) (https://doi.pangaea.de/10.1594/PANGAEA.743296) and Binder et al. (2013).
2.2 The composite flow law
The composite flow law as proposed by Goldsby and Kohlstedt (2001) is formulated as follows:
where is the total strain rate, composed of strain rates for basal slip rate-limited by non-basal slip or dislocation creep, ; the strain rate produced by basal slip, ; the strain rate produced by GBS, ; and diffusion creep, . Each of these creep mechanisms can be described by a power law relation of the following form:
where A is a material parameter, σ is the differential stress (MPa), n is the stress exponent, d is the grain size diameter (m), p is the grain size exponent, Q is the activation energy for the creep mechanism (J mol−1), P is the hydrostatic pressure (MPa), V∗ the activation volume (m3 mol−1), R is the gas constant (J K−1 mol−1) and T the absolute temperature (K). The effect of PV∗ is assumed to be very small (Durham and Stern, 2001) and is ignored for the remainder of this study. The power law relationship of Eq. (3) also corresponds to the type of flow equation used in Glen's law (Glen, 1955; Paterson, 1994).
As explained by Durham and Stern (2001) and Durham et al. (2001, 2010), GBS and dislocation slip are sequential processes where one cannot proceed without the other and the slowest mechanism determines the overall strain rate, i.e., is rate-limiting, so that if
Under the temperatures, grain sizes and stresses that occur in natural ice on Earth, basal slip will always give faster strain rates than GBS (Eq. 4) and non-basal slip (Goldsby and Kohlstedt, 2001; Goldsby, 2006). This makes, according to Goldsby and Kohlstedt (2001), either GBS or non-basal slip the rate-limiting mechanism for deformation of ice sheets. Therefore, basal slip-limited creep is not considered in the remainder of this paper, as this deformation mechanism is not relevant for polar ice sheets. Hence, the composite flow law simplifies to
As noted in the introduction, the mechanisms involved in the low-stress, grain-size-sensitive deformation regime in ice are debated and several different creep models have been proposed (Montagnat and Duval, 2000; Goldsby and Kohlstedt, 2001; Saruya et al., 2019). While the deformation mechanisms involved are controversial, there is some consensus from the experimental studies on the flow law parameters of this regime (Goldsby and Kohlstedt, 2001; Saruya et al., 2019) with n about 2 and p about 1.4. As we are using the simplified version of the composite flow law in Eq. (6), our study is not dependent on the details of the deformation mechanisms in the GSS regime.
Figure 4 shows the effect of grain size and stress on strain rate for GBS-limited creep (), the dislocation creep mechanism () of the composite flow law and the most often used form (n=3) of Glen's flow law. The chosen uniform temperature of 243 K is representative for the upper 1200 m at NEEM (Fig. 1c; Sheldon et al., 2014). Glen's flow law and the dislocation creep mechanism are not dependent on grain size (p=0) but have a different slope to each other resulting from the different stress exponents. GBS-limited creep shows relatively fast strain rates at small grain sizes and low stresses. At higher stresses and larger grains, the dislocation creep mechanism is dominant over GBS-limited creep.
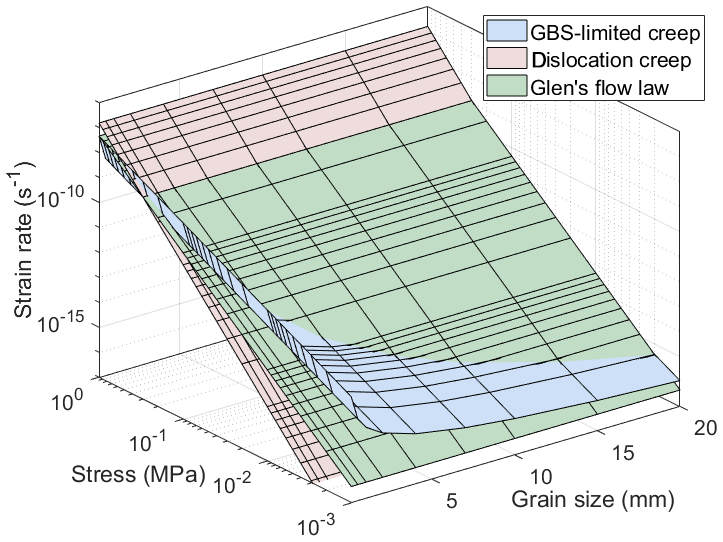
Figure 4The effect of grain size and stress on calculated strain rate plotted for Glen's flow law and the dislocation creep mechanism and GBS-limited creep of the composite flow law at a constant temperature of 243 K using the flow law parameters in Table 1.
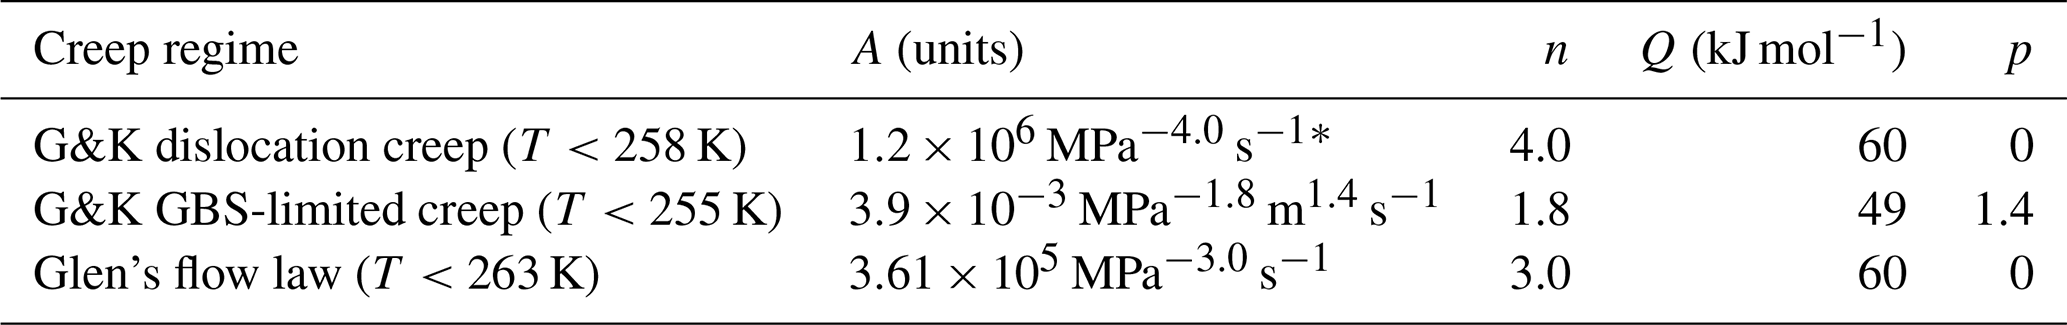
Table 1Parameters for the simplified composite flow law and for Glen's flow law given by Eq. (3) that relates grain size, temperature and stress to strain rate. Values taken from Goldsby and Kohlstedt (2001, G&K) and Paterson (1994). The A value for G&K dislocation creep (indicated by *) was updated and taken from Goldsby (2006).
The smaller grains in a polycrystal can potentially deform by a different mechanism than the larger grains, since the smaller grains are more susceptible to GSS deformation mechanisms. In order to study the effect of the variation in grain size, a grain size distribution was used as well as a mean grain size in the flow law (Freeman and Ferguson, 1986; Heilbronner and Bruhn, 1998; Ter Heege et al., 2004). As shown by Freeman and Ferguson (1986) and Ter Heege et al. (2004), applying a grain size distribution into a composite flow law leads to application of two theoretical end-members to describe the deformation of ice: the homogeneous stress, or microscale constant stress model, and the homogeneous strain rate, or microscale constant strain rate model.
The microscale constant stress model assumes that each grain experiences the same stress, which is equal to the bulk stress of the material. However, the strain rate produced by each grain is different. The driving stress and the bulk strain rate produced by this model can be expressed as follows:
where the bulk volume has been segmented into n grain size classes, vi stands for the volume fraction of grain size class i and stands for the strain rate of grain size class i.
The microscale constant strain rate model assumes that each grain deforms by the same strain rate, which is equal to the strain rate of the bulk material. The stress required to produce this strain rate is different for each grain size class. This end-member assumes that the larger grains in the polycrystalline material support more stress than the smaller grains and can be described as follows:
where stands for the stress supported by grain size class i. An iterative approach is required to calculate the strain rate when the bulk stress is known.
2.3 Boundary conditions and input data
The temperature in the NEEM borehole reaches 269.8 K at the bedrock interface, which is only 0.9 K below the estimated pressure-melting point (Sheldon et al., 2014). At this temperature it is expected that the deformation of ice is affected by pre-melting (e.g., Mellor and Testa, 1969b; Barnes et al., 1971; Morgan, 1991; Goldsby and Kohlstedt, 2001). To omit the effect of the different temperature thresholds given in Table 1 for Glen's flow law (263 K), the GBS-limited mechanism (255 K) and the dislocation creep mechanism (258 K) of the composite flow law (Goldsby and Kohlstedt, 2001; Goldsby, 2006), the high-temperature flow law parameters, and therefore the effect of pre-melting on strain rate, were not included in this study. Since the effect of pre-melting is expected to start close to the Glacial–Eemian interface at about T>262 K this paper (Part 1) focuses on the relatively cold Holocene and Glacial ice in the upper 2207 m of NEEM. The deeper, possibly pre-melted ice will be the subject of a companion paper (Part 2, Kuiper et al., 2020), which will analyze the combined effects of grain size and pre-melting on deformation in the NEEM ice core.
The method of Heilbronner and Bruhn (1998) was used to convert 2D sectional areas to 3D volume fractions. This method uses an equivalent grain diameter that was determined for each grain and a 3D volume fraction was calculated with the assumption of a spherical grain. This method corrects for the overrepresentation of small grains in an LM image compared to the bulk volume. The grain size distribution contains 80 grain size classes defined by steps of the equivalent diameter of 0.3 mm each, covering the full breath of the observed grain size distribution in the Holocene and Glacial ice. The equivalent diameter of each grain in each ice core section was calculated and included in the corresponding grain size class. Figure 5 shows an example of the volume contribution of sectional circles and the corresponding volume contribution of spheres for an ice core section at 921 m depth (details of the microstructure are shown in Fig. 2a).
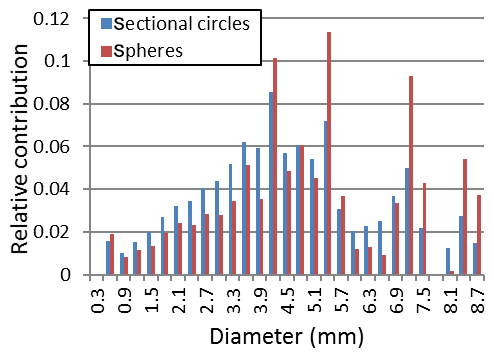
Figure 5Relative contribution of each grain size class to the bulk volume of an ice core section containing 965 grains at 921 m depth calculated for sectional circles (blue) and spherical grains (red) using the method of Heilbronner and Bruhn (1988).
The mean grain size was determined by dividing the total area, as classified by the “grain” category in the Ice-image software, by the number of grains for each LM image. This way, the areas affected by bubbles, fracturing or frost are excluded from the mean grain size calculation. A mean equivalent diameter for each ice core section was calculated by assuming a circular grain. Since the composite flow law of Goldsby and Kohlstedt (1997, 2001) requires a grain diameter instead of grain area as an input variable, the conversion of grain area to equivalent grain diameter is required. This conversion might induce a small but systematic error, since recrystallized materials tend to have a lognormal grain size distribution, which leads the calculated equivalent grain diameter to be larger than the mean grain diameter. When using a mean grain size, there are no series of volume fractions (Eqs. 8 and 10) so no application of the microscale constant stress model and the microscale constant strain rate model is required.
To calculate the strain rate using Glen's flow law and the composite flow law at the location of the NEEM ice core, information about the variation in stress with depth in the ice sheet is required. As stress itself cannot be measured, the stress has to be estimated based on theoretical considerations and constraints on strain rates in the NEEM ice core.
The shear stress in an ice sheet is driven by gravity and is determined by the surface slope of the ice sheet and the depth from the surface zice. The shear stress along an ice core can be estimated using the shallow ice approximation (e.g., Hutter, 1983; Greve and Blatter, 2009):
where τ is the shear stress (Pa), ρice is the density of ice (910 kg m−3), zice is the ice thickness (m), g is the gravitational constant (9.81 m s−2) and is the surface slope in the direction of flow. The surface slope at NEEM is about 1.8 m km−1 (Montagnat et al., 2014) and the ice core length is 2540 m (Rasmussen et al., 2013). Assuming a constant ice density, the shear stress increases linearly with depth, reaching 0.041 MPa at the ice–bedrock interface at NEEM. Both the composite flow law and Glen's flow law were derived during uniaxial deformation tests in secondary creep (Glen, 1952, 1955; Goldsby and Kohlstedt, 1997, 2001). So in order to use the shear stress as input for the flow laws, the shear stress has to be converted to an equivalent stress σe using the following relationship (Paterson and Olgaard, 2000):
which results in an equivalent axial differential stress at the ice–bedrock interface at NEEM of 0.071 MPa as shown in Fig. 6.
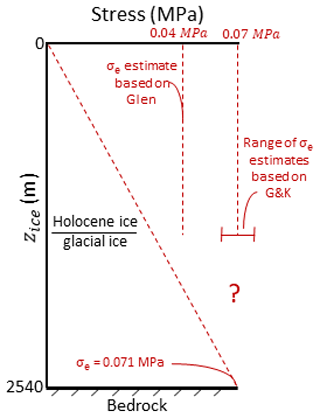
Figure 6The equivalent shear stress (σe) with depth calculated using the shallow ice approximation (Eq. 11) and the range of the estimated longitudinal stress, based on the modified parameters of the composite flow law (G&K) of Table 2 and the best estimate for Glen's flow law constrained by the annual layer thinning in the Holocene ice of the NEEM ice core. There are no constraints on the annual layer thinning in the Glacial and Eemian ice, which is indicated by the question mark.
The upper part of the NEEM ice core is dominated by longitudinal stress, perpendicular to the plane of the divide, leading to thinning of the annual layers (Dansgaard and Johnsen, 1969; Montagnat et al., 2014). Longitudinal stresses can be calculated from the increase in the ice slope away from the divide if the rheology of ice is assumed (Raymond, 1983; Dahl-Jensen, 1989a). In this study, the simple approach of assuming an imposed stress–depth relationship will be taken to investigate how ice rheology is influenced by grain size, temperature and imposed stress. The layer thinning in the upper part of an ice core, caused by the increased overburden pressure resulting from the deposition of a new snow layer each year, provides a constraint on the vertical strain rate. In case of the NEEM ice core this gives a value of about s−1 (Gillet-Chaulet et al., 2011; Montagnat et al., 2014) in the Holocene ice. This strain rate can be used to estimate the equivalent stress in the upper part of the ice sheet using the composite flow law and Glen's flow law (Fig. 6). A constant equivalent stress value of 0.07 MPa using the composite flow law reproduced the rate of observed layer thinning, as shown in Fig. 9. Note that Fig. 9 is based on the composite flow law with the modified flow law parameters, discussed in Sect. 3. For Glen's flow law the equivalent stress required to reproduce the observed layer thinning in the Holocene ice is lower at about 0.04 MPa. It was therefore decided to assume a constant equivalent stress of 0.07 MPa along the length of the NEEM ice core as input for Glen's flow law and the composite flow law. At the base of the ice sheet the vertical equivalent stress will tend to zero, with the decrease in vertical stress depending on the stress exponent in the flow law (Dansgaard and Johnson, 1969; Dahl-Jensen, 1989b).
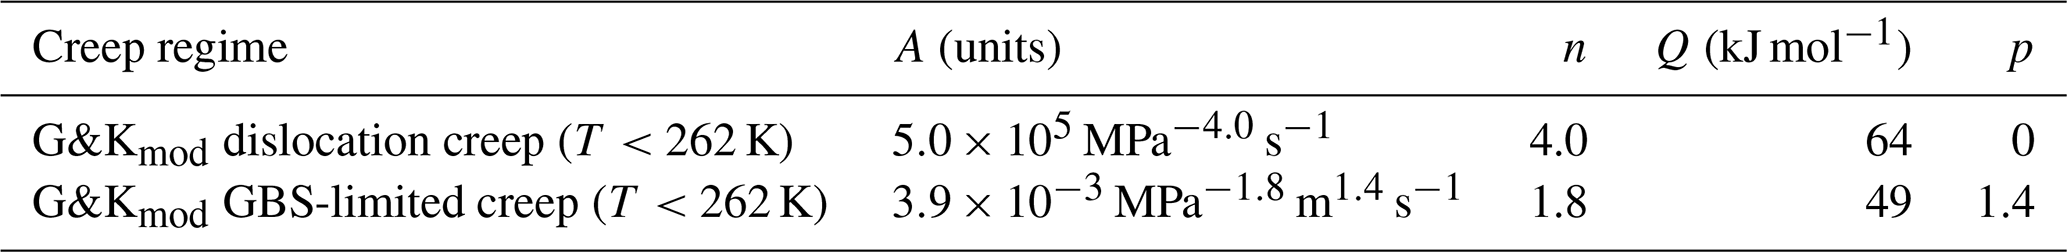
Table 2Modified dislocation creep parameters for the composite flow law as derived from Fig. 7. The transition temperature is taken to be 262 K (see Sects. 2.3 and 3).
The assumption of constant equivalent stress with depth is not realistic for ice sheets in general (e.g., Dahl-Jensen, 1989b). However, this assumption is a useful first approximation for the NEEM ice core where the equivalent stress, related to the shear stress in the lower part of the ice core, is by coincidence similar to the magnitude of equivalent stress related to the vertical stress in the upper part of the ice core. While this approach is simple, it is a useful first step. We have also investigated the effect of changing the constant equivalent stress in the range of 0.01 to 0.50 MPa. When calculating strain rates, no distinction is made between simple shear and vertical flattening deformation.
The most recently updated flow law parameters for the simplified composite flow law (Goldsby, 2006) and the most often used form of Glen's flow law with n=3 (Paterson, 1994) are given in Table 1 for low temperatures where no pre-melting effects are expected. In order to apply the composite flow law of Goldsby and Kohlstedt (2001) to the NEEM ice core, a check was made of the various published flow laws (Goldsby and Kohlstedt, 1997, 2001; Goldsby, 2006) with the experimental data. This analysis highlighted an error in one part of the published flow law. The error was confirmed by others (David Goldsby, personal communication, 2018; David Prior, personal communication, 2018) and is explained and corrected in the next two paragraphs.
A comparison of the calculated strain rate for dislocation creep with the experimental data points from Fig. 7 of Goldsby and Kohlstedt (2001) was made. The calculated strain rates were based on the flow law parameters in Table 1 and using Eq. (3). This comparison is shown in Fig. 7a. The solid blue line shows the calculated strain rate for dislocation creep when the flow law parameters of Table 1 were used and forced with a stress of 6.3 MPa, which is the same stress as used in Fig. 6 of Goldsby and Kohlstedt (2001). The calculated strain rate does not coincide with the three experimental data points for a temperature of <258 K. The calculated strain rate is about 15 to 20 times higher than the experimental strain rates. An Arrhenius plot for GBS-limited creep (Fig. 7b) was also calculated using a stress of 0.53 MPa and a uniform grain size of 73 µm, similar to Fig. 4 of Goldsby and Kohlstedt (2001) and using the flow law parameters of Table 1. For this deformation mechanism, the calculated strain rate agrees well with the experimental data points at T<255 K of Goldsby and Kohlstedt (2001).
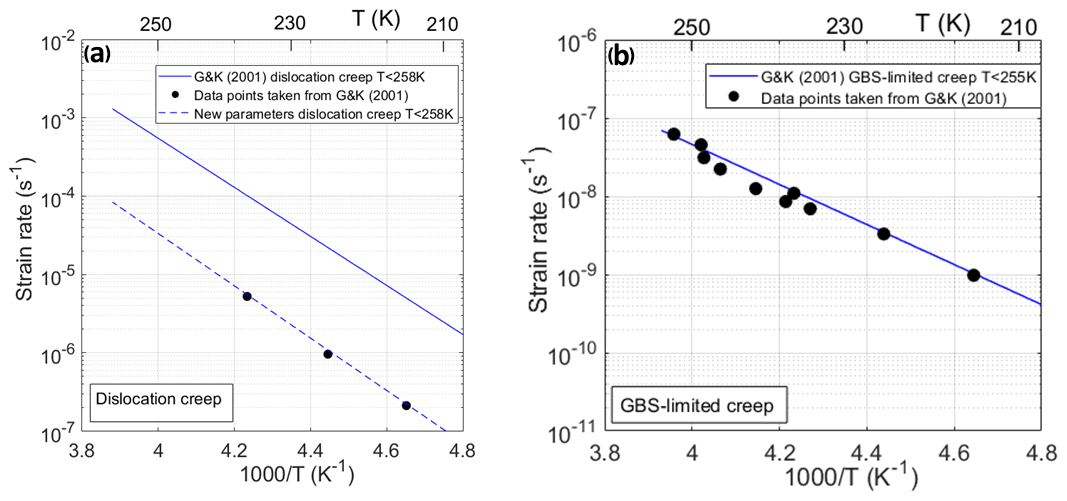
Figure 7Arrhenius plot showing (a) the dislocation creep mechanism and (b) the GBS-limited creep mechanism below their temperature thresholds of 258 and 255 K, respectively. A stress of 6.3 MPa was used to calculate the strain rates in (a) and a stress of 0.53 MPa and a uniform grain size of 73 µm were used for (b). The black dots are the experimental data points taken from Goldsby and Kohlstedt (2001). The solid lines represent the calculated strain rate using the original flow law parameters from Goldsby and Kohlstedt (2001) (Table 1). The dotted line, G&Kmod, is the calculated strain rates for dislocation creep using the modified flow law parameters (Table 2).
We have modified the flow law parameters for dislocation creep (dashed blue line, Fig. 7a). A transition temperature of 262 K was taken for both dislocation creep and GBS-limited creep, as this is the expected temperature threshold at which pre-melting starts to dominate ice rheology (see Kuiper et al., 2020). The modified flow law parameters for dislocation creep that are proposed here are shown in Table 2; the flow law parameters for GBS-limited creep are the same as given in Table 1 except for the temperature threshold. For dislocation creep, the material parameter A and the activation energy Q (Table 2) change significantly compared to the values given by Goldsby and Kohlstedt (2001) and Goldsby (2006) shown in Table 1. These modified flow law parameters show a better agreement with the experimental data points for dislocation creep (Fig. 7a) and results in dislocation creep being 15 to 20 times slower compared to the original flow law parameters. We will only show and discuss the results obtained using the flow law parameters given in Table 2.
For both the composite flow law and Glen's flow law, the influence of CPO on strain rate is not taken into account during this study, for example, by a pre-exponential enhancement factor. It is well known that dislocation creep in ice is strongly influenced by CPO development (Azuma, 1994), and it is likely that flow involving basal slip rate-limited by GBS is also strongly influenced by CPO. The effect of CPO development on the grain-size-sensitive mechanisms cannot be included yet as experimental data are lacking.
As noted in the introduction, we did not include any grain size evolution in the model, so the model simply applies to the current grain sizes found in the NEEM ice core. It is well known that grain size and grain size distributions are not fixed parameters in ice depending on the recrystallization mechanisms and on parameters such as stress, strain and temperature (Wilson et al., 2014; Faria et al., 2014b; Peternell et al., 2019). The grain size produced by dynamic recrystallization will scale with the stress (Jacka and Li, 1994). As larger grain sizes are produced at lower stress, dynamic recrystallization can limit the importance of GSS creep (de Bresser et al., 2001). The grain sizes in the GRIP ice core from Greenland and the Byrd ice core from the Antarctic are smaller than the stress–grain size relationship and the GSI-GSS transitions (Goldsby and Kohlstedt, 2002, Fig. 2; Goldsby, 2006, Fig. 60.5) indicating that GSS creep is potentially favored in the upper sections of polar ice sheets compared to the coarser-grained deeper ice.
Figure 8a and b show the strain rate per grain size class and the contribution of the two deformation mechanisms (Eq. 6) for an ice core section at 921 m depth (see detail in Fig. 2a). This ice core section is located in the middle of the Holocene ice and has a relatively high variation in grain size. Since dislocation creep is a GSI mechanism, the strain rate produced by this deformation mechanism is the same for each grain size class in the microscale constant stress model (Fig. 8a). GBS-limited creep shows faster strain rates than dislocation creep for all grain size classes and strongly decreases in strain rate with increasing grain size, which is consistent with the inverse relationship to grain size given in Eq. (3). The volume contribution of each grain size class (black bars in Fig. 8a and b) is used in Eq. (8) to calculate the bulk strain rate for this ice core section and in Eq. (10) to iteratively calculate the stress supported by each grain size class.
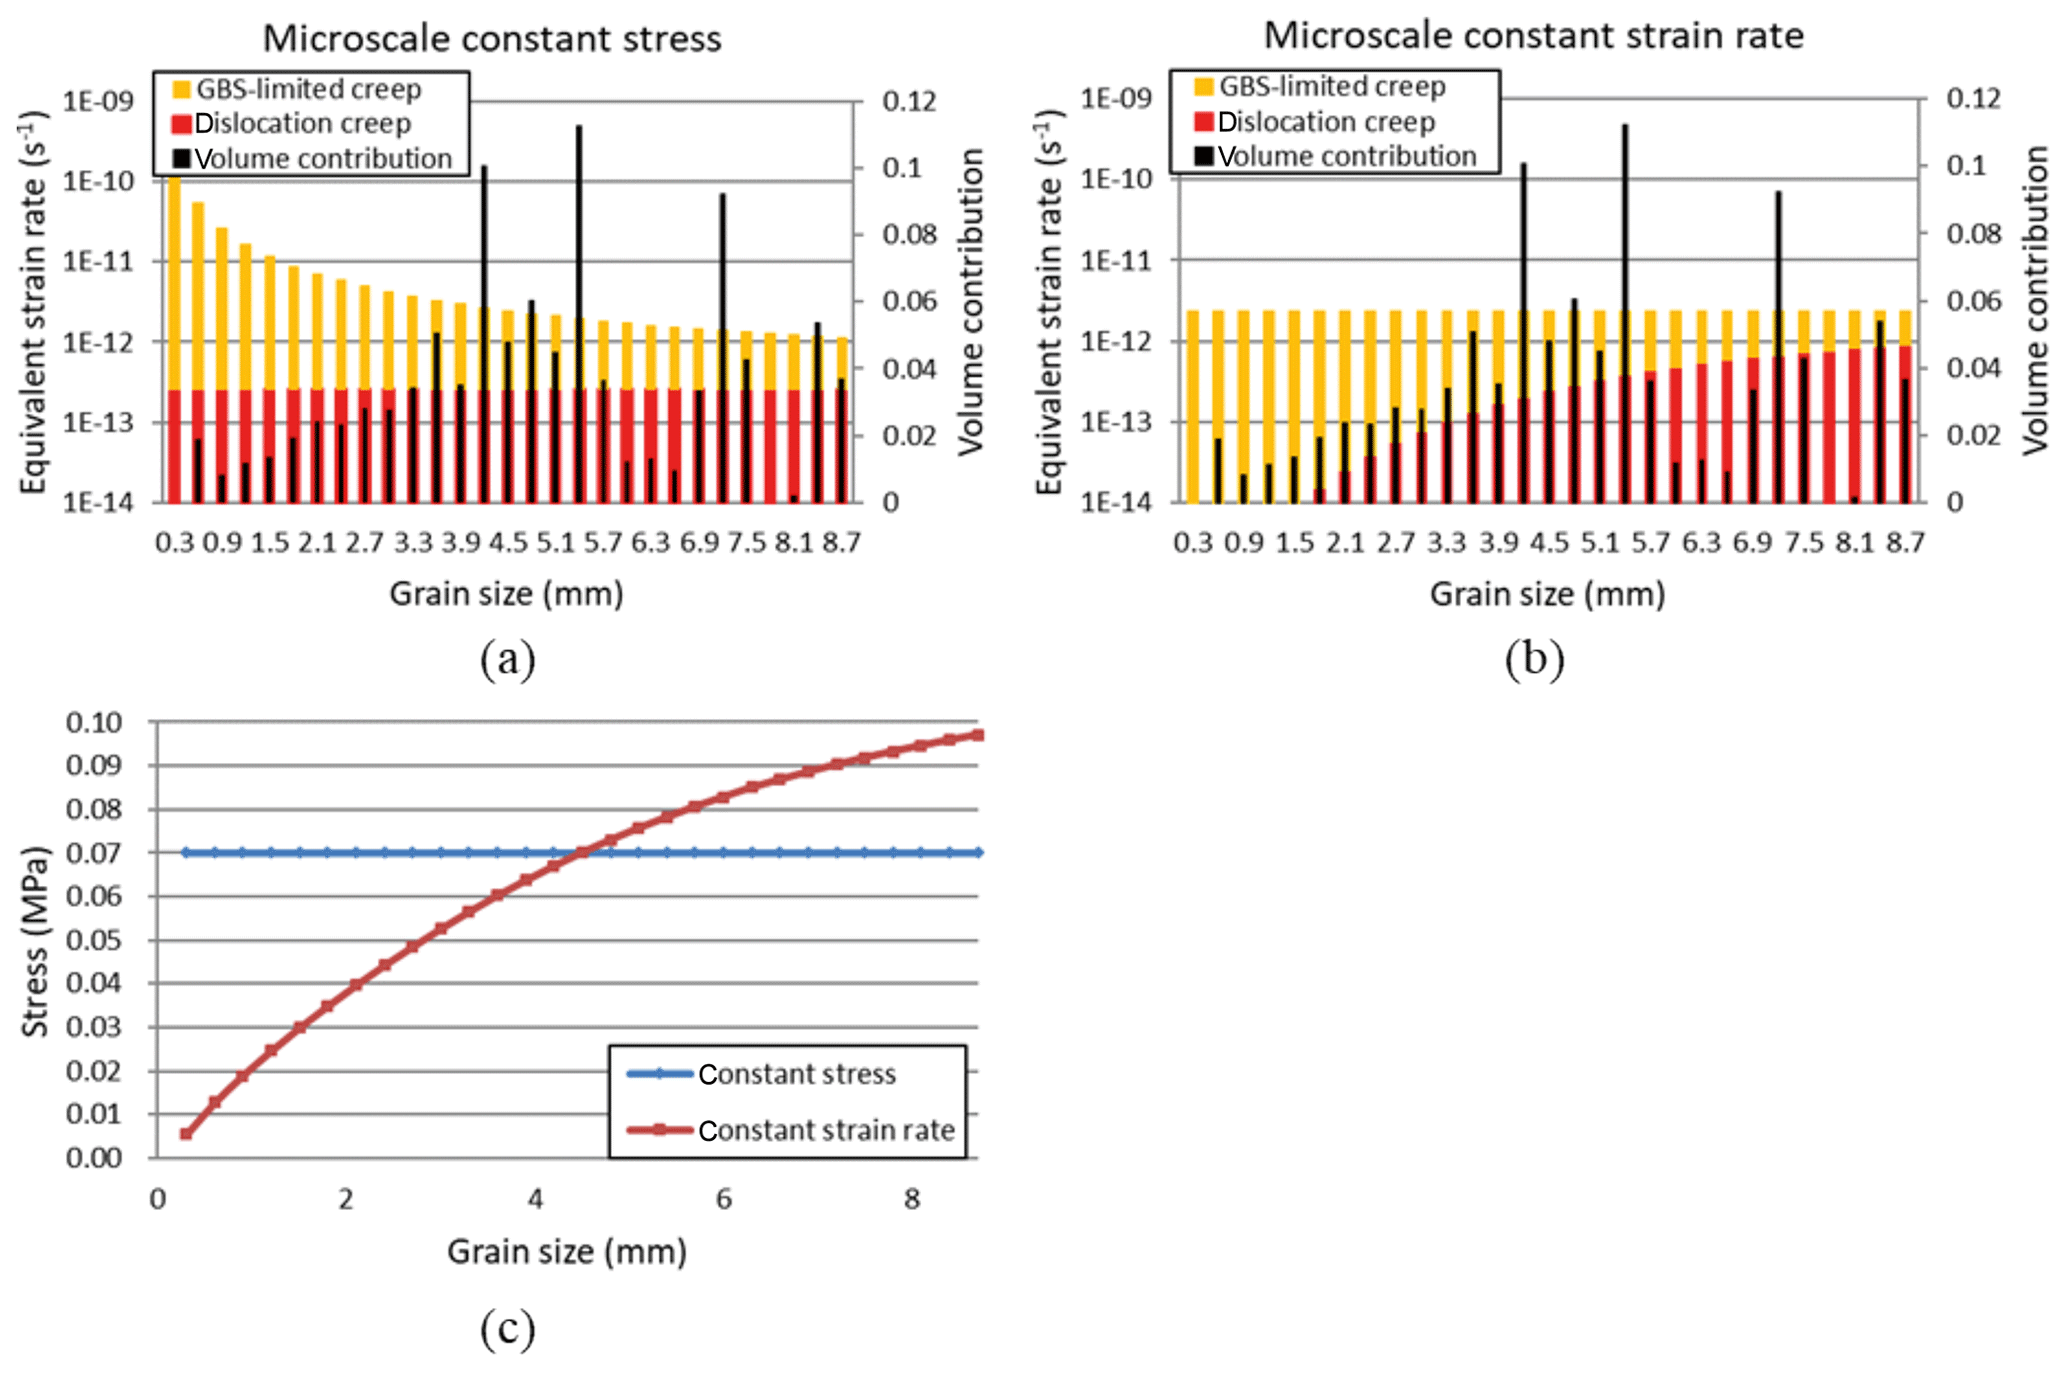
Figure 8Grain size class versus log strain rate for an ice core section at 921 m depth for (a) the microscale constant stress model, (b) the microscale constant strain rate model and (c) the stress supported by each grain size class of the grain size distribution. The results were calculated using the flow law parameters in Table 2. The bulk strain rate for this ice core section using the microscale constant stress and microscale constant strain rate model following Eqs. (7) to (10) are and s−1, respectively.
The total strain rate produced by each grain size class is set to be the same for the microscale constant strain rate model (Fig. 8b). The relative contribution of each deformation mechanism differs between grain size classes. GBS-limited creep is the dominant deformation mechanism for the smallest grains, whereas dislocation creep becomes increasingly more important for classes with larger grain sizes. However, even for the largest grains in this ice core section the strain rate produced by GBS-limited creep is still slightly larger than the strain rate produced by dislocation creep.
The stress supported per grain size class for the microscale constant stress and microscale constant strain rate model for the composite flow law is shown in Fig. 8c. The stress supported per grain size class using the microscale constant strain rate model is used in Eq. (10) to iteratively calculate the stress in the bulk material of the ice core section. The smallest grain size classes support only a small amount of stress, since they are more sensitive to GBS-limited creep. As a consequence, the larger grains support more stress and activate a significant amount of dislocation creep.
Figure 9 shows plots of the equivalent strain rate as a function of depth for Glen's flow law and the composite flow law with its two different deformation mechanisms and the three different model end-members calculated using the modified flow law parameters for dislocation creep (Table 2) and the original parameters for GBS-limited creep (Table 1). The contribution of GBS-limited creep to bulk strain rate is also shown. The temperature input for all the models is shown in Fig. 1c. The results using the full grain size distribution with the microscale constant stress model (Fig. 9a) and the microscale constant strain rate model with the grain size distribution (Fig. 9b) are shown, as well as the results using the mean grain size model (Fig. 9c). All models show similarities, such as (i) a relatively constant strain rate between 400 and 1400 m depth, (ii) a strain rate increase below 1400 m depth and (iii) a higher strain rate for Glen's flow law compared to the composite flow law along the entire depth range down to 2207 m of the NEEM ice core. In all of the three model end-members, dislocation creep hardly contributes to the overall strain. The calculated strain rate for GBS-limited creep and the composite flow law both show a more variable strain rate below 1400 m. This depth coincides with the transition from the coarse-grained Holocene ice to the finer-grained Glacial ice and with an increase in temperature (Fig. 1c). Two strain rate peaks occur at about 1980 and 2100 m depth and show a two- to three-fold increase in strain rate compared to the mean strain rate in the Glacial ice predicted by the composite flow law.

Figure 9(a) Results for the Holocene and Glacial ice for Glen's flow law (purple, the same in a, b, c) and the composite flow law (blue) using the flow law parameters in Table 2, which consist of dislocation creep (red) and GBS-limited creep (green), using (a) the microscale constant stress model with the grain size distribution, (b) the microscale constant strain rate model with the grain size distribution and (c) the composite flow law with the average grain size data. The contribution of GBS-limited creep to bulk strain rate for all three model end-members is shown. A constant effective stress of 0.07 MPa was used for all figures.
The difference between the strain rates of GBS-limited creep and dislocation creep in the Holocene ice is smaller for the microscale constant strain rate model than for the microscale constant stress model and the mean grain size model. Compared to the microscale constant stress model, the microscale constant strain rate model predicts slightly lower absolute strain rates from GBS-limited creep along the entire upper 2207 m depth of the NEEM ice core (Fig. 9a, b) and especially below 1419 m depth, where the strain rate is more variable. Using a mean grain size produces a weaker variability in strain rate with depth than the two model end-members using a grain size distribution (Fig. 9c). The average strain rate in the Holocene ice is about 60 % higher using the microscale constant stress model compared to the microscale constant strain rate model. For the Glacial ice, this difference between the two model end-members is about 40 %.
To study the dominant deformation mechanism of the composite flow law at different stress levels and its comparison in strain rate to Glen's flow law, both flow laws were forced at different stress values, which roughly cover the range of equivalent stresses in the Greenland and Antarctic ice sheets (Sergienko et al., 2014). Figure 10a shows the calculated strain rate for dislocation creep and GBS-limited creep using the grain size distribution with the microscale constant stress model and the temperature profile of NEEM, forced with different constant stress values. At the lowest stress of 0.01 MPa, the strain rate produced by dislocation creep is about 3 orders of magnitude lower than the strain rate produced by GBS-limited creep. With increasing stress, the contribution of dislocation creep to the overall strain rate becomes bigger, and at a stress of 0.25 MPa dislocation creep and GBS-limited creep have roughly the same contribution. The strain rate produced by the dislocation creep mechanism at 0.50 MPa is roughly 5 times higher than for GBS-limited creep. A similar graph showing the calculated strain rate for the composite flow law and Glen's flow law is shown in Fig. 10b. At the lowest stress of 0.01 MPa the composite flow law predicts a slightly higher strain rate compared to Glen's flow law. However, with increasing stress, Glen's flow law predicts progressively higher strain rates than the composite flow law. At the highest stress of 0.50 MPa, the strain rate predicted by Glen's flow law is almost an order of magnitude higher than the strain rate predicted by the composite flow law.
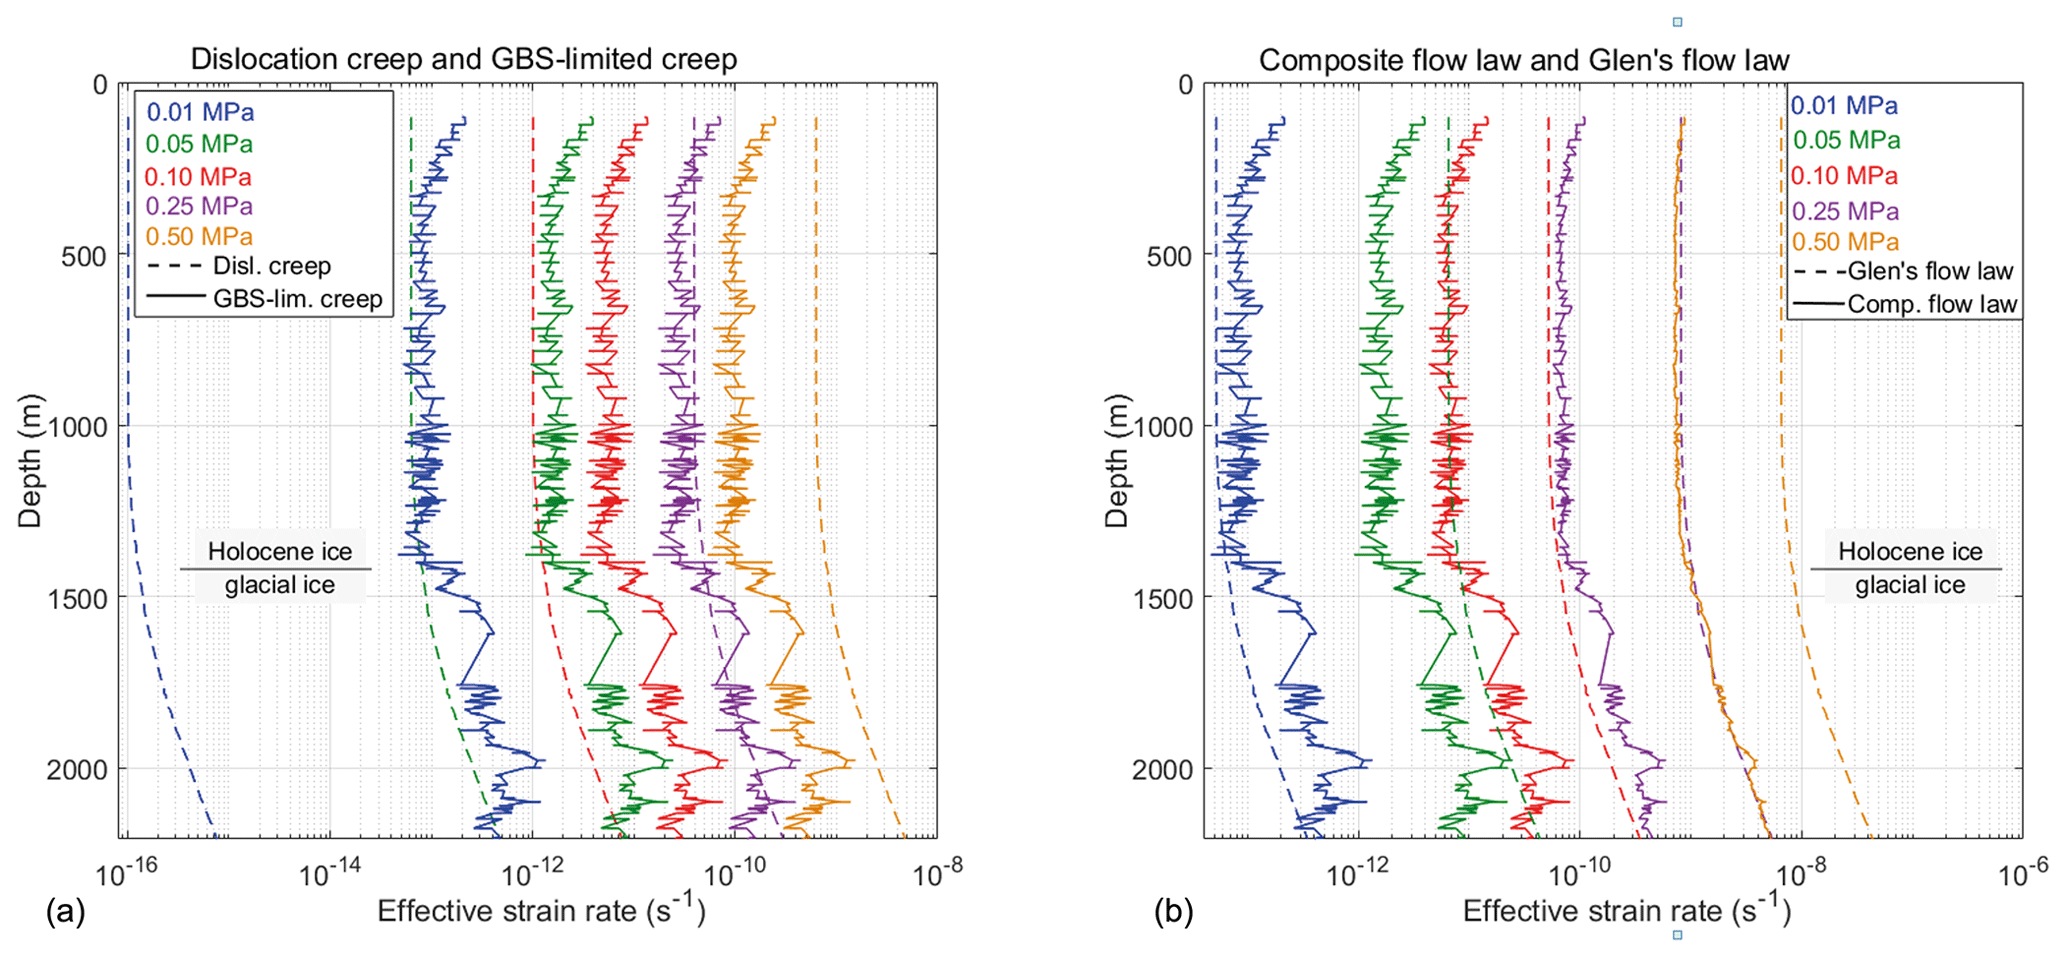
Figure 10Stress sensitivity of the deformation mechanisms in the Holocene and Glacial ice. (a) Strain rates predicted by the dislocation creep mechanism (dotted lines) and GBS-limited creep (continuous lines) at different constant stress values. For readability, only the results of the microscale constant stress model are shown. (b) Plot of Glen's flow law (dotted lines) and the composite flow law (continuous lines). For (a) and (b) the temperature profile and the grain size distribution of the NEEM ice core were used in combination with the flow law parameters in Table 2.
We will first discuss the results from the different microscale end-member models for distributed grain sizes in Sect. 5.1, then compare the results of models with a distributed grain size against a mean grain size in Sect. 5.2. The effect of stress levels on predicted strain rates will be discussed in Sect. 5.3 followed by a consideration of the variation in predicted strain rates with depth in Sect. 5.4. In the last section, the predictions of the composite flow law are compared with the deformation mechanisms indicated by the microstructures and CPOs from the NEEM ice core.
5.1 Comparison of microscale constant stress versus microscale constant strain rate model
The main difference between the microscale constant stress model and the microscale constant strain rate model is that the microscale constant stress model allows the smallest grains to deform more than an order of magnitude faster than the larger grains (Fig. 8a), while this is not possible in the microscale constant strain rate model (Fig. 8b). For the microscale constant strain rate model, the strain rate is set to be the same for each grain size class. GBS-limited creep and dislocation creep are therefore codependent, since the sum of the two deformation mechanisms has to add up to a certain strain rate (Eq. 6). Consequently, since the strain rate produced by GBS-limited creep decreases with increasing grain size, the contribution of dislocation creep to bulk strain rate increases with grain size. This effect is shown in Fig. 8b, where the bulk strain rate is similar for each grain size class but the contribution of dislocation creep to the bulk strain rate increases with increasing grain size. Due to this codependence of dislocation creep and GBS-limited creep in the microscale constant strain rate model, the strain rate produced by dislocation creep varies slightly with depth, as is shown in Fig. 9b.
For most ice core samples, the finest grain size classes contribute only slightly to the bulk volume of the material, as is also the case for the ice core section at 921 m depth shown in Fig. 8. For this particular ice core section, the smallest grain size classes (<0.9 mm) make up only 2.7 % of the bulk volume. Therefore, the contribution of these smallest grain size classes to the bulk strain rate remains limited. Nevertheless, the average strain rate in the Holocene ice calculated using the microscale constant stress model is 60 % higher than the average strain rate produced by the microscale constant strain rate model. In the Glacial ice, where the grain sizes are finer and grain size distributions are more uniform, the difference in strain rates between the microscale constant stress and microscale constant strain rate model is 40 %. These differences are remarkably small compared to results obtained for the two model end-members in wet olivine (Ter Heege et al., 2004) and calcite mylonites (Herwegh et al., 2005). In wet olivine, the bulk strain rate could be up to an order of magnitude higher for the microscale constant stress model compared to the microscale constant strain rate model for samples with a high standard deviation in grain size distribution. This indicates that the grain size variation measured within each of the 90×55 mm ice core sections is not large enough to change the strain rate by an order of magnitude as observed for wet olivine.
By assuming that each grain deforms by the same amount in the microscale constant strain rate model, the strain heterogeneities that have often been observed in ice core microstructures (e.g., Obbard et al., 2006; Weikusat et al., 2009a; Faria et al., 2014a; Piazolo et al., 2015; Jansen et al., 2016) are ignored. Contrary to the microscale constant stress model, where the contribution of the finest grains is relatively large compared to their volume contribution, the microscale constant strain rate model probably overestimates the role of the larger grains on the bulk strain rate in the ice core section. Therefore, the two models represent the lower and upper limit of deformation behavior of a polycrystal with a distributed grain size (Ter Heege et al., 2004). Natural deformation in ice sheets is likely to involve microscale variations in stress and strain rate (e.g., Faria et al., 2014a; Piazolo et al., 2015).
5.2 Comparing grain size distribution model end-members with the mean grain size model
The difference in calculated strain rate between using a grain size distribution with the microscale constant strain rate model and the mean grain size model is relatively small (Fig. 9b and c). A single mean grain size eliminates the effect that smaller grains have on the bulk strain rate. However, the effect of the smaller grains on strain rate in the microscale constant strain rate model is also limited since all grain size classes deform by the same amount, and thus the difference in bulk strain rate between the microscale constant strain rate model and mean grain size model is small. The much larger computational expense of the microscale constant strain rate model and the small difference in calculated strain with the mean grain size model argues for using a mean grain size model over a microscale constant strain rate model when modeling GSS behavior in polar ice sheets.
The difference in calculated strain rate between the microscale constant stress model and using a mean grain size model is larger than the difference between the microscale constant strain rate model and the mean grain size model. The strain rate peaks predicted in the layers at about 1980 m and 2100 m depth are 2 to 3 times larger for the microscale constant stress model compared to the mean grain size model (Fig. 9a, c). This difference is mainly caused by the effect that the finest grains have on the bulk strain rate in the microscale constant stress model (Fig. 8a).
5.3 Effect of stress magnitude on predicted deformation mechanisms
Figure 10a shows that, at equivalent stresses below 0.25 MPa, the strain rate produced by GBS-limited creep is higher than the strain rate produced by dislocation creep, while at an equivalent stress of 0.50 MPa the strain rate produced by dislocation creep is higher than GBS-limited creep. The stress sensitivity of dislocation creep is controlled by a stress exponent of n=4, while the stress sensitivity of GBS-limited creep is controlled by n=1.8. Thus, if temperature and grain size remain constant, dislocation creep becomes progressively stronger relative to GBS-limited creep with increasing stress. However, with the temperature profile and grain size data from the upper 2207 m depth in the NEEM ice core, an equivalent stress of about 0.25 MPa is required for dislocation creep to become as strong as GBS-limited creep. Such a high stress is not reached in the NEEM ice core, as the best estimate gives an equivalent stress of 0.07 MPa. However, the driving stress progressively increases from the ice domes and divides towards the margins of the ice sheet, reaching a driving stress of about 0.30 MPa at the margins of the ice sheets (Sergienko et al., 2014). A driving stress of 0.30 MPa corresponds to an equivalent stress of about 0.50 MPa (Eq. 12). Therefore, if the temperature and grain size along the NEEM ice core is comparable to the ice along the margins of the ice sheet, the dominant deformation mechanism could switch from GBS-limited creep near domes and divides to dislocation creep near the margins of the ice sheets.
Interestingly, the stress of 0.10–0.50 MPa is within the range of stresses (0.1–1.0 MPa) that was used during the deformation experiments of Glen (1952, 1955). The grain size 1–2 mm reported by Glen (1952) is similar to the grain size in the Glacial ice of the NEEM ice core. The results in Fig. 10a for 0.25 MPa show that the contribution of dislocation creep and GBS-limited creep to the total strain rate in the Glacial ice is roughly equal. This result supports the hypothesis of Durham et al. (2001, 2010), Goldsby and Kohlstedt (2001, 2002), Goldsby (2006), and Bons et al. (2018) that the stress exponent of n=3 found by Glen (1952, 1955) is the result of collecting data at a transition regime between n=4 for dislocation creep and n=1.8 for GBS-limited creep. Empirical evidence for a change in stress exponent in ice sheets was found by Pettit and Waddington (2003). These authors showed that a low stress exponent is best for describing ice deformation at low stress, while a higher stress exponent is required in high-stress environments.
Comparison of the results using the composite flow law with Glen's flow law at different equivalent stresses (Fig. 10b) shows that at a stress of 0.01 MPa the composite flow law predicts a higher strain rate than Glen's flow law in most of the upper 2207 m depth in the NEEM ice core. In the finest-grained parts of the Glacial ice, the composite flow law predicts a strain rate that is about 5 times faster than predicted by Glen's flow law at the low equivalent stress of 0.01 MPa. As the equivalent stress increases, Glen's flow law becomes progressively faster relative to the composite flow law. Since the dominant deformation mechanism of the composite flow law at low equivalent stress is GBS-limited creep (Fig. 10a), the effective stress exponent will also be close to the stress exponent for GBS-limited creep (n=1.8). Glen's flow law, driven by a stress exponent of n=3, therefore shows a stronger increase in strain rate with increasing stress than the composite flow law. Consequently, at a driving stress of 0.25 MPa, Glen's flow law predicts a strain rate that is about an order of magnitude faster than the strain rate predicted by the composite flow law. As the contribution of dislocation creep in the composite flow law increases with increasing stress (Fig. 10a), the sensitivity of the bulk strain rate to grain size variation decreases with increasing stress since dislocation creep is insensitive to grain size. This effect can be seen in Fig. 10b, where the strain rate peaks and the layer-to-layer variability predicted by the composite flow law become weaker with increasing stress.
5.4 Variability of predicted strain rates with depth
Levels of high borehole closure and borehole tilting have been observed in many polar ice cores and often coincide with high-impurity content and small grain sizes (e.g., Fisher and Koerner, 1986; Paterson, 1994). These depth levels can be seen as layers with a different microstructure than the surrounding ice and therefore deform at a higher strain rate. The reason that small grain size and high-impurity content coincide is still not well understood (Eichler et al., 2017). The results using the composite flow law suggest that prominent soft layers, i.e., layers with a high strain rate, could be present at two depths of about 1980 and 2100 m in the NEEM ice core. The predictions from the composite flow law are consistent with preliminary results from ongoing borehole tilt measurements at NEEM (Dahl-Jansen et al., 2016; Greve et al., 2017; Dorthe Dahl-Jensen, personal communication, 2019). These soft layers are located in the lower part of the NEEM ice core, which is dominated by simple shear (Dansgaard and Johnson, 1969; Montagnat et al., 2014). The soft layers can therefore be seen as depths where a high rate of simple shear occurs, instead of layers with enhanced extrusion (Waddington, 2010). It is likely that not all soft layers that are caused by finer grains have been identified in the model, since the available sampling rate of 615 LM images along 2207 m depth of the NEEM ice core leaves many depth intervals not studied. Glen's flow law is unable to predict soft layers related to grain size variations since the flow law is forced by stress and temperature only. The effects of anisotropy, grain size and/or impurity content on strain rate are often incorporated in the form of an enhancement factor (Azuma, 1994; Thorsteinsson et al., 1999). However, information about the softening effects, like grain size, are needed in order to incorporate the enhancement factor with the right value and at the right depth. This can only be achieved by a flow law that explicitly describes GSS deformation, such as the flow laws of Goldsby and Kohlstedt (2001) or Saruya et al. (2019). GSS deformation is also expected for flow involving basal slip accommodated by grain boundary migration (Montagnant et al., 2003), although there is no calibrated quantitative flow law for this mechanism.
Another reason why soft layers might have been missed during this study is that by taking the grain size distribution of the 90×55 mm LM images, the fine grain size of shear bands, kink bands (tilted lattice bands) or cloudy bands (Faria et al., 2010, 2014a; Jansen et al., 2016) could have been averaged out. Often, these bands have a vertical thickness that is much thinner than the 90 mm height of the LM images (see examples in Fig. 2b; Fig. 4 in Faria et al., 2014b). Therefore, it is likely that many soft layers in the Glacial ice of the NEEM ice core have not been identified in this study or have been averaged out over the 90×55 mm LM images.
5.5 Comparison of model predictions with deformation mechanisms inferred from NEEM microstructures and CPO
The microstructures and CPOs in the NEEM core provide constraints on the active deformation mechanisms. The microstructures in the Holocene ice (Fig. 2a) with irregular grain boundaries indicate strain-induced grain boundary migration (SIBM, using the terminology of Faria et al., 2014b), and subgrain development in the grains indicates that dislocation creep and dynamic recrystallization are important (Montagnat et al., 2014; Weikusat et al., 2017; Steinbach et al., 2017). The microstructures in the Holocene ice are clearly different from the microstructure developed in experimental samples by GSS creep (Goldsby and Kohlstedt, 1997; Saruya et al., 2019). So the results from the composite flow model (Fig. 9) are inconsistent with the microstructures in the Holocene ice.
In the Glacial ice, different microstructures occur and the grain size is smaller than in the Holocene ice. In the Glacial ice, grain boundaries are straight to smooth and the grain aspect ratio found in subhorizontal fine-grained bands (Fig. 2b) is similar to that reported by Goldsby and Kohlstedt (1997, Fig. 6 therein) in the GBS-limited creep experiments. Also, similar to Goldsby and Kohlstedt (1997), aligned grain boundaries and numerous quadruple junctions were found (Fig. 2b). These flattened grains, aligned grain boundaries and quadruple junctions were only found in the finest-grained parts of the Glacial ice, which could well indicate that these layers have deformed by GBS, possibly enforced by micro-shear (Faria et al., 2014b).
The c axis eigenvalues show a minor variability in the Glacial ice of the NEEM ice core (Eichler et al., 2013; Montagnat et al., 2014), where the layers of high GSS creep strain rate are predicted. The strong development of CPO and the development of substructures indicate that large amounts of strain are accommodated by basal slip of dislocations in the NEEM ice core. This may seem to be in disagreement with the conclusion that GSS creep is the dominant deformation mechanism. A random or weak CPO is usually associated with dominant GBS deformation. However, the paradigm that the presence of a strong CPO rules out significant GBS is based on studies of isotropic metals and may not always apply to anisotropic materials like minerals and ice (Hansen et al., 2011, 2012). In their original paper, Goldsby and Kohlstedt (1997) proposed that GBS was the dominant strain producing mechanism in the n=2 p=1.4 regime. Later Goldsby and Kohlstedt (2001) and Goldsby (2006) proposed that as basal slip and GBS were sequential processes, the strain would be mainly accommodated by basal slip with GBS as the rate controlling process. Durham and Stern (2001) made the important point that the composite flow equation for sequential mechanisms embedded in Eqs. (2) to (5) is based on the assertion that the sequential mechanisms accommodate the same amount of strain. So if creep in ice does occur by sequential basal slip and GBS then it is likely that a CPO will develop during high strain deformation. A strong CPO is expected to develop in the case of basal slip accommodated by grain boundary migration (Montagnat and Duval, 2000) and for the deformation mechanism proposed by Saruya et al. (2019) involving dislocation creep enhanced by grain boundaries acting as sinks for dislocations. Ice deforming by the mechanism proposed by Saruya et al. (2019) would be mainly deforming by basal slip and thus would develop a strong CPO. The microstructures reported by Saruya et al. (2019) in the grain-size-sensitive regime are very similar to those found in the fine-grained Glacial ice of the NEEM core (Shigeyama et al., 2019).
For both the composite flow law and Glen's flow law, the influence of CPO on strain rate is not taken into account during this study, for example, by a pre-exponential enhancement factor. In bed-parallel simple shear, a strong vertical single maximum CPO produces fewer strain incompatibilities at grain boundaries by aligning the basal planes of the ice crystals in the direction of the flow. This means that less accommodation of basal slip is required by either non-basal slip or GBS per unit of strain, which causes the strain rate to increase compared to an isotropic ice sample. The strain rate enhancement caused by a well-developed CPO is about 2.3 times stronger in simple shear than in pure shear (Budd and Jacka, 1989; Treverrow et al., 2012). Therefore, the difference in equivalent strain rate between the Holocene and the Glacial ice is probably larger than shown in Fig. 9, since the Holocene ice is predominantly deforming by pure shear, while the Glacial ice is predominantly deforming by simple shear (Montagnat et al., 2014). Both deformation mechanisms of the composite flow law assume basal slip to be the dominant strain-producing mechanism and being rate-limited by either grain boundary sliding or non-basal slip. We suggest that both dislocation creep and GSS creep are both enhanced by a strong single maximum CPO as a strong alignment of the dominant slip system produces fewer strain incompatibilities at grain boundaries and triple junctions.
We will now consider the discrepancy between the model predictions and the deformation mechanisms indicated by the NEEM Holocene microstructures. The results from the composite flow law model shown in Fig. 9 suggest that ice deformation in the upper 2207 m depth of the NEEM ice core is almost entirely produced by GSS creep. However, there is evidence that significant non-basal slip is activated in the polar ice sheets (e.g., Weikusat et al., 2009b, 2011, 2017). Goldsby (2006) compared the results of the composite flow law using the original flow law parameters (Table 1) to the grain size and strain rate variability with depth in the basal layer of the Meserve glacier, Antarctica (Cuffey et al., 2000b). It was found that the composite flow law overestimates the contribution of GBS-limited creep in the basal part of the Meserve glacier. The in situ temperature (256 K) and the estimated shear stress (0.05 MPa) in the basal layer of the Meserve glacier are fairly similar to the temperature and stress estimated for the Glacial ice in the NEEM ice core (Fig. 1c). With the modified flow law parameters for dislocation creep (Table 2), the calculated contribution of GBS-limited creep to total strain rate would be close to 100 %, which is similar to the results with the NEEM ice core (Fig. 9). Therefore, it is proposed that the composite flow law severely underestimates the strain rate produced by dislocation creep, as high stresses of about 0.25 MPa are required for dislocation creep to become roughly as fast as GBS-limited creep in the NEEM ice core (Fig. 10a). This while the large and interlocking grains in the Holocene ice of the NEEM ice core (Fig. 2a) argue against GBS as the dominant rate limiting mechanism for basal slip. It is interesting to note that the constant strain rate model predicts a larger role for dislocation creep so this model may be more appropriate for the shallow ice that is deforming mainly by pure shear, with all layers deforming at the same strain rate.
The deformation experiments in the GSI and GSS regime of Goldsby and Kohlstedt (1997, 2001) were performed at low temperature in order to prevent grain growth during the deformation experiments. Significant grain growth during the deformation experiments would have complicated the derivation of the flow law parameters in the GSS creep regime. Goldsby and Kohlstedt (1997) stated that “grains in deformed samples were equiaxed with straight grain boundaries; irregular grain boundaries typical of dynamical recrystallization by grain boundary migration were not observed”. However, suppressing SIBM during the deformation experiments also meant that SIBM could not remove strain incompatibilities at grain boundaries and/or triple junctions. Recrystallization by SIBM is considered an important softening mechanism in polar ice (e.g., Duval et al., 2000; Montagnat and Duval, 2000; 2004; Wilson et al., 2014). It is well established that SIBM is active at all depths in polar ice cores (e.g., Weikusat et al., 2009a), although the amount of SIBM varies strongly with depth (e.g., Duval and Castelnau, 1995; Kipfstuhl et al., 2009; Faria et al., 2014a). In the NEEM ice core, SIBM is probably less extensive in the finer-grained Glacial ice than in the coarser-grained Holocene ice, which is supported by the lower grain boundary curvature in the Glacial ice (Binder, 2014). It is therefore proposed that SIBM is an important softening mechanism in the Holocene ice of the NEEM ice core, while it was suppressed during the deformation experiments of Goldsby and Kohlstedt (1997, 2001). Therefore, the ice during the GSI deformation experiments of Goldsby and Kohlstedt (2001) was probably relatively hard, compared to natural polar ice, as the synthetic ice in experiments was not softened by SIBM. This would have affected the flow law parameters that were derived from the results of these deformation experiments, potentially underestimating dislocation creep strain rates when using the composite flow law.
In order to study the effect of grain size and grain size variation with depth in polar ice sheets, the composite flow law of Goldsby and Kohlstedt (2001) was used with temperature and grain size data from the upper 2207 m depth in the NEEM ice core. A constant equivalent stress with depth was assumed, with a magnitude of 0.07 MPa constrained from the surface slope and layer thinning data from NEEM. GSS deformation was described using a mean grain size and a grain size distribution in combination with two model end-members: the microscale constant stress model and the microscale constant strain rate model. A modification of the flow law parameters for dislocation creep (GSI) in the composite flow law showed a better fit with the experimental data obtained during the deformation experiments of Goldsby and Kohlstedt (1997, 2001).
The difference between the model end-members is relatively small, with the microscale constant stress model predicting higher strain rates than the microscale constant strain rate model and using a mean grain size. The results using the modified flow law parameters and a constant equivalent stress of 0.07 MPa, predict that GSS creep produces almost all deformation in the upper 2207 m depth in the NEEM ice core. A strain rate increase, mainly resulting from a reduction in grain size, is predicted below 1400 m depth for all model end-members. Two depths in the Glacial ice with a higher strain rate, caused by enhanced GSS creep, are predicted at about 1980 and 2100 m depth.
At the grain size and temperature conditions of the NEEM ice core, GSS creep is predicted to be the dominant deformation mechanism over dislocation creep for equivalent stresses up to about 0.25 MPa. At higher stresses, which occur at the edges of polar ice sheets, dislocation creep is dominant over GSS creep. At low stresses of about 0.01 MPa, the composite flow law predicts a faster strain rate than Glen's flow law. However, the stress exponent of Glen's flow law is higher than the effective stress exponent for the composite flow law and therefore the strain rate increase with increasing stress is higher for Glen's flow law than for the composite flow law. At NEEM grain size and temperature conditions, Glen's flow law predicts a higher strain rate than the composite flow law at equivalent stresses higher than 0.05 MPa.
The prediction from the composite flow model that GSS creep is the dominant process at all depths is inconsistent with microstructures in the Holocene ice, indicating that the rate of dislocation creep is underestimated in the model. One possible explanation for this is that recrystallization by SIBM was not active during the experiments of Goldsby and Kohlstedt (1997, 2001), while recrystallization by SIBM is an important softening mechanism in the Holocene ice. In the Glacial ice the microstructures and CPO indicate that large strains are accommodated by basal slip, while the occurrence of straight grain boundaries and quadruple points indicate that GBS may be significant. These features are consistent with GSS creep mechanisms involving large activity of the easy slip system, such as basal slip rate-limited by GBS as proposed by Goldsby and Kohlstedt (2001) or grain-size-enhanced dislocation creep as recently proposed by Saruya et al. (2019). The composite flow law model and the microstructures in the Glacial ice both indicate that the fine-grained layers in the Glacial ice may potentially act as internal preferential sliding zones in the Greenland ice sheet.
The models were calculated using C code and an Excel spreadsheet using the NEEM grain size and temperature data, which are available from Pangaea Data Publisher for Earth & Environmental Science (https://doi.pangaea.de/10.1594/PANGAEA.743296, Kipfstuhl, 2010; https://doi.org/10.1594/PANGAEA.919775, Weikusat at al., 2020a; https://doi.org/10.1594/PANGAEA.920005, Weikusat et al., 2020b), and the flow law parameters used in Table 2.
EJNK prepared the code, data, and setup of simulations and conducted model runs. JHPdB developed the algorithm for the code and provided the initial idea. MRD and GMP supervised and initiated the simulation setups and interpretations. DJ and IW provided ice core samples and data, glaciological background, and data preparation. All authors jointly interpreted results and wrote the manuscript.
The authors declare that they have no conflict of interest.
This work has been carried out as part of the Helmholtz Junior Research group “The effect of deformation mechanisms for ice sheet dynamics” (VH-NG-802). The NEEM light microscope data used in this study has been made available by http://www.pangaea.de (last access: 10 July 2020). The authors would like to thank Sepp Kipfstuhl and Tobias Binder for providing data and encouraging discussions. The authors would like to thank all the NEEM Community members who were involved in the preparation of the physical properties samples in the field. This work is a contribution to the NEEM ice core project, which is directed and organized by the Center of Ice and Climate at the Niels Bohr Institute and the US NSF, Office of Polar Programs. It is supported by funding agencies and institutions in Belgium (FNRS-CFB and FWO), Canada (NRCan/GSC), China (CAS), Denmark (FIST), France (IPEV, CNRS/INSU, CEA and ANR), Germany (AWI), Iceland (RannIs), Japan (NIPR), South Korea (KOPRI), the Netherlands (NWO/ALW), Sweden (VR), Switzerland (SNF), the United Kingdom (NERC) and the USA (US NSF, Office of Polar Programs). Thanks to Dave Prior, Chris Wilson and an anonymous reviewer for their detailed reviews and helpful comments.
This research has been supported by the Hermann von Helmholtz-Gemeinschaft Deutscher Forschungszentren e.V. and the Helmholtz Foundation (grant no. VH-NG-802).
This paper was edited by Robert Arthern and reviewed by David Prior, Chris Wilson and one anonymous referee.
Alley, R. B.: Flow-law hypothesis for ice-sheet modelling, J. Glaciol., 38, 245–256, 1992.
Alley, R. B., Clark, P. U., Huybrechts, P., and Joughin, I.: Ice-Sheet and Sea-Level changes, Science, 310, 456–460, https://doi.org/10.1126/science.1114613, 2005.
Azuma, N.: A flow law for anisotropic ice and its application to ice sheets, Earth Planet. Sc. Lett., 128, 601–614, https://doi.org/10.1016/0012-821X(94)90173-2, 1994.
Baker, R. W.: Textural and Crystal-Fabric Anisotropies and the Flow of Ice Masses, Science, New Series, 211, 1043–1044, 1981.
Barnes, P., Tabor, D., and Walker, J. C. F.: The friction and creep of polycrystalline ice, Proceedings Royal Society London A, 324, 127–155, 1971.
Binder, T.: Measurements of grain boundary networks in deep polar ice cores – A digital image processing approach, PhD thesis, University of Heidelberg, Germany, https://doi.org/10.11588/heidok.00016891, 2014.
Binder, T., Weikusat, I., Freitag, J., Garbe, C. S., Wagenbach, D., and Kipfstuhl, S.: Microstructure through an ice sheet, Mater. Sci. Forum, 753, 481–484, https://doi.org/10.4028/www.scientific.net/MSF.753.481, 2013.
Bintanja, R.: Glacier Science and environmental change, edited by: Knight, P. G., Blackwell, Oxford, 174–176, 2009.
Bons, P. D., Kleiner, T., Llorens, M.-G., Prior, D. J., Sachau, T., Weikusat, I., and Jansen, D.: Greenland Ice Sheet: Higher Nonlinearity of ice Flow Significantly Reduces Estimated Basal Motion, Geophys. Res. Lett., 45, 1–7, https://doi.org/10.1029/2018GL078356, 2018.
Budd, W. F. and Jacka, T. H.: A review of ice rheology for ice sheet modelling, Cold Reg. Sci. Technol., 16, 107–144, https://doi.org/10.1016/0165-232X(89)90014-1, 1989.
Church, J. A., Clark, P. U., Cazenave, A., Gregory, J. M., Jevrejeva, S., Levermann, A., Merrifield, M. A., Milne, G. A., Nerem, R. S., Nunn, P. D., Payne, A. J., Pfeffer, W. T., Stammer, D., and Unnikrishnan, A. S.: Sea Level Change, in: Climate Change 2013: The Physical Science Basis. Contribution of Working Group I to the Fifth Assessment Report of the Intergovernmental Panel on Climate Change, edited by: Stocker, T. F., Qin, D., Plattner, G.-K., Tignor, M., Allen, S. K., Boschung, J., Nauels, A., Xia, Y., Bex, V., and Midgley, P. M., Cambridge University Press, Cambridge, United Kingdom and New York, NY, USA, 2013.
Cuffey, K. M., Thorsteinsson, T., and Waddington, E. D.: A renewed argument for crystal size control of ice sheet strain rates, J. Geophys. Res., 105, 27889–27894, https://doi.org/10.1029/2000JB900270, 2000a.
Cuffey, K. M., Conway, H., Gades, A., Hallet, B., Raymond, C. F., and Whitlow, S.: Deformation properties of subfreezing glacier ice: Role of crystal size, chemical impurities, and rock particles inferred from in situ measurements, J. Geophys. Res., 105, 27895–27915, https://doi.org/10.1029/2001JB900014, 2000b.
Dahl-Jensen, D.: Two-dimensional thermo-mechanical modelling of flow and depth-age profiles near the ice divide in central Greenland, Ann. Glaciol., 12, 31–36, 1989a.
Dahl-Jensen, D.: Steady Thermomechanical flow along two-dimensional flow lines in large grounded ice sheets, J. Geophys. Res., 94, 10355–10362, https://doi.org/10.1029/JB094iB08p10355, 1989b.
Dahl-Jensen, D. and Gundestrup, N. S.: Constitutive properties of ice at Dye 3. Greenland, The Physical Basis of Ice Sheet Modelling, 170, 31–40, 1987.
Dahl-Jensen, D., Azuma, N., Keegan, K., Kipfstuhl, S., Montagnat, M., Panton, C., and Sheldon, S. G.: NEEM flow properties show differences over Dansgaard-Oeschger events, Abstract submission ID: 245 IPICS, 2nd Open Science Conference, 7–11 March 2016, Hobart, Australia, available at: https://static1.squarespace.com/static/5459b25de4b00ee921cd006d/t/56dce081c2ea51eadac2f4e1/1457315995517/IPICS+2016+-+Abstracts.pdf (last access: 10 July 2020), 2016.
Dansgaard, W. and Johnsen, S. J.: A flow model and a time scale for the ice core from camp century, Greenland, J. Glaciol., 8, 215–223, https://doi.org/10.3189/S0022143000031208, 1969.
de Bresser, J. H. P., Ter Heege, J. H., and Spiers, C. J.: Grain size reduction by dynamic recrystallization can it result in major rheological weakening?, Int. J. Earth Sci., 90, 28–45, 2001.
De La Chapelle, S., Castelnau, O., Lipenkov, V., and Duval, P.: Dynamic recrystallization and texture development in ice as revealed by the study of deep ice cores in Antarctica and Greenland, J. Geophys. Res., 103, 5091–5105, 1998.
De La Chapelle, S., Milsch, H., Castelnau, O., and Duval, P.: Compressive creep of ice containing a liquid intergranular phase: rate-controlling processes in the dislocation creep regime, Geophys. Res. Lett., 26, 251–254, https://doi.org/10.1029/1998GL900289, 1999.
Durham, W. B. and Stern, L. A.: Rheological properties of water ice-applications to satellites of the outer planets, Annu. Rev. Earth Pl. Sc., 29, 295–330, 2001.
Durham, W. B., Heard, H. C., and Kirby, S. H.: Experimental deformation of polycrystalline H2O ice at high-pressure and low-temperature – preliminary-results, J. Geophys. Res., 88, B377–B392, 1983.
Durham, W. B., Stern, L. A., and Kirby, S. H.: Rheology of ice I at low stress and elevated confining pressure, J. Geophys. Res. Sol.-Ea., 106, 11031–11042, https://doi.org/10.1029/2000JB900446, 2001.
Durham, W. B., Prieto-Ballesteros, O., Goldsby, D. L., and Kargel, J. S.: Rheological and Thermal Properties of Icy Materials, Space Sci. Rev., 153, 273–298, https://doi.org/10.1007/s11214-009-9619-1, 2010.
Duval, P. and Castelnau, O.: Dynamic recrystallization of ice in polar ice sheets, J. Phys. III, 5, 197–205, https://doi.org/10.1051/jp4:1995317, 1995.
Duval, P. and Montagnat, M.: Comment on “Superplastic deformation of ice: Experimental observations” by D. L. Goldsby and D. L. Kohlstedt, J. Geophys. Res., 107, 28082, https://doi.org/10.1029/2001JB000946, 2002.
Duval, P. and Montagnat, M.: Physical deformation modes of ice in glaciers and ice sheets, Glacier Science and Environmental Change, edited by: Knight, P. G., Blackwell Publishing, Malden, MA, USA, 303–208, https://doi.org/10.1002/9780470750636.ch59, 2006.
Duval, P., Ashby, M. F., and Anderman, I.: Rate-controlling processes in the creep of polycrystalline ice, J. Phys. Chem., 87, 4066–4074, https://doi.org/10.1021/j100244a014, 1983.
Duval, P., Arnaud, L., Brissaud, O., Montagnat, M., and De La Chapelle, S.: Deformation and recrystallization processes of ice from polar ice sheets, Ann. Glaciol., 30, 83–87, https://doi.org/10.3189/172756400781820688, 2000.
Eichler, J., Weikusat, I., and Kipfstuhl, S.: Orientation-tensor eigenvalues along the NEEM ice core, PANGAEA, https://doi.org/10.1594/Pangaea.838059, 2013.
Eichler, J., Kleitz, I., Bayer-Giraldi, M., Jansen, D., Kipfstuhl, S., Shigeyama, W., Weikusat, C., and Weikusat, I.: Location and distribution of micro-inclusions in the EDML and NEEM ice cores using optical microscopy and in situ Raman spectroscopy, The Cryosphere, 11, 1075–1090, https://doi.org/10.5194/tc-11-1075-2017, 2017.
Faria, S. H., Freitag, J., and Kipfstuhl, S.: Polar ice structure and the integrity of ice-core paleoclimate records, Quaternary Sci. Rev., 29, 338–351, https://doi.org/10.1016/j.quascirev.2009.10.016, 2010.
Faria, S. H., Weikusat, I., and Azuma, N.: The microstructure of polar ice. Part II: State of the art, J. Struct. Geol., 61, 21–49, https://doi.org/10.1016/j.jsg.2013.11.003, 2014a.
Faria, S. H., Weikusat, I., and Azuma, N.: The microstructure of polar ice. Part I: Highlights from ice core research, J. Struct. Geol., 61, 2–20, https://doi.org/10.1016/j.jsg.2013.09.010, 2014b.
Fisher, D. A. and Koerner, R. M.: On the special rheological properties of ancient microparticle-laden northern hemisphere ice as derived from bore-hole and core measurements, J. Glaciol., 32, 501–510, 1986.
Fitzpatrick, J. J., Voigt, D. E., Fegyveresi, J. M., Stevens, N. T., Spencer, M. K., Cole-dai, J., Alley, R. B., Jardine, G. E., Cravens, E. D., Wilen, L. A., Fudge, T. J., and McConnell, J. R.: Physical properties of the WAIS Divide ice core, J. Glaciol., 60, 1181–1198, https://doi.org/10.3189/2013JoG14j100, 2014.
Freeman, B. and Ferguson, C.: Deformation mechanism maps and micromechanics of rocks with distributed grain sizes, J. Geophys. Res., 91, 3849–3860, https://doi.org/10.1029/JB091iB03p03849, 1986.
Gillet-Chaulet, F., Hindmarsh, R. C. A., Corr, H. F. J., King, E. C., and Jenkins, A.: In-situ quantification of ice rheology and direct measurement of the Raymond Effect at Summit, Greenland using a phase-sensitive radar, Geophys. Res. Lett., 38, 381–386, https://doi.org/10.1029/2011GL049843, 2011.
Glen, J. W.: Experiments on the deformation of ice, J. Glaciol., 2, 111–114, 1952.
Glen, J. W.: Rate of Flow of polycrystalline Ice, Nature, 172, 721–722, 1953.
Glen, J. W.: The creep of polycrystalline ice, P. Roy. Soc. A, 228, 519–538, https://doi.org/10.1098/rspa.1955.0066, 1955.
Greve, R.: Application of a Polythermal Three-Dimensional Ice Sheet Model to the Greenland Ice Sheet: Response to Steady-State and Transient Climate Scenarios, J. Climate, 10, 901–918, 1997.
Greve, R. and Blatter, H.: Dynamics of ice sheets and glaciers, Springer Berlin/Heidelberg, 2009.
Greve, R., Dahl-Jensen, D., and Hvidberg, C. S.: Connection between climatic state and ice softness derived from deformation measurements of the Greenlandic NEEM borehole, AGU Fall Meeting Abstracts, 2017, C44A-02, available at: https://ui.adsabs.harvard.edu/abs/2017AGUFM.C44A..02G/abstract (last access: 10 July 2020), 2017.
Goldsby, D. L.: Superplastic Flow of Ice Relevant to Glacier and Ice-Sheet Mechanics, Glacier Science and Environmental Change, edited by: Knight, P. G., Blackwell Publishing, Malden, MA, USA, 308–314, https://doi.org/10.1002/9780470750636.ch60, 2006.
Goldsby, D. L. and Kohlstedt, D. L.: Grain boundary sliding in fine grained ice I, Scripta Mater., 37, 1399–1406, 1997.
Goldsby, D. L. and Kohlstedt, D. L.: Superplastic deformation of ice: Experimental observations, J. Geophys. Res., 106, 11017–11030, https://doi.org/10.1029/2000JB900336, 2001.
Goldsby, D. L. and Kohlstedt, D. L.: Reply to comment by P. Duval and M. Montagnat on “Superplastic deformation of ice: Experimental observations”, J. Geophys. Res., 107, 1–5, https://doi.org/10.1029/2002JB001842, 2002.
Gow, A. J., Meese, D. A., Alley, R. B., Fitzpatrick, J. J., Anandakrishnan, S., Woods, G. A., and Elder, B. C.: Physical and structural properties of the Greenland Ice Sheet Project 2 ice core: A review, J. Geophys. Res., 102, 26559–26575, https://doi.org/10.1029/97JC00165, 1997.
Hansen, L. N., Zimmerman, M. E., and Kohlstedt, D. L.: Grain boundary sliding in San Carlos olivine: Flow law parameters and crystallographic-preferred orientation, J. Geophys. Res.-Sol. Ea., 116, 1–16, https://doi.org/10.1029/2011JB008220, 2011.
Hansen, L. N., Zimmerman, M. E., and Kohlstedt, D. L.: The influence of microstructure on deformation of olivine in the grain-boundary sliding regime, J. Geophys. Res.-Sol. Ea., 117, 1–17, https://doi.org/10.1029/2012JB009305, 2012.
Heilbronner, R. and Bruhn, D.: The influence of three-dimensional grain size distributions on the rheology of polyphaser rocks, J. Struct. Geol., 20, 695–705, https://doi.org/10.1016/S0191-8141(98)00010-8, 1998.
Herwegh, M., Bresser, J. H. P., and Ter Heege, J. H.: Combining natural microstructures with composite flow laws: an improved approach for the extrapolation of lab data to nature, J. Struct. Geol., 27, 503–521, https://doi.org/10.1016/j.jsg.2004.10.010, 2005.
Hutter, K.: Theoretical glaciology; material science of ice and the mechanics of glaciers and ice sheets, Reidel Publishing Co., Dordrecht, Terra Scientific Publishing Co, Tokyo, 1983.
Huybrechts, P.: Ice sheet modelling, Encyclopedia of the Antarctic, edited by: Riffenburgh, B., Routledge, New York and London, 514–417 2007.
IPCC: Climate change 2014: Synthesis report. contribution of working groups i, ii, iii to the fifth assessment report of the intergovernmental panel on climate change, IPCC, Geneva, Switzerland, 2014.
Jacka, T. H. and Li, J.: The steady state crystal size of deforming ice, Ann. Glaciol., 20, 13–18, 1994.
Jansen, D., Llorens, M.-G., Westhoff, J., Steinbach, F., Kipfstuhl, S., Bons, P. D., Griera, A., and Weikusat, I.: Small-scale disturbances in the stratigraphy of the NEEM ice core: observations and numerical model simulations, The Cryosphere, 10, 359–370, https://doi.org/10.5194/tc-10-359-2016, 2016.
Kipfstuhl, S.: Large area scan macroscope images from the NEEM ice core, Alfred Wegener Institute, Helmholtz Centre for Polar and Marine Research, Bremerhaven, Pangaea, https://doi.pangaea.de/10.1594/PANGAEA.743296 (last access: 10 July 2020) (unpublished dataset), 2010.
Kipfstuhl, S., Hamann, I., Lambrecht, A., Freitag, J., Faria, S. H., Grigoriev, D., and Azuma, N.: Microstructure mapping: a new method for imaging deformation induced microstructural features of ice on the grain scale, J. Glaciol., 52, 398–406, https://doi.org/10.3189/172756506781828647, 2006.
Kipfstuhl, S., Faria, S. H., Azuma, N., Freitag, J., Hamann, I., Kaufmann, P., Miller, H., Weiler, K. and Wilhelms, F.: Evidence of dynamic recrystallization in polar firn, J. Geophys. Res., 114, 1–10, https://doi.org/10.1029/2008JB005583, 2009.
Kirby, S., Durham, W., Beeman, M., Heard, H., and Daley, M.: Inelastic properties of ice Ih at low temperatures and high pressures, Journal de Physique Colloques, 48, 227–232, https://doi.org/10.1051/jphyscol:1987131, 1987.
Krischke, A., Oechsner, U., and Kipfstuhl, S.: Rapid Microstructure Analysis of Polar Ice Cores, Optik & Photonik, 10, 32–35, https://doi.org/10.1002/opph.201500016, 2015.
Kuiper, E.-J. N., de Bresser, J. H. P., Drury, M. R., Eichler, J., Pennock, G. M., and Weikusat, I.: Using a composite flow law to model deformation in the NEEM deep ice core, Greenland – Part 2: The role of grain size and premelting on ice deformation at high homologous temperature, The Cryosphere, 14, 2449–2467, https://doi.org/10.5194/tc-14-2449-2020, 2020.
Marshall, S. J.: Modelling glacier response to climate change, in Glacier Science and Environmental Change, edited by: Knight, P. G., Blackwell Publishing, 163–173, 2006.
Martin, C., Gudmundsson, G. H., Pritchard, H. D., and Gagliardini, O.: On the effects of anisotropic rheology on ice flow, internal structure, and the age-depth relationship at ice divides, J. Geophys. Res. Lett., 114, F04001, https://doi.org/10.1029/2008JF001204, 2009.
Mellor, M. and Testa, R.: Creep of ice under low stress, J. Glaciol., 8, 147–152, 1969a.
Mellor, M. and Testa, R.: Effect of temperature on the creep of ice, J. Glaciol., 8, 131–145, 1969b.
Montagnat, M. and Duval, P.: Rate controlling processes in the creep of polar ice, influence of grain boundary migration associated with recrystallization, Earth Planet. Sc. Lett, 183, 179–186, https://doi.org/10.1016/S0012-821X(00)00262-4, 2000.
Montagnat, M. and Duval, P.: Dislocations in ice and Deformation Mechanisms: from Single Crystals to Polar Ice, Defect and Diffusion Forum, 229, 43–54, 2004.
Montagnat, M., Duval, P., Bastie, P., Hamelin, B., Ya, V., and Lipenkov, V. Ya.: Lattice distortion in ice crystals from the Vostock core (Antarctica) revealed by hard X-ray diffraction: implication in the deformation of ice at low stress, Earth Planet. Sc. Lett., 214, 369–378, 2003.
Montagnat, M., Azuma, N., Dahl-Jensen, D., Eichler, J., Fujita, S., Gillet-Chaulet, F., Kipfstuhl, S., Samyn, D., Svensson, A., and Weikusat, I.: Fabric along the NEEM ice core, Greenland, and its comparison with GRIP and NGRIP ice cores, The Cryosphere, 8, 1129–1138, https://doi.org/10.5194/tc-8-1129-2014, 2014.
Morgan, V. I.: High-Temperature ice creep tests, Cold Reg. Sci. Technol., 19, 295–300, 1991.
NEEM community members: Eemian interglacial reconstructed from a Greenland folded ice core, Nature, 493, 489–494, https://doi.org/10.1038/nature11789, 2013.
Obbard, R., Baker, I., and Sieg, S.: Using electron backscatter diffraction patterns to examine recrystallization in polar ice sheets, J. Glaciol., 52, 546–557, 2006.
Paterson, M. S. and Olgaard, D. L.: Rock deformation tests to large shear strains in torsion, J. Struct. Geol., 22, 1341–1358, https://doi.org/10.1016/S0191-8141(00)00042-0, 2000.
Paterson, W. S. B.: Why ice-age ice is sometimes “soft”, Cold Reg. Sci. Technol., 20, 75–98, https://doi.org/10.1016/0165-232X(91)90058-O, 1991.
Paterson, W. S. B.: The physics of glaciers, 3rd Edn., Oxford, Elsevier, 1994.
Peltier, W. R., Goldsby, D. L., Kohlstedt, D. L., and Tarasov, L.: Ice-age ice-sheet rheology: constraints from the Last Glacial Maximum form of the Laurentide ice sheet, Ann. Glaciol., 30, 163–176, https://doi.org/10.3189/172756400781820859, 2000.
Peternell, M., Wilson, C. J. L., and Hammes, D. M.: Strain rate dependence for evolution of steady state grain sizes: Insights from high-strain experiments on ice, Earth Planet. Sc. Lett., 506, 168–174, 2019.
Petrenko, V. F. and Withworth, R. W.: Physics of ice, Oxford University Press, Oxford, 1999.
Pettit, E. C. and Waddington, E. D.: Ice flow at low deviatoric stress, J. Glaciol., 49, 359–369, https://doi.org/10.3189/172756503781830584, 2003.
Piazolo, S., Montagnat, M., Grennerat, F., Moulinec, H., and Wheeler, J.: Effect of local stress heterogeneities on dislocation fields: Examples from transient creep in polycrystalline ice, Acta Mater., 90, 303–309, https://doi.org/10.1016/j.actamat.2015.02.046, 2015.
Pimienta, P. and Duval, P.: Rate controlling processes in the creep of polar glacier ice, Journal de Physique Colloques, 48, 243–248, https://doi.org/10.1051/jphyscol:1987134, 1987.
Qi, C., Goldsby, D. L., and Prior, D. J.: The down-stress transition from cluster to cone fabrics in experimentally deformed ice, Earth Planet. Sc. Lett., 471, 136–147, 2017.
Rasmussen, S. O., Abbott, P. M., Blunier, T., Bourne, A. J., Brook, E., Buchardt, S. L., Buizert, C., Chappellaz, J., Clausen, H. B., Cook, E., Dahl-Jensen, D., Davies, S. M., Guillevic, M., Kipfstuhl, S., Laepple, T., Seierstad, I. K., Severinghaus, J. P., Steffensen, J. P., Stowasser, C., Svensson, A., Vallelonga, P., Vinther, B. M., Wilhelms, F., and Winstrup, M.: A first chronology for the North Greenland Eemian Ice Drilling (NEEM) ice core, Clim. Past, 9, 2713–2730, https://doi.org/10.5194/cp-9-2713-2013, 2013.
Raymond, C. F.: Deformation in the vicinity of ice divides, J. Glaciol., 29, 357–373, 1983.
Saruya, T., Nakajima, K., Takata, M., Homma, T., Azuma, N., and Goto-Azuma, K.: Effects of microparticles on deformation and microstructural evolution of fine-grained ice, J. Glaciol., 65, 531–541, https://doi.org/10.1017/jog.2019.29, 2019.
Schulson, E. M. and Duval, P.: Creep and Fracture of Ice, Cambridge University Press, 2009.
Seddik, H., Greve, R., Placidi, L., Hamann, I., and Gagliardini, O.: Application of a continuum-mechanical model for the flow of anisotropic polar ice to the EDML core, Antarctica, J. Glaciol., 54, 631–642, 2008.
Sergienko, O. V., Creyts, T. T., and Hindmarsh, R. C. A.: Similarity of organized patterns in driving and basal stresses of Antarctic and Greenland ice sheets beneath extensive areas of basal sliding, Geophys. Re. Lett., 41, 3925–3932, https://doi.org/10.1002/2014GL059976, 2014.
Sheldon, S. G., Steffensen, J. P., Hansen, S. B., Popp, T. J., and Johnson, S. J.: The investigation and experience of using ESTISOL™ 240 and COASOL™ for ice-core drilling, Ann. Glaciol., 55, 219–232, https://doi.org/10.3189/2014AoG68A036, 2014.
Shigeyama, W., Nagatsuka, N., Homma, T., Takata, M., Goto-Azuma, K., Weikusat, I., Drury, M. R., Kuiper, E.-J., Mateiu, R.V., Azuma, N., Dahl-Jansen, D., and Kipfstuhl, S.: Microstructural analysis of Greenland ice using a cryogenic scanning electron microscope equipped with an electron backscatter diffraction detector, Bulletin of Glagiology Research, 37, 31–45, https://doi.org/10.5331/bgr.19R01, 2019.
Steinbach, F., Kuiper, E.-J., Eichler, J., Bons, P. D., Drury, M. R., Griera, A., Pennock, G. M., and Weikusat, I.: The relvance of grain dissection for grain size reduction in polar ice: Insights from numerical models and ice core microstructure analysis, Front. Earth Sci., 5, 66, https://doi.org/10.3389/feart.2017.00066, 2017.
Ter Heege, J. H., De Bresser, J. H. P., and Spiers, C. J.: Composite flow laws for crystalline materials with log normally distributed grain size: theory and application to olivine, J. Struct. Geol., 26, 1693–1705, https://doi.org/10.1016/j.jsg.2004.01.008, 2004.
Thoma, M., Grosfeld, K., Mayer, C., and Pattyn, F.: Interaction between ice sheet dynamics and subglacial lake circulation: a coupled modelling approach, The Cryosphere, 4, 1–12, https://doi.org/10.5194/tc-4-1-2010, 2010.
Thorsteinsson, T., Kipfstuhl, J., and Miller, H.: Textures and fabrics in the GRIP ice core, J. Geophys. Res., 102, 26583–26599, 1997.
Thorsteinsson, T., Waddington, E. D., Taylor, K. C., Alley, R. B., and Blankenship, D. D.: Strain-rate enhancement at Dye 3, Greenland, J. Glaciol., 45, 338–345, https://doi.org/10.3189/002214399793377185, 1999.
Treverrow, A., Budd, W. F., Jacka, T. H., and Warner, R. C.: The tertiary creep of polycrystalline ice: experimental evidence for stress-dependent levels of strain-rate enhancement, J. Glaciol., 58, 301–314, https://doi.org/10.3189/2012JoG11J149, 2012.
Vaughan, D. G. and Arthern, R.: Why is it hard to predict the future of ice sheets?, Science, 315, 1503–1504, https://doi.org/10.1126/science.1141111, 2007.
Waddington, E. D.: Life, death and afterlife of the extrusion flow theory, J. Glaciol., 56, 973–996, https://doi.org/10.3189/002214311796406022, 2010.
Weertman, J.: Creep deformation of ice, Annu. Rev. Earth Pl. Sc., 11, 215–240, 1983.
Weikusat, I., Kipfstuhl, S., Faria, S. H., Azuma, N., and Miyamoto, A.: Subgrain boundaries and related microstructural features in EDML (Antarctica) deep ice core, J. Glaciol., 55, 461–472, 2009a.
Weikusat, I., Kipfstuhl, S., Azuma, N., Faria, S. H., and Miyamoto, A.: Deformation microstructures in an Antarctic ice core (EDML) and in experimentally deformed artificial ice, Physics of Ice Core Records II, 68, 115–123, 2009b.
Weikusat, I., Miyamoto, A., Faria, S. H., Kipfstuhl, S., Azuma, N., and Hondoh, T.: Subgrain boundaries in Antarctic ice quantified by X-ray Laue diffraction, J. Glaciol., 57, 85–94, https://doi.org/10.3189/002214311795306628, 2011.
Weikusat, I., Kuiper, E.-J. N., Pennock, G. M., Kipfstuhl, S., and Drury, M. R.: EBSD analysis of subgrain boundaries and dislocation slip systems in Antarctic and Greenland ice, Solid Earth, 8, 883–898, https://doi.org/10.5194/se-8-883-2017, 2017.
Weikusat, I., Binder, T., and Kipfstuhl, S.: Structural grain parameters from image analysis of large area scan macroscope images from the NEEM ice core, PANGAEA, https://doi.org/10.1594/PANGAEA.919775, 2020a.
Weikusat, I., Kuiper, E.-J. N., de Bresser, J. H. P., Jansen, D., Pennock, G. M., and Drury, M. R.: A composite flow law to model deformation in the NEEM deep ice core, Greenland – The role of grain size, grain size distribution and premelting on ice deformation, PANGAEA, https://doi.org/10.1594/PANGAEA.920005, 2020b.
Wilson, C. J. L., Peternell, M., Piazolo, S., and Luzin, V.: Microstructure and fabric development in ice: Lessons learned from insitu experiments and implications for understanding rock evolution, J. Struct. Geol., 61, 50–77, 2014.
Wolovick, M. J. and Creyts, T. T.: Overturned folds in ice sheets: Insight from a kinematic model of travelling sticky patches and comparisons with observations, J. Geophys. Res.-Earth, 121, 1065–1083, https://doi.org/10.1002/2015JF003698, 2016.
Zwally, H. J., Abdalati, W., Herring, T., Larson, K., Saba, J., and Steffen, S.: Surface Melt-Induced Acceleration of Greenland Ice-Sheet Flow, Science, 297, 218–223, https://doi.org/10.1126/science.1072708, 2002.