the Creative Commons Attribution 4.0 License.
the Creative Commons Attribution 4.0 License.
 | 29 Jun 2020
Physically based model of the contribution of red snow algal cells to temporal changes in albedo in northwest Greenland
Nozomu Takeuchi
Sota Tanaka
Naoko Nagatsuka
Masashi Niwano
Teruo Aoki
Surface albedo of snow and ice is substantially reduced by inorganic impurities, such as aeolian mineral dust (MD) and black carbon (BC), and also by organic impurities, such as microbes that live in the snow. In this paper, we present the temporal changes of surface albedo, snow grain size, MD, BC and snow algal cell concentration observed on a snowpack in northwest Greenland during the ablation season of 2014 and our attempt to reproduce the changes in albedo with a physically based snow albedo model. We also attempt to reproduce the effects of inorganic impurities and the red snow algae (Sanguina nivaloides) on albedo. Concentrations of MD and red snow algae in the surface snow were found to increase in early August, while snow grain size and BC were found to not significantly change throughout the ablation season. Surface albedo was found to have decreased by 0.08 from late July to early August. The albedo simulated by the model agreed with the albedo observed during the study period. However, red snow algae exerted little effect on surface albedo in early August. This is probably owing to the abundance of smaller cells (4.9×10⁴ cells L−1) when compared with the cell abundance of red snow reported by previous studies in the Arctic region (∼108 cells L−1). The simulation of snow albedo until the end of the melting season, with a snow algae model, revealed that the reduction in albedo attributed to red snow algae could equal 0.004, out of a total reduction of 0.102 arising from the three impurities on a snowpack in northwest Greenland. Finally, we conducted scenario simulations using the snow albedo model, coupled with the snow algae model, in order to simulate the possible effects of red snow blooming on snow albedo under warm conditions in northwest Greenland. The result suggests that albedo reduction by red snow algal growth under warm conditions (surface snow temperature of +1.5 ∘C) reached 0.04, equivalent to a radiative forcing of 7.5 W m−2 during the ablation season of 2014. This coupled albedo model has the potential to dynamically simulate snow albedo, including the effect of organic and inorganic impurities, leading to proper estimates of the surface albedo of snow cover in Greenland.
- Article
(5277 KB) - Full-text XML
-
Supplement
(236 KB) - BibTeX
- EndNote


The Greenland Ice Sheet, which is the largest continuous body of ice in the Northern Hemisphere, has been losing mass rapidly since the 2000s (Rignot et al., 2008). The increase in the melting of snow and ice is likely to be caused by reduction of surface albedo as well as temperature rise (Tedesco et al., 2011; Box et al., 2012; Yallop et al., 2012). Therefore, it is important to understand the physical processes causing the reduction in albedo and to estimate current and future snow and ice albedo accurately on the Greenland Ice Sheet.
Surface albedo plays an important role in the balance of energy over the snow surface. Snow albedo is approximately 0.9 for fresh snow and gradually decreases to approximately 0.5 for granular snow during the melting season (Wiscombe and Warren, 1980). Because a reduction of snow albedo increases the absorption of solar radiation by a snowpack, the reduction in albedo accelerates the melting of snow. The major factors affecting surface albedo are snow grain size and abundance of light-absorbing impurities in the snow (Warren and Wiscombe, 1980; Aoki et al., 2011). An increase in the number of snow impurities and in the snow grain size causes more absorption of solar radiation in the visible (400–700 nm) and near-infrared (700–3000 nm) regions (Warren and Wiscombe, 1980; Aoki et al., 2000). Major light-absorbing impurities in a snowpack are black carbon (BC), which is derived from the combustion of fossil and solid fuels and from biomass burning (Bond et al., 2013), and mineral dust (MD), which is transported by wind from local or distant arid terrestrial surfaces (Bøggild et al., 2010). For example, a mass concentration of 10 µg kg−1 of BC in wet snow can reduce the albedo by 0.01 (Warren and Wiscombe, 1985). Although light absorption by MD in the visible region was reported to be lower by approximately 0.7 % than that by BC (Aoki et al., 2011), the mass concentration of MD was 10 times greater or more than that of BC in the snowpack of the Greenland Ice Sheet. Thus, the impact of MD on snow albedo cannot be ignored (Steffensen, 1997). In addition, organic carbon (OC) is an impurity that absorbs light in the visible spectrum (Kirchstetter et al., 2004; Andreae and Gelencsér, 2006). OCs in atmospheric aerosols, consisting of burned fossil fuel, plant materials, viable microbes (bacteria, viruses, fungal spores and algae), soil organic matter and marine aerosol (Jacobson et al., 2000; Cerqueira et al., 2010), might be present on the surface snow and reduce its albedo.
Physical models of snow surface albedo have been developed to calculate the surface albedo of snow containing various impurities. Physical models can reproduce snow albedo as a function of snow grain size, impurities (BC and MD), and direct and diffuse solar radiation (Wiscombe and Warren, 1980). Such models have been developed in recent years. For example, Flanner and Zender (2005, 2006) proposed a multilayer snow albedo model, which is incorporated into a land surface model in a general circulation model, in order to simulate the microphysics and radiative properties of snow at a global scale. The physically based snow albedo model (PBSAM) developed by Aoki et al. (2011) separately calculates broadband albedos for the ultraviolet–visible (200–700 nm) and near-infrared (700–3000 nm) wavebands, at the snow surface, taking into account the spectral radiation properties of impurities (BC and MD) in those spectra. This model can efficiently simulate snow albedo using a look-up table, which consists of an albedo dataset calculated with a radiative transfer model for various environmental variables (snow grain size, snow water equivalent, snow impurity concentration and solar zenith angle). Global climate simulation (e.g., of surface net shortwave flux) using an Earth system model with a snow albedo module, including light-absorbing impurities (BC, MD and OC), suggests that the contribution of aerosol OC to total visible absorption in the snow surface was smaller than that of BC and MD (Yasunari et al., 2015).
Although many albedo models have been developed to include inorganic impurities (BC and MD) and aerosol organic impurity, recent studies have suggested that microbes growing in snow, such as snow algae, also affect snow albedo (Takeuchi, 2013; Aoki et al., 2013; Lutz et al., 2016; Cook et al., 2017a, b). Snow algae are cold-tolerant photosynthetic microbes growing on snow and are commonly found globally on glaciers and snowfields. Blooms of snow algae occur on thawing snow surfaces and change the color of snow to red or green (Thomas and Duval, 1995; Takeuchi et al., 2006; Hoham and Remias, 2020). Red-colored snow results from a bloom of snow algae, which are typically Sanguina (S.) nivaloides (renamed recently from Chlamydomonas nivalis), and can be observed widely in polar and alpine snow fields (Hoham and Duval, 2001; Segawa et al., 2005, 2018; Takeuchi, 2013; Hisakawa et al., 2015; Lutz et al., 2016; Tanaka et al., 2016; Ganey et al., 2017; Procházková et al., 2019). Many observational studies have reported the quantitative effect of the red snow blooming on the surface albedo. For example, algal blooms have a potential to reduce snow albedo by 0.13 on Arctic glaciers (Lutz et al., 2016). Because the impact of red snow blooming on albedo is comparable to that of BC and MD, albedo models including the effect of snow algae have been established recently. For example, a bio-albedo model proposed by Cook et al. (2017a, b) can simulate spectral albedo using calculations of radiative transfer that incorporate biological variables (cell concentration, cell size and cellular pigment composition), snow physical properties (specific surface area, density and layer thickness) and irradiance. This model satisfactorily reproduced the spectral albedo of red snow blooming and temporal change of surface albedo on a glacier in Greenland. However, the physical properties and inorganic impurities (BC and MD) in the snow used in the simulation were not representative field values but assumed constant values based on previous studies at other sites of Greenland. Thus, the effect of snow algae on intact surface albedo has yet to be quantitatively assessed. In addition, temporal changes in algal abundance were not used at the model calculation. Snow algal abundance can change significantly because of their growth, accumulation and removal of their cells over time (Müller et al., 2001; Takeuchi, 2013; Onuma et al., 2016, 2018). Therefore, snow albedo simulations should incorporate a numerical model of snow algae.
In this study, we aimed to reproduce the temporal changes of snow albedo observed on a snowpack during the melt season of Qaanaaq Glacier in northwest Greenland. We used the PBSAM and included the effects of snow algae, as well as inorganic impurities (BC and MD). Snow physical properties (snow grain size, temperature, density and spectral reflectance in the visible band) and the abundances of the three impurities (BC, MD and snow algae) in the surface and subsurface snow were periodically quantified in the snowpack from June to August in 2014. The PBSAM was updated to incorporate the effect of snow algae, and temporal changes of the surface albedo were calculated by using the model and incorporating the observed meteorological conditions, snow physical properties and three impurities. The impacts of the observed and simulated blooms of red snow on the surface albedo were quantified using the updated PBSAM. In addition, we simulated temporal change in snow algal abundance by using a snow algae model to reproduce the change in albedo throughout the entire melting season.
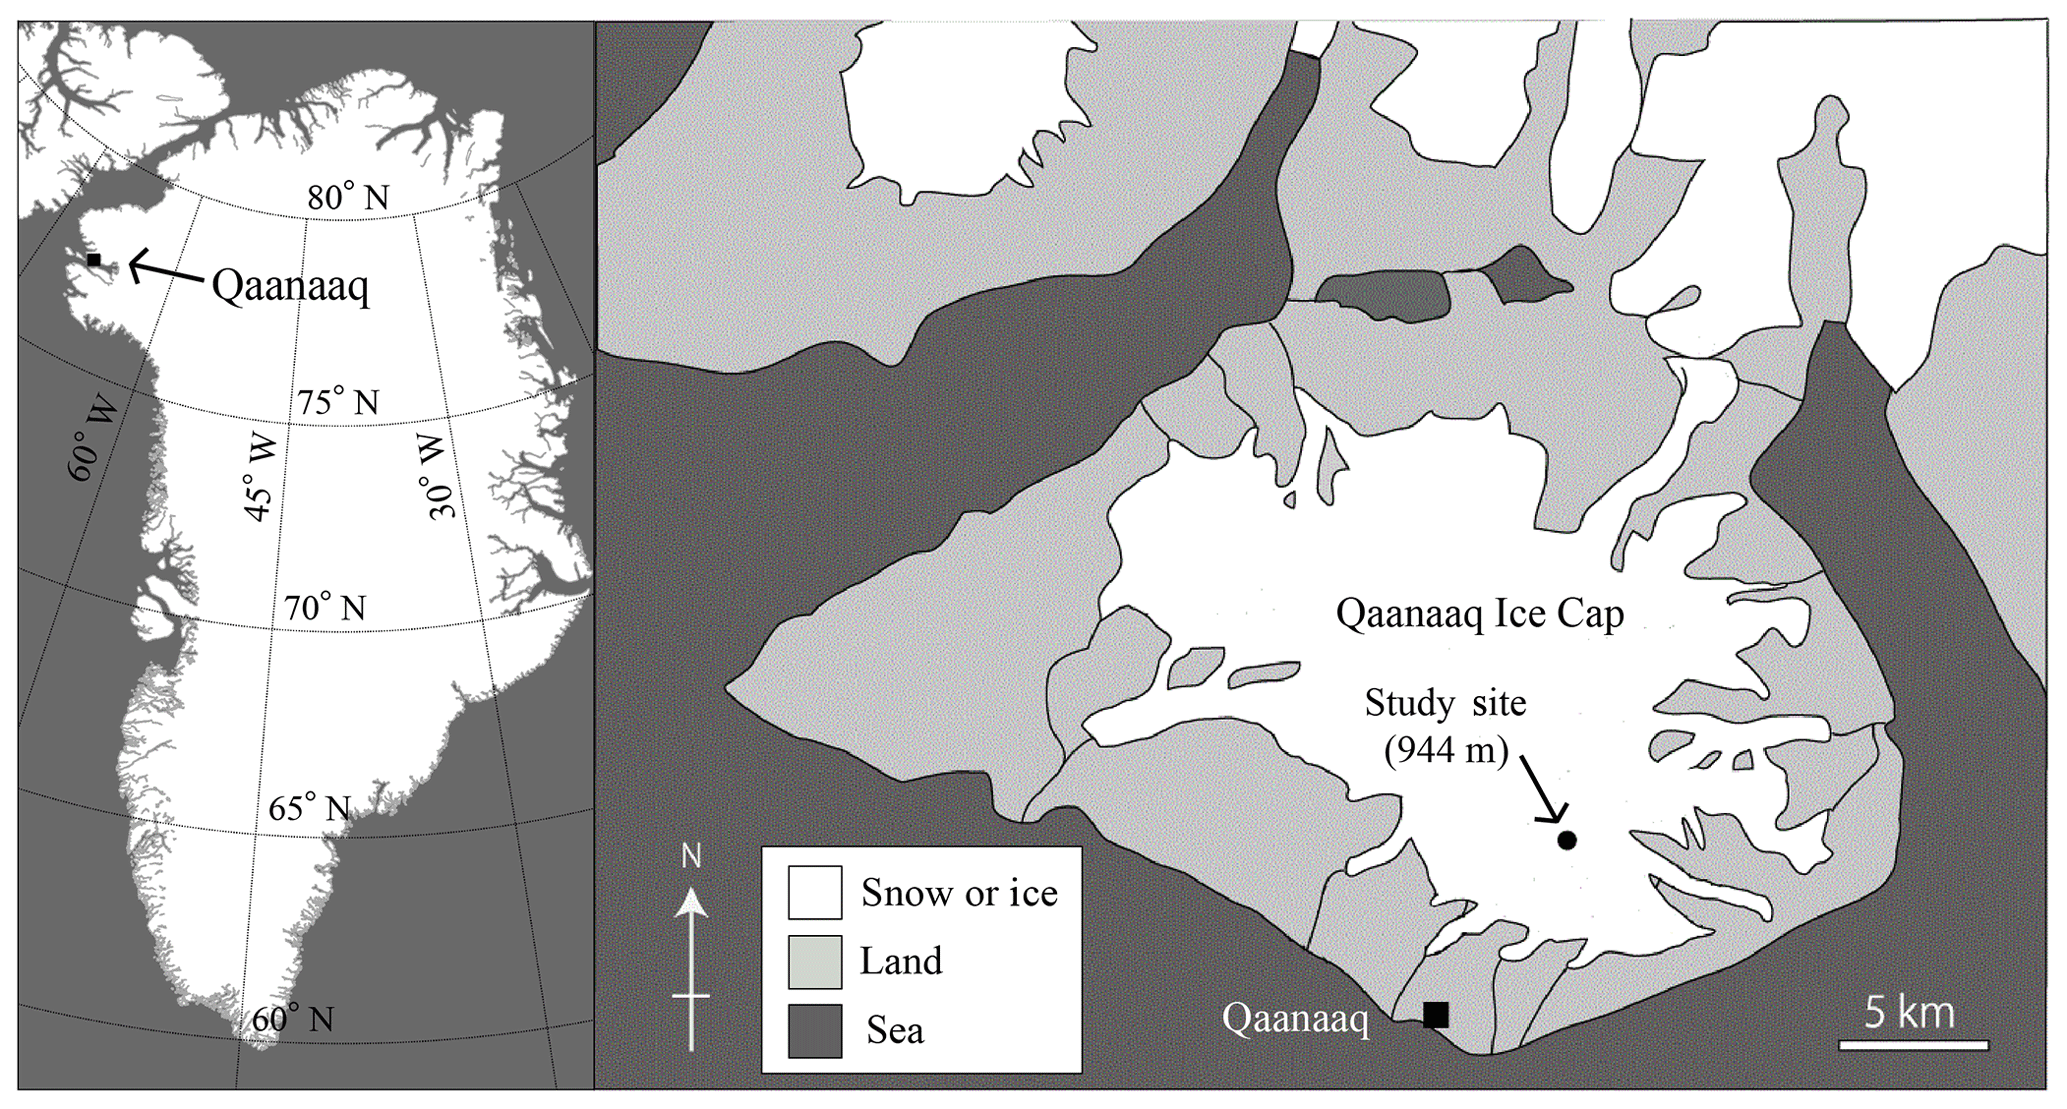
Figure 1Map of Greenland (left) and Qaanaaq Ice Cap in northwest Greenland (right). The figure to the right shows the sampling site on the glacier.
2.1 Study sites and observation methods
Field investigations were conducted at the Qaanaaq Ice Cap in northwest Greenland (Fig. 1) from June to August in 2014. The Qaanaaq Ice Cap, which lies on a small peninsula in northwest Greenland, covers an area of 286 km2 and has an elevation of approximately 1110 m a.s.l. (Takeuchi et al., 2014; Sugiyama et al., 2014). We selected a study site close to the SIGMA-B automatic weather station (AWS) (77∘32′ N, 69∘04′ W, 944 m a.s.l., Aoki et al., 2014a) on the ice cap, which is easily accessible on foot from the Qaanaaq village. The site is located near the equilibrium line of the glacier, which was 1001 m a.s.l. in 2014, as determined by a mass balance study (Tsutaki et al., 2017). As reported previously, snow algae visibly bloomed on the snowpack at the study site from late July to August in 2014. They consisted mostly of the spherical red cells of S. nivaloides, and their mean diameter was 21.3±2.3 µm (Onuma et al., 2018), although there was no molecular analysis of all species present.
The meteorological conditions considered in this study were measured at the SIGMA-B AWS, which was installed in 2012 as part of the project Snow Impurity and Glacier Microbe effects on abrupt warming in the Arctic (SIGMA; Aoki et al., 2014a). Air temperature and radiation fluxes of the upward and downward shortwave and upward and downward longwave radiation were collected hourly from June to August 2014 using the AWS. The temperature sensor and pyranometers of the AWS were placed at heights of 3.0 and 2.5 m above the snow surface, respectively. Surface albedo was calculated from the ratio of upward to downward shortwave radiation. The surface albedo was corrected to include the effect of local slope (4∘) on snow albedo, according to Jonsell et al. (2003). The time used in this study was Greenland local time (LT), which is 2 h later than Greenwich mean time. Detailed settings of the other meteorological sensors have been described by Aoki et al. (2014a).
Collection of snow samples and measurement of snow properties were periodically conducted at the site from days 168 (17 June 2014) to 215 (3 August 2014) to obtain the level of abundance of the impurities and the physical properties of the surface snow. The collection was conducted on sunny or cloudy days. The optically equivalent snow grain size was measured with a handheld lens according to Aoki et al. (2007). Snow temperature was measured with a thermistor sensor (CT-430WP, Custom Ltd, Tokyo, Japan). The snow density was measured using a density sampler (volume: 100 cm3). Variation in snow layer thickness at each observational date relative to that on day 168 was defined as the relative snow surface level for estimating snow melting. The snow properties (the optically equivalent snow grain size, snow temperature, snow density and snow layer thickness) were measured to simulate snow albedo with a physically based snow albedo model. Spectral reflectance of the snow surface in the visible wavelength range (350–700 nm) was measured with a portable spectroradiometer (MS-720, Eiko Seiki, Japan). Surface snow was collected after the measurement to quantify the impurity content.
Snow samples were collected from one to three surfaces selected randomly in the spatial scale of approximately 15 m × 15 m at the study site in order to estimate spatial mean concentration of each snow impurity at the site. They were collected from two snow layers, at depths of 0 to 2 cm (surface) and 2 to 10 cm (subsurface), using a stainless-steel spatula. At each layer, snow samples were collected separately to quantify the algal cell, MD particles, and OC and BC contents. The amounts of snow sample used for algal cell analysis ranged from 22 to 36 g for the surface and 21 to 33 g for the subsurface. Samples for analysis of MD particle and BC and OC concentrations ranged from 500 to 2200 g for the surface and 500 to 2100 g for the subsurface.
2.2 Quantification of snow impurities
Mass concentrations of MD in the snow were quantified by the combustion method (Takeuchi and Li, 2008; Onuma et al., 2018). Snow samples were collected at the site in dust-free plastic bags from the surface and subsurface, as described in the previous section. These samples were melted at room temperature in Qaanaaq village, and their mass was measured with a weight scale. The dust precipitated in the bag was preserved in clean 30 mL polyethylene bottles, which were then transported to Chiba University, Japan, for analysis. The samples were dried (60 ∘C, 24 h) in pre-weighed crucibles and then combusted (500 ∘C, 3 h) in an electric furnace to remove organic matter. The mass of mineral particles per melt water volume (mg L−1) was obtained from the combusted sample weight and sample volume, since only mineral particles remained after combustion. Mass concentrations of MD in surface snow at the study site during the observational period have been observed in previous studies (Onuma et al., 2018).
Mass concentrations of OC and elemental carbon (EC) in snow were quantified from filtered snow samples by the thermal optical reflectance method (Chow et al., 1993; Kuchiki et al., 2015). Snow samples were collected in dust-free plastic bags from the snow surface and subsurface, as described in the previous section, at the site. The samples were melted at room temperature and pre-filtered through a 150 µm mesh filter to remove large particles, including leaves, insects and clothing fibers. The melted samples were combined with ammonium dihydrogen phosphate (NH4H2PO4) of 1.5 g 100 mL−1 as a coagulant and were then magnetically stirred and sonicated for 10 min. Previous studies have reported that the mean collection efficiency of a quartz fiber filter for BC particles increased to 95 % when NH4H2PO4 coagulant was added to the sample solution, compared with 5 % efficiency without the addition of the coagulant (Torres et al., 2014). In addition, adding the NH4H2PO4 coagulant to melted snow samples had no apparent effect on the measurement of OC by the thermal reflectance optical method (Kuchiki et al., 2015). The melted samples were filtered through a quartz fiber filter (pore size: 0.45 µm, 2500QAT-UP; Pall Corp., MI, USA) on a clean bench by atmospheric pressure. The filters were maintained in plastic cases before being transported to the Meteorological Research Institute in Tsukuba, Japan, for analysis. Mass concentrations of OC and EC were measured with an OC–EC aerosol analyzer (Sunset Laboratory Inc., OR, USA) using the thermal optical reflectance method. Samples were volatilized at 120, 250, 450 and 550 ∘C in a pure helium atmosphere and then combusted at 550, 700 and 800 ∘C in a 10 % oxygen–90 % helium atmosphere, in accordance with the Interagency Monitoring of Protected Visual Environments (IMPROVE) thermal evolution protocol (Chow et al., 2001). Throughout the analysis, laser reflectance from the filter deposit was continuously monitored to correct the OC pyrolysis. The filter reflectance usually decreased with increasing temperature in the helium atmosphere due to pyrolysis of organic material. When oxygen was added, the remaining light-absorbing carbon combusted, and the reflectance increased. The split point between OC and EC was identified by the timing of drastic change in reflectance. EC concentrations measured with the thermal optical method agree with the BC concentrations measured with an optical method using a particle soot absorption photometer to within 2 % (Miyazaki et al., 2007). In the present study, we assumed that the component of EC was equal to BC in order to estimate the mass concentration of BC in snow. The mass concentrations of OC and BC per meltwater volume (mg L−1) were obtained from the volatilization volume of carbon before and after the OC ∕ EC split point, respectively. Kuchiki et al. (2015) provide a more detailed description of the method.
Abundance of snow algae was quantified by the direct cell count method (Takeuchi, 2013; Tanaka et al., 2016; Onuma et al., 2018). Snow samples were preserved in Whirl-Pak® bags (Nasco, Fort Atkinson, Wisconsin, USA) and then melted in Qaanaaq village. The melted samples were preserved in 3 % formalin in clean 30 mL polyethylene bottles before being transported to Chiba University, Japan, for analysis. Algal abundance was represented as algal cell concentration per unit of meltwater volume of the snowpack. Water samples of 50–1000 µL were filtered through a hydrophilized PTFE membrane filter (pore size 0.45 µm; Omnipore JHWP, Millipore, Japan), and the number of algal cells on the filter was counted two to five times for each sample using an optical microscope (BX51, OLYMPUS, Japan), and cell concentrations (cells L−1) were obtained from mean cell counts and filtered sample volumes. Cell concentrations for S. nivaloides in surface snow at the study site have been published previously (Onuma et al., 2018).
Table 1Mass absorption coefficients (MACs) of snow impurities parameterized in the PBSAM (Aoki et al., 2011). The MAC for red snow algae was assumed in our study.

2.3 Physically based snow albedo model (PBSAM)
A PBSAM was used to simulate snow albedo, including the effect of inorganic and organic impurities, in this study. Broadband albedos in the snowpack were calculated by the PBSAM as functions of snow grain size and concentrations of impurities in a maximum of five layers of snow under solar illumination conditions (Aoki et al., 2011). In addition, PBSAM can calculate visible and near-infrared albedos using downward solar radiation in the visible and near-infrared regions, respectively. In order to include impurities of different optical properties (BC and MD in the case of Aoki et al., 2011), a snow impurity factor (SIF) was defined in the model. SIFi for sub-band of wavelength i was calculated as follows:
where ki,BC and ki,MD are the mass absorption cross sections (MACs) of BC and MD for sub-band i, respectively. MACs represent the absorption characteristic (absorption coefficient) for the sub-band of different wavelengths (Table 1). CBC and CMD are the mass concentrations of BC and MD in snow, respectively. MACs and the mass concentrations of each impurity were used as the parameters and variables for simulation by PBSAM. Aoki et al. (2011) further added the OC to Eq. (1) as follows:
where ki,OC and COC are the MAC and the mass concentration of OC for sub-band i, respectively. In their study, OC was assumed to be aerosol OC derived from the atmosphere. The MAC of the OC, as well as that of MD and BC, was assumed using an aerosol model (Hess et al., 1998), as reported by Aoki et al. (2011).
In the present study, red snow algae were included in the model as part of the OC. In order to convert the algal cell concentration (cells L−1) into COC (mg L−1), a regression was applied to a scatter diagram of observed algal cell versus OC concentration of snow samples in this study. Because the MAC of snow algae is unlikely to be equal to that of aerosol OC, as has previously been used in PBSAM, we assumed the MAC for snow algae based on cell size and pigment composition (Table 1). To calculate the MAC for snow algae, a lognormal size distribution (Hess et al., 1998, Eq. 3d) was assumed, based on the measurement of algal cell size based on algae from this study site. The sizes of 100 S. nivaloides cells, which were obtained from snow samples stored in a freezer, were measured directly using Image-J for estimation of the normal distribution curve (mode radius = 11.4 µm; standard deviation = 1.18 µm). Because the effect of light absorption of snow algae on snow albedo should be calculated quantitatively in an albedo model, we calculated the imaginary part of refractive indices for S. nivaloides according to Cook et al. (2017a, Eqs. 2 and 3). The imaginary part of refractive indices for the spectral region from 400 to 750 nm was calculated based on the pigment composition (chlorophyll a, chlorophyll b, primary carotenoids and secondary carotenoids) that were assumed as the compositions of S. nivaloides by them. The concentrations of each pigment in the algal cells were based on their study (Cook et al., 2017a, Table 2; “High End-Member Scenario”). The imaginary part of the refractive index for non-absorption spectral regions by red snow algae, which are 200–400 and 750–3000 nm, was assumed to be that for pure water. The real part of the refractive index for the entire spectra from 200 to 3000 nm was assumed to be the same as pure water. The MAC for snow algae was calculated from Mie theory by assuming the spherical particles, using the lognormal size distribution previously calculated and the spectral refractive indices following the protocol of Aoki et al. (2011).
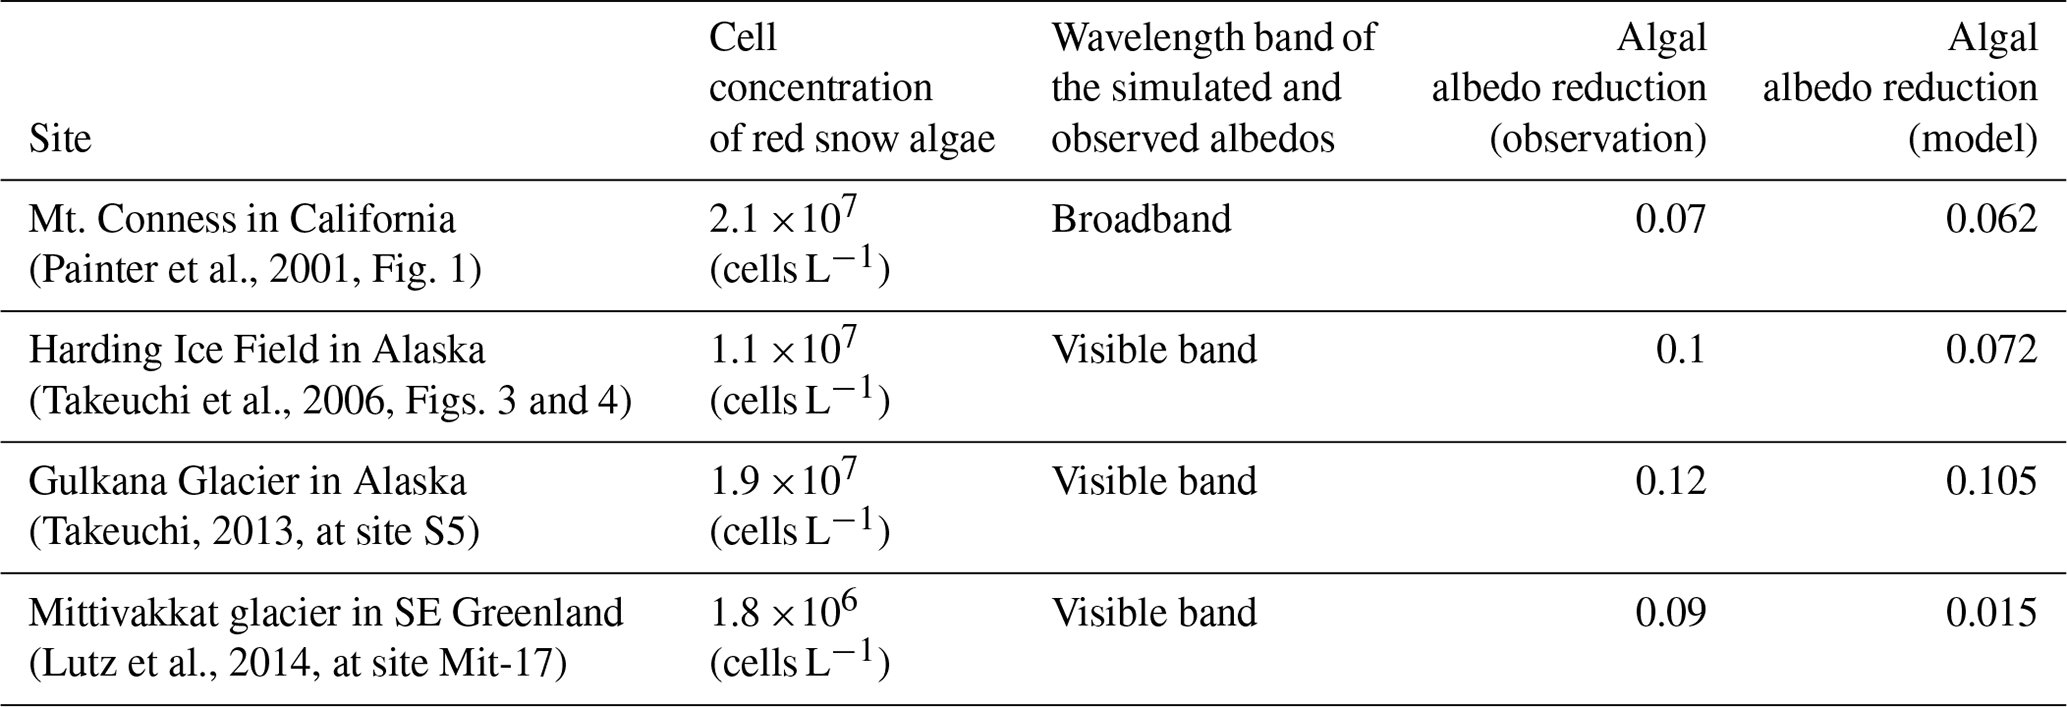
Table 2The information for model validation with field observations. The wavelength band of the simulated snow albedo was adjusted to that of the observed snow albedo.
Snow albedo was calculated with PBSAM, using CBC, CMD, COC, physical properties in surface (0–2 cm) and subsurface (2–10 cm) snow, and meteorological conditions recorded in this study. The observed thickness of the snow layer, snow density, and temperature and grain size were used as input data in PBSAM. Downward shortwave radiation measured at the AWS, the direct-to-diffuse insolation ratio and the visible-to-near-infrared insolation ratio were also used as input variables. These two ratios were calculated from observed downward shortwave radiation, upward and downward longwave radiation, and air temperature at the AWS following the protocol of Niwano et al. (2012). Meteorological variables measured from 10:00 to 12:00 LT for each observation date were used for the model simulation to calculate snow albedo at 10:00, 11:00 and 12:00 LT.
In this study, four kinds of snow albedo simulations were conducted based on four assumptions of snow impurity: (1) snow albedo without any impurities present (Alb-C), (2) snow albedo with the effect of MD only (Alb-D), (3) snow albedo with the effects of MD and BC only (Alb-DB), and (4) snow albedo with the effects of all impurities, i.e., MD, BC and algae (Alb-DBA).
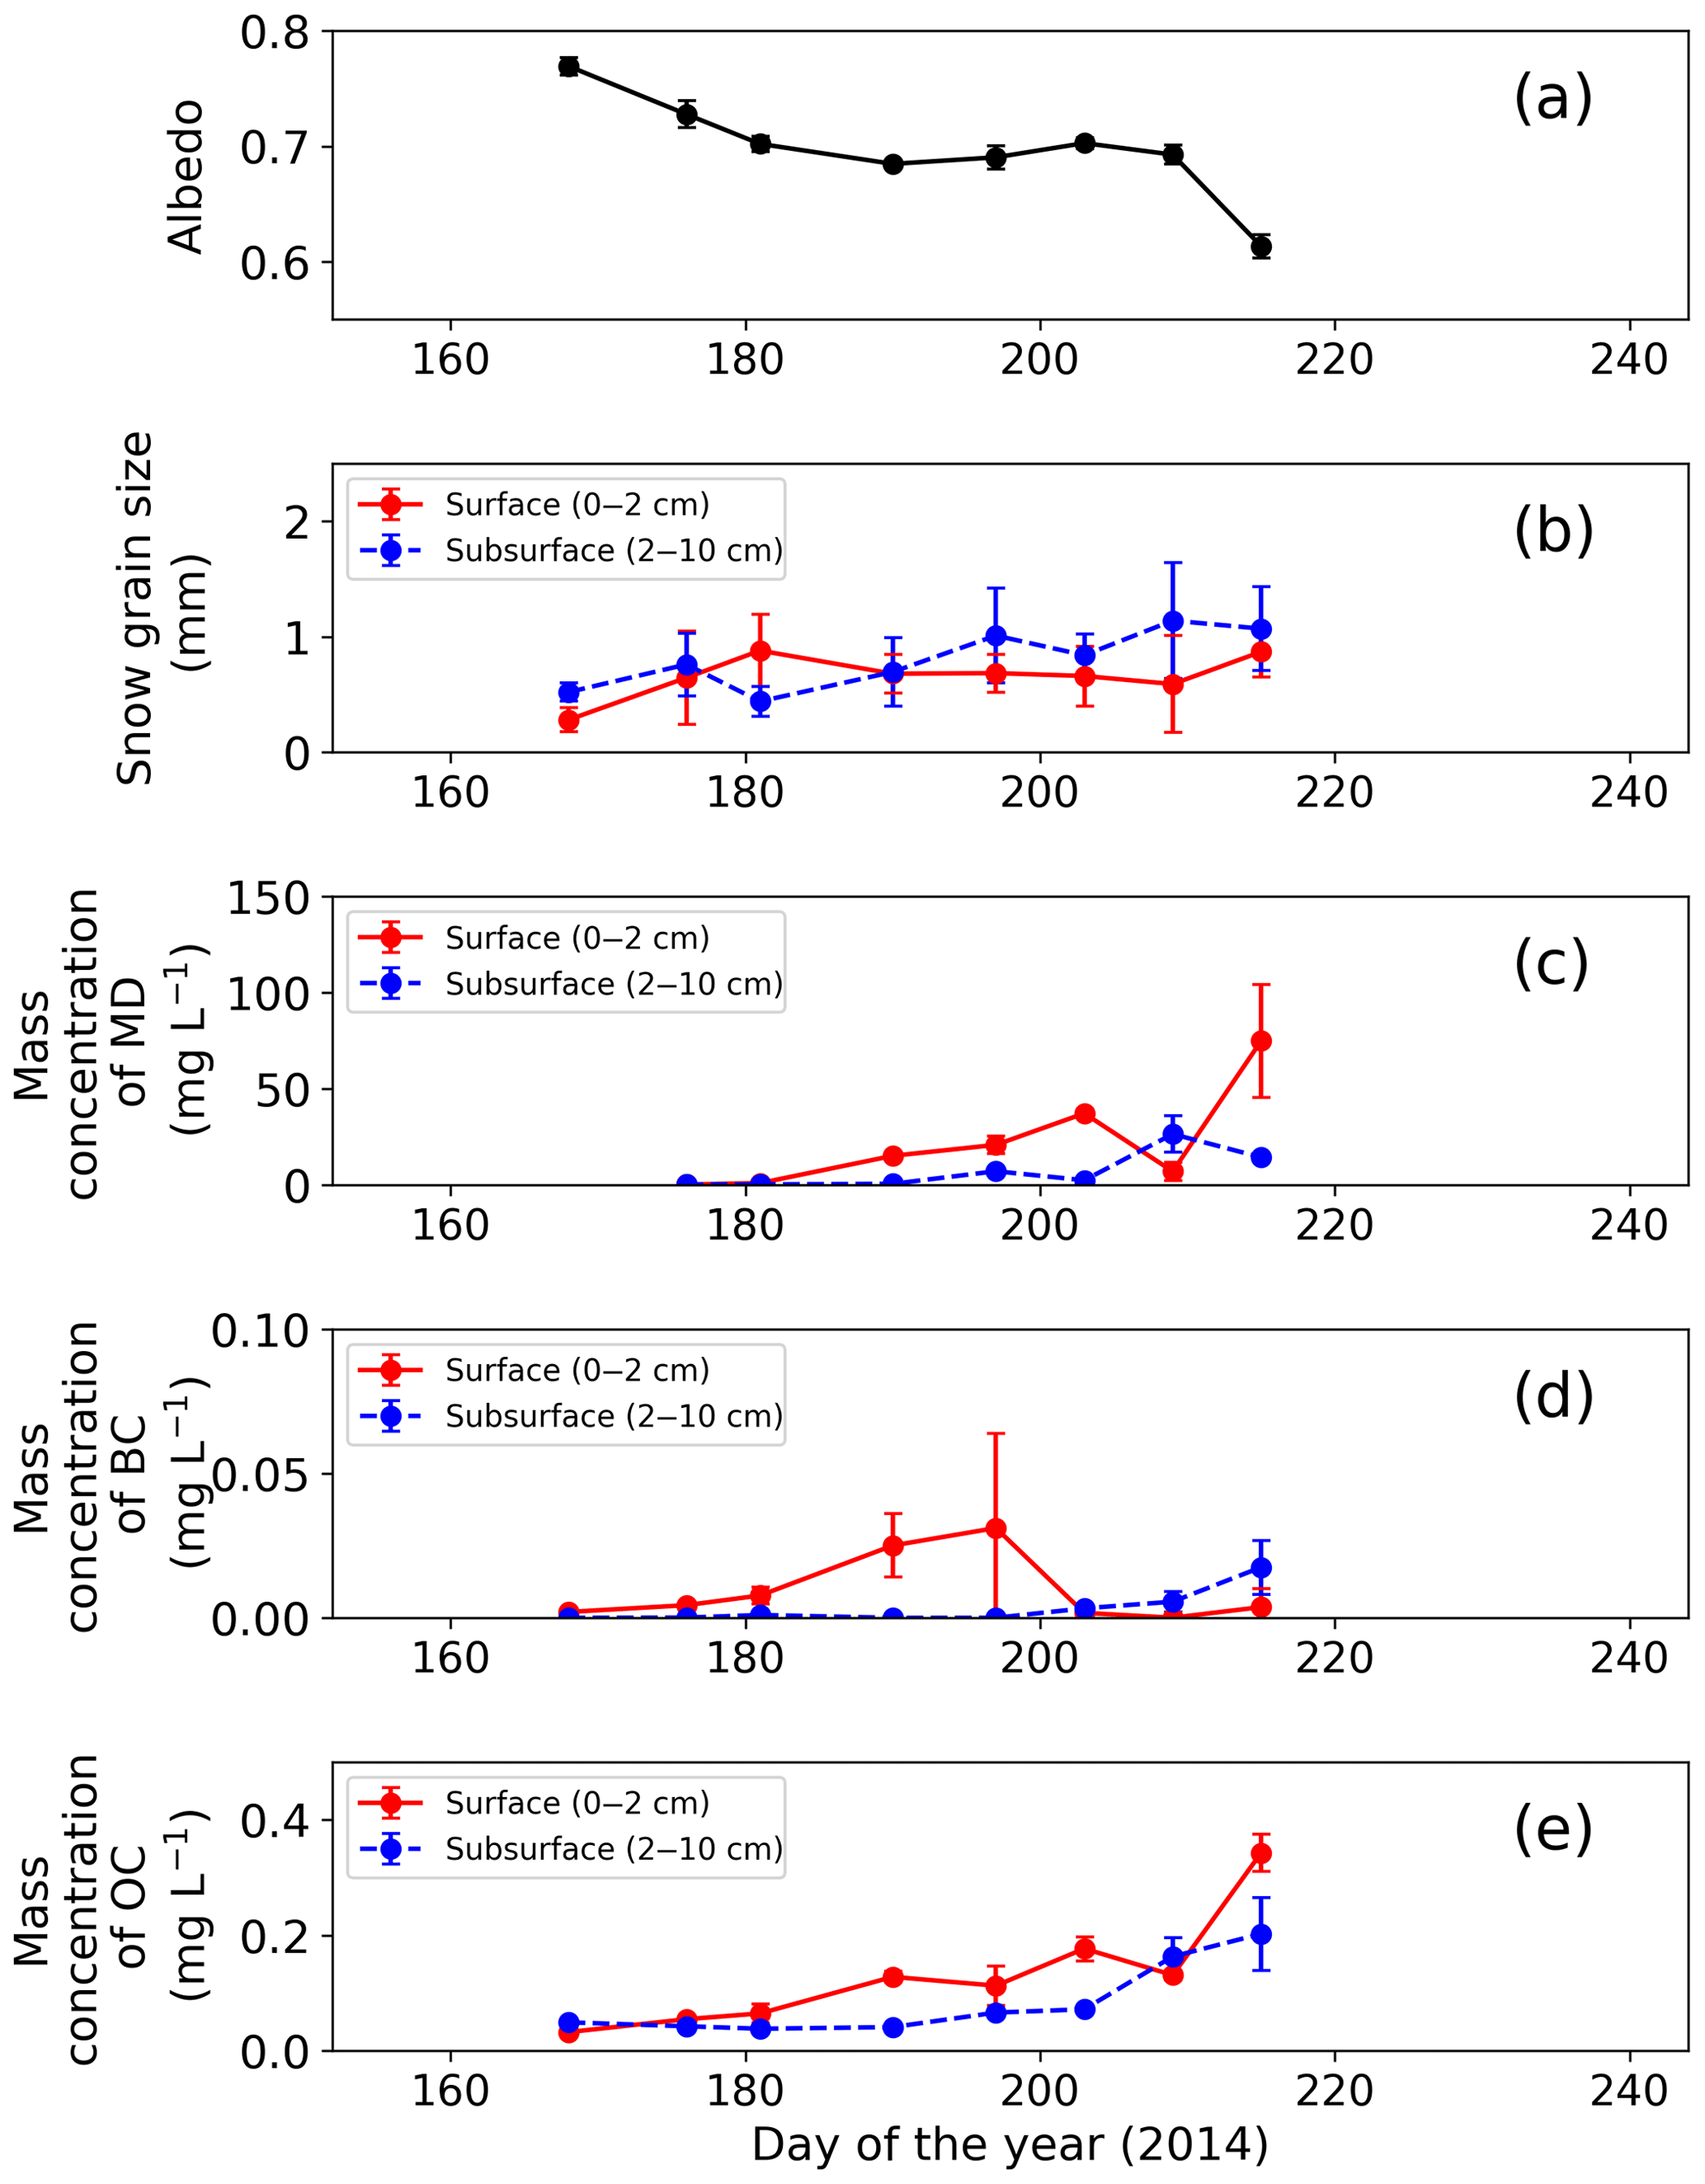
Figure 2Temporal changes in observed snow physical properties on surface and subsurface snow at the study site. (a) Snow albedo, (b) snow grain size (radius), (c) mass concentration of MD, (d) mass concentration of BC and (e) mass concentration of OC. Snow albedo was calculated from the ratio of upward and downward shortwave radiation at AWS. Error bars: standard deviation.
3.1 Temporal changes in physical properties of the snow
Surface albedo of the snowpack at the study site gradually decreased with snow melting from late June to early August (Fig. 2a, b). The snowpack melted continuously from day 176 (25 June 2014) to day 215 (3 August 2014), as previously described by Onuma et al. (2018). For example, surface snow was fresh snow on day 168, and then it became granular snow on day 176 and remained so until day 215. Mean optically equivalent snow grain size (radius) of the surface was 0.3±0.1 mm (mean ± SD) on day 168, was 0.6±0.4 mm on day 176, and then it varied between 0.7 and 0.9 mm until day 215. The properties of subsurface snow changed similarly. Relative snow surface level (0 cm on day 168) gradually decreased by 123 cm during the study period (from day 168 to day 215). Snow albedo was 0.791 on day 168, and then it gradually decreased until day 209 (from 0.791 to 0.698). Finally, it decreased rapidly by 0.08 from day 209 to day 215.
3.2 Temporal changes in impurities in snow
The mass concentration of MD in both surface and subsurface snow gradually increased from mid-June to early August at the study site and reached the maximum in early August. The concentration in surface snow was mg L−1 on day 176 (25 June 2014) and gradually increased, with a slight temporary decrease on day 209, but it increased again and finally reached mg L−1 (mean ± SD) on day 215 (Fig. 2c). A statistical test (one-way analysis of variance – one-way ANOVA) demonstrated that the temporal change in the mass concentration of MD was significant (F=4.95, ). The concentration in the subsurface snow was generally lower than that in surface snow. It was mg L−1 on day 176 and gradually increased to 1.4×10 mg L−1 on day 215 (Fig. 2c).
In contrast to MD, the mass concentration of BC did not show seasonal trends in either surface or subsurface snow during the study period. The BC concentrations in surface and subsurface snow ranged from to mg L−1 (mean: mg L−1) and to mg L−1 (mean: mg L−1), respectively (Fig. 2d). The temporal change of BC was not statistically significant for either surface or subsurface snow (one-way ANOVA, surface: F=3.14, ; subsurface: F=8.89, ).
The mass concentrations of OC in surface snow gradually increased from mid-June to early August, and they were maximal in early August. The OC concentration in surface snow was mg L−1 on day 168 and gradually increased to mg L−1 on day 215, although the concentration decreased temporally on days 197 and 209 (Fig. 2e). This temporal change was significant in surface snow (one-way ANOVA, F=3.14, ). Mass concentration of OC in the subsurface snow ranged from to mg L−1 (mean: mg L−1; Fig. 2e). There was no significant difference in concentration from day 168 to day 215 (one-way ANOVA, F=8.89, ).
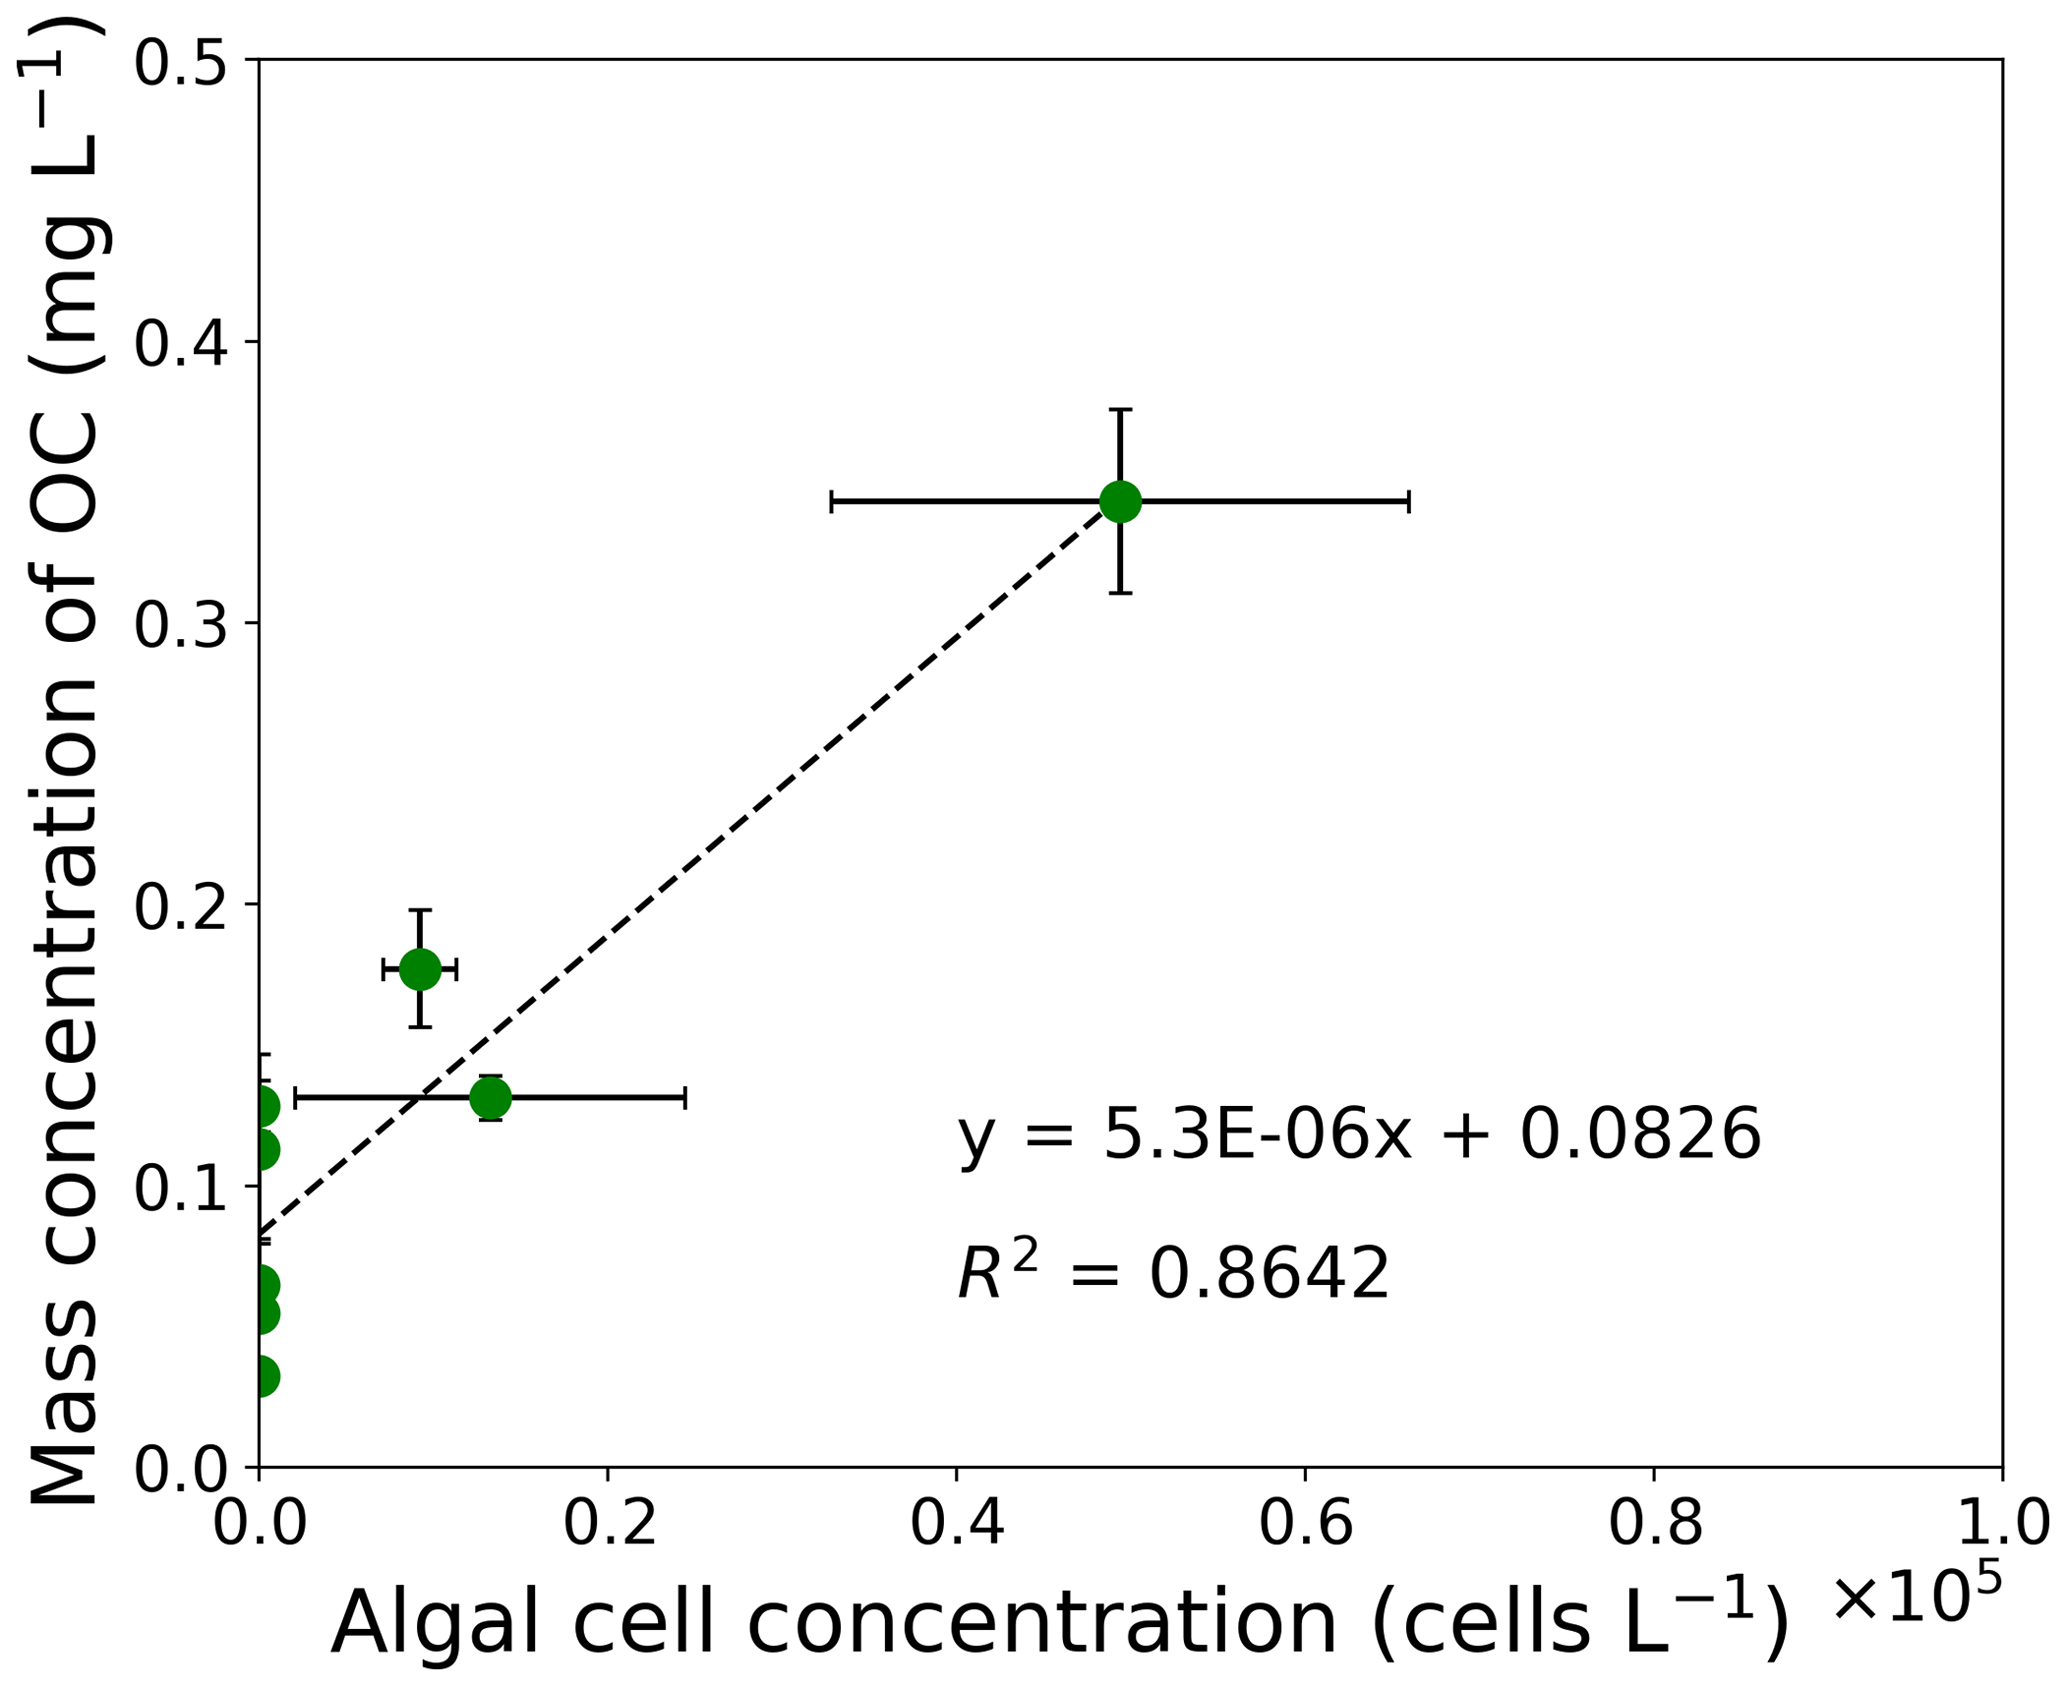
Figure 3Correlation chart between mass concentration of OC and algal cell concentration from filed measurements at the study site. The correlation coefficient is 0.93 (). Error bars: standard deviation.
The concentration of OC was positively correlated to algal cell concentration of S. nivaloides, as previously quantified by Onuma et al. (2018). The concentration of algal cells ranged from 0 to 4.9×10⁴ cells L−1 in the surface snow from day 168 to day 215 (Fig. 3). The relationship between algal cell and OC concentrations exhibited a significant positive linear correlation (r=0.93, ). Based on the relationship, a regression line was obtained as follows:
where CAlgae is algal cell concentration (cells L−1) in surface snow. This COC (mg L−1) was used as an input variable for simulation of PBSAM in this study.
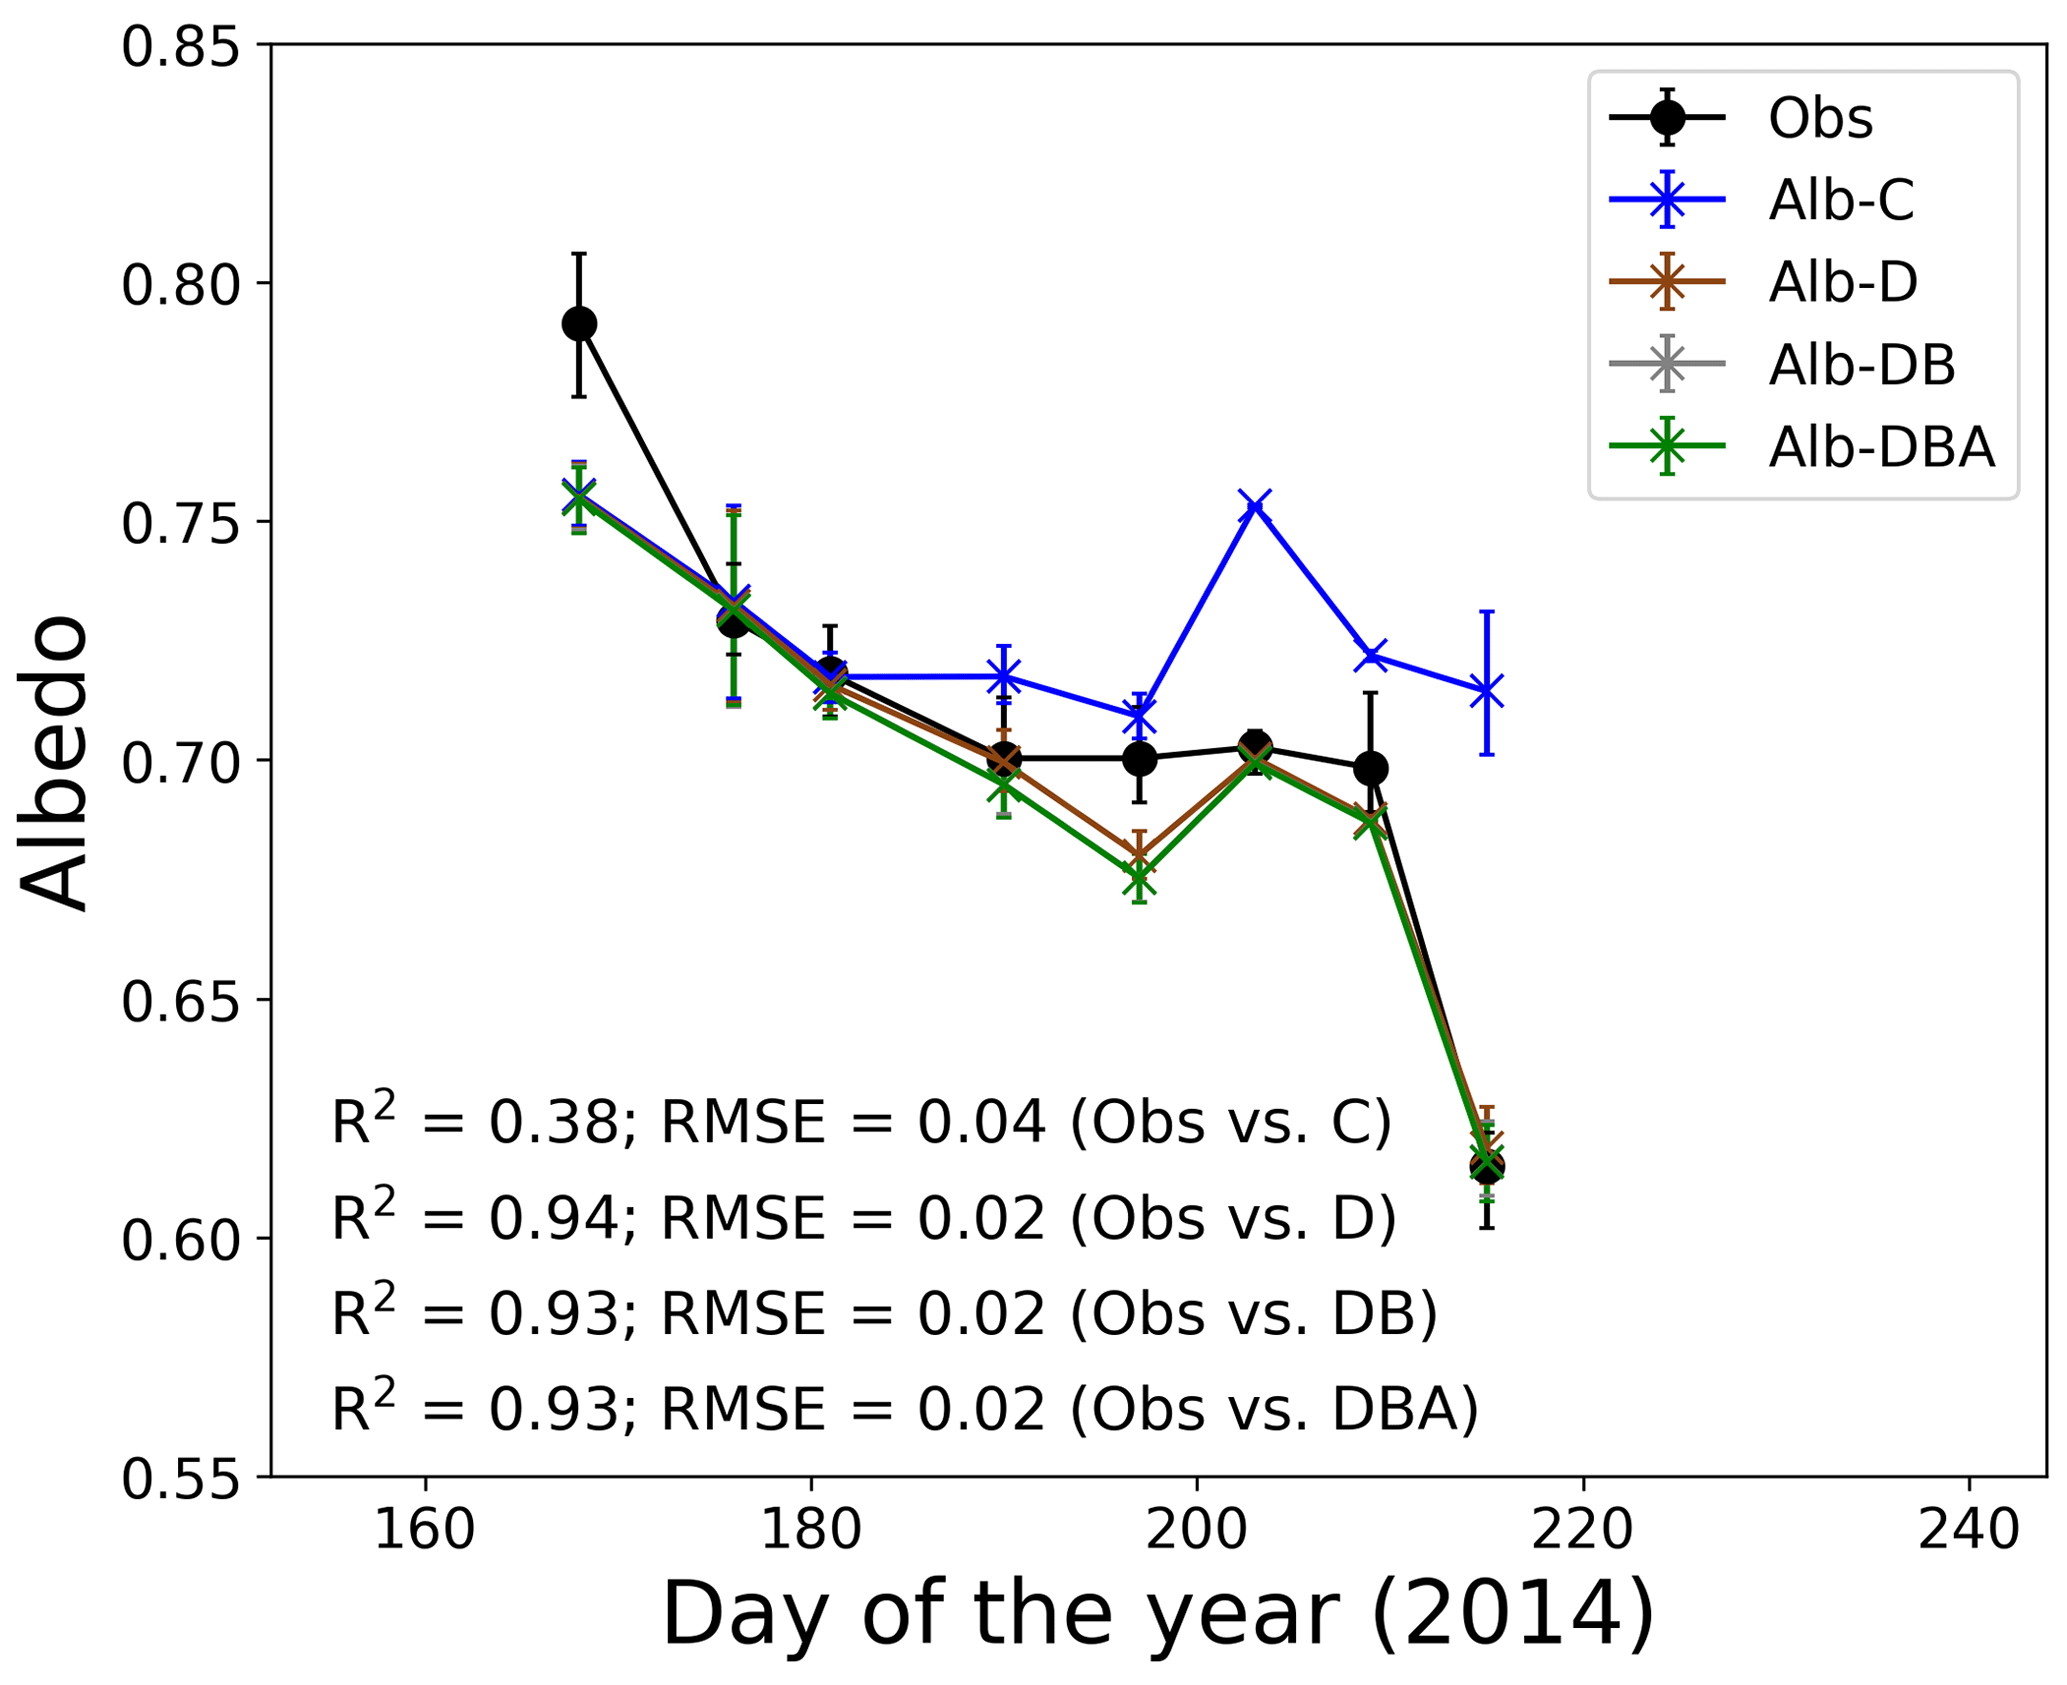
Figure 4Temporal changes in observed and calculated snow albedo at the study site. Solid symbols indicate observed snow albedo. Cross symbols indicate four simulations of snow albedo based on the assumption of snow impurity inclusions. Error bars indicate the albedo range simulated using the meteorological conditions at 10:00, 11:00 and 12:00 LT.
3.3 Temporal changes in snow albedo simulated with PBSAM
Snow albedos simulated with the effect of only MD (Alb-D), with MD and BC (Alb-DB), and with MD, BC and snow algae (Alb-DBA) gradually decreased from mid-June to early August, whereas the snow albedo calculated without the effect of any impurity (Alb-C) did not change significantly (Fig. 4). Physical properties of snow, snow impurities and meteorological conditions from 10:00 to 12:00 LT and used as input data for the simulation are presented in the Supplement (Tables S1–S5). Mean Alb-C ranged from 0.709 to 0.753 during the study period, but the change was not statistically significant. Mean Alb-DBA was 0.755 on day 168 and gradually decreased to 0.687 until day 209, followed by a large decrease to 0.616 on day 215. The temporal changes of Alb-D and Alb-DB were similar to that of Alb-DBA. Coefficients of determination for the regression (R2) between the calculated and observed albedo from day 168 to day 215 were 0.38 for Alb-C, 0.94 for Alb-D, 0.93 for Alb-DB and 0.93 for Alb-DBA. The root-mean-square errors (RMSEs) were 0.04 for Alb-C, 0.02 for Alb-D, 0.02 for Alb-DB and 0.02 for Alb-DBA. These results indicate that the three albedo simulations including snow impurities (Alb-D, Alb-DB and Alb-DBA) exhibited good performance in representing temporal changes of measured albedo.
4.1 Temporal changes of MD and BC on the snowpack
Differences in temporal changes in mass concentrations of MD and BC suggest that they were transported to the snow surface through different processes. Aoki et al. (2014b) have reported temporal changes in MD and BC concentrations in surface snow located at an elevation of 1490 m a.s.l. in northwest Greenland (SIGMA-A site, 78∘03′ N, 67∘38′ W). During their observations, from 28 June to 12 July 2012, the MD concentration in surface snow increased by a factor of 349 and reached 1.3 mg L−1 while BC concentration increased by only a factor of 5.4 and reached mg L−1. Their study suggested that the main factors explaining the increment were deposition from the atmosphere for MD and an enrichment following sublimation and evaporation of snow for BC. Geochemical analyses of MD on glaciers in the Arctic region, including Qaanaaq Glacier, suggested that it is likely to be supplied mainly from local ground surfaces (e.g., moraine near the glacier) rather than more distant areas (Nagatsuka et al., 2014, 2016; Tobo et al., 2019). The mass concentration of MD at the study site increased by a factor of 57 from mg L−1 on day 176 (25 June 2014) to 15.2 mg L−1 on day 190 (9 July 2014). The increase in MD concentration at the study site was likely due to exposure of the ground surface during the melting season. The mean BC concentration at the study site was mg L−1, which is the same order as those (from to mg L−1) at the SIGMA-A site, suggesting that BC at both sites was supplied from distant sources.
Temporal changes of calculated albedo suggest that MD is the main factor causing the reduction in albedo at the study site during the melting season. Alb-D and Alb-DB gradually decreased from mid-June to early August, whereas Alb-C did not change significantly during that period (Fig. 4). Thus, the reduction in albedo at the study site was due to the increase in snow impurities, rather than the changing of the snow grain size. The snow grain size did not change significantly after day 168. The differences of surface albedo between the Alb-C and Alb-D and between the Alb-D and Alb-DB were 0.1 and almost 0 on day 215, respectively, which were equivalent to the reduction in albedo caused by MD and BC, respectively. Although the MAC of BC used was larger than that of MD at any wavelength (Table 1), the effect of BC on albedo was smaller than the effect of MD. This was due to the greater concentration of MD on the snow surface.
4.2 Reproduction of temporal change in snow albedo using PBSAM, including the effects of snow algae
Temporal changes in algal cell concentration were positively correlated with that in the mass concentration of OC in surface snow, suggesting that snow algae can be regarded as the main constituent of OC in snow (Fig. 3). The positive correlation between the observed algal cell and OC concentrations in surface snow suggests that OC in snow can be approximated using the algal cell concentration at the study site. Indeed, S. nivaloides was the dominant species in snowpack at the study site throughout the summer season of 2014 (Onuma et al., 2018). However, significant amounts of OC were detected in snow samples without cells of S. nivaloides, indicating that these snow samples contained organic matter originating from other organisms (for example, bacteria and yeast-like fungi) and atmospheric OC aerosol. The intercept of 0.0826 of Eq. (3) can be interpreted as being contributed from the other organisms and the atmospheric OC aerosol. In fact, Chroococcaceae cyanobacterium, which is a cyanobacterium found commonly on glaciers and snowpacks in Greenland, was observed on the surface snow of the study site from mid-June to early August in 2014 (Onuma et al., 2018). However, its effect was neglected in the present study because the concentration was much smaller than the abundance of S. nivaloides at the study site.
The MACs for snow algae in this study were likely to reproduce characteristics of light absorption caused by a snow algal bloom. In order to calculate the effects of light absorption by snow algae on snow albedo, we assumed that four pigments accounted for absorption in each cell. These pigments are major light absorption pigments for red snow algae (Cook et al., 2017a). Spectral variation in the imaginary part of refractive indices for wavelengths in this study, calculated from the four algal pigments, agreed with the spectral variation in that estimated from observed spectral reflectance of the red snow surface on the Qaanaaq Glacier (Aoki et al., 2013). The result suggests that the imaginary part of refractive indices in this study can reproduce the light absorption based on theoretical optical characteristics of S. nivaloides.
Temporal change of snow albedo (Alb-DBA) on the snowpack at the study site was simulated with the PBSAM, including the effects of the three impurities (MD, BC and snow algae), for the study period (from day 168 to 215). The result indicates that the model that included the total effect of MD, BC and snow algae was the best in reproducing temporal changes throughout the study period. The values of R2 and RMSE between the observed albedo and modeled Alb-DBA from days 168 to 215 were 0.93 and 0.016, respectively. Furthermore, the Alb-DBA exhibited good performance in simulations with MD and BC only (Alb-DB). However, there was no significant difference in model performance among these simulations. This is probably due to the lower cell concentration at the study site, which was cells L−1 (mean ± SD) on day 215, when compared with that of typical red snow appearing on oligotrophic polar or alpine snow, which ranges from 3.2×10⁶ to 2.0×10⁸ cells L−1 (Thomas and Duval, 1995; Takeuchi and Koshima, 2004; Takeuchi et al., 2006; Stibal et al., 2007; Takeuchi, 2013; Lutz et al., 2014; Tanaka et al., 2016; Onuma et al., 2018; Procházková et al., 2018). In fact, visible red snow was not seen on day 215 at the study site. The spectral reflectance of the surface snow was consistent with this; it did not show the typical spectral absorption of the algal pigments (carotenoids and chlorophyll), which have absorption peaks in the wavebands of 400–600 and 670–680 nm (Painter et al., 2001; Takeuchi et al., 2006). The snow albedo simulation by Cook et al. (2017a) suggested that algal abundance of 10 µg of algae per gram of snow, which is equivalent to 5.9×10⁴ cells L−1 for a snow density of 600 kg m−3, has little effect on the spectral absorption between 400 and 2200 nm.
4.3 Simulation of temporal changes in surface snow albedo using PBSAM and a snow algae model
Although our field observations ended on day 215, snow algal abundance could further increase until the end of the melting season. In order to infer temporal changes in snow albedo for the whole melting season, we calculated snow albedo using the PBSAM and a snow algae model proposed by Onuma et al. (2018). Temporal changes in abundance of S. nivaloides on surface snow of Qaanaaq Glacier can simply be expressed by a differential logistic growth equation. Microbial growth was therefore calculated as follows (Onuma et al., 2018):
where X and X0 are population densities of microbes at t and t0, respectively, and μ is the growth rate of microbes in t−1. K is the carrying capacity of algae in the snow surface and t0 is the day of the first appearance of algae on the snow surface. t represents the number of the days during which the snow surface temperature was above 0 ∘C, because snow algal growth mainly occurs on the melting snow surface. Although this model assumes algal growth on the snow surface, the algal cells observed in the surface snow were mostly cyst stage, which do not divide and thus do not actively increase their population. The algae may divide at the subsurface or deeper layers in the snowpack. Therefore, the increase in algal cells at the snow surface may be due to not only their growth but also accumulation at the surface as snow melts. However, their actual life cycle is still uncertain on this glacier. In this study, we use this model, which may include growth and/or accumulation of the algal cells but can reasonably reconstruct the observation of their seasonal change on the snow surface of the study site (Onuma et al., 2018).
Snow surface temperatures at the study site were obtained from the AWS data (Onuma et al., 2018). Parameters for the algae, including the initial cell concentration, algal growth rate and carrying capacity, were also the same as those in the previous study ( cells L−1, 0.39 d−1 and 3.2×10⁶ cells L−1, respectively; Onuma et al., 2018). Because the snowpack at the site was unlikely to have disappeared after day 215, snow algae possibly increased on the surface snow beyond day 215. The calculation showed that algal cell concentration significantly increased from days 216 to 233 (1.5×10⁵ to 1.6×10⁶ cells L−1) and then remained constant until the end of the melting season (Fig. 5).
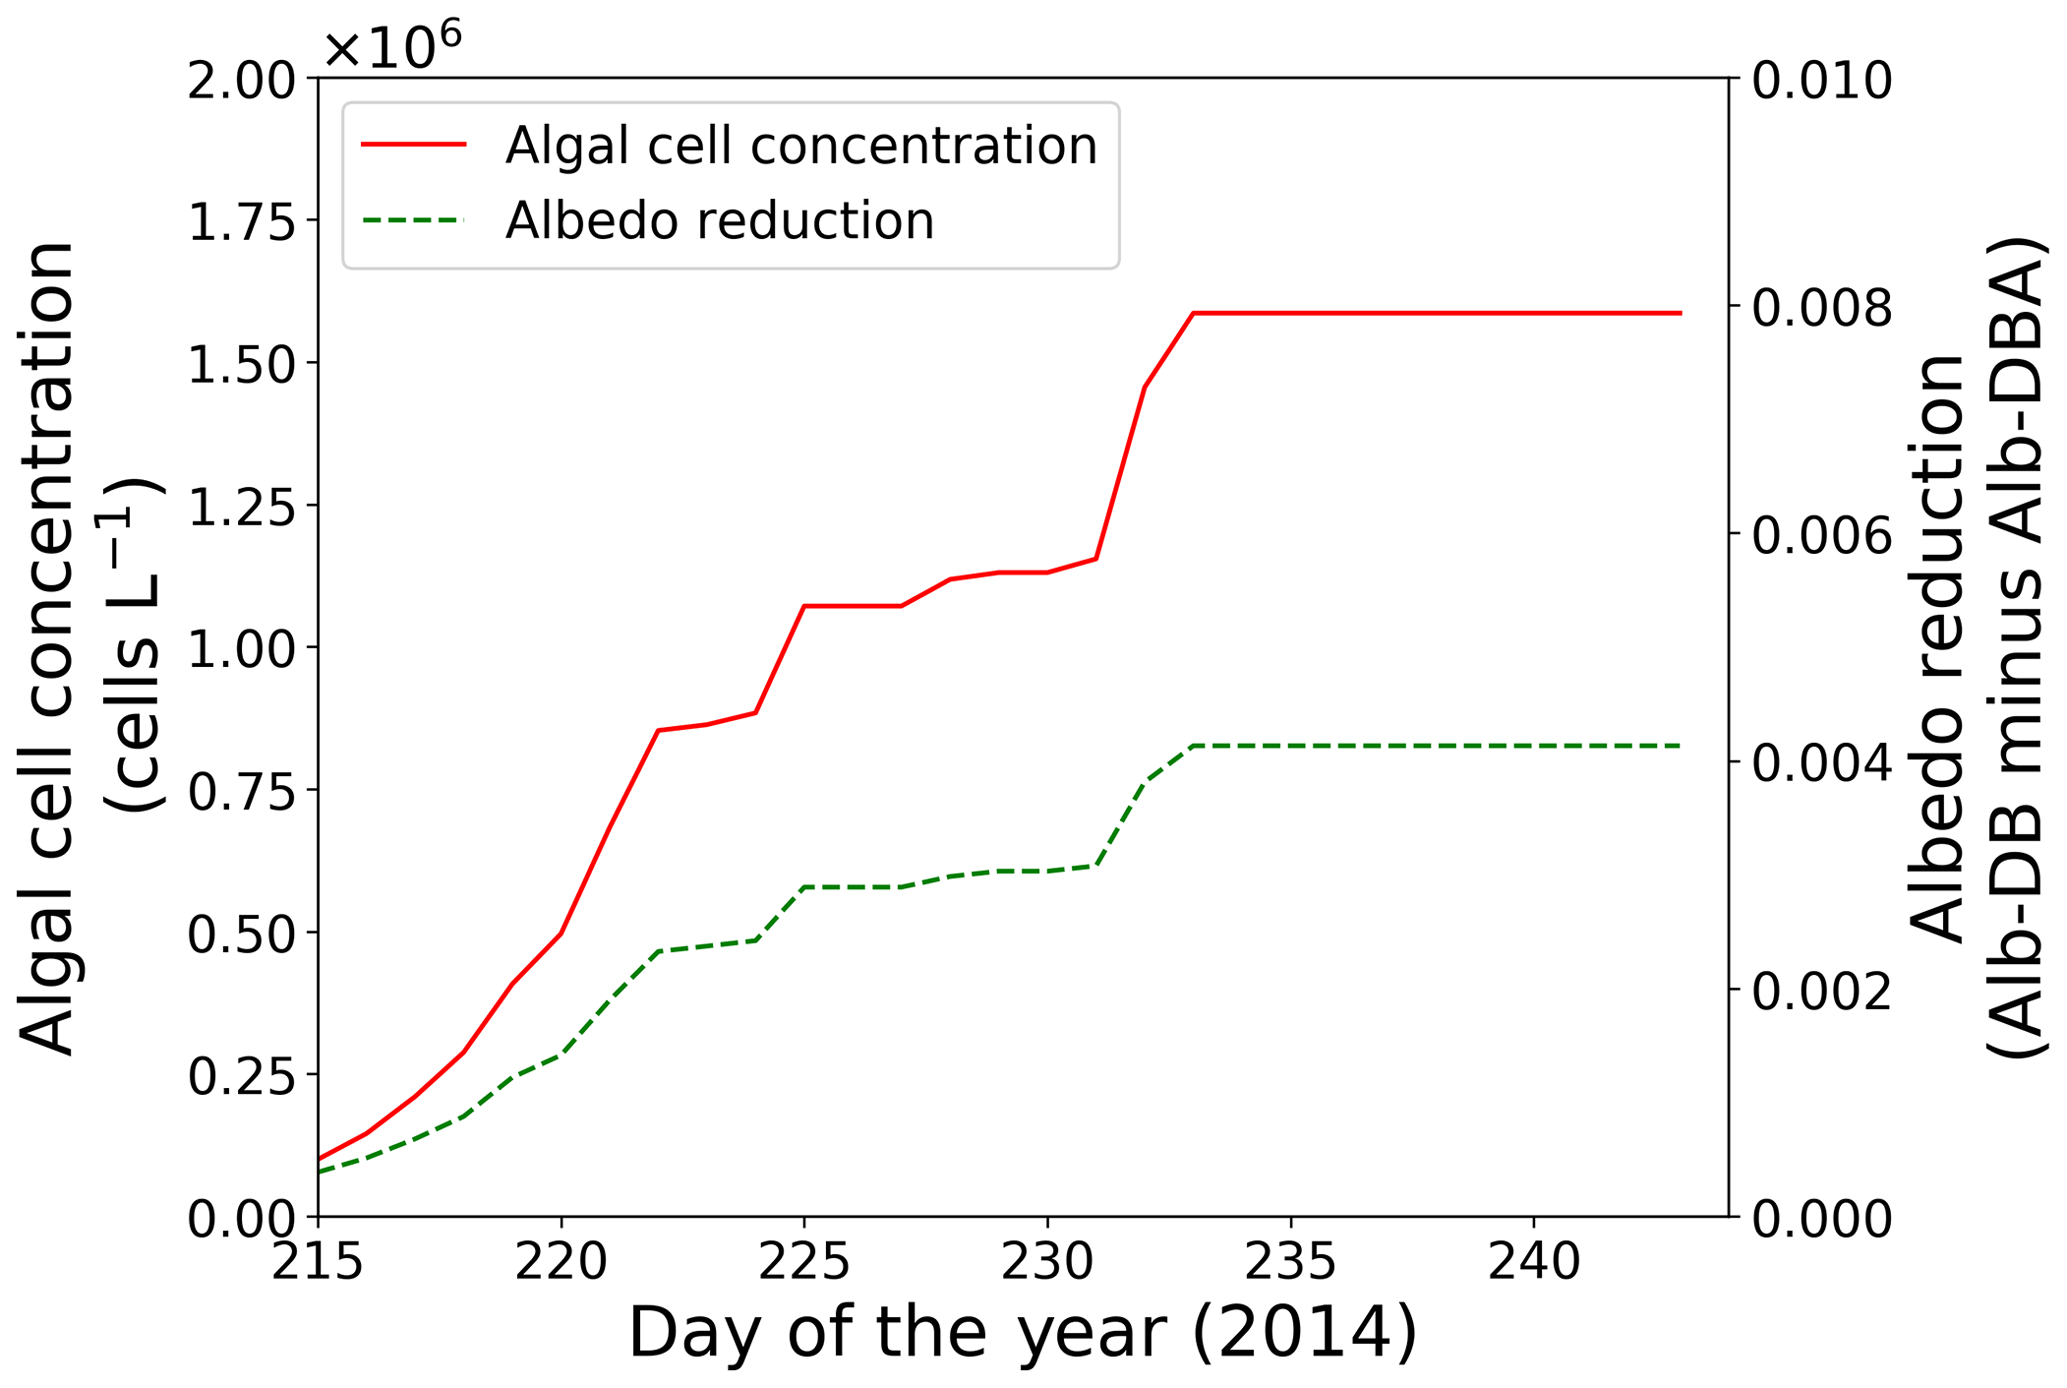
Figure 5Temporal changes in algal cell concentration and albedo reduction from days 215 to 243 at the study site; algal cell concentration (red solid line) and albedo reduction (green dotted line).
Simulation of snow albedo using PBSAM, coupled with the snow algae model, was conducted on the snowpack at the study site for the entire melting season in 2014 (Fig. 5). The meteorological conditions, snow physical properties and inorganic impurities were assumed to be constant after the last observation on day 215 (Tables S1–S5). Consequently, Alb-DBA was 0.616 on day 216 and 0.612 at the end of the melting season (day 233). The effects of the snow algae (the difference between Alb-DB and Alb-DBA) were 0.001 and 0.004 on days 216 and 233, respectively, indicating that snow albedo was significantly decreased owing to the blooms of red snow late in the melting season (August).
4.4 Possible albedo reduction in the presence of red snow blooming
We validated the albedo reduction for high algal abundance using the snow albedos of red snow surface on oligotrophic polar or alpine snow reported by previous studies (Painter et al., 2001; Takeuchi et al., 2006; Takeuchi, 2013; Lutz et al., 2014) (Table 2). The algal cell concentrations obtained from their field measurements were used as input variables in surface (0–2 cm) and subsurface (2–10 cm) snow. These algal cell concentrations were converted into COC using Eq. (3). Our observational data on day 215 (meteorological, snow physical and impurity conditions) were used as other input data of these simulations. The simulation using the cell concentration observed by Painter et al. (2001) demonstrated that the difference between Alb-DB and Alb-DBA was 0.062, which is equivalent to the albedo reduction by snow algae and in agreement with the algal albedo reduction (0.07) observed by Painter et al. (2001). This reduction in albedo was also close to the result of another simulation with the bio-albedo model proposed by Cook et al. (2017a, algal albedo reduction = 0.07). Thus, both our PBSAM and the bio-albedo model can consistently reproduce the reduction in albedo based on the optical properties of S. nivaloides. The simulation using the cell concentration observed by Takeuchi (2013) suggested that the simulated albedo reduction was close to the observed one (model: 0.105; observation: 0.12). In contrast, the simulation using the cell concentration reported by Lutz et al. (2014) produced an albedo reduction by snow algae of 0.015, which was lower than that observed by them (0.09) and calculated with the bio-albedo model (0.09). This is probably owing to different algal pigments in the ice surfaces. Lutz et al. (2014) reported that glacier algae (filamentous cells: 6.1×10⁶ cells L−1) were found in addition to snow algae (spherical cells: 1.8×10⁶ cells L−1) in the samples collected at their study site (MIT-17). The phenolic pigments of glacier algae have a broader bandwidth of spectral absorption than the carotenoids and chlorophyll of S. nivaloides (Remias, 2012; Williamson et al., 2020). In the albedo simulation with the bio-albedo model, measured pigment compositions (total chlorophyll, primary and secondary carotenoids) were used as model parameters while our simulation only used MAC for snow algae (S. nivaloides). The simulation using the cell concentration reported by Takeuchi et al. (2006) showed that the simulated albedo reduction underestimated the observed albedo reduction (model: 0.072, observation: 0.099). This may be due to the difference between the observed and parameterized cell size. Our PBSAM assumed that the cell size of S. nivaloides is 11.4 µm, whereas that measured by Takeuchi et al. (2006) was 17.5 µm. Because the MACs for red snow were estimated using the cell size of 11.4 µm, the simulated mass absorption might underestimate the intact mass absorption for red snow algae. Unfortunately, we have only the validation data in the study site (MD, BC and OC concentrations and snow physical properties in surface and subsurface snow layers). The detailed time series observation, including analysis of cell size, pigment composition and algal community, should be conducted at other sites to evaluate our albedo model. Moreover, the detailed spatial measurements of algal cell abundance and snow albedo would also be needed because the patchy red color caused by the blooms of snow algae often appears on oligotrophic polar and alpine snow.

Figure 6The relationship between reduction in snow albedo and algal cell concentration. Albedo reductions were calculated from the difference in Alb-DB and Alb-DBA simulated with an assumed algal cell density and (a) snow grain size or (b) MD concentrations. Grey shades indicate the range of the albedo reduction simulated with snow grain size ranging from 0.3 to 1.5 mm or MD concentration from 0 to 150 mg L−1, respectively.
4.5 Potential for albedo reduction caused by blooms of red snow
Using the PBSAM, we conducted sensitivity analyses to quantify the reduction in albedo with different concentrations of snow algae. Figure 6 shows the albedo reduction by snow algae (Alb-DB minus Alb-DBA) as a function of algal cell concentration for various snow grain sizes or MD concentrations on the surface snow. Algal cell concentrations ranged from 4.9×10⁴ to 2.0×10⁸ cells L−1, which cover the range of cell concentrations for typical red snow reported previously on oligotrophic polar and alpine snow (Thomas and Duval, 1995; Takeuchi and Koshima, 2004; Takeuchi et al., 2006; Stibal et al., 2007; Takeuchi, 2013; Lutz et al., 2014; Tanaka et al., 2016; Onuma et al., 2018; Procházková et al., 2018). Various snow grain sizes and MD concentrations were used in the simulation (0.3–1.5 mm and 0–150 mg L−1, respectively), which were based on observations on day 215 in this study (0.87 mm and 75 mg L−1, respectively). Observational data on day 215 (meteorological, snow physical and snow impurity conditions) were used as other input data for this simulation. The simulation demonstrated that the albedo reduction by snow algae ranged from 0 to 0.196 (algal cell concentration: 4.9×10⁴ to 2.0×10⁸ cells L−1) with an MD concentration of 75 mg L−1, consistent with the algal albedo reduction estimated for red algal abundances observed on various arctic glaciers (a maximum reduction of 0.2; Lutz et al., 2016). Thus, the simulation with our albedo model was comparable to the visible blooms of red snow.
4.6 Light absorption of algal cells in different snow grain sizes and inorganic impurity concentrations in snow
Sensitivity analyses with PBSAM using different snow algal cell concentrations and grain sizes suggested that increased snow grain size in a snow layer can enhance light absorption by snow algal cells arising from deeper penetration of incident radiation through snowpack. The difference between Alb-DB and Alb-DBA was larger when snow grain size was large (1.2 mm, albedo reduction: 0–0.21; Fig. 6a). Conversely, the difference was smaller when snow grain size was smaller (0.6 mm, albedo reduction: 0–0.18). Aoki et al. (2011) suggested that light penetration depth in snow composed of coarse grains is deeper, enhancing light absorption by inorganic impurities due to increased scattering of light. Therefore, increased snow grain size possibly enhances albedo reduction by snow algae. Blooms of red snow algae could accelerate the increase in snow grain size because of the increase in penetration of incoming radiation within the snowpack, leading to further reduction in snow albedo.
Increases in MD and BC concentrations in a snowpack possibly weaken the scattering of light in the snowpack and reduce the amount of light absorbed by snow algae. The difference between Alb-DB and Alb-DBA was smaller when MD concentrations were larger (100 mg L−1, albedo reduction: 0–0.18; Fig. 6b). Conversely, the difference was larger when MD concentrations were reduced (50 mg L−1, albedo reduction: 0–0.21). These results suggest that algal cells absorb more light when MD concentrations were smaller, compared with a higher MD concentration. The albedos calculated with different BC concentrations also confirmed this result. The higher concentrations of MD or BC may decrease the intensity of light scattered in snow layers, thereby resulting in reduced light absorption by algae. There is limited information about the effect of MD and BC on algal light absorption in snowpacks, and a recent study suggested that the interaction between algal cells and other impurities in snow should be investigated (Cook et al., 2017a). Although further study is necessary to investigate in situ interactions among snow algae and inorganic impurities in snowpack, our simulation suggests that increased concentrations of inorganic snow impurities weaken algal light absorption due to a reduction of the intensity of scattered light in snow.
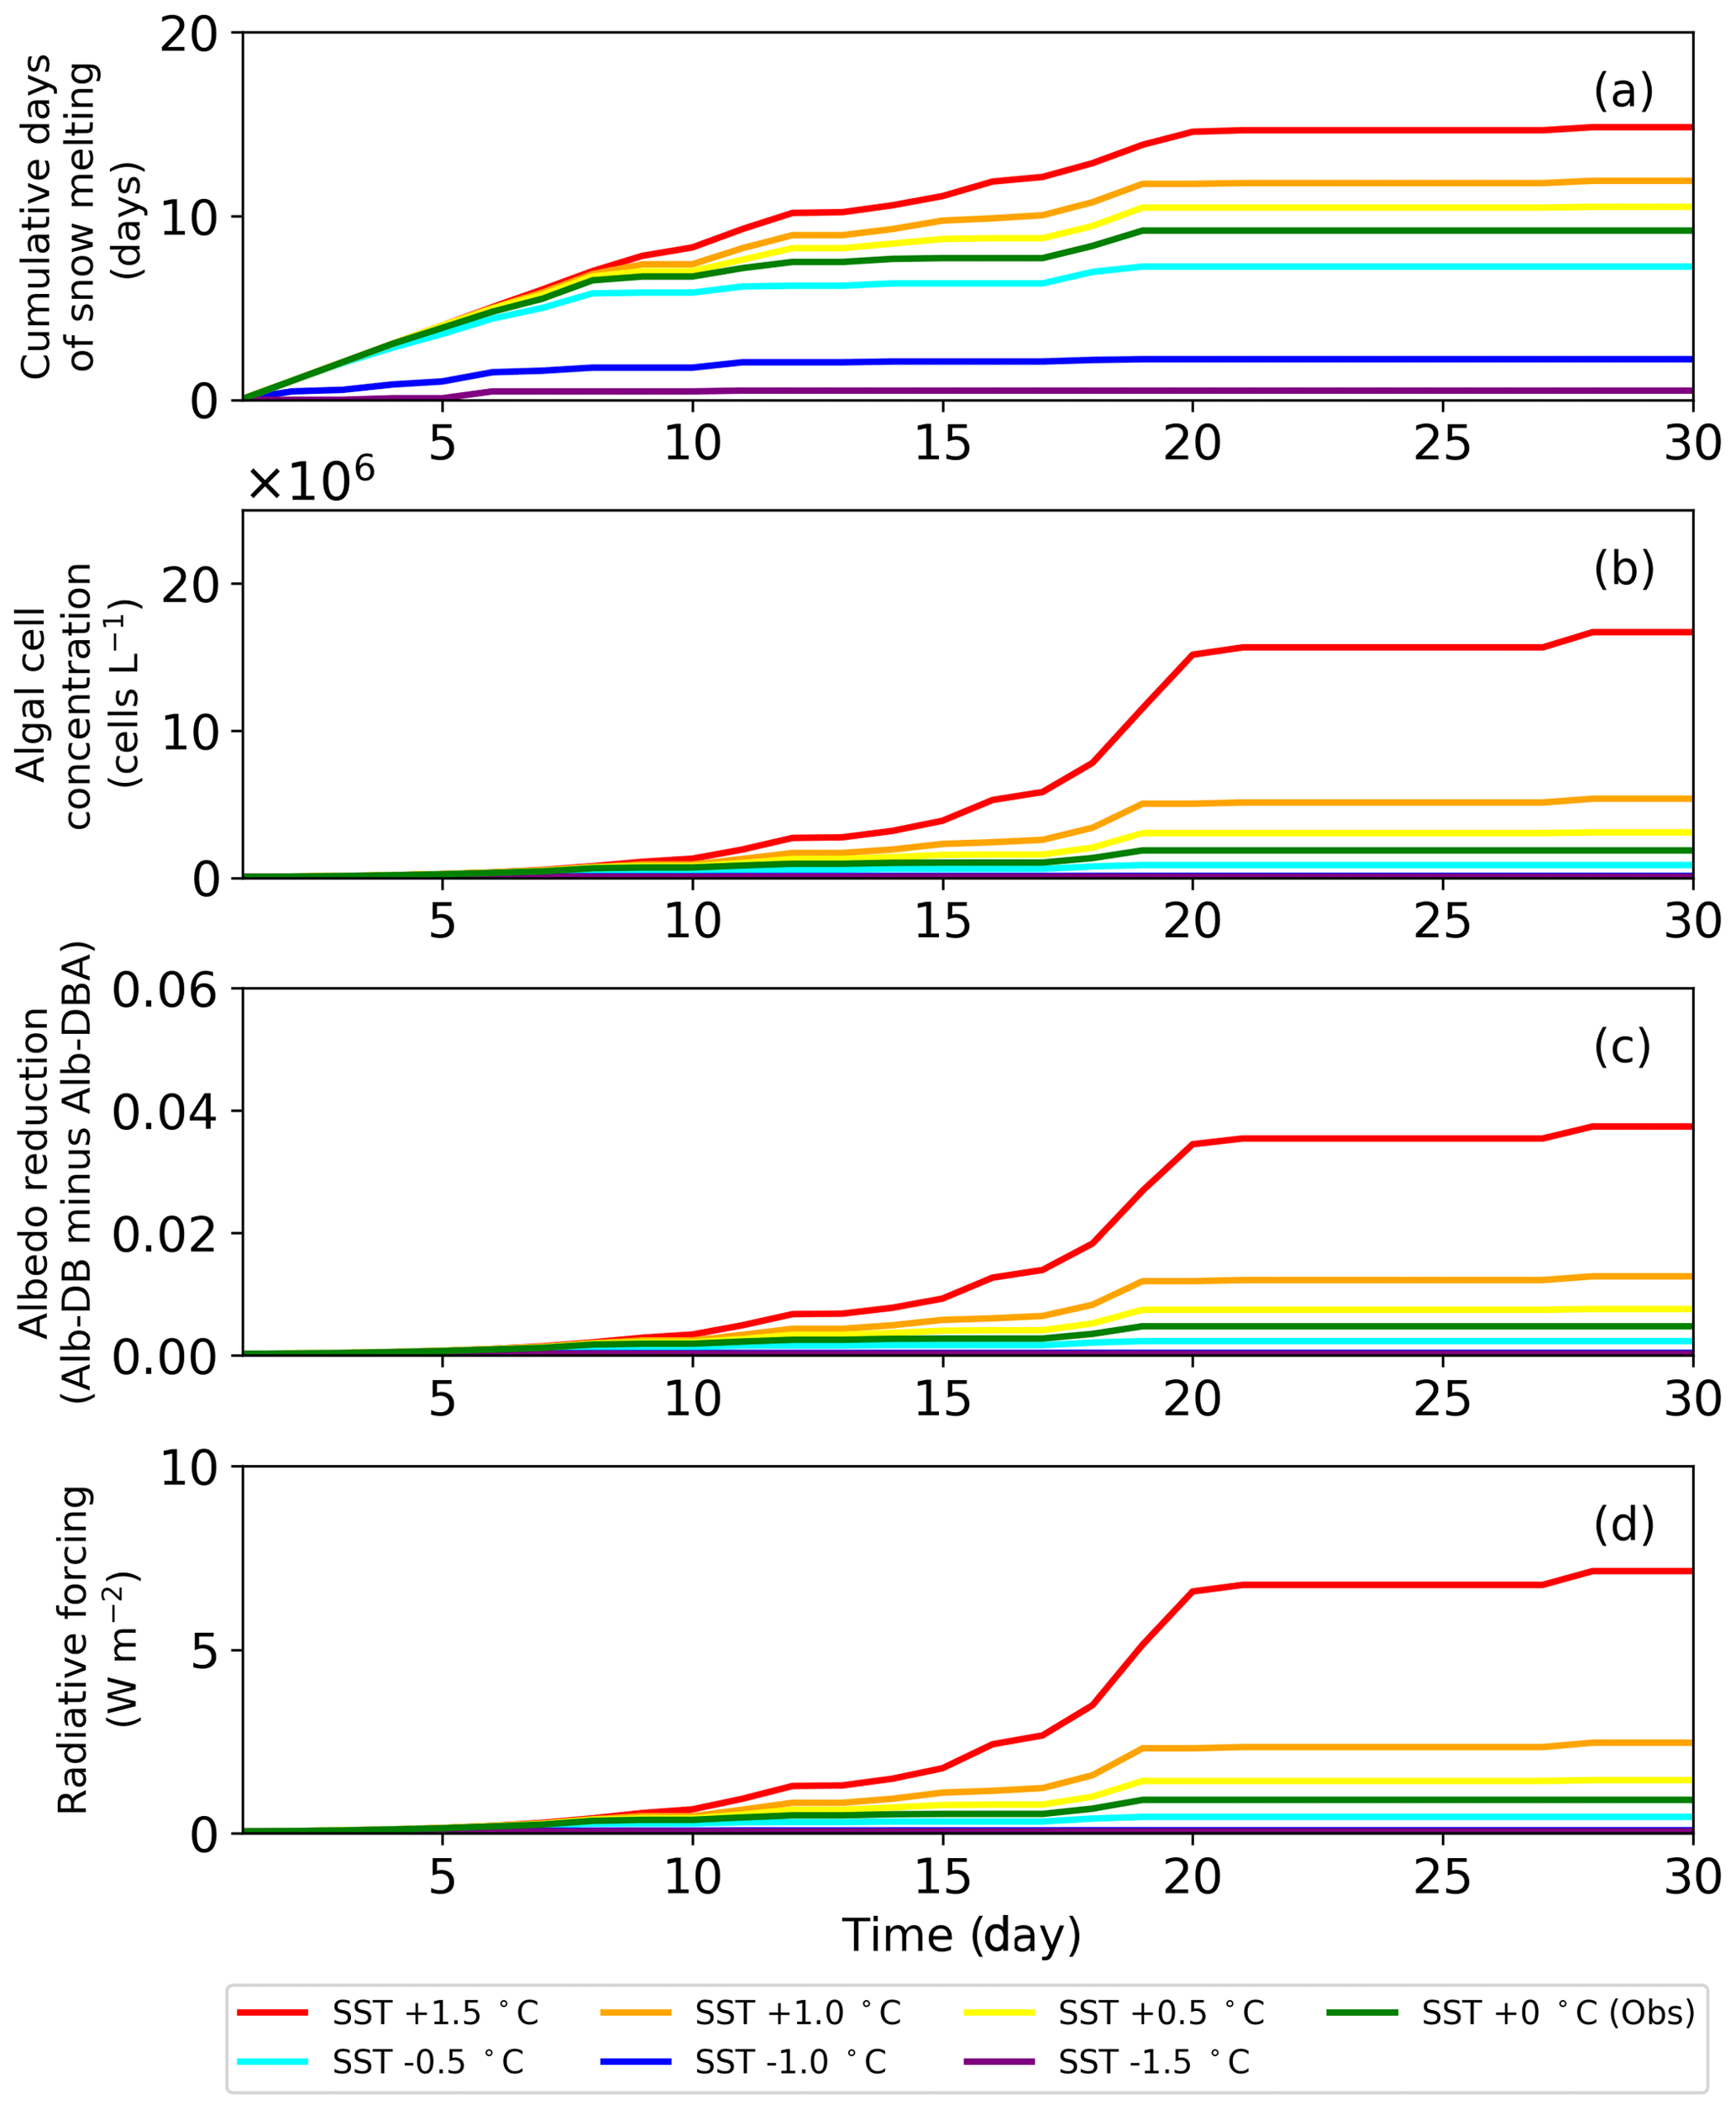
Figure 7Temporal changes in (a) cumulative days of snow melting (b) algal growth, (c) albedo reduction by snow algae and (d) radiative forcing by snow algae for 30 d under various surface snow temperature (SST) conditions at the study site.
4.7 Radiative forcing of algal cells
To quantitatively assess the effects of red snow blooming on the net shortwave radiation, we calculated the radiative forcing from the observed downward shortwave radiation multiplied by the difference of Alb-DB and Alb-DBA, following the method of Niwano et al. (2012). Meteorological conditions measured from 10:00 to 12:00 LT on day 215 were used to calculate the radiative forcing. The calculations demonstrated that the radiative forcings ranged from 0 to 0.1 W m−2 (mean: 0.1 W m−2) and 18.0 to 63.6 W m−2 (mean: 37.5 W m−2) when cell concentrations were 4.9×10⁴ and 2.0×10⁸ cells L−1, respectively. The difference of Alb-DB and Alb-C was used to calculate the radiative forcing of total MD and BC, and on day 215 at the study site the forcing ranged from 8.4 to 33.9 W m−2 (mean: 19.4 W m−2). Cell concentrations of S. nivaloides in visibly red snow surfaces ranged from 1.0 ×10⁶ to 5.0 ×10⁷ cells L−1 in Greenland (Lutz et al., 2014, 2016; Onuma et al., 2018). The radiative forcings calculated with these cell concentrations were equivalent to the range from 0.2 to 8.3 W m−2. Our calculations suggest that prominent blooms of red snow (5.0×10⁷ cells L−1, equivalent to 300 mg L−1) have the potential to increase radiative forcing equal to that caused by total MD (75 mg L−1) and BC ( mg L−1), although further field observation and model validation in various snowfields are needed to discuss the potential for studying albedo reduction arising from blooms of red snow.
4.8 Temporal changes in snow albedo reduction caused by red snow algae under warming conditions
The sensitivity test of PBSAM, coupled with the snow algae model, suggested that albedo reduction by snow algae reached a maximum of 0.04, equivalent to a radiative forcing of 7.5 W m−2, when surface snow temperature was increased by 1.5 ∘C in August 2014, at the study site. Monthly mean surface air temperature at the study site, from 2012 to 2017, which was measured with the SIGMA-B AWS, ranged from −2.9 to 0.2 ∘C in August (2014 season: −1.2 ∘C). Because the cell concentration of S. nivaloides continuously increased during snow melting (Onuma et al., 2018), the abundance of snow algae at the study site could differ each year. In this study, we simulated temporal changes in snow albedo during the late summer season using PBSAM coupled with a snow algae model, while assuming various surface snow temperatures to estimate the impact of red snow algal growth on snow albedo under climate change (Fig. 7). The simulation was conducted for 30 d, starting on day 215. The surface snow temperature assumed was the observation plus or minus 0.5, 1.0 and 1.5 ∘C, but we kept 0 ∘C in case the temperature exceeded 0 ∘C. The initial cell concentration, algal growth rate and carrying capacity were 4.9×10⁴ cells L−1, 0.39 d−1 and 2.0×10⁸ cells L−1, respectively. The algal cell concentration obtained from the snow algae model was used in PBSAM to calculate surface albedo (Fig. 7b). The other variables used in the PBSAM are from observational data on day 215. Our simulations suggested that snow algae can exhibit additional growth in warmer conditions, resulting in a larger reduction in albedo, equivalent to larger radiative forcing. In particular, simulations with surface snow temperature of plus 1.5 ∘C demonstrated that the reduction in albedo and radiative forcing significantly increased for 30 d (red lines in Fig. 7). Although there is little information pertaining to blooms of red snow on surface snow in Greenland, satellite observations have detected the blooms on surface snow caused by growth of S. nivaloides in southeast Greenland (Hisakawa et al., 2015). Ganey et al. (2017) suggested that the red snow area detected by Landsat 8 extended over about 700 km2 on an Alaskan ice field, and the red snow was responsible for 17% of the total snowmelt there. Further study is necessary to simulate snow albedo with the inclusion of the effect of red algal growth over the Greenland Ice Sheet. Future climate warming in Greenland may expand the area of red snow in the near future, leading to accelerated loss in mass of the Greenland Ice Sheet.
Temporal changes in snow albedo of Qaanaaq Glacier in northwest Greenland were calculated with a physical snow albedo model that incorporated the effect of three snow impurities (MD, BC and snow algae). A PBSAM (Aoki et al., 2011) can calculate snow albedo using meteorological conditions, snow physical properties and snow inorganic impurities. To quantify the effect of red snow blooming on snow albedo, we calculated a light absorption coefficient for red snow algae, based on geometry and the pigment composition of red snow algae (Sanguina nivaloides, which was renamed recently from Chlamydomonas nivalis) and introduced this coefficient into PBSAM. In addition, we simulated a temporal change in snow albedo using this PBSAM coupled with a simple numerical model for snow algal abundance (Onuma et al., 2018). The calculated albedo agreed with the observed albedo during the algal growing period, from late June to early August, although the algal cell concentration did not reach the level of typical red snow blooming during the observation period. We also calculated the snow albedo of the typical red snow blooming surface previously reported and demonstrated that it agreed with the observed snow albedo. Our simulation suggests that typical red snow blooming has the potential to reduce snow albedo by 0.21, equivalent to a radiative forcing of 40 W m−2. Finally, we conducted scenario simulations (surface snow temperature of plus or minus 1.5 ∘C) in order to estimate a possible albedo reduction by snow algae in the near future. The albedo reduction by snow algae only equaled 0.04 (radiative forcing: 7.5 W m−2) during a warmer ablation season (surface snow temperature of +1.5 ∘C) in northwest Greenland, suggesting that climate warming in the near future of Greenland Ice Sheet may expand the area of red snow and further accelerate a loss of the mass balance. Our model can simulate surface albedo in the broadband wavelength (300–3000 nm) range, including the effects of both organic and inorganic impurities, and it can independently estimate the reductions in albedo arising from each impurity (MD, BC and snow algae). Intercomparison with other albedo models (e.g., the bio-albedo model proposed by Cook et al., 2017a) would be useful to develop the albedo model and to further understand the process of albedo reduction arising from microbial activities on snow and ice. Although further study is necessary to understand dynamics of organic and inorganic impurities in the snowpack, the physical model of snow albedo coupled with the snow algae model have the potential to provide a mechanistic understanding of temporal changes of snow albedo over the Greenland Ice Sheet by incorporating microbial activity on the snow and ice. In the future, coupling a regional climate model NHM-SMAP (Niwano et al., 2018), which uses PBSAM as the snow albedo scheme, and the snow algae model will enable us to estimate the effect of red snow blooming on the melting of snow.
All of the observation and model input and output data presented in this study are available upon request to the corresponding author (Yukihiko Onuma, onuma@iis.u-tokyo.ac.jp).
The supplement related to this article is available online at: https://doi.org/10.5194/tc-14-2087-2020-supplement.
YO and NT designed the study and wrote the paper. YO and TA established the light absorption coefficient for red snow algae and simulated snow albedo with PBSAM. YO, ST and NN collected snow samples and observed snow physical properties. YO and ST analyzed the collected data. MN and TA prepared the SIGMA AWS data and provided technical support.
The authors declare that they have no conflict of interest.
We would like to thank the filed campaign members of the SIGMA (Snow Impurity and Glacial Microbe effects on abrupt warming in the Arctic) project and GRENE (the Green Network of Excellence) Arctic Climate Change Research Project in Greenland in 2014. We also thank the two reviewers (Daniel Remias and Marian Yallop) and the editor (Elizabeth Bagshaw) for helpful suggestions that greatly improved this paper.
This research has been supported by JSPS-KAKENHI (grant nos. 23221004,26247078, 26241020, 16H01772, 18H03363, 19H01143 and 20K19955) and the Arctic Challenge for Sustainability (ArCS and ArCS II) projects.
This paper was edited by Elizabeth Bagshaw and reviewed by Daniel Remias and Marian Yallop.
Andreae, M. O. and Gelencsér, A.: Black carbon or brown carbon? The nature of light-absorbing carbonaceous aerosols, Atmos. Chem. Phys., 6, 3131–3148, https://doi.org/10.5194/acp-6-3131-2006, 2006.
Aoki, Te., Aoki, Ta., Fukabori, M., Hachikubo, A., Tachibana, Y., and Nishio, F.: Effects of snow physical parameters on spectral albedo and bidirectional reflectance of snow surface, J. Geophys. Res., 105, 10219–10236, https://doi.org/10.1029/1999JD901122, 2000.
Aoki, T., Hori, M., Motoyoshi, H., Tanikawa, T., Hachikubo, A., Sugiura, K., Yasunari, T. J., Storvold, R., Eide, H. A., Stamnes, K., Li, W., Nieke, J., Nakajima, Y., and Takahashi, F.: ADEOS-II/GLI snow/ice products – Part II: Validation results using GLI and MODIS data, Remote Sens. Environ., 111, 274–290, https://doi.org/10.1016/j.rse.2007b.02.035, 2007.
Aoki, T., Kuchiki, K., Niwano, M., Kodama, Y., Hosaka, M., and Tanaka, T.: Physically based snow albedo model for calculating broadband albedos and the solar heating profile in snowpack for general circulation models, J. Geophys. Res., 116, D11114, https://doi.org/10.1029/2010JD015507, 2011.
Aoki, T., Kuchiki, K., Niwano, M., Matoba, S., Uetake, J., Masuda K., and Ishimoto, H.: Numerical Simulation of Spectral Albedos of Glacier Surfaces Covered with Glacial Microbes in Northwestern Greenland, Radiation Processes In The Atmosphere And Ocean (IRS2012), edited by: Cahalan, R. and Fischer, ALP Conf. Proc., 1531, 176, https://doi.org/10.1063/1.4804735, 2013.
Aoki, T., Matoba, S., Uetake, J., Takeuchi, N., and Motoyama, H.: Field activities of the “Snow Impurity and Glacial Microbe effects on abrupt warming in the Arctic” (SIGMA) project in Greenland in 2011–2013, Bull. Glaciol. Res., 32, 3–20, https://doi.org/10.5331/bgr.32.3, 2014a.
Aoki, T., Matoba, S., Yamaguchi, S., Tanikawa, T., Niwano, N., Kuchiki, K., Adachi, K., Uetake, J., Motoyama, H., and Hori, M.: Light-absorbing snow impurity concentrations measured on Northwest Greenland ice sheet in 2011 and 2012, Bull. Glaciol. Res., 32, 21–31, https://doi.org/10.5331/bgr.32.21, 2014b.
Bøggild, C. E., Brandt, R. E., Brown, K. J., and Warren, S. G.: The ablation zone in northeast Greenland: ice types, albedos and impurities, J. Glaciol., 56, 101–113, https://doi.org/10.3189/002214310791190776, 2010.
Bond, T. C., Doherty, S. J., Fahey, D. W., Forster, P. M., Berntsen, T., DeAngelo, B. J., Flanner, M. G., Ghan, S., Kärcher, B., Koch, D., Kinne, S., Kondo, Y., Quinn, P. K., Sarofim, M. C., Schultz, M. G., Schulz, M., Venkataraman, C., Zhang, H., Zhang, S., Bellouin, N., Guttikunda, S. K., Hopke, P. K., Jacobson, M. Z., Kaiser, J. W., Klimont, Z., Lohmann, U., Schwarz, J. P., Shindell, D., Storelvmo, T., Warren, S. G., and Zender, C. S.: Bounding the role of black carbon in the climate system: A scientific assessment, J. Geophys. Res.-Atmos., 118, 5380–5552, https://doi.org/10.1002/jgrd.50171, 2013.
Box, J. E., Fettweis, X., Stroeve, J. C., Tedesco, M., Hall, D. K., and Steffen, K.: Greenland ice sheet albedo feedback: thermodynamics and atmospheric drivers, The Cryosphere, 6, 821–839, https://doi.org/10.5194/tc-6-821-2012, 2012.
Cerqueira, M., Pioa, C., Legrandb, M., Puxbaumc, H., Gieblc, A., Afonsoa, J., Preunkertb, S., Gelencsérd, A., and Fialhoe, P.: Particulate carbon in precipitation at European background sites, Aerosol Sci., 41, 51–61, https://doi.org/10.1016/j.jaerosci.2009.08.002, 2010.
Chow, J. C., Watson, J. G., Pritchett, L. C., Pierson, W. R., Frazier, C. A., and Purcell, R. G.: The DRI thermal/optical reflectance carbon analysis system: Description, evaluation and applications in U.S. air quality studies, Atmos. Environ., 27, 1185–1201, https://doi.org/10.1016/0960-1686(93)90245-T, 1993.
Chow, J. C., Watson, J. G., Crow, D., Lowenthal, D. H., and Merrifield, T.: Comparison of IMPROVE and NIOSH carbon measurements, Aerosol Sci. Technol., 34, 23–34, 2001.
Cook. J. M., Hodson, A. J., Taggart, A. J., Mernild, S. H., and Tranter, M.: A predictive model for the spectral “bioalbedo” of snow. J. Geophys. Res.-Earth Surf., 122, https://doi.org/10.1002/2016JF003932, 2017a.
Cook, J. M., Hodson, A. J., Gardner, A. S., Flanner, M., Tedstone, A. J., Williamson, C., Irvine-Fynn, T. D. L., Nilsson, J., Bryant, R., and Tranter, M.: Quantifying bioalbedo: a new physically based model and discussion of empirical methods for characterising biological influence on ice and snow albedo, The Cryosphere, 11, 2611–2632, https://doi.org/10.5194/tc-11-2611-2017, 2017b.
Flanner, M. G. and Zender, C. S.: Snowpack radiative heating: Influence on Tibetan Plateau climate, Geophys. Res. Lett., 32, L06501, https://doi.org/10.1029/2004GL022076, 2005.
Flanner, M. G. and Zender, C. S.: Linking snowpack microphysics and albedo evolution, J. Geophys. Res., 111, D12208, https://doi.org/10.1029/2005JD006834, 2006.
Ganey, G. Q., Loso, M. G., Burgess, A. B., and Dial, R. J.: The role of microbes in snowmelt and radiative forcing on an Alaskan icefield, Nature Geosci., 10, 754–759, https://doi.org/10.1038/NGEO3027, 2017.
Hess, M., Koepke, P., and Schult, I.: Optical properties of aerosols and clouds: The software package OPAC, B. Am. Meteorol. Soc., 79, 831–844, https://doi.org/10.1175/1520-0477(1998)079<0831:OPOAAC>2.0.CO;2, 1998.
Hisakawa, N., Quistad, S. D., Hestler, E. R., Martynova, D., Maughan, H., Sala, E., Gavrilo, M. V., and Rowher, F.: Metagenomic and satellite analyses of red snow in the Russian Arctic, Peer J., 3, e1491, https://doi.org/10.7717/peerj.1491, 2015.
Hoham, R. W. and Duval, B.: Microbial ecology of snow and freshwater ice. in: Snow Ecology, edited by: Jones, H. G., Pomeloy, J. W., Walker, D. A., and Hoham, R. W., Cambridge University Press, 168–228, 2001.
Hoham, R. W. and Remias, D.: Snow And Glacial Algae: A Review, J. Phycol., 56, 264–282, https://doi.org/10.1111/jpy.12952, 2020.
Jacobson, M. C., Hansson, H. C., Noone, K. J., and Charlson, R. J.: Organic atmospheric aerosols: Review and state of the science, Rev. Geophys., 38, 267–294, https://doi.org/10.1029/1998RG000045, 2000.
Jonsell, U., Hock, R., and Holmgren, B.: Spatial and temporal variations in albedo on Storglaciären, Sweden, J. Glaciol., 49, 59–68, 2003.
Kirchstetter, T. W., Novakov, T., and Hobbs, P. V.: Evidence that the spectral dependence of light absorption by aerosols is affected by organic carbon, J. Geophys. Res., 109, D21208, https://doi.org/10.1029/2004JD004999, 2004.
Kuchiki, K., Aoki, T., Niwano, M., Matoba, S., Kodama, Y., and Adachi, K.: Elemental carbon, organic carbon, and dust concentrations in snow measured with thermal optical and gravimetric methods: Variations during the 2007–2013 winters at Sapporo, Japan, J. Geophys. Res.-Atmos., 120, 868–882, https://doi.org/10.1002/2014JD022144, 2015.
Lutz, S., Anesio, A. M., Jorge Villar, S. E., and Benning, L. G.: Variations of algal communities cause darkening of a Greenland glacier, FEMS Microbiol. Ecol., 89, 402–414, https://doi.org/10.1111/1574-6941.12351, 2014.
Lutz, S., Anesio, A. M., Raiswell, R., Edwards, A., Newton, R. J., Gill, F., and Benning, L. G.: The biogeography of red snow microbiomes and their role in melting arctic glaciers, Nat. Commun., 7, 11968, https://doi.org/10.1038/ncomms11968, 2016.
Miyazaki, Y., Kondo, Y., Han, S., Koike, M., Kodama, D., Komazaki, Y., Tanimoto, H., and Matsueda, H.: Chemical characteristics of water-soluble organic carbon in the Asian outflow, J. Geophys. Res., 112, D22S30, https://doi.org/10.1029/2007JD009116, 2007.
Müller, T., Leya, T., and Fuhr, G.: Persistent Snow Algal Fields in Spitsbergen: Field Observations and a Hypothesis about the Annual Cell Circulation, Arct. Antarct. Alp. Res., 33, 42–51, https://doi.org/10.2307/1552276, 2001.
Nagatsuka, N., Takeuchi, N., Uetake, J., and Shimada, R.: Mineralogical composition of cryoconite on glaciers in northwest Greenland, Bull. Glaciol. Res., 32, 107–114, https://doi.org/10.5331/bgr.32.107, 2014.
Nagatsuka, N., Takeuchi, N., Uetake, J., Shimada, R., Onuma, Y., Tanaka, S., and Nakano, T.: Variations in Sr and Nd isotopic ratios of mineral particles in cryoconite in western Greenland, Front. Earth Sci., 4, 93, https://doi.org/10.3389/feart.2016.00093, 2016.
Niwano, M., Aoki, T., Kuchiki, K., Hosaka, M., and Kodama, Y.: Snow Metamorphism and Albedo Process (SMAP) model for climate studies: Model validation using meteorological and snow impurity data measured at Sapporo, Japan, J. Geophys. Res., 117, F03008, https://doi.org/10.1029/2011JF002239, 2012.
Niwano, M., Aoki, T., Hashimoto, A., Matoba, S., Yamaguchi, S., Tanikawa, T., Fujita, K., Tsushima, A., Iizuka, Y., Shimada, R., and Hori, M.: NHM–SMAP: spatially and temporally high-resolution nonhydrostatic atmospheric model coupled with detailed snow process model for Greenland Ice Sheet, The Cryosphere, 12, 635–655, https://doi.org/10.5194/tc-12-635-2018, 2018.
Onuma, Y., Takeuchi, N., and Takeuchi, Y.: Temporal changes in snow algal abundance on surface snow in Tohkamachi, Japan, Bull. Glaciol. Res., 34, 21–31, https://doi.org/10.5331/bgr.16A02, 2016.
Onuma, Y., Takeuchi, N., Tanaka, S., Nagatsuka, N., Niwano, M., and Aoki, T.: Observations and modelling of algal growth on a snowpack in north-western Greenland, The Cryosphere, 12, 2147–2158, https://doi.org/10.5194/tc-12-2147-2018, 2018.
Painter, T. H., Duval, B., and Thomas, W. H.: Detection and quantification of snow algae with an airborne imaging spectrometer, Appl. Environ. Microbiol., 67, 5267–5272, https://doi.org/10.1128/AEM.67.11.5267-5272.2001, 2001.
Procházková, L., Remias, D., Holzinger, A., Řezanka, T., and Nedbalová, L.: Ecophysiological and morphological comparison of two populations of Chlainomonas sp. (Chlorophyta) causing red snow on ice-covered lakes in the High Tatras and Austrian Alps, Eur. J. Phycol., 53, 230–43, https://doi.org/10.1080/09670262.2018.1426789, 2018.
Procházková, L., Leya, T., Křížková, H., and Nedbalová, L.: Sanguina nivaloides and Sanguina aurantia gen. et spp. nov. (Chlorophyta): the taxonomy, phylogeny, biogeography and ecology of two newly recognised algae causing red and orange snow., FEMS Microbiol. Ecol., 95, fiz064, https://doi.org/10.1093/femsec/fiz064, 2019.
Remias, D.: Cell structure and physiology of alpine snow and ice algae, in: Plants in alpine regions, Cell physiology of adaption and survival strategies, edited by: Lütz, C., Springer Wien, 202, 175–186, https://doi.org/10.1007/978-3-7091-0136-0_13, 2012.
Rignot, E., Box, J. E., Burgess, E., and Hanna, E.: Mass balance of the Greenland ice sheet from 1958 to 2007, Geophys. Res. Let., 35, L20502, https://doi.org/10.1029/2008gl035417, 2008.
Segawa, T., Miyamoto, K., Ushida, K., Agata, K., Okada, N., and Koshima, S.: Seasonal Change in Bacterial Flora and Biomass in Mountain Snow from the Tateyama Mountains, Japan, Analyzed by 16S rRNA Gene Sequencing and Real-Time PCR, App. Environ. Microbiol., 71, 123–130, https://doi.org/10.1128/AEM.71.1.123--130, 2005.
Segawa, T., Matsuzaki, R., Takeuchi, N., Akiyoshi, A., Navarro, F., Sugiyama, S., Yonezawa, T., and Mori, H.: Bipolar dispersal of red-snow algae, Nat. Commun., 9, 3094, https://doi.org/10.1038/s41467-018-05521-w, 2018.
Steffensen, J. P.: The size distribution of microparticles from selected segments of the Greenland Ice Core Project ice core representing different climate periods, J. Geophys. Res., 102, 26755–26763, https://doi.org/10.1029/97JC01490, 1997.
Stibal, M., Elster, J., Ŝabacká, M., and Kaŝtovská, K.: Seasonal and diel changes in photosynthetic activity of the snow alga Chlamydomonas nivalis (Chlorophyceae) from Svalbard determined by pulse amplitude modulation fluorometry, FEMS. Microbiol. Ecol., 59, 265–273, https://doi.org/10.1111/j.1574-6941.2006.00264.x, 2007.
Sugiyama, S., Sakakibara, D., Matsuno S., Yamaguchi, S., Matoba, S., and Aoki T.: Initial field observations on Qaanaaq ice cap, northwestern Greenland, Ann. Glaciol., 55, 25–33, https://doi.org/10.3189/2014AoG66A102, 2014.
Takeuchi, N.: Seasonal and altitudinal variations in snow algal communities on an Alaskan glacier (Gulkana glacier in the Alaska range), Environ. Res. Lett., 8, 035002, https://doi.org/10.1088/1748-9326/8/3/035002, 2013.
Takeuchi, N. and Kohshima, S.: snow algal community on a Patagonian glacier, Tyndall glacier in the Southern Patagonia Icefield, Arct. Antarct. Alp. Res., 36, 91–8, 2004.
Takeuchi, N. and Li, Z.: Characteristics of surface dust on Ürümqi glacier No. 1 in the Tien Shan mountains, China Arct. Antarct. Alp. Res., 40, 744–750, 2008.
Takeuchi, N., Dial, R., Kohshima, S., Segawa, T., and Uetake, J.: Spatial distribution and abundance of red snow algae on the Harding Icefield, Alaska derived from a satellite image, Geophys. Res. Lett., 33, L21502, https://doi.org/10.1029/2006GL027819, 2006.
Takeuchi, N., Nagatsuka, N., Uetake, J., and Shimada, R.: Spatial variations in impurities (cryoconite) on glaciers in northwest Greenland, Bull. Glaciol. Res., 32, 85–94, https://doi.org/10.5331/bgr.32.85, 2014.
Tanaka, S., Takeuchi, N., Miyairi, M., Fujisawa, Y., Kadota, T., Shirakawa, T., Kusaka, R., Takahashi, S., Enomoto, H., Ohata, T., Yabuki, H., Konya, K., Fedorov, A., Konstantinov, P.: Snow algal communities on glaciers in the Suntar-Khayata Mountain Range in eastern Siberia, Russia, Polar Sci., 10, 227–238, https://doi.org/10.1016/j.polar.2016.03.004, 2016.
Tedesco, M., Fettweis, X., Van den Broeke, M. R., Van de Wal, R. S. W., Smeets, C. J. P. P., van de Berg, W. J., Serreze, M. C., and Box, J. E.: The role of albedo and accumulation in the 2010 melting record in Greenland, Environ. Res. Let., 6, 014005, https://doi.org/10.1088/1748-9326/6/1/014005, 2011.
Thomas, W. H. and Duval, B.: Sierra Nevada, California, USA, snow algae: snow albedo changes, algal-bacterial interrelationships, and ultraviolet radiation effects, Arct. Alp. Res., 27, 389–99, 1995.
Tobo, Y., Adachi, K., DeMott, P. J., Hill, T. C. J., Hamilton, D. S., Mahowald, N. M., Nagatsuka, N., Ohata, S., Uetake, J., Kondo, Y., and Koike, M.: Glacially sourced dust as a potentially significant source of ice nucleating particles, Nat. Geosci., 12, 253–258 https://doi.org/10.1038/s41561-019-0314-x, 2019.
Torres, A., Bond, T. C., Lehmann, C. M. B., Subramanian, R., and Hadley, O. L.: Measuring organic carbon and black carbon in rainwater: Evaluation of methods, Aerosol Sci. Technol., 48, 238–249, https://doi.org/10.1080/02786826.2013.868596, 2014.
Tsutaki S., Sugiyama, S. Sakakibara, D., Aoki, T., and Niwano, M.: Surface mass balance, ice velocity and near-surface ice temperature on Qaanaaq Ice Cap, northwestern Greenland, from 2012 to 2016, Ann. Glaciol., 58, 181–192, https://doi.org/10.1017/aog.2017.7, 2017.
Warren, S. G. and Wiscombe, W. J.: A model for the spectral albedo of snow, II: Snow containing atmospheric aerosols, J. Atmos. Sci., 37, 2734–2745, https://doi.org/10.1175/1520-0469(1980)037<2734:AMFTSA>2.0.CO;2, 1980.
Warren, S. G. and Wiscombe, W. J.: Dirty snow after nuclear war, Nature, 313, 467–470, https://doi.org/10.1038/313467a0, 1985.
Wiscombe, W. J. and Warren, S. G.: A model for the spectral albedo of snow: I. Pure snow, J. Atmos. Sci., 37, 2712–2733, https://doi.org/10.1175/1520-0469(1980)037<2712:AMFTSA>2.0.CO;2, 1980.
Williamson, C. J., Cook, J., Tedstone, A., Yallop, M., McCutcheon, J., Poniecka, E., Campbell, D., Irvine-Fynn, T., McQuaid, J., Tranter, M., Perkins, R., and Anesio, A.: Algal photophysiology drives darkening and melt of the Greenland Ice Sheet, P. Natl. Acad. Sci., 117, 5694–5705, https://doi.org/10.1073/pnas.1918412117, 2020.
Yallop, M. L., Anesio, A. M., Perkins, R. G., Cook, J., Telling, J., Fagan, D., MacFarlane, J., Stibal, M., Barker, G., and Bellas, C.: Photophysiology and albedo-changing potential of the ice algal community on the surface of the Greenland ice sheet, ISME J., 6, 2302–2313, https://doi.org/10.1038/ismej.2012.107, 2012.
Yasunari, T. J., Koster, R. D., Lau, W. K. M., and Kim, K. M.: Impact of snow darkening via dust, black carbon, and organic carbon on boreal spring climate in the Earth system, J. Geophys. Res.-Atmos., 120, 5485–5503, https://doi.org/10.1002/2014jd022977, 2015.