the Creative Commons Attribution 4.0 License.
the Creative Commons Attribution 4.0 License.
 | 18 Jun 2020
A quasi-annual record of time-transgressive esker formation: implications for ice-sheet reconstruction and subglacial hydrology
Stephen J. Livingstone
Emma L. M. Lewington
Chris D. Clark
Robert D. Storrar
Andrew J. Sole
Isabelle McMartin
Nico Dewald
We identify and map chains of esker beads (series of aligned mounds) up to 15 m high and on average ∼ 65 m wide in central Nunavut, Canada, from the high-resolution (2 m) ArcticDEM. Based on the close 1 : 1 association with regularly spaced, sharp-crested ridges interpreted as De Geer moraines, we interpret the esker beads to be quasi-annual ice-marginal deposits formed time-transgressively at the mouth of subglacial conduits during deglaciation. Esker beads therefore preserve a high-resolution record of ice-margin retreat and subglacial hydrology. The well-organised beaded esker network implies that subglacial channelised drainage was relatively fixed in space and through time. Downstream esker bead spacing constrains the typical pace of deglaciation in central Nunavut between 8.1 and 6.8 cal kyr BP to 165–370 m yr−1, although with short periods of more rapid retreat (> 400 m yr−1). Under our time-transgressive interpretation, the lateral spacing of the observed eskers provides a true measure of subglacial conduit spacing for testing mathematical models of subglacial hydrology. Esker beads also record the volume of sediment deposited from conduits in each melt season, thus providing a minimum bound on annual sediment fluxes, which is in the range of 103–104 m3 yr−1 in each 6–10 km wide subglacial conduit catchment. We suggest that the prevalence of esker beads across this predominantly marine-terminating sector of the Laurentide Ice Sheet is a result of sediment fluxes that were unable to backfill conduits at a rate faster than ice-margin retreat. Conversely, we hypothesise that esker ridges form when sediment backfilling of the subglacial conduit outpaced retreat, resulting in headward esker growth close to but behind the margin. The implication, in accordance with recent modelling results, is that eskers in general record a composite signature of ice-marginal drainage rather than a temporal snapshot of ice-sheet-wide subglacial drainage.
- Article
(30753 KB) - Full-text XML
- BibTeX
- EndNote


Eskers record the former channelised drainage of meltwater under ice sheets. They typically comprise a slightly sinuous ridge of glaciofluvial sediments tens to hundreds of metres wide and metres to tens of metres high and are widespread across the beds of the Laurentide and Fennoscandian ice sheets (e.g. Prest et al., 1968; Aylsworth and Shilts, 1989; Boulton et al., 2001; Storrar et al., 2013; Stroeven et al., 2016). Their distribution and network geometry have been used to reconstruct past ice-sheet retreat patterns and subglacial hydrological properties (Greenwood et al., 2016, and references therein). However, a key uncertainty is whether eskers, which often form networks that stretch continuously for hundreds of kilometres, reflect an extensive synchronous drainage system (e.g. Brennand, 1994, 2000) or record, in a time-transgressive manner, the location of segments of subglacial conduits close to the ice margin as it retreated (e.g. De Geer, 1897, 1910, 1940; Hebrand and Åmark, 1989; Mäkinen, 2003; Hewitt and Creyts, 2019).
Beaded eskers are characterised by a series of aligned mounds and are typically composed of ice-marginal sediments, deposited in (1) subaerial environments (Hebrand and Åmark, 1989), (2) subaqueous environments, as a delta or subaqueous fan at the mouth of a subglacial conduit in proglacial lacustrine or marine settings (Banerjee and McDonald, 1975; Rust and Romanelli, 1975; Cheel and Rust, 1986; Warren and Ashley, 1994; Brennand, 2000; Mäkinen, 2003), or (3) subglacial environments (Gorrell and Shaw, 1991). In the first two interpretations, the occurrence of esker beads implies time-transgressive esker formation. Indeed, several studies have suggested that each bead consists of sediment from either one or a small number of melt seasons and therefore represents a quasi-annual signal of channelised drainage (e.g. Banerjee and McDonald, 1975; Mäkinen, 2003). Although detailed sedimentological investigations have improved our understanding of the processes and context of esker bead deposition, what we can learn from such time-transgressive records about the past conditions of subglacial channelised drainage remains poorly understood. This includes the factors determining synchronous vs. incremental formation of esker ridges, palaeo-ice-margin retreat rates, and subglacial conduit sediment fluxes.
In this paper we use the high-resolution (2 m) ArcticDEM v7 mosaic (Porter et al., 2018; https://www.pgc.umn.edu/data/arcticdem/, last access: 1 September 2019) to identify and map nearly 5000 beads forming part of an extensive esker network NW of Hudson Bay in central Nunavut, Canada (Fig. 1). We use the distribution of the esker beads, their morphometric properties, and their relationship with De Geer moraines to propose a quasi-annual, time-transgressive model of deposition and ice retreat, and we discuss the implications for understanding esker formation and subglacial drainage.
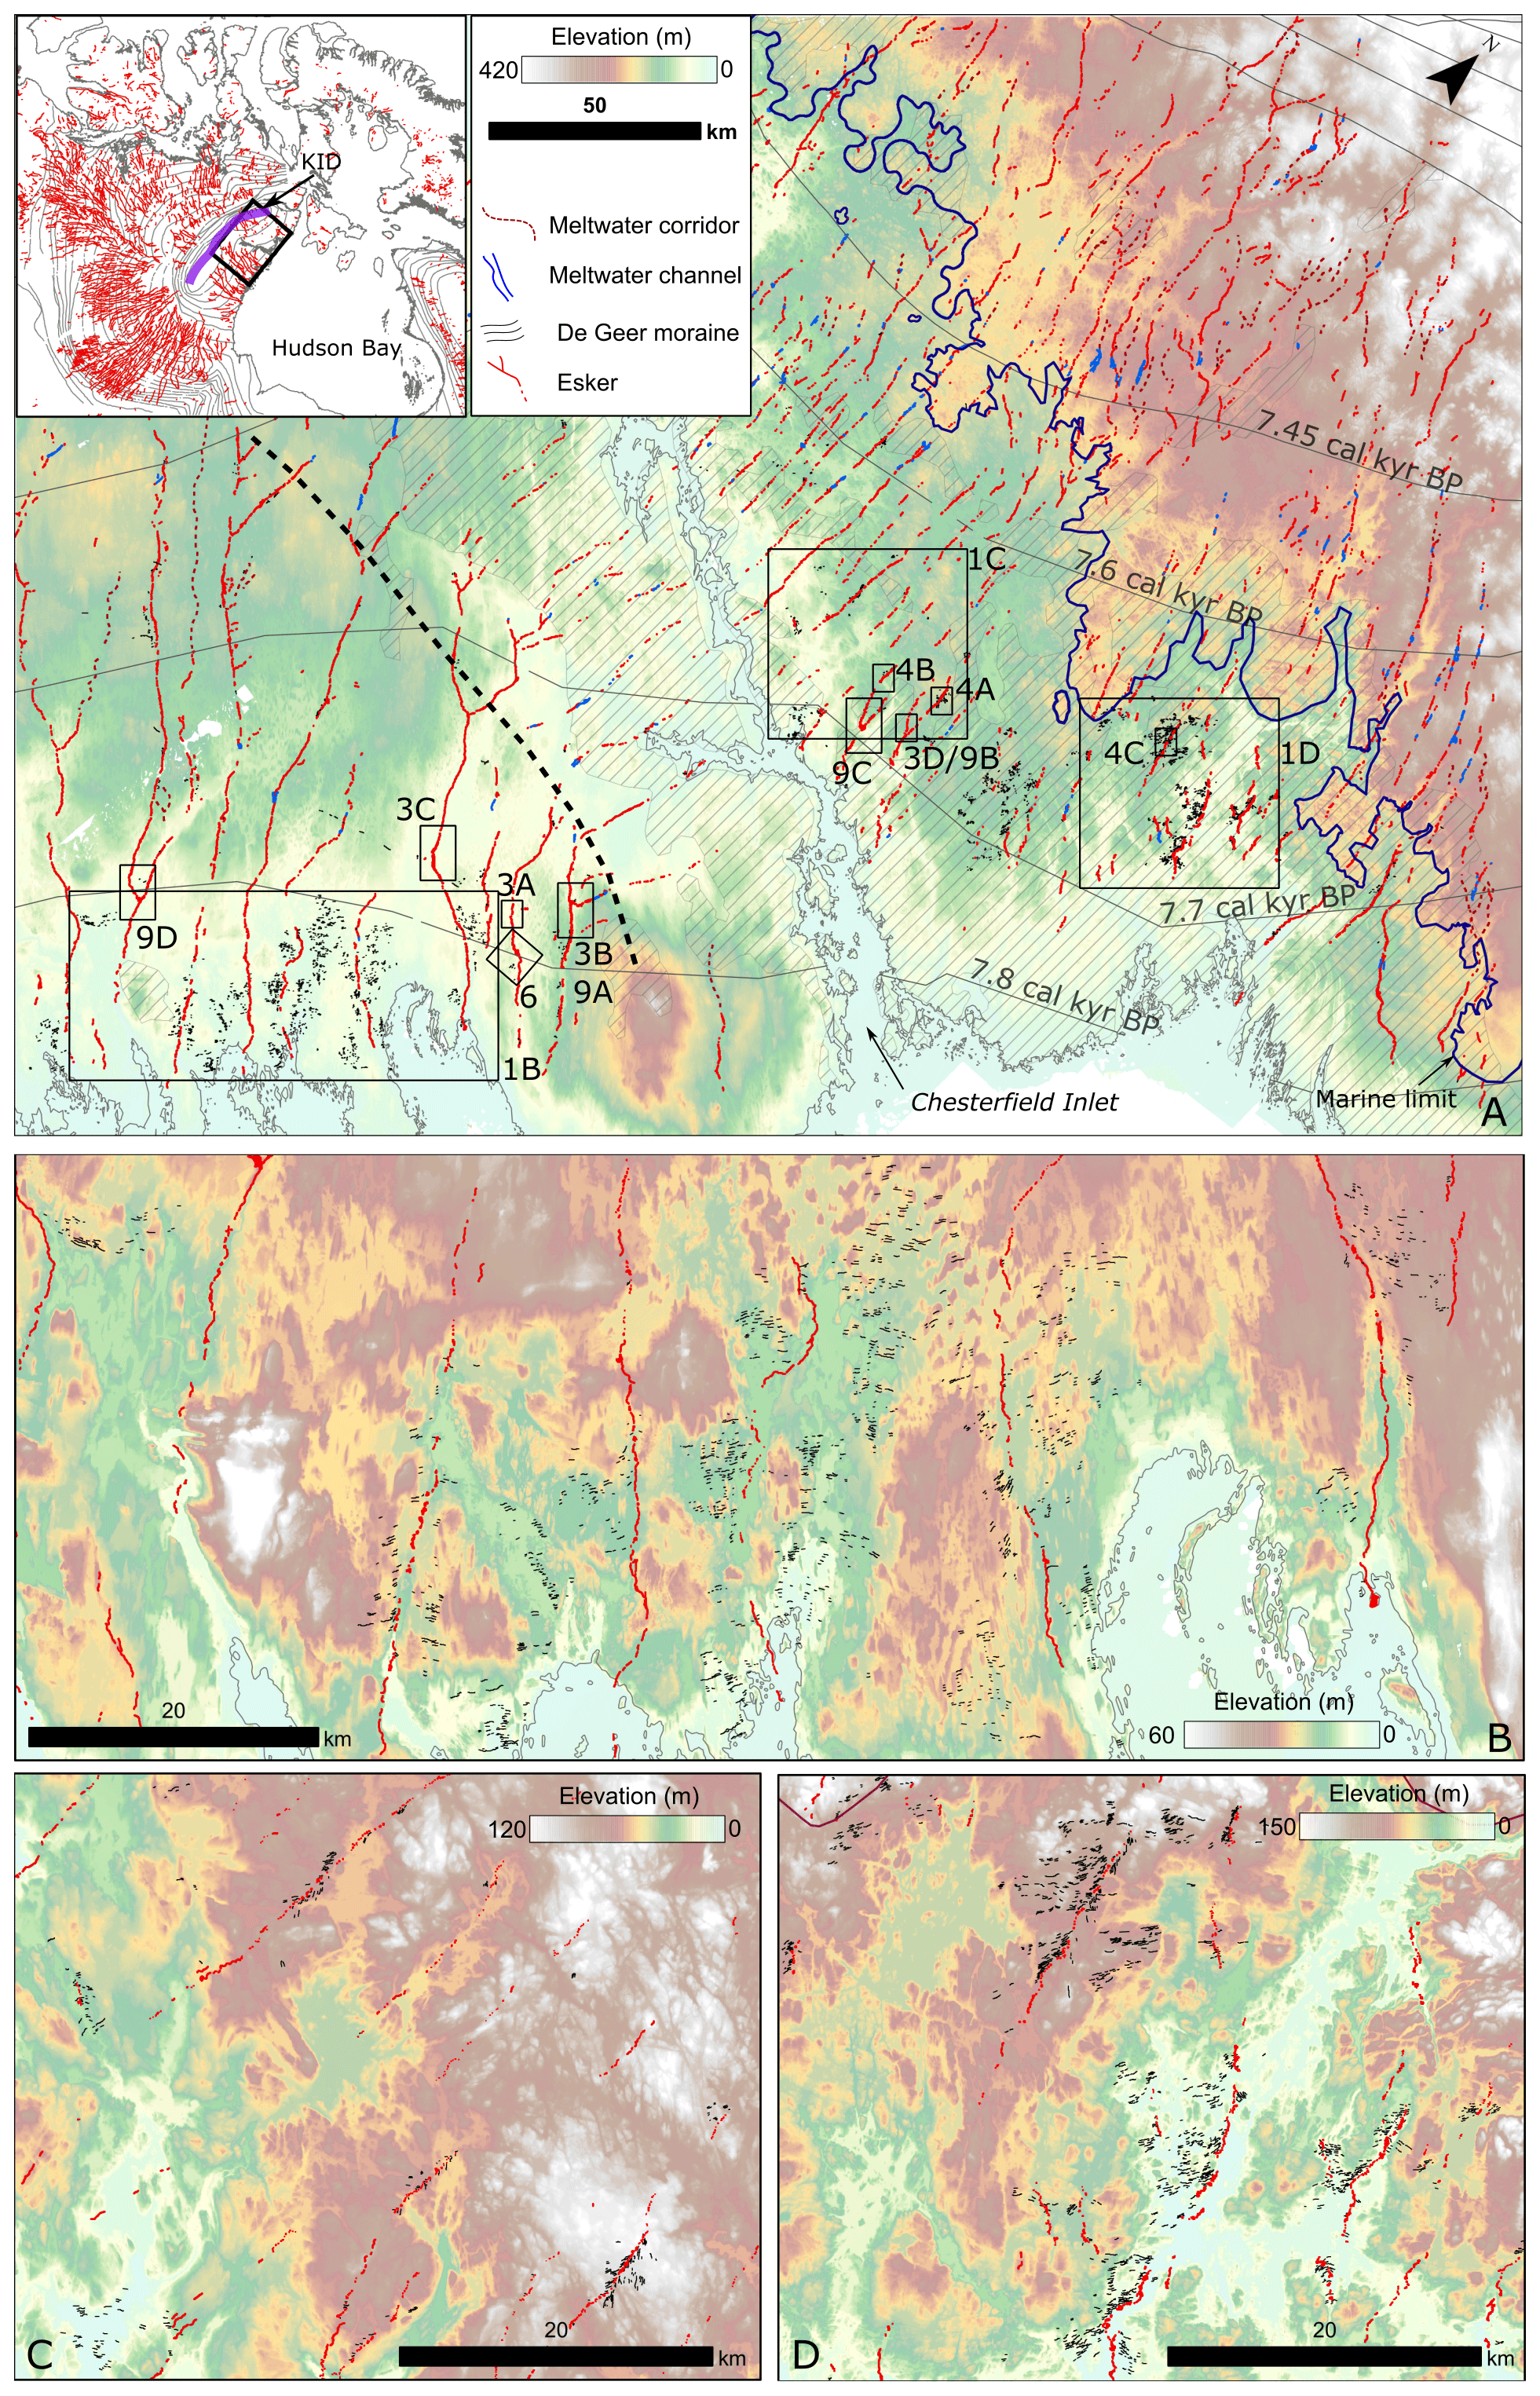
Figure 1(a) Glacial geomorphological map of meltwater features and De Geer moraines in central Nunavut, NW of Hudson Bay. Inset map shows location of study area, Keewatin Ice Divide (KID) (purple line), and previous regional mapping of eskers (Storrar et al., 2013). Black dashed line indicates the approximate axis of a re-entrant along which we interpret the two ice masses pulled apart. Solid dark blue line is the marine limit modified and extended from Randour et al. (2016). Grey hatched lines are areas of exposed bedrock, and annotated solid grey lines are ice-margin positions extrapolated from Dyke et al. (2003). (b–d) Zoomed-in maps showing the pattern of De Geer moraines and eskers. DEMs created by the Polar Geospatial Center from DigitalGlobe, Inc., imagery.
The study area covers 87 500 km2 of central Nunavut, around Chesterfield Inlet, NW of Hudson Bay (Fig. 1). North of Chesterfield Inlet the topography rises up to ∼ 420 m a.s.l. (metres above sea level), but in general land lies below ∼ 150 m a.s.l. The region is predominantly composed of Precambrian Shield rocks of the western Churchill Province (mainly Archean gneiss and granites; Paul et al., 2002) that are exposed at the surface in and around Chesterfield Inlet. To the north of the inlet the bedrock has a discontinuous veneer of till, whereas a thicker till (2–20 m) blankets the portion of the study area south of the inlet (Fig. 1). The till has been moulded into drumlins and flutes and formed crag and tails in the lee of bedrock obstacles (e.g. McMartin and Henderson, 2004).
The study area partially straddles and is just to the southeast of the final location of the Keewatin Ice Divide (Fig. 1), which, based on palimpsest glacial landform and sediment evidence, is thought to have been highly mobile throughout the last glaciation (e.g. Boulton and Clark, 1990a, b; Klassen, 1995; McMartin and Henderson, 2004). Regional ice-flow indicators including drumlins, striae, and eskers suggest that final ice flow during deglaciation was SE into Hudson Bay (Tyrrell, 1898; Prest et al., 1968; Shilts et al., 1979; Aylsworth and Shilts, 1989; Boulton and Clark, 1990a, b; McMartin and Henderson, 2004). Deglaciation of the area occurred between 7.2 and 6 kyr 14C BP (8.1 and 6.8 cal kyr BP), with the final vestiges of ice splitting into two small ice masses on either side of Chesterfield Inlet (Dyke et al., 2003; Dalton et al., 2020). Flights of raised marine strandlines indicate that final deglaciation involved a marine ice front calving into the Tyrrell Sea. Strandline elevations are variable across the region, indicative of rebound under thinning ice cover, and typically range from ∼ 130–170 m, with the higher strandlines to the south (e.g. Shilts et al., 1979; Shilts, 1986; Randour et al., 2016).
Manual digitisation of eskers and other meltwater landforms (e.g. meltwater channels and subglacial meltwater corridors) was undertaken in ArcGIS 10.4 using hill-shaded digital surface models (DSMs) following standard practice outlined in Chandler et al. (2018). We used the 2 m ArcticDEM v7 mosaic, generated by applying stereo auto-correction techniques to overlapping pairs of high-resolution optical satellite images (Noh and Howat, 2015), to identify and map meltwater features. The outlines of esker beads were mapped as polygons at their break of slope, and esker ridge crest lines, moraine ridge crest lines, meltwater channel sides, and subglacial meltwater corridor centrelines were mapped as polylines. Surficial materials were taken from Fulton (1995), who mapped till thickness from aerial photographs (till veneer 2 m and till blanket 2 m). Esker bead area was calculated in ArcMap from the mapped polygons. Esker bead volume was calculated by removing the beads from the DSM; this included a 50 m buffer around the bead to avoid edge effects. The holes in the DSM were then re-interpolated using the function inpaint_nans in MATLAB (written by John D'Errico: freely available at https://uk.mathworks.com/matlabcentral/fileexchange/4551-inpaint_nans, last access: 5 June 2019). The modified DSM with beads removed was then subtracted from the original DSM, and the summed elevation difference was multiplied by 2 m×2 m (grid resolution) to calculate volume. Esker bead spacing was defined as the straight-line distance, d, between successive beads' centre points along the same meltwater axis and calculated, for a given bead, as the average of its distance to the bead upstream and its distance to its bead downstream. Spacing distances of > 1200 m (top 1 % of spacing values, > 5× median value) were removed to avoid biasing the statistics from breaks in deposition, submergence of beads in lakes, or post-depositional erosion.
4.1 Meltwater drainage imprint
Over 5000 esker ridge segments and 4700 esker beads were mapped across the study area, which together form a coherent esker and meltwater channel pattern converging into proto-Hudson Bay (Fig. 1). There are two distinctive networks, a broadly N–S-orientated set of quasi-regularly spaced (∼ 6 km mean lateral spacing) eskers in the northern part of the study area and a larger and more widely spaced (∼ 10 km mean lateral spacing) NW–SE-trending network of eskers south of Chesterfield Inlet. After trending down the regional topography towards and across Chesterfield Inlet, the N–S-orientated esker network becomes confluent with the NW–SE-trending esker network. In the northern network, eskers above the marine limit (Fig. 1) tend to be more complex in planform, characterised by numerous tributaries, and have orientations varying from NW–SE to N–S. These eskers typically comprise ridges rather than beads and often form in, and are connected to, subglacial meltwater corridors (e.g. Lewington et al., 2019). The southern section of this first network becomes increasingly fragmented, with beaded eskers dominating, and the general pattern here is much simpler, with few tributaries and a consistent N–S orientation with a remarkable degree of consistent parallel patterning. The southern end of this esker network connects with the second network of eskers, which, as described above, trends NW–SE. These eskers comprise a mix of beads and ridges, with beads more frequent on lower ground close to Hudson Bay and on the N–S tributaries emanating from the first network of eskers.
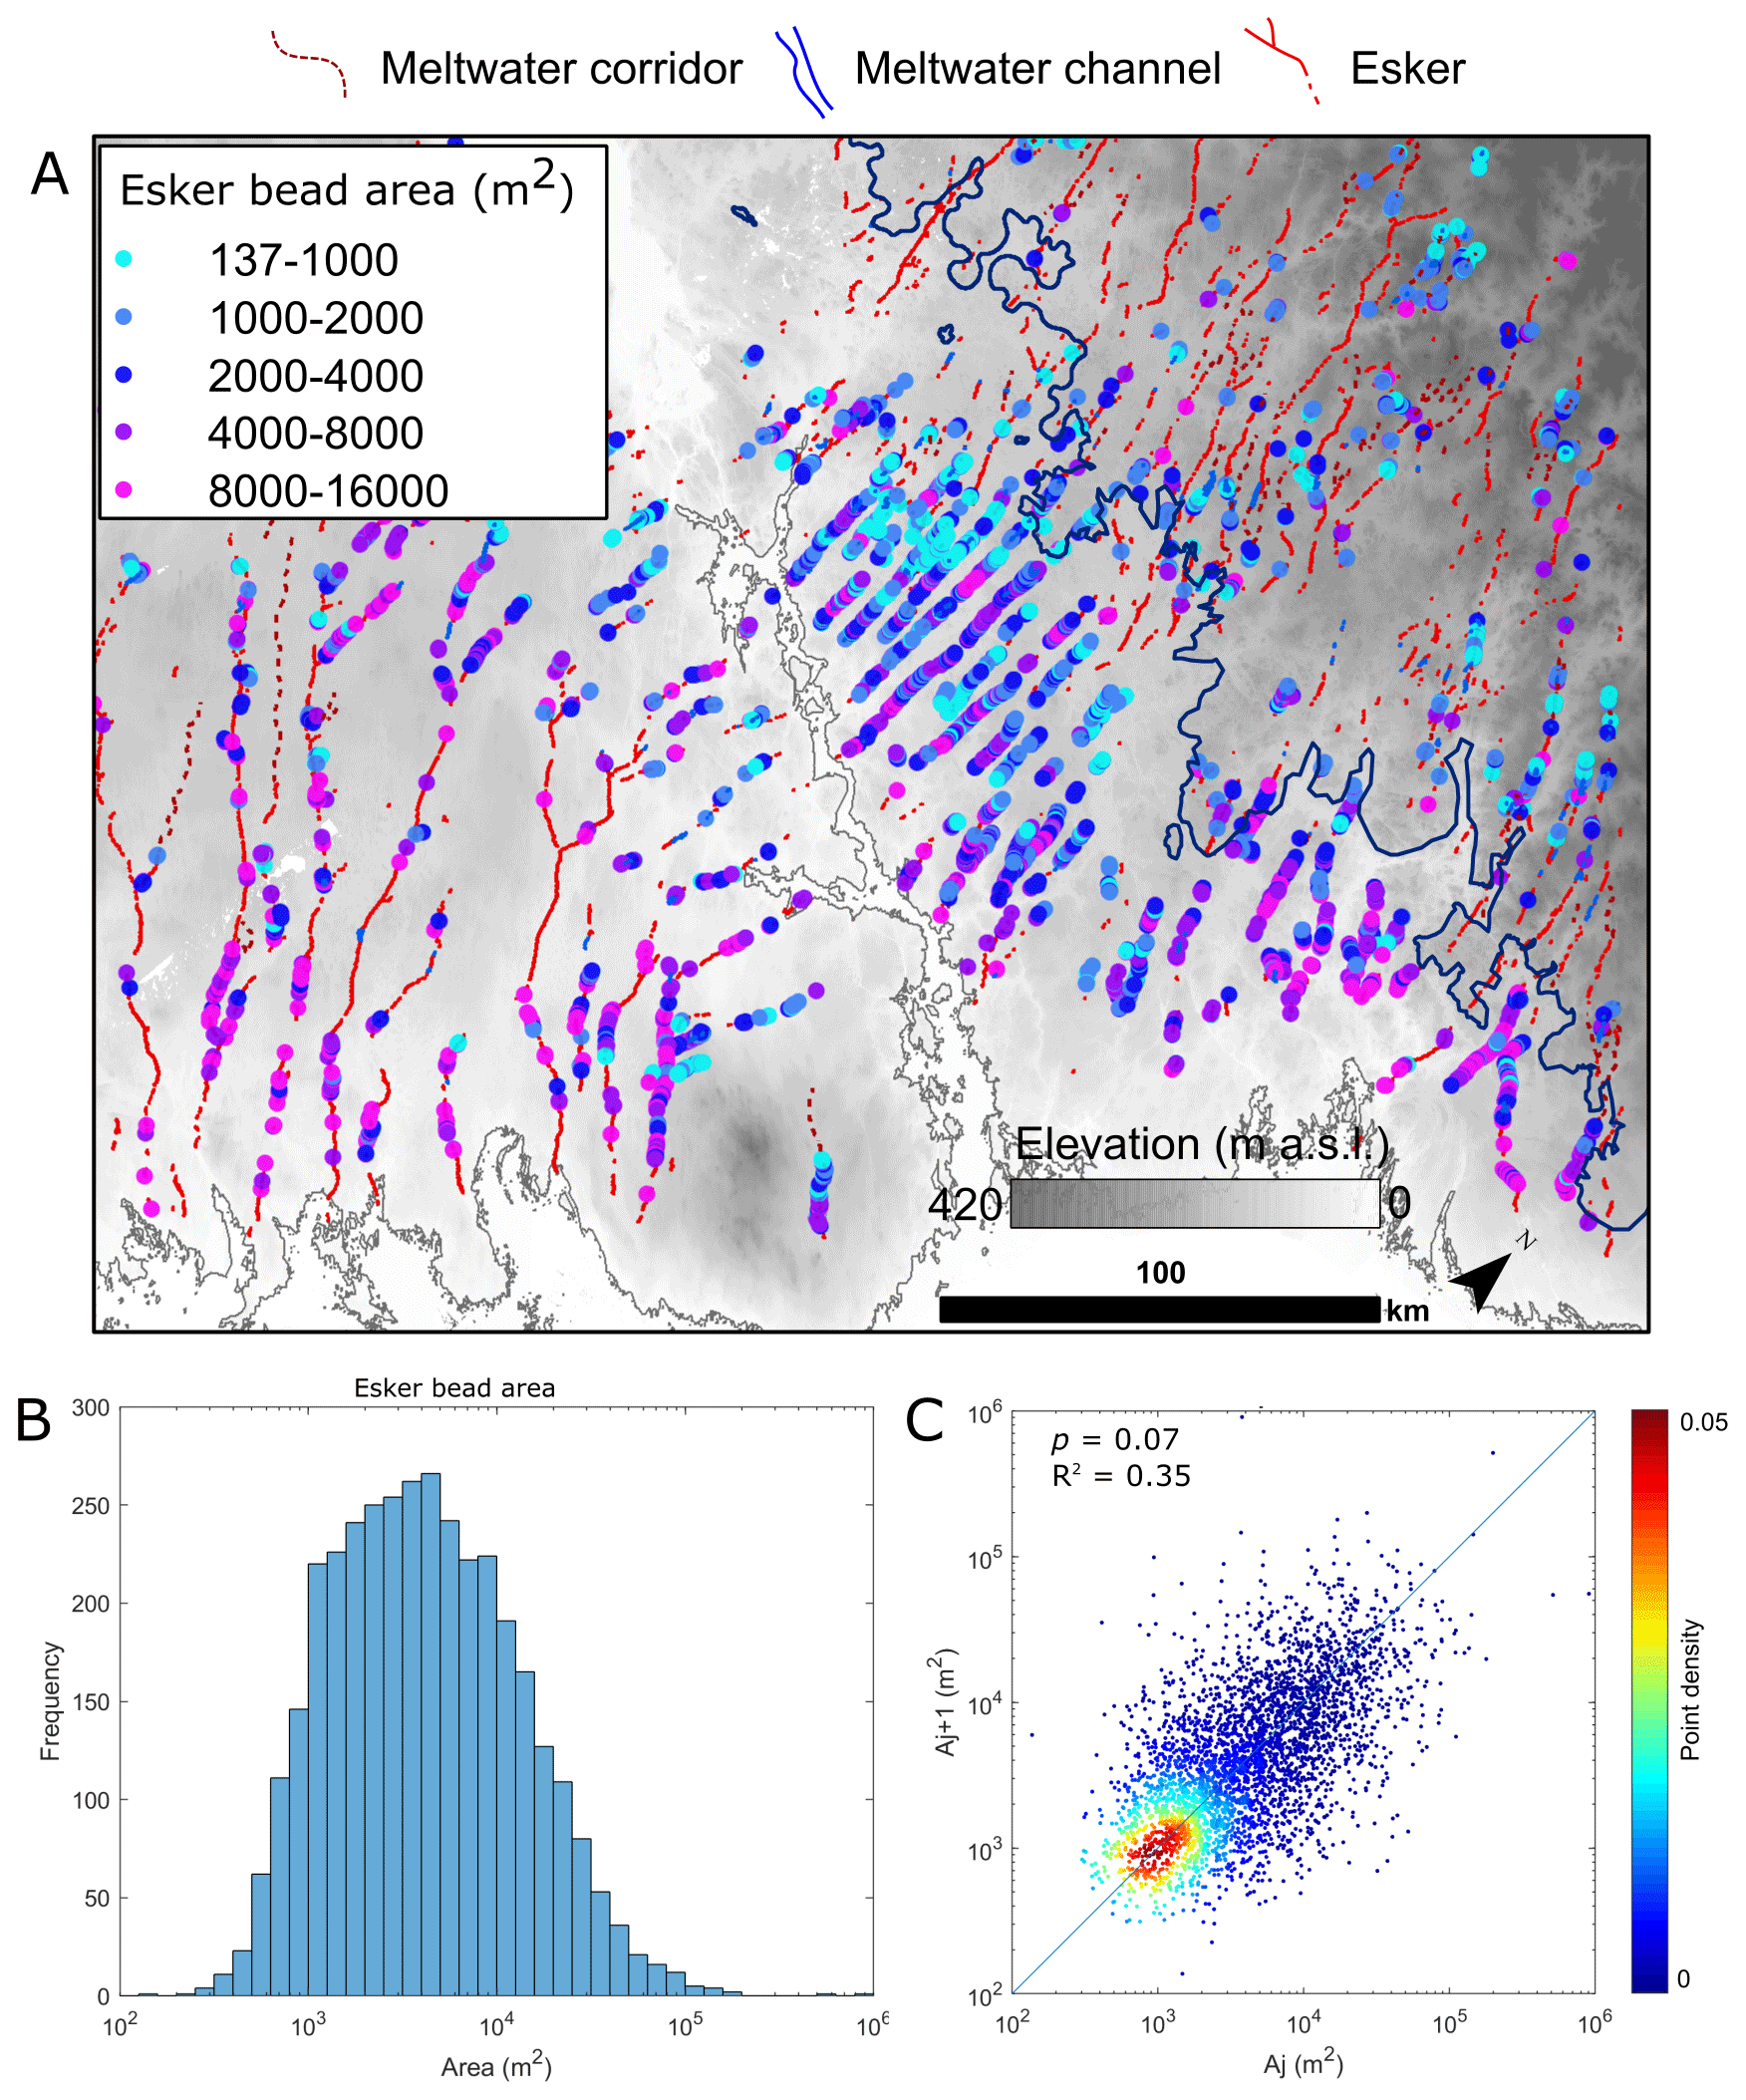
Figure 2Esker bead locations and area. Panel (a) displays their spatial pattern. The dark blue line is the marine limit. (b) Frequency histogram of bead area. (c) Leading-order variogram, where Aj is the area of an esker bead and Aj+1 is the area of its up-ice neighbour. Where neighbouring esker beads have the same area, the resultant point plots on the 1 : 1 line. Large deviations in area between successive beads result in a random spread of points. Point density is the number of other points lying within a circle of 400 m2 radius, normalised by the total number of points. The low p value and clustering of points around the 1 : 1 line indicates a gradual transition in esker bead area along individual eskers. In addition, point density indicates that ∼ 30 % of neighbouring esker beads are similar (i.e. percentage of points within the cyan–yellow–red region). DEMs created by the Polar Geospatial Center from DigitalGlobe, Inc., imagery.
4.2 Esker bead distribution and morphology
Esker beads often form “chains” across the landscape, with individual beads typically up to ∼ 15 m high, having a median area of 4000 m2 (∼ 65 m wide), and their areas form a log-normal distribution with a large standard deviation (22 000 m2) (Fig. 2a, b). Although the size of esker beads is variable, the largest beads tend to occur where the elevation is lower, close to the present-day coastline of Hudson Bay (Fig. 2a), and variations in size are gradual along individual eskers (p value = 0.07), with ∼ 30 % of neighbouring esker beads similarly sized (Fig. 2c); 90 % of beads are found < 120 m a.s.l. within the marine limit, with the densest clusters on the till veneer and exposed bedrock north of Chesterfield Inlet and on the till blanket at the southeastern end of the NW–SE-orientated esker system. Beads display a range of shapes, from mound-like forms (Fig. 3d) to wedge and fan geometries (Fig. 3c) and flow-parallel and flow-transverse ridges (Fig. 3a, b). Flat-topped esker beads are also observed (Fig. 3c) and tend to be more prevalent at the seaward end of the larger northwest–southeast esker network. Above the marine limit, beads are almost exclusively mound-shaped and tend to be smaller and form less coherent and more widely dispersed chains. Esker beads are often discrete features but can also overlap or merge together, particularly when larger and/or closely spaced (Fig. 3b, c) or when they grade headwards into an esker ridge.
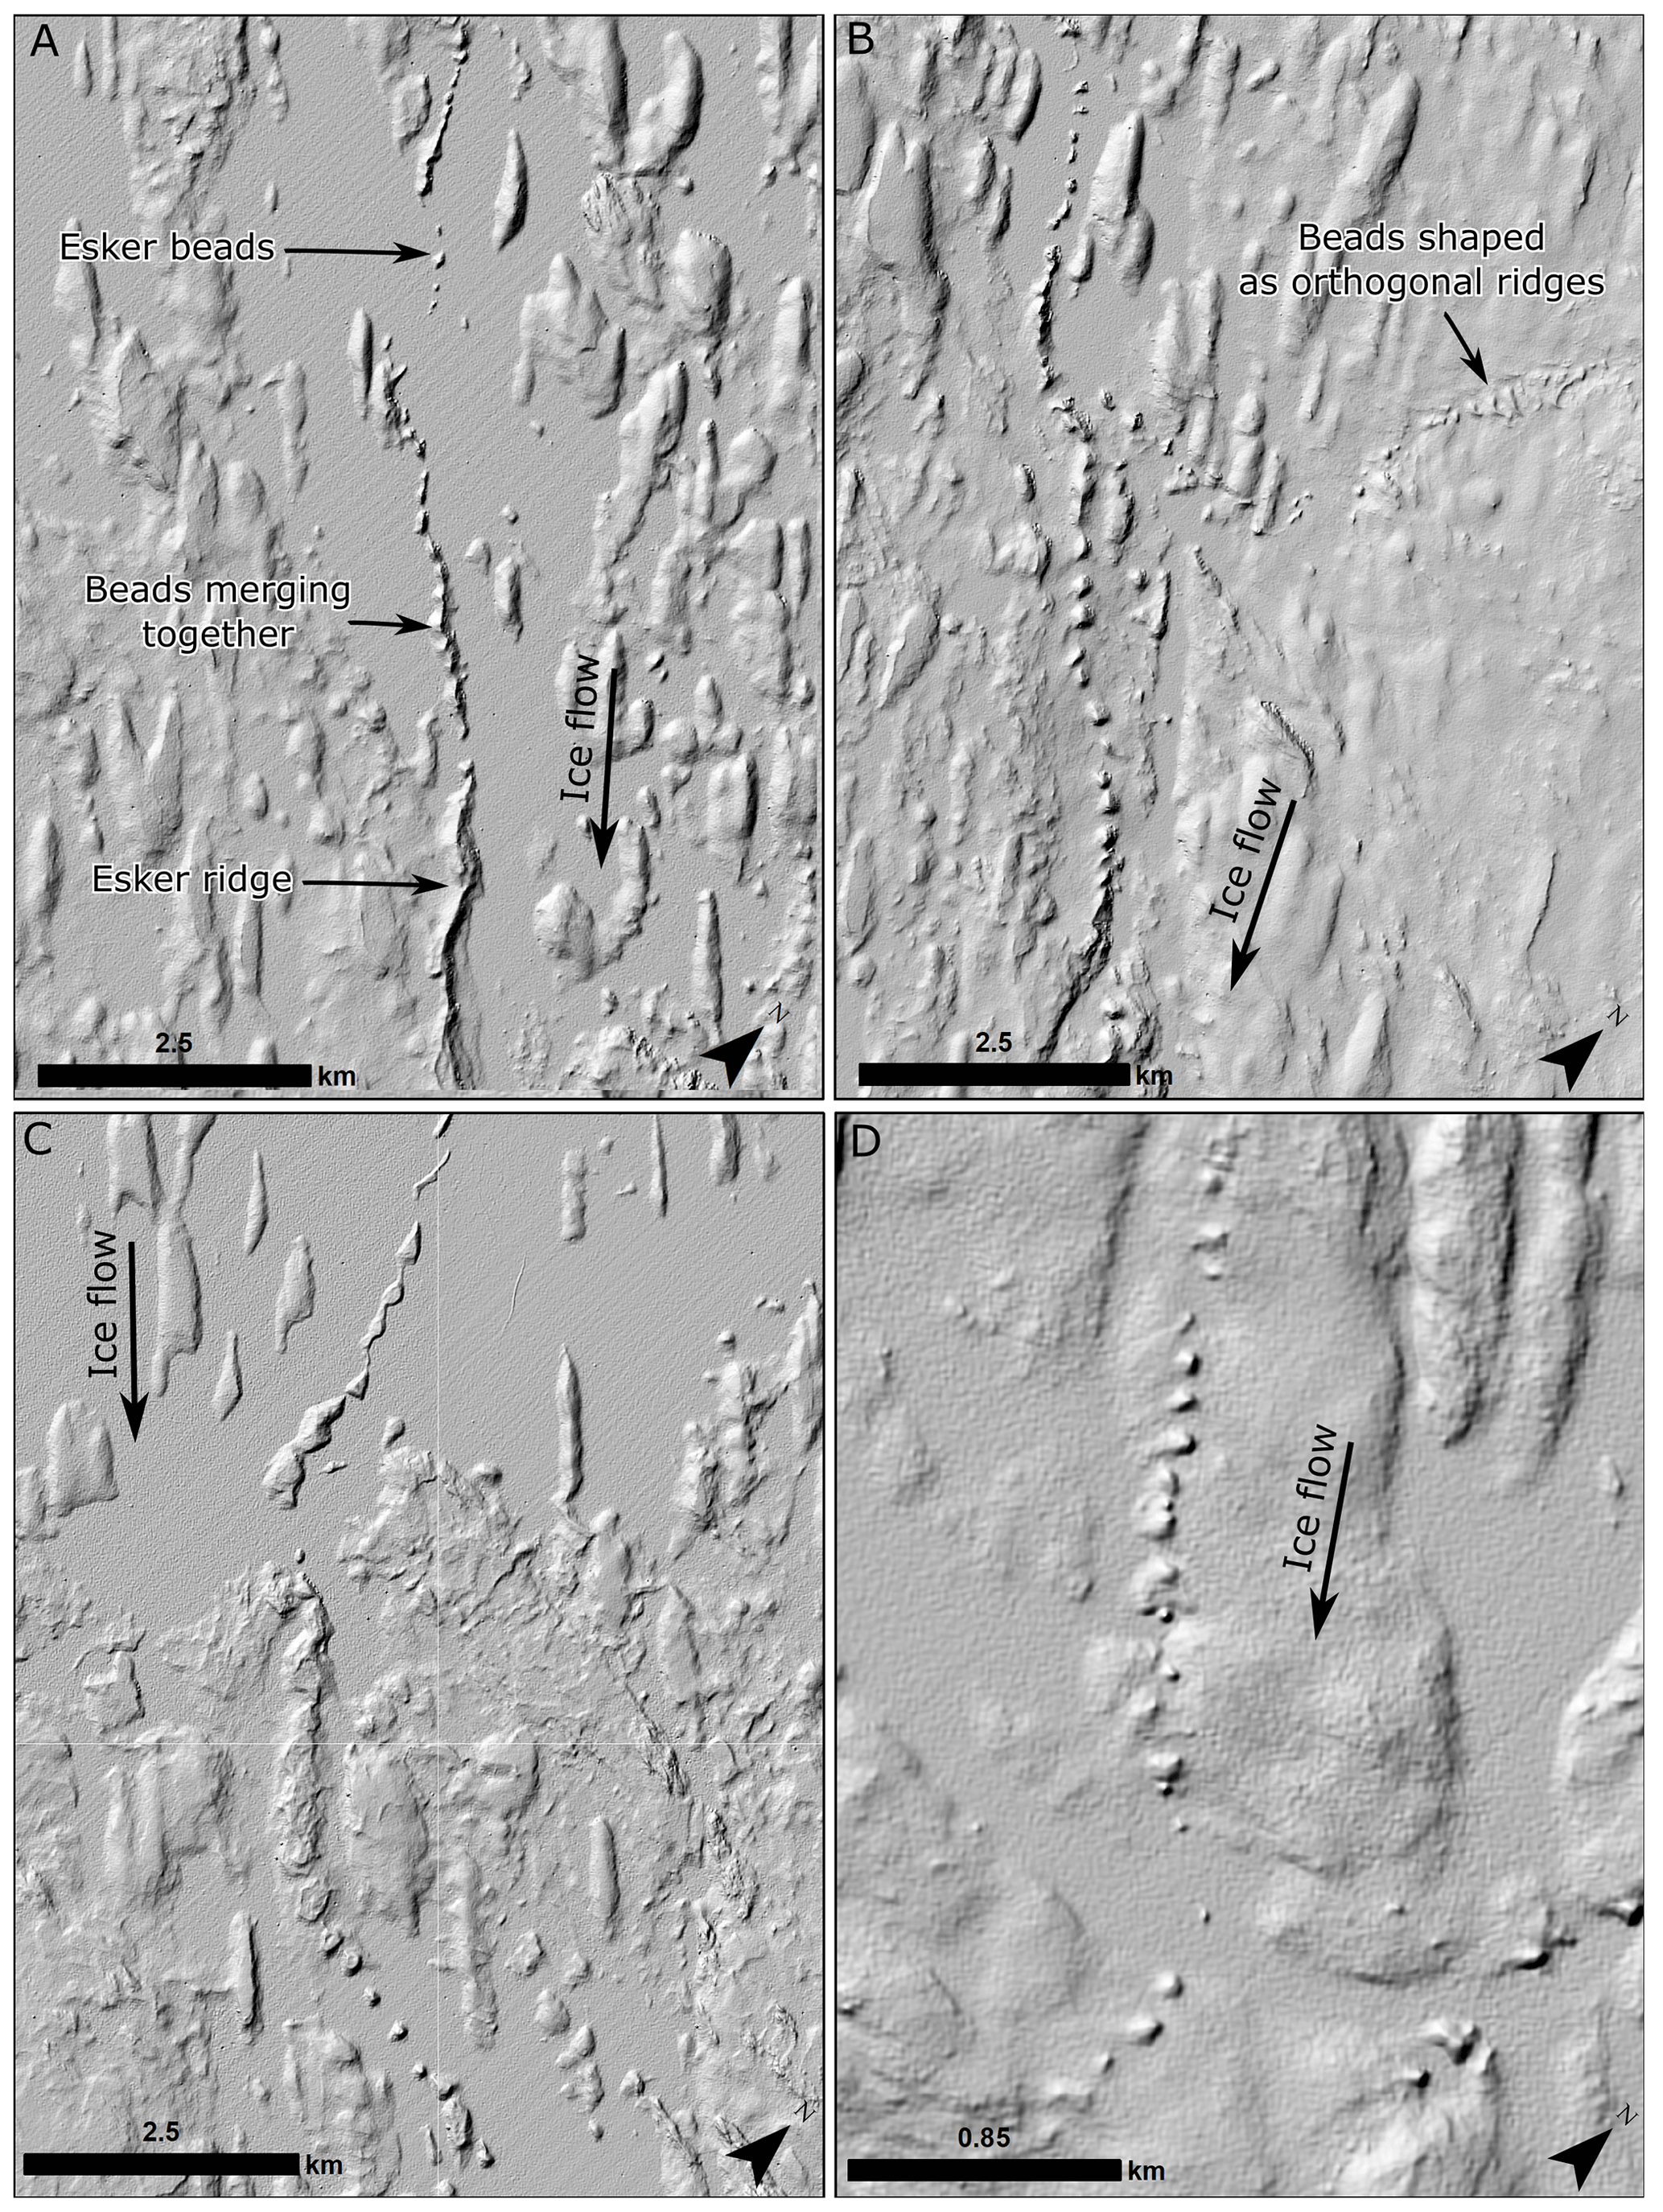
Figure 3Examples of beaded eskers. (a) Transition between a classical esker ridge and esker beads, some of which merge together to form a ridge-like form due to their large size and/or close spacing. Note how the beads range in shape from ridge-like to (b) triangular (c), flat-topped (c), and circular (d). Hill-shaded ArcticDEM has 2 m horizontal resolution. Locations of beaded eskers displayed in Fig. 1. DEMs created by the Polar Geospatial Center from DigitalGlobe, Inc., imagery.
4.3 Association with moraines
Below ∼ 80 m a.s.l., esker beads are often intimately associated with parallel to sub-parallel, regularly spaced, sharp-crested moraine ridges, 1–3 m in relief, that drape around the surrounding topography (Figs. 1c–d, 4). Ridges observed on the ground are subtle, narrow features with no clear asymmetry and are commonly composed of sandy diamicton with a significant boulder cover. These ridges either occur transverse to the esker or more commonly in a distinctive V-shaped arrangement (see also McMartin and Henderson, 2004), with the esker bead at the headward point and the ridges splitting downstream on either side of the esker. This V-shaped arrangement typically extends for no more than 1–2 km on either side of the esker. Some moraine ridges appear to originate at the bead, resulting in a roughly 1 : 1 relationship between beads and moraines. Some beads even form a series of small flow-transverse ridge forms, like rungs on a ladder, suggesting they were modified when the ridge was formed (e.g. Fig. 3c – upper right quarter of panel).
Two principal hypotheses have been put forward for the formation of esker beads in the literature: (1) deposition at a retreating margin, with time-transgressive formation by sequential deposition of sediment debouching from subglacial conduits into a low-energy subaqueous environment such as a lake or sea (e.g. De Geer, 1897, 1910; Banerjee and McDonald, 1975; Rust and Romanelli, 1975; Cheel and Rust, 1986; Warren and Ashley, 1994; Mäkinen, 2003; Ahokangas and Mäkinen, 2014), and (2) entirely subglacial deposition with synchronous formation during periodic separation of the glacier from its bed, causing sediment-rich water to spill laterally out from the main subglacial conduit (esker ridge) into neighbouring subglacial cavities (e.g. Gorrell and Shaw, 1991).
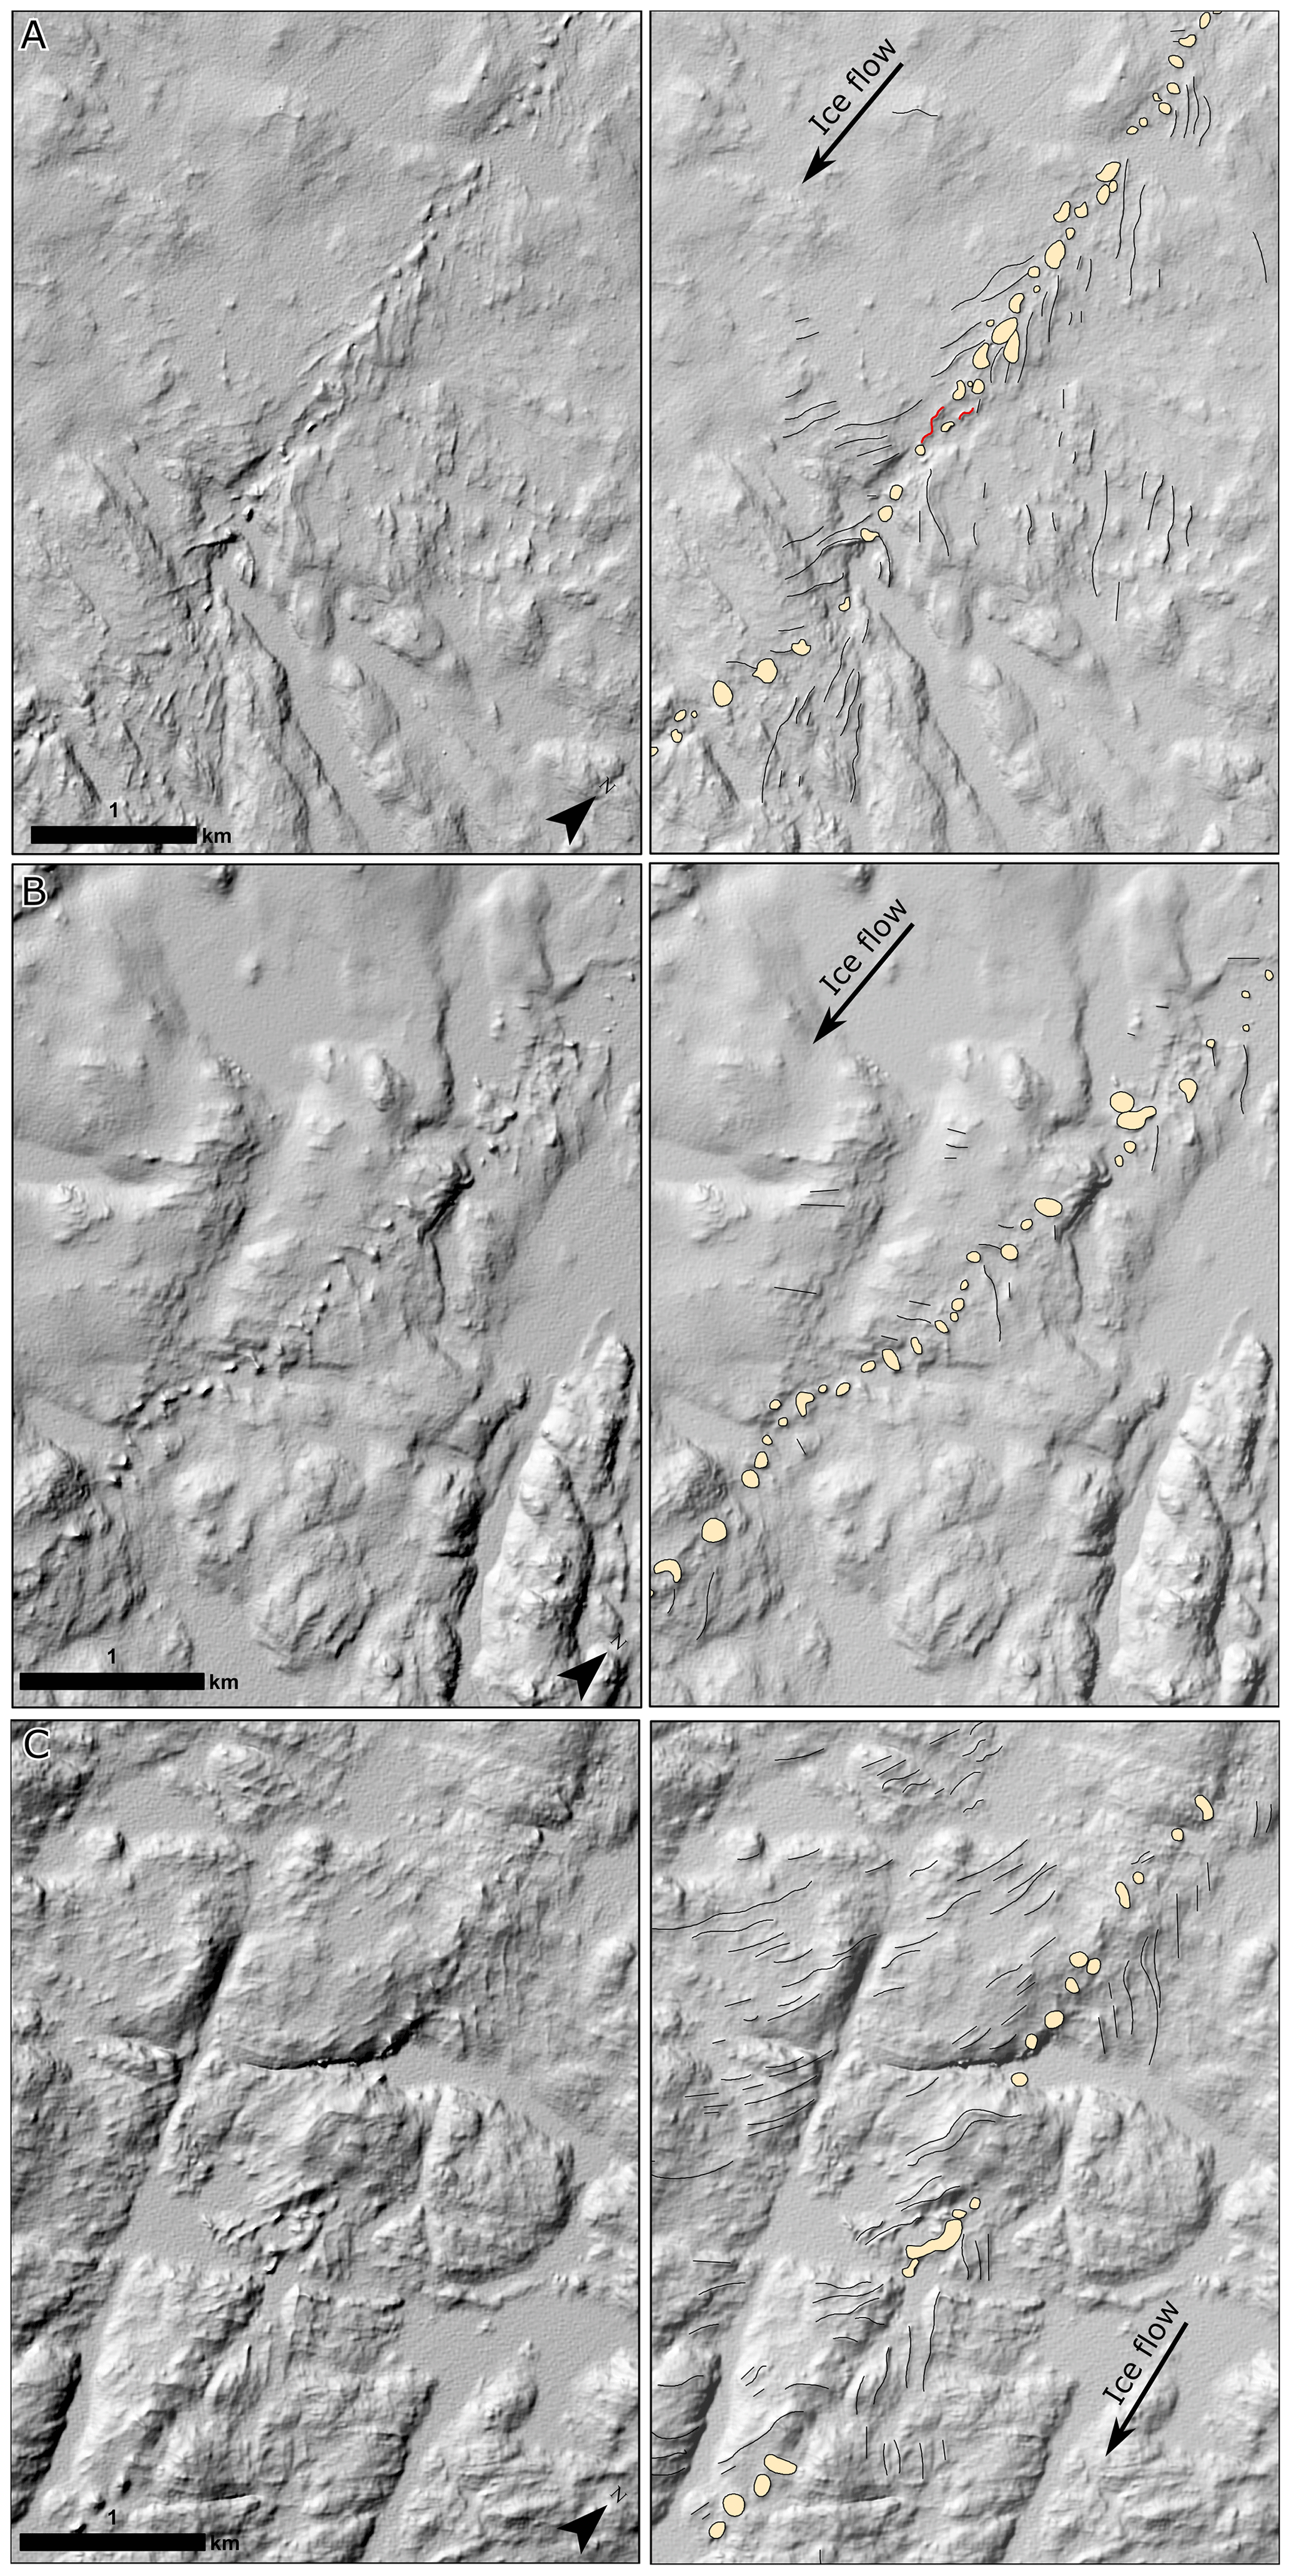
Figure 4Relationship between esker beads and De Geer moraines. Right-hand column is the mapped (beads are yellow polygons; moraines are black lines; esker ridges are red lines) interpretation of (a), (b), and (c). Note how the De Geer moraines typically form a V-shaped geometry pointing up-ice and the close association between individual moraines and beads. In some cases (e.g. a) the ridges originate from the beads. Locations are displayed in Fig. 1. DEMs created by the Polar Geospatial Center from DigitalGlobe, Inc., imagery.
We interpret our esker beads to be quasi-annual deposits formed time-transgressively (hypothesis 1), predominantly in an ice-marginal marine setting (Fig. 5). This is based on their close 1 : 1 association with regularly spaced, sharp-crested ridges (Fig. 4) that are interpreted as De Geer moraines (e.g. Lindén and Möller, 2005; Ottesen and Dowdeswell, 2006; Todd et al., 2007; Bouvier et al., 2015; Ojala, 2016). De Geer moraines are typically thought to occur at the grounding line of calving glaciers (e.g. Ottesen and Dowdeswell, 2006; Flink et al., 2015), which is consistent with their occurrence in areas below 120 m a.s.l., well within the proposed maximum marine limit of the Tyrrell Sea along the western coast of Hudson Bay (Shilts et al., 1979; Shilts, 1986; Simon et al., 2014; Randour et al., 2016). In addition, the V-shaped arrangement of the moraine ridges around the esker beads is consistent with embayments forming at the mouth of subglacial conduits (see also Hoppe, 1957; Strömberg, 1981; Lindén and Möller, 2005; Bouvier et al., 2015; Dowling et al., 2016) due to plume-enhanced melting and calving (e.g. Benn et al., 2007). In this configuration, local ice flow would be towards the embayment, which is supported by the convergent pattern of striations 1–2 km on either side of esker ridges in this area (e.g. Fig. 6; McMartin, 2000). The morphology of the beads suggests to us that they did not form subglacially. In particular, (i) some of the beads have a flat top, indicating sedimentation up to the water level, (ii) fan-shaped beads tend to be orientated downstream rather than orthogonal to water flow, (iii) where a bead grades into a ridge, this occurs in an up-ice direction, and (iv) beads are strongly aligned (i.e. do not deviate from a central axis) (Figs. 3–4). Together, these morphological observations indicate ice-marginal deposition filling the accommodation space at the mouth of a subglacial conduit rather than lateral deposition into a subglacial cavity flanking the main conduit. Likewise, given the arrangement of the De Geer moraines, their distribution within the marine limit, and their association with esker beads, we consider alternative subglacial origins for their formation, such as in basal crevasses during surging (e.g. Zilliacus, 1989), to be unlikely.
Although De Geer moraines are traditionally thought to represent an annual signature with a ridge formed each winter as ice undergoes a minor re-advance (e.g. De Geer, 1940), intra-annual frequencies have also been proposed, with summer ridges associated with periodic calving (Lundqvist, 1958; Strömberg, 1965; Möller, 1962; Lindén and Möller, 2005; Ojala et al., 2015). Indeed, some ridges and beads could be the result of several years of deposition, with other ridges destroyed by a more extensive winter re-advance. Möller (1962) suggested that intra-annual moraine ridges tend to be smaller, less regular ridges nested amongst the larger, more regular annual ridges. However, we do not observe this bimodal population of moraine ridge sizes across the study area. If intra-annual calving events dominated the signal, we might expect to observe significant variation in sediment flux and retreat rate and consequently esker bead size and spacing over short distances imposed by the irregularity of calving events throughout the melt season. While there is some substantial deviation in bead size, variation is often gradual (e.g. Figs. 2c, 3a, 4c), and more typically the beads exhibit consistent sizes down individual eskers (e.g. Figs. 2c; 3a, b, and d; 4b–d). In addition, whilst there is a lot of noise in the bead spacing measurements, particularly where esker beads are widely spaced (likely due to breaks because of non-deposition and/or post-depositional modification), 35 % of neighbouring esker beads are similarly spaced (Fig. 7c). Such observed sequences of variation in bead size and spacing are consistent with a background forcing comprising slow year-to-year changes in climate rather than quasi-random ice calving events.
Although we prefer an annual origin to explain the regularly spaced De Geer moraines and their 1 : 1 relationship with beads, the traditional hypothesis that De Geer moraine formed each winter as ice underwent a minor re-advance (e.g. De Geer, 1940) needs to be reconciled with their alignment next to rather than between esker beads (e.g. Fig. 4, and see schematics in Fig. 5) deposited during the summer melt season. This can be explained by the ice margin re-advancing to the previous year's esker bead and/or deposition of the esker bead prior to the onset or after summer retreat from the moraine. The latter suggestion is consistent with observations at present-day ice margins, which indicate that ice-marginal advance (retreat) is out-of-phase with the start (end) of the melt season (e.g. Schild and Hamilton, 2003).

Figure 5(a) 3-D schematic showing the proposed quasi-annual formation of esker beads and De Geer moraines in embayments at a marine grounding line (modified from Warren and Ashley, 1994). De Geer formation likely occurred during subsequent winter ice re-advance and/or deposition of the esker bead prior to the onset or after summer retreat from the moraine. (b) Plan view showing the annual deposition of esker beads at the mouth of a series of subglacial conduits. Note how variations in retreat rate affect the downstream spacing of esker beads and that the lateral spacing between individual esker systems is a true measure of subglacial conduit spacing, at least near the inferred palaeo-ice margin.
The range of esker bead morphologies identified in the study region likely reflects variations in depositional environment and sediment supply (Figs. 3, 4). Fans and mounds are analogous to subaqueous fan deposition (Powell, 1990), while flat-topped beads suggest limited accommodation space and therefore sedimentation in shallow water (e.g. delta) or beneath an ice shelf or conduit roof. About 10 % of esker beads occur above the marine limit (Fig. 1). These beads more typically have a mounded appearance or occur as a sequence of short (< 100 m) ridge segments and are frequently interrupted by esker ridges. We interpret these to have been deposited subaerially or occasionally in proglacial lakes as outwash fans (mounds) or due to temporary clogging of the subglacial conduit (short ridge segments).
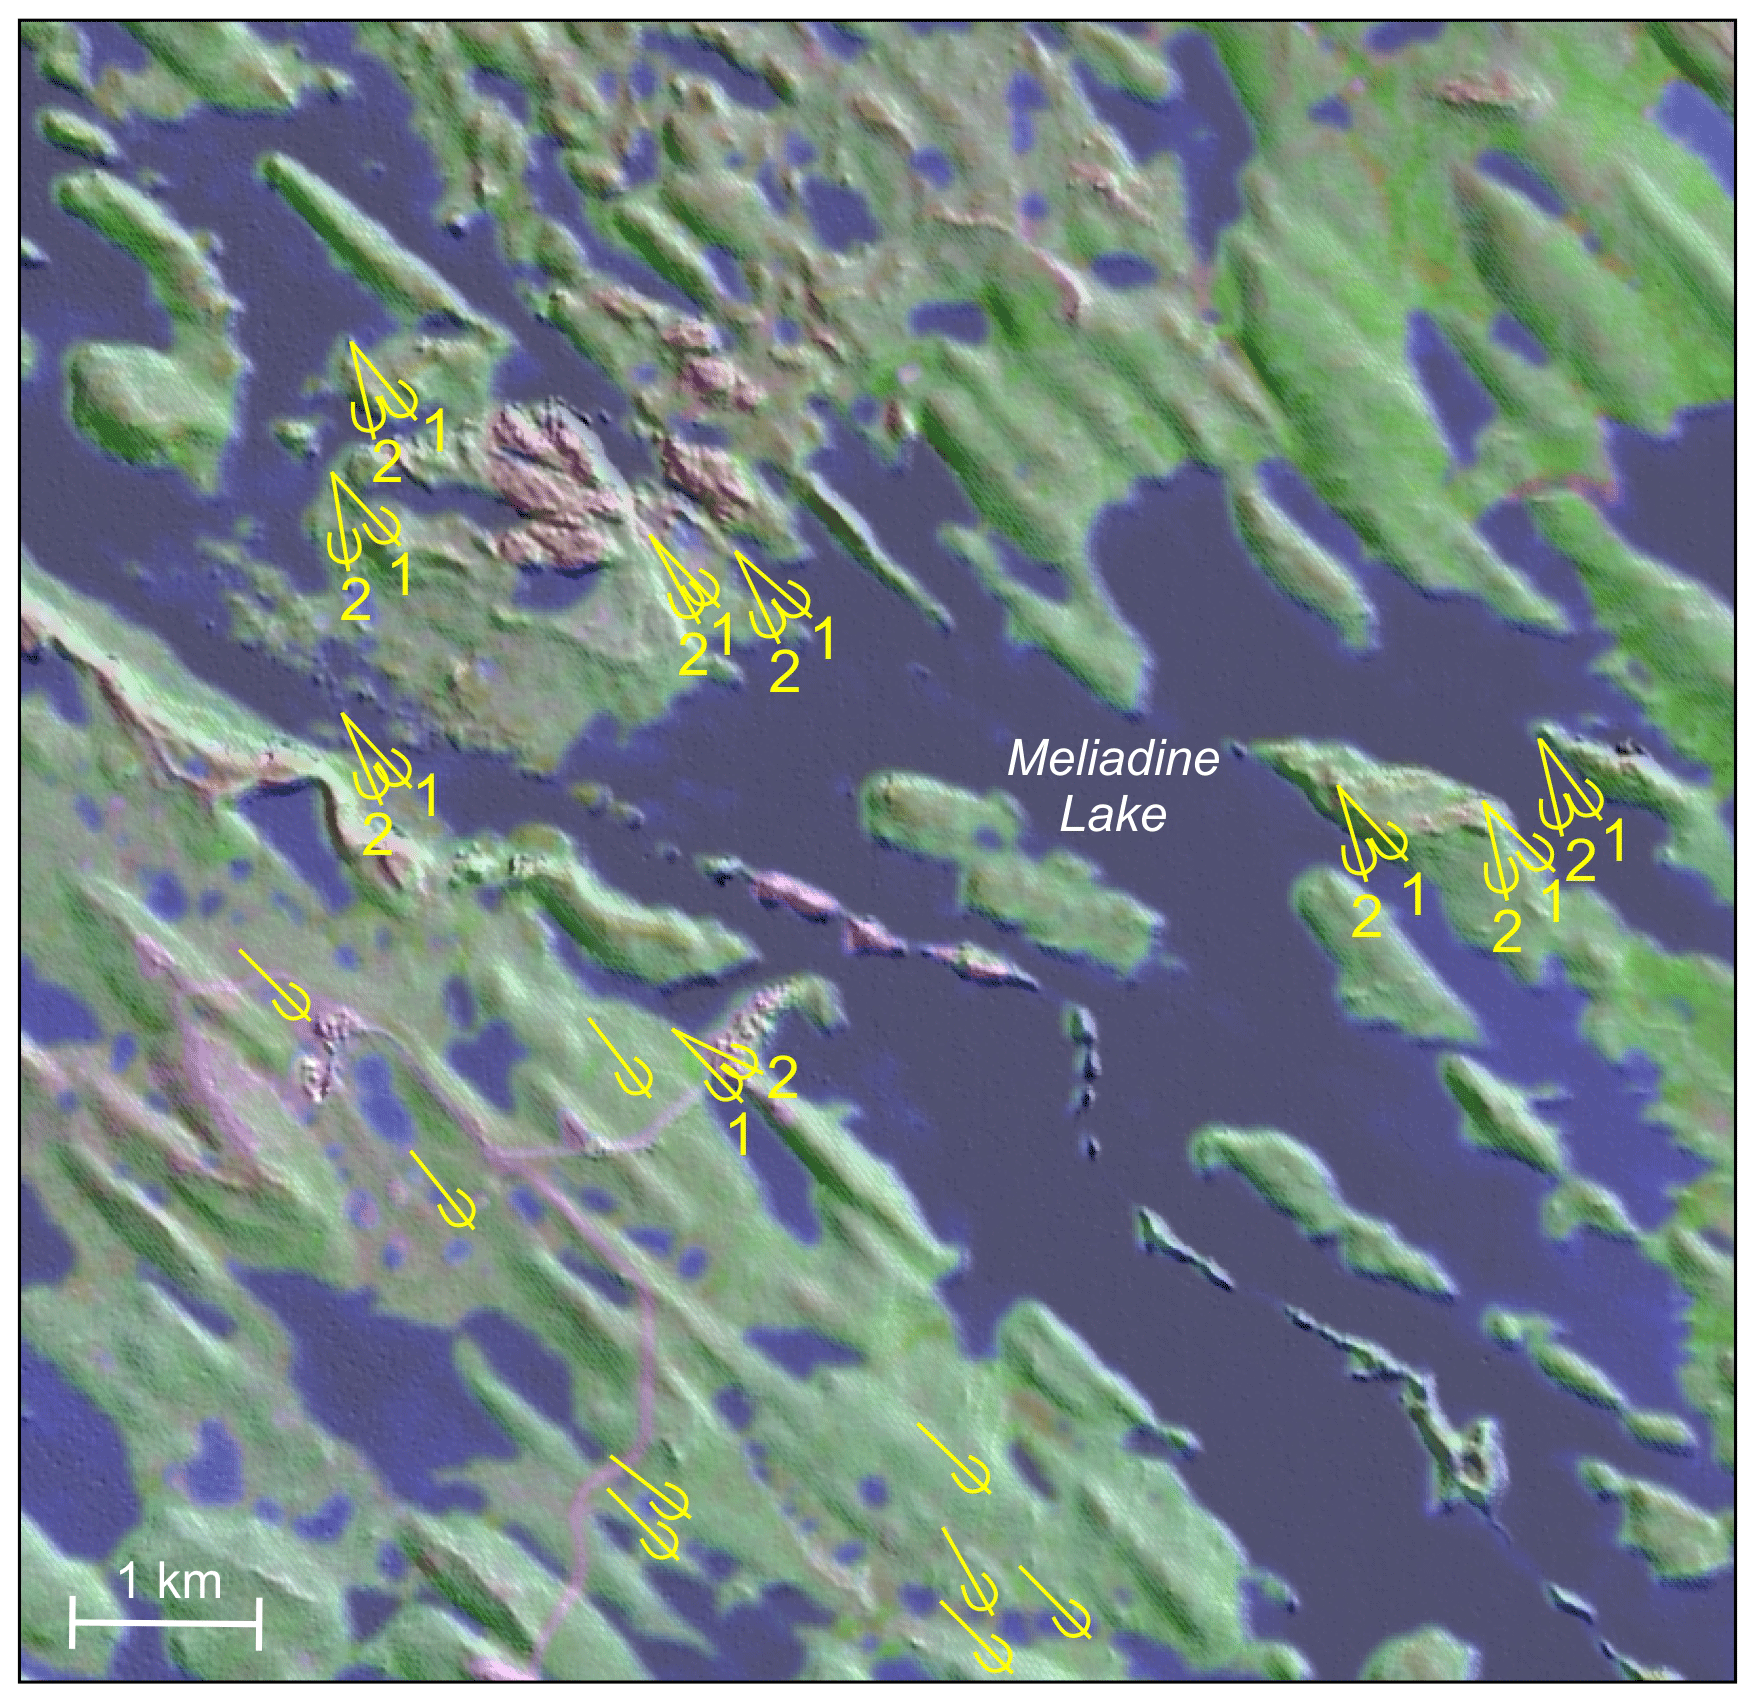
Figure 6Pattern of striations (yellow arrows) on either side of the Meliadine esker beads, showing convergence towards the esker (no. 2 arrows). Background is a Landsat 8 satellite image (Bands 754) on top of the ArcticDEM.
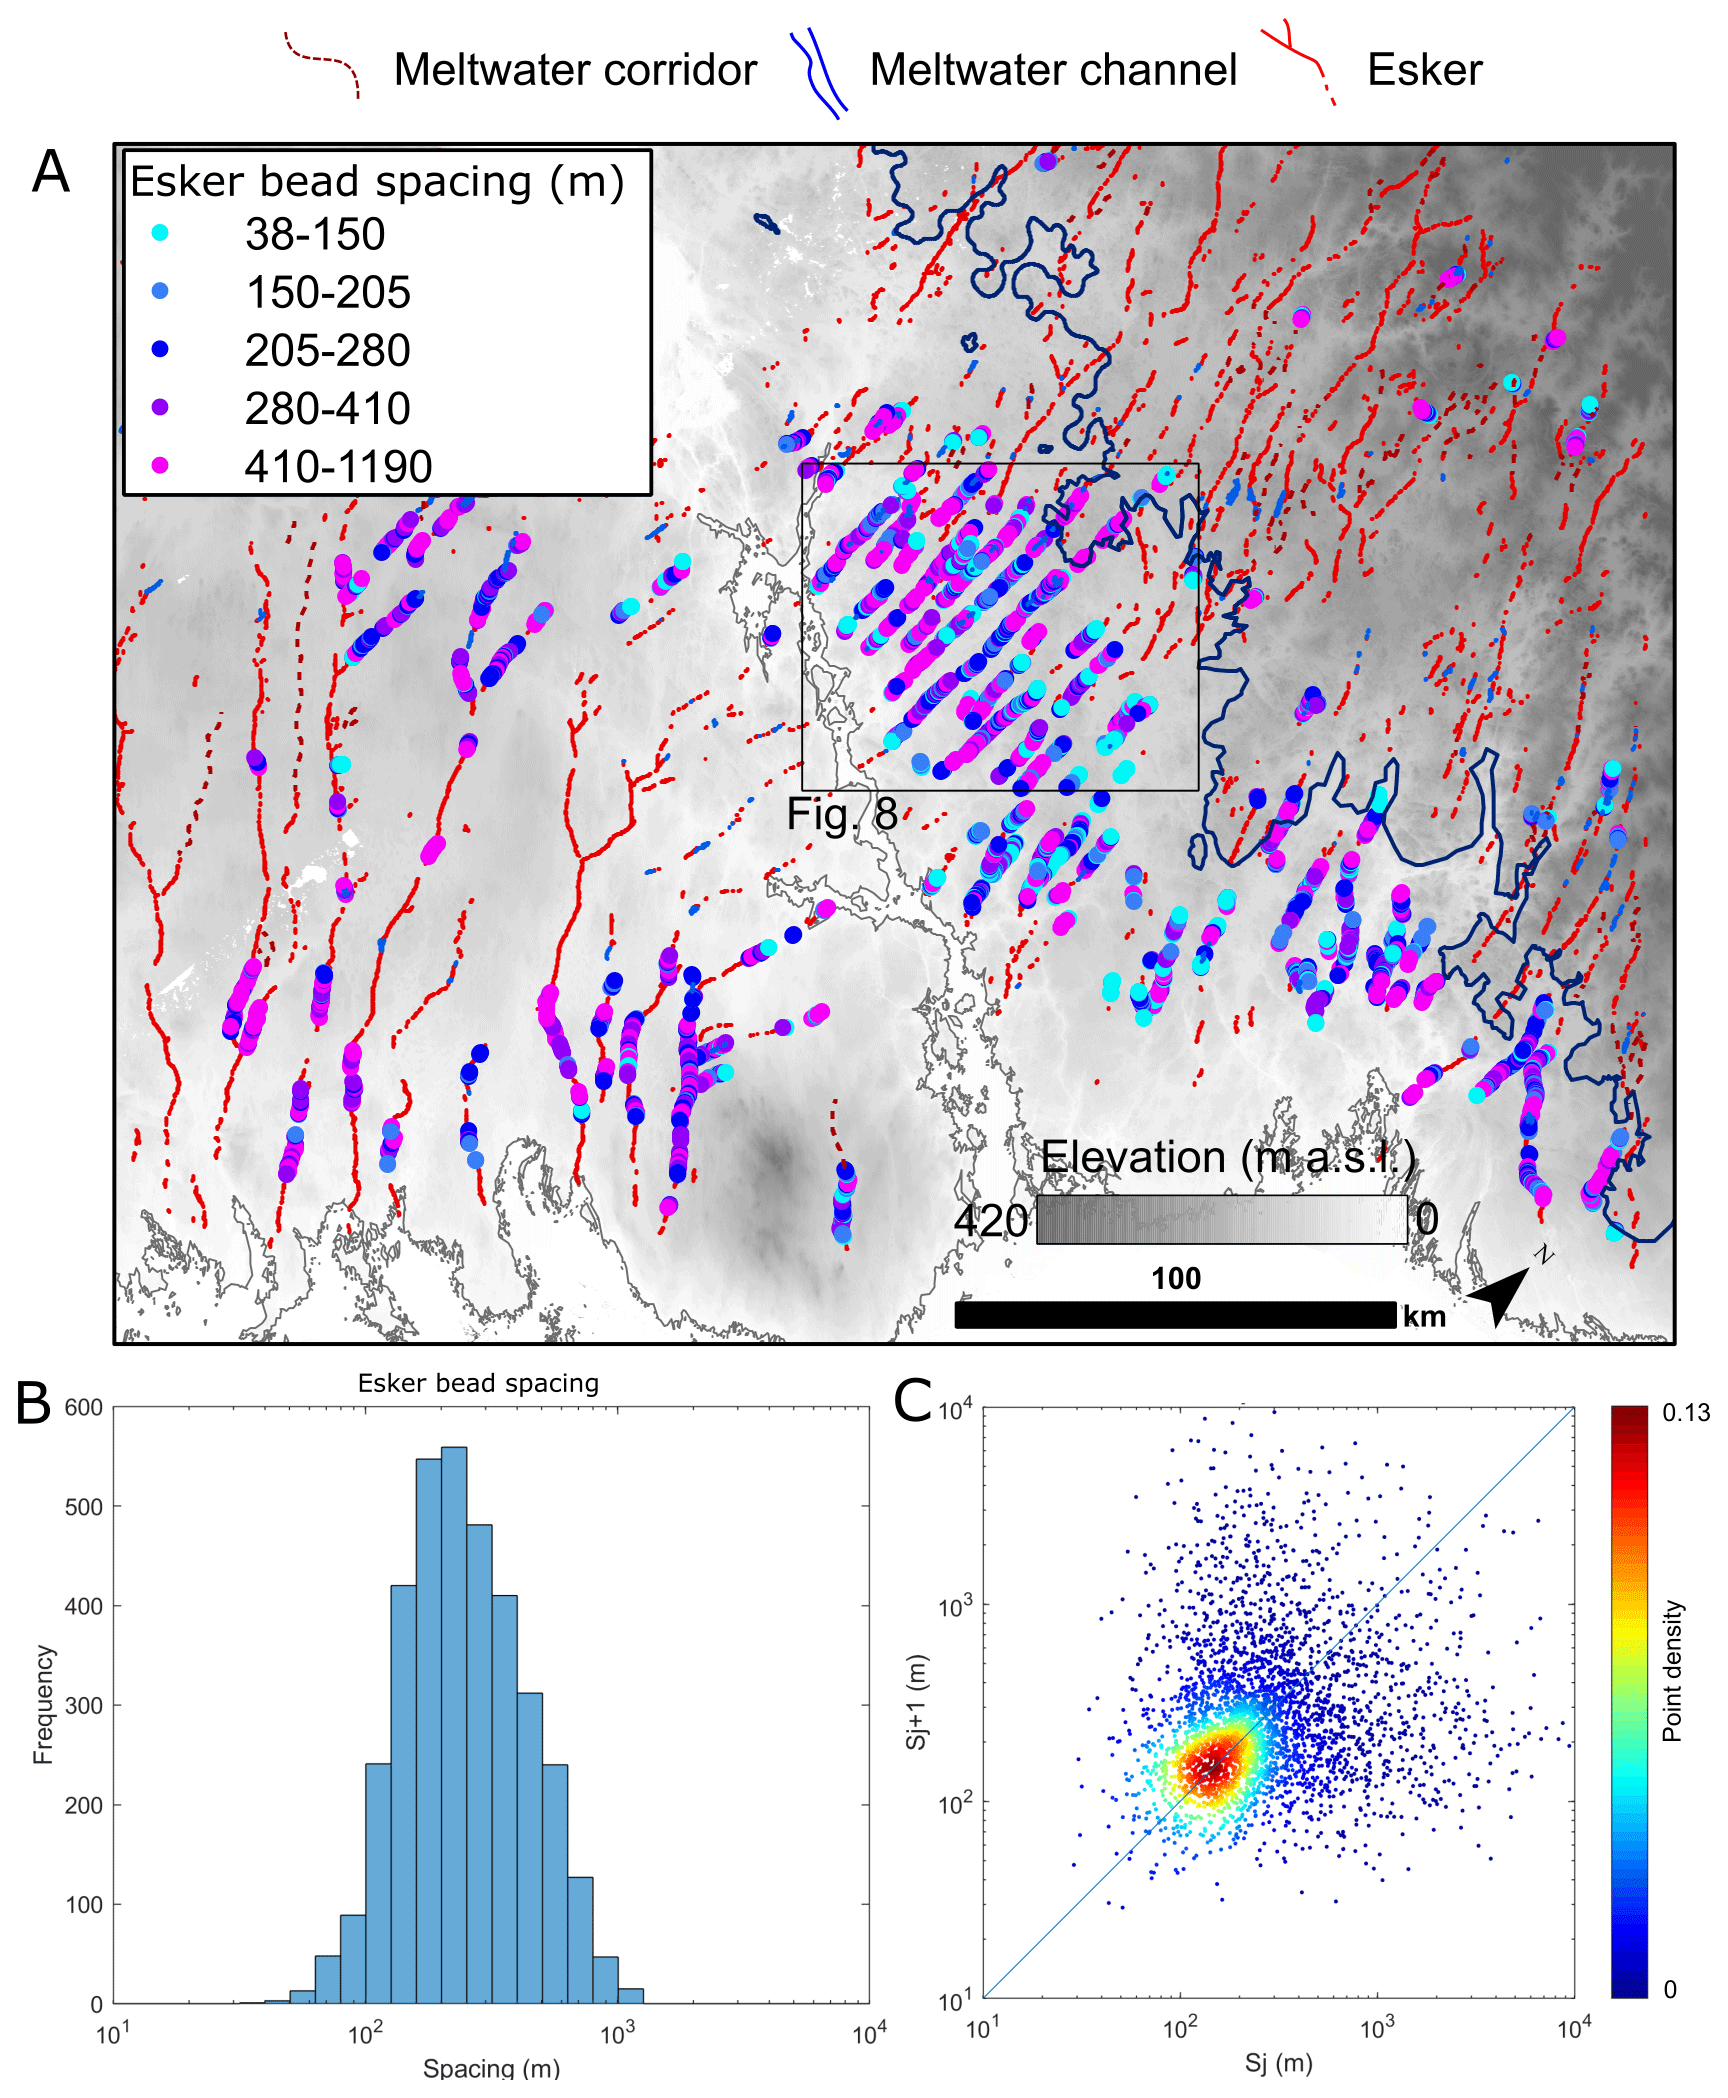
Figure 7Along-esker bead spacing. Panel (a) is the spatial pattern and panel (b) the frequency histograms. Black box is the location of Fig. 8. The dark blue line in (a) is the marine limit. Median spacing is 240 m. (c) Leading-order variogram, where Sj is the spacing of an esker bead and Sj+1 is the spacing of its up-ice neighbour. Where neighbouring esker beads have the same spacing, the resultant point plots on the 1 : 1 line. Large deviations in spacing between successive beads result in a random spread of points. Point density is the number of other points lying within a circle of 50 m radius, normalised by the total number of points. Although the p value is not-significant and the R2 is low, ∼ 35 % of successive neighbouring esker beads have a similar spacing (i.e. percentage of points within the cyan–yellow–red region). DEMs created by the Polar Geospatial Center from DigitalGlobe, Inc., imagery.
If esker beads are deposited approximately once per year, then their downstream spacing, like varves and De Geer moraines, could be used to produce an annual chronology of ice-margin retreat (e.g. De Geer, 1910). Our data suggest that the downstream spacing of esker beads varies, with a strong positive skew, across the study area, from < 50 to > 1200 m, with a median value of 240 m and interquartile range of 165–370 m (Fig. 7). This implies a typical retreat rate of 165–370 m yr−1 towards the final location of the Keewatin Ice Divide, across a distance of > 100 km. Although deglaciation is poorly constrained in this sector of the Laurentide Ice Sheet, reconstructed ice margins from Dalton et al. (2020) suggest that retreat proceeded across a distance of ∼ 215 km over 1.2 kyr, which equates to a mean retreat rate of ∼ 180 m yr−1. This is a rough estimate given uncertainties in radiocarbon dating and poor age control in this region; however, it is comparable to that calculated from the esker beads.
Variations in ice-marginal rate of retreat during regional deglaciation should result in a pattern of downstream spacing of esker beads that can be spatially correlated between eskers (e.g. Fig. 5b). Although this is complicated by uncertainty over the shape of the ice margin, local variations in retreat rate and fragmentation (e.g. due to hiatuses in deposition, post-depositional erosion, or non-detection due to submersion in lakes), we are nonetheless able to identify coherent, broad-scale (data binned at 5 km) trends in esker bead frequency in the cluster of N–S-trending eskers, just to the north of Chesterfield Inlet (Fig. 8). Five sections of more closely spaced esker beads corresponding to periods of slower ice retreat can be qualitatively identified across multiple eskers (Fig. 8a, b), and the resulting isochrones produce ice margins which appear realistic (i.e. they are transverse to the eskers and do not contain unusual lobes or indentations given the topography) (Fig. 8a). Thus, while we would certainly expect some local deviation from an annual signal, over a large area we suggest that the esker beads and De Geer moraines represent a roughly annual signature of ice retreat and meltwater drainage. This is consistent with other studies that have invoked an annual origin for esker beads (e.g. De Geer, 1897, 1910, 1940; Banerjee and McDonald, 1975). In particular, De Geer (1897, 1910, 1940) was able to correlate esker beads to De Geer moraines and the annual glacial varve record in Sweden based on extensive mapping and detailed sedimentological and stratigraphic investigation.
Annual esker bead deposition and De Geer moraine formation provide a high-resolution record of ice-margin retreat that can be used to better constrain the timing and rate of deglaciation in central Nunavut (Dyke et al., 2003). Our results suggest that the pace of deglaciation was on the order of 165–370 m yr−1, punctuated by short periods (years to a few decades) of more rapid retreat (> 400 m yr−1) (Fig. 7). These retreat rates are consistent with, but towards the upper end of, those experienced by marine palaeo-ice streams (e.g. Winsborrow et al., 2010; Livingstone et al., 2012) and contemporary marine-terminating outlet glaciers in Greenland (e.g. Howat and Eddy, 2011; Murray et al., 2015). The distribution of beads and De Geer moraines indicates retreat of an initially marine-terminating ice sheet (Shilts et al., 1979; Shilts, 1986) that became terrestrially terminating as it retreated northwards onto higher ground ( 130 m a.s.l.) (e.g. Fig. 1). Plume-enhanced melting and calving modified the grounding line, producing kilometre-scale indentations (marine embayments) where water debouched from subglacial conduits (Fig. 5).
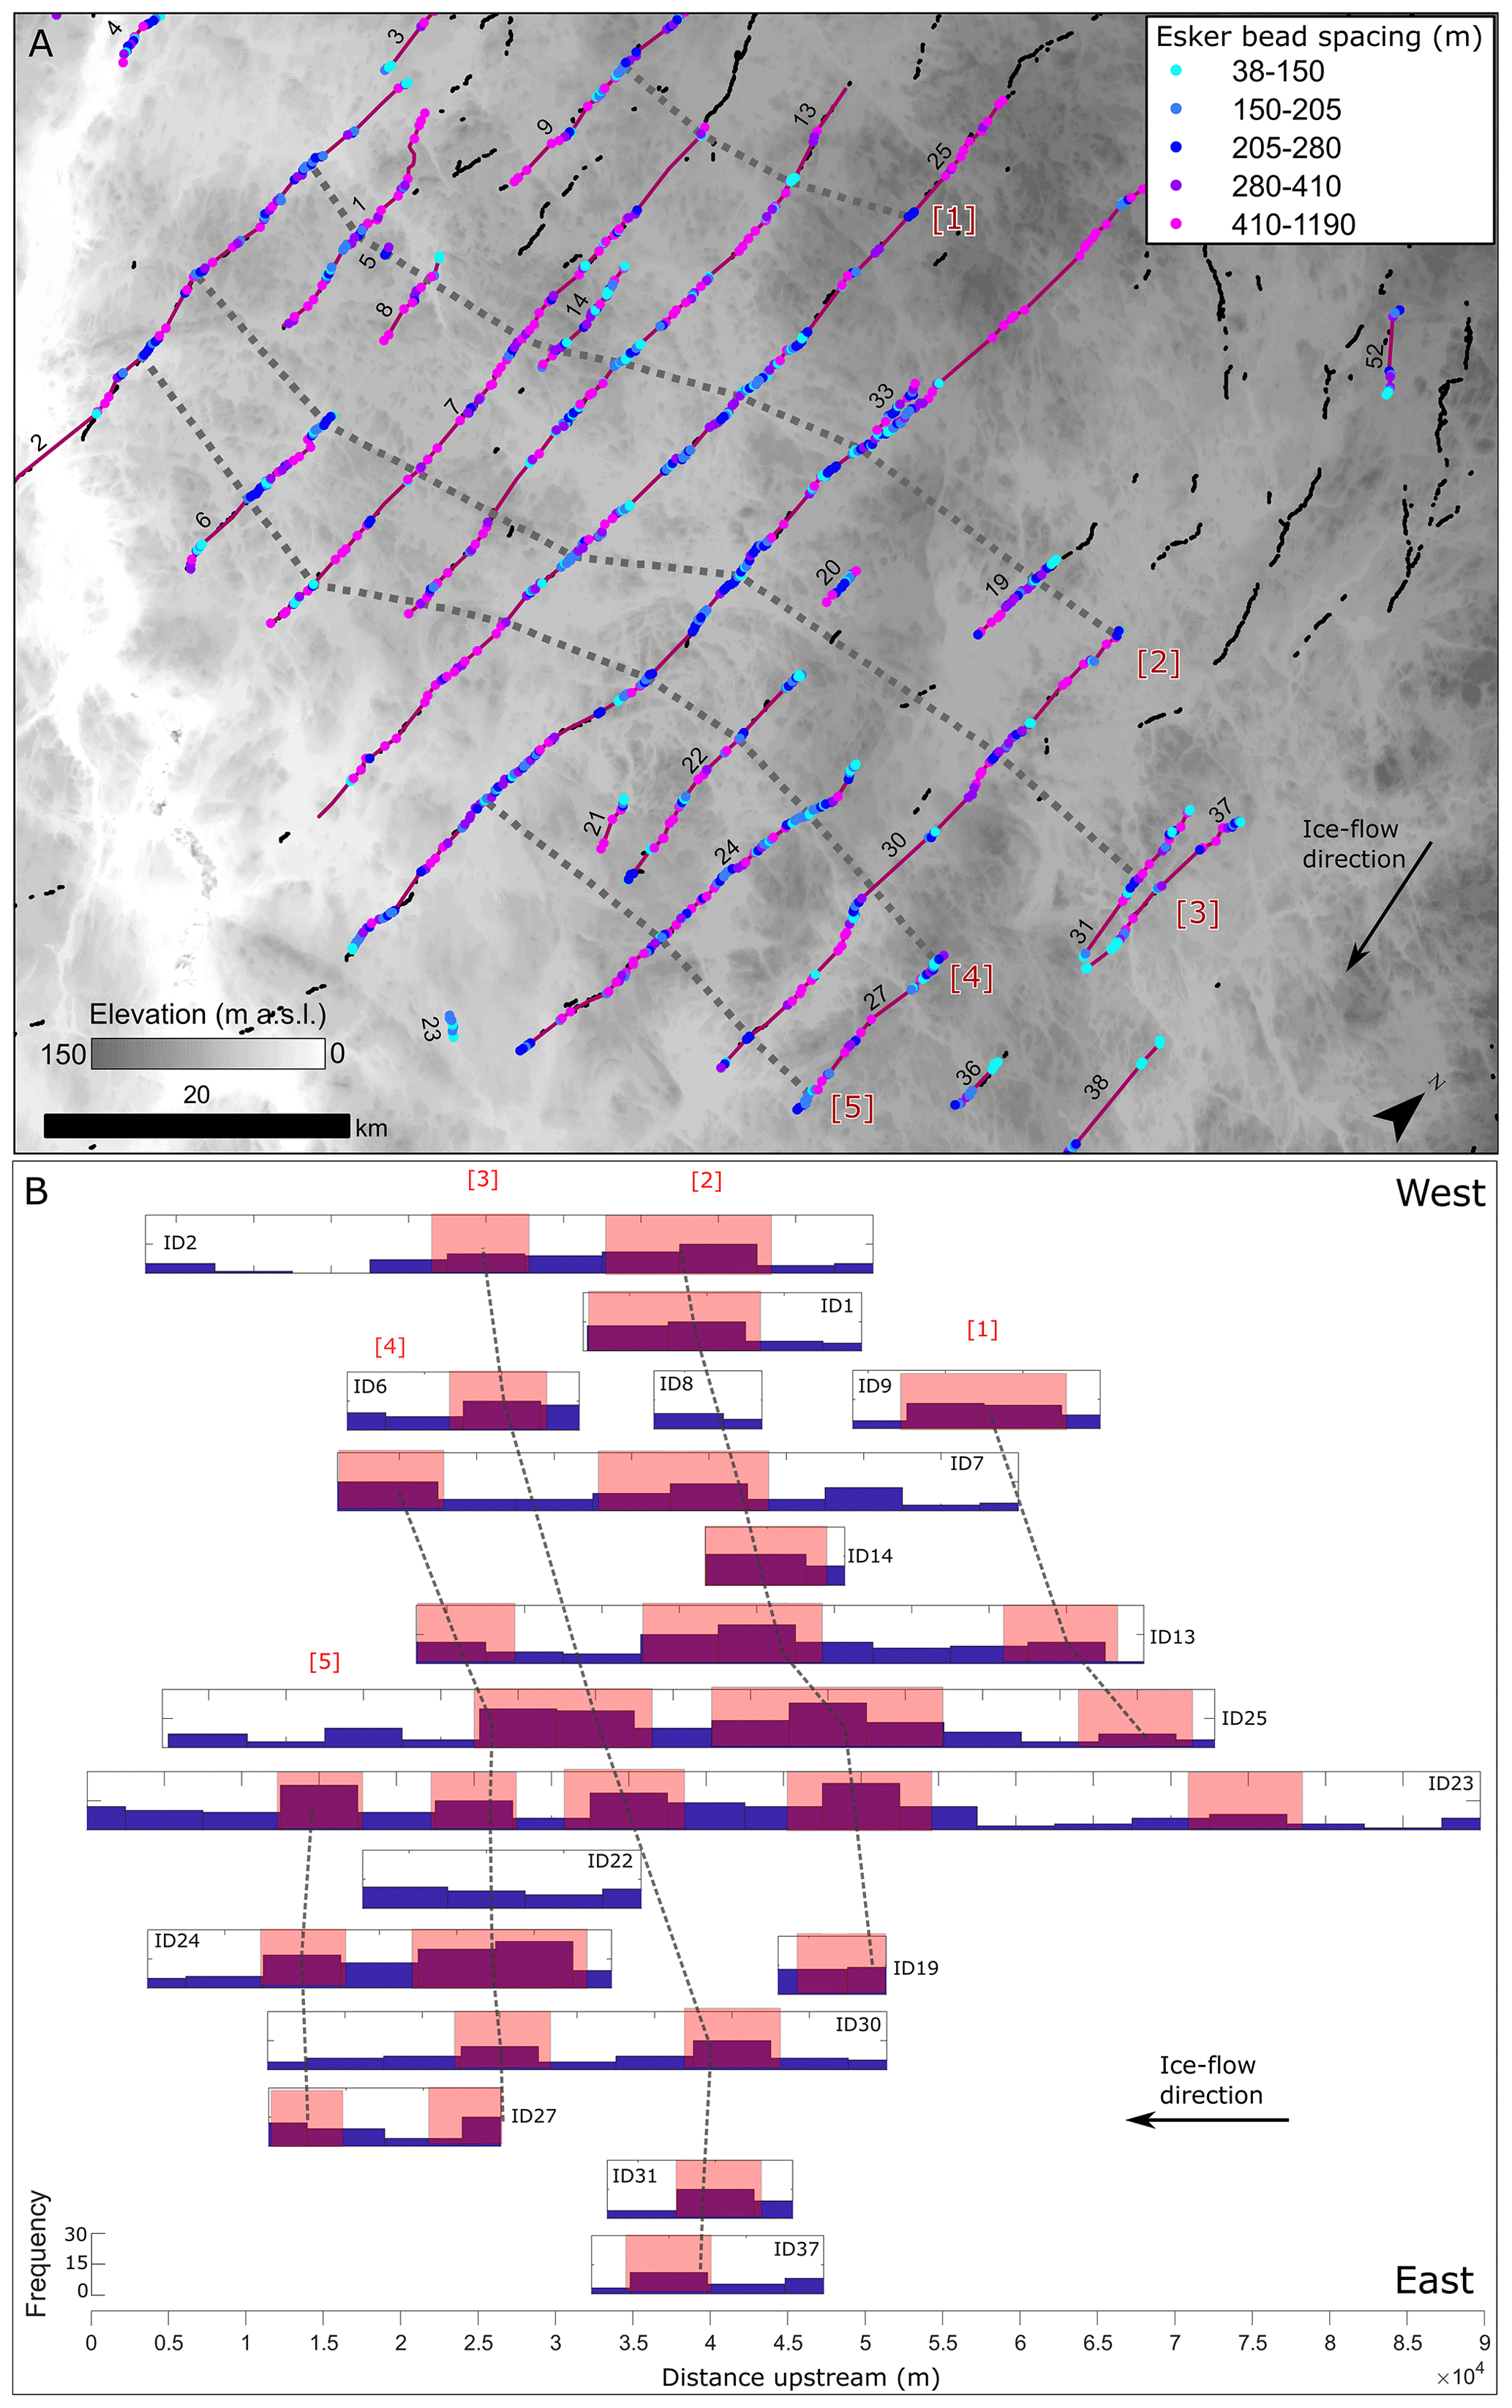
Figure 8Esker bead downstream spacing-distance plot. Panel (a) shows the spatial distribution of beaded eskers and average downstream spacing between two nearest beads (location shown in Fig. 7). Black lines are esker ridges. Panel (b) is a frequency-density histogram of esker beads along esker axes (numerical ID labelled in black in a). Bins are 5 km. Coincidence of regions with closely spaced beads (high density) is traced by eye (red boxes and dotted lines) and plotted in (a) (red IDs). Note the consistent qualitative transverse relationship between closely spaced beads, indicative of a common forcing. DEMs created by the Polar Geospatial Center from DigitalGlobe, Inc., imagery.
To explain the two distinct time-transgressive esker networks, orientated N–S and NW–SE, the ice sheet must have split into two ice masses with a large re-entrant to the south of Chesterfield Inlet (black dashed line in Fig. 1). This is consistent with fragmentation of the ice sheet into two smaller ice masses on either side of Chesterfield Inlet during the final stages of deglaciation (Dyke et al., 2003; Dyke, 2004). The more northerly centre of ice dispersal must have migrated farther northwards than envisaged by Dyke et al. (2003) to account for the extension of the esker network across the divide (see also McMartin et al., 2016, 2019). The interlobate zone along which the ice masses split is illustrated in Fig. 9a by two smaller N–S-orientated beaded eskers joining a larger NW–SE beaded esker at acute angles. This larger esker likely demarcates the former interlobate zone into which water from the N–S-trending ice lobe was focused (e.g. Warren and Ashley, 1994; Mäkinen, 2003) (Fig. 1). Noteworthy in this example is that the upper N–S-orientated beaded esker turns E–W as it joins the larger esker (Fig. 9a), which is difficult to reconcile with a subglacial origin because drainage would have been up-glacier.

Figure 9Examples of confluences between beaded eskers and influence of topography on drainage networks. Black lines are mapped esker ridges, blue lines are meltwater channel sides, and black polygons are mapped esker beads. Hill-shaded ArcticDEM is 2 m horizontal resolution. Locations are displayed in Fig. 1. The black dashed lines in (a) represent interpreted margin positions demarcating the unzipping of two ice lobes, one retreating west and another north (arrows show direction of retreat). DEMs created by the Polar Geospatial Center from DigitalGlobe, Inc., imagery.
Our suggestion that beaded eskers are an annual imprint of ice-marginal conduit deposition is significant because the composite signature can be deconvolved to provide information on the spatial and temporal scales of subglacial drainage that have hitherto been difficult to reconcile. As such these findings provide much-needed constraints for testing subglacial hydrological models (e.g. Hewitt and Creyts, 2019). In particular, the assumption that the spacing of subglacial conduits is reflected by the lateral spacing of a given observed network of eskers (e.g. Hewitt, 2011; Storrar et al., 2014) is predicated on all eskers of that network having formed synchronously in the past. This condition is difficult to deduce from the esker ridges themselves and will not be met if different sets of eskers were deposited subglacially at different times during deglaciation to form the network observed today. In contrast, because the esker beads identified in this study formed time-transgressively at the ice-sheet margin, the set of all eskers must have formed together as one retreat episode. Consequently, the lateral spacing of beaded eskers is a true reflection of subglacial conduit spacing at least near the palaeo-ice margin and so provides a more accurate set of observations for testing the esker-spacing theory.
The network of beaded eskers is well-organised and can be traced for over 100 km, spanning ∼ 350 years of deposition (Fig. 1), indicating that spacing of subglacial channelised drainage was relatively fixed in space and through time in this region. Beaded eskers typically exhibit parallel drainage patterns, contrasting with areas dominated by ridges and subglacial meltwater corridors which tend to be more dendritic (Fig. 1). This could indicate that esker ridges are not formed right at the ice margin but can extend some distance up-ice, resulting in more complex drainage networks, and that tributaries may be largely transitory features, which tend to occur up-glacier of the retreating ice margin. Alternatively, the increase in the number of tributaries could indicate a transition to a shallower ice surface slope and thus shallower hydraulic potential gradient, or the higher roughness regions to the north may have resulted in more complex subglacial water flow. Where beaded esker tributaries are observed, they tend to record re-entrants associated with unzipping of the two ice lobes (Fig. 9a). However, other tributaries with shallow-angled junctions also occur (Fig 9b–d), and in these cases it may be possible to determine whether these are true hydrologically functioning tributaries that emerge at the ice margin during retreat or apparent tributaries that arise as a single subglacial conduit splits into two during retreat. The tributaries in Fig. 9b and c do not appear to be controlled by bed topography and can only be traced for a short distance (∼ 10 km in both cases) before one of the eskers disappears and are therefore thought to represent slight reorganisations of the drainage network (e.g. due to a change in ice geometry). In Fig. 9d the esker tributaries are interpreted to have been strongly controlled by their alignment along topographic lows.
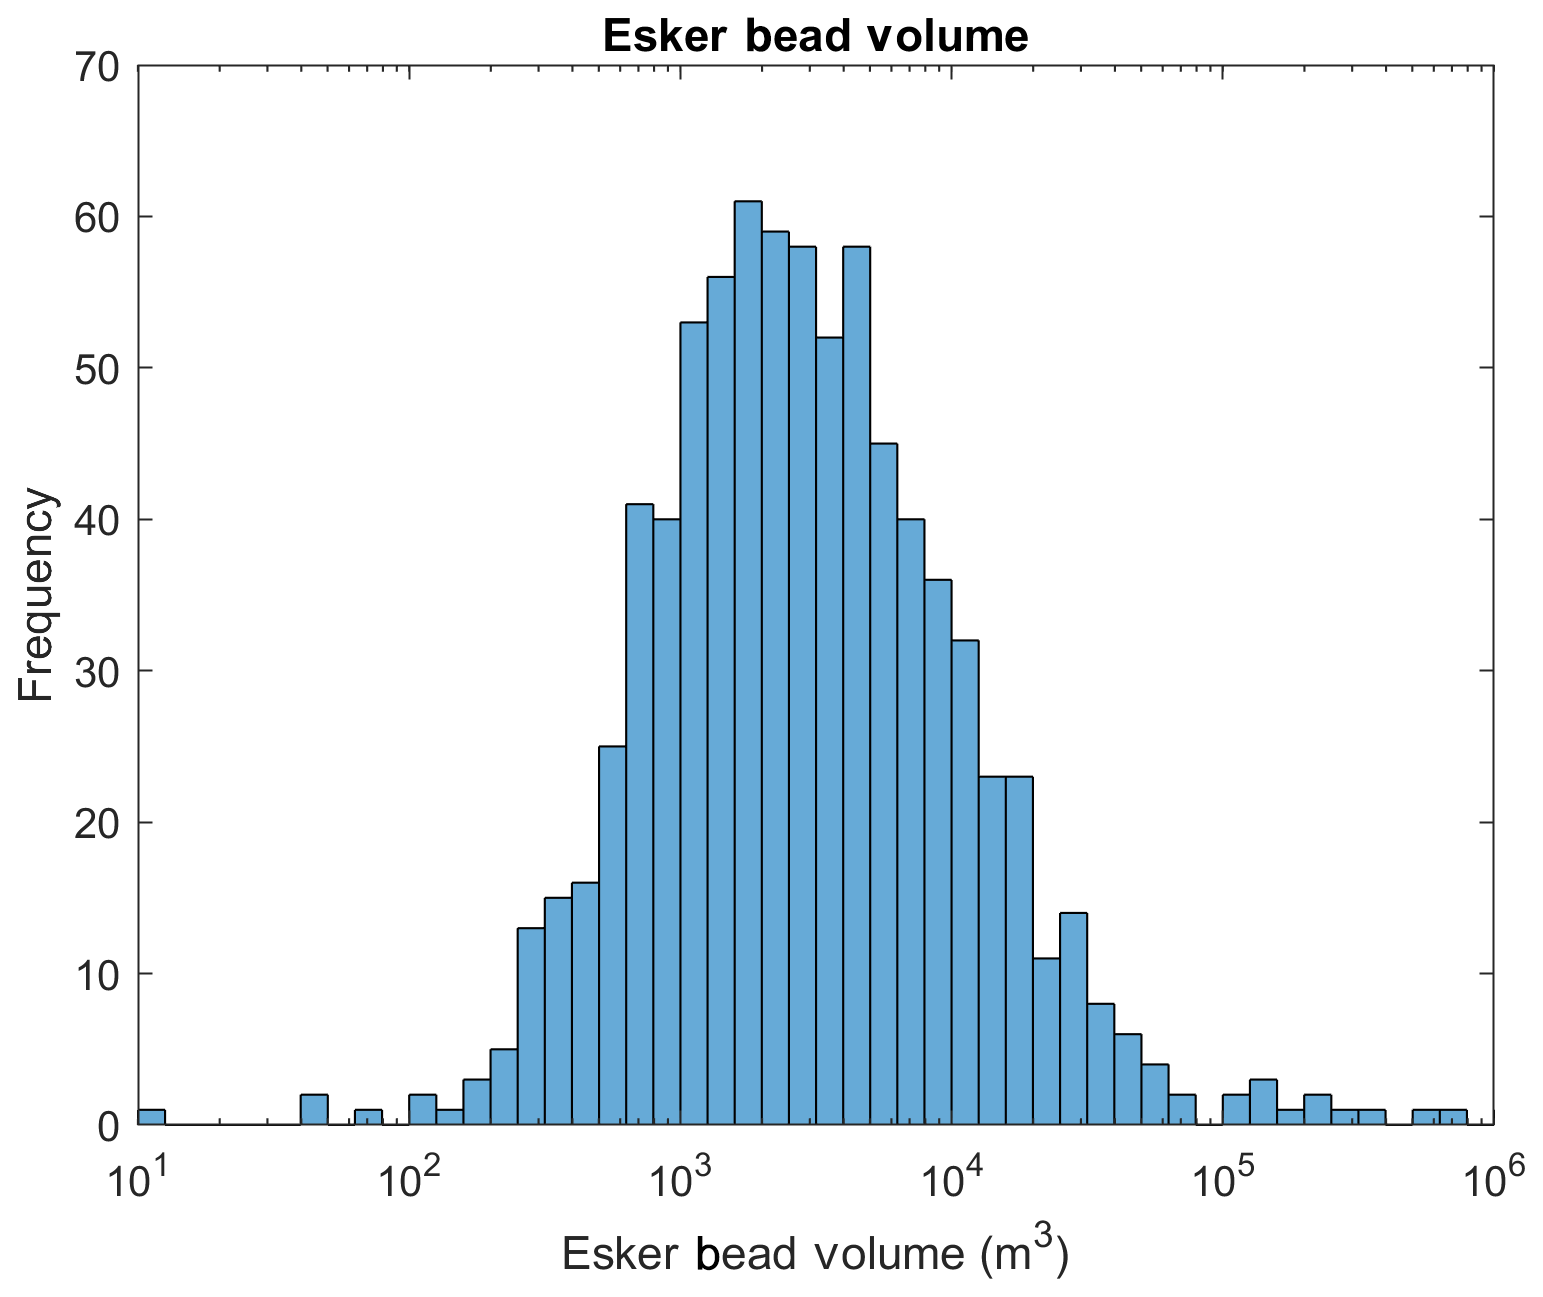
Figure 10Esker bead volume. Because the beads are interpreted as quasi-annual and the lateral spacing of the eskers is thought to reflect the true spacing of the subglacial conduits, these volumes represent a minimum sediment flux per year per 6–10 km ice-margin width.
Finally, accepting this interpretation, esker beads record the volume of sediment deposited each melt season and can therefore be used to better constrain subglacial conduit sediment fluxes. These fluxes should be considered minimum bounds, since not all sediment will be deposited at the grounding line (much of the finer component will be transported away in plumes; e.g. Powell, 1990) and the beads have likely endured erosion since deposition. In addition, the spacing of eskers provides a bound on the width of the catchment of each subglacial conduit. Given that the rough lateral spacing of beaded eskers is 6–10 km, these fluxes can be considered minimum sediment fluxes per year per 6–10 km width of the past ice sheet. The esker beads in central Nunavut produce minimum esker sediment fluxes that typically range between 103 and 104 m3 yr−1 per bead (Fig. 10), which is a few orders of magnitude lower than sediment fluxes derived from the aggradation of present-day grounding-line fans in southern Alaska (106 m3 yr−1: Powell, 1990; Powell and Molnia, 1989). This is probably not surprising, however, given the thin and patchy cover of sediment in central Nunavut (Fig. 1), which would have limited the supply of sediment, especially when compared to the more elevated and steeper terrain in southern Alaska. Indeed, there is a general qualitative correlation between the size of esker beads and bed substrate, with larger beads more prevalent south of Chesterfield Inlet in the zone covered by a thick till blanket, while the bedrock exposed area around Chesterfield Inlet is characterised by smaller beads that are more sporadic (Figs. 1, 2). The ubiquity of esker beads across this marine-terminating sector of the Laurentide Ice Sheet may therefore be a result of lower sediment fluxes that were unable to backfill conduits at a rate greater than the pace of ice-margin retreat. If so, the switch to more continuous esker ridges on higher ground to the north may reflect a slowdown in retreat as the ice became terrestrially terminating or an increase in sediment supply. Certainly, below the marine limit, esker ridges tend to be more common in thicker till and where esker beads are larger (e.g. see south of Chesterfield Inlet in Fig. 7a), implying that sediment supply is an important control. The logical conclusion is therefore that esker ridges also represent a time-transgressive signature but that sediment backfilling of the subglacial conduit outpaced retreat, allowing ridges to form in a headward direction behind the margin. These inferences are consistent with those of De Geer (1940), who identified esker ridges composed of a series of annual fans deposited on top of each other, and with recent modelling results (Beaud et al., 2018; Hewitt and Creytts, 2019); this implies that eskers record a composite pattern of near-margin subglacial drainage.
We mapped nearly 10 000 esker beads and ridge segments from high-resolution (2 m) ArcticDEM data across an 87 500 km2 area of central Nunavut, around Chesterfield Inlet, NW of Hudson Bay. Our mapping revealed nearly 5000 esker beads (series of aligned mounds), which because of their association with De Geer moraines are interpreted as quasi-annual ice-marginal deposits formed time-transgressively at the mouth of subglacial conduits during deglaciation. The majority of beads are located below the former marine limit of the Tyrrell Sea and therefore likely represent subaqueous outwash fans. De Geer moraines display a striking V-shaped arrangement, indicating the formation of embayments at the mouth of subglacial conduits due to plume-enhanced melting and calving. The co-alignment of De Geer moraines and esker beads suggests that the ice-margin re-advanced to the previous year's esker bead and/or that the esker bead was formed prior to the onset or after summer retreat from the moraine. The identification of esker beads as quasi-annual deposits has significant implications, as they preserve a high-resolution record of ice-margin retreat and subglacial hydrology. These include the following.
-
The network of esker beads is well-organised (quasi-regularly spaced) and spans > 100 km, implying that subglacial channelised drainage was relatively fixed in space and through time. Tributaries are thought to record re-entrants associated with unzipping of two ice lobes on either side of Chesterfield Inlet; stable drainage tributaries controlled by ice surface slope and topography emerged at the ice margin during ice retreat.
-
We propose that the downstream spacing of esker beads records a high-resolution (quasi-annual) record of ice-sheet retreat in this sector of the Laurentide Ice Sheet. Our results suggest that the pace of deglaciation was on the order of 165–370 m yr−1, punctuated by short periods of more rapid retreat (> 400 m yr−1).
-
In contrast to esker ridges, which could have been deposited subglacially at different times during deglaciation, the set of esker beads must have sequentially formed together during one retreat episode and therefore provide a true reflection of subglacial conduit spacing. Our data therefore provide an appropriate set of observations for testing the esker-spacing theory.
-
Esker beads record the volume of sediment deposited during each melt season and therefore can be used to better constrain minimum subglacial conduit sediment fluxes. The esker beads in central Nunavut produce minimum sediment fluxes in the range of 103–104 m3 yr−1 per subglacial conduit, which drained meltwater across stretches of the ice sheet 6–10 km in width.
-
There is a general qualitative correlation between the esker bead size and bed substrate, with larger beads more frequent in the zone covered by a thick till blanket. We suggest that the prevalence of esker beads across this marine-terminating sector of the Laurentide Ice Sheet is a result of lower sediment fluxes that were unable to backfill conduits at a rate greater than the pace of ice-margin retreat. The switch to more continuous esker ridges on higher ground to the north may reflect a slowdown in retreat as the ice became terrestrially terminating or an increase in sediment supply. We therefore suggest that the esker ridges also formed time-transgressively but that sediment backfilling of the subglacial conduit outpaced retreat, resulting in headward esker growth close to but behind the margin. The implication, in accordance with the pioneering initial work of De Geer (1897, 1910, 1940) and recent modelling results (Hewitt and Creytts, 2019), is that eskers in general record a composite signature of ice-marginal and not subglacial drainage, although we cannot rule out the latter sometimes occurring.
The mapping of meltwater features is archived at https://doi.org/10.15131/shef.data.12315221 (Livingstone et al., 2020).
EL discovered the esker beads. SJL carried out the mapping and analysis, with FN writing the code for Figs. 2c and 7c and IM producing Fig. 6. SL prepared the paper, with contributions from all co-authors.
The authors declare that they have no conflict of interest.
DEMs were provided by the Polar Geospatial Centre under NSF-OPP awards 1043681, 1559691, and 1542736. We would like to thank Anna L. C. Hughes and two anonymous reviewers for their insightful comments that really helped to improve the paper. Rod Smith is also thanked for his helpful comments on an earlier draft.
This project has benefitted from the PALGLAC team of researchers and received funding from the European Research Council (ERC) under the European Union's Horizon 2020 research and innovation programme (grant agreement no. 787263). Emma L. M. Lewington was funded through “Adapting to the Challenges of a Changing Environment” (ACCE), a NERC-funded doctoral training partnership ACCE DTP (NE/L002450/1).
This paper was edited by Kerim Nisancioglu and reviewed by Anna L. C. Hughes and two anonymous referees.
Ahokangas, E. and Mäkinen, J.: Sedimentology of an ice lobe margin esker with implications for the deglacial dynamics of the Finnish Lake District lobe trunk, Boreas, 43, 90–106, https://doi.org/10.1111/bor.12023, 2014.
Aylsworth, J. M. and Shilts, W. W.: Glacial features around the Keewatin Ice Divide: Districts of Mackenzie and Keewatin, Geol. Surv. Canada, Ottawa, Paper 88-24, 21 pp., 1989.
Banerjee, I. and McDonald, B. C.: Nature of esker sedimentation, in: Glaciofluvial and Ghciolacustrine Sedimentation, edited by: Jopling, A. V. and McDonald, B. C., SEPM Special Publication 23, 132–154, 1975.
Beaud, F., Flowers, G. E., and Venditti, J. G.: Modeling Sediment Transport in Ice-Walled Subglacial Channels and Its Implications for Esker Formation and Proglacial Sediment Yields, J. Geophys. Res.-Earth Surf., 123, 3206–3227, https://doi.org/10.1029/2018jf004779, 2018.
Benn, D. I., Warren, C. R., and Mottram, R. H.: Calving processes and the dynamics of calving glaciers, Earth-Sci. Rev., 82, 143–179, https://doi.org/10.1016/j.earscirev.2007.02.002, 2007.
Boulton, G. S. and Clark, C. D.: A highly mobile Laurentide ice sheet revealed by satellite images of glacial lineations, Nature, 346, 813–817, https://doi.org/10.1038/346813a0, 1990a.
Boulton, G. S. and Clark, C. D.: The Laurentide ice sheet through the last glacial cycle: the topology of drift lineations as a key to the dynamic behaviour of former ice sheets, Earth Env. Sci. T. R. So., 81, 327–347, https://doi.org/10.1017/s0263593300020836, 1990b.
Boulton, G. S., Dongelmans, M., Punkari, and Broadgate, M.: Paleoglaciology of an ice sheet through a glacial cycle: the European ice sheet through the Weichselian, Quater. Sci. Rev., 20, 591–625, https://doi.org/10.1016/S0277-3791(00)00160-8, 2001.
Bouvier, V., Johnson, M. D., and Påsse, T.: Distribution, genesis and annual-origin of De Geer moraines in Sweden: insights revealed by LiDAR, GFF, 137, 319–333, https://doi.org/10.1080/11035897.2015.1089933, 2015.
Brennand, T. A.: Macroforms, large bedforms and rhythmic sedimentary sequences in subglacial eskers, south-central Ontario: implications for esker genesis and meltwater regime, Sedimentary Geol., 91, 9–55, https://doi.org/10.1016/0037-0738(94)90122-8, 1994.
Brennand, T. A.: Deglacial meltwater drainage and glaciodynamics: inferences from Laurentide eskers, Canada, Geomorphology, 32, 263–293, https://doi.org/10.1016/s0169-555x(99)00100-2, 2000.
Chandler, B. M., Lovell, H., Boston, C. M., Lukas, S., Barr, I. D., Benediktsson, Í. Ö., Benn, D. I., Clark, C. D., Darvill, C. M., Evans, D. J., and Ewertowski, M. W.: Glacial geomorphological mapping: A review of approaches and frameworks for best practice, Earth-Sci. Rev., 185, 806–846, https://doi.org/10.1016/j.earscirev.2018.07.015, 2018.
Cheel, R. J. and Rust, B. R.: A sequence of soft-sediment deformation (dewatering) structures in Late Quaternary subaqueous outwash near Ottawa, Canada, Sediment. Geol., 47, 77–93, https://doi.org/10.1016/0037-0738(86)90072-2, 1986.
Dalton, A. S., Margold, M., Stokes, C. R., et al.: An updated radiocarbon-based ice margin chronology for the last deglaciation of the North American Ice Sheet Complex, Quaternary Sci. Rev., 234, 106223, https://doi.org/10.1016/j.quascirev.2020.106223, 2020.
De Geer, G.: Om rullstensåsarnas bildningssätt, Geologiska Föreningen i Stockholm Förhandlingar, 19, 366–388, https://doi.org/10.1080/11035899709448614, 1897.
De Geer, G.: Geochronolgie der letzten 12 000 Jahre, The 11th International Geological Congress in Stockholm, 457–471, 1910.
De Geer, G.: Geochronologia Suecica Principles, Kungliga Svenska Vetenskapsakademiens Handlingar III, 18, 367 pp., 1940.
Dowling, T. P., Möller, P., and Spagnolo, M.: Rapid subglacial streamlined bedform formation at a calving bay margin, J. Quatern. Sci., 31, 879–892, https://doi.org/10.1002/jqs.2912, 2016.
Dyke, A. S.: An outline of North American deglaciation with emphasis on central and northern Canada, in: Quaternary Glaciations: Extent and Chronology, Part II, edited by: Ehlers, J. and Gibbard, P. L., Elsevier, Amsterdam, 373–424, 2004.
Dyke, A. S., Moore, A., and Robertson, L.: Deglaciation of North America, Geol. Surv. Canada, Open File 1574, Natural Resources Canada, Ottawa, https://doi.org/10.4095/214399, 2003.
Flink, A. E., Noormets, R., Kirchner, N., Benn, D. I., Luckman, A., and Lovell, H.: The evolution of a submarine landform record following recent and multiple surges of Tunabreen glacier, Svalbard, Quatern. Sci. Rev., 108, 37–50, https://doi.org/10.1016/j.quascirev.2014.11.006, 2015.
Fulton, R. J.: Surficial materials of Canada, Geol. Surv. Canada, “A” Series Map 1880A, 1 sheet, https://doi.org/10.4095/205040, 1995.
Gorrell, G. and Shaw, J.: Deposition in an esker, bead and fan complex, Lanark, Ontario, Canada, Sediment. Geol., 72, 285–314, https://doi.org/10.1016/0037-0738(91)90016-7, 1991.
Greenwood, S. L., Clason, C. C., Helanow, C., and Margold, M.: Theoretical, contemporary observational and palaeo-perspectives on ice sheet hydrology: processes and products, Earth-Sci. Rev., 155, 1–27, https://doi.org/10.1016/j.earscirev.2016.01.010, 2016.
Hebrand, M. and Åmark, M.: Esker formation and glacier dynamics in eastern Skane and adjacent areas, southern Sweden, Boreas, 18, 67–81, https://doi.org/10.1111/j.1502-3885.1989.tb00372.x, 1989.
Hewitt, I. J.: Modelling distributed and channelized subglacial drainage: the https://doi.org/10.3189/002214311796405951, 2011.
Hewitt, I. J. and Creyts, T. T.: A model for the formation of eskers, Geophys. Res. Lett., 46, 6673–6680, https://doi.org/10.1029/2019gl082304, 2019.
Hoppe, G.: Problems of glacial morphology and the Ice Age, Geogr. Annaler, 39, 1–18, https://doi.org/10.2307/520339, 1957.
Howat, I. M. and Eddy, A.: Multi-decadal retreat of Greenland's marine-terminating glaciers, J. Glaciol., 57, 389–396, https://doi.org/10.3189/002214311796905631, 2011.
Klassen, R. A.: Drift composition and glacial dispersal trains, Baker Lake area, District of Keewatin, Northwest Territories, Geol. Surv. Canada, https://doi.org/10.4095/204885, 1995.
Lewington, E. L., Livingstone, S. J., Sole, A. J., Clark, C. D., and Ng, F. S.: An automated method for mapping geomorphological expressions of former subglacial meltwater pathways (hummock corridors) from high resolution digital elevation data, Geomorphology, 339, 70–86, https://doi.org/10.1016/j.geomorph.2019.04.013, 2019.
Lindén, M. and Möller, P.: Marginal formation of De Geer moraines and their implications to the dynamics of grounding-line recession, J. Quatern. Sci., 20, 113–133, https://doi.org/10.1002/jqs.902, 2005.
Livingstone, S. J., Cofaigh, C. Ó., Stokes, C. R., Hillenbrand, C. D., Vieli, A., and Jamieson, S. S.: Antarctic palaeo-ice streams, Earth-Sci. Rev., 111, 90–128, https://doi.org/10.1016/j.earscirev.2011.10.003, 2012.
Livingstone, S. J., Lewington, E. L., Clark, C. D., Storrar, R. D., Sole, A. J., McMartin, I., Dewald, N., and Ng, F.: Mapping of meltwater features and De Geer moraines in central Nunavut, Canada from the high-resolution (2 m) ArcticDEM, https://doi.org/10.15131/shef.data.12315221, 2020.
Lundqvist, J.: Studies of the Quaternary History and Deposits of Värmland, Sweden – Experiences Made While Preparing a Survey Map, Avhandlingar och Uppsatser ser. C 559, Sveriges Geologiska Undersökning, Stockholm, 1958.
Mäkinen, J.: Time-transgressive deposits of repeated depositional sequences within interlobate glaciofluvial (esker) sediments in Köyliö, SW Finland, Sedimentology, 50, 327–360, https://doi.org/10.1046/j.1365-3091.2003.00557.x, 2003.
McMartin, I.: Till composition across the Meliadine Trend, Rankin Inlet area, Kivalliq region, Nunavut. Geol. Surv. Canada, Open File 3747, https://doi.org/10.4095/211793, 2000.
McMartin, I. and Henderson, P.: Evidence from Keewatin (central Nunavut) for paleo-ice divide migration, Geogr. Phys. Quatern., 58, 163–186, https://doi.org/10.7202/013137ar, 2004.
McMartin, I., Day, S. J. A., Randour, I., Roy, M., Byatt, J., LaRocque, A., and Leblon, B.: Report of 2016 activities for the surficial mapping and sampling surveys in the Tehery-Wager GEM-2 Rae Project area, Geol. Surv. Canada, Open File 8134, https://doi.org/10.4095/299385, 2016.
McMartin, I., Randour, I., and Wodicka, N.: Till composition across the Keewatin Ice Divide in the Tehery-Wager GEM-2 Rae project area, Nunavut, Geol. Surv. Canada, Open File 8563, https://doi.org/10.4095/314707, 2019.
Möller, H.: Annuella och interannuella ändmoräner (Annual and interannual end moraines), GFF, 84, 134–143, https://doi.org/10.1080/11035896209449211, 1962.
Murray, T., Scharrer, K., Selmes, N., Booth, A. D., James, T. D., Bevan, S. L., Bradley, J., Cook, S., Llana, L. C., Drocourt, Y., and Dyke, L.: Extensive retreat of Greenland tidewater glaciers, 2000–2010, Arct. Antarct. Alp. Res., 47, 427–447, https://doi.org/10.1657/aaar0014-049, 2015.
Noh, M. J. and Howat, I. M.: Automated stereo-photogrammetric DEM generation at high latitudes: Surface Extraction with TIN-based Search-space Minimization (SETSM) validation and demonstration over glaciated regions, GISci. Remote Sens., 52, 198–217, https://doi.org/10.1080/15481603.2015.1008621, 2015.
Ojala, A. E.: Appearance of De Geer moraines in southern and western Finland – Implications for reconstructing glacier retreat dynamics, Geomorph., 255, 16–25, https://doi.org/10.1016/j.geomorph.2015.12.005, 2016.
Ojala, A. E., Putkinen, N., Palmu, J. P., and Nenonen, K.: Characterization of De Geer moraines in Finland based on LiDAR DEM mapping, GFF, 137, 304–318, https://doi.org/10.1080/11035897.2015.1050449, 2015.
Ottesen, D. and Dowdeswell, J. A.: Assemblages of submarine landforms produced by tidewater glaciers in Svalbard, J. Geophys. Res.-Earth Surf., 111, F01016, https://doi.org/10.1029/2005jf000330, 2006.
Paul, D., Hanmer, S., Tella, S., Peterson, T. D., and LeCheminant, A. N.: Compilation, bedrock geology of part of the western Churchill Province, Nunavut-Northwest Territories. Geol. Surv. Canada, Ottawa, Open File 4236, Scale 1 : 1 000 000, https://doi.org/10.4095/213530, 2002.
Porter, C., Morin, P., Howat, I., Noh, M.-J., Bates, B., Peterman, K., Keesey, S., Schlenk, M., Gardiner, J., Tomko, K., Willis, M., Kelleher, C., Cloutier, M., Husby, E., Foga, S., Nakamura, H., Platson, M., Wethington Jr., M., Williamson, C., Bauer, G., Enos, J., Arnold, G., Kramer, W., Becker, P., Doshi, A., D'Souza, C., Cummens, P., Laurier, F., and Bojesen, M.: ArcticDEM, V1, Harvard Dataverse, https://doi.org/10.7910/DVN/OHHUKH, 2018.
Powell, R. D. and Molnia, B. F.: Glacimarine sedimentary processes, facies and morphology of the south-southeast Alaska shelf and fjords, Mar. Geol., 85, 359–390, https://doi.org/10.1016/0025-3227(89)90160-6, 1989.
Powell, R. D.: Glacimarine processes at grounding-line fans and their growth to ice-contact deltas, Geological Society, London, Special Publications, 53, 53–73, https://doi.org/10.1144/gsl.sp.1990.053.01.03, 1990.
Prest, V. K., Grant, D. R., and Rampton, V. N.: Glacial map of Canada, Geol. Surv. Canada, Department of Energy, Mines and Resources, 1968.
Randour, I., McMartin, I., and Roy, M.: Study of the postglacial marine limit between Wager Bay and Chesterfield Inlet, western Hudson Bay, Nunavut, Canada-Nunavut Geoscience Office, Summary of Activities 2016, 51–60, 2016.
Rust, B. R. and Romanelli, R.: Late Quaternary subaqueous outwash deposits near Ottawa, Canada, Glaciofluvial and Glaciolacustrine Sedimentation, 177–192, https://doi.org/10.2110/pec.75.23.0177, 1975.
Schild, K. M. and Hamilton, G. S.: Seasonal variations of outlet glacier terminus position in Greenland, J. Glaciol., 59, 759–770, https://doi.org/10.3189/2013jog12j238, 2013.
Shilts, W. W.: Glaciation of the Hudson Bay region, in: Canadian Inland Seas, Martini, I. P., Elsevier, Amsterdam, 55–78, https://doi.org/10.1016/s0422-9894(08)70897-3, 1986.
Shilts, W. W., Cunningham, C. M., and Kaszycki, C. A.: Keewatin Ice Sheet – Re-evaluation of the traditional concept of the Laurentide Ice Sheet, Geology, 7, 537–541, https://doi.org/10.1130/0091-7613(1979)7<537:kisott>2.0.co;2, 1979.
Simon, K. M, Thomas, S. J, Forbes, D. L., Telka, A. M., Dyke, A. S., and Henton, J. A.: A relative sea-level history for Arviat, Nunavut, and implications for Laurentide Ice Sheet thickness west of Hudson Bay, Quatern. Res., 82, 185–197, https://doi.org/10.1016/j.yqres.2014.04.002, 2014.
Storrar, R. D., Stokes, C. R., and Evans, D. J. A.: A map of large Canadian eskers from Landsat satellite imagery, J. Maps, 9, 456–473, https://doi.org/10.1080/17445647.2013.815591, 2013.
Storrar, R. D., Stokes, C. R., and Evans, D. J. A.: Morphometry and pattern of a large sample (> 20,000) of Canadian eskers and implications for subglacial drainage beneath ice sheets, Quatern. Sci. Rev., 105, 1–25, https://doi.org/10.1016/j.quascirev.2014.09.013, 2014.
Stroeven, A. P., Hättestrand, C., Kleman, J., Heyman, J., Fabel, D., Fredin, O., Goodfellow, B. W., Harbor, J. M., Jansen, J. D., Olsen, L., Caffee, M. W., Fink, D., Lundqvist, J., Rosqvist, G. C., Strömberg, B., and Jansson, K. N.: Deglaciation of Fennoscandia, Quatern. Sci. Rev., 147, 91–121, https://doi.org/10.1016/j.quascirev.2015.09.016, 2016.
Strömberg, B.: Mapping and geochronological investigation in some moraine areas of south-central Sweden, Geogr. Ann. Ser. A, 47, 73–82, https://doi.org/10.1080/04353676.1965.11879715, 1965.
Strömberg, B.: Calving bays, striae and moraines at Gysinge-Hedesunda, central Sweden, Geogr. Annaler. A, 63, 149–154, https://doi.org/10.1080/04353676.1981.11880028, 1981.
Todd, B. J., Valentine, P. C., Longva, O., and Shaw, J.: Glacial landforms on German Bank, Scotian Shelf: evidence for Late Wisconsinan ice-sheet dynamics and implications for the formation of De Geer moraines, Boreas, 36, 148–169, https://doi.org/10.1111/j.1502-3885.2007.tb01189.x, 2007.
Tyrrell, J. B.: The glaciation of north central Canada, J. Geol., 6, 147–160, https://doi.org/10.1086/608030, 1898.
Warren, W. P. and Ashley, G. M.: Origins of the ice-contact stratified ridges (eskers) of Ireland, J. Sediment. Res., 64, 433–449, https://doi.org/10.1306/d4267dd9-2b26-11d7-8648000102c1865d, 1994.
Winsborrow, M. C., Andreassen, K., Corner, G. D., and Laberg, J. S.: Deglaciation of a marine-based ice sheet: Late Weichselian palaeo-ice dynamics and retreat in the southern Barents Sea reconstructed from onshore and offshore glacial geomorphology, Quatern. Sci. Rev., 29, 424–442, https://doi.org/10.1016/j.quascirev.2009.10.001, 2010.
Zilliacus, H.: Genesis of De Geer moraines in Finland, Sediment. Geol., 62, 309–317, https://doi.org/10.1016/0037-0738(89)90121-8, 1989.
- Abstract
- Introduction
- Study area
- Methods
- Results
- A model for quasi-annual deposition of esker beads in an ice-marginal marine setting
- Implications for reconstructing the ice-marginal retreat history of central Nunavut
- Implications for understanding subglacial drainage
- Conclusions
- Data availability
- Author contributions
- Competing interests
- Acknowledgements
- Financial support
- Review statement
- References