the Creative Commons Attribution 4.0 License.
the Creative Commons Attribution 4.0 License.
 | 11 Mar 2019
Firn data compilation reveals widespread decrease of firn air content in western Greenland
Michael MacFerrin
Horst Machguth
William T. Colgan
Dirk van As
Achim Heilig
C. Max Stevens
Charalampos Charalampidis
Robert S. Fausto
Elizabeth M. Morris
Ellen Mosley-Thompson
Lora Koenig
Lynn N. Montgomery
Clément Miège
Sebastian B. Simonsen
Thomas Ingeman-Nielsen
Jason E. Box
A porous layer of multi-year snow known as firn covers the Greenland-ice-sheet interior. The firn layer buffers the ice-sheet contribution to sea-level rise by retaining a fraction of summer melt as liquid water and refrozen ice. In this study we quantify the Greenland ice-sheet firn air content (FAC), an indicator of meltwater retention capacity, based on 360 point observations. We quantify FAC in both the uppermost 10 m and the entire firn column before interpolating FAC over the entire ice-sheet firn area as an empirical function of long-term mean air temperature () and net snow accumulation (. We estimate a total ice-sheet-wide FAC of 26 800±1840 km3, of which 6500±450 km3 resides within the uppermost 10 m of firn, for the 2010–2017 period. In the dry snow area ( ∘C), FAC has not changed significantly since 1953. In the low-accumulation percolation area ( ∘C and mm w.e. yr−1), FAC has decreased by 23±16 % between 1998–2008 and 2010–2017. This reflects a loss of firn retention capacity of between 150±100 Gt and 540±440 Gt, respectively, from the top 10 m and entire firn column. The top 10 m FACs simulated by three regional climate models (HIRHAM5, RACMO2.3p2, and MARv3.9) agree within 12 % with observations. However, model biases in the total FAC and marked regional differences highlight the need for caution when using models to quantify the current and future FAC and firn retention capacity.
- Article
(4532 KB) - Full-text XML
-
Supplement
(1076 KB) - BibTeX
- EndNote


As a consequence of the atmospheric and oceanic warming associated with anthropogenic climate change, the Greenland ice sheet (GrIS) is losing mass at an accelerating rate. The GrIS is now responsible for approximately 20 % of contemporary sea-level rise (Bindoff et al., 2013; Nerem et al., 2018). Over half of this GrIS mass loss stems from summer surface melt and subsequent meltwater runoff into the ocean (van den Broeke et al., 2016). While most meltwater runoff originates from the low-elevation ablation area, the surface melt area is now expanding into the high-elevation firn-covered interior of the GrIS (Mote et al., 2007; Nghiem et al., 2012). Rather than flowing horizontally, most of the meltwater produced at the surface of the firn area percolates vertically into the underlying firn where it refreezes and thereby does not contribute to sea-level rise (Harper et al., 2012). Hence, the meltwater retention capacity of Greenland's firn is a non-trivial parameter in the sea-level budget.
Assessing meltwater retention capacity of the firn in Greenland requires knowledge of both the extent of the firn area, as well as the spatial distribution of depth-integrated firn porosity or firn air content (FAC). The extent of the firn area can be tracked using the firn line, which Benson (1962) described as “the highest elevation to which the annual snow cover recedes during the melt season”. Recently, Fausto et al. (2018a) updated the methods from Fausto et al. (2007) and presented maps of remotely sensed end-of-summer snow lines over the 2000–2017 period. These maps effectively provide an annual delineation of Greenland's firn area. FAC is the integrated volume of air contained within the firn from the surface to a certain depth per unit area (van Angelen et al., 2013; Ligtenberg et al., 2018). FAC quantifies the maximum pore volume available per unit area to retain percolating meltwater, either in liquid or refrozen form (Harper et al., 2012; van Angelen et al., 2013). Previously, ice-sheet-wide firn retention capacity has been estimated using simplifying assumptions (Pfeffer et al., 1991) or unconstrained regional climate model (RCM) simulations (van Angelen et al., 2013). Harper et al. (2012) provided the first empirical estimate of the firn's meltwater retention capacity in the GrIS percolation area using 3 years of observations (2007–2009) at 15 sites in western Greenland. While pioneering, their approach did not acknowledge the GrIS's diverse firn regimes (Forster et al., 2014; Machguth et al., 2016). Ligtenberg et al. (2018) provided an RCM simulation of FAC that generally compares well against observations in 62 firn cores but substantially underestimated FAC in the western percolation area.
The depth to which meltwater may percolate, and therefore the depth range over which FAC must be integrated to constrain meltwater retention capacity, varies with melt intensity and firn permeability (Pfeffer et al., 1991). This makes the maximum depth of meltwater percolation both temporally and spatially variable, as highlighted by the following studies. Braithwaite et al. (1994) and Heilig et al. (2018) reported meltwater refreezing within the top 4 m of firn in western Greenland, respectively, at ∼1500 m a.s.l. during the summer of 1991 and at 2120 m a.s.l. during the 2016 melt season. Both studies indicate that, at specific sites and years, meltwater is stored in near-surface firn. However, firn temperature measurements in 2007–2009 at 1555 m a.s.l. in western Greenland (Humphrey et al., 2012) as well as the presence of firn aquifer at a depth greater than 10 m in southeastern Greenland (Miège et al., 2016) both show that meltwater can percolate below 10 m depth in the firn. This deep percolation implies that, for certain firn conditions and given sufficient meltwater, the FAC of the total firn column, from the surface to the firn–ice transition, may be used for meltwater retention. Finally, Machguth et al. (2016) show that percolation depth may not increase linearly with meltwater production, and instead low-permeability ice layers can limit even abundant meltwater from percolating into the entire firn column. Given the complexity of meltwater percolation and the paucity of percolation observations, reasonable upper and lower bounds of the meltwater retention capacity of firn can be estimated by determining FAC through the total firn column (FACtot) and within the uppermost 10 m of firn column (FAC10), respectively (Harper et al., 2012). FACtot is also valuable information to convert remotely sensed surface height changes into mass changes (Sørensen et al., 2011; Simonsen et al., 2013; Kuipers Munneke et al., 2015a).
In this study, we first compile a dataset of 360 firn density profiles, collected between 1953 and 2017, and quantify the observed FAC. We then extrapolate these point-scale observations across the entire GrIS firn area as empirical functions of long-term mean air temperature and mean snow accumulation. The point observations are thereby used to resolve the spatial distribution of FAC but also, where possible, its temporal evolution. We use a simple extrapolation to estimate FACtot from FAC10 where firn cores do not extend to the firn–ice transition. Spatial integration of FAC10 and FACtot over the firn area permits the estimation of the lower and upper bounds, respectively, of the GrIS firn meltwater retention capacity. Finally, we evaluate the FAC simulated by three RCMs that are commonly used to evaluate ice-sheet-wide firn meltwater retention capacity but that have never been compared to such an extensive firn dataset.
2.1 Firn core dataset and firn area delineation
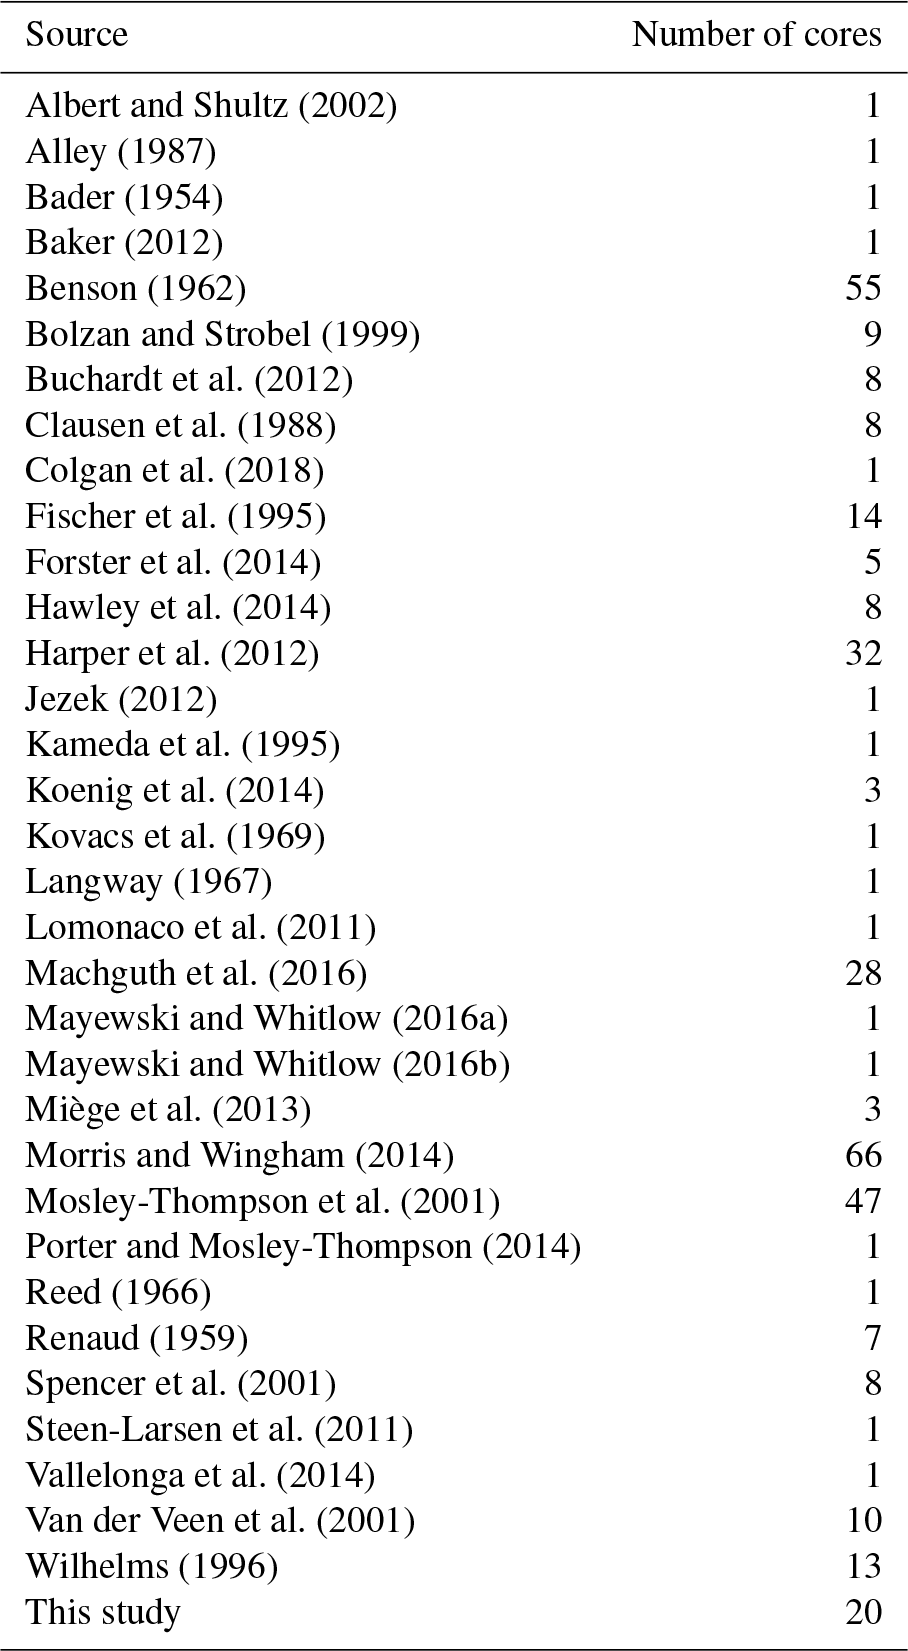
We compiled 340 previously published GrIS firn density profiles of at least 5 m in depth (Table 1). To these, we added an additional 20 cores extracted in 2016 and 2017, for which firn density was measured at a 10 cm resolution following the same procedure as Machguth et al. (2016). When near-surface snow densities were missing, we assigned a density of 315 kg m−3 (Fausto et al., 2018b) to the top centimetre and interpolated over the remaining gaps in density profiles using a logarithmic function of depth fitted to the available densities.
Table 1List of the publications presenting the firn cores used in this study.
We use the end-of-summer snow lines from Fausto et al. (2018a) to delineate the minimum firn area detected during the 2000–2017 period. This 1 405 500 km2 area, where snow is always detected during the 2000–2017 period, is taken to represent the GrIS's current firn area. Moving this firn line 1 km inward or outward, the resolution of the product from Fausto et al. (2018a) suggests an uncertainty of ±17 250 km2 (∼1 %). Additional uncertainty applies to the margin of the firn area where transient firn patches may exist outside of our delineation. Owing to the inherent thinness of firn at the lower elevation boundary of the firn area, we expect these omitted firn patches to play a negligible role in the overall meltwater retention capacity of the firn area.
2.2 Calculation of FAC10
For a discrete density profile composed of N sections and reaching a depth z, the FAC in metres is calculated as follows:
where, for each depth interval k, ρk is the firn density and mk is the firn mass. ρice is the density of the ice, assumed to be 917 kg m−3.
With 121 cores shorter than 10 m in our dataset, we extrapolate shallow measurements to a depth of 10 m. We do this by finding the core longer than 10 m that best matches the FAC-versus-depth profile of the core shorter than 10 m with the lowest root-mean-squared difference (RMSD) amongst all available cores. We then append the bottom section of this core longer than 10 m to the FAC profile of the core shorter than 10 m (see Fig. S1 of the Supplement). When testing this methodology on the available cores longer than 10 m, from which we remove the deepest 3 m of the FAC profile, we find a mean difference between extrapolated and real FAC10<1 % and an RMSD of 0.15 m.
We assess the accuracy of the firn density measurements, as well as the effect of spatial heterogeneity, by comparing FAC10 measurements located within 1 km and collected in the same year (Fig. S2). A standard deviation below 0.15 m is found in the majority of the co-located and contemporaneous FAC10 observations (20 of 27 groups of comparable observations). We correspondingly assign an uncertainty of ±0.3 m, twice this standard deviation, to FAC10 measurements.
2.3 Zonation of firn air content
The FAC10 is calculated from firn density, which depends, among other parameters, on the local near-surface air temperature and snowfall rate (Shumskii, 1964). Air temperature is a proxy for summer melt and subsequent refreezing within the firn, as well as firn temperature and compaction rates. Through these processes, increasing air temperature acts to decrease FAC (Kuipers Munneke et al., 2015b). On the other hand, snow accumulation introduces low-density fresh snow at the surface. Increasing snowfall thus acts to increase FAC. To put our FAC10 measurements in their climatic context, we extract the long-term (1979–2014) average annual net snow accumulation (snowfall − sublimation) and air temperature for each FAC10 measurement location from the nearest 5 km2 cell of the Modèle Atmosphérique Régional (MARv3.5.2; Fettweis et al., 2017).
Following the terminology of Benson (1962), we define three regions where FAC10 shows distinct regimes: (1) the dry snow area (DSA, yellow area in Fig. 1a), (2) the low-accumulation percolation area (LAPA, red area in Fig. 1a) and (3) the high-accumulation percolation area (HAPA, green area in Fig. 1a). The DSA encompasses low temperature regions of high altitude and/or latitude where melt is uncommon and where FAC10 can be related by a linear function of (yellow markers in Fig. 1c). Two distinct firn regimes emerge towards higher , meaning lower altitude and/or latitude. Firstly, towards lower , in the LAPA, more scatter appears in FAC10 and the slope of the FAC10 temperature dependency changes. Secondly, towards higher , in the HAPA, the few available FAC10 observations describe a similar temperature dependency as in the DSA, even though they are in relatively warm regions where melt occurs. FAC10 observations in the HAPA are up to 5 times higher than at locations with similar in the LAPA (Fig. 1c).
The boundary that delineates the cold (DSA) and warm regions (LAPA and HAPA) can be defined as the temperature where an inflection occurs in the linear dependency of FAC10 on (Fig. 1c). We interpret the slope break in the temperature dependence of FAC10 as the upper limit of frequent meltwater percolation and refreezing within the firn which Benson et al. (1962) defined as the dry snow line. While the transition between cold and warm areas is gradual in practice, for our analysis we set this boundary to ∘C. Our LAPA and HAPA here stretch from the dry snow line to the firn line and therefore also include the so-called wet snow facies defined by Benson et al. (1962). The snowfall boundary that delineates the low- and high-accumulation percolation areas is more difficult to characterise. There are insufficient firn observations available along the transition from LAPA to HAPA. The snowfall boundary could be anywhere between 543 mm w.e. yr−1 (the highest-accumulation LAPA core, Fig. 1b) and 647 mm w.e. yr−1 (the lowest-accumulation HAPA core, Fig. 1b). Acknowledging this uncertainty, we chose the round value of mm w.e. yr−1 to separate LAPA and HAPA. The spatial delineations of the DSA, LAPA and HAPA are illustrated in Fig. 1a.
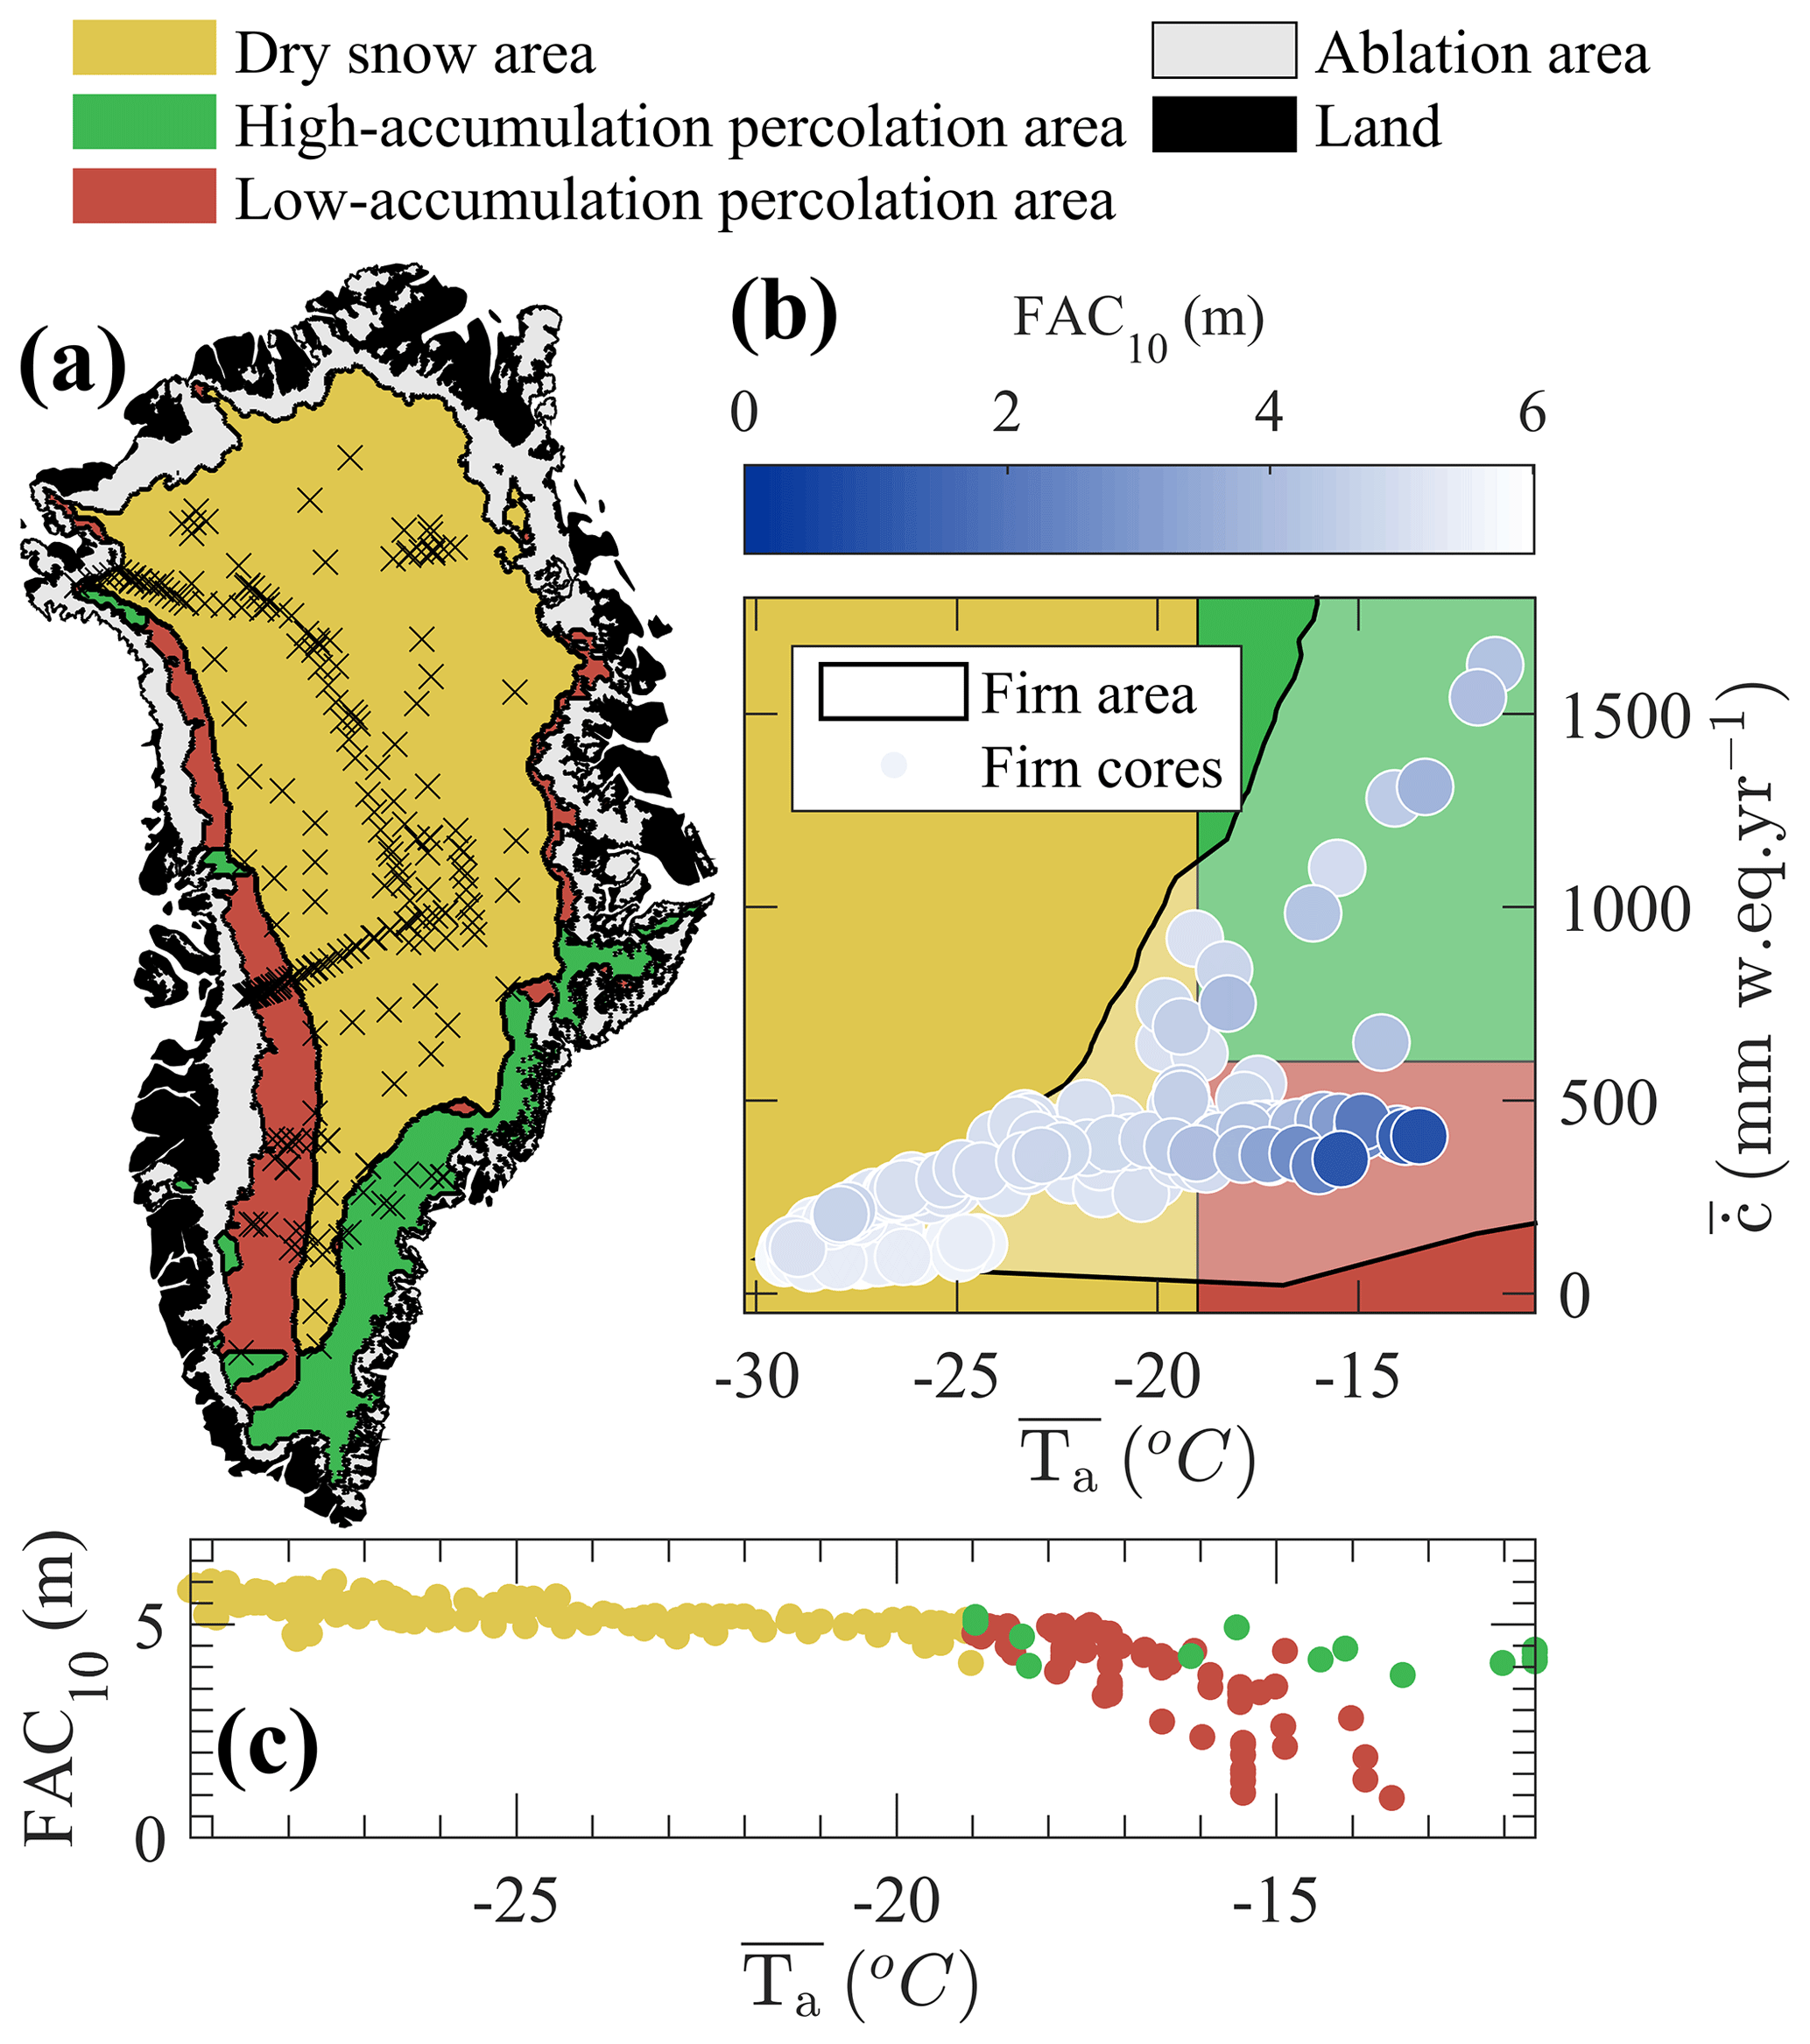
Figure 1(a) Spatial distribution of the FAC10 dataset. The DSA, HAPA and LAPA are indicated using yellow, green and red areas, respectively. (b) Distribution of the dataset in the accumulation–temperature space ( and ). FAC10 value is indicated by a coloured marker. Black lines and shaded areas indicate the extent of firn in the accumulation–temperature space. (c) Temperature dependency of FAC10 in the DSA (yellow markers), LAPA (red markers) and HAPA (green markers).
2.4 FAC10 interpolation
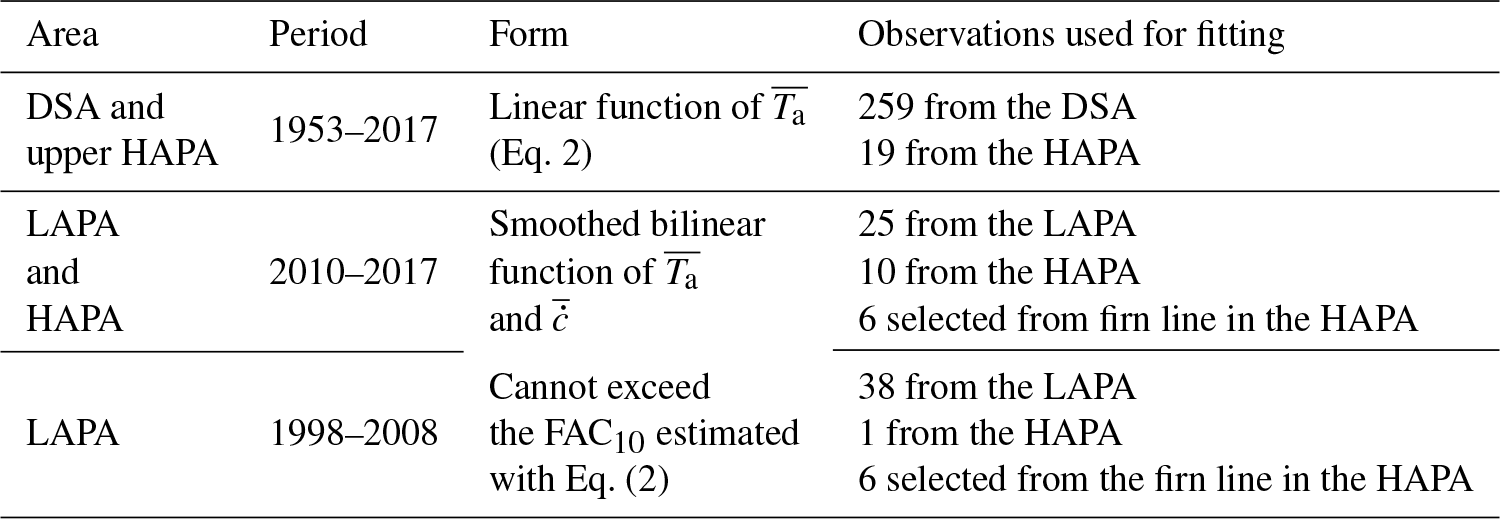
To interpolate point-scale observations of FAC10 over the entire GrIS firn area, we describe FAC10 observations using empirical functions of long-term mean air temperature and net snowfall. The derivation of these empirical functions is described in the following sections and an overview of their general form as well as the data used to constrain them is presented in Table 2.
Table 2Overview of the empirical functions fitted to FAC10 observations in each region of the firn area.
2.4.1 Dry snow area
In the DSA, the 259 FAC10 observations obtained between 1953 and 2017 can be approximated by a linear function of their local (Fig. 1c). This dependency is the same for the 19 FAC10 observations from the upper HAPA available between 1981 and 2014. We consequently include these observations so that the linear relationship remains valid in the upper HAPA (Sect. 2.4.2). These 278 FAC10 observations are then binned into four equal ranges to avoid the over-representation of clustered data (Fig. 2a). Eventually, a linear function of is fitted to the bins' average FAC10 using a least-squares method to estimate the FAC10 in the DSA:
We assign to any FAC10 estimated in the DSA using Eq. (2) an uncertainty equal to twice the regression's RMSD: 0.4 m. Although FAC10 is also dependent on , the residuals from Eq. (2) do not present any correlation with their respective values. It indicates that because of the intrinsic co-variability of and , most of the variations in observed FAC10 can be explained using either or . Insufficient data are available to separate the role of and in FAC10 variations in the DSA. We therefore choose to use only in Eq. (2).
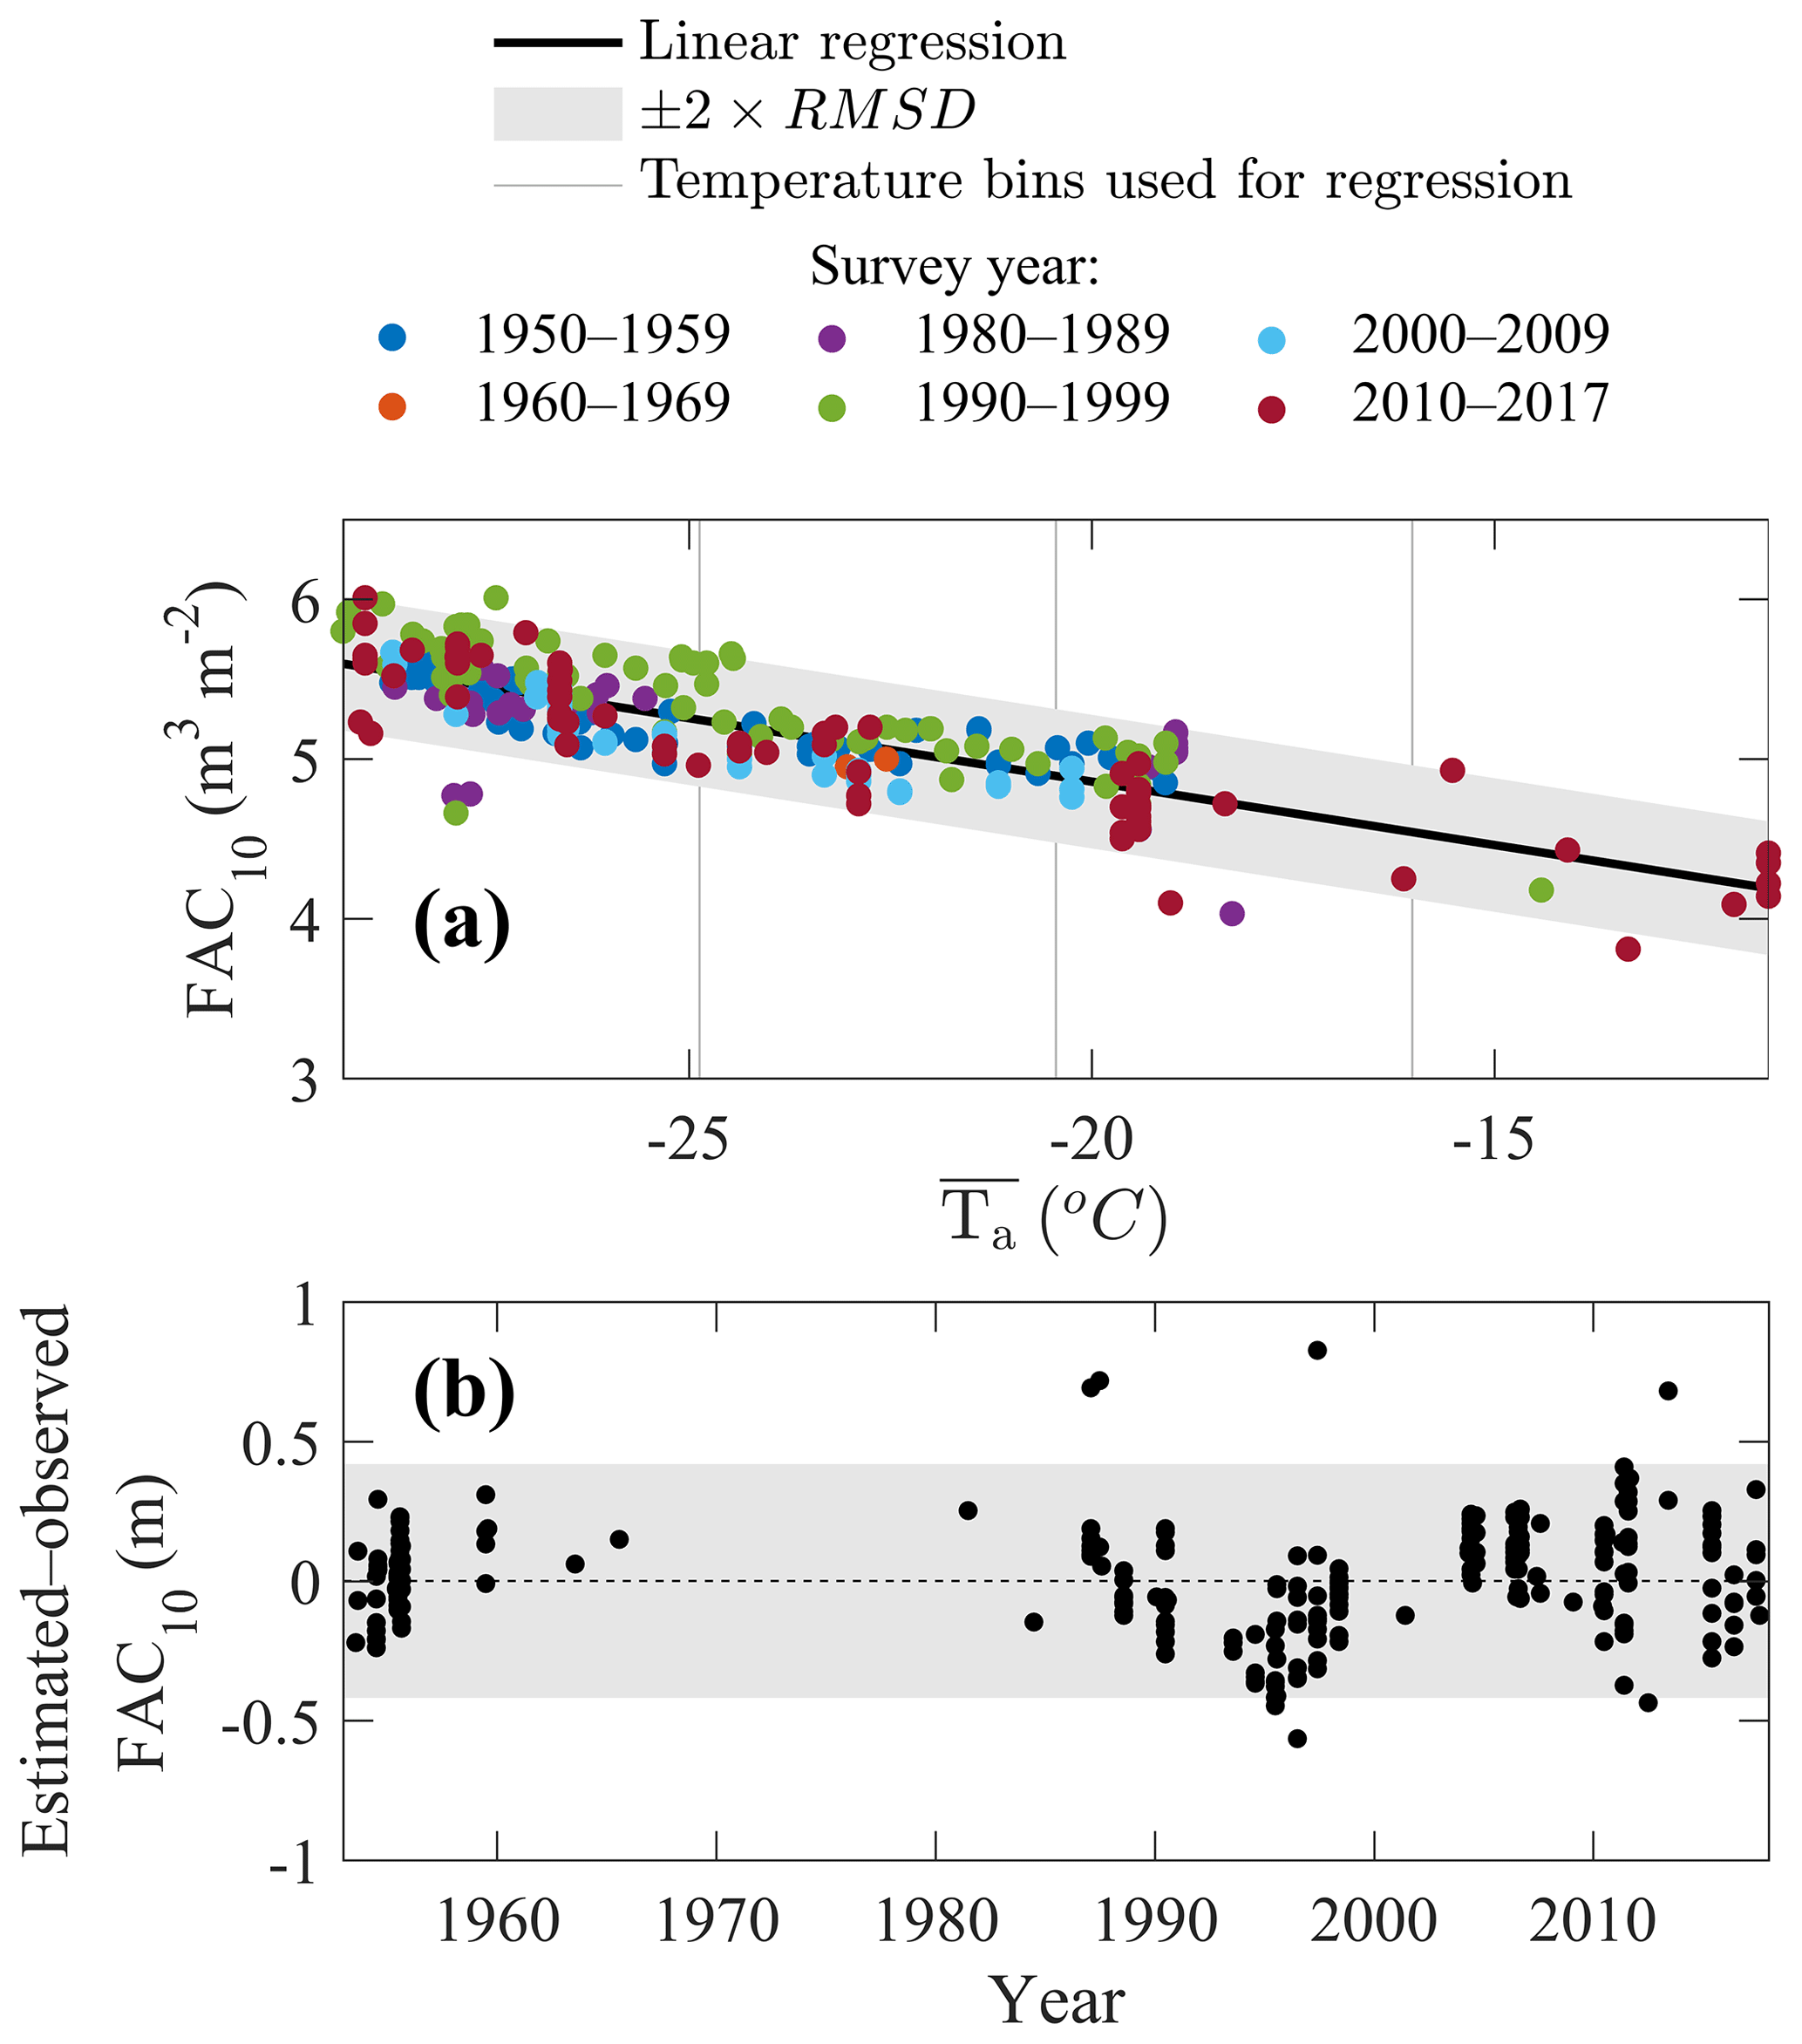
Figure 2(a) Linear function of fitted to FAC10 observations from the DSA and upper HAPA. (b) Residual between estimated (using linear regression) and observed FAC10 as a function of survey year.
2.4.2 Percolation areas
In the LAPA and in the HAPA, FAC10 observations exhibit a more complex dependency on and (Fig. 1b and c). Additionally, observations are unevenly distributed in space and time. Thus, to reveal the temporal trends in FAC10, the observation dataset is divided into two time slices that each contain enough FAC10 observations to describe the spatial pattern of FAC10 and constrain our empirical functions.
Over the 2010–2017 period, 25 FAC10 observations were made in the LAPA, stretching from the upper boundary of the LAPA down to the vicinity of the firn line. During that same period, 10 firn cores were collected in the HAPA. Unfortunately, in addition to their small number, the cores are located relatively far into the interior of the ice sheet and do not describe how the FAC10 decreases in parts of the HAPA closer to the firn line. We consequently complement these firn cores with six sites, selected on the remotely sensed firn line, where FAC10 is assumed to be null (Fig. S3). FAC10 in the LAPA and HAPA during 2010–2017 is then described by a smoothed bilinear function of and fitted through least squares method to the available observations (Fig. 3b). We do not allow that function to exceed the linear function of that describes FAC10 measurements in the DSA and in the upper HAPA (Eq. 2) or to predict FAC10 below 0 m.
Prior to 2010, insufficient data are available to document the FAC10 in the HAPA. In the LAPA, however, 35 observations were made between 2006 and 2008 and three cores were collected in 1998. These measurements are used to describe the FAC10 in LAPA during the 1998–2008 period by a smoothed bilinear function of and . To ensure that our empirical function has realistic values towards the transition with the HAPA, we also include one core collected in the HAPA in 1998. We also include the previously described six locations from the firn line (Fig. 3a). Although observation locations in 1998–2008 and 2010–2017 can be different, few samples available at the same sites (e.g. Crawford Point, DYE-2) in both time slices confirm that FAC10 changes are more likely due to a temporal evolution rather than from the different spatial coverage of each period's constraining dataset.
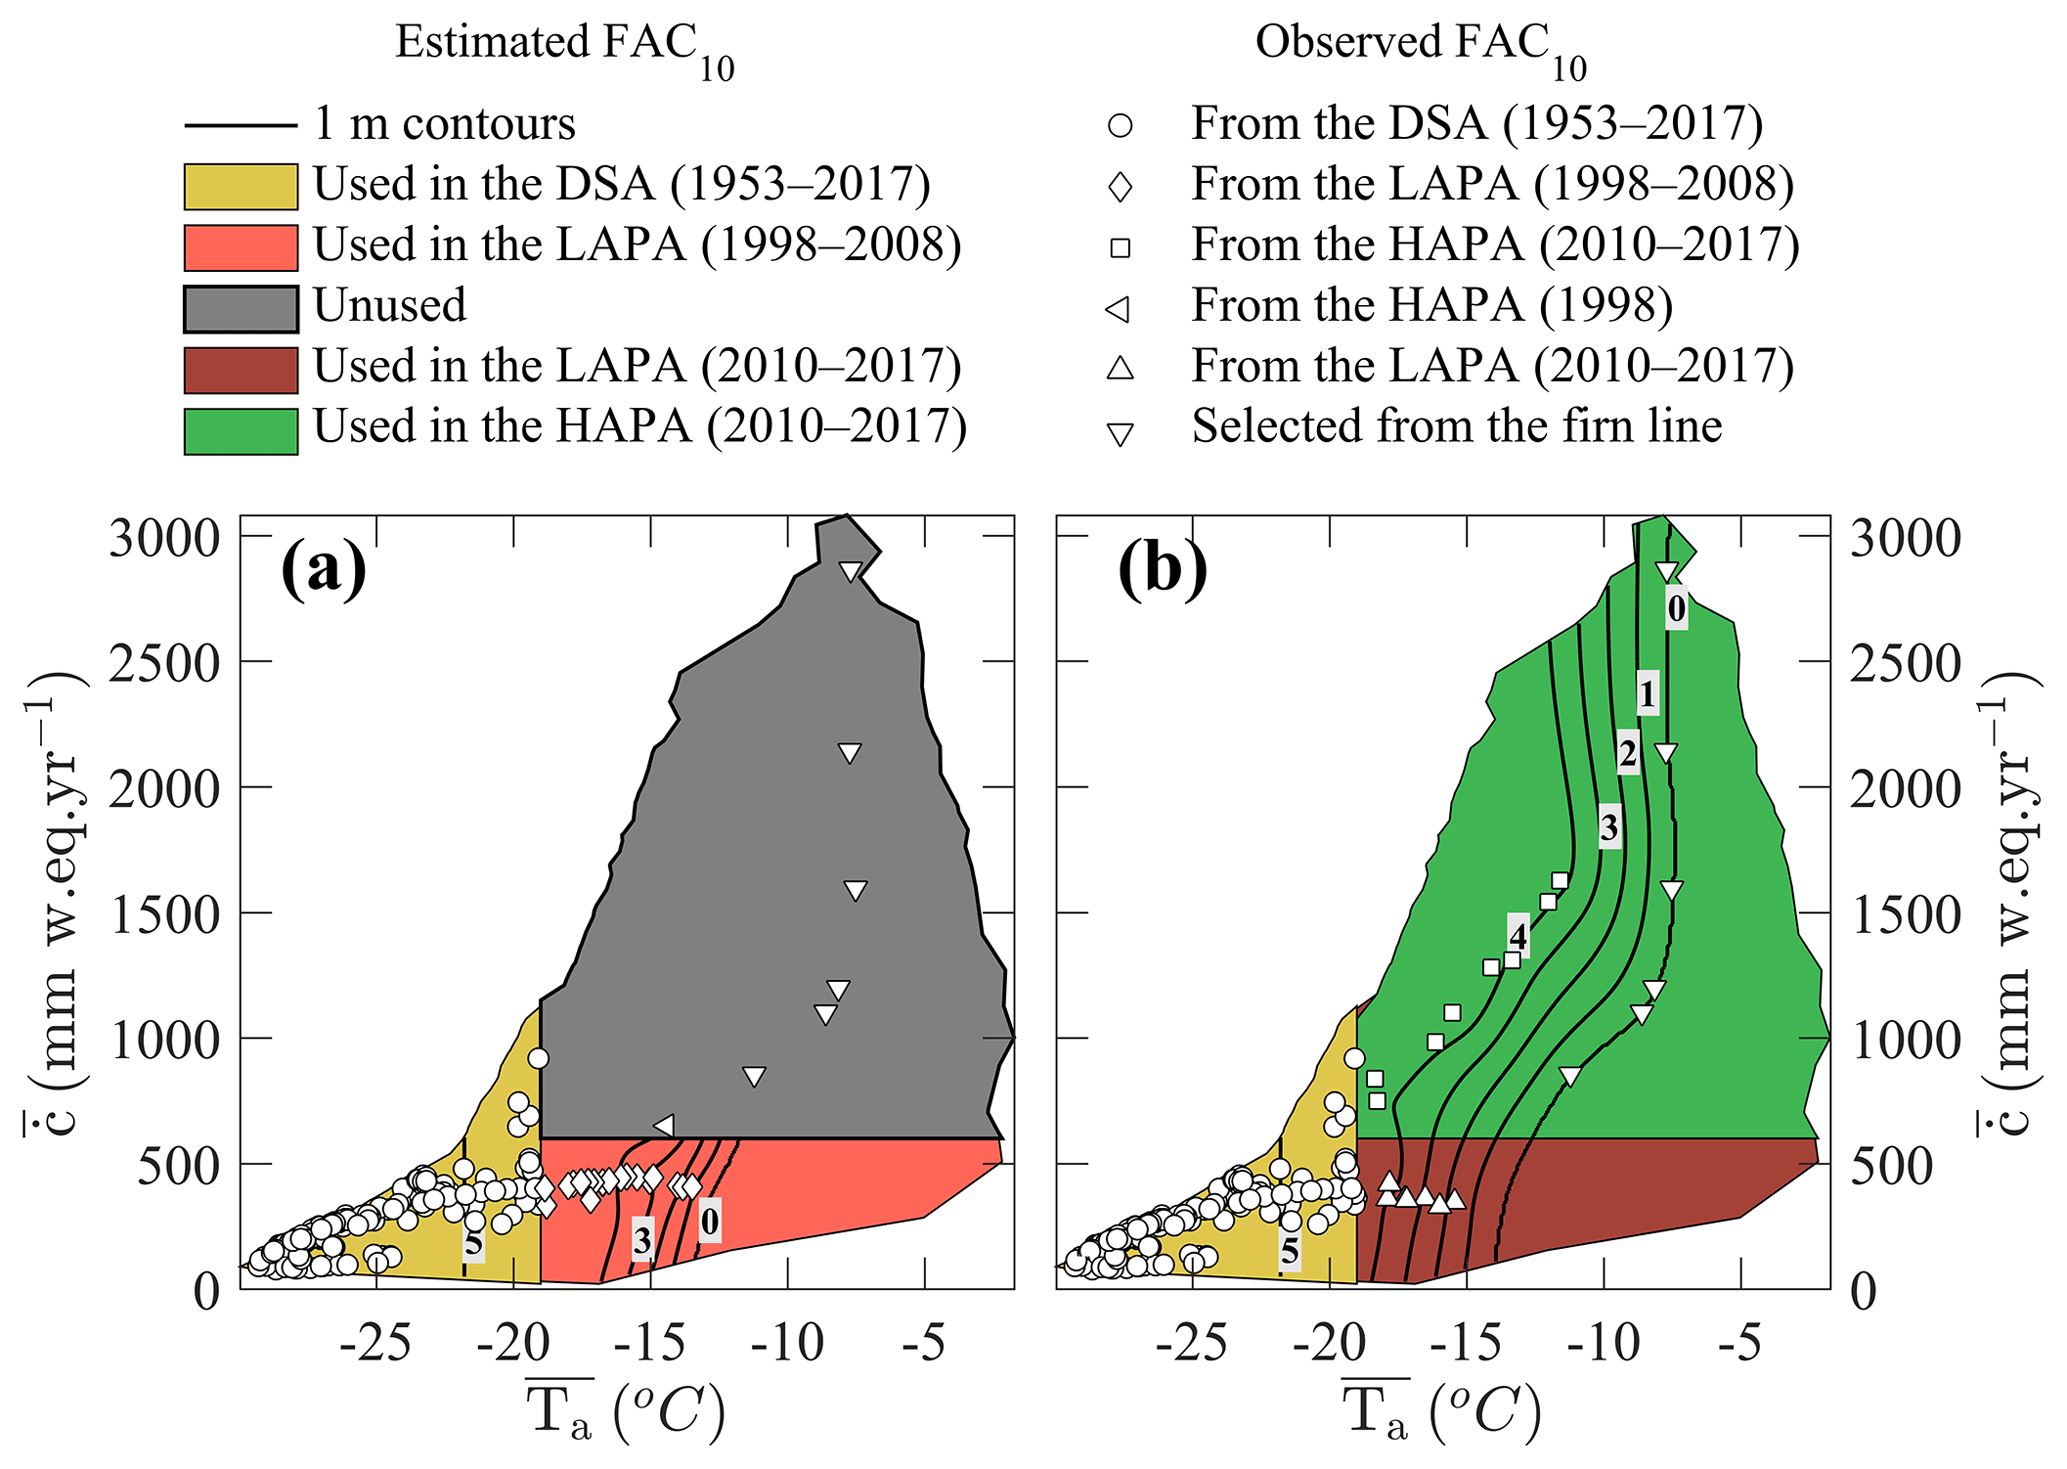
Figure 3Contours (labelled black lines) of the empirical functions of and used to estimate FAC10 along with the FAC10 observations used to constrain the functions. Two functions could be constructed: (a) describing FAC10 in the LAPA during 1998–2008 and (b) describing FAC10 in the LAPA and HAPA during 2010–2017.
The empirical functions used to estimate the FAC10 in the LAPA and HAPA (Fig. 3), when compared to FAC10 observations, have a RMSD of 0.28 m in the LAPA over the 1998–2008 period, 0.27 m in the LAPA over the 2010–2017 period and 0.17 m in the HAPA over the 2010–2017 period.
We investigate the robustness of our empirical functions in the HAPA and LAPA using, for each period separately, the following sensitivity analysis. For 1000 repetitions, we apply four types of perturbations to the FAC10 observations and then refit our empirical functions. The effect of the availability of measurements in the LAPA is tested by randomly excluding four observations in that region (16 % and 11 % of observations in 2010–2017 and 1998–2008, respectively). The effect of uncertainty in the firn line location in the (, ) space is tested by adding a normally distributed noise with a mean of zero and standard deviation of 3 ∘C to the of firn-line-derived FAC10 (illustrated in Fig. S3). The effect of the uncertain FAC10 value at the firn line is assessed by assigning to firn-line-derived points a random FAC10 value between 0 and 1 m. Finally, the effect of the smoothing applied to the bilinear interpolation of FAC10 measurements is assessed by modifying the amount of smoothing applied. Following 1000 repetitions of the above-mentioned four perturbations to the FAC10 observations, we then calculate the standard deviation of all empirically estimated FAC10 values within the (, ) parameter space. We then double this standard deviation to approximate the 95 % uncertainty envelope for empirically estimated FAC10 in the LAPA and HAPA. We set 0.3 m, the uncertainty related to FAC measurements (Sect. 2.2), as the minimum possible uncertainty on any empirically estimated FAC10.
2.5 Estimation of FACtot
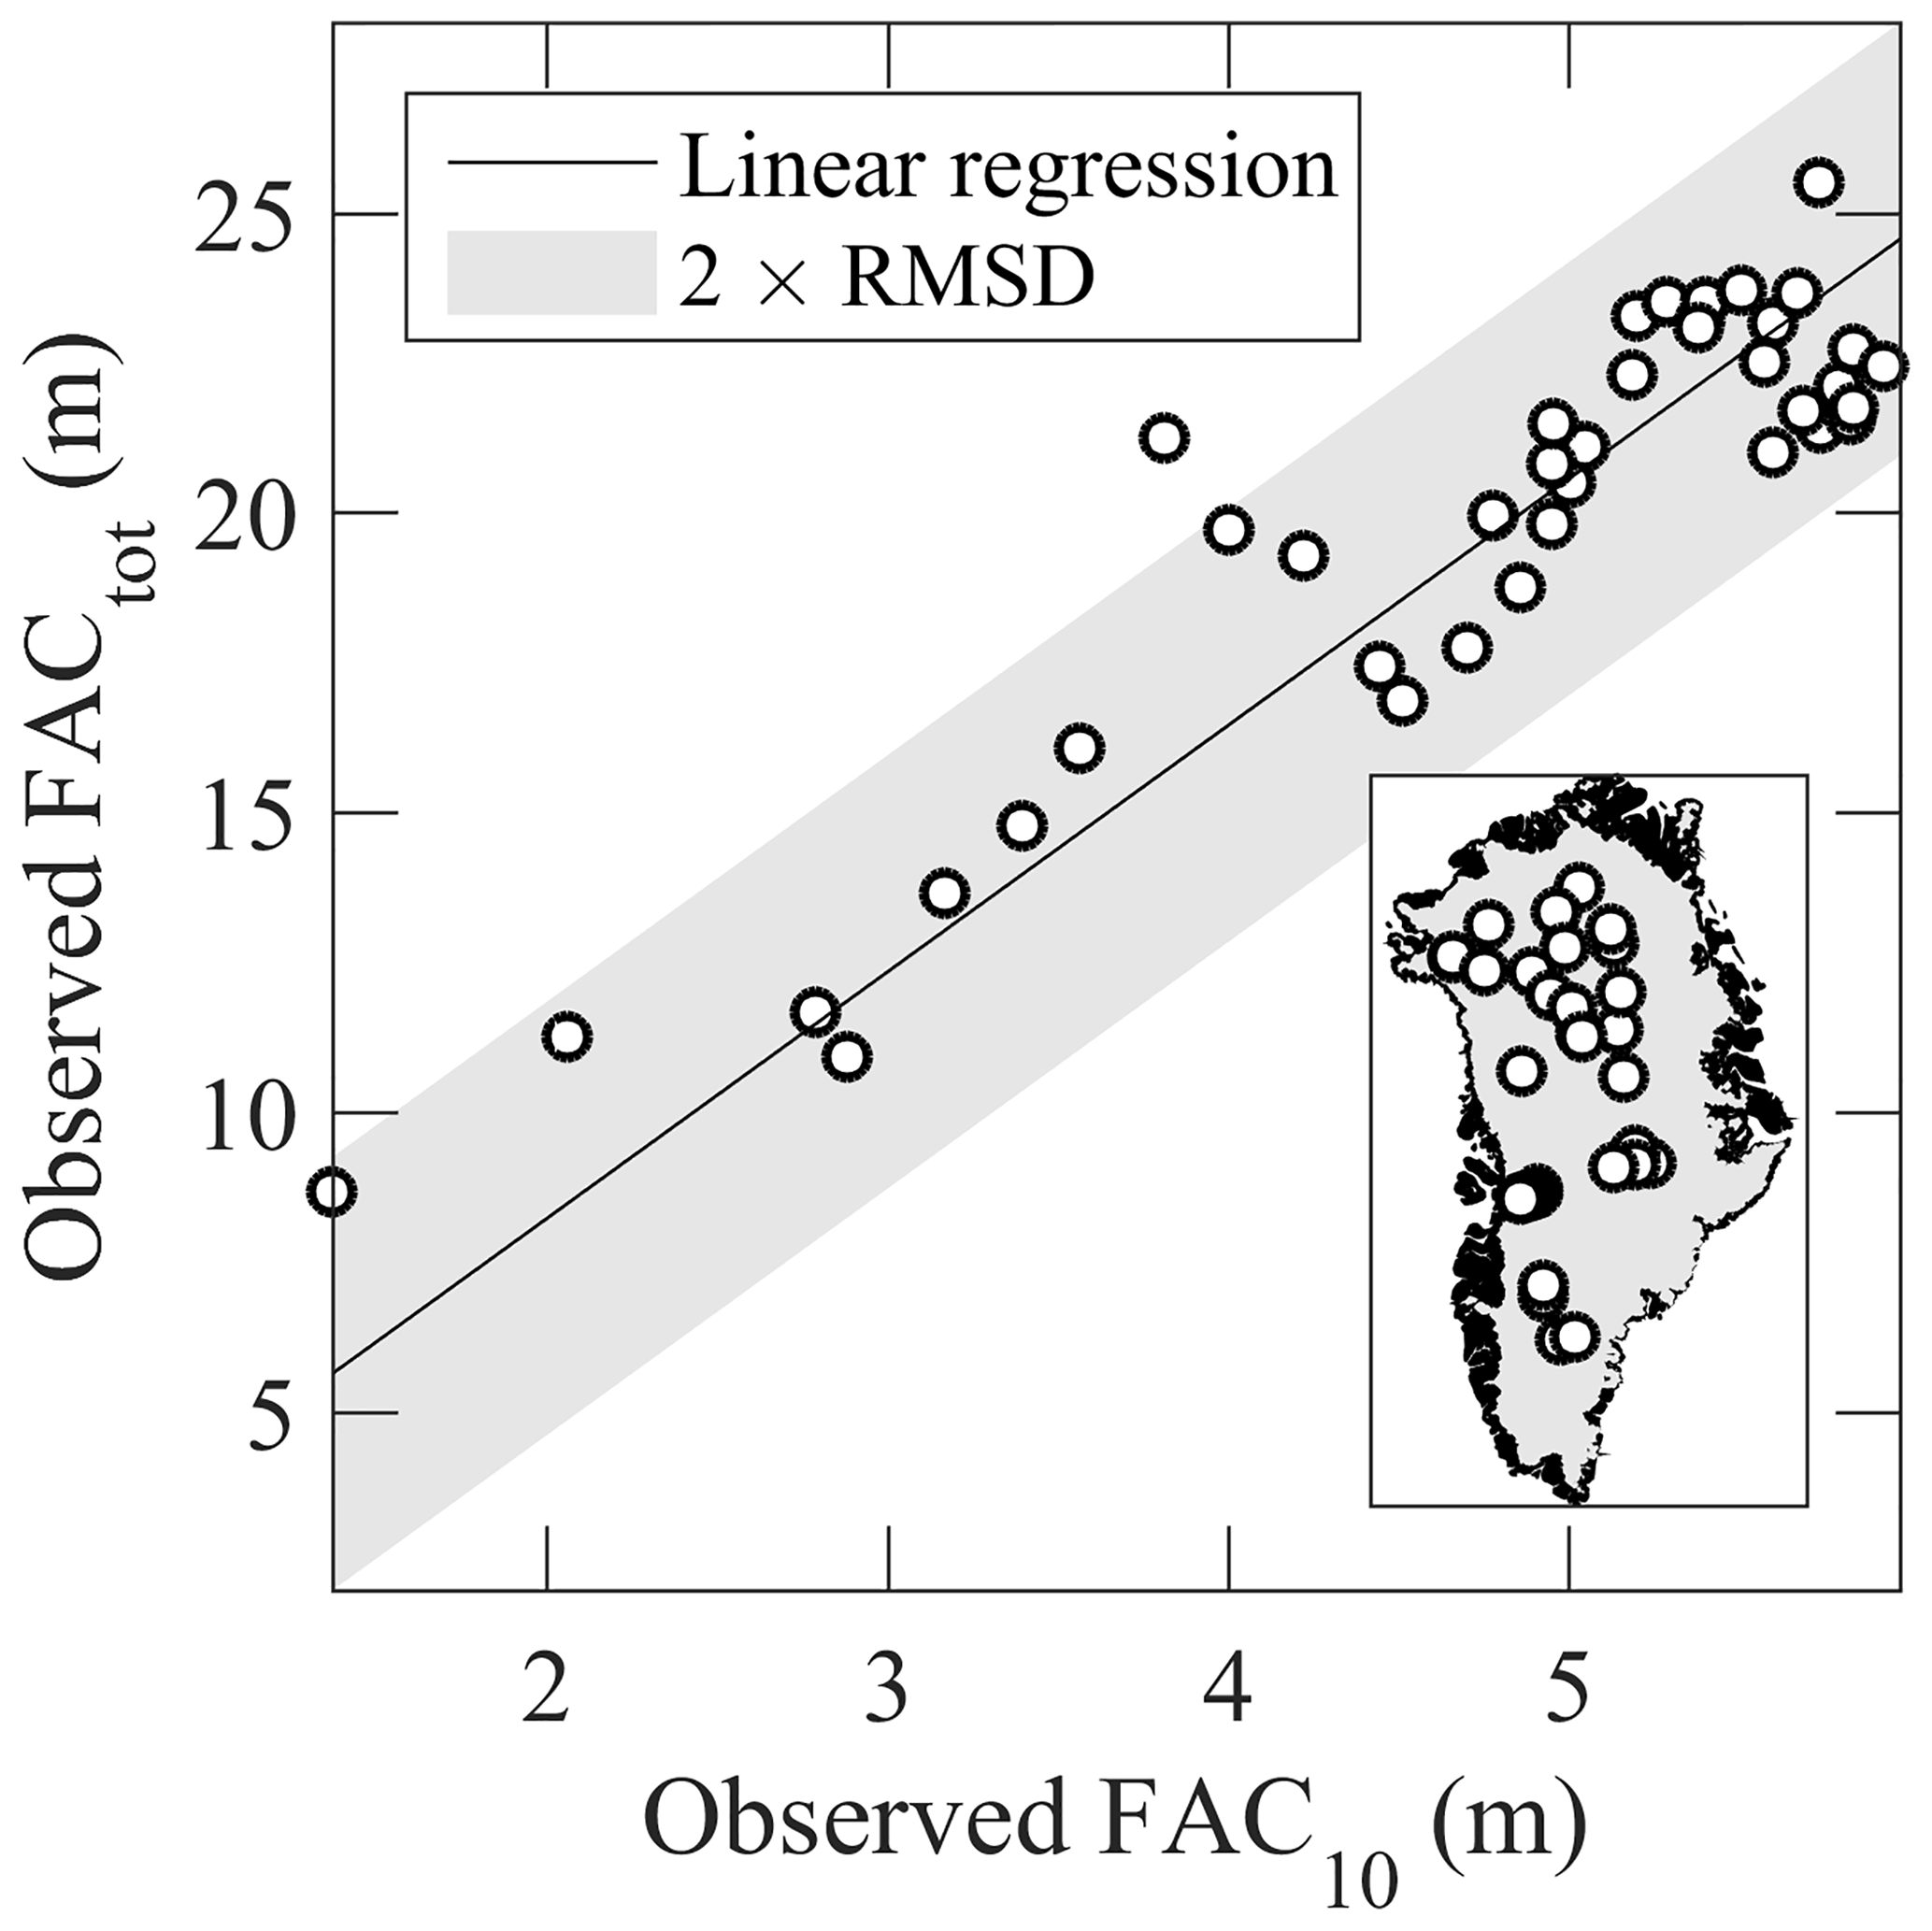
FACtot should be integrated from the ice-sheet surface down to the depth where firn reaches the density of ice (Ligtenberg et al., 2018). This depth varies in space and time across the GrIS but is poorly documented. Additionally, the RCM HIRHAM5 (evaluated in Sect. 3.3) does not reach ice density at the bottom of its column in certain locations. We therefore calculate FACtot as the vertically integrate FAC from the surface to a standard 100 m depth. Only 29 of our 360 firn observations reach depths greater than 100 m. We therefore complement these core observations with 13 ground-penetrating radar observations of FACtot from Harper et al. (2012).Using the least squares method with an intercept of zero, we fit the following linear regression between FAC10 and FACtot (Fig. 4):
This function infers that FACtot is approximately 410 % of FAC10. While we acknowledge this relation is straightforward, we highlight that it is statistically robust. We assign 3.6 m, twice the RMSD of the linear regression, as the typical uncertainty for an estimated FACtot value that can, in theory, vary between 0 and ∼25 m.
As a result of deriving FACtot as a function of FAC10 (Eq. 3), any change in FAC10 between two dates implies a proportional change in FACtot over the same time period. The use of this covariation neglects the fact that near-surface changes in the firn slowly propagate to greater depth with thermal conduction and downward mass advection (Kuipers Munneke et al., 2015b). We therefore note that, for a decreasing FAC10 (see Sect. 3.2.1), our estimated change in FACtot corresponds to the maximum possible change associated with the whole firn column having sufficient time to adapt to the new surface conditions.
2.6 Spatially integrated FAC and retention capacity
We define, for any ice-sheet region, the spatially integrated FAC as the cumulated volume of air within that region either in the top 10 m of firn or for the total firn column (top 100 m). The uncertainty associated with the empirically estimated FAC10 and FACtot at a given location is not independent of other locations because the same functions of and are applied across the GrIS. Consequently, we consider that the uncertainty of the mean FAC in a specific region is the mean of FAC uncertainty values therein and that the uncertainty of spatially integrated FAC is the sum of the uncertainty values in the considered region.
We use the estimated FAC to calculate the meltwater retention capacity of the firn. Harper et al. (2012) defined the firn retention capacity as the amount of water that needs to be added to the firn to bring its density to 843 kg m−3, the density of firn saturated by refrozen meltwater measured in firn cores.
2.7 Comparison with regional climate models
We compare our FAC10 observations and spatially integrated FAC estimates to the firn products available from three RCMs: HIRHAM5, RACMO2.3p2 and MARv3.9. HIRHAM5 output is available at 5.5 km spatial resolution and is presented in Langen et al. (2017). Two versions of HIRHAM5 are used: linear parameterisation of surface albedo (hereafter referred as HH_LIN) and MODIS-derived albedo (hereafter referred as HH_MOD). RACMO2.3p2, presented by Noël et al. (2018), provides FAC at a 5.5 km resolution. MARv3.9, presented in Fettweis et al. (2017), only simulates FAC10 because of its shallow subsurface domain and has a spatial resolution of 15 km.
3.1 Spatio-temporal distribution of FAC
In the DSA, we consider the absence of a temporal trend in the deviation between measured FAC10 and FAC10 estimated using the linear function of (Fig. 2b) as evidence of unchanging FAC10 in that area between 1953 and 2017. This inference of widespread stable FAC in the DSA is confirmed at point scale by firn cores in our dataset taken at the same sites but decades apart, showing the same FAC (e.g. Summit Station, Camp Century). This result is also corroborated by recent firn modelling at weather stations located in the DSA (Vandecrux et al., 2018).
Using the 5 km × 5 km and grids from Fettweis et al. (2017) and the empirical functions presented in Fig. 3, we map the FAC10 and its uncertainty across the GrIS firn area (Fig. 5). From these maps we calculate an average FAC10 of 5.2±0.3 m in the DSA over the 1953–2017 period and of 3.0±0.4 m in the HAPA during the 2010–2017 period. Within the LAPA, we calculate an average FAC10 of 3.9±0.3 m during the 1998–2008 period, which decreases by 23 % to 3.0±0.3 m in the 2010–2017 period. Spatially, the FAC10 loss in the LAPA is concentrated in a 60 km wide band above the firn line in western Greenland (Fig. 5b).
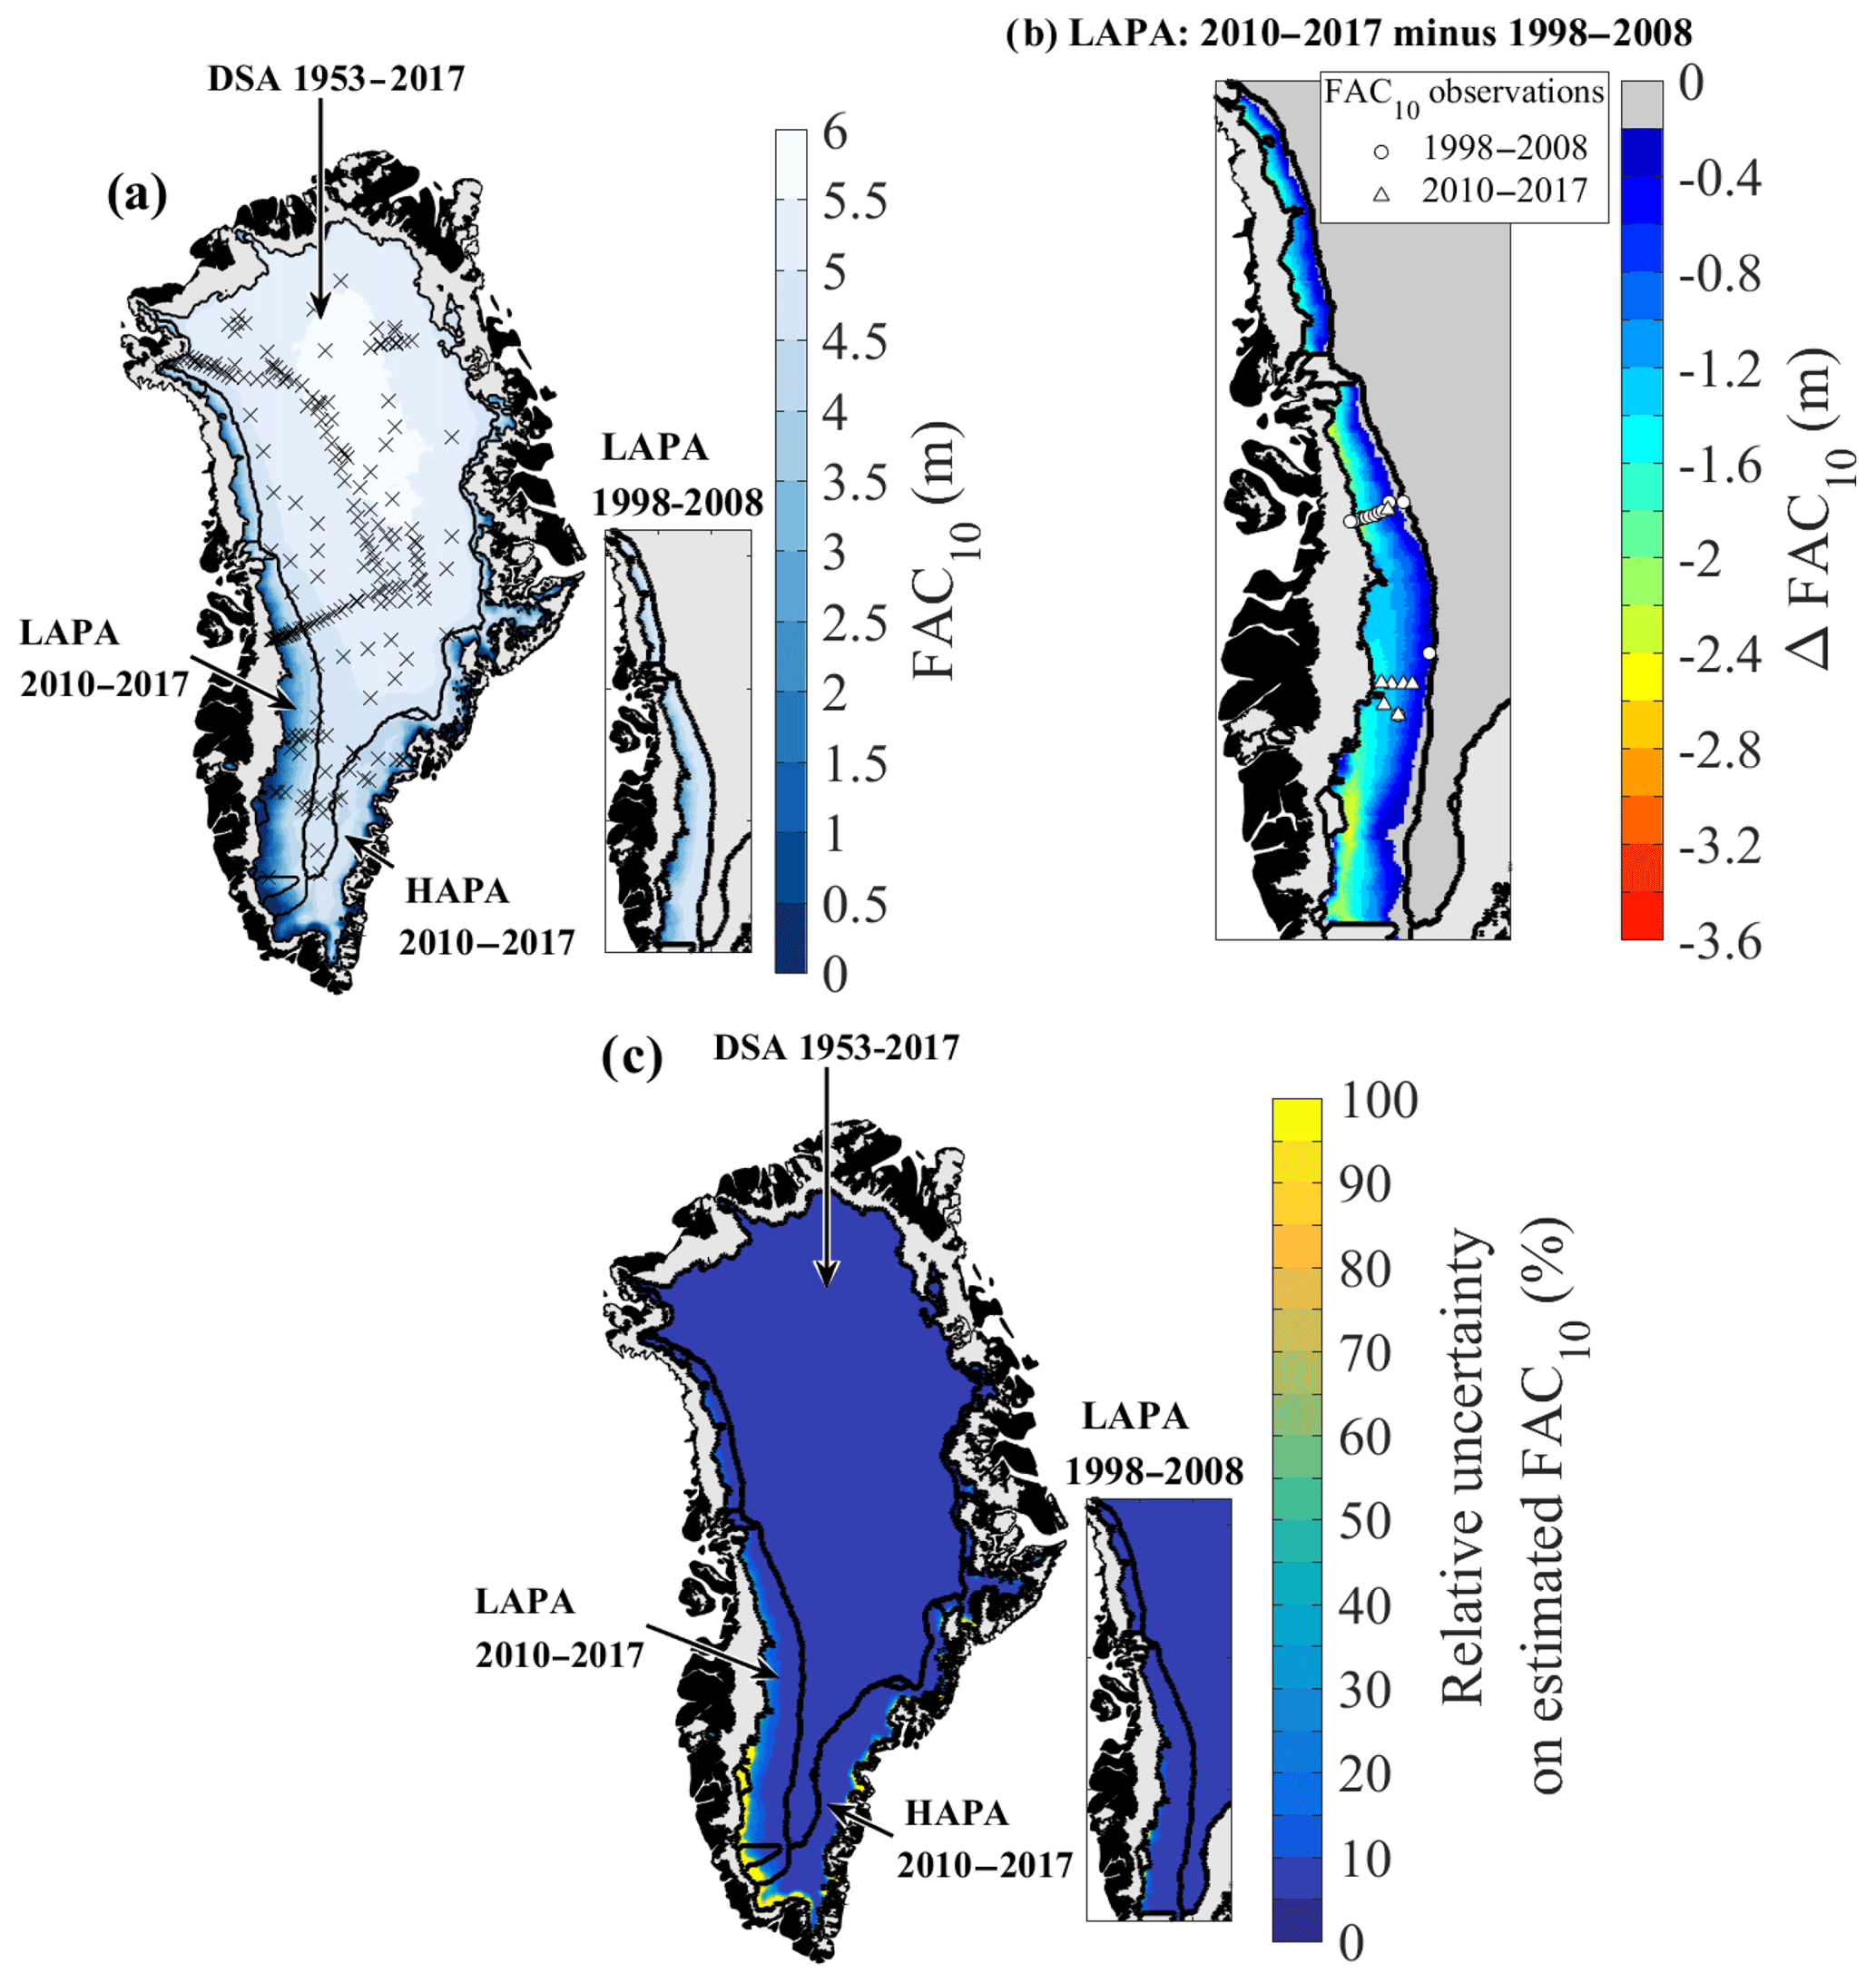
Figure 5(a) FAC10 maps and location of the FAC10 measurements. (b) Change in FAC10 between 1998–2008 and 2010–2017 in the LAPA. (c) Maps of the relative uncertainty of the FAC10.
We find that during the 2010–2017 period, the entire firn area contained 6500±450 km3 of air within the top 10 m and up to 26 800 ± 1840 km3 within the whole firn column (Table 3). About 83±5 % of this air content is found in the DSA, which represents 74 % of the firn area. The HAPA, covering 12 % of the firn area, contains 8±1 % of GrIS FAC, both for the top 10 m and the whole firn column.
Table 3Spatially integrated FAC and firn retention capacity over each ice-sheet region.
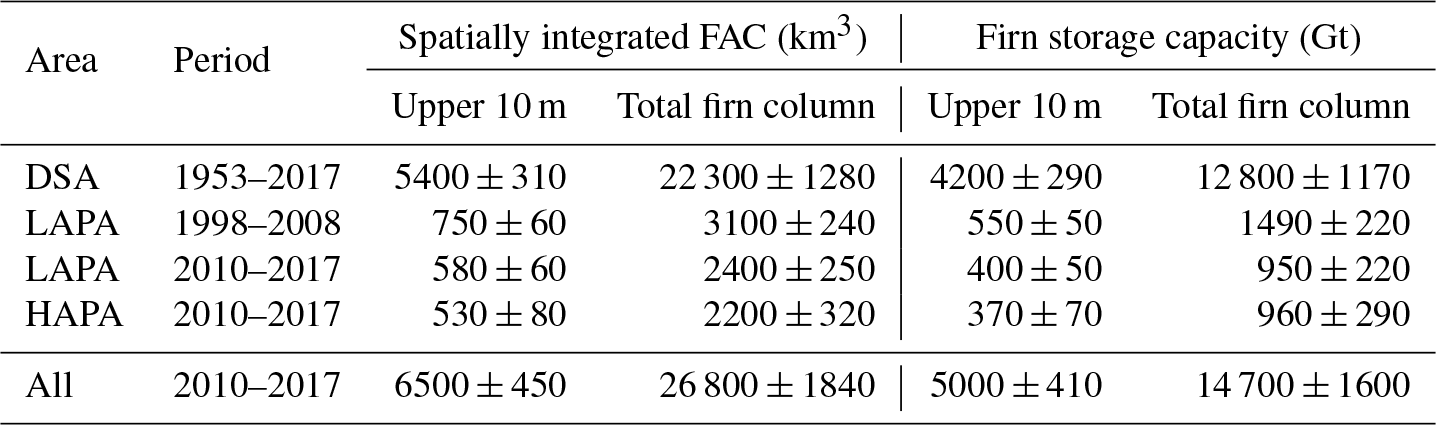
The LAPA, which comprises 14 % of the firn area, contained 9±1 % of ice-sheet-wide firn air content in the period 2010–2017. Decreasing FAC10 between 1998–2008 and 2010–2017 yields a loss of 170±120 km3 (23±16 %) of air from the top 10 m of firn. The corresponding decrease in FACtot indicates that, as an upper estimate, 700±490 km3 of air may have been lost from the total firn column. In this we assume that the FAC10 decrease propagated to the entire firn column (see Sect. 2.5), which might not be accurate. Insufficient data are available to determine precisely how much FAC was lost below 10 m and we can only give a hypothetical upper bound to the FACtot decrease.
Recent studies have identified increasing surface melt and meltwater refreezing as major contributors to increasing near-surface firn densities and subsequent loss of FAC (de la Peña et al., 2015; Charalampidis et al., 2015; Machguth et al., 2016; Graeter et al., 2018). However, firn density and FAC are also dependent on annual snowfall, with decreasing snowfall driving increasing firn density and decreasing FAC (e.g. Vandecrux et al., 2018). Nevertheless, the lack of widely distributed observations of snow accumulation for the 1998–2017 period and the contradicting trends in precipitation calculated by RCMs (Lucas-Picher et al., 2012; van den Broeke et al., 2016; Fettweis et al., 2017) complicate the partitioning of the melt and snowfall contributions to changes in GrIS FAC.
To investigate how uncertainties in and impact our FAC10 maps, we repeat our procedure using the 1979–2014 and estimated by Box (2013) and Box et al. (2013) (hereafter referred to as “Box13”). The Box13-derived FAC10 fits equally well (RMSD < 0.3 m) to the FAC10 observations, leading to spatially integrated FAC values within the uncertainty of the MAR-derived values. However, due to differing model formulations and atmospheric forcings, the spatial patterns of air temperature and snowfall are different between Box13 and MARv3.5.2 (detailed in Fettweis et al., 2017), especially in the southern and eastern regions of the firn area. This leads to different estimations of FAC10 in these regions (Fig. S4). Additionally, in these regions no firn observations are available to constrain our FAC10 estimates. More observations in the sparsely observed southern and eastern regions would improve FAC10 estimates and help better elucidate which and source best describes the spatial pattern in FAC10.
3.2 Firn retention capacity
The decrease in FAC10 in the LAPA between 1998–2008 and 2010–2017 translates to a loss in meltwater retention capacity of 150±100 Gt in the top 10 m of firn (Table 3). This lost retention capacity represents 0.4±0.3 mm sea-level equivalent (s.l.e.). For the total firn column, we estimate an associated upper bound loss of 540±440 Gt (1.5±1.2 mm s.l.e.). While these volumes are small compared to the average GrIS mass loss ( mm s.l.e. yr−1 for 1991–2015 in van den Broeke, 2016), the impact of reduced retention capacity has an important time-integrated effect in amplifying meltwater runoff each year. This amplification can be non-linear as when, for instance, a succession of anomalously high melt years and reduced firn permeability resulted in an abrupt increase in western Greenland runoff in 2012 (Machguth et al., 2016).
Harper et al. (2012), using observations from 2007 to 2009, estimated that 150 000 km2 of firn residing within the lower percolation area (as delineated in an earlier version of MAR) could potentially store between 322±44 Gt of meltwater in the top 10 m of firn and Gt within the entire firn column. We note that the Harper et al. (2012) estimate is based solely on observations in the LAPA, while 68 % of the percolation area to which they extrapolate is located in the HAPA. By contrast, we find that the warmest 150 000 km2 of our firn area in 2010–2017 can retain only 150±66 Gt of meltwater in the top 10 m of the firn. We estimate a total storage capacity of 310±270 Gt within the whole firn column in this part of the firn area. Our relatively low estimate of the retention capacity might reflect the recent decrease of FAC in the LAPA but also, for the values derived from FACtot, our simplifying assumption that this decrease has propagated through the whole firn column (Sect. 2.5). Yet, beyond these integrated values, our approach allows the quantification of the firn retention capacity and the corresponding uncertainty at any location of the firn area. Our product can therefore be used in combination with, for instance, remotely sensed melt extent to derive which areas of the firn actively retain meltwater and evaluate the retention capacity there.
We use the same infiltration ice density as Harper et al. (2012), 843±36 kg m−3 as determined from firn core segments saturated by refrozen meltwater. However, Machguth et al. (2016) measured an infiltration ice density of 873±25 kg m−3 with a similar technique in western Greenland. Using the latter value increases our estimated firn storage capacity of the top 10 m of firn by 8 % to 13 %, depending on the region, but remains within our uncertainty intervals (Table 3). Additional field measurements are needed to ascertain the spatial and temporal dependence of infiltration ice density on climatic drivers. Our definition of retention capacity assumes that retention occurs through the refreezing of meltwater and neglects potential liquid water retention seen in firn aquifers (Forster et al., 2014). Nevertheless, recent work in southeastern Greenland showed that meltwater resides for less than 30 years in the aquifer before it flows into nearby crevasses and eventually leaves the GrIS (Miller et al., 2018). Meltwater refrozen within the firn can be retained for much longer periods, until it is discharged at a marine-terminating outlet glacier or reaches the surface of the ablation area. By neglecting liquid water retention in firn, our study focuses on long-term meltwater retention.
3.3 Regional climate model evaluation
3.3.1 Comparison with FAC observations
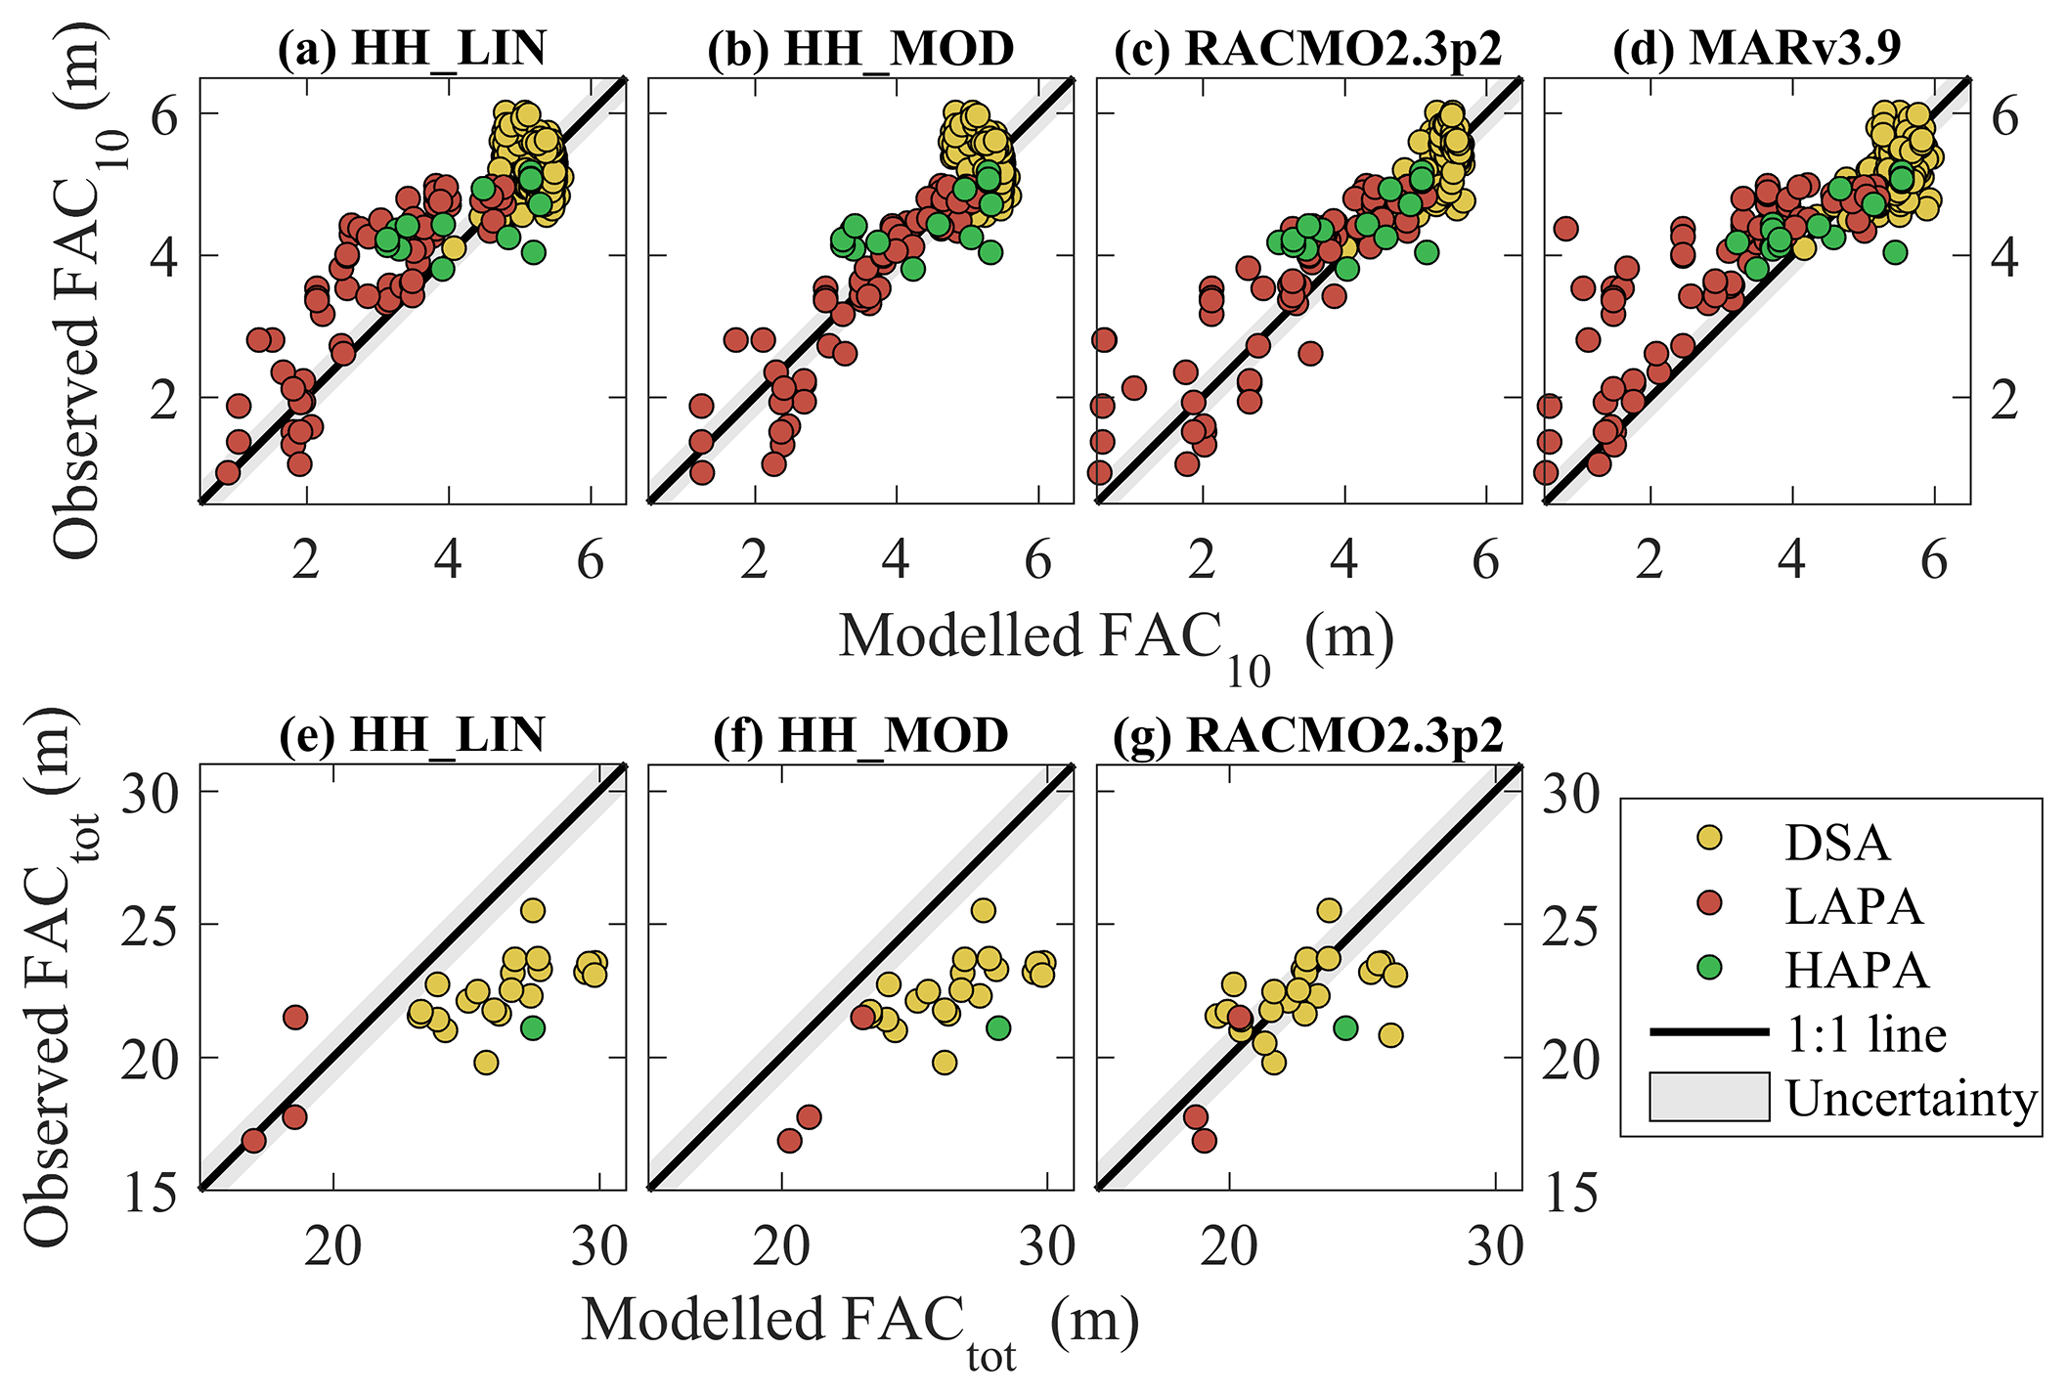
Figure 6Comparison between the observed FAC10 and FACtot and the simulated FAC in the corresponding cells of three RCMs.
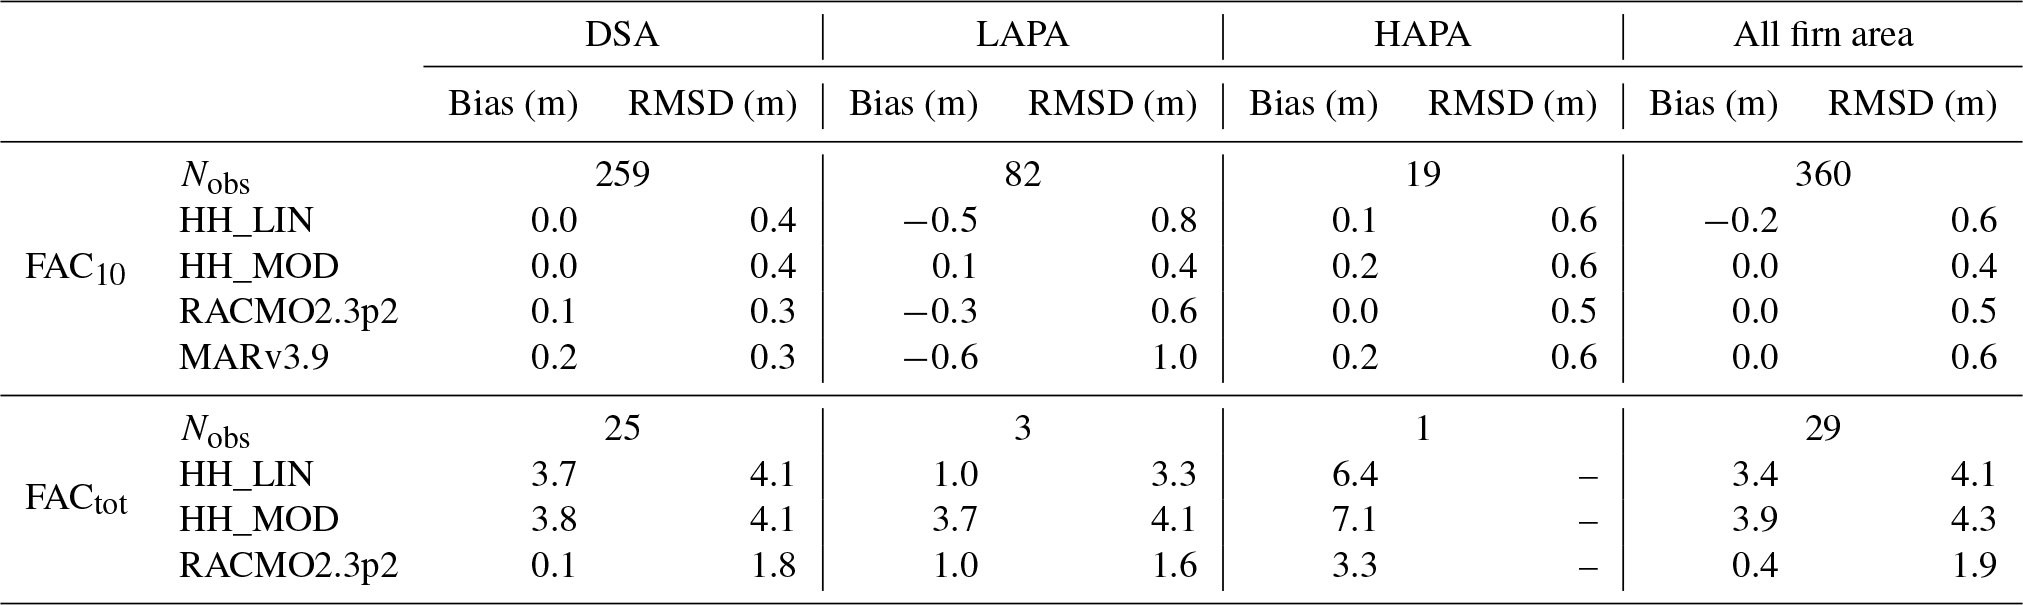
All models reproduce the FAC10 observations in the DSA and HAPA with a bias ≤ 0.2 m and RMSD ≤ 0.4 m (Fig. 6, Table 4). RACMO2.3p2, MARv3.9 and HH_LIN tend to underestimate the FAC10 in the LAPA, while HH_MOD does not show a pronounced bias there. The RCMs all present a RMSD less than 12 % of the mean FAC10 for our entire dataset. The RCMs are also evaluated against the 29 directly observed FACtot (Fig. 6, Table 4). Both versions of HIRHAM5 overestimate FACtot in the DSA (bias > 3 m), while RACMO2.3p2 performs better in that area (bias = 0.1, RMSD = 1.8). HH_LIN and RACMO2.3p2 compare relatively well with the three FACtot observations available in the LAPA, while HH_MOD presents a larger positive bias. These three FACtot observations are located in the upper LAPA and therefore do not include regions where RCMs underestimate FAC10. All models overestimate the only FACtot observation available in the HAPA by more than 3 m. Compared to all FACtot measurements, RACMO2.3p2 gives a RMSD equivalent to 9 % of the mean observed FACtot when HIRHAM5's RMSD reaches 20 % with HH_MOD. None of the RCMs therefore simulate both FAC10 and FACtot accurately.
Table 4Performance of the RCMs for FAC10 and FACtot in terms of bias (average difference between model and observations) and root-mean-squared difference (RMSD).
3.3.2 Comparison with the spatially integrated FAC
Agreement between RCM-simulated and observation-derived spatially integrated FAC is model- and region-dependent (Fig. 7). RCMs simulate a spatially integrated FAC10 within the uncertainty of our observation-derived estimation in the DSA. Models also show lower spatially integrated FAC10 in the LAPA and higher values in the HAPA compared to our estimate (Fig. 7b–d). These regional differences cancel out when spatially integrating FAC10 over the entire firn area (Fig. 7a). Our estimation of spatially integrated FACtot is subject to more assumptions, as uncertainty is introduced in our conversion of FAC10 to FACtot (Sect. 2.5). In the DSA, HH_MOD simulates a spatially integrated FACtot 20 % higher than our estimation while RACMO2.3p2 simulates spatially integrated FACtot within our uncertainty range (Fig. 7e). In the LAPA, the decrease in spatially integrated FACtot is more pronounced in our estimate than in the RCMs. This might indicate that, in the RCMs, the FAC loss is concentrated in the near-surface firn and has not yet propagated through the entire firn column. Our estimate assumes that any change in FAC10 immediately propagates to the entire firn pack (see Sect. 2.5). In the HAPA, RCMs show higher spatially integrated FACtot values than our estimate (Fig. 7h), contributing to the higher spatially integrated FACtot across the entire firn area in the RCMs compared to our estimation (Fig. 7e). This is partly due to the fact that in our estimation, FAC decreases with elevation and is set to zero at the firn line. In the RCMs, modelled FAC remains higher than our estimate in the lower HAPA and in the vicinity of the firn line. No FAC observations are available in the lower HAPA to confirm this. Future measurements will help to quantify FAC in the surroundings of the firn line, allowing for better evaluations of our assumptions and further assess to the RCMs' performance in that area.
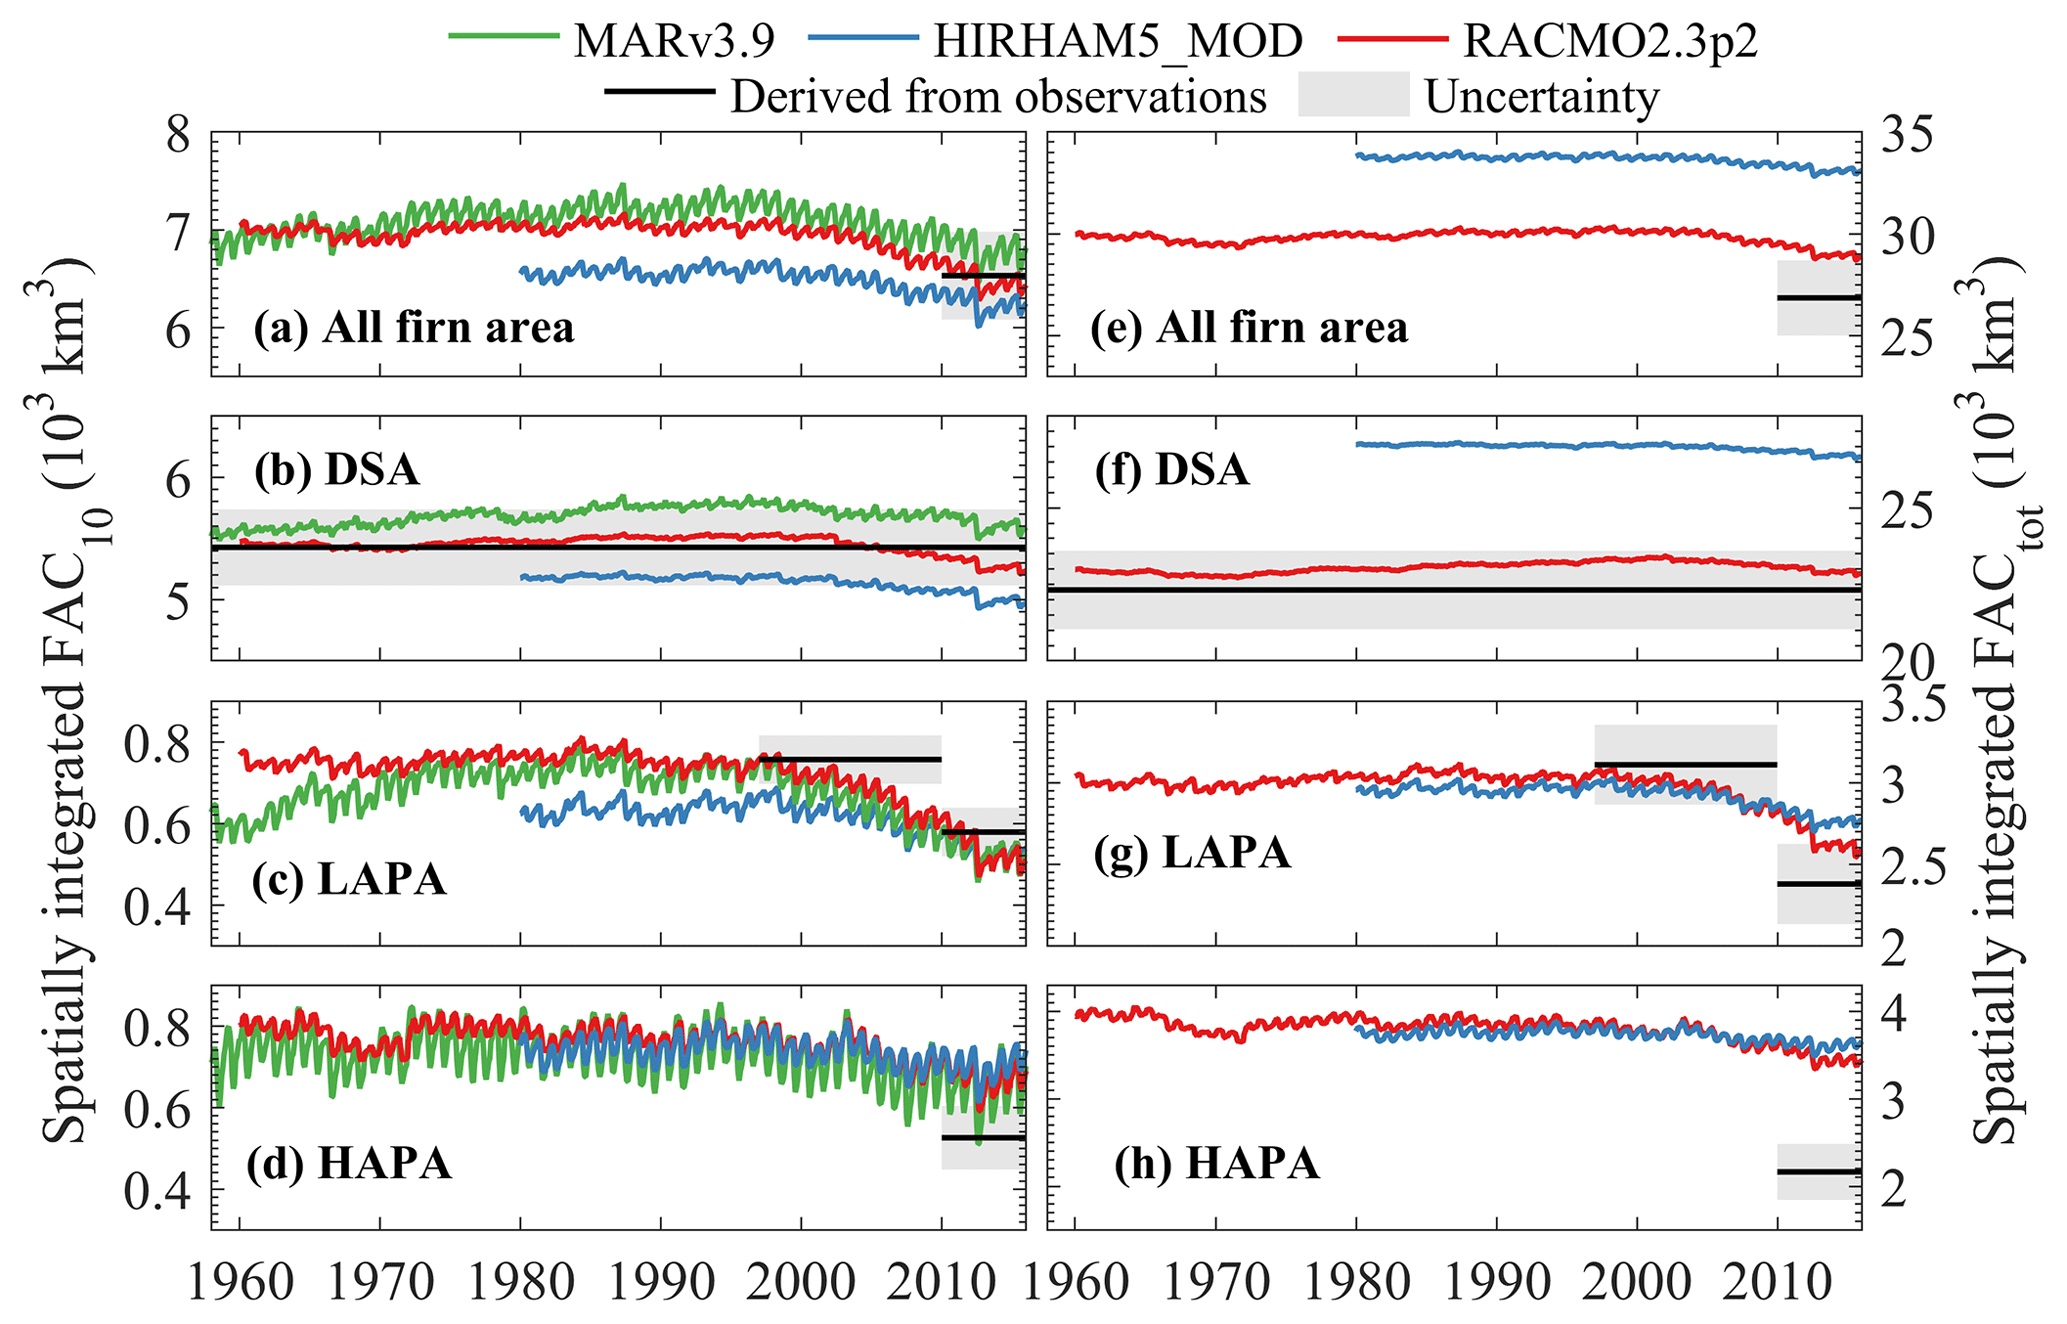
The differences between RCM outputs may stem from their respective surface forcings. As an illustration, HH_MOD uses a higher albedo than HH_LIN and thus calculates less surface melt and refreezing and, as a consequence, higher FAC10 in the LAPA. Noël et al. (2018) found that the surface mass balance of RACMO2.3p2 in the accumulation area was on average slightly lower than observations, indicating excessive sublimation or runoff relative to snowfall in the model. This surface bias could explain the model's underestimation of FAC10 in the LAPA at point scale (Fig. 6, Table 4) and on spatially integrated values (Fig. 7). On the other hand, MARv3.9 has slight positive biases in surface mass balance compared to observations (Fettweis et al., 2017). And although this RCM simulates too much precipitation relative to melt, it also underestimates FAC10 in the LAPA. Surface forcing is therefore not the only factor influencing the FAC estimates by the RCMs.
Differences in RCM-simulated FAC10 can also be explained by the way firn densification is treated in the snow model of each RCM. For instance, the overestimation of FACtot in the DSA by HIRHAM5 potentially arises from the use of a firn compaction law originally developed for seasonal snow (Vionnet et al., 2012). RACMO2.3p2 produces more realistic FACtot in the DSA, most likely because the densification law it uses has been tuned to match eight deep firn density observations (Kuipers Munneke et al., 2015a). It is nevertheless difficult to disentangle the roles of surface forcing and model formulation in the performance of RCMs.
In agreement with our observation-derived FAC10 estimates, the RCMs calculate a decreasing FAC10 in the LAPA (Fig. 7c) initiating in the early 2000s and accelerated during the extreme summers of 2010 and 2012. In the DSA, RCMs show a FAC10 decrease ranging from −120 km3 in MARv3.9 to −282 km3 in RACMO2.3p2 between 1998 and 2017. These decreases contradict our conclusion that FAC has not changed significantly in the DSA over that period (Sect. 3.1). The different FAC10 dynamics in our dataset and in RCMs could be due to (i) the RCMs not capturing an increase of snowfall in the DSA, which could in theory counterbalance the densification expected from the recent warming in the firn area (McGrath et al., 2014); (ii) an overestimated response of firn compaction rates to increasing temperatures in the models; or (iii) the spatial heterogeneity and uncertainty of FAC observations leading to spurious conclusions from our dataset. Yet, finding identical firn density profiles decades apart at several sites (e.g. Summit Station, Camp Century) adds confidence to our findings.
Using a collection of 360 firn density profiles spanning 65 years we quantified the firn air content (FAC) of the Greenland ice sheet as function of long-term air temperature and net snow accumulation averages ( and . For the 2010–2017 period we calculate that the Greenland firn contained 26 800 ± 1840 km3 of air, of which 6500 ± 450 km3 is in its top 10 m. We find that over the 1953–2017 period, FAC remained constant within uncertainty in the dry snow area (DSA, where ∘C). We note that the vast majority of the ice sheet's FAC (83±5 %) resides within the DSA and represents a potential meltwater storage volume of 12 800 ± 1170 Gt. In the low-accumulation percolation area (LAPA, where ∘C and mm w.e. yr−1), we calculate that the FAC decreased by 23±16 % between 1998–2008 and 2010–2017. This decrease translates into the loss of meltwater retention capacity of 150±100 Gt (0.4±0.3 mm sea-level equivalent) in the top 10 m of the firn and potentially up to 540±440 Gt (1.5±1.2 mm sea-level equivalent) in the entire vertical extent of the firn layer. This decreased FAC and meltwater retention capacity is focused in the lower-accumulation area of central western Greenland. Thus, in contrast to the relative stability of the DSA, the LAPA is the focal area of the firn's response to recent climate change. The firn in the high-accumulation percolation area (LAPA, where ∘C and mm w.e. yr−1) has the capacity to store 370±70 Gt in its top 10 m and up to 960±290 Gt in its entire vertical extent. Yet, this area is covered by fewer observations and would highly benefit from future field surveys.
The outputs from three regional climate models (HIRHAM5, RACMO2.3p2 and MARv3.9) indicate that our calculated decrease in FAC may have been initiated in the early 2000s and accelerated after 2010. The RCMs also provide estimates of FAC in regions where no measurements are available. But the mismatch between RCMs and our firn core dataset illustrates that RCMs should be used with caution when assessing meltwater retention capacity, or when converting ice-sheet volume changes into mass changes in the firn area. Finally, our study highlights the importance of assimilating in situ firn density measurements to document the climate response of ice-sheet firn as a non-trivial component of the sea-level budget. More broadly, this work illustrates how new insight can be obtained from the synthesis of historical data sources and thus emphasises the tremendous value of open-access data within the scientific community.
The FAC dataset and maps, along with the firn area delineation, are available at https://doi.org/10.18739/A2V40JZ6C (Vandecrux, 2019a) and the majority of the original firn density measurements can be found in the SUMup dataset at https://doi.org/10.18739/A2JH3D23R (Koenig and Montgomery, 2018). The source code is available at https://doi.org/10.5281/zenodo.2578788 (Vandecrux, 2019b).
The supplement related to this article is available online at: https://doi.org/10.5194/tc-13-845-2019-supplement.
BV, MM, HM, WTC, DvA, AH, CMS, CC, EMM, EMT, LK, LNM, CM and SBS collected firn density profiles either in the field or from previously published sources. BV, RSF, JEB and TIN designed the study. BV wrote the manuscript, to which all co-authors contributed.
The authors declare that they have no conflict of interest.
This work is part of the Retain project funded by Danmarks Frie
Forskningsfond (grant no. 4002-00234) and the Programme for Monitoring of the
Greenland ice sheet (http://PROMICE.dk, last access: 25 February 2019).
The field campaigns were funded by the NASA grant NNX15AC62G in collaboration
with the Greenland Analogue Project (GAP). Achim Heilig was supported by DFG
grant HE 7501/1-1. We thank Hubertus Fischer from the Department of Climate
and Environmental Physics at the University of Bern (Switzerland), for
providing low-resolution density data from firn cores collected during the
EGIG expeditions of 1990 and 1992. We are grateful to Peter Langen from the
Danish Meteorological Institute, Stefan Ligtenberg from the Institute for
Marine and Atmospheric Research at Utrecht University (IMAU) and Xavier
Fettweis from the Laboratory of Climatology, Department of Geography,
University of Liège, for providing the regional climate model output. We
thank Sergey Marchenko and an anonymous reviewer for their suggestions, which
greatly improved the manuscript.
Edited by:
Michiel van den Broeke
Reviewed by: Sergey Marchenko and one
anonymous referee
Albert, M. and Shultz, E.: Snow and firn properties and air–snow transport processes at Summit, Greenland, Atmos. Environ., 36, 2789–2797, https://doi.org/10.1016/S1352-2310(02)00119-X, 2002.
Alley, R.: Transformations in Polar Firn, PhD Thesis, University of Wisconsin, Madison, WI, USA, 1987.
Bader, H.: Sorge's law of densification of snow on high polar glaciers, J. Glaciol., 2, 15, 319–411, https://doi.org/10.3189/S0022143000025144, 1954.
Baker, I.: Density and permeability measurements with depth for the NEEM 2009S2 firn core, ACADIS Gateway, https://doi.org/10.18739/A2Q88G, 2012.
Benson, C. S.: Stratigraphic Studies in the Snow and Firn of the Greenland Ice Sheet, U.S. Army Snow, Ice and Permafrost Research Establishment (SIPRE–CRREL), Research Report 70, reprinted with revisions by CRREL, 1996, 1962.
Bindoff, N. L., Stott, P. A., AchutaRao, K. M., Allen, M. R., Gillett, N., Gutzler, D., Hansingo, K., Hegerl, G., Hu, Y., Jain, S., Mokhov, I. I., Overland, J., Perlwitz, J., Sebbari, R., and Zhang, X.: Detection and Attribution of Climate Change: from Global to Regional, in: Climate Change 2013: The Physical Science Basis, Contribution of Working Group I to the Fifth Assessment Report of the Intergovernmental Panel on Climate Change, edited by: Stocker, T. F., Qin, D., Plattner, G.-K., Tignor, M., Allen, S. K., Boschung, J., Nauels, A., Xia, Y., Bex, V., and Midgley, P. M., Cambridge University Press, Cambridge, UK, New York, NY, USA, 867–952, https://doi.org/10.1017/CBO9781107415324.022, 2013.
Bolzan, J. F. and Strobel, M.: Oxygen isotope data from snowpit at GISP2 Site 15, PANGAEA, https://doi.org/10.1594/PANGAEA.55511, 1999.
Box, J.: Greenland ice sheet mass balance reconstruction. Part II: Surface mass balance (1840–2010), J. Climate, 26, 6974–6989, https://doi.org/10.1175/JCLI-D-12-00518.1, 2013.
Box, J., Cressie, N., Bromwich, D. H., Jung, J.-H., van den Broeke, M. R., van Angelen, J., Forster, R. R., Miège, C., Mosley-Thompson, E., Vinther, B., and McConnell, J. R.: Greenland ice sheet mass balance reconstruction. Part I: Net snow accumulation (1600–2009), J. Climate, 26, 3919–3934, https://doi.org/10.1175/JCLI-D-12-00373.1, 2013.
Braithwaite, R., Laternser, M., and Pfeffer, W. T.: Variation of near-surface firn density in the lower accumulation area of the Greenland ice sheet, Pâkitsoq, West Greenland, J. Glaciol., 40, 477–485, https://doi.org/10.3189/S002214300001234X, 1994.
Buchardt, S. L., Clausen, H. B., Vinther, B. M., and Dahl-Jensen, D.: Investigating the past and recent δ18O-accumulation relationship seen in Greenland ice cores, Clim. Past, 8, 2053–2059, https://doi.org/10.5194/cp-8-2053-2012, 2012.
Charalampidis, C., van As, D., Box, J. E., van den Broeke, M. R., Colgan, W. T., Doyle, S. H., Hubbard, A. L., MacFerrin, M., Machguth, H., and Smeets, C. J. P. P.: Changing surface–atmosphere energy exchange and refreezing capacity of the lower accumulation area, West Greenland, The Cryosphere, 9, 2163–2181, https://doi.org/10.5194/tc-9-2163-2015, 2015.
Clausen, H., Gundestrup, N. S., Johnsen, S. J., Bindschadler, R., and Zwally, J.: Glaciological investigations in the Crete area, Central Greenland: a search for a new deep-drilling Site, Ann. Glaciol., 10, 10–15, https://doi.org/10.3189/S0260305500004080, 1988.
Colgan, W., Pedersen, A., Binder, D., Machguth, H., Abermann, J., and Jayred, M.: Initial field activities of the Camp Century Climate Monitoring Programme in Greenland, Geol. Surv. Denmark Greenland Bull., 41, 75–78, 2018.
de la Peña, S., Howat, I. M., Nienow, P. W., van den Broeke, M. R., Mosley-Thompson, E., Price, S. F., Mair, D., Noël, B., and Sole, A. J.: Changes in the firn structure of the western Greenland Ice Sheet caused by recent warming, The Cryosphere, 9, 1203–1211, https://doi.org/10.5194/tc-9-1203-2015, 2015.
Fausto, R., Mayer, C., and Ahlstrøm, A.: Satellite-derived surface type and melt area of the Greenland ice sheet using MODIS data from 2000 to 2005, Ann. Glaciol., 46, 35–42, https://doi.org/10.3189/172756407782871422, 2007.
Fausto, R. S, Andersen, S. B., Ahlstrøm, A. P., van As, D., Box, J. E., Binder, D., Citterio, M., Colgan, W., Haubner, K., Hansen, K., Karlsson, N. B., Mankoff, K. D., Pedersen, A. Ø., Solgaard, A., and Vandecrux, B.: The Greenland ice sheet – snowline elevations at the end of the melt seasons from 2000 to 2017, Geol. Surv. Denmark Greenland Bull., 41, 71–74, 2018a.
Fausto, R. S., Box, J. E., Vandecrux, B., van As, D., Steffen, K., MacFerrin, M., Machguth H., Colgan W., Koenig L. S., McGrath D., Charalampidis, C., and Braithwaite, R. J.: A Snow Density Dataset for Improving Surface Boundary Conditions in Greenland Ice Sheet Firn Modeling, Front. Earth Sci., 6, 51 pp., https://doi.org/10.3389/feart.2018.00051, 2018b.
Fettweis, X., Box, J. E., Agosta, C., Amory, C., Kittel, C., Lang, C., van As, D., Machguth, H., and Gallée, H.: Reconstructions of the 1900–2015 Greenland ice sheet surface mass balance using the regional climate MAR model, The Cryosphere, 11, 1015–1033, https://doi.org/10.5194/tc-11-1015-2017, 2017.
Fischer, H., Wagenbach, D., Laternser, M., and Haeberli, W.: Glacio-meteorological and isotopic studies along the EGIG line, central Greenland, J. Glaciol., 41, 139, 515–527, https://doi.org/10.3189/S0022143000034857, 1995.
Forster, R. R., Box, J. E., van den Broeke, M. R., Miège, C., Burgess, E. W., Angelen, J. H., Lenaerts, J. T. M., Koenig, L. S., Paden, J., Lewis, C., Gogineni, S. P., Leuschen, C., and McConnell, J. R.: Extensive liquid meltwater storage in firn within the Greenland ice sheet, Nat. Geosci., 7, 95–98, 2014.
Graeter, K. A., Osterberg, E., Ferris, D. G., Hawley, R. L., Marshall, H. P., Lewis, G., Meehan, T., McCarthy, F., Overly, T., and Birkel, S. D.: Ice Core Records of West Greenland Melt and Climate Forcing, Geophys. Res. Lett., 45, 3164–3182, https://doi.org/10.1002/2017GL076641, 2018.
Harper, J., Humphrey, N., Pfeffer, W. T., Brown, J., and Fettweis, X.: Greenland ice-sheet contribution to sea-level rise buffered by meltwater storage in firn, Nature, 491, 240–243, https://doi.org/10.1038/nature11566, 2012.
Hawley, R. L., Courville, Z. R., Kehrl, L., Lutz, E., Osterberg, E., Overly, T. B., and Wong, G.: Recent accumulation variability in northwest Greenland from ground-penetrating radar and shallow cores along the Greenland Inland Traverse, J. Glaciol., 60, 375–382, https://doi.org/10.3189/2014JoG13J141, 2014.
Heilig, A., Eisen, O., MacFerrin, M., Tedesco, M., and Fettweis, X.: Seasonal monitoring of melt and accumulation within the deep percolation zone of the Greenland Ice Sheet and comparison with simulations of regional climate modeling, The Cryosphere, 12, 1851–1866, https://doi.org/10.5194/tc-12-1851-2018, 2018.
Humphrey, N. F., Harper, J. T., and Pfeffer, W. T.: Thermal tracking of meltwater retention in Greenland's accumulation area, J. Geophys. Res., 117, F01010, https://doi.org/10.1029/2011JF002083, 2012.
Jezek, K. C.: Surface Elevation and Velocity Changes on the South Central Greenland Ice Sheet: 1980–2011 – Data Summary, BPRC Technical Report No. 2012-01, Byrd Polar Research Center, The Ohio State University, Columbus, Ohio, 2012.
Kameda, T., Narita, H., Shoji, H., Nishio, F., Fuji, Y., and Watanabe, O.: Melt features in ice cores from Site J, southern Greenland: some implication for summer climate since AD 1550, Ann. Glaciol., 21, 51–58, https://doi.org/10.3189/S0260305500015597, 1995.
Koenig, L. and Montgomery, L.: Surface Mass Balance and Snow Depth on Sea Ice Working Group (SUMup) snow density subdataset, Greenland and Antartica, 1950–2018, Arctic Data Center, https://doi.org/10.18739/A2JH3D23R, 2018.
Koenig, L. S., Miège, C., Forster, R. R., and Brucker, L.: Initial in situ measurements of perennial meltwater storage in the Greenland firn aquifer, Geophys. Res. Lett., 41, 81–85, https://doi.org/10.1002/2013GL058083, 2014.
Kovacs, A., Weeks, W. F., and Michitti, F.: Variation of Some Mechanical Properties of Polar Snow, Camp Century, Greenland, CRREL Res. Rpt. 276, 1969.
Kuipers Munneke, P., Ligtenberg, S. R. M., Noël, B. P. Y., Howat, I. M., Box, J. E., Mosley-Thompson, E., McConnell, J. R., Steffen, K., Harper, J. T., Das, S. B., and van den Broeke, M. R.: Elevation change of the Greenland Ice Sheet due to surface mass balance and firn processes, 1960–2014, The Cryosphere, 9, 2009–2025, https://doi.org/10.5194/tc-9-2009-2015, 2015a.
Kuipers Munneke, P., Ligtenberg, S. R., Suder, E. A., and van den Broeke, M. R.: A model study of the response of dry and wet firn to climate change, Ann. Glaciol., 56, 1–8, https://doi.org/10.3189/2015AoG70A994, 2015b.
Langen, P., Fausto, R. S., Vandecrux, B., Mottram, R., and Box, J.: Liquid Water Flow and Retention on the Greenland Ice Sheet in the Regional Climate Model HIRHAM5: Local and Large-Scale Impacts, Front. Earth Sci., 4, 110 pp., https://doi.org/10.3389/feart.2016.00110, 2017.
Langway, C. C.: Stratigraphic analysis of a deep ice core from Greenland, CRREL Res. Rpt. 77, 1967.
Ligtenberg, S. R. M., Kuipers Munneke, P., Noël, B. P. Y., and van den Broeke, M. R.: Brief communication: Improved simulation of the present-day Greenland firn layer (1960–2016), The Cryosphere, 12, 1643–1649, https://doi.org/10.5194/tc-12-1643-2018, 2018.
Lomonaco, R., Albert, M., and Baker, I.: Microstructural evolution of fine-grained layers through the firn column at Summit, Greenland, J. Glaciol., 57, 204 pp., https://doi.org/10.3189/002214311797409730, 2011.
Lucas-Picher, P., Wulff-Nielsen, M., Christensen, J. H., Aðalgeirsdóttir, G., Mottram, R., and Simonsen, S. B.: Very high resolution in regional climate model simulations for Greenland: Identifying added value, J. Geophys. Res., 117, D02108, https://doi.org/10.1029/2011JD016267, 2012.
Machguth, H., MacFerrin, M., van As, D., Box, J., Charalampidis, C., Colgan, W., Fausto, R. S., Meijer, H. A., Mosley-Thompson, E., and van de Wal, R. S.: Greenland meltwater storage in firn limited by near-surface ice formation, Nat. Clim. Change, 6, 390–395, https://doi.org/10.1038/NCLIMATE2899, 2016.
Mayewski, P. and Whitlow, S.: Snow Pit and Ice Core Data from Southern Greenland, 1984, NSF Arctic Data Center https://doi.org/10.5065/D6S180MH, 2016a.
Mayewski, P. and Whitlow S.: Snow Pit Data from Greenland Summit, 1989 to 1993, NSF Arctic Data Center, https://doi.org/10.5065/D6NP22KX, 2016b.
McGrath, D., Colgan, W., Bayou, N., Muto, A., and Steffen, K.: Recent warming at Summit, Greenland: Global context and implications, Geophys. Res. Lett., 40, 2091–2096, https://doi.org/10.1002/grl.50456, 2013.
Miège, C., Forster, R. R., Box, J. E., Burgess, E., McConnell, J., Pasteris, D., and Spikes, V. B.: Southeast Greenland high accumulation rates derived from firn cores and ground-penetrating radar, Ann. Glaciol., 54, 322–332, https://doi.org/10.3189/2013AoG63A358, 2013.
Miège, C., Forster, R. R., Brucker, L., Koenig, L. S., Solomon, D. K., Paden, J. D., Box, J. E., Burgess, E. W., Miller, J. Z., McNerney, L., Brautigam, N., Fausto, R. S., and Gogineni, S.: Spatial extent and temporal variability of Greenland firn aquifers detected by ground and airborne radars, J. Geophys. Res.-Earth, 121, 2381–2398, https://doi.org/10.1002/2016JF003869, 2016.
Morris, E. M. and Wingham, D. J.: Densification of polar snow: Measurements, modeling and implication for altimetry, J. Geophys. Res.-Earth, 119, 349–365, https://doi.org/10.1002/2013JF002898, 2014.
Mosley-Thompson, E., McConnell, J., Bales, R., Li, Z., Lin, P.-N., Steffen, K., Thompson, L. G., Edwards, R., and Bathke, D.: Local to regional-scale variability of annual net accumulation on the Greenland ice sheet from PARCA cores, J. Geophys. Res., 106, 33839–33851, https://doi.org/10.1029/2001JD900067, 2001.
Mote, T. L.: Greenland surface melt trends 1973–2007: Evidence of a large increase in 2007, Geophys. Res. Lett., 34, L22507, https://doi.org/10.1029/2007GL031976, 2007.
Nerem, R. S., Beckley, B. D., Fasullo, J. T., Hamlington, B. D., Masters, D., and Mitchum, G. T.: Climate-change-driven accelerated sea-level rise detected in the altimeter era, P. Natl. Acad. Sci. USA, 7, 201717312, https://doi.org/10.1073/pnas.1717312115, 2018.
Nghiem, S. V., Hall, D. K., Mote, T. L., Tedesco, M., Albert, M. R., Keegan, K., Shuman, C. A., DiGirolamo, N. E., and Neumann, G.: The extreme melt across the Greenland ice sheet in 2012, Geophys. Res. Lett., 39, L20502, https://doi.org/10.1029/2012GL053611, 2012.
Noël, B., van de Berg, W. J., van Wessem, J. M., van Meijgaard, E., van As, D., Lenaerts, J. T. M., Lhermitte, S., Kuipers Munneke, P., Smeets, C. J. P. P., van Ulft, L. H., van de Wal, R. S. W., and van den Broeke, M. R.: Modelling the climate and surface mass balance of polar ice sheets using RACMO2 – Part 1: Greenland (1958–2016), The Cryosphere, 12, 811–831, https://doi.org/10.5194/tc-12-811-2018, 2018.
Porter, S. and Mosley-Thompson, E.: Exploring seasonal accumulation bias in a west central Greenland ice core with observed and reanalyzed data, J. Glaciol., 60, 1065–1074, https://doi.org/10.3189/2014JoG13J233, 2014.
Reed, S.: Performance Study of the Dewline Ice Cap Stations, 1963, CRREL Special Report 72, 1966.
Renaud, A.: Etude physiques et chimiques sur la glace de l'inlandsis du Groenland, Medd. Groenland, 2, 100–107, 1959.
Shumskii, P. A.: Principles of structural glaciology: the petrography of fresh-water ice as a method of glaciological investigation, Dover Publications Inc., 1964.
Simonsen, S. B., Stenseng, L., Ađalgeirsdóttir, G., Fausto, R. S., Hvidberg, C. S., and Lucas-Picher, P.: Assessing a multilayered dynamic firn-compaction model for Greenland with ASIRAS radar measurements, J. Glaciol., 59, 545–558, https://doi.org/10.3189/2013JoG12J158, 2013.
Spencer, M. K., Alley, R. B., and Creyts, T. T.: Preliminary firn-densification model with 38-site dataset, J. Glaciol., 47, 671–676, https://doi.org/10.3189/172756501781831765, 2001.
Steen-Larsen, H. C., Masson-Delmotte, V., Sjolte, J., Johnsen, S. J., Vinther, B. M., Bréon, F. M., Clausen, H. B., Dahl-Jensen, D., Falourd, S., Fettweis, X., Gallée, H., Jouzel, J., Kageyama, M., Lerche, H., Minster, B., Picard, G., Punge, H. J., Risi, C., Salas, D., Schwander, J., Steffen, K., Sveinbjörnsdóttir, A. E., Svensson, A., and White, J.: Understanding the climatic signal in the water stable isotope records from the NEEM cores, J. Geophys. Res., 116, D06108, https://doi.org/10.1029/2010JD014311, 2011.
Sørensen, L. S., Simonsen, S. B., Nielsen, K., Lucas-Picher, P., Spada, G., Adalgeirsdottir, G., Forsberg, R., and Hvidberg, C. S.: Mass balance of the Greenland ice sheet (2003–2008) from ICESat data – the impact of interpolation, sampling and firn density, The Cryosphere, 5, 173–186, https://doi.org/10.5194/tc-5-173-2011, 2011.
Vallelonga, P., Christianson, K., Alley, R. B., Anandakrishnan, S., Christian, J. E. M., Dahl-Jensen, D., Gkinis, V., Holme, C., Jacobel, R. W., Karlsson, N. B., Keisling, B. A., Kipfstuhl, S., Kjær, H. A., Kristensen, M. E. L., Muto, A., Peters, L. E., Popp, T., Riverman, K. L., Svensson, A. M., Tibuleac, C., Vinther, B. M., Weng, Y., and Winstrup, M.: Initial results from geophysical surveys and shallow coring of the Northeast Greenland Ice Stream (NEGIS), The Cryosphere, 8, 1275–1287, https://doi.org/10.5194/tc-8-1275-2014, 2014.
van Angelen, J., Lenaerts, J. T., van den Broeke, M. R., Fettweis, X., and van Meijgaard, E.: Rapid loss of firn pore space accelerates 21st century Greenland mass loss, Geophys. Res. Lett., 40, 2109–2113, https://doi.org/10.1002/grl.50490, 2013.
Vandecrux, B., Fausto, R. S., Langen, P. L., Van As, D., MacFerrin, M., Colgan, W. T., Ingeman-Nielsen, T., Steffen, K., Jensen, N. S., Møller, M. T., and Box, J. E.: Drivers of Firn Density on the Greenland Ice Sheet Revealed by Weather Station Observations and Modeling, J. Geophys. Res.-Earth, 123, 2563–2576, https://doi.org/10.1029/2017JF004597, 2018.
Vandecrux, B.: Firn air content and firn area delineation on the Greenland ice sheet, Arctic Data Center, https://doi.org/10.18739/A2V40JZ6C, 2019a.
Vandecrux, B.: Greenland ice sheet firn air content analysis scripts (Version v1.0.1), Zenodo, https://doi.org/10.5281/zenodo.2578788, 2019b.
van den Broeke, M. R., Enderlin, E. M., Howat, I. M., Kuipers Munneke, P., Noël, B. P. Y., van de Berg, W. J., van Meijgaard, E., and Wouters, B.: On the recent contribution of the Greenland ice sheet to sea level change, The Cryosphere, 10, 1933–1946, https://doi.org/10.5194/tc-10-1933-2016, 2016.
van der Veen, C. J., Mosley-Thompson, E., Jezek, K. C., Whillans, I. M., and Bolzan, J. F.: Accumulation rates in South and Central Greenland, Polar Geography, 25, 79–162, https://doi.org/10.1080/10889370109377709, 2001.
Wilhelms, F.: Measuring the Conductivity and Density of Ice Cores, Ber. Polarforsch., 191 pp., 1996.