the Creative Commons Attribution 4.0 License.
the Creative Commons Attribution 4.0 License.
 | 14 Feb 2019
Past and future dynamics of the Brunt Ice Shelf from seabed bathymetry and ice shelf geometry
Tom A. Jordan
Jan De Rydt
Peter T. Fretwell
Samuel A. Seddon
David Becker
Kelly A. Hogan
Andrew M. Smith
David G. Vaughan
The recent rapid growth of rifts in the Brunt Ice Shelf appears to signal the onset of its largest calving event since records began in 1915. The aim of this study is to determine whether this calving event will lead to a new steady state in which the Brunt Ice Shelf remains in contact with the bed, or an unpinning from the bed, which could predispose it to accelerated flow or possible break-up. We use a range of geophysical data to reconstruct the sea-floor bathymetry and ice shelf geometry, to examine past ice sheet configurations in the Brunt Basin, and to define the present-day geometry of the contact between the Brunt Ice Shelf and the bed. Results show that during past ice advances grounded ice streams likely converged in the Brunt Basin from the south and east. As the ice retreated, it was likely pinned on at least three former grounding lines marked by topographic highs, and transverse ridges on the flanks of the basin. These may have subsequently formed pinning points for developing ice shelves. The ice shelf geometry and bathymetry measurements show that the base of the Brunt Ice Shelf now only makes contact with one of these topographic highs. This contact is limited to an area of less than 1.3 to 3 km2 and results in a compressive regime that helps to maintain the ice shelf's integrity. The maximum overlap between ice shelf draft and the bathymetric high is 2–25 m and is contingent on the presence of incorporated iceberg keels, which protrude beneath the base of the ice shelf. The future of the ice shelf depends on whether the expected calving event causes full or partial loss of contact with the bed and whether the subsequent response causes re-grounding within a predictable period or a loss of structural integrity resulting from properties inherited at the grounding line.
- Article
(5068 KB) - Full-text XML
-
Supplement
(801 KB) - BibTeX
- EndNote


Compilations of marine geophysical data have shown that the Coats Land ice shelves bordering the Weddell Sea in East Antarctica have historically retreated towards the grounding line once detached from pinning points on the seabed (Hodgson et al., 2018).
The Brunt Ice Shelf (BIS) is the only large ice shelf that remains intact in Coats Land south of 74∘ S (Fig. 1). It is formed by a series of unnamed glaciers that cross a steep grounding line at a feature known as the Brunt Icefalls (75∘55′ S, 25∘0′ W; Fig. 2a). This zone extends for about 80 km and marks the transition between the grounded and floating ice masses. Here the glaciers and the surrounding ice sheet calve into a 10–20 km wide zone of icebergs (sometimes referred to as the ice mélange, Fig. 2a), which are eventually fused together by sea ice and falling and drifting snow layers to form a structurally heterogeneous ice shelf (King et al., 2018).
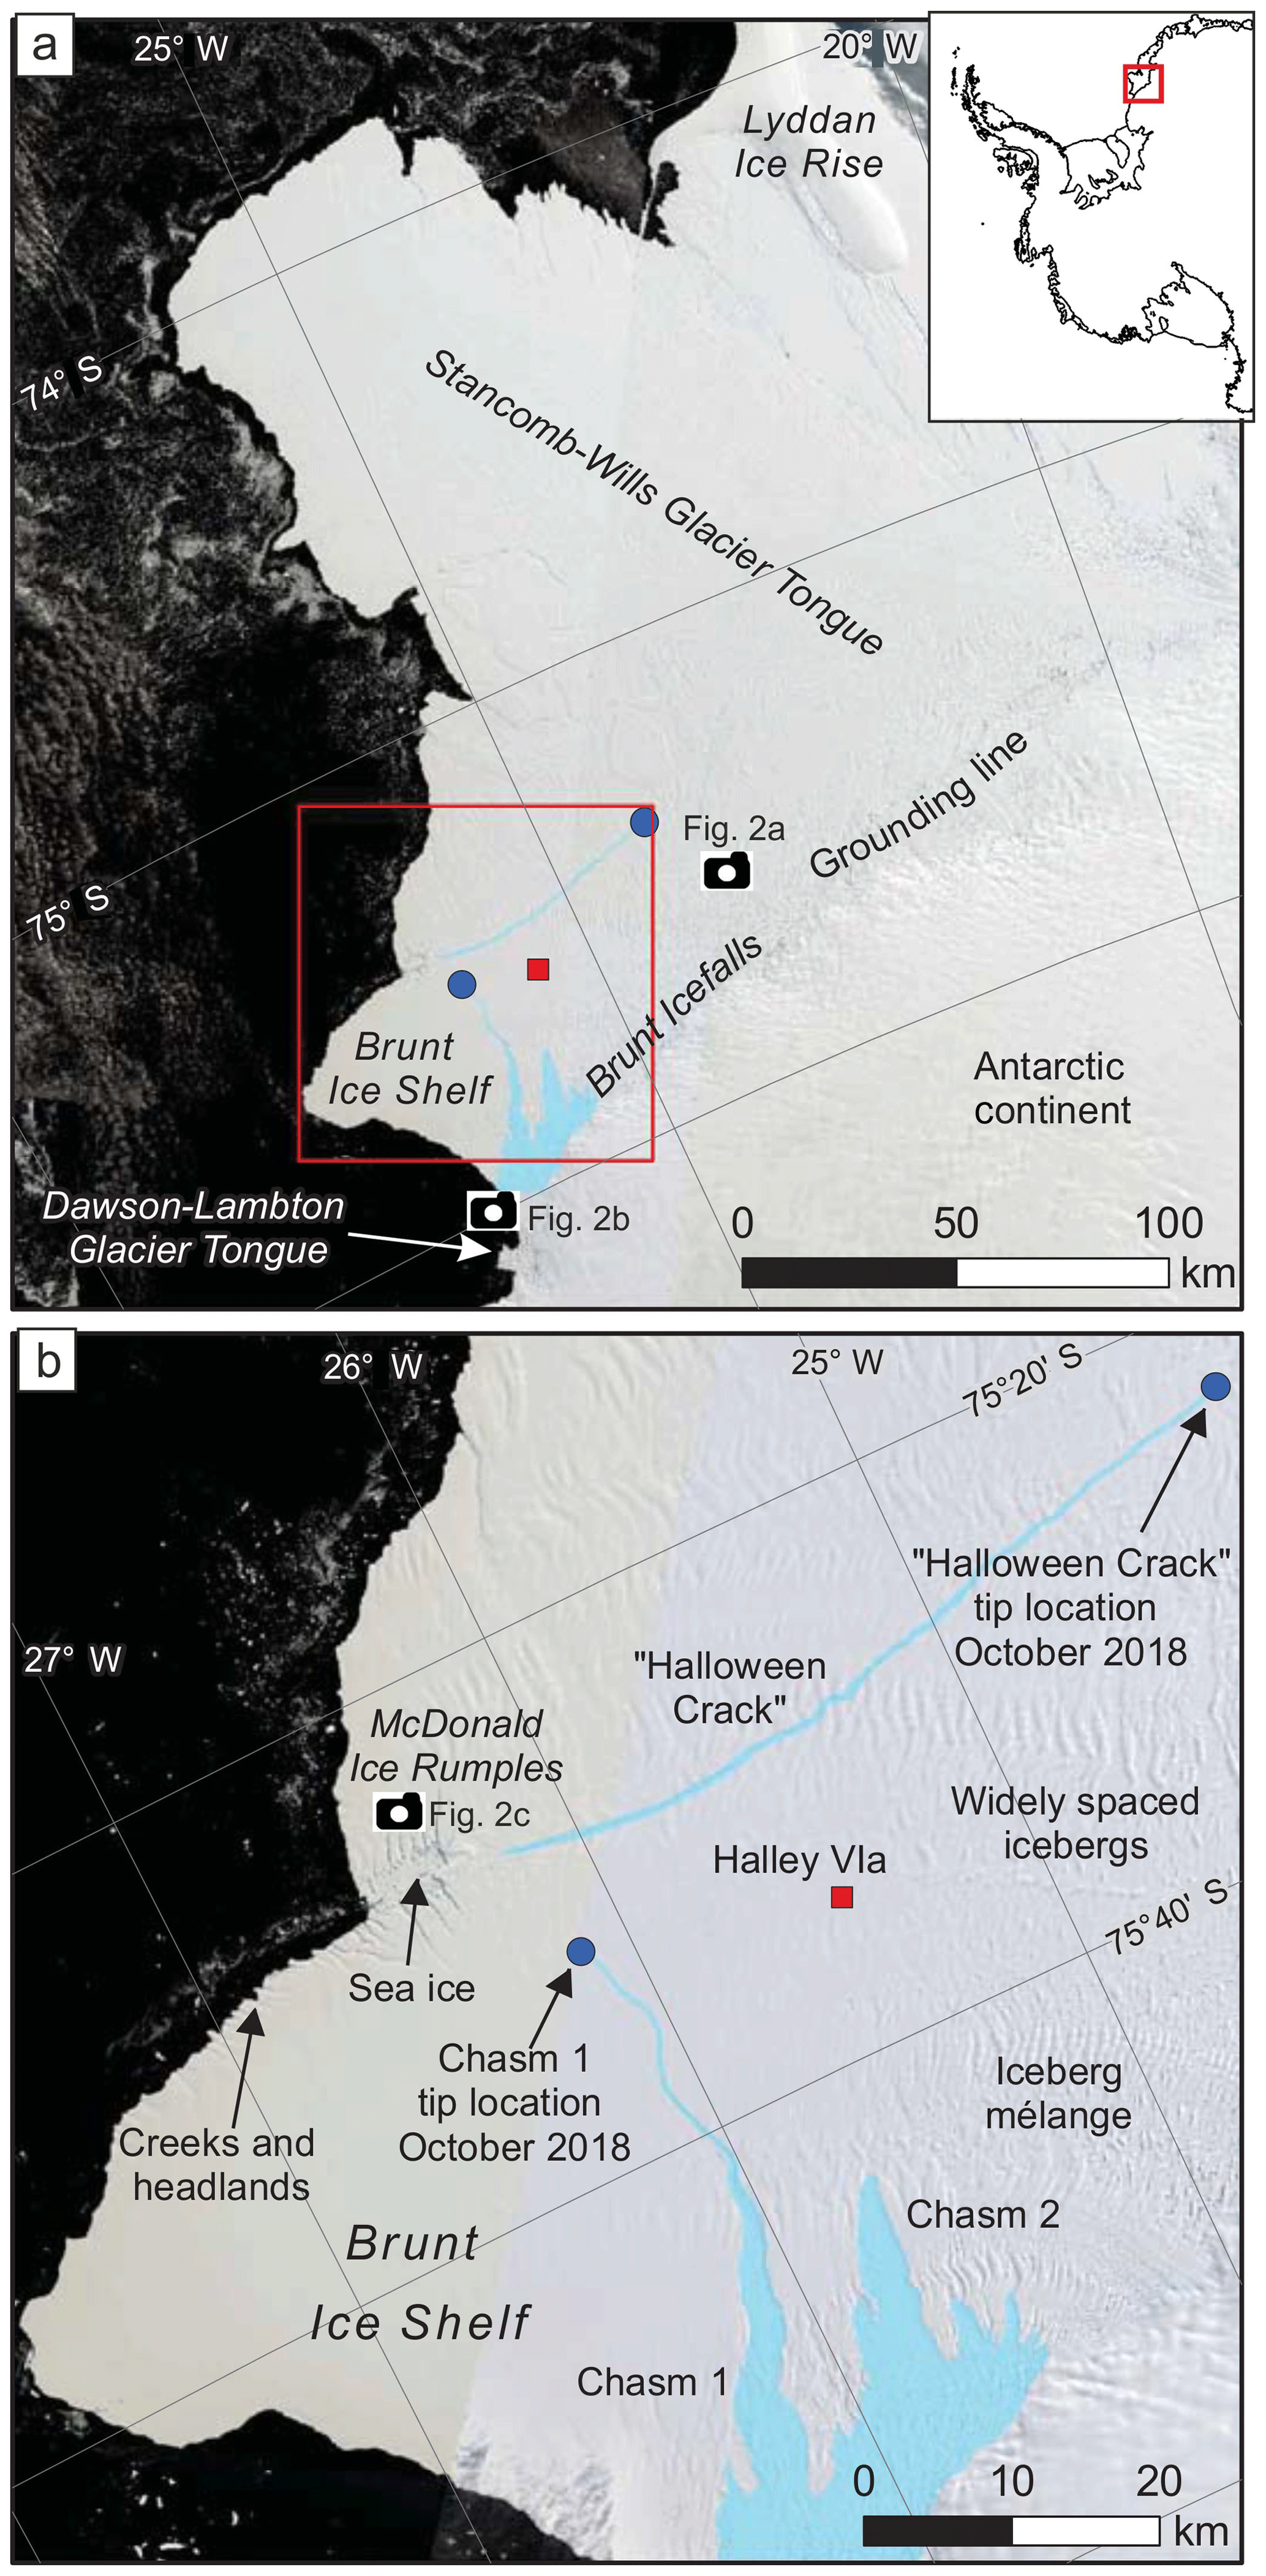
Figure 1Study location map over Landsat 8 satellite images. (a) Composite of visible-band Landsat 8 satellite images showing the Brunt Ice Shelf and Stancomb-Wills Glacier Tongue. Pale blue shading highlights the current cracks and chasms seen on the ice shelf. Camera symbols approximately locate photographs in Fig. 2a–c. The red box locates panel (b) and the inset shows the study area (red) in its Antarctic context. (b) Details of the Brunt Ice Shelf showing the Halloween Crack and Chasm 1. Landsat 8 images from 5, 9, and 12 February 2018 courtesy of the U.S. Geological Survey.
The BIS is bounded to the north by the Stancomb-Wills Glacier Tongue (SWGT, Fig. 1a) and to the southwest by the Dawson-Lambton Glacier Tongue (DLGT; Figs. 1a, 2b). Together they form a continuous floating ice mass of approximately 33 000 km2 (De Rydt et al., 2018). Halley VIa Research Station is currently situated on the BIS at 75∘34′ S, 25∘28′ W, having been recently moved from the Halley VI site at 75∘36′ S, 26∘12′ W due to the development of rifts in the ice shelf. This base is the latest in a series of six British research stations that have occupied the ice shelf since 1956 (Fig. 1b). A programme of glaciological monitoring supports the operational activities and, as a result, the BIS is one of the most intensely observed ice shelves in Antarctica. Since the 1956–1958 International Geophysical Year, glaciological experiments, aerial photographs, and more recently satellite images, in situ radar surveys, and a network of GPS stations, have all been used to monitor the behaviour of the ice shelf (De Rydt et al., 2018; Gudmundsson et al., 2016). The changing positions of the ice front have also been mapped since the Shackleton-led Endurance expedition into the Weddell Sea in 1915 (Worsley, 1921).
The historical records show cyclical changes of both the SWGT and the DLGT over the last 100 years. These have included an advance, then substantial calving of the SWGT sometime between 1915 and 1955 (Thomas, 1973), and the formation and loss of several > 10 km long ice tongues formed by the Dawson-Lambton Ice Stream since 1958 (Admiralty Charts, British Antarctic Survey Archives). In both cases, these glacier tongues have been of insufficient extent or thickness to re-establish contact with the topographic highs mapped at the distal ends of their glacial troughs (Hodgson et al., 2018). This failure to reconnect with the bed means that they remain un-buttressed and have been described as “failed ice shelves” (Hodgson et al., 2018) (Fig. 2b).
In contrast, the BIS has only experienced relatively small episodic calving events along its ice front since 1915 (Anderson et al., 2014). This relative stability has been the result of the base of the ice shelf maintaining contact with a topographic high on a ridge of glacial sediments (Seismic profile 5; Elverhøi and Maisey, 1983) known as the McDonald Bank (75∘28′ S 26∘18′ W). This topographic high deflects the flow of the SWGT to the north and BIS to the south. Back stresses from the contact between the base of the ice shelf and the bed buttress the ice shelf and create a series of upstream concentric pressure waves with extensive crevassing and rifting known as the McDonald Ice Rumples (MIR, Figs. 1b and 2c). These pressure waves rise up to ca. 10 m above the surrounding ice shelf. Downstream of the MIR there is a channel of open water and sea ice and a series of 0.1–3 km wide ice headlands and creeks (Anderson et al., 2014). Some of these headlands show a moderate 2–4 m rise at their seaward ends. This has been attributed to “upwarping by the buoyancy of submarine rams of ice” extending seaward of the cliff front below the waterline (Swithinbank, 1957; p. 14; Thomas, 1973; p. 5).

Figure 2Images of key ice shelf features. Approximate locations of a–c in Fig. 1. (a) The grounding line of the Brunt Ice Shelf showing the 10–20 km wide zone of icebergs which eventually “fuse” together with sea ice and falling and drifting snow layers to form a structurally heterogeneous ice shelf. (b) The Dawson-Lambton Glacier Tongue, which fails to reconnect with the bed. (c) The McDonald Ice Rumples showing where the ice shelf is deflected around a topographic high on the McDonald Bank, oblique aerial photograph facing NNW in 2017. (d) Part of the Coats Land ice margin south of the Brunt Ice Shelf, which calves directly into the Weddell Sea. Photograph taken of the coast immediately south of the study area in Fig. 1a.
Although in contact with the bed at the MIR, the BIS has experienced substantial changes in its velocity during the instrumental period, including periods of fast flow between the late 1970s and 2000 and from 2012 to the present. In the late 1970s, the acceleration in ice shelf velocities from 400 to > 700 m a−1 (Simmons and Rouse, 1984) was immediately preceded by the formation of a rift upstream of the MIR in 1968 (Thomas, 1973). This event has been attributed to either a change in the stiffness of the ice mélange area resulting from differences in the rheology between meteoric and marine ice (Khazendar et al., 2009) or a partial loss of buttressing caused by relatively small calving events at the ice shelf front. The latter hypothesis has been tested by an ice flow model, which showed that short-term loss of mechanical contact with the bed, following the local calving event in 1971, could explain both a near-instantaneous 2-fold increase in ice velocities over a large section of the ice shelf and a subsequent decrease once contact was re-established (Gudmundsson et al., 2016).
Recent GPS measurements of ice velocity have revealed an ongoing and spatially heterogeneous acceleration in the flow of the BIS since 2012 (Gudmundsson et al., 2016). The rapid propagation of a new rift immediately upstream of the MIR in October 2016 (Fig. 1b) has led to further changes in the velocity of the ice shelf. Known as the “Halloween Crack” this feature now extends to the northeast, partly decoupling the BIS from the SWGT (De Rydt et al., 2018). At the same time, an existing rift in the ice shelf, known as “Chasm 1” has been widening from a few centimetres per day at the tip to > 20 cm day−1 elsewhere (Fig. 1b). It is now over a kilometre wide at the southern edge of the ice shelf, and its tip is propagating north towards the MIR at varying rates of up to 4 km yr−1, with occasional episodes of rapid propagation controlled by the heterogeneous internal structure of the ice shelf (De Rydt et al., 2018; King et al., 2018). When this reaches the MIR or connects with the Halloween Crack it is expected that an iceberg will form and float away to the west. This will be the largest calving event on the BIS since the start of observations.
The first aim of this study was to describe past changes in ice sheet configurations in the Brunt Basin based on geomorphological interpretations of the bathymetry and subglacial topography. The second was to combine these data with surveys of ice shelf geometry to examine the present-day contact between the BIS and the McDonald Bank, to evaluate a range of future ice shelf configurations following the calving event including (1) a new steady state of the BIS in which it remains in contact with McDonald Bank; (2) a loss of contact followed by accelerated ice shelf flow and re-grounding; (3) the formation of an unpinned, but structurally viable, glacier tongue resulting from (temporary, or longer-term) loss of contact with the McDonald Bank; or (4) a catastrophic break-up resulting from the removal of buttressing coupled with a loss of structural integrity. These four different outcomes depend initially on the direction of propagation of Chasm 1, more precisely, whether Chasm 1 propagates to a point at or downstream of the MIR, thereby maintaining contact between the ice shelf and the bed, or joins the Halloween Crack upstream of the MIR, potentially unpinning the BIS from the McDonald Bank. Model predictions based on the present-day stress distribution of the ice shelf suggest a future pathway that leads directly to the centre of the MIR (De Rydt et al., 2018).
Critical to differentiating between these outcomes is determining the nature and geometry of the contact between the sea floor and the base of the ice shelf. Here we use a range of geophysical data to build an understanding of the regional sea-floor bathymetry and subglacial topography, including under the floating ice of the BIS and SWGT and their grounded ice sheet catchments. We combine this with measurements of current ice shelf geometry. This includes digital elevation models (DEMs) to define the area of the MIR and derive estimates of the ice shelf draft, focusing on ice shelf flow lines upstream of the MIR. These provide the basis for an analysis of the current interaction between the ice shelf and the bed, and of the future development of the ice shelf following the calving event.
2.1 Bathymetry and subglacial topography
In open water areas, the seabed bathymetry was derived from compilations of ship-based multibeam and single-beam bathymetric data (presented in Hodgson et al., 2018) combined with the International Bathymetric Chart of the Southern Ocean (IBSCO; Arndt et al., 2013).
In inaccessible areas that are covered by the ice shelf, the seabed bathymetry was derived from bathymetric measurements from historical ship tracks inland of the present ice front, which is currently at its most advanced position since 1915 (Anderson et al., 2014). Further bathymetric control was provided by 38 seismic data points acquired from the surface of the ice shelf described in Hodgson et al. (2018). These were combined with new estimates of bathymetry from gravity and magnetic data from aerogeophysical surveys in 2017 (Fig. 3). Where the ice sheet is grounded, airborne radio echo-sounding depth data from BEDMAP2 (Fretwell et al., 2013) and the 2017 aerogeophysical survey were used. The revised directly measured bathymetric and topographic dataset used in this study is available online (Hodgson et al., 2019).
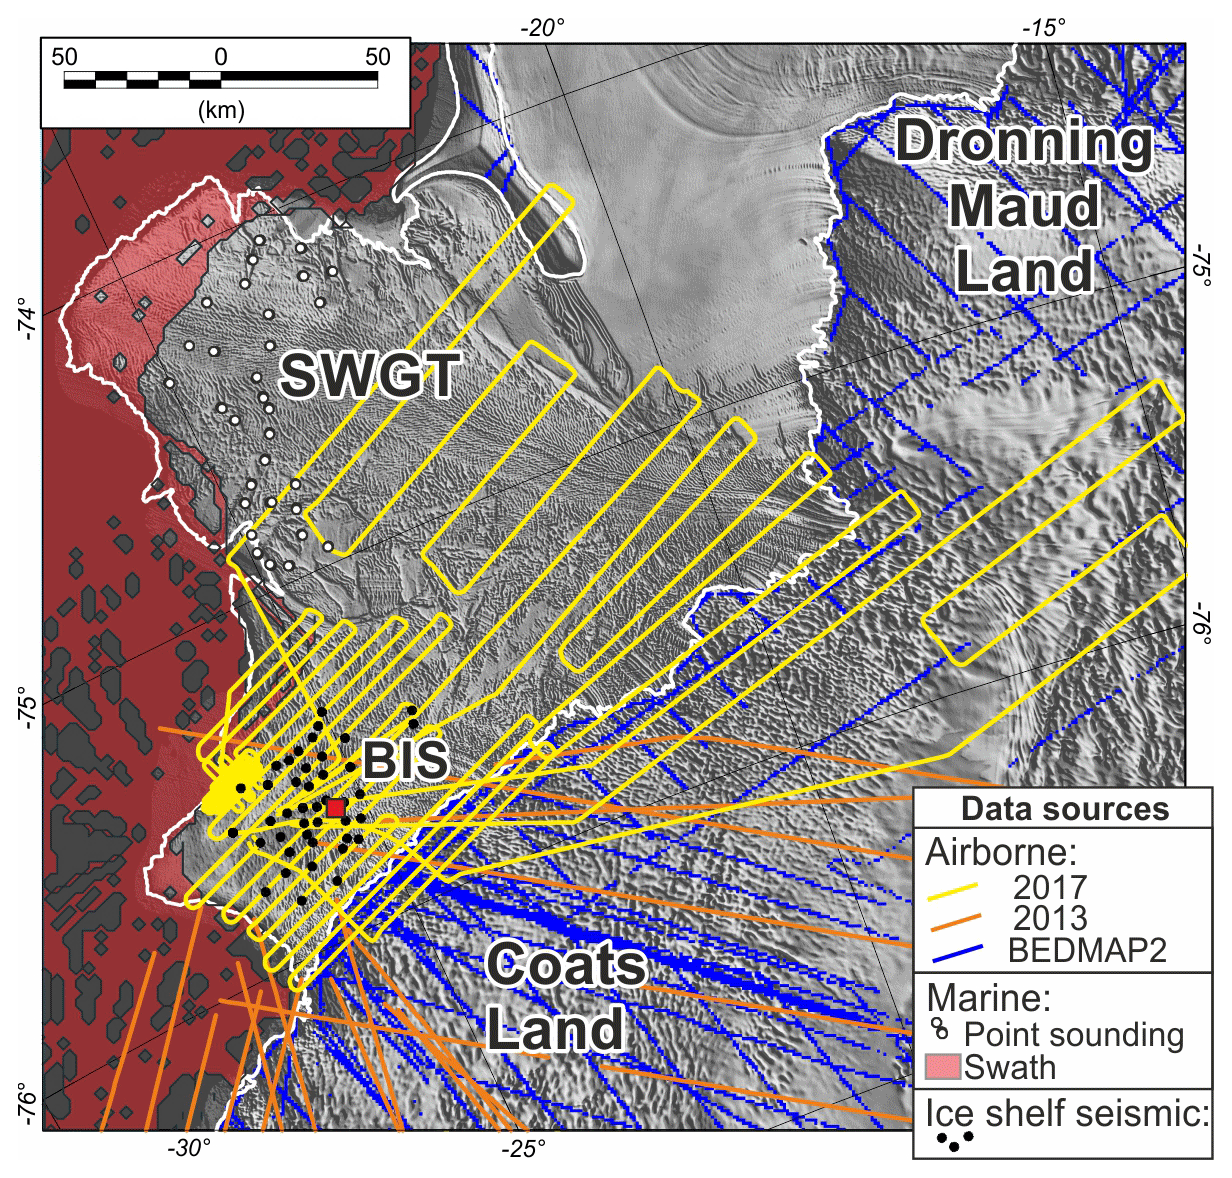
Figure 3Data locations overlain on MODIS Mosaic of Antarctica 2008–2009 (MOA2009) satellite image (Haran et al., 2014). Yellow lines indicate 2017 aerogeophysical flights collecting radar, gravity, and magnetic data. Red shading indicates swath bathymetry data coverage. Blue lines mark radar depth determinations from BEDMAP2 (Fretwell et al., 2013). Orange lines mark the location of ICEGRAV 2013 radar and gravity data (Forsberg et al., 2017). Black dots mark seismic determinations of water column thickness under the Brunt Ice Shelf (Hodgson et al., 2018). The white dots mark soundings from historical ship tracks acquired when the ice front of the Stancomb-Wills Glacier Tongue was less-advanced. The white line marks the grounding line/ice shelf edge from the 2013 Antarctic Digital Database. The red square marks the approximate location of Halley VIa Station.
Inversion of gravity data reveals the sub-ice shelf bathymetry based on the large density contrast at the water–rock interface (Cochran and Bell, 2012). However, shallow geological factors such as sedimentary basins or dense intrusions can give rise to gravity anomalies with the same amplitude and wavelength as the bathymetry, making direct inversion challenging (Brisbourne et al., 2014). By integrating gravity and aeromagnetic data to constrain the subsurface geology, we have developed a procedure to provide the most reasonable estimate of the sub-ice shelf bathymetry in otherwise un-surveyed areas. Gravity data are from a “strapdown” type of sensor which provides a resolution of ∼6 km and root-mean-squared error of ∼1.8 mGal (Jordan and Becker, 2018). This was combined with regional data from previous surveys and compilations (Aleshkova et al., 2000; Forsberg et al., 2017; Jordan et al., 2017). Coincident aeromagnetic data were used to constrain the location and size of a large mafic intrusion (Jordan and Becker, 2018), which would otherwise have significantly distorted the inversion results. Both the integrated free-air compilation (Hodgson et al., 2019) and high-resolution line gravity data (Becker et al., 2018) are available online.
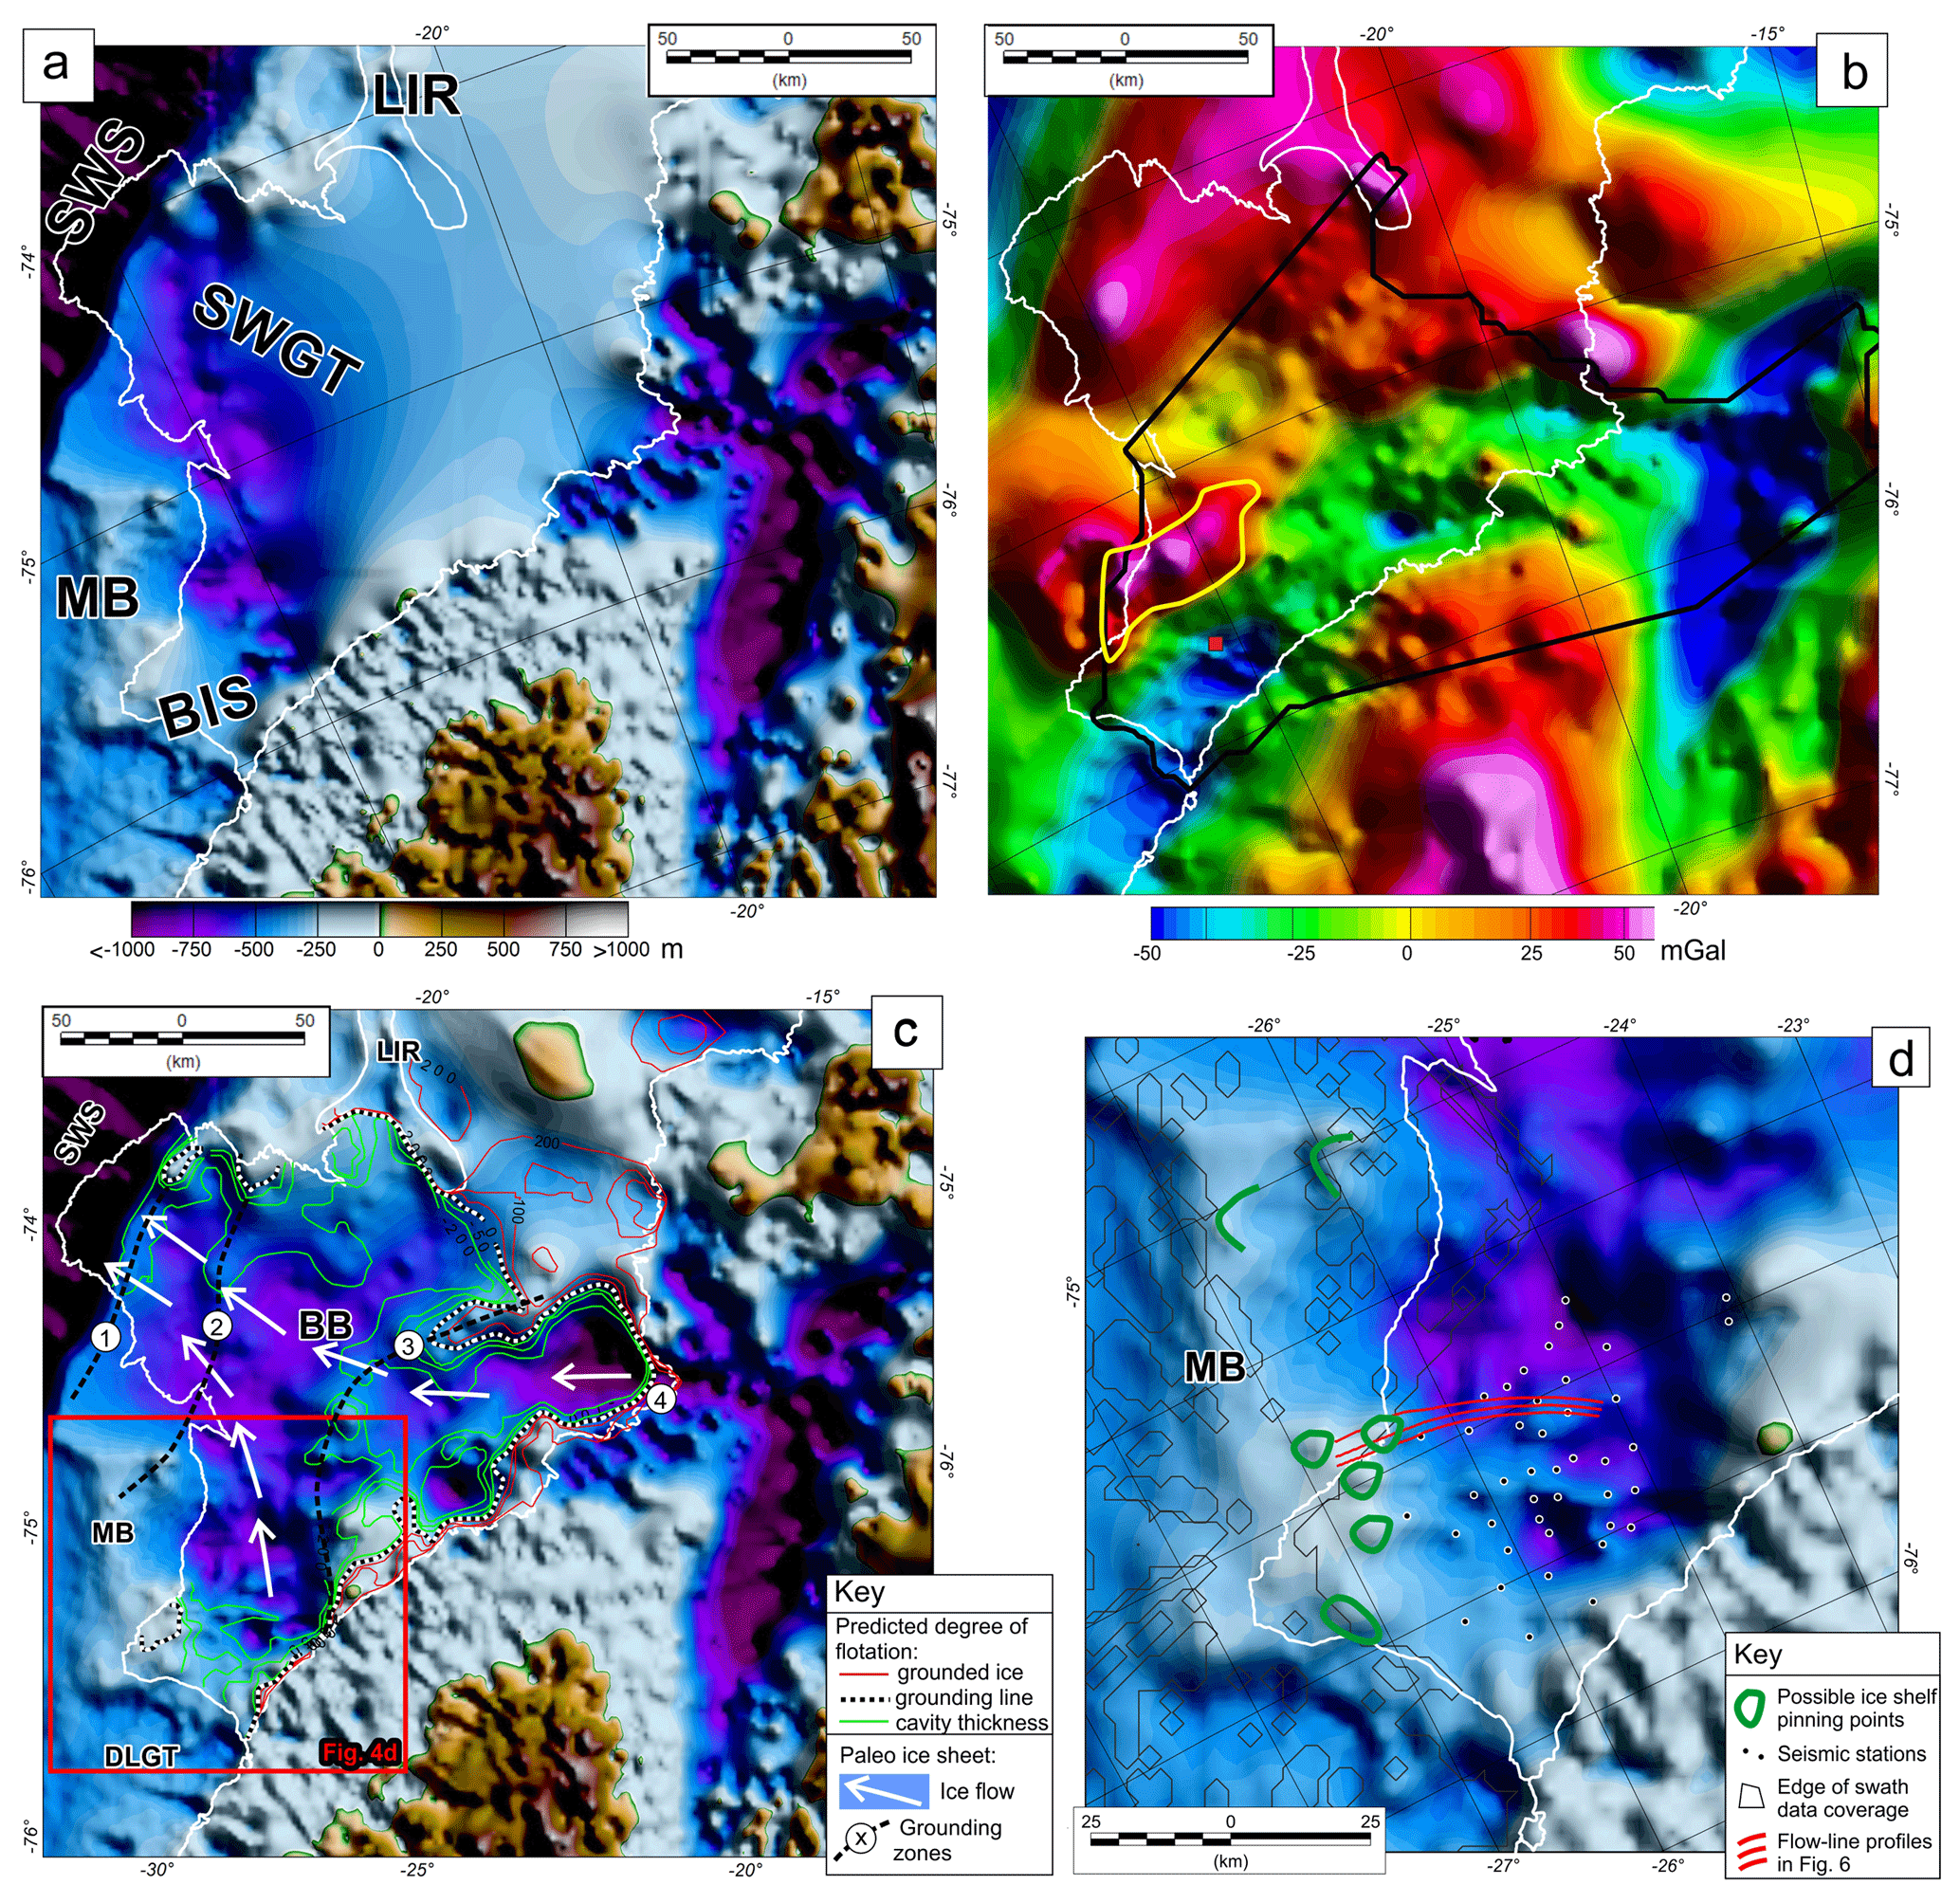
Figure 4Revised topography beneath the Brunt Ice Shelf and Stancomb-Wills Glacier Tongue. (a) Topography derived from direct observations including swath bathymetry offshore and in areas historically accessible to ships during past calving events, seismic depth sounding of the ice shelf, and radar depth sounding over the grounded ice sheet. (b) Free-air gravity anomalies. Data inside black outline from new strapdown gravity data set (Becker et al., 2018). Regional data from the ICEGRAV 2013 survey (Forsberg et al., 2017) and previous regional compilations (Jordan et al., 2017). Note gravity “high” outlined in yellow attributed to a large mafic intrusion based on gravity and magnetic signatures (Jordan and Becker, 2018). (c) Integrated bathymetric model including additional constraints from gravity data beneath the ice shelf. Black and white contour is the predicted grounding line. Red contours show areas predicted to be grounded by ice 50, 100, or 200 m deeper than the calculated bed. Green contours show 50, 100, and 200 m predicted cavity thicknesses. Probable orientations of past grounded ice flow are indicated by white arrows. Inferred former grounding lines based on mapped topographic highs are marked by numbered black dashed lines (1–3) together with the current grounding line (4). (d) Details of the topography beneath the Brunt Ice Shelf. Red lines mark the position of flow lines plotted in Fig. 6. Black dots show seismic stations and thin black lines mark edges of swath bathymetric data coverage. Green circles and crescent-shaped lines indicate possible past and present pinning points. Abbreviations are LIR (Lyddan Ice Rise), SWS (southern Weddell Sea), MB (McDonald Bank), SWGT (Stancomb-Wills Glacier Tongue), BIS (Brunt Ice Shelf), BB (Brunt Basin), and DLGT (Dawson-Lambton Glacier Tongue).
Estimation of the sub-ice shelf bathymetry from the gravity data used a four-step procedure (for details see Supplement Sect. S1). First, to initiate the estimation we used interpolated grids of ice surface, sub-surface topography, and bathymetry from direct observations (Figs. 3 and 4a). The gravity effect of these surfaces was calculated and subtracted from the compiled free-air gravity anomaly (Fig. 4b) to give an estimated Bouguer anomaly. The second stage was to isolate the gravity signatures in the Bouguer anomaly due to bathymetry not described by direct observation. A low-pass (150 km) filter isolated signatures due to crustal thickness variations. A ∼50 mGal anomaly north of the location of Halley VIa Research Station (Fig. 4b) is interpreted from magnetic and gravity data to be a large mafic intrusion 80 km long, 30 km wide, and ∼6 km thick (Jordan and Becker, 2018). The gravity anomaly from this structure significantly distorts any bathymetric inversion. A 3-D gravity model of this body was therefore constructed. Both the long-wavelength crustal anomaly and the gravity model of the mafic intrusion were subtracted from the Bouguer anomaly. This provides a residual gravity anomaly due only to unmodelled variations in sub-ice shelf bathymetry and unmodelled upper crustal geology. The third stage of the topographic estimation process converts the residual gravity anomaly to variations in bathymetry using the Bouguer slab formula. Adding the calculated bathymetric variations back to the initial bathymetric grid gives a preliminary gravity-derived estimate of bathymetry. The fourth and final stage of the estimation process blends the bathymetry from the preliminary gravity estimate and the direct (seismic, swath, radar) observations. To do this the gravity-derived topography is forced to match observational point data where they are available and shifted to smoothly join with these well constrained areas, providing the best possible overall bathymetric model (Fig. 3). The final bathymetric model (Fig. 4c) retains uncertainties due to unmodelled geological structures away from direct bathymetric observations and should not be considered the result of a formal inversion; however, it reveals the broad structure of the sub-ice shelf bathymetry and subglacial topography.
Uncertainties arising from unknown and unmodelled geology are hard to quantify, as step 4 of the estimation procedure means the model always matches the direct bathymetric observations. One estimate of the errors due to geological factors can be made by looking at the difference between the initial gravity estimation of topography (step 3) and the direct observations. This reveals a symmetrical error distribution with ∼0 mean, a standard deviation of ∼175 m, which we attributed to unaccounted-for geological biases, and the long wavelength of the regional gravity data. This therefore represents a worst-case estimate of the expected error far from control points. Step 4 will have, in part, accounted for the impact of unknown geological features and hence reduced the overall error of the resulting estimated bathymetry. One alternative check is to compare predictions of ice shelf flotation, based on freeboard and an assumed ice shelf density, to the final estimated bathymetry (Fig. 4c). This reveals that the final bathymetry generally predicts the grounding line well. A key discrepancy is beneath the SWGT at 75∘ S, where flotation is violated by 50–100 m. We therefore consider ±100 m a reasonable minimum estimate of the error in the bathymetric estimate in this region. Northeast of the 2017 survey area, our new bathymetric estimate suggests a broad area of ice shelf should not be floating. We attribute this to a lack of high-quality gravity data coverage and/or actual observations of bathymetry, which would help constrain the impact of unmodelled underlying geological features.
In regions where both direct topographic–bathymetric observations and high-resolution gravity data are available (Fig. 4a and b respectively) major topographic structures, including the deep onshore basin and the trough beneath the BIS, are resolved as significant lows in the gravity data. This supports the use of gravity data to fill the intervening areas where no direct bathymetric measurements are available. Aeromagnetic data across the study area (Sect. S2) show a clear high-frequency signal beneath the main survey area. This suggests the geological basement is close to the surface, and a major thick sedimentary basin which could distort the results is not present. In addition, no clear 1:1 correlation between the inverted bathymetry and the underlying geologic (magnetic) fabric is seen. This supports the view that the bathymetry dominates any underlying geological signal. However, the northern part of topographic ridge 3 does appear to follow a relatively short-wavelength negative magnetic anomaly, indicating geological control of this structure. The more limited data coverage in this region (Fig. 3) makes further detailed discussion of the underlying geological origin of this feature problematic.
2.2 Ice shelf geometry
The surface topography of the ice shelf was measured using a high-resolution surface DEM derived from WorldView stereo imagery (De Rydt et al., 2018). A total of seven individual WorldView tiles with a horizontal resolution of 3 m and varying timestamps (20 October 2012 to 30 March 2014) were collated using (1) a surface velocity field from June 2015 (De Rydt et al., 2018) to shift individual tiles to a common datum, (2) ground control points to fix the floating vertical coordinate, and (3) tidal corrections to correct vertical offsets. The data were subsampled onto a 30 m × 30 m grid and cross-calibrated with airborne lidar data from the 2017 airborne campaign (flight lines in Fig. 3) to obtain surface elevations above sea level. Although airborne radar measurements of ice shelf draft were available, it was difficult to accurately determine ice shelf draft with these methods. Instead, the ice shelf draft along selected flow lines was calculated based on assumptions of a floating ice column and the density profile of the ice to translate the freeboard into ice thickness. A common mid-point (CMP) survey of the top 30 m constrained the mean density in the firn pack to 750 kg m−3, and nominal ice densities of 920 kg m−3 were assumed below 30 m. These density estimates were applied uniformly across the ice shelf without local corrections for incorporated icebergs.
3.1 Bathymetry and subglacial topography
The subglacial topography and bathymetry show that the grounded ice occupies a complex bedrock terrain (Fig. 4c). There is a 1900 m deep trough beneath the Stancomb-Wills Glacier with subglacial catchments to the north, northeast, and south, each fed by multiple tributary valleys. In contrast, the terrain beneath the glaciers that discharge into the BIS consists of a series of small northwest-oriented troughs that are on a bedrock surface, which generally lies < 200 m below sea level.
A steep coastal slope marks the transition between grounded and floating ice masses (the black and white contour in Fig. 4c is the predicted grounding line). Downstream of this grounding line, the trough originating under the BIS is oriented south to north, whilst the trough originating beneath the SWGT is oriented east to west (orientations indicated by white arrows, Fig. 4c). Both troughs reach depths of 600–1200 m and merge into the Brunt Basin forming a single north-northwest-oriented 400–800 m deep basin that extends > 120 km into the southern Weddell Sea at 74∘ S. The Dawson-Lambton Ice Stream occupies a small glacial trough, which extends to the west under the DLGT (Fig. 4c).
A number of topographic highs occur in the Brunt Basin. Two of these are high enough to make contact with floating ice at the base of the SWGT around the Lyddan Ice Rise and at the base of the BIS forming the McDonald Ice Rumples (Fig. 1). Other topographic highs are present in the NNW-oriented part of the Brunt Basin under the SWGT, including a series of at least three transverse ridges on the flanks of the trough (marked as inferred grounding lines 1–3 in Fig. 4c). Our gravity-derived topography predicts these ridges are in contact with the base of the SWGT, which is not indicated by ice velocity or satellite imagery. Instead, we suggest that these ridges fall just short of the base of the ice. Two similar transverse ridges are seen at the present-day grounding line in the east–west-oriented part of the trough beneath the SWGT (marked as inferred grounding line 4 in Fig. 4c). We interpret these topographic highs as likely contact points, perhaps for both grounded ice retreating from its maximum extent (grounding line positions) and stabilisation points for subsequently floating ice (pinning points).
The McDonald Bank is well resolved, particularly off shore by the swath bathymetry and single-beam surveys (Fig. 4d). The east face of the McDonald Bank rises steeply from the Brunt Basin (Figs. 4d and 6). The upper surface of the bank is relatively flat but has a number of smaller-scale topographic highs, reaching a minimum depth of ca. 212 m below sea level. Some of these appear to be crescent-shaped (indicated in green, Fig. 4d).
3.2 Ice shelf geometry
The satellite images (Fig. 1) and DEM (Fig. 5) show the heterogeneous nature of the ice shelf. The main distinction is between those parts of the ice shelf supplied by higher-velocity glaciers and ice streams and those supplied by the low-velocity ice of the inland ice sheet. The former supply the ice shelf with closely packed bands of incorporated icebergs, and the latter with icebergs that are more widely spaced. These icebergs are typically oriented with their long axis at 90∘ to the direction of ice flow (Figs. 1b, 5) (King et al., 2018).
The draft of the BIS was examined in detail along three flow lines (northern, central, and southern) upstream of the MIR (Fig. 6). The three flow lines follow the southern edge of a moderately closely packed band of incorporated icebergs within the ice shelf (Fig. 5). All three lines show an increase in ice shelf draft from 35 to 22 km upstream of the McDonald Bank. From 22 to 0 km the draft remains relatively constant. The base of the ice shelf is highly irregular, as a result of the keels of icebergs incorporated into the ice (King et al., 2018; Thomas, 1973).
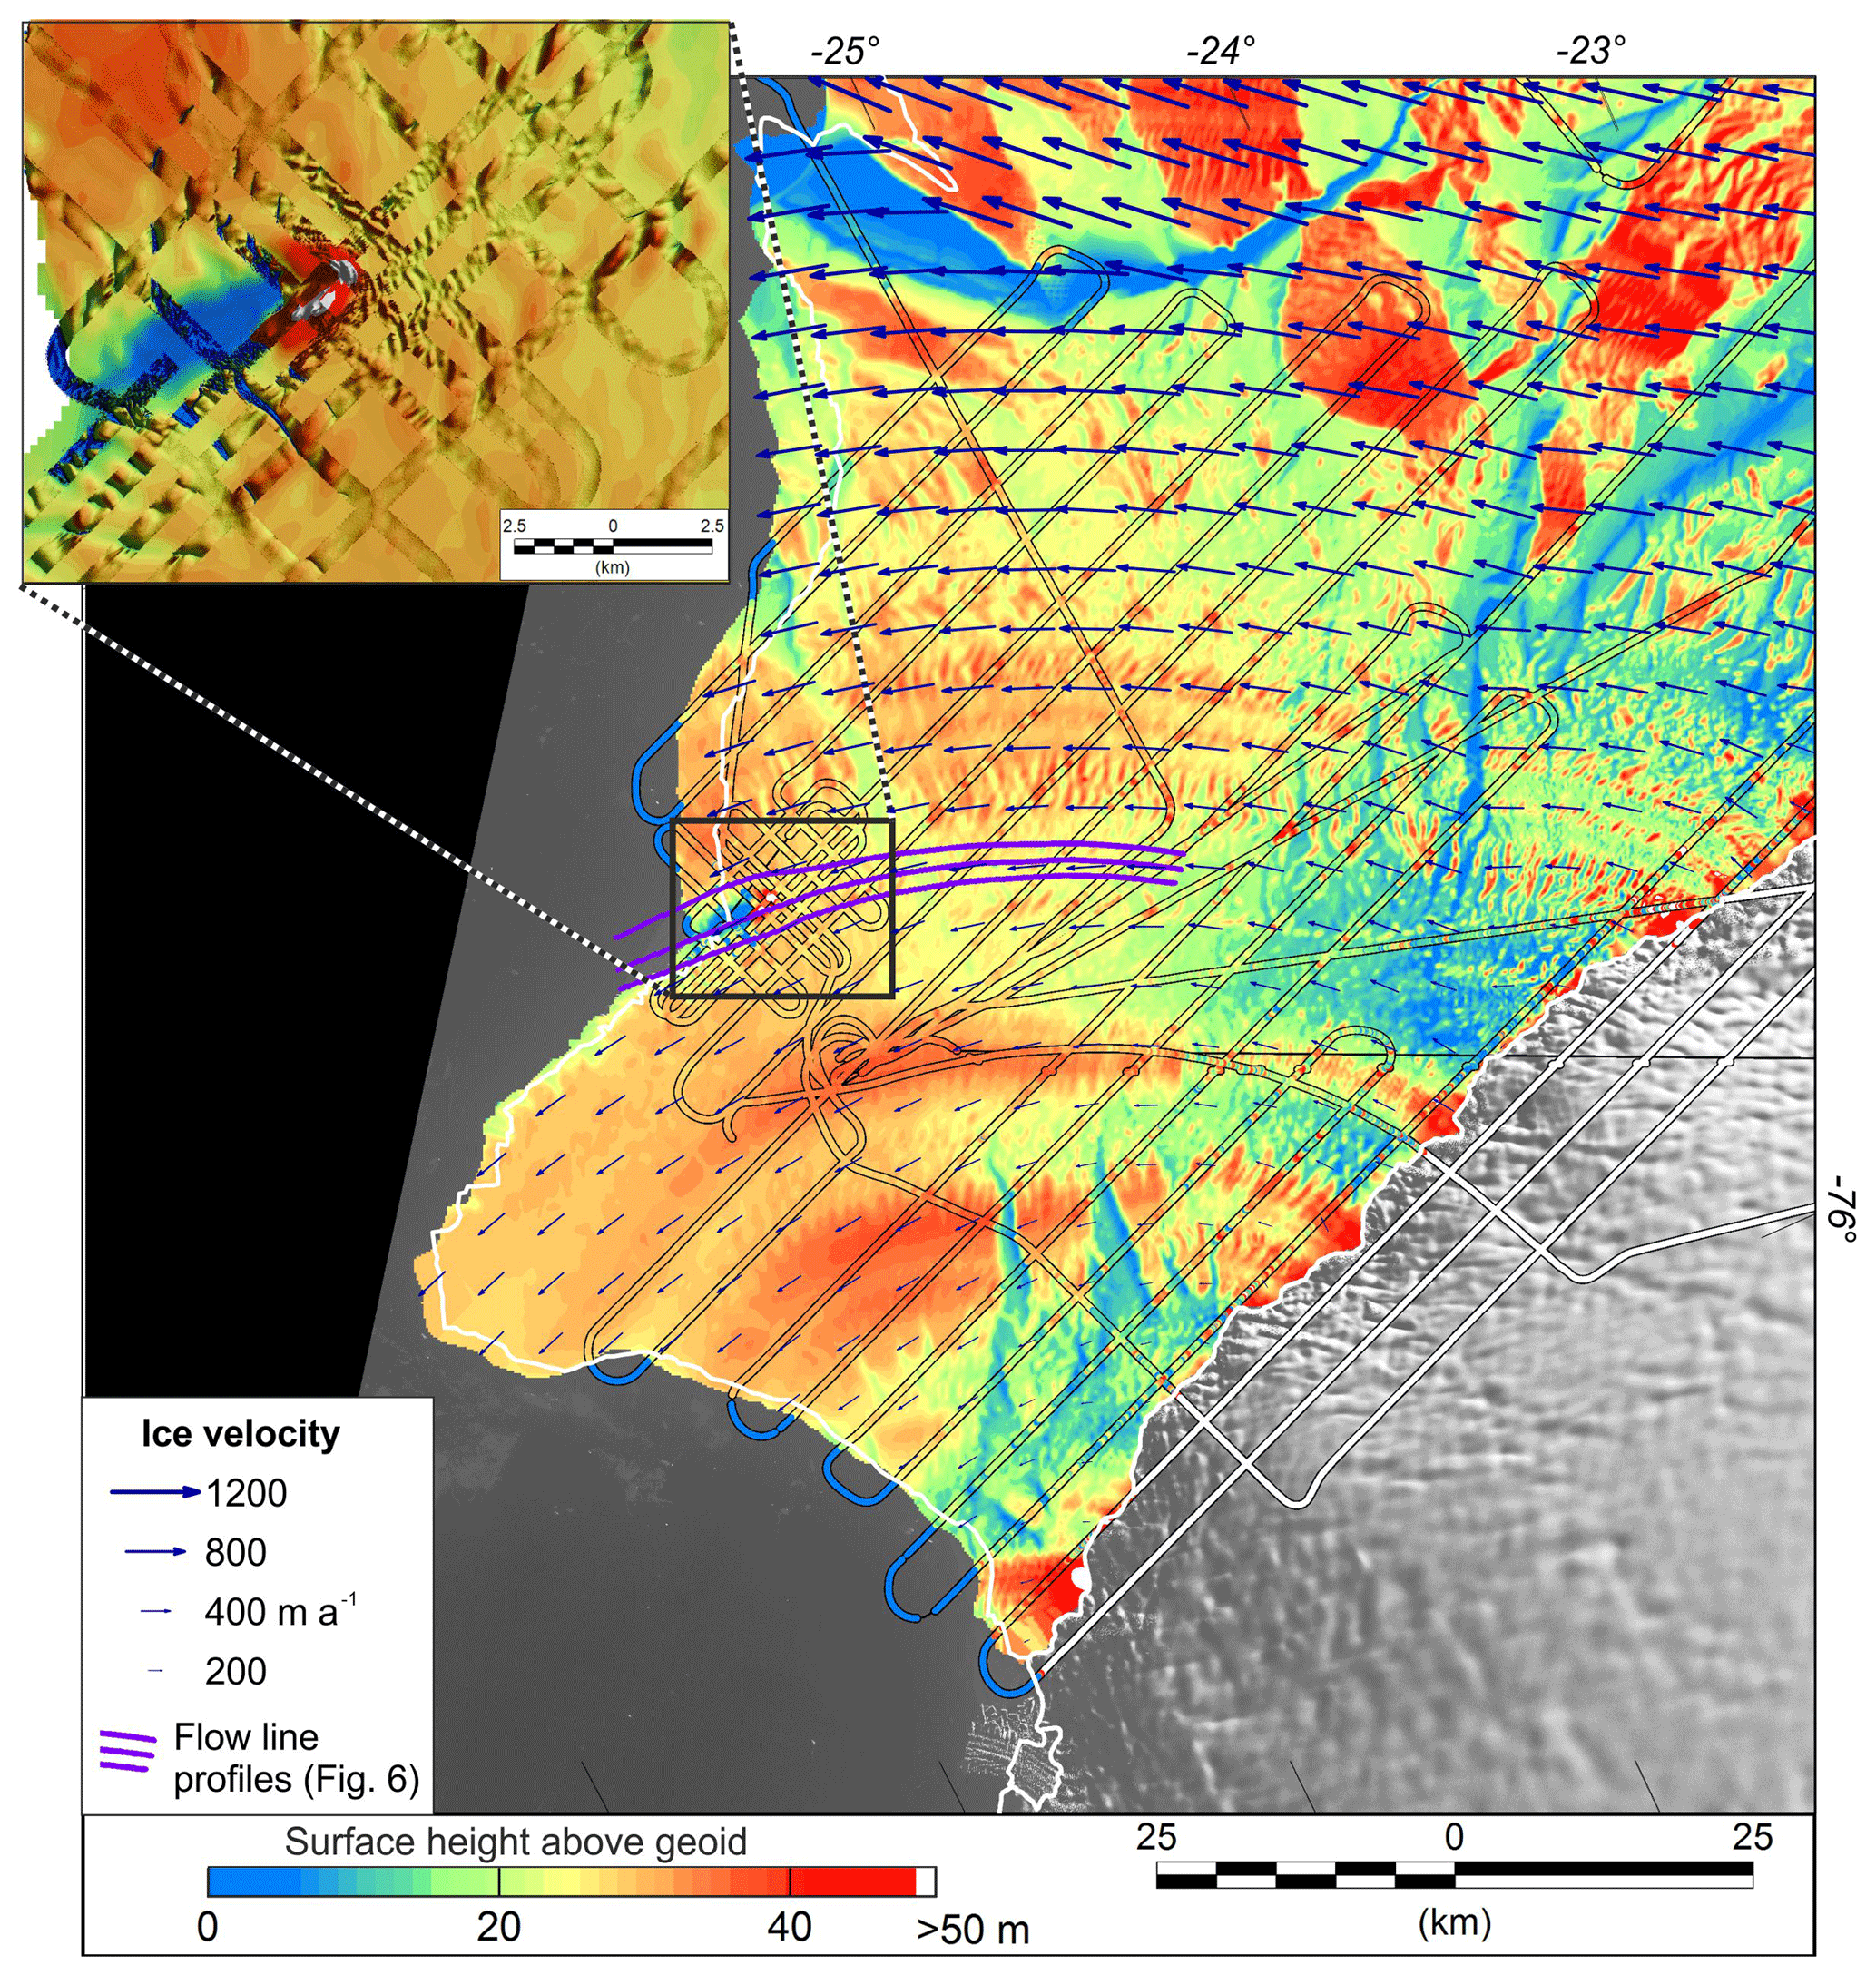
Figure 5High-resolution surface digital elevation model (DEM) from WorldView surface height above the geoid (subsampled at 250 m × 250 m) for December 2016. This is cross-calibrated with airborne lidar data from the 2017 airborne campaign referenced to WGS84, then corrected to the same reference grid as the DEM by applying the BEDMAP2 geoid correction to obtain surface elevations above sea level. The effective timestamp of the surface DEM is 15 January 2017. Survey flight lines are marked by thin black lines. The velocity field is represented by blue arrows, based on data from June 2015. Purple lines mark the position of the flow lines plotted in Fig. 6. The white line marks the grounding line/ice shelf edge from the 2013 Antarctic Digital Database. The background image is a Landsat 8 image from 28 January 2017. The inset shows details of surface topography over the MIR region. Colour shaded data mark the full lidar swath gridded at 10 m. Note the complex pattern of ridges upstream and fractures downstream from the peak elevations, which mark the MIR pinning point.
The highest point of the McDonald Bank was 212 m below sea level, measured on the southern flow line (Fig. 6). The precise ice shelf thickness at the McDonald Bank is difficult to resolve from the radar data as there was no clear expression of the bed due to interference from the complex topography of the MIR. However, the maximum draft of the iceberg keels along the three flow lines was 214 (northern), 214 (central), and 237 m (southern) below sea level, so the maximum potential overlap between the depth of the incorporated ice shelf keels and the depth of bed along all flow lines ranged from 2 to 25 m.
The DEM analysis of the MIR shows that the area of deformation caused by contact between the base of the ice shelf and the McDonald Bank is limited to an area of less than 1.3 to 3 km2 (Fig. 5). Strain rates upstream of the MIR (Fig. 8 in De Rydt et al., 2018) show the compressive regime in the ice shelf resulting from grounding in 2015.
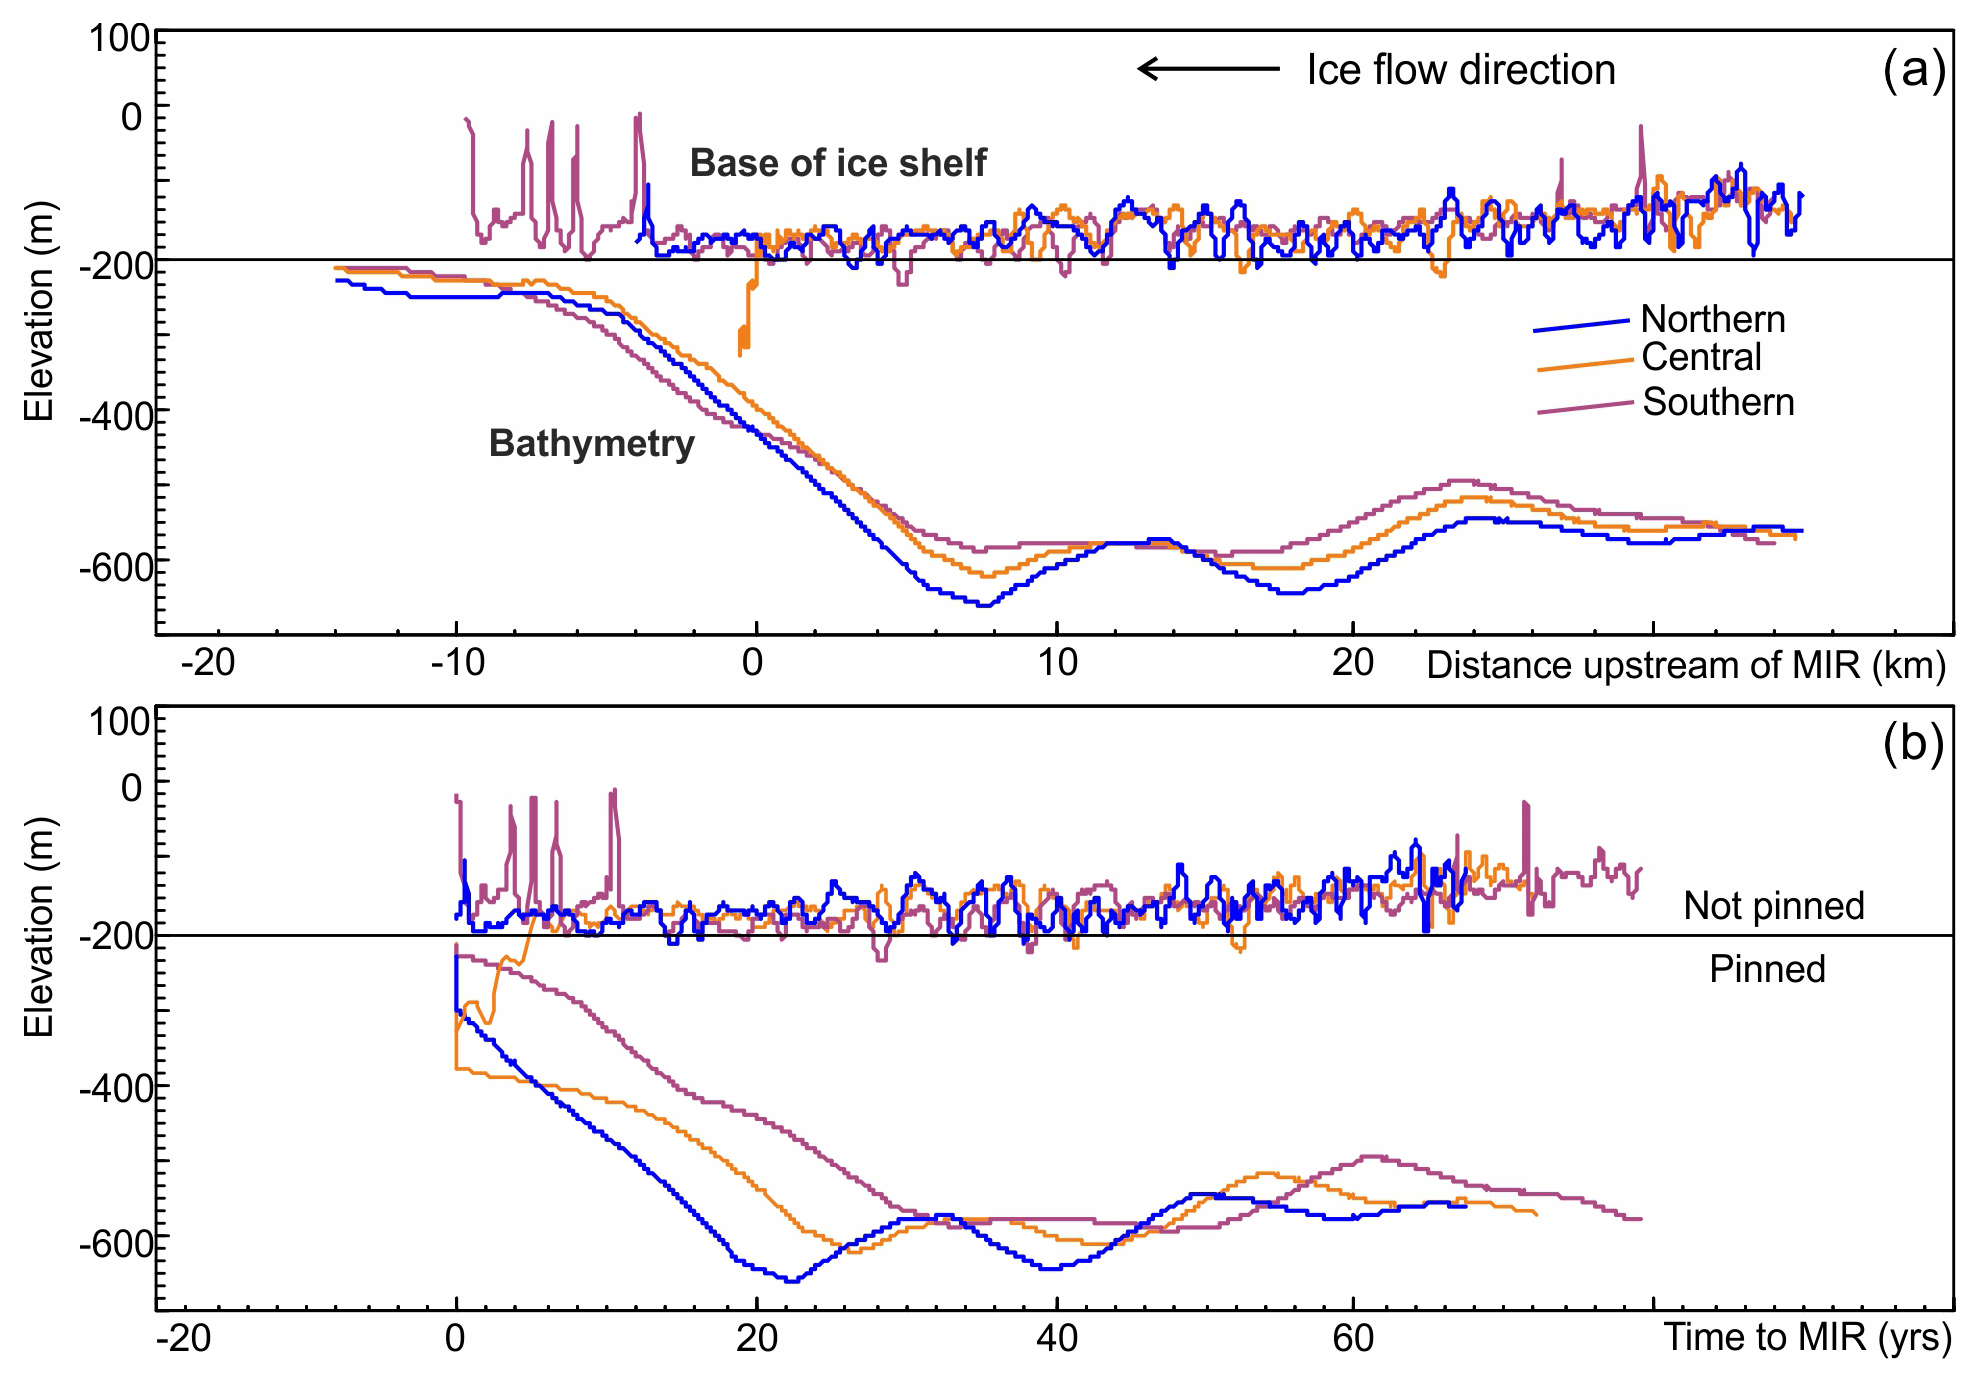
Figure 6Cross section of the McDonald Bank and the Brunt Ice Shelf showing ice shelf draft and bathymetry along three flow lines upstream of the MIR (the position of these flow lines is marked in Fig. 4d). The flow lines are plotted as a function of both (a) distance and (b) time from the McDonald Bank calculated from feature tracking between Sentinel-1 satellite images on 18 and 30 June 2015 (De Rydt et al., 2018). The horizontal line approximates the highest known point of the McDonald Bank. Where the ice shelf draft falls below the horizontal line we infer contact between the ice shelf and the bed; where it falls above the line the ice shelf will potentially become detached. This figure shows the significance of the iceberg keels in maintaining contact with the McDonald Bank. Note that the rapid increase in ice shelf draft in the “central” flow line approaching 0 km is considered a data anomaly, which may have resulted from the complex surface topography at the McDonald Ice Rumples.
4.1 Past ice sheet configurations
The bathymetry and subglacial topography provide sufficient evidence to propose a range of past ice configurations in the study area. The substantially overdeepened south-to-north-oriented trough under the BIS and east-to-west-oriented trough under the SWGT are the likely products of grounded ice streams which converged in the Brunt Basin (white arrows, Fig. 4c) and presumably discharged westwards towards the Filchner Trough at glacial maxima. At these times, glacial depositional processes operating between the ice streams occupying Filchner Trough and the Brunt Basin likely formed the layered glacial sediments of the McDonald Bank interpreted from seismic surveys (Elverhøi and Maisey, 1983). Although seismic lines at different orientations are required to fully characterise the internal architecture and processes forming this deposit, the line drawings based on sparker seismic source data presented by Elverhøi and Maisey (1983, Profile 5, p. 486) suggest the layered glacial sediments dip westwards into the Weddell Sea. At least two of these layers (Units 1 and 2) were interpreted as being of glacial origin, although whether they are glaciomarine sediments, till and/or glacially compacted glaciomarine sediments cannot be determined. These layers have subsequently been truncated along the steep eastern slopes of the McDonald Bank, presumably by erosive ice advances along the south-to-north-oriented trough under the BIS. The relatively flat top of the McDonald Bank may be the product of glacial planation processes by ice shelves during, and either side of, peak glacial conditions.
During the development of interglacial conditions, it is reasonable to assume that the ice stream occupying the south-to-north-oriented trough under the BIS was starved of ice. We attribute this to the relatively small northwest-oriented glaciers in its catchment being largely < 200 m below sea level and therefore susceptible to progressive isolation from the deep troughs of the inland ice sheet. Instead, we suggest that most of the regional ice flow progressively followed the deep trough under the Stancomb-Wills Glacier, channelling ice from several north-, northeast-, and south-oriented subglacial catchments before discharging it west into the Brunt Basin and then north-northwest towards the southern Weddell Sea.
The topographic highs and ridges at, and just south of, the 74∘ S parallel, and at the 75∘ S parallel (labelled 1–3 in Fig. 4c) mark at least three potential former potential grounding line positions. These are similar to transverse ridges and other topographic highs at the present-day grounding line (labelled 4 in Fig. 4c). These inferred grounding lines are separated by deep trough basins, so it is reasonable to assume that during deglaciations the ice sheet stepped back through a series of grounding lines at these topographic highs.
Following grounding line retreat, floating ice likely occupied the Brunt Basin, as it does today. In this configuration, the various topographic highs associated with the highest parts of the transverse ridges and former grounding lines and the McDonald Bank would have formed potential pinning points for advancing ice shelves and glacier tongues. Most of these features fall just short of the base of the ice. Although the McDonald Bank has a relatively flat top, contact between the ice and the bed can be inferred from evidence of smaller-scale surface topography, including the poorly resolved crescent-shaped features (Fig. 4d). The latter may be ice-push moraine complexes formed where dense aggregations of deep keels from icebergs incorporated into the ice shelf from upstream glacial troughs have grounded on the bank.
As the BIS continued to thin, the topographic highs on the McDonald Bank would have provided the last potential pinning points and frontal buttressing of advancing ice. In its present configuration, only one of these is high enough (ca. 212 m below sea level) to maintain contact with the base of the BIS at the MIR. In contrast, the SWGT is neither thick nor extensive enough to ground on the McDonald Bank but may benefit from lateral buttressing from the Lyddan Ice Rise to the northeast and from the McDonald Bank during periods when it is coupled with the BIS (it is presently decoupled by the Halloween Crack; De Rydt et al., 2018). The DLGT is also not thick enough to ground on the grounding zone wedge at the seaward end of the Dawson-Lambton trough, although its internal architecture suggests grounding in the past and the presence of a frontally buttressed ice shelf (Hodgson et al., 2018).
4.2 Contact between the Brunt Ice Shelf and the bed
Satellite images and aerial photographs show that the MIR have changed in their extent and morphology at different times in the recent past. This can be interpreted as an indicator of periodic thinning and at least partial loss of contact with the bed resulting from changes in ice shelf draft and minor calving events (see Bindschadler, 2002). The BIS has significant local thickness variations. This means that along any flow line the ice shelf draft varies considerably. This is due to a combination of the presence of incorporated iceberg keels, initial ice thickness close to the grounding line, changes in mass balance from accumulation of snow on the surface, basal accretion of marine ice, compression along the flow line from the McDonald Bank, ice velocity, and local flow divergence. Below, we consider how these influence the draft of ice shelf approaching the MIR.
Changes in mass balance from snow accumulation and accretion of marine ice can be estimated from meteorological records and published over-snow radar surveys of the internal structure of the ice shelf (King et al., 2018). Meteorological records show a mean snow accumulation rate (Halley Station data from 1972 to 2017) of 90 cm yr−1 (range of 48–149 cm). King et al. (2018) have shown that the addition of this snow and firn accumulation drives the incorporated meteoric icebergs below sea level and explains the increase in the ice shelf draft away from the grounding line (Fig. 6). From this point (22 km upstream of the MIR) there is no further downstream increase in ice shelf thickness that can be attributed to firn accumulation or the accretion of marine ice or other processes such as compression (Fig. 6). This may be due to lateral spreading under gravity, temporal changes in the stress regime as the ice shelf goes through phases of well-buttressed and lightly buttressed conditions, or basal melting. The latter is likely to be of limited magnitude (< 0.5 m yr−1) based on measurements of seawater temperatures under the Riiser-Larsen Ice Shelf immediately to the north of the Lyddan Ice Rise (Gjessing and Wold, 1979). However, the sub-ice shelf bathymetry presents no substantial barriers to the future penetration of warm circumpolar deep water that has been predicted, by one model, in the second half of the 21st century (Hellmer et al., 2012).
The ice shelf flow line analysis shows no evidence of upstream thickening of the ice shelf resulting from buttressing (Fig. 6), although the modelling suggests that the compressive regime is felt at least 70 km upstream of the MIR (De Rydt et al., 2018). Analysis of the strain rate patterns using ice velocities shows that outside of the local area of compression, most of the ice shelf is moving in similar directions at similar velocities with thinning rates of less than 1 m yr−1 as a result of flow divergence (Fig. 8 in De Rydt et al., 2018). However, this thinning signal is largely offset by surface accumulation. Thus, from at least 22 km upstream of the MIR there are no overall trends in thickness resulting from natural ice shelf evolution down the flow line (Fig. 6).
The flow line analysis also shows that the base of the ice shelf is highly heterogeneous as a result of the incorporated iceberg keels. Maximum keel depths along our flow lines ranged from 214 (northern and central) to 237 m (southern). This supports ice-penetrating radar analysis of the internal architecture elsewhere on the ice shelf that shows keels ranging between 175 and 250 m in depth interspersed with thinner sections of ice shelf formed by accumulated sea ice and seawater-saturated firn, snowfall, and drift (Fig. 4 in King et al., 2018). At least some of the cracks and chasms downstream of the MIR may be the expression of the differential strain experienced during the grounding then release of the incorporated icebergs, versus the intervening brine and firn sections of ice shelf (this is most apparent downstream of the MIR on the northern side; see Fig. 2 in King et al., 2018).
Collectively the ice shelf geometry analyses suggest that the distribution and depth of the incorporated iceberg keels are key to determining the future grounding potential of the ice shelf it flows towards and around the MIR. Their distribution can be inferred from the surface topography and ICESat data (Fig. 5), as well as Sentinel-1 satellite radar images (King et al., 2018). This shows areas on flow lines upstream of the MIR where the icebergs are more widely spaced or have shallower keels that could fail to make contact with the McDonald Bank (Fig. 6).
4.3 Future evolution of the Brunt Ice Shelf
The future integrity of the BIS depends not only on the physical properties of the ice, which are poorly understood, but also on whether it remains grounded on the McDonald Bank. In the immediate future, this will be determined by the direction of propagation of the tip of Chasm 1, the dynamics and geometry of the expected calving event, and the subsequent response of the remaining ice shelf. We consider four scenarios below.
-
Chasm 1 propagates to, or downstream of, the MIR and the BIS remains pinned to the McDonald Bank following the calving event. In this scenario, a new steady state will persist as long as the ice draft and keels are deep enough to maintain contact with the bed. This situation has persisted since the establishment of Halley Research Station on the ice shelf in 1956 and has included the short-term loss and reestablishment of mechanical contact with the bed, following a small local calving event in 1971, However, the DEM surface topography (and ICESat data) shows large variations in the distribution of the incorporated icebergs (Fig. 5) and the ice shelf draft upstream of the MIR (Fig. 6), which can be used to determine if the grounding will be maintained in future. For example, there are currently portions of the ice shelf, due to reach the MIR 4–12 years from 2017 that may have insufficient draft to ground, with no keels extending below −200 m. At this time the ice shelf might be more prone to reduced, or loss of, contact (Fig. 6b).
-
Chasm 1 propagates to, or upstream of, the MIR, and the BIS temporarily loses contact with the bed, but then rapidly increases in velocity and re-stabilises. If Chasm 1 joins the Halloween Crack at or upstream of the McDonald Bank, then contact with the bed will be reduced or lost following the calving event. In this scenario an immediate increase in the velocity in the ice shelf might be anticipated as a result of the removal of buttressing (Gudmundsson et al., 2016). This “surge” could result in a re-grounding on the McDonald Bank and re-stabilisation of the ice shelf.
-
Chasm 1 propagates upstream of the MIR, the BIS loses contact with the bed, and this un-grounded state persists for a sufficient period that the ice shelf essentially becomes an unpinned glacier tongue, which may or may not extend beyond the McDonald Bank, but does not re-ground. The analogue for this scenario is the SWGT, which has maintained a degree of structural integrity in the absence of frontal buttressing (Fig. 1a) but experiences large calving events at the ice front. The SWGT extends more than 200 km from the grounding line; if BIS were to follow this scenario it could advance forward, and potentially re-ground on topographic highs elsewhere on the McDonald Bank (including at the location of the MIR), but the timescale for a re-grounding remains highly uncertain.
Under scenarios 1–3 the presence of the large iceberg calved from the BIS poses an additional threat to the integrity of the remaining parts of the ice shelf through iceberg collision. This hypothesis was considered by Anderson et al. (2014) with respect to a calving event on the SWGT.
In this scenario, Chasm 1 propagates upstream of the MIR, the BIS loses contact with the bed, and the subsequent increase in velocity is not extensive enough for the ice shelf to reconnect with the bed but is sufficient to increase strain rates to a level at which further fractures across the ice shelf are likely. This more widespread collapse would likely be influenced by the internal structural properties inherited at the grounding line (King et al., 2018). Observations show that these have resulted in occasional episodes of fast crack propagation (De Rydt et al., 2018), and inverse and forward modelling results suggest vulnerability to destabilisation by relatively rapid changes in the ice mélange properties, resulting from the interaction of its marine ice component with ocean water, or by the further propagation of a frontal rift (Khazendar et al., 2009). The local analogues for a more widespread collapse scenario are the DLGT, which is a glacier tongue that is subject to frequent calving events (Fig. 2c), and the ice margin south of the BIS that calves directly into the Weddell Sea (Fig. 2d).
Although the outcome of the calving of the ice shelf is not yet known, these four potential scenarios all show the importance of understanding the geometry of the ice shelf and the bed. Which of the four scenarios will transpire depends, at least in part, on whether the ice shelf is able to remain in contact with one of the topographic highs on the McDonald Bank. Whilst the depth of the topographic highs is fixed, the contact between the ice shelf and the bed depends on a number of variables. These include the short-term development of the ice shelf flow regime following calving and its impact on ice shelf draft (e.g. lateral spreading) and structural integrity (e.g. development of further rifts resulting from changes in the strain rate). They also include the long-term influences of processes at the grounding line, such as the thickness and velocity of ice flowing across the Brunt Icefalls, which determine the spacing and depth of the iceberg keels.
The ice dynamics of the BIS and SWGT glacier catchments have evolved from widespread occupation by grounded ice streams (during glacial periods) to a retreat of grounded ice through several inferred grounding line positions (during deglaciation), followed by the development of floating ice forming both buttressed ice shelves (BIS) and glacier tongues (SWGT, DLGT). In the former case, buttressing has occurred where the ice has been thick enough to maintain contact with topographic highs in the seabed.
The BIS has maintained its overall structural integrity since it was first observed in 1915, despite experiencing several periods of fast flow (Simmons and Rouse, 1984), fracturing, and episodic calving events along its ice front (Anderson et al., 2014). This relative stability can be attributed to its (at least intermittent) grounding on the McDonald Bank.
Although situated in a region of Antarctica that is not presently experiencing a rapid increase in atmospheric temperature or a known intrusion of circumpolar deep water, the BIS has nonetheless entered a period of rapid change (De Rydt et al., 2018), marked by the rapid propagation of rifts that will likely result in the largest calving event since observations began. Being composed of icebergs fused together by sea ice and accumulated snow, its internal structure differs from most other Antarctic ice shelves, and hence its dynamics are more difficult to predict. Specifically, it is not yet known if the ice shelf will lose contact with the bed and how it will respond after the calving event. Based on the history of different ice sheet configurations and the geometry of the ice shelf and the seabed, we have outlined four scenarios that might occur following the expected calving event, which will occur as Chasm 1 progresses north. These scenarios range from a re-stabilisation of the BIS to a more widespread collapse.
Priorities for future work on the BIS include (1) continued assessment of changes in the flow velocity and compressive regime in the ice shelf resulting from un-grounding at the MIR; (2) use of radar data to examine changes in ice shelf draft resulting from compression and changes in mass balance (firn and snow accumulation and marine ice accretion); specifically, modelling the balance between accumulation and lateral spreading under different grounding scenarios; (3) calibration and refinement of the geometry data by direct measurements of sea-floor bathymetry in new areas exposed by iceberg calving and measurements of ice shelf thickness and depth to the bed where the BIS meets the McDonald Bank (with access through sea ice in the Halloween Crack and Chasm 1); (4) further measurements to assess the different material properties of incorporated icebergs versus the intervening areas of sea ice and accumulated snow (temperature, viscosity, fracture toughness, etc.); and (5) an assessment of the future evolution of the ice thickness and draft from transient model runs with assumptions about the present and future calving events.
The data sets used in this paper are Hodgson et al. (2019) and Becker et al. (2018) which are available at the NERC Polar Data Centre (http://www.bas.ac.uk/data/uk-pdc, Hodgson et al., 2019).
The supplement related to this article is available online at: https://doi.org/10.5194/tc-13-545-2019-supplement.
All authors contributed to the writing of the paper. Bathymetry data were acquired and processed by DH, TJ, PF, KH, AS, SS, and DB. Data on ice shelf geometry were acquired and processed by JDR, TJ, and PF. DAH and AJ contributed equally to this work.
The authors declare that they have no conflict of interest.
We thank the British Antarctic Survey (BAS) Air Operations Team and airborne
survey specialists including Hugh Corr, Carl Robinson, and Ian Potten. We thank Hilmar Gudmundsson (BAS and Northumbria University) for management of data
acquisition on the Brunt Ice Shelf and Ed King (BAS) for discussions on its
internal structure. Steve Colwell (BAS) provided snow accumulation and
temperature data. Laura Gerrish (BAS) prepared Fig. 1. This research
contributes to NERC grant NE/K003674/1 “Reducing the uncertainty in
estimates of the sea level contribution from the westernmost part of the East
Antarctic Ice Sheet”. Sarah Greenwood, the anonymous reviewer, and the editor Joe MacGregor are thanked for their constructive advice and
suggestions.
Edited by: Joseph MacGregor
Reviewed by: Sarah Greenwood and one anonymous referee
Aleshkova, N. D., Golynsky, A., Kurinin, R. G., and Mandrikov, V. S.: Gravity Mapping in the Southern Weddell Sea Region (Explanatory note for free-air and Bouguer anomalies maps), Polarforschung 67, 163–177, https://doi.org/10.2312/polarforschung.67.3.163, 2000.
Anderson, R., Jones, D. H., and Gudmundsson, G. H.: Halley Research Station, Antarctica: calving risks and monitoring strategies, Nat. Hazards Earth Syst. Sci., 14, 917–927, https://doi.org/10.5194/nhess-14-917-2014, 2014.
Arndt, J. E., Schenke, H. W., Jakobsson, M., Nitsche, F. O., Buys, G., Goleby, B., Rebesco, M., Bohoyo, F., Hong, J., Black, J., Greku, R., Udintsev, G., Barrios, F., Reynoso-Peralta, W., Taisei, M., and Wigley, R.: The International Bathymetric Chart of the Southern Ocean (IBCSO) Version 1.0 – A new bathymetric compilation covering circum-Antarctic waters, Geophys. Res. Lett., 40, 3111–3117, 2013.
Becker, D., Jordan, T. A., Corr, H., and Robinson, C. (Eds.): Strapdown gravity survey across the Brunt Ice Shelf (2017), UK Polar Data Centre, https://doi.org/10.5285/79e63097-f5dc-41ff-8ca5-36bc4f95a6ff, 2018.
Bindschadler, R. A.: History of lower Pine Island Glacier, West Antarctica, from Landsat imagery, J. Glaciol., 48, 536–544, 2002.
Brisbourne, A. M., Smith, A. M., King, E. C., Nicholls, K. W., Holland, P. R., and Makinson, K.: Seabed topography beneath Larsen C Ice Shelf from seismic soundings, The Cryosphere, 8, 1–13, https://doi.org/10.5194/tc-8-1-2014, 2014.
Cochran, J. and Bell, R.: Inversion of IceBridge gravity data for continental shelf bathymetry beneath the Larsen Ice Shelf, Antarctica, J. Glaciol., 58, 540–552, https://doi.org/10.3189/2012JoG11J033, 2012.
De Rydt, J., Gudmundsson, G. H., Nagler, T., Wuite, J., and King, E. C.: Recent rift formation and impact on the structural integrity of the Brunt Ice Shelf, East Antarctica, The Cryosphere, 12, 505–520, https://doi.org/10.5194/tc-12-505-2018, 2018.
Elverhøi, A. and Maisey, G.: Glacial erosion and morphology of the eastern and southeastern Weddell Sea shelf, in: Fourth International Symposium Antarctic Earth Science, edited by: Oliver, R. L., James, P. R., and Jago, J. B., Aust. Acad. of Sci., Adelaide, South Australia, 1983.
Forsberg, R., Olesen, A. V., Ferraccioli, F., Jordan, T. A., Matsuoka, K., Zakrajsek, A., Ghidella, M., and Greenbaum, J. S.: Exploring the Recovery Lakes region and interior Dronning Maud Land, East Antarctica, with airborne gravity, magnetic and radar measurements, Geological Society, London, Special Publications, 461, https://doi.org/10.1144/SP461.17, 2017.
Fretwell, P., Pritchard, H. D., Vaughan, D. G., Bamber, J. L., Barrand, N. E., Bell, R., Bianchi, C., Bingham, R. G., Blankenship, D. D., Casassa, G., Catania, G., Callens, D., Conway, H., Cook, A. J., Corr, H. F. J., Damaske, D., Damm, V., Ferraccioli, F., Forsberg, R., Fujita, S., Gim, Y., Gogineni, P., Griggs, J. A., Hindmarsh, R. C. A., Holmlund, P., Holt, J. W., Jacobel, R. W., Jenkins, A., Jokat, W., Jordan, T., King, E. C., Kohler, J., Krabill, W., Riger-Kusk, M., Langley, K. A., Leitchenkov, G., Leuschen, C., Luyendyk, B. P., Matsuoka, K., Mouginot, J., Nitsche, F. O., Nogi, Y., Nost, O. A., Popov, S. V., Rignot, E., Rippin, D. M., Rivera, A., Roberts, J., Ross, N., Siegert, M. J., Smith, A. M., Steinhage, D., Studinger, M., Sun, B., Tinto, B. K., Welch, B. C., Wilson, D., Young, D. A., Xiangbin, C., and Zirizzotti, A.: Bedmap2: improved ice bed, surface and thickness datasets for Antarctica, The Cryosphere, 7, 375–93, https://doi.org/10.5194/tc-7-375-2013, 2013.
Gjessing, Y. and Wold, B.: Absolute movements, mass balance and snow temperature of the Riiser-Larsenisen Ice Shelf, Antarctica, Norwegian Antarctic Research Expedition 1976/79, Publ. No. 50, Nor. Polarinst. Skr. 187, 23–31 1986.
Gudmundsson, G. H., De Rydt, J., and Nagler, T.: Five decades of strong temporal variability in the flow of the Brunt Ice Shelf, Antarctica, J. Glaciol., 63, 164–175, 2016.
Haran, T., Bohlander, J., Scambos, T., Painter, T., and Fahnestock, M.: MODIS Mosaic of Antarctica 2008–2009 (MOA2009) Image Map, Boulder, Colorado USA: National Snow and Ice Data Center, https://doi.org/10.7265/N5KP8037, 2014.
Hellmer, H. H., Kauker, F., Timmermann, R., Determann, J., and Rae, J.: Twenty-first-century warming of a large Antarctic ice-shelf cavity by a redirected coastal current, Nature, 485, 225–228, 2012.
Hodgson, D. A., Hogan, K., Smith, J. M., Smith, J. A., Hillenbrand, C.-D., Graham, A. G. C., Fretwell, P., Allen, C., Peck, V., Arndt, J.-E., Dorschel, B., Hübscher, C., Smith, A. M., and Larter, R.: Deglaciation and future stability of the Coats Land ice margin, Antarctica, The Cryosphere, 12, 2383–2399, https://doi.org/10.5194/tc-12-2383-2018, 2018.
Hodgson, D., Jordan, T., de Rydt, J., Fretwell, P., Seddon, S., Becker, D., Hogan, K., Smith, A., and Vaughan, D.: Gravity enhanced bathymetric model beneath the Brunt Ice Shelf and Stancomb-Wills Glacier Tongue [Dataset], UK Polar Data Centre, https://doi.org/10.5285/40bcedbe-fea0-4b41-b2f7-bf2d8494b5ad, 2019.
Jordan, T. A. and Becker, D.: Investigating the distribution of magmatism at the onset of Gondwana breakup with novel strapdown gravity and aeromagnetic data, Phys. Earth Planet. Int., 282, 77–88, 2018.
Jordan, T. A., Ferraccioli, F., and Leat, P. T.: New geophysical compilations link crustal block motion to Jurassic extension and strike-slip faulting in the Weddell Sea Rift System of West Antarctica, Gondwana Res., 42, 29–48, 2017.
Khazendar, A., Rignot, E., and Larour, E.: Roles of marine ice, rheology, and fracture in the flow and stability of the Brunt/Stancomb-Wills Ice Shelf, J. Geophys. Res. 114, F04007, https://doi.org/10.1029/2008JF001124, 2009.
King, E. C., De Rydt, J., and Gudmundsson, G. H.: The internal structure of the Brunt Ice Shelf from ice-penetrating radar analysis and implications for ice shelf fracture, The Cryosphere, 12, 3361–3372, https://doi.org/10.5194/tc-12-3361-2018, 2018.
Simmons, D. A. and Rouse, J. R.: Accelerating Flow of the Brunt Ice Shelf, Antarctica, J. Glaciol., 30, 377–380, 1984.
Swithinbank, C. W. M.: Glaciology. I. The morphology of the ice shelves of western Dronning Maud Land, Norwegian-British-Swedish Antarctic Expedition Scientific Results, 194, 9–52, 1957.
Thomas, R. H.: The dynamics of the Brunt Ice Shelf, Coats Land, Antarctica British Antarctic Survey Scientific Reports, 79, 1–47, 1973.
Worsley, F.: Track of Endurance 1914–15 in the Weddell Sea, Sketch Survey Map C8421, United Kingdom Hydrographic Office, 1921.