the Creative Commons Attribution 4.0 License.
the Creative Commons Attribution 4.0 License.
 | 17 Dec 2019
Validating modeled critical crack length for crack propagation in the snow cover model SNOWPACK
Jürg Schweizer
Mathias W. Rotach
Alec van Herwijnen
Observed snow stratigraphy and snow stability are of key importance for avalanche forecasting. Such observations are rare and snow cover models can improve the spatial and temporal resolution. To evaluate snow stability, failure initiation and crack propagation have to be considered. Recently, a new stability criterion relating to crack propagation, namely the critical crack length, was implemented into the snow cover model SNOWPACK. The critical crack length can also be measured in the field with a propagation saw test, which allows for an unambiguous comparison. To validate and improve the parameterization for the critical crack length, we used data from 3 years of field experiments performed close to two automatic weather stations above Davos, Switzerland. We monitored seven distinct weak layers and performed in total 157 propagation saw tests on a weekly basis. Comparing modeled to measured critical crack length showed some discrepancies stemming from model assumption. Hence, we replaced two variables of the original parameterization, namely the weak layer shear modulus and thickness, with a fit factor depending on weak layer density and grain size. With these adjustments, the normalized root-mean-square error between modeled and observed critical crack lengths decreased from 1.80 to 0.28. As the improved parameterization accounts for grain size, values of critical crack lengths for snow layers consisting of small grains, which in general are not weak layers, become larger. In turn, critical weak layers appear more prominently in the vertical profile of critical crack length simulated with SNOWPACK. Hence, minimal values in modeled critical crack length better match observed weak layers. The improved parameterization of critical crack length may be useful for both weak layer detection in simulated snow stratigraphy and also providing more realistic snow stability information – and hence may improve avalanche forecasting.
- Article
(912 KB) - Full-text XML
- BibTeX
- EndNote


Snow slab avalanches are hazardous and can threaten people and infrastructure. Each year, around 100 avalanche fatalities occur in the European Alps (Techel et al., 2016). Whether avalanche release is likely largely depends on snow layering, in particular the complex interaction between slab layers and a so-called weak layer (Schweizer et al., 2008). Such weak layers often form near or at the snow surface and, if subsequently covered by a snowfall, can sometimes persist throughout the season.
Dry-snow slab avalanches start with a failure in the weak layer resulting in a macroscopic crack. If this crack reaches a critical size, the crack will rapidly propagate outward (e.g. McClung and Schweizer, 1999; Schweizer et al., 2003a; van Herwijnen and Jamieson, 2007a), provided the tensile strength of the slab allows for crack propagation (Reuter and Schweizer, 2018). After crack propagation, the slab comes into frictional contact with the bed surface (Simenhois et al., 2012; van Herwijnen and Heierli, 2009), and slope angle mainly determines if an avalanche releases. Snow cover stratigraphy is thus considered an important contributing factor in avalanche forecasting (Schweizer et al., 2003a). To assess snow instability therefore requires information on the spatial distribution of slab and weak layer properties and how easily cracks form and propagate.
Snow stratigraphy information is traditionally obtained with manually observed snow profiles, where each layer is characterized by grain type, grain size, and hand hardness (Fierz et al., 2009). Manually observed snow profiles are often completed with snow stability tests (e.g. Schweizer and Jamieson, 2010). However, information on snow stratigraphy and snow stability are rare point observations which are very time consuming and sometimes dangerous to obtain. Numerical snow cover models can help increase the spatial and temporal resolution of information on snow stability (e.g. Lafaysse et al., 2013).
Crocus (Brun et al., 1992; Vionnet et al., 2012) and SNOWPACK (Lehning et al., 2002; Wever et al., 2015) are detailed snow cover models that also provide stability indices (Schweizer et al., 2006; Lehning et al., 2004; Vernay et al., 2015). The French model chain SAFRAN-SURFEX/ISBA-Crocus-MEPRA (S2M) predicts indices describing the avalanche danger at regional scale (Durand et al., 1999; Lafaysse et al., 2013). Crocus is driven with input of the meteorological model SAFRAN, and the stratigraphy on virtual slopes for a range of elevations and aspects is simulated. The expert system MEPRA combines various stability indices with a set of rules to evaluate the simulated snow stratigraphy in terms of stability classes and derives the avalanche danger (Giraud and Navarre, 1995). However, model predictions such as the avalanche danger level are difficult to validate (Schweizer et al., 2003b).
The snow cover model SNOWPACK is driven with data from automatic weather stations. Stability indices are then calculated from modeled snow stratigraphy, i.e. modeled layer properties. Several stability indices have been implemented in SNOWPACK, in particular the natural stability index SN38 and the skier stability index SK38 (Lehning et al., 2004; Monti et al., 2016). Both stability indices relate to failure initiation and are based on the ratio of the shear strength of a weak layer to the load of the overlaying slab and, for SK38, the approximate stress due to a skier (Föhn, 1987; Jamieson and Johnston, 1998). Weak layer shear strength is parameterized from shear frame measurements in relation to snow density and grain type (Chalmers, 2001; Jamieson and Johnston, 2001). Shear strength and related stability indices are calculated in SNOWPACK for each modeled snow layer (Lehning et al., 2004). To validate these stability indices, previous studies relied on a variety of field measurements, including shear frame measurements, stability tests, manual snow profiles, and avalanche observations, to compare modeled stability metrics with observations. Whereas SK38 is closely related to avalanche activity, SN38 is a rather poor predictor of natural avalanche release (Gauthier et al., 2010). While modeled SK38 performed poorly in terms of identifying potential weak layers, combining it with structural parameters, e.g. differences in grain sizes or hand hardness, the performance improved (Schweizer et al., 2006; Schweizer and Jamieson, 2007).
Recently, a parameterization for the critical crack length, which relates to the onset of crack propagation, was suggested by Gaume et al. (2017) and implemented into SNOWPACK. The critical crack length can be directly measured in the field with the propagation saw test (PST; Gauthier and Jamieson, 2008a), which greatly facilitates the validation. A qualitative comparison suggested that local minima in modeled critical crack lengths for one particular field day agreed with observed critical crack lengths (Gaume et al., 2017). Schweizer et al. (2016) monitored the temporal evolution of a weak layer during the winter season 2014–2015 above Davos, Switzerland. They compared the temporal evolution of the critical crack length observed with PST experiments to the critical crack length predicted by SNOWPACK. Although SNOWPACK reproduced the overall trend fairly well, the seasonal increase was too pronounced. They attributed these discrepancies to an overestimation of weak layer density in SNOWPACK; however their analysis only included one weak layer of faceted crystals.
In this study, we will investigate the performance and limitations of the SNOWPACK model to predict the critical crack length. We will use a dataset containing weekly field measurements. During three winter seasons, 2014–2017, we tracked persistent weak layers with time at different locations close to an automatic weather station and conducted measurements of critical crack length. This dataset was used to validate and improve the parameterization of the critical crack length suggested by Gaume et al. (2017). The new formulation allows for a better representation of the temporal evolution of the critical crack length. It reduces the dependency on weak layer density and considers the microstructural parameter grain size. Minima in the vertical profile of the critical crack length corresponded to associated weak layers, which may improve weak layer detection.
2.1 Field sites
We collected data during three winter seasons, from 2014–2015 to 2016–2017, at two flat field sites above Davos, Switzerland. Both sites are relatively sheltered from wind and equipped with an automatic weather station (AWS) measuring snow depth, air temperature, relative humidity, wind speed, wind direction, and incoming and outgoing short- and longwave radiation. The Weissfluhjoch site (WFJ; 46.830∘ N, 9.809∘ E) is located at 2536 m a.s.l. and the Wannengrat site (WAN7; 46.808∘ N, 9.788∘ E) is located at 2442 m a.s.l. about 3 km to the southwest from WFJ; they typically have a similar snowpack.
2.2 Snow profiles and stability tests
At both sites, manual snow profiles were recorded on an almost weekly basis between January and March (Table 1). Data on hand hardness, temperature, density, grain type, and grain size were recorded according to Fierz et al. (2009). Density was measured either for each individual snow layer with a density tube (volume of 100 cm3, 3.7 cm inner diameter) or for every 3 cm in a vertical profile using a density cutter (box-type density cutter of 100 cm3, 6 cm × 3 cm × 5.5 cm; Proksch et al., 2016). The density of layers thinner than 3 cm could therefore not be measured.

Figure 1Picture of a propagation saw test (PST). Schematic representation of the slab (black lines) and the weak layer (orange line). Red line indicates the artificial crack, initiated with a saw. Photo credit Julia Wessels.
Manual snow profiles were complemented with stability tests, namely the compression test (CT; van Herwijnen and Jamieson, 2007b), the extended column test (ECT; Simenhois and Birkeland, 2009), and the propagation saw test (PST; Gauthier and Jamieson, 2006; Sigrist and Schweizer, 2007; van Herwijnen and Jamieson, 2005). CTs and ECTs were conducted to identify weak layers. The PST is a fracture mechanical field test and was used to assess the critical crack length required for rapid crack propagation in an a priori known weak layer. It consists of an isolated column of 30 cm width and a variable length of at least 120 cm (Fig. 1). A failure in the weak layer is initiated by cutting the weak layer with a snow saw until the crack propagates. The length at which the crack propagated is called the critical crack length rc. The critical crack length as well as the propagation distance are recorded. On each of the 49 measurement days (Table 1), we performed CTs, ECTs, and one to five PSTs per weak layer. In total, 157 PST experiments were conducted in seven different weak layers. We calculated average rc values from PSTs conducted in any given weak layer on a particular day. This yielded a dataset of 61 averaged critical crack lengths, which was then compared to rc values simulated with SNOWPACK for the associated layers. Weak layers were coded after their grain type (GT) according to Fierz et al. (2009) and burial date (YYMMDD) with the code GTYYMMDD.
Table 1Overview of number of weak layers and propagation saw test (PST) results available for validation; data collected during three winter seasons and at two field sites: Weissfluhjoch (WFJ) and Wannengrat (WAN7).

2.3 SNOWPACK
We used the snow cover model SNOWPACK (version 3.5.0, revision 1801) to simulate the snow stratigraphy (Bartelt and Lehning, 2002). The model was driven with AWS data at both sites, using air temperature, relative humidity, snow surface temperature, wind speed, and short- and longwave radiation. For the WAN7 site the snow cover mass balance was enforced with the increment of measured snow depth. For the WFJ site additional data from a heated rain gauge were used to estimate the occurrence of rain (WSL Institute for Snow and Avalanche Research SLF, 2015). At the field site WAN7, the sensor measuring the snow surface temperature malfunctioned. We therefore chose to use Neumann boundary conditions at the snow surface at both sites to estimate the snow surface temperature from energy fluxes (Bartelt and Lehning, 2002; Lehning et al., 2002). At the bottom of the snowpack, a constant geothermal heat flux of 0.06 W m−2 was assumed (Davies and Davies, 2010; Pollack et al., 1993). The simulation time step was 15 min and the output was stored daily at 11:00 UTC, which corresponds approximately with the times of manually observed snow profiles (i.e. between 09:00 and 14:00 UTC). Hence, the comparison to measurements was not affected by daily variations, which are generally low.
Based on these meteorological input data, SNOWPACK simulates the formation and metamorphism of snow layers. Each layer therefore has different properties, mainly characterized by its density, temperature, grain type, and grain size. To compare observed weak layers with the corresponding simulated weak layers, we stored the deposition date of simulated layers. Each modeled snow layer was assigned within the SNOWPACK model with a deposition date corresponding to the date when a new layer was defined in the model. For observed weak layers, however, we only know the burial date, i.e. the day when a weak snow surface was covered by new snow. To match observed weak layers with the corresponding simulated layer, we therefore searched for the simulated layer, which was deposited immediately before the burial date of the observed weak layer. In other words, we identified the simulated weak layer by choosing the uppermost simulated layer with a deposition date older than the burial date of the observed weak layer. Layers of surface hoar are treated separately in SNOWPACK. Since surface hoar forms by deposition of water vapor from the air on the snow surface, and not from precipitation, it is only treated as snow layer within SNOWPACK if certain conditions are fulfilled during burial (Lehning et al., 2002). Thus, modeled surface hoar only “becomes” a snow layer at burial. For observed layers of surface hoar, we therefore first checked whether the layer which was covered by new snow also consisted of surface hoar in the simulation. To temporally track this layer of modeled surface hoar, we then identified the simulated weak layer by choosing the lowermost simulated layer with a deposition date equal to the burial date of the observed layer. All layers above an associated weak layer were assigned to the slab. To obtain slab thickness, layer thicknesses of all simulated slab layers were summed up. Slab density was obtained by a thickness-weighted average of simulated slab layers.
From simulated layer properties, snow mechanical properties required for the parameterization of the critical crack length (see Sect. 2.4) are computed in SNOWPACK. As suggested in Gaume et al. (2017), the elastic modulus of the slab, E, was related to the slab density ρsl by a power-law fit of the data collected by Scapozza (2004):
with ρice=917 kg m−3 being the density of ice. For the original parameterization of E, a correlation coefficient of 0.9 was reported (Scapozza, 2004). We used the default implementation for the shear strength τp in SNOWPACK, which depends on grain type (Fig. 2). For all grain types except for SH (see caption of Fig. 2 for the acronyms of different grain types), τp solely depends on weak layer density ρwl through a power-law function . Values for a and b were derived for different grain types based on shear frame measurements; correlation coefficients of 0.31 to 0.54, depending on grain type, were reported (see Table 8 in Jamieson and Johnston, 2001). For SH, the parametrization of Lehning et al. (2004) was applied, which is a function of age of the weak layer, the normal stress σn, slab thickness Dsl, snow depth (HS), weak layer thickness Dwl, and weak layer temperature Twl. The normal stress σn=ρslgDsl is exerted on the weak layer due to the overlying slab, with the slab thickness Dsl and the gravitational acceleration g. In Fig. 2 τp is shown for a layer of SH with an age of 7 d, Dwl=0.01 m, Dsl=0.5 m, HS =1 m, ∘C, ρsl=200 kg m−3, and σn=0.981 kPa.

Figure 2Parameterization of the shear strength τp as implemented in SNOWPACK. Except for surface hoar (SH), τp is a power-law function of normalized density . Values for a and b depend on grain type. Grain types are precipitation particles (PP), decomposed and fragmented precipitation particles (DF), rounded grains (RG), faceted crystals (FC), depth hoar (DH), surface hoar (SH), melt forms (MF), and graupel (PPgp).
2.4 Critical crack length parameterization
To estimate the critical crack length rc from snow mechanical properties, we used the parameterization suggested by Gaume et al. (2017). They modeled crack propagation with the discrete element method, using an idealized structure of the weak layer by assembling spheres in a triangular shape. For a flat field site (slope angle θ=0) rc reduces to
where the characteristic length scale includes the plain strain elastic modulus of the slab , the Poisson's ratio of the slab ν=0.2, and the shear modulus of the weak layer Gwl=0.2 MPa, as suggested by Gaume et al. (2017).
All layer properties required in Eq. (2) are calculated within SNOWPACK. Furthermore, Eq. (2) was also evaluated using profile data as most properties – i.e. Dsl, Dwl, ρsl, and ρwl – were measured directly in the field. Weak layer shear strength and the elastic modulus of the slab, which were not measured, were derived from measured densities using the same parameterizations as those implemented in SNOWPACK (Eq. 1 and Fig. 2).
2.5 Model performance measures and weak layer detection
We used different performance measures to validate the parameterization for the critical crack length, as well as layer properties from SNOWPACK, namely density and layer thickness. To measure the linear relationship between a modeled value y and a measured value x, we calculated the Pearson correlation coefficient rp. We considered a level of p<0.05 to be significant. To quantify errors, we calculated the normalized root-mean-square error (NRMSE):
where n is the number of measurements (e.g. n=61 is the number of mean values for rc observed with 157 PST experiments per weak layer and day; see Sect. 2.2), and is the mean of the measurements.
To assess whether the parameterization for the critical crack length implemented in SNOWPACK can be used to automatically identify critical weak layers, we investigated whether the five lowest values in the vertical profile of the critical crack length in SNOWPACK corresponded to the critical weak layers tested in the field. This approach consisted of ranking layers in SNOWPACK according to their rc values in ascending order. First, we checked whether the global minimum in the simulated vertical profile of critical crack length was close to a simulated weak layer that was matched with the observations. If the layer with the lowest critical crack length in SNOWPACK was in the range of ±5 cm of an associated weak layer, it was counted as a detection (d), otherwise it was counted as a false alarm (fa). If we observed multiple weak layers in one profile, we iteratively identified the layers with the next lowest values in the vertical profile of the critical crack length by excluding a range of 5 cm above and below the prior minimum. Detections and false alarms were counted until either all associated weak layers were found or five minima in the vertical profile of the critical crack length were compared. If associated weak layers were not detected within the five minima, they were considered not detected (nd). For each field day j, we summed up d, fa, and nd. This procedure allowed us to calculate a detection rate (DR) and a misclassification rate (MR):
where m=49 is the number of field days. Note that .
3.1 Winter seasons – weather and snowpack
The snow depth was average during 2014–2015 and generally below average for the winter seasons 2015–2016 and 2016–2017 (Fig. 3). Each winter, one to two pronounced weak layers developed and consistently failed in CT and ECT tests. These persistent weak layers were tracked in PST experiments throughout the season (Table 1). In the following we will give a detailed description of the formation of these weak layers.
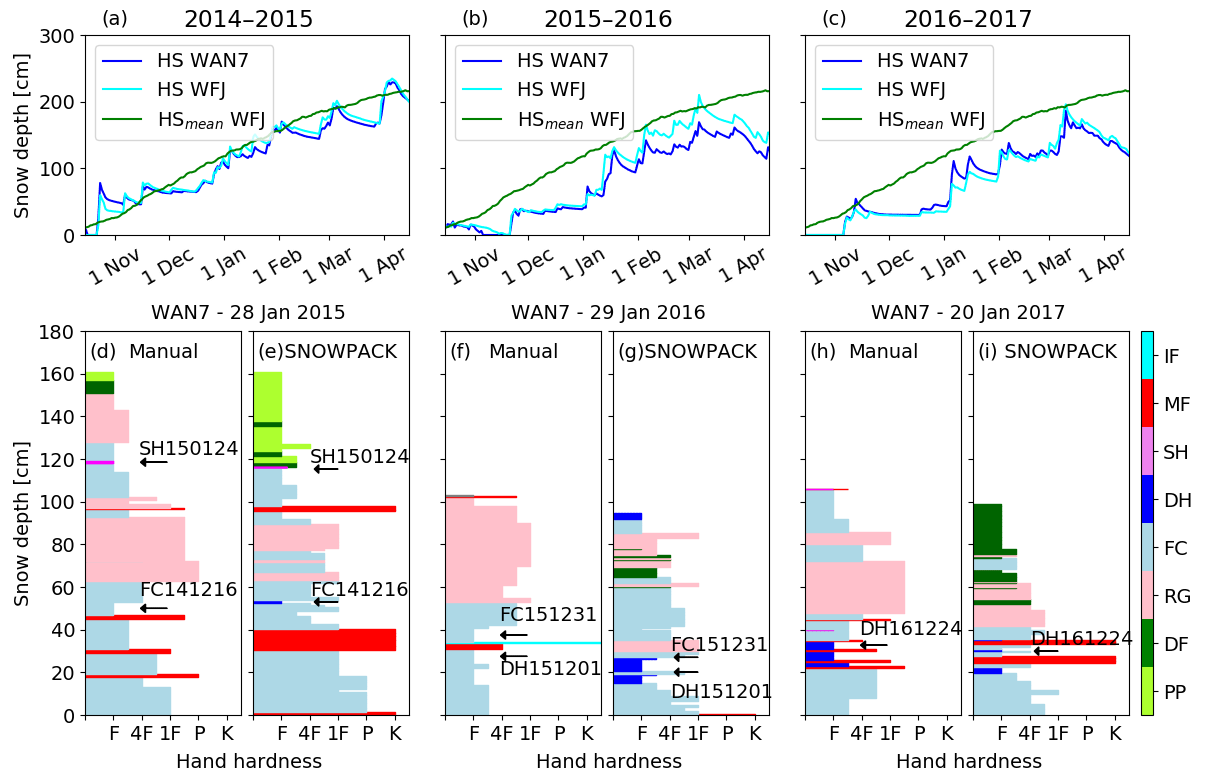
Figure 3(a, b, c) Temporal evolution of measured snow depth at both field sites for the winter seasons (a) 2014–2015, (b) 2015–2016, and (c) 2016–2017. HSmean is the measured snow depth at WFJ averaged over 85 years. (d, f, h) Manually observed snow profile at WAN7 showing hand hardness and grain type (colors) for the end of January each year and (e, g, i) corresponding simulated snow stratigraphy from SNOWPACK. Hand hardness is coded after Fierz et al. (2009), where F corresponds to fist, 4F to four fingers, 1F to one finger, P to pencil, and K to knife. Grain types are precipitation particles (PP), decomposing and fragmented precipitation particles (DF), rounded grains (RG), faceted crystals (FC), depth hoar (DH), surface hoar (SH), melt forms (MF), and ice formations (IF). Arrows with labels indicate critical weak layers, which were observed in PST experiments. Labels of weak layers were coded after grain type GT and burial date (GTYYMMDD).
3.1.1 Winter 2014–2015
The winter started at the end of October with approximately 60 cm of snow. During the calm weather period starting in mid-November, the near-surface snow transformed into a layer of faceted crystals, forming a persistent weak layer that was buried by snow in mid-December (FC141216). A layer of surface hoar, which had formed in the region in mid-January, was buried on 24 January 2015 (SH150124) and was subsequently observed in the traditional snow profile on 28 January 2015 (Fig. 3d). During this winter, we only performed measurements at the WAN7 field site. A more detailed description of the weather development and weak layer formation can be found in Schweizer et al. (2016).
3.1.2 Winter 2015–2016
In early November, a first snowstorm deposited around 30 cm of snow at both field sites. A period of calm weather followed and large temperature gradients transformed the near-surface snow into a layer of depth hoar (DH151201). On 1 December 2015, local observers reported rain up to 2600 m a.s.l., forming a crust on top of DH151201. In mid-December, an additional 20 cm of snow accumulated on the crust and subsequently transformed into a layer of faceted crystals during a clear weather period. This layer of facets was then covered by snow on 31 December 2015 (FC151231). From January 2016 on, no further prominent weak layer developed. These two persistent weak layers, below and above the crust, were observed at both field sites.
3.1.3 Winter 2016–2017
This winter was relatively similar to the previous winter, starting with a shallow snowpack followed by a period of calm weather. Around 20–30 cm above the ground, a layer of DH crystals formed. This weak layer was covered by snow on 24 December 2016 (DH161224). Between January and March 2017, several small snowstorms occurred such that the snow height reached about 200 cm at the beginning of March. No further pronounced weak layers developed during this winter.
3.2 Modeled snow stratigraphy
For each site and winter season SNOWPACK reproduced the main stratigraphic features reasonably well (Fig. 3d–i). The overall hardness profiles agreed with the observations, and the weak layers that were identified and tracked in the field were also present in the simulated profiles. Still, some discrepancies were observed between observation and simulation. One of these discrepancies is the rain crust and ice lens, which formed in the winter 2015–2016 at both field sites (see MF and IF at around 35 cm in Fig. 3f), and were used as a reference for the weak layers. SNOWPACK did not simulate this rain crust but rather a thin layer of new snow (Fig. 3g) since the 5 m air temperature stayed well below 0 ∘C.
For the critical crack length parameterization, slab and weak layer properties are required. Most variables in Eq. (2) are related to density, which was also measured in the field. Modeled slab density ρsl agreed well (Fig. 4a) with measured density (rp=0.94, p≪0.05, and NRMSE =0.13), and the agreement for weak layer density ρwl was only slightly worse (rp=0.75, p≪0.05, and NRMSE =0.12). Modeled slab thickness also agreed well (Fig. 4c) with observed Dsl (rp=0.98, p≪0.05, and NRMSE =0.09). Weak layer thickness, however, did not agree with observed thickness (, p=0.28, and NRMSE =1.26). In the field, observers define layer boundaries based on evident differences in layer properties, which is partly subjective, resulting in recorded weak layer thicknesses up to 30 cm. Simulated Dwl ranged from 0.17 to 2.52 cm because layer thicknesses were constrained by the simulation time step (Lehning et al., 2002). In contrast, Dwl in Eq. (2) described an idealized weak layer thickness closely related to the collapse height after weak layer fracture.
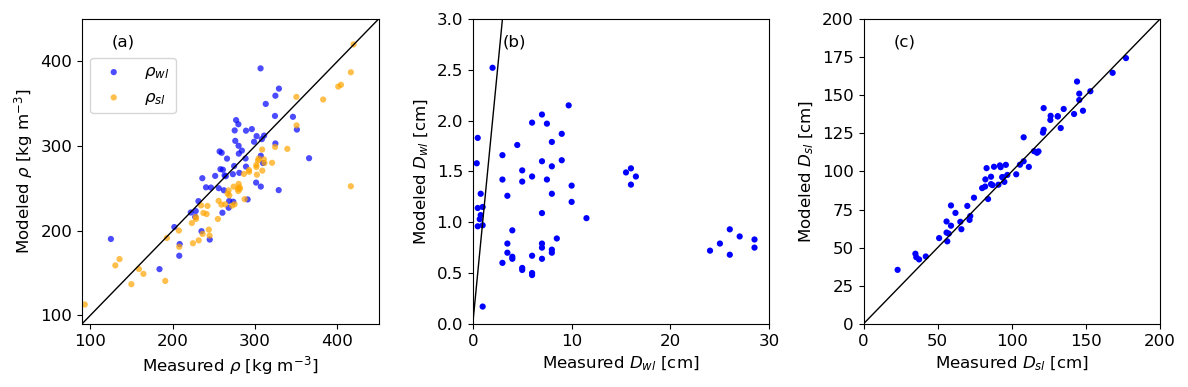
Figure 4Comparison of (a) modeled to measured weak layer density ρwl and mean slab density ρsl, (b) weak layer thickness Dwl, and (c) slab thickness Dsl. Modeled properties were taken from SNOWPACK simulations while measured properties come from manually observed snow profiles. The black line is the 1:1 line.
3.3 Evolution of the critical crack length
PST experiments were conducted in the persistent weak layers described above. Observed critical crack lengths ranged from 17 to 121 cm and generally increased with time for all sites and seasons (Fig. 5). On a single day, repeated PST experiments on the same layer varied by 1 cm to 35 cm, resulting in an average relative range of 30 %. Temporary decreases in rc were sometimes observed after pronounced precipitation events, as for example around 9 March 2017 (Fig. 5d, e). Depending on the weak layer and the field site, seasonal increases in observed rc were more or less pronounced. For instance, rc for layer FC151231 only slightly increased from 20 to 40 cm at WAN7 (Fig. 5), whereas at WFJ the increase was more prominent (Fig. 5b, c). The largest increases in rc were observed at the end of March and in early April 2017.
The overall temporal trend of rc (Eq. 2) was reproduced when using layer properties from SNOWPACK (rp=0.88, p≪0.05; Fig. 5). However, rc was generally overestimated (NRMSE =1.78; Fig. 6) and simulated rc values ranged from 4 to 462 cm. The only exception was for a layer of buried surface hoar (SH150124), for which observed and simulated rc values corresponded well (rp=0.90, p=0.04, and NRMSE =0.41; Fig. 5a). Modeled rc values (Eq. 2) were also calculated using layer properties from manually observed snow profiles, if data on thickness and density were available. Doing so, the discrepancies between modeled (Eq. 2) and observed rc values were even larger (rp=0.62, p≪0.05, and NRMSE =7.11; Fig. 6).
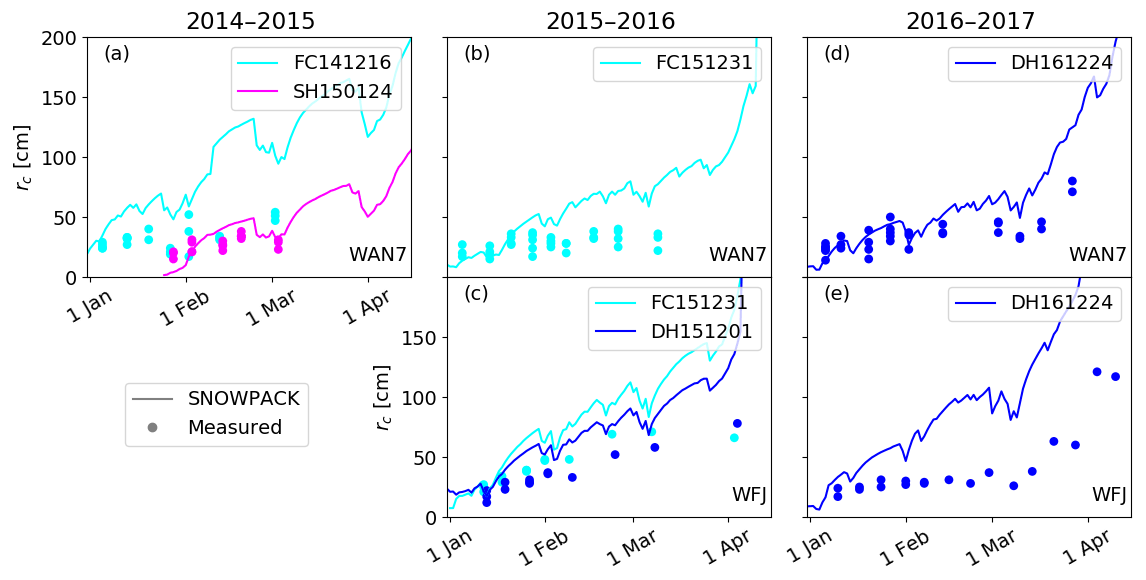
Figure 5Evolution of the critical crack length rc for the winter seasons 2014–2015 (a WAN7), 2015–2016 (b WAN7; c WFJ), and 2016–2017 (d WAN7; e WFJ). Dots represent mean measured rc values from PST experiments, and lines represent modeled rc values with layer properties from SNOWPACK using Eq. (2).

Figure 6Modeled rc values (Eq. 2) with layer properties from SNOWPACK (blue dots) and from manual profiles (orange dots) with averaged measured critical crack lengths from PST experiments. Error bars indicate the range of measured critical crack lengths for each point. The black line is the 1:1 line.
Clearly, the modeled critical crack length with layer properties either from SNOWPACK or from manual snow profiles overestimated observed critical crack lengths, especially later in the season. Since we used the same parameterizations for the required mechanical properties of snow, namely E and τp, we investigated differences in modeled and observed density or layer thickness more closely. While modeled slab and weak layer densities as well as slab thickness corresponded well with the observation (Fig. 4a, c), modeled and observed weak layer thickness were completely different (Fig. 4b). Indeed, measured values of Dwl ranged from 0.4 to 30 cm, whereas in SNOWPACK Dwl ranged from 0.2 to 2.5 cm. These differences may be related to difficulties in assessing layer boundaries in manual snow profiles but are primarily due to numerical boundary conditions limiting the thickness of layers in SNOWPACK. Furthermore, the weak layer shear modulus was taken as constant (Gwl=0.2 MPa). This simplification does not account for the temporal evolution of layer properties in the snow cover. Thus, Dwl and Gwl in the parameterization of Gaume et al. (2017) are likely responsible for the observed discrepancies in modeled critical crack length.
3.4 Improvements to rc parameterization
To improve the rc parameterization we replaced the ratio with a parameter Fwl=f(ρwl, gswl), i.e. a function of density ρwl and the grain size gswl of the weak layer. can be determined from mean rc,obs from PST measurements for each layer and each day in combination with layer properties σn, E′, and τp from SNOWPACK using Eq. (2):
Based on the 61 mean observed critical crack lengths in the winters 2014–2015 to 2016–2017 and slab and weak layer variables from SNOWPACK simulations, Fwl ranged between and m Pa−1 (blue dots in Fig. 7). We then fitted the values of Fwl to a power-law function,
with the fit parameters a and b. To normalize grain size we select gs0=0.00125 m according to Schweizer et al. (2008). With x and y integers ranging from −3 to 3, we evaluated 48 fit functions with regard to their ability to detect weak layers. Therefore, we calculated DR (Eq. 4) and MR (Eq. 5) values for all field days (m=49). The best performance, i.e. high DR and low MR, was obtained with , namely a DR of 0.89 and a MR of 0.64 (Fig. 8). The original parameterization of Gaume et al. (2017) performed poorly in terms of weak layer detection with a relatively low DR of 0.18 and a high MR of 0.95. To exemplify these differences, on 28 January 2015, using the original parameterization (Eq. 2), only one (d=1) of the two tested weak layers (nd =1) was within the five weakest layers (Fig. 9c), resulting in a DR of 0.5 and a MR of 0.8 for that single day. In contrast, using the fit function with , both weak layers were detected within the first four weakest layers, resulting in a DR of 1 and a MR of 0.5 (Fig. 9d). We therefore suggest a new parameterization of rc, where in Eq. (2) is replaced by Fwl:
where Fwl is given by
where m Pa−1 and are the mean fit parameters obtained with 10-fold cross-validation (Wilks, 2011). For this, we randomly split the joint dataset into 10 groups, fitted Fwl with nine groups, and tested the fit function on the excluded group. After performing this 10 times with each group serving as test group, we averaged the fit parameters and performance values. This yielded an average NRMSE for modeled rc from the SNOWPACK simulation using Eq. (8). Compared to the original parameterization (Eq. 2) with an NRMSE =1.78, the results highly improved. For SNOWPACK, values of rc ranged from 12 to 121 cm (rp=0.90, p≪0.05) using Eq. (8) (blue dots in Fig. 10). We also modeled rc values from manually observed snow profile data using the same fit factor (Eq. 9) in Eq. (8). The discrepancies between modeled values of critical crack length from manually observed snow profiles and measured rc values (orange dots in Fig. 10) were also removed using Eq. (8), with modeled rc values ranging from 2 to 156 cm (rp=0.72, p≪0.05, and NRMSE =0.57). Also, the match between observed and modeled time series of rc using SNOWPACK layer properties for the individual weak layers was substantially better when using Eq. (8) (Fig. 11).
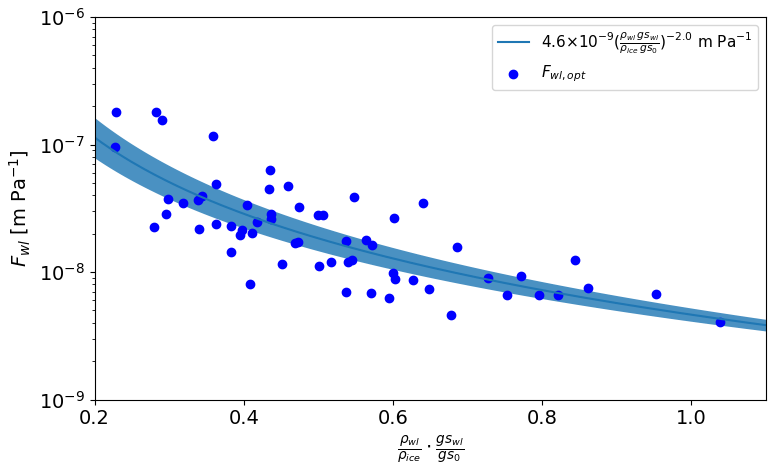
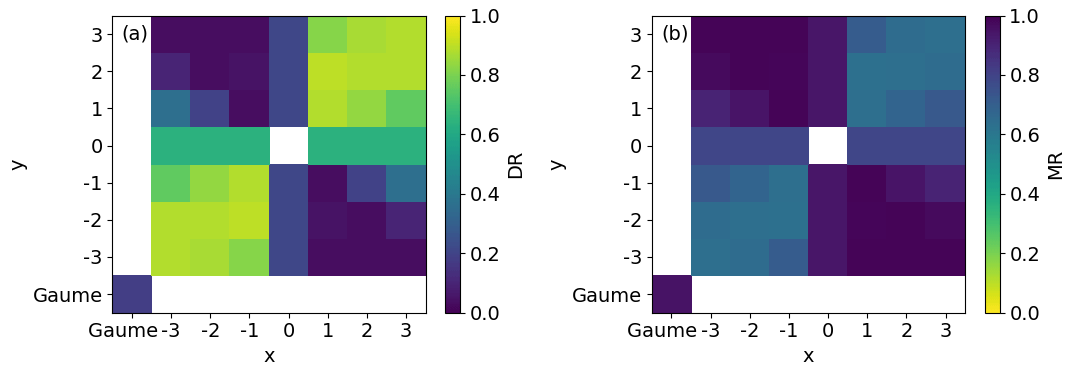
Figure 8(a) Detection rate (DR) and (b) misclassification rate (MR) values for the 49 field days with exponents x and y for the power-law fit function . Values for x and y ranged from −3 to 3. The original parametrization of Gaume et al. (2017) (Eq. 2) is shown in the lower left corner.
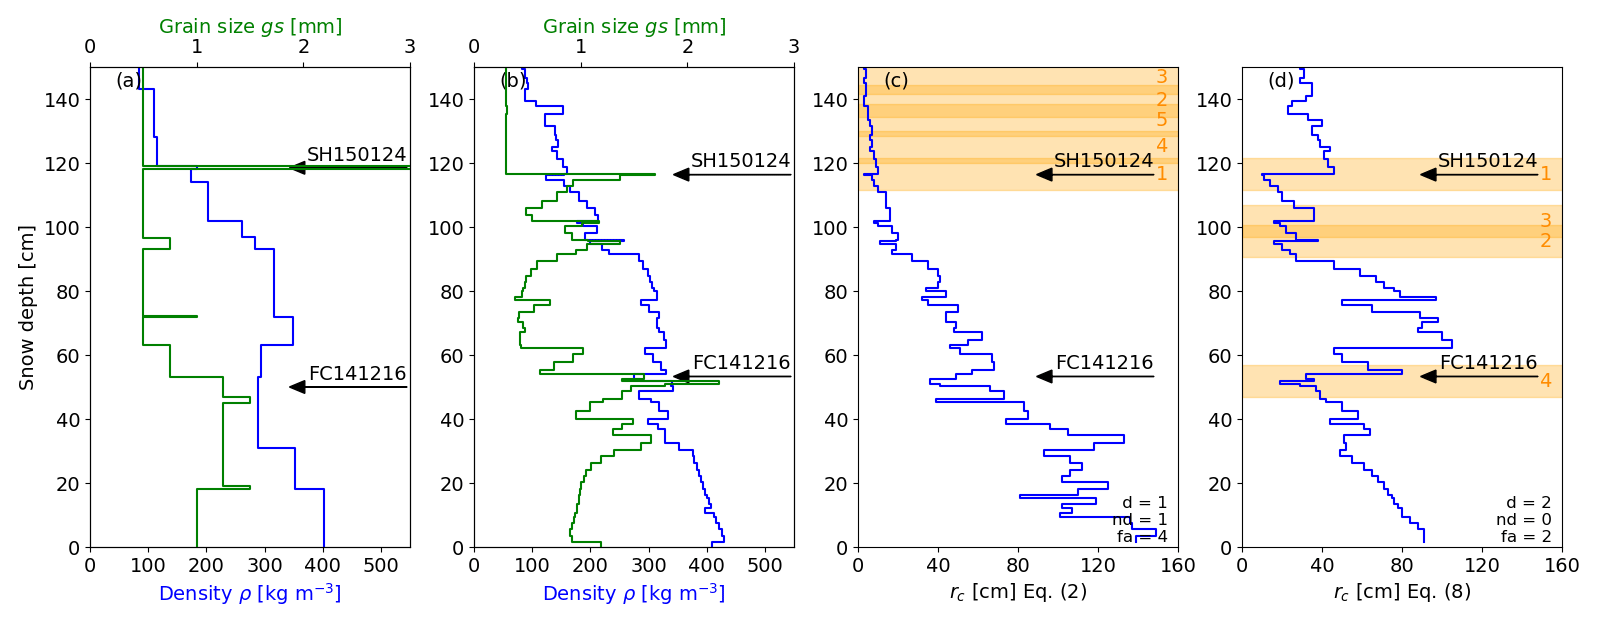
Figure 9Observed (a) and simulated (b) density (ρ) and grain size (gs) profiles on 28 January 2015 at WAN7. Corresponding vertical rc profiles using layer properties from SNOWPACK for (c) the parameterization of Gaume et al. (2017) (Eq. 2) and (d) the optimized parameterization (Eq. 8). Arrows show the weak layers on which PST experiments were performed. Orange bars show the lowest values in the vertical rc profiles.
We focused on validating the critical crack length parameterization in the snow cover model SNOWPACK. Crack propagation propensity only provides information on one of the processes required for avalanche release. Nevertheless, a critical weak layer will likely have both a low failure initiation propensity and a low crack propagation propensity (Reuter and Schweizer, 2018). As such, we focused only on crack propagation, which is a fundamental process when assessing snow stability. The critical crack length provides valuable information on crack propagation (Gauthier and Jamieson, 2008b) and can directly be measured with PST experiments. Furthermore, PST experiments allow us to directly compare measurements to the critical crack length modeled by SNOWPACK. This greatly facilitates the validation, especially when performing the measurements directly next to an automatic weather station used to drive SNOWPACK, as was done in this study. Due to the vicinity to the AWS, no spatial interpolation was needed and the possible errors in the energy budget are assumed to be negligible. Indeed, for the field site WFJ we investigated the effect of different model configurations. For instance, using Dirichlet boundary conditions at the snow surface, i.e. directly using measured snow surface temperature, which did not influence our results, as differences in modeled snow properties were very small (not shown).
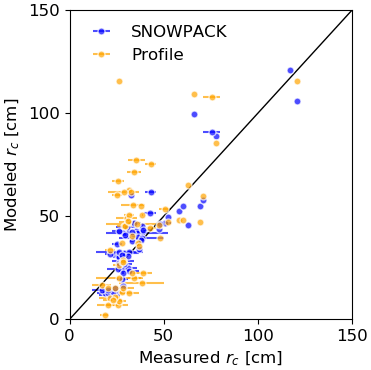
Figure 10Modeled values of critical crack length (Eq. 8) with layer properties from SNOWPACK (blue dots) and from manually observed profiles (orange dots) vs. averaged critical crack lengths from PST experiments. Error bars indicate the range of measured critical crack lengths for each point. The black line is the 1:1 line.

Figure 11Evolution of the critical crack length at WAN7 (a, b, d) and WFJ (c, e) for the winter seasons 2014–2015 (a WAN7), 2015–2016 (b WAN7; c WFJ), and 2016–2017 (d WAN7; e WFJ). Dots represent mean measured rc values from PST experiments, and lines represent modeled rc values with layer properties from SNOWPACK using Eq. (8).
For the validation, we focused on prominent weak layers which were buried early in the season. Later in the season, we also observed other failure layers in our CTs and ECTs. However, we did not perform PST experiments in these other failure layers, as they did not show consistent crack propagation. Generally, PST experiments only provide a measure for the critical crack length in layers that are prone to crack propagation. Such layers are typically soft (hand hardness index ≤2) and consist of rather large crystals, as typically found in the failure layers of avalanches (Schweizer and Jamieson, 2003; van Herwijnen and Jamieson, 2007a). Performing a PST in other layers, such as for instance a layer of small rounded grains, generally does not yield any result for the critical crack length. The only microstructural dependence in the original parameterization of Gaume et al. (2017) (Eq. 2) was through the grain type dependence of the shear strength τp developed by Jamieson and Johnston (2001) and implemented in SNOWPACK. Most of the observed weak layers consisted of faceted crystals and depth hoar crystals with measured densities of up to 366 kg m−3. Differences in shear strength for rounded grains and faceted crystal as implemented in SNOWPACK are modest for densities around 300 kg m−3. For densities above 330 kg m−3 the shear strength of rounded grains becomes even smaller than the shear strength of faceted crystal (Fig. 2). This is rather counterintuitive since rounded grains are related to slab layers. Furthermore, most of the slab layers directly above weak layers also consist of faceted crystals in both observed and simulated profiles (Fig. 3). Although weak layers and adjacent slab layers do not differ in grain type, they strongly differ in grain size (Fig. 9a, b). It is clear that SNOWPACK would ultimately benefit from microstructural-based parameterizations of shear strength and elastic modulus. However, currently only these rather simple formulations are available. Therefore, the modeled critical crack length as suggested by Gaume et al. (2017) mainly increased with depth (Fig. 9c), which was driven by the increase in density with depth. In contrast to density, grain size varied more prominently with weak layers often consisting of large grains (Fig. 9a, b). Furthermore, modeled rc became unrealistically large late in the season (Fig. 5). We therefore proposed a refined parameterization (Eq. 8), which strongly reduced the discrepancies between modeled and simulated critical crack lengths. Our refined parameterization greatly improved the results as it removed two variables of the original parameterization (Eq. 2), which were not sufficiently well represented in SNOWPACK.
The first variable was weak layer thickness Dwl. The large discrepancies between observed and modeled Dwl showed that simply using modeled Dwl results in poor estimates of rc (Fig. 4b). While a layer per definition should differ from adjacent layers in density or microstructure (Fierz et al., 2009), layer thicknesses are constrained by numerical stability in SNOWPACK. The simulation time step was 15 min and therefore snow layer thicknesses were restricted to approximately 3 cm. In contrast, observers define layer boundaries with some subjectivity, and layer thicknesses of up to 30 cm were recorded in manually observed snow profiles. To develop the original rc parameterization (Eq. 2), Gaume et al. (2017) performed numerical simulations using an idealized structure of the weak layer and Dwl was closely linked to collapse height. Indeed, when rc is reached in a PST experiment, crack propagation occurs, inducing the structural collapse of the weak layer (e.g. van Herwijnen and Jamieson, 2005; van Herwijnen et al., 2010). The collapse height is believed to contribute to extensive fracture propagation (Jamieson and Schweizer, 2000; van Herwijnen and Jamieson, 2005; van Herwijnen et al., 2010). However, collapse heights are generally around 1 to 10 mm in real PST experiments (van Herwijnen and Jamieson, 2005), i.e. on the order of the grain size rather than Dwl. While thus far it remains unclear whether the collapse height relates to rc and how it scales with grain size, it is plausible to consider grain size rather than weak layer thickness in the parameterization. Moreover, structural length, crystal size, and grain size have been previously introduced to improve the parameterizations of mechanical properties (e.g. Proksch et al., 2015; Schulson, 2001; Schweizer et al., 2004).
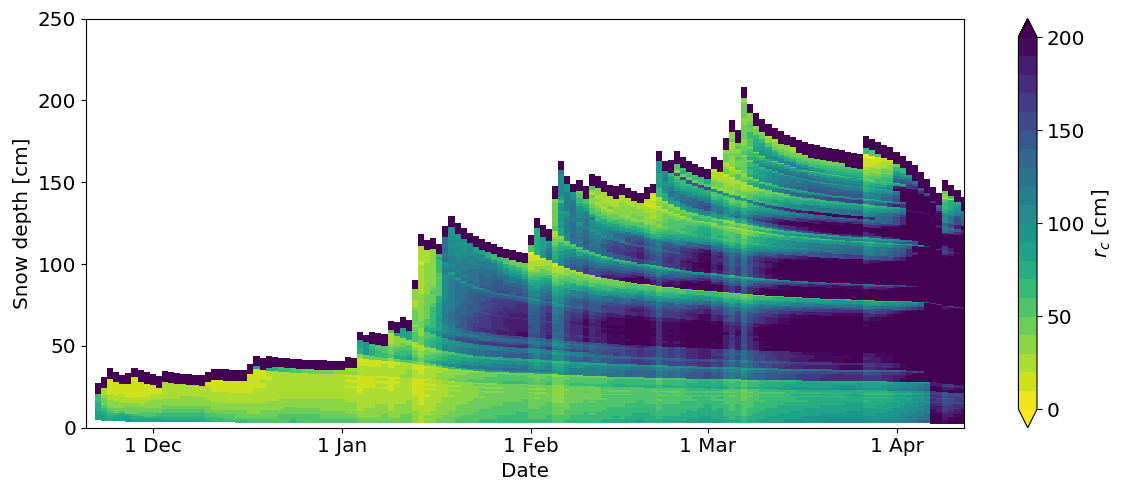
Figure 12Temporal evolution of the vertical profile of the critical crack length modeled with SNOWPACK using Eq. (8) for WFJ 2015–2016.
The second variable in Eq. (2) was the shear modulus of the weak layer Gwl. Thus far, there are very few measurements of Gwl (Föhn et al., 1998; Reiweger et al., 2010) and therefore Gwl was kept constant in the original parameterization. Nevertheless, one would expect Gwl to increase with increasing density, similar to E (Scapozza, 2004; van Herwijnen et al., 2016). This would in part compensate for the exaggerated seasonal increase in modeled rc (Fig. 12). In the absence of a sound Gwl parameterization, replacing Gwl with a term depending on ρwl to model rc therefore seems plausible.
Thus, we replaced the poorly constrained term with Eq. (9). The overall dependency of rc on layer density through shear strength therefore decreased since the exponent for weak layer density in the shear strength is positive, while the exponent in the fit parameter is negative. Instead, we introduced the grain size, resulting in lower values in rc for larger grains (Fig. 9). Hence, the temporal increase in rc was less pronounced with increasing density, resulting in more realistic seasonal trends (Fig. 11). Furthermore, the grain size dependence greatly improved the performance of using modeled critical crack length for weak layer detection (Fig. 8).
The critical crack length can be calculated for every simulated snow layer (Fig. 9d). However, this does not mean that in each layer a crack will actually propagate. Currently, it is not possible to distinguish simulated snow layers with high propagation propensity from others. Furthermore, SNOWPACK simulates considerably more layers than observed due to the mismatch of layer thicknesses between simulated and observed snow profiles. We chose a relatively simple approach without requiring any layer matching to automatically detect weak layers based on low values for the critical crack length. An associated weak layer was counted as detected if it was located within ±5 cm of the minimum in the vertical profile of critical crack length. This approach avoids detecting many weak layers within a small range. While it is clear that the threshold value of 5 cm above and below the minimum is somewhat subjective, we are confident that it is not a gross misrepresentation when assessing the stability of the snowpack. The optimized parameterization (Eq. 8) increased the detection rate from 0.18 to 0.89 compared to Eq. (2), while decreasing the misclassification rate from 0.95 to 0.64. Hence, the refined parameterization for the critical crack length can properly represent observed results from snow stability tests and observed weaknesses often agreed with minima in the vertical profile of simulated crack length. This approach does not solve the weak layer detection problem, as this is a complex task (Schweizer et al., 2006; Monti et al., 2014). Instead, this approach shows the overall improvements of the refined parameterization and suggests that weak layer detection seems feasible, taking into account the critical crack length.
The seasonal evolution of rc simulated with SNOWPACK using Eq. (8) for WFJ 2015–2016 showed a general increase in rc for each layer (Fig. 12). With increasing snow depth due to precipitation, rc, for each layer being temporally decreased (e.g. at the beginning of February and March). The weak base in the lower 40 cm of the snowpack, which was tracked with the PST experiments, consistently showed lower rc values than those within the overlying slab in the simulation. The simulation also showed weaknesses, which formed later in the season; e.g. a layer that had formed on 31 January at the snow surface at around 120 cm. Although these layers might have been weak layers, they were not contained in our dataset of PST experiments and therefore counted as false alarms.
During three winter seasons we monitored the evolution of the critical crack length rc with PST experiments in persistent weak layers at two field sites above Davos, Switzerland. On 49 field days, we collected data on seven distinct persistent weak layers including 157 PST experiments. Comparing observed to modeled critical crack length showed that the recently suggested model by Gaume et al. (2017) generally overestimated the observed critical crack length, especially later in the season. The discrepancies are likely related to the weak layer thickness Dwl and the shear modulus of the weak layer Gwl.
We therefore suggested an improved parameterization including weak layer grain size and weak layer density instead of Dwl and Gwl (Eq. 8). The grain size term in the improved rc parameterization (Eq. 8) allowed us to implicitly account for snow microstructure. This resulted in lower rc values for layers with larger grains, in line with our field experience. This also improved the detection rate by simply comparing low values in simulated critical crack lengths with associated weak layers. The critical crack length can be modeled with simulated layer properties from either the snow cover model SNOWPACK or data from manual snow pit observations. In both cases, Eq. (8) greatly improved the match between observed and modeled rc values and improved the representation of the observed seasonal evolution of the critical crack length. However, we want to highlight that the parameterization was developed based on data of weak layers of large faceted grains and could further be improved by sampling a greater diversity of weak layers.
The critical crack length relates to the onset of crack propagation and is therefore an important parameter to assess snow stability. However, a snowpack is only prone to avalanche release if conditions for failure initiation and crack propagation are fulfilled. For the stability criteria in SNOWPACK, these conditions still need to be defined and verified with independent data. Clearly, the complex problem of automatically identifying weak layers and evaluating snow stability in simulated snow profiles is not yet solved. Nevertheless, our results are an encouraging step in the right direction.
All relevant data, including manually observed snow profiles, stability tests, and SNOWPACK simulations, are available at https://doi.org/10.16904/envidat.119 (Richter et al., 2019). The numerical snow cover model SNOWPACK can be downloaded from http://models.slf.ch/p/snowpack/ (SNOWPACK, 2019).
AH and JS initiated this study and BR processed and analyzed the data and simulations. AH, BR, and JS developed the field measurements and collected the data. BR prepared the paper with contributions from all co-authors.
The authors declare that they have no conflict of interests.
We would like to thank all colleagues involved in the field campaigns, in particular Stephanie Mayer and Konstantin Nebel. We would also like to thank the two anonymous reviewers as well as the editor Guillaume Chambon, who helped us to improve this paper.
Bettina Richter has been supported by a grant from the Swiss National Science Foundation (200021_169641).
This paper was edited by Guillaume Chambon and reviewed by two anonymous referees.
Bartelt, P. and Lehning, M.: A physical SNOWPACK model for the Swiss avalanche warning Part I: Numerical model, Cold Reg. Sci. Technol., 35, 123–145, https://doi.org/10.1016/S0165-232X(02)00074-5, 2002. a, b
Brun, E., David, P., and Sudul, M.: A numerical-model to simulate snow-cover stratigraphy for operational avalanche forecasting, J. Glaciol., 38, 13–22, https://doi.org/10.3189/S0022143000009552, 1992. a
Chalmers, T. S.: Forecasting shear strength and skier-triggered avalanches for buried surface hoar layers, MSc thesis, Dept. of Civil Eng., University of Calgary, Calgary, Canada, 2001. a
Davies, J. H. and Davies, D. R.: Earth's surface heat flux, Solid Earth, 1, 5–24, https://doi.org/10.5194/se-1-5-2010, 2010. a
Durand, Y., Giraud, G., Brun, E., Merindol, L., and Martin, E.: A computer-based system simulating snowpack structures as a tool for regional avalanche forecasting, J. Glaciol., 45, 469–484, https://doi.org/10.3189/S0022143000001337, 1999. a
Fierz, C., Armstrong, R., Durand, Y., Etchevers, P., Greene, E., McClung, D., Nishimura, K., Satyawali, P., and Sokratov, S.: The international classification for seasonal snow on the ground, HP-VII Technical Document in Hydrology, 83. UNESCO-IHP, Paris, France, p. 90, 2009. a, b, c, d, e
Föhn, P.: The “Rutschblock” as a pratical tool for slope stability evaluation, IAHS-AISH Publ., 162, 223–228, 1987. a
Föhn, P., Camponovo, C., and Krüsi, G.: Mechanical and structural properties of weak snow layers measured in situ, Ann. Glaciol., 26, 1–6, https://doi.org/10.3189/1998AoG26-1-1-6, 1998. a
Gaume, J., van Herwijnen, A., Chambon, G., Wever, N., and Schweizer, J.: Snow fracture in relation to slab avalanche release: critical state for the onset of crack propagation, The Cryosphere, 11, 217–228, https://doi.org/10.5194/tc-11-217-2017, 2017. a, b, c, d, e, f, g, h, i, j, k, l, m, n
Gauthier, D. and Jamieson, B.: Towards a field test for fracture propagation propensity in weak snowpack layers, J. Glaciol., 52, 164–168, https://doi.org/10.3189/172756506781828962, 2006. a
Gauthier, D. and Jamieson, B.: Evaluation of a prototype field test for fracture and failure propagation propensity in weak snowpack layers, Cold Reg. Sci. Technol., 51, 87–97, https://doi.org/10.1016/j.coldregions.2007.04.005, 2008a. a
Gauthier, D. and Jamieson, B.: Frature propagation propensity in relation to snow slab avalanche release: Validating the propagation saw test, Geophys. Res. Lett., 35, L13501, https://doi.org/10.1029/2008GL034245, 2008b. a
Gauthier, D., Brown, C., and Jamieson, B.: Modeling strength and stability in storm snow for slab avalanche forecasting, Cold Reg. Sci. Technol., 62, 107–118, https://doi.org/10.1016/j.coldregions.2010.04.004, 2010. a
Giraud, G. and Navarre, J.: MEPRA et le risque de déclenchement accidentel d'avalanches, in: Les apports de la recherche scientifique à la sécurité neige, glace et avalanche, Actes de Colloque, Chamonix, 30 May–3 June, 145–150, 1995. a
Jamieson, J. and Johnston, C.: Refinements to the stability index for skier-triggered dry-slab avalanches, Ann. Glaciol., 26, 296–302, https://doi.org/10.3189/1998AoG26-1-296-302, 1998. a
Jamieson, J. and Johnston, C.: Evaluation of the shear frame test for weak snowpack layers, Ann. Glaciol., 32, 59–69, https://doi.org/10.3189/172756401781819472, 2001. a, b, c
Jamieson, J. B. and Schweizer, J.: Texture and strength changes of buried surface-hoar layers with implications for dry snow-slab avalanche release, J. Glaciol., 46, 151–160, https://doi.org/10.3189/172756500781833278, 2000. a
Lafaysse, M., Morin, S., Coléou, C., Vernay, M., Serça, D., Besson, F., Willemet, J.-M., Giraud, G., Durand, Y., and Météo-France, D.: Towards a new chain of models for avalanche hazard forecasting in French mountain ranges, including low altitude mountains, in: Proceedings of International Snow Science Workshop Grenoble–Chamonix Mont-Blanc, 162–166, 2013. a, b
Lehning, M., Bartelt, P., Brown, B., and Fierz, C.: A physical SNOWPACK model for the Swiss avalanche warning: Part III: meteorological forcing, thin layer formation and evaluation, Cold Reg. Sci. Technol., 35, 169–184, https://doi.org/10.1016/S0165-232X(02)00072-1, 2002. a, b, c, d
Lehning, M., Fierz, C., Brown, B., and Jamieson, B.: Modeling snow instability with the snow-cover model SNOWPACK, Ann. Glaciol., 38, 331–338, https://doi.org/10.3189/172756404781815220, 2004. a, b, c, d
McClung, D. M. and Schweizer, J.: Skier triggering, snow temperatures and the stability index for dry-slab avalanche initiation, J. Glaciol., 45, 190–200, https://doi.org/10.3189/S0022143000001696, 1999. a
Monti, F., Schweizer, J., and Fierz, C.: Hardness estimation and weak layer detection in simulated snow stratigraphy, Cold Reg. Sci. Technol., 103, 82–90, https://doi.org/10.1016/j.coldregions.2014.03.009, 2014. a
Monti, F., Gaume, J., van Herwijnen, A., and Schweizer, J.: Snow instability evaluation: calculating the skier-induced stress in a multi-layered snowpack, Nat. Hazards Earth Syst. Sci., 16, 775–788, https://doi.org/10.5194/nhess-16-775-2016, 2016. a
Pollack, H. N., Hurter, S. J., and Johnson, J. R.: Heat flow from the Earth's interior: Analysis of the global data set, Rev. Geophys., 31, 267–280, https://doi.org/10.1029/93RG01249, 1993. a
Proksch, M., Löwe, H., and Schneebeli, M.: Density, specific surface area and correlation length of snow measured by high-resolution penetrometry, J. Geophys. Res., 120, 346–362, https://doi.org/10.1002/2014JF003266, 2015. a
Proksch, M., Rutter, N., Fierz, C., and Schneebeli, M.: Intercomparison of snow density measurements: bias, precision, and vertical resolution, The Cryosphere, 10, 371–384, https://doi.org/10.5194/tc-10-371-2016, 2016. a
Reiweger, I., Schweizer, J., Ernst, R., and Dual, J.: Load-controlled test apparatus for snow, Cold Reg. Sci. Technol., 62, 119–125, https://doi.org/10.1016/j.coldregions.2010.04.002, 2010. a
Reuter, B. and Schweizer, J.: Describing snow instability by failure initiation, crack propagation, and slab tensile support, Geophys. Res. Lett., 45, 7019–7027, https://doi.org/10.1029/2018GL078069, 2018. a, b
Richter, B., Schweizer, J., Rotach, M. W., and van Herwijnen, A.: Validating and improving the critical crack length in SNOWPACK, https://doi.org/10.16904/envidat.119, 2019. a
Scapozza, C.: Entwicklung eines dichte- und temperaturabhängigen Stoffgesetzes zur Beschreibung des visko-elastischen Verhaltens von Schnee, PhD thesis, ETH Zürich, 2004. a, b, c
Schulson, E. M.: Brittle failure of ice, Eng. Fract. Mech., 68, 1839–1887, https://doi.org/10.1016/S0013-7944(01)00037-6, 2001. a
Schweizer, J. and Jamieson, B.: Snowpack properties for snow profile analysis, Cold Reg. Sci. Technol., 37, 233–241, https://doi.org/10.1016/S0165-232X(03)00067-3, 2003. a
Schweizer, J. and Jamieson, B.: Snowpack tests for assessing snow-slope stability, Ann. Glaciol., 51, 187–193, https://doi.org/10.3189/172756410791386652, 2010. a
Schweizer, J. and Jamieson, J.: A threshold sum approach to stability evaluation of manual snow profiles, Cold Reg. Sci. Technol., 47, 50–59, https://doi.org/10.1016/j.coldregions.2006.08.011, 2007. a
Schweizer, J., Jamieson, J., and Schneebeli, M.: Snow avalanche formation, Rev. Geophys., 41, 1016, https://doi.org/10.1029/2002RG000123, 2003a. a, b
Schweizer, J., Kronholm, K., and Wiesinger, T.: Verification of regional snowpack stability and avalanche danger, Cold Reg. Sci. Technol., 37, 277–288, https://doi.org/10.1016/S0165-232X(03)00070-3, 2003b. a
Schweizer, J., Michot, G., and Kirchner, H. O.: On the fracture toughness of snow, Ann. Glaciol., 38, 1–8, https://doi.org/10.3189/172756404781814906, 2004. a
Schweizer, J., Bellaire, S., Fierz, C., Lehning, M., and Pielmeier, C.: Evaluating and improving the stability predictions of the snow cover model SNOWPACK, Cold Reg. Sci. Technol., 46, 52–59, https://doi.org/10.1016/j.coldregions.2006.05.007, 2006. a, b, c
Schweizer, J., McCammon, I., and Jamieson, J. B.: Snowpack observations and fracture concepts for skier-triggering of dry-snow slab avalanches, Cold Reg. Sci. Technol., 51, 112–121, https://doi.org/10.1016/j.coldregions.2007.04.019, 2008. a, b
Schweizer, J., Reuter, B., van Herwijnen, A., Richter, B., and Gaume, J.: Temporal evolution of crack propagation propensity in snow in relation to slab and weak layer properties, The Cryosphere, 10, 2637–2653, https://doi.org/10.5194/tc-10-2637-2016, 2016. a, b
Sigrist, C. and Schweizer, J.: Critical energy release rates of weak snowpack layers determined in field experiments, Geophys. Res. Lett., 34, L03502, https://doi.org/10.1029/2006GL028576, 2007. a
Simenhois, R. and Birkeland, K. W.: The Extended Column Test: Test effectiveness, spatial variability, and comparison with the Propagation Saw Test, Cold Reg. Sci. Technol., 59, 210–216, https://doi.org/10.1016/j.coldregions.2009.04.001, 2009. a
Simenhois, R., Birkeland, K., and van Herwijnen, A.: Measurements of ECT scores and crack-face friction in non-persistent weak layers: What are the implications for practitioners?, Proceedings of International Snow Science Workshop, Anchorage, AK, USA, 2012. a
SNOWPACK: available at: http://models.slf.ch/p/snowpack/, last access: 16 December 2019. a
Techel, F., Jarry, F., Kronthaler, G., Mitterer, S., Nairz, P., Pavšek, M., Valt, M., and Darms, G.: Avalanche fatalities in the European Alps: long-term trends and statistics, Geogr. Helv., 71, 147–159, https://doi.org/10.5194/gh-71-147-2016, 2016. a
van Herwijnen, A. and Heierli, J.: Measurement of crack-face friction in collapsed weak snow layers, Geophys. Res. Lett., 36, L23502, https://doi.org/10.1029/2009GL040389, 2009. a
van Herwijnen, A. and Jamieson, B.: High-speed photography of fractures in weak snowpack layers, Cold Reg. Sci. Technol., 43, 71–82, https://doi.org/10.1016/j.coldregions.2005.05.005, 2005. a, b, c, d
van Herwijnen, A. and Jamieson, B.: Snowpack properties associated with fracture initiation and propagation resulting in skier-triggered dry snow slab avalanches, Cold Reg. Sci. Technol., 50, 13–22, https://doi.org/10.1016/j.coldregions.2007.02.004, 2007a. a, b
van Herwijnen, A. and Jamieson, B.: Fracture character in compression tests, Cold Reg. Sci. Technol., 47, 60–68, https://doi.org/10.1016/j.coldregions.2006.08.016, 2007b. a
van Herwijnen, A., Schweizer, J., and Heierli, J.: Measurement of the deformation field associated with fracture propagation in weak snowpack layers, J. Geophys. Res.-Earth, 115, F03042, https://doi.org/10.1029/2009JF001515, 2010. a, b
van Herwijnen, A., Gaume, J., Bair, E. H., Reuter, B., Birkeland, K. W., and Schweizer, J.: Estimating the effective elastic modulus and specific fracture energy of snowpack layers from field experiments, J. Glaciol., 62, 997–1007, https://doi.org/10.1017/jog.2016.90, 2016. a
Vernay, M., Lafaysse, M., Mérindol, L., Giraud, G., and Morin, S.: Ensemble forecasting of snowpack conditions and avalanche hazard, Cold Reg. Sci. Technol., 120, 251–262, https://doi.org/10.1016/j.coldregions.2015.04.010, 2015. a
Vionnet, V., Brun, E., Morin, S., Boone, A., Faroux, S., Le Moigne, P., Martin, E., and Willemet, J.-M.: The detailed snowpack scheme Crocus and its implementation in SURFEX v7.2, Geosci. Model Dev., 5, 773–791, https://doi.org/10.5194/gmd-5-773-2012, 2012. a
Wever, N., Schmid, L., Heilig, A., Eisen, O., Fierz, C., and Lehning, M.: Verification of the multi-layer SNOWPACK model with different water transport schemes, The Cryosphere, 9, 2271–2293, https://doi.org/10.5194/tc-9-2271-2015, 2015. a
Wilks, D. S.: Statistical methods in the atmospheric sciences, 100, Academic press, 2011. a
WSL Institute for Snow and Avalanche Research SLF: WFJ_MOD: Meteorological and snowpack measurements from Weissfluhjoch, WSL Institute for Snow and Avalanche Research SLF, https://doi.org/10.16904/1, 2015. a