the Creative Commons Attribution 4.0 License.
the Creative Commons Attribution 4.0 License.
Simulated single-layer forest canopies delay Northern Hemisphere snowmelt
Nick Rutter
Christopher G. Fletcher
Leanne M. Wake
Single-layer vegetation schemes in modern land surface models have been found to overestimate diurnal cycles in longwave radiation beneath forest canopies. This study introduces an empirical correction, based on forest-stand-scale simulations, which reduces diurnal cycles of sub-canopy longwave radiation. The correction is subsequently implemented in land-only simulations of the Community Land Model version 4.5 (CLM4.5) in order to assess the impact on snow cover. Nighttime underestimations of sub-canopy longwave radiation outweigh daytime overestimations, which leads to underestimated averages over the snow cover season. As a result, snow temperatures are underestimated and snowmelt is delayed in CLM4.5 across evergreen boreal forests. Comparison with global observations confirms this delay and its reduction by correction of sub-canopy longwave radiation. Increasing insolation and day length change the impact of overestimated diurnal cycles on daily average sub-canopy longwave radiation throughout the snowmelt season. Consequently, delay of snowmelt in land-only simulations is more substantial where snowmelt occurs early.
- Article
(9732 KB) - Full-text XML
- BibTeX
- EndNote
Forest canopy cover modulates longwave radiation received by the ground, which consequently differs from atmospheric longwave radiation. This process is called longwave enhancement and has been shown to result in substantial positive net longwave radiation of the surface when snow cover is prevalent, especially under clear skies and during snowmelt (Webster et al., 2016). In contrast, net longwave radiation fluxes are typically negative for snow under clear-sky conditions in unforested areas, as has been observed for evergreen Canadian boreal forests (Harding and Pomeroy, 1996; Ellis et al., 2010). Moreover, forest cover has been reported to enhance snowmelt for subarctic open woodland during overcast days and early in the snowmelt season (Woo and Giesbrecht, 2000). However, the impact of forest coverage on snowmelt varies regionally as a function of forest density and meteorological conditions, with the importance of shortwave and longwave radiation changing throughout the snowmelt season (Sicart et al., 2004; Lundquist et al., 2013).
Meteorological conditions control longwave enhancement, as clear skies increase insolation and thereby vegetation temperature while radiative temperature of the sky is reduced (Sicart et al., 2004; Lundquist et al., 2013; Todt et al., 2018). Therefore, values for longwave enhancement, i.e. the ratio of below-canopy to above-canopy longwave radiation, are higher under clear skies but close to 1 or even smaller for overcast conditions due to similar vegetation temperature and radiative temperature of the sky. Vegetation density impacts longwave enhancement by scaling the respective contributions of vegetation and atmosphere to sub-canopy longwave radiation as well as by governing the impact of meteorological forcing on vegetation temperatures (Todt et al., 2018). While observations have shown trunks heating up due to insolation and emission of longwave radiation consequently increasing (Rowlands et al., 2002; Pomeroy et al., 2009), diurnal variations in tree temperatures depend on exposure to insolation and thus vegetation density (Webster et al., 2016).
About a fifth of seasonally snow-covered land over the Northern Hemisphere is covered by boreal forests (Rutter et al., 2009), indicating that the process of longwave enhancement affects a substantial fraction of global snow cover. Considerable challenges persist in the representation of snow cover and snowmelt in the current generation of climate models, as historical simulations from Climate Model Intercomparison Project Phase 5 (CMIP5) underestimate observed trends and interannual variability of the spring snow cover extent (SCE; Derksen and Brown, 2012; Brutel-Vuilmet et al., 2013; Rupp et al., 2013; Mudryk et al., 2014; Thackeray et al., 2016). Snow Model Intercomparison Project’s second phase (SnowMIP2) identified less skill in modelling snow for forested than for open sites, which was attributed to complex processes between atmosphere, snow, and vegetation (Essery et al., 2009; Rutter et al., 2009).
Among models displaying deficiencies in simulating snow cover evolution across boreal forests is the Community Land Model (CLM) version 4 and its parent, the Community Climate System Model version 4 (Thackeray et al., 2014, 2015). CLM uses a one-layer vegetation scheme, and CLM version 4.5 (CLM4.5) has been found to show deficiencies in simulation of sub-canopy longwave radiation and longwave enhancement with overestimated diurnal cycles under clear-sky conditions (Todt et al., 2018). Similar issues have been mitigated in CLM4.5 by subdividing the roughness layer (Bonan et al., 2018) and in SNOWPACK, a one-dimensional snow cover model, by partitioning the canopy into two layers with separate energy balances and consequently separate vegetation temperatures (Gouttevin et al., 2015), which results in different longwave radiation fluxes emitted upward and downward from the vegetation.
In order to avoid implementing multiple canopy layers in a global land model and associated computational costs, this study presents an alternative guided by the effect of separate vegetation layers on sub-canopy longwave radiation. A correction to sub-canopy longwave radiation is implemented in CLM4.5 to reduce overestimated diurnal cycles, damping variations in longwave radiation emitted downward and, consequently, increasing variations in longwave radiation emitted upward. While simulation of sub-canopy longwave radiation and longwave enhancement by land surface models has so far been assessed using forest-stand-scale forcing and evaluation data, this study uses land-only simulations of CLM4.5 and snow-off dates derived from global observations of snow water equivalent (SWE) to assess the impact of overestimated diurnal cycles in sub-canopy longwave radiation on simulated global snow cover and snowmelt. Therefore, this study has three objectives:
- i.
to develop a correction of sub-canopy longwave radiation simulated by single-layer vegetation in CLM4.5,
- ii.
to evaluate the effect of this correction on simulated diurnal cycles and daily averages of sub-canopy longwave radiation,
- iii.
to quantify the impact of corrected sub-canopy longwave radiation on snow cover and snowmelt across the Northern Hemisphere.
Section 2 presents methodological details about the treatment of sub-canopy longwave radiation in CLM4.5, the physical basis for the empirical correction, configuration of global land-only simulations, and calculation of the snow-off date from SWE observations. Calculation of correction factors is detailed in Sect. 3, and their impacts on the simulated energy balance and seasonal cycle of snow cover are presented in Sect. 4. We conclude with a brief discussion in Sect. 5.
2.1 Sub-canopy longwave radiation in CLM4.5
Vegetation in CLM4.5 is parameterized as a single layer using a “big-leaf” approach (Oleson et al., 2013). Sub-canopy longwave radiation is calculated as the sum of atmospheric longwave radiation LWatm and longwave radiation emitted by vegetation LWveg, weighted by vegetation emissivity εv:
using the Stefan–Boltzmann law with the Stefan–Boltzmann constant W m−2 K−4 and vegetation temperature Tv. Vegetation temperature is calculated based on an energy balance, net radiation minus turbulent heat fluxes. Radiative transfer of direct and diffuse shortwave radiation is calculated via a two-stream approximation (Sellers, 1985) considering one reflection from ground to canopy. Net longwave radiation is calculated from atmospheric longwave radiation, vegetation temperature, and (ground) surface temperature and determined by vegetation emissivity and emissivity of the ground. Calculation of turbulent heat fluxes in CLM4.5 is based on Monin–Obukhov similarity theory and described by Oleson et al. (2013). Vegetation emissivity depends on the leaf area index (LAI) and stem area index (SAI) and is calculated as
This parameter is a combination of emissivity in the physical sense and a weighing parameter based on vegetation density; however, we will stick to this denomination here for consistency with the nomenclature of the technical description of CLM4.5 (Oleson et al., 2013).
CLM4.5 subdivides grid cells based on land units, e.g. vegetated, glacier, or urban, and vegetated land units based on plant functional types (PFTs), with up to 16 possible PFTs as well as bare soil. Sub-canopy longwave radiation is calculated for each PFT present in a grid cell, with separate values of LAI, SAI, and vegetation temperature for each PFT. All PFTs within one vegetated land unit share a single column of snow and soil so that fluxes from vegetation to the ground are weighted averages over all PFTs. Consequently, changes in fluxes from an individual PFT affect snow cover beneath every PFT in a particular vegetated land unit.
2.2 Correction of sub-canopy longwave radiation in CLM4.5
For this study, a correction factor fcorr was implemented in CLM4.5 to reduce unphysical diurnal variations in sub-canopy longwave radiation. As atmospheric longwave radiation is an input variable to CLM4.5, from either forcing datasets or the atmospheric component of CESM (Community Atmosphere Model – CAM), correction factors were used to scale longwave radiation emitted from vegetation:
Conceptually, correction factors represent a vegetation structure consisting of multiple individual layers so that longwave radiation fluxes emitted upward and downward from the vegetation are no longer equal by design. In a multilayer canopy configuration, the uppermost layer contributes most to longwave radiation emitted upward to the atmosphere and directly absorbs incoming longwave and shortwave radiation fluxes. Conversely, the lowest layer contributes most to longwave radiation emitted downward to the surface but is insulated from atmospheric fluxes by the canopy layers above.
Using this multilayer canopy configuration as a guideline, longwave radiation emitted by the canopy was partitioned asymmetrically upward and downward in CLM4.5. The resulting above-canopy longwave radiation flux to the atmosphere was calculated as
with emissivity of the ground εg and temperature of the ground Tg. Ground emissivity in CLM4.5 is calculated as a weighted sum of emissivities of snow (0.97) and soil (0.96), weighted by the fraction of snow covering a grid cell. In Eq. (4), the first term represents atmospheric longwave radiation transmitted through the vegetation, reflected by the ground, and transmitted through the vegetation to the atmosphere; the second term represents longwave radiation emitted from the vegetation reaching the atmosphere; and the third term represents longwave radiation emitted by the ground and transmitted through the vegetation to the atmosphere. The second term combines longwave radiation emitted by the vegetation directly to the atmosphere (first term in brackets) and longwave radiation emitted downward from the vegetation, reflected by the ground, and transmitted through the vegetation to the atmosphere (second term in brackets). For fcorr>1, LWabove decreases as a reduction in the first term in brackets (2−fcorr) outweighs the increase in the second term in brackets , while LWsub in Eq. (3) increases. For fcorr<1, LWsub decreases and LWabove increases. Note that the sum of LWsub and LWabove was not changed by the introduction of fcorr, which guaranteed conservation of energy. The calculation of vegetation temperature in CLM4.5 was not altered by this approach so that the temperature of the single vegetation layer represented an average of multiple (theoretical) layers suggested by asymmetrical upward and downward longwave radiation fluxes.
2.3 Global offline simulations with CLM4.5
Offline simulations of CLM4.5 were forced by prescribed atmospheric data, using the CRUNCEP Version 7 dataset, covering 1981 to 2016 and thus snow seasons 1981–1982 to 2015–2016 (Viovy, 2018). The impact of correction factors on longwave enhancement, snow cover, and snowmelt was assessed by comparing two simulations, a control run (henceforth CTRL) and a run in which correction factors were implemented (henceforth CORR). Correction factors were applied to evergreen needleleaf trees in CLM4.5, as given in Eqs. (3) and (4). Two PFTs, needleleaf evergreen boreal trees (NEBTs) and needleleaf evergreen temperate trees (NETTs), represent evergreen forests across snow-covered areas in CLM4.5, and grid-cell coverage by these two PFTs is shown in Fig. 1a. Plant area index (PAI), the sum of LAI and SAI, is shown in Fig. 1b as a weighted average of NEBTs and NETTs.
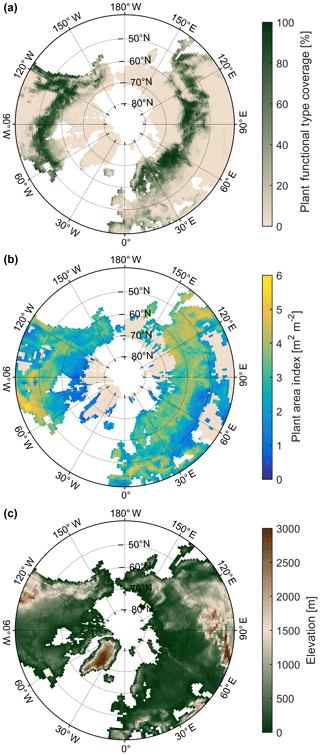
Figure 1Coverage of vegetated land unit within grid cell by combination of needleleaf evergreen boreal trees (NEBTs) and needleleaf evergreen temperate trees (NETTs) (a), plant area index (PAI) for combination of NEBTs and NETTs weighted by PFT fractions (b), and grid-cell average elevation (c) based on CLM4.5's surface dataset.
2.4 Global observations of snow-off date
A blended dataset of five global observation-based SWE products (henceforth Blended-5) covering the period 1981 to 2010 (Mudryk et al., 2015) was used to estimate snow-off dates across the Northern Hemisphere and evaluate simulation of snowmelt in CTRL and CORR. In contrast to simulations, observations display snow persisting for physically unrealistical durations, which necessitates a SWE threshold to estimate snow-off dates (Krinner et al., 2018). While Mudryk et al. (2017) and Krinner et al. (2018) used thresholds of 4 and 5 mm, respectively, for estimates of the spatial snow cover extent, a smaller SWE value was necessary to represent the precise timing of melt-out within individual grid cells. A threshold of 1 mm was used in this study to define melt-out for the Blended-5 mean, and the snow-off date was defined as the first day of a year for which the SWE did not exceed this threshold. Sensitivity of snow-off dates to threshold values was tested for the range 0.5 to 4 mm; however, the overall conclusions of this study are unchanged for different thresholds.
Todt et al. (2018) created a “toy model”, which utilized forest-stand-scale forcing data to evaluate sub-canopy longwave radiation in CLM4.5 and revealed systematic simulation errors that depend on meteorological conditions. These meteorological conditions were categorized via insolation and cloudiness represented by effective emissivity of the sky, which is calculated as
using air temperature Tair. Based on those stand-scale simulations, this study calculated the correction factor fcorr from εsky and insolation SWin as
Coefficients relate to the intercept of the equation, εsky, insolation, and interaction of εsky and insolation, respectively, and were calculated via multiple linear regression from stand-scale simulation errors expressed as ratios (Fig. 2) and observations of εsky and insolation at forest stands listed in Table 1. Consequently, correction factors were calculated as inverses of these ratios to scale longwave radiation in CLM4.5. For example, if stand-scale simulations revealed an overestimation of longwave radiation by 25 % for particular values of εsky and SWin, correction factors in global simulations would be for the same meteorological conditions.
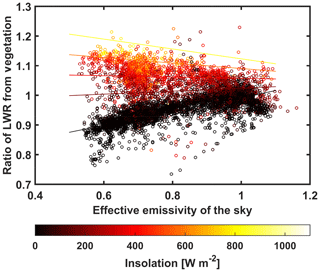
Figure 2Ratio of longwave radiation emitted from vegetation simulated by CLM4.5 and estimated from forest-stand observations as a function of effective emissivity of the sky (abscissa) and insolation (colour) for Alptal (season 2005), Seehornwald (season 2009), Sodankylä, and Cherskiy. Lines represent solutions of Eq. (6) for multiple values of insolation: 0, 200, 400, 600, and 800 W m−2.
Table 1Forest stands used for calculation of correction factors based on simulations by Todt et al. (2018). Vegetation density is given as plant area index (PAI), the one-sided area of plant components per unit ground surface area including stems, branches, and leaves or needles. Abisko and Cherskiy feature deciduous vegetation so that trees were leafless throughout the simulation periods, and PAI values do not consider leaves or needles.

As CLM4.5 only simulates longwave radiation emitted from vegetation, simulation errors were calculated for LWveg that was derived from sub-canopy longwave radiation via Eqs. (1) and (2) using measurements of atmospheric longwave radiation and PAI given in Table 1. Error ratios as a function of εsky and insolation as well as estimates based on regression coefficients are shown in Fig. 2. Nighttime estimates are a linear function of εsky as SWin=0, while daytime estimates include potential non-linear interactions of εsky and SWin. Both daytime and nighttime simulation errors generally increase in magnitude with clearer skies.
Regression coefficients as outlined in Eq. (6) are shown in Fig. 3 for every site and season, differentiated for day and night. The intercept b0 and regression coefficient for εsky b1 agree in sign for all sites and agree in magnitude for all sites except Abisko (Fig. 3a, b, d, and e), with little interannual variability for the two sites with multiple years of data (Alptal and Seehornwald). In contrast to Abisko, b0 and b1 for the deciduous forest at Cherskiy are similar to those for evergreen sites Alptal, Seehornwald, and Sodankylä despite featuring a different vegetation type, structure, and density. Regression coefficients involving insolation agree in sign but differ in magnitude among Alptal, Cherskiy, Seehornwald, and Sodankylä (Fig. 3c and f), with similar values for the latter two sites due to little interannual variability for Seehornwald. In contrast, interannual variability is large for Alptal, with higher magnitudes for all 4 years combined compared to Seehornwald and Sodankylä, while magnitudes are smallest for Cherskiy. For Abisko, five out of six regression coefficients display the smallest magnitudes due to deciduous vegetation and consequently low vegetation density as well as smaller simulation errors compared to other sites (Todt et al., 2018). Overall, uncertainties are largest for Abisko due to a short evaluation period, with no regression coefficient being significantly different from zero (or 1, as in the case of intercept b0).
For implementation in global simulation CORR, regression coefficients were calculated based on one season of each of the sites, Alptal, Cherskiy, Seehornwald, and Sodankylä, in order to balance dense and sparser sites. Despite featuring a deciduous PFT, Cherskiy was included, as regression coefficients are similar to evergreen sites. Individual seasons for Alptal, 2005, and Seehornwald, 2009, were chosen based on the similarity of regression coefficients to those of the respective site for all years combined. Regression coefficients for these four sites combined are shown as red lines in Fig. 3. Estimates of simulation errors based on these regression coefficients are shown in Fig. 2 and explain 60 % of variance in nighttime errors and 59 % of variance in daytime errors.
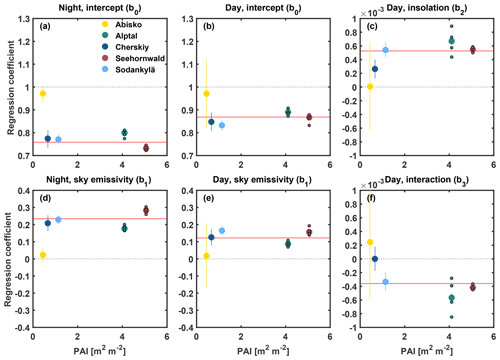
Figure 3Regression coefficients (Eq. 6) for forest stands at Abisko (yellow), Alptal (green), Cherskiy (dark blue), Seehornwald (maroon), and Sodankylä (light blue), with small circles indicating individual seasons for Alptal and Seehornwald and solid lines indicating 95 % confidence intervals. Red lines display regression coefficients calculated from a combination of Alptal (season 2005), Cherskiy, Seehornwald (season 2009), and Sodankylä. Intercept b0 and regression coefficient for εsky b1 are differentiated for night (a and d, respectively) and day (b and e, respectively). Regression coefficient for insolation b2 and regression coefficient for interaction of εsky and insolation b3 are shown for day only (c and f, respectively). Regression coefficients involving insolation have the unit of square metres per watt (W−1 m2).
4.1 Sub-canopy longwave radiation – case study Alptal, Switzerland
For the location of Alptal, in contrast to other forest stands used in this study, the forest stand and the CLM4.5 grid cell feature similarly high vegetation densities (PAIs of 4.1 and 3.7 m2 m−2, respectively) and thus similar vegetation emissivities εv (0.983 and 0.975, respectively). This allows for a comparison of diurnal cycles of sub-canopy longwave radiation as well as longwave enhancement between stand-scale measurements and offline simulations. Implementation of correction factors in CLM4.5 results in decreased sub-canopy longwave radiation during the daytime and increased sub-canopy longwave radiation during nighttime, thereby reducing diurnal cycles. For the grid cell representing Alptal, diurnal ranges decrease from about 70 to about 30 W m−2 during the snowmelt season (Fig. 4a and b). Observations at the forest stand show an average diurnal range of about 15 W m−2 during the snowmelt season. Simulations and observations display a similar range of intraseasonal variability but do not agree in evolution and daily average of sub-canopy longwave radiation. Implementation of correction factors increases average sub-canopy longwave radiation, as seen in Fig. 4b, for two reasons. Firstly, daytime correction depends on insolation, which changes throughout the snow cover season so that daytime correction varies to a higher degree than nighttime correction. Secondly, nights are longer than days prior to the boreal spring equinox, which leads to nighttime increases outweighing daytime decreases. Consequently, correction results in increased average sub-canopy longwave radiation even for equal magnitudes of daytime overestimation and nighttime underestimation.
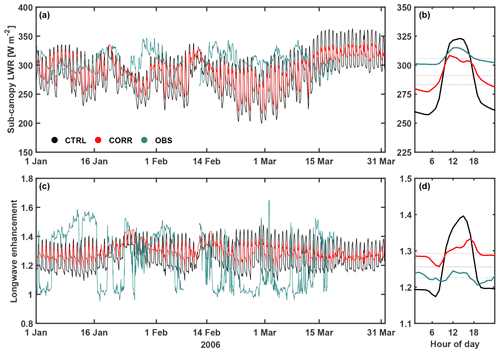
Figure 4Hourly time series (a, c), diurnal cycles (solid in b and d), and JFM averages (dotted in b and d) of sub-canopy longwave radiation (a, b) and longwave enhancement (c, d) for the snowmelt season in 2006 at Alptal, Switzerland. Measurements at the forest stand (OBS; green) are shown for comparison with offline simulations CTRL (black) and CORR (red) for boreal evergreen needleleaf trees in the corresponding grid cell of Alptal, Switzerland. Gaps in measurements are due to quality checks and excluded from calculation of diurnal cycle and JFM average.
Comparison of simulated and measured longwave enhancement is shown in Fig. 4c and d for Alptal. As for sub-canopy longwave radiation, the diurnal cycle of simulated longwave enhancement is reduced by implementation of correction factors with increased enhancement at night and decreased enhancement at daytime. Reduction of daytime longwave enhancement increases throughout the snowmelt season, which is due to increasing insolation and thus increasing reduction of sub-canopy longwave radiation during daytime. Longwave enhancement values vary between 1.1 and 1.4 in CTRL, which is predominately driven by diurnal cycles. The diurnal cycle of longwave enhancement is reduced by more than 50 % in CORR, resulting in a diurnal range similar to observations and increased daily average longwave enhancement. Simulated longwave enhancement displays little intraseasonal variability, with variations mostly due to the overestimated diurnal cycle. This indicates that intraseasonal variability in sub-canopy longwave radiation is largely due to variations in atmospheric longwave radiation. In contrast, measured longwave enhancement values range from less than 1 to more than 1.6 and display little diurnal variability but high variability on synoptic timescales, which results in a different daily average of longwave enhancement compared to simulations. Moreover, lower average longwave enhancement for observations indicates more overcast conditions, which lead to smaller diurnal cycles in sub-canopy longwave radiation compared to simulations. Therefore, correction factors improve the realism of diurnal cycles of sub-canopy longwave radiation and longwave enhancement, encouraging usage for evaluation of the impact on snow cover.
The contrast in variability between simulated and observed longwave enhancement can be seen in Fig. 5. Observations show a large range of longwave enhancement values that are closely tied to effective emissivity of the sky, which represents clear-sky (low εsky) and overcast (high εsky) conditions. Observed longwave enhancement increases for decreasing εsky as the contrast between vegetation temperatures (increasing due to higher insolation) and the effective temperature of the sky increase. Spread in observed longwave enhancement is small throughout the range of εsky, indicating little diurnal variability and the process of longwave enhancement depending on meteorological conditions. Simulations display a narrow range of εsky, which causes the lack of intraseasonal variability seen in Fig. 4c. The spread in simulated longwave enhancement values is substantially larger compared to observations for the respective range in εsky, representing overestimated diurnal cycles. Implementation of correction factors reduces the spread in longwave enhancement values and increases average longwave enhancement (see Fig. 4d); however, spread in longwave enhancement is still overestimated and average longwave enhancement is underestimated in CORR compared to observations for the respective range in εsky.
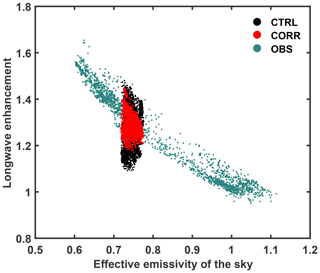
Figure 5Longwave enhancement measured (OBS; green) at the forest stand of Alptal, Switzerland, and simulated in CTRL (black) and CORR (red) for boreal evergreen needleleaf trees in the corresponding grid cell of Alptal, Switzerland, as a function of effective emissivity of the sky. Each data point represents an hourly average seen in Fig. 4c.
4.2 Longwave enhancement and limited spatial variability in εsky
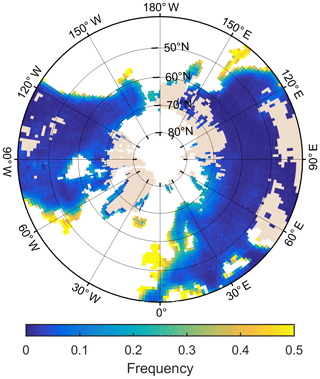
Lack of variability in simulated εsky, as seen for the grid cell of Alptal, across the Northern Hemisphere results in spatially similar correction factors that are largely dependent on insolation. However, variability in both insolation and diurnal ranges of atmospheric longwave radiation indicates small variations in meteorological forcing that are not represented by εsky. Therefore, εsky in simulations may indicate clear-sky conditions even when insolation and atmospheric longwave radiation suggest more overcast conditions, resulting in overestimated correction factors and overcorrection of sub-canopy longwave radiation. This overcorrection results in larger nighttime than daytime values of sub-canopy longwave radiation in contrast to atmospheric longwave radiation and occurs mostly along continental coasts (Fig. 6). Consequently, a contour line is used in the following to denote an overcorrection for 10 % of days.
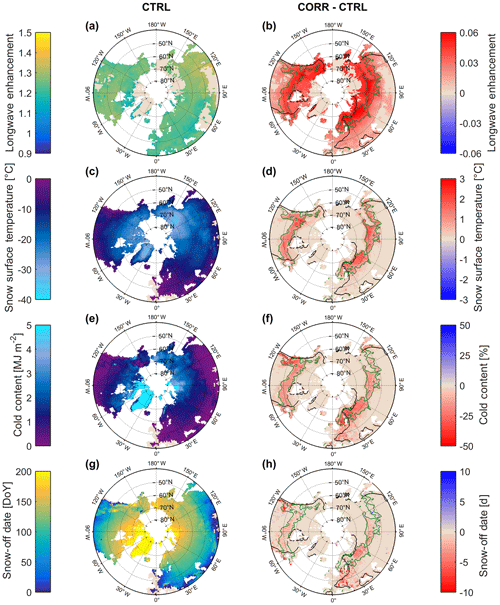
Figure 7Averages in CTRL (a, c, e, g) and differences between CORR and CTRL (b, d, f, h) for longwave enhancement beneath evergreen needleleaf trees (a, b), snow surface temperature (c, d), cold content (e, f), and snow-off date (g, h). Longwave enhancement is averaged over December to May, while snow surface temperature and cold content are averaged over entire snow cover seasons. Differences between CORR and CTRL are calculated as averages of differences between each individual snow cover season. For panels (c–h), a mask is applied to filter out grid cells that are not perennially covered in snow. Black lines demarcate continental areas with less than 10 % of overcorrected days. Green lines demarcate areas with coverage by evergreen needleleaf trees of at least 50 %.
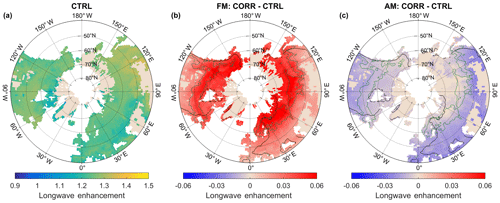
Figure 8Longwave enhancement beneath evergreen needleleaf trees as average over December to May in CTRL (a; as in Fig. 7) and as difference between CORR and CTRL over February and March (b) and over April and May (c). Differences between CORR and CTRL are calculated as averages of differences between each individual year. Black lines demarcate continental areas with less than 10 % of overcorrected days. Green lines demarcate areas with coverage by evergreen needleleaf trees of at least 50 %.
To demonstrate the impact of correction factors spatially, maps of longwave enhancement beneath evergreen needleleaf forests in CLM4.5 are shown in Fig. 7a and b. Averages over boreal winter and spring show an enhancement of longwave radiation beneath canopies by about 20 % to 30 % and display little differences across boreal forests, which is due to small spatial variability in both εsky and vegetation density (Fig. 1). CORR displays increased average longwave enhancement north of 40∘ N, with an additional enhancement of longwave radiation of up to 5 % beneath dense boreal forests. Changes in longwave enhancement generally increase with latitude, as daytime correction factors vary with insolation while nighttime correction factors are independent of latitude. A higher increase in longwave enhancement can be seen for higher vegetation density within regions covered by boreal forests (Fig. 1b) due to weighting of contributions to sub-canopy longwave radiation (Eq. 3).
4.3 Snow cover and snowmelt
Changes in sub-canopy longwave radiation induced by the correction increase the net energy flux to the surface, which can be seen for grid-cell-averaged snow surface temperature (Fig. 7c and d). Simulated average snow surface temperatures are determined by latitude, topography, and continent, reaching values of less than −40 ∘C in the mountainous regions of northeastern Siberia (Fig. 1c), and range between −20 and −15 ∘C for boreal forests, the outlines of which can be seen in central Siberia and central North America. The impact of correction factors is limited to grid cells for which vegetation is dominated by evergreen needleleaf trees and implementation results in an increase in average snow surface temperature of up to 2 ∘C. The lack of spatial variability is caused by little spatial variability in meteorological conditions, high vegetation density, and similarly high PFT coverage across boreal forests (Fig. 1a and b).
Cold content, the energy required to raise snow temperatures to 0 ∘C, is used to quantify the impact of correction factors on the entire snow column. Average cold content simulated by CLM4.5 mostly reaches values of up to 4 MJ m−2 and exceeds 5 MJ m−2 only in glaciated grid cells (Fig. 7e). In CTRL, simulated average cold content ranges between 1.5 and 3 MJ m−2 across boreal forests, with the lowest values in northeastern Europe and highest values in eastern Siberia, western Canada, and Quebec. Relative changes in cold content from CTRL to CORR display spatial differences, with cold content generally decreasing across boreal forests (Fig. 7f). Reductions in average cold content reach up to 30 % in northeastern Europe and western North America and up to 20 % in central North America. Across Siberian boreal forests, relative reductions decrease from west to east from more than 20 % to about 10 %. Spatial differences in relative reductions correspond to spatial differences in average cold content, with higher relative reductions for smaller averages, representing a more even spatial pattern of absolute reductions in cold content as indicated by changes in snow surface temperature (Fig. 7d).
Spatial patterns in the snow-off date are similar to those in cold content, with higher cold content corresponding to later melt-out (Fig. 7g and h). Changes in the snow-off date from CTRL to CORR display stark spatial contrasts, with melt-out happening up to 10 d earlier in central Europe and on the western coast of North America. Melt-out is advanced by about 5 d for boreal forests in northeastern Europe and western Siberia and slightly less for boreal forests in central North America. In contrast, melt-out is delayed in the mountains of southeastern Siberia (Fig. 1c), where melt-out occurs late among boreal forests.
As offline simulations lack spatial variability in εsky, latitude (through insolation) and duration of snow on the ground (through day length) control spatial differences in the impact of correction of sub-canopy longwave radiation on the snow-off date. Changes in longwave enhancement due to correction of sub-canopy longwave radiation before and after the boreal spring equinox, approximated by averages over February–March and April–May, display opposite signs across the Northern Hemisphere (Fig. 8), with shorter (longer) days than nights before (after) the equinox resulting in an increase (decrease) in daily average longwave enhancement. Generally, lower insolation at higher latitudes leads to a more positive impact of correction on daily average longwave enhancement, increasing (decreasing) positive (negative) changes in longwave enhancement with increasing latitude before (after) the boreal spring equinox. Across mid-latitudes, the increase in daily average longwave enhancement over February and March is roughly similar to the decrease in daily average longwave enhancement over April and May, while the increase over February and March outweighs the decrease over April and May across high latitudes, including most of the regions covered by boreal forests.
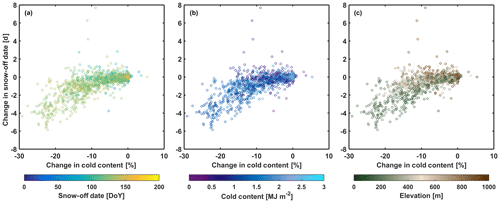
Reasons for spatial differences in changes of the snow-off date across Siberian boreal forests are explored in Fig. 9. Snow-off dates are similar spatially in CTRL, likely caused by higher elevations in southeastern Siberia compensating for less cold content, and melt-out generally occurs past the boreal spring equinox in northwestern and southeastern Siberia. However, higher insolation for southeastern Siberia results in higher reductions of daytime sub-canopy longwave radiation by correction factors and consequently smaller increases in daily average sub-canopy longwave radiation prior to the boreal spring equinox compared to northwestern Siberia. Although changes in sub-canopy longwave radiation are still positive in southeastern Siberia, when accumulated over the snow season, causing a decrease in cold content, reduction in daily average sub-canopy longwave radiation by correction factors past the boreal spring equinox cancels out the previous increase, and consequently, snowmelt is slightly delayed. In contrast to southeastern Siberia, melt-out is slightly accelerated in central North America, although both latitude and the melt-out date are similar, as relative reductions in cold content are generally higher. However, differences in changes in the melt-out date between central North America and southeastern Siberia are minor.
4.4 Snow-off date in comparison to observations
Simulated and observed snow-off dates are compared in Fig. 10 for grid cells with consistent snow cover throughout the preceding December and coverage by evergreen needleleaf trees of at least 50 %. The simulations CTRL and CORR generally feature a narrower probability density function (PDF) of snow-off dates, indicating a shorter snowmelt season, and later melt-out compared to observations across the entire Northern Hemisphere (Fig. 10a). While shapes of observed PDFs are well represented by simulations over Eurasia (Fig. 10b and d), observations show a clearer, shorter peak of melt-out compared to simulations over mountainous western North America (Fig. 10c). Correction of sub-canopy longwave radiation displays little impact when accumulated over the entire Northern Hemisphere; however, it systematically reduces the delay of simulated snow-off dates throughout the snowmelt season. PDFs of snow-off dates for regional subsets reflect spatial patterns seen in Fig. 7h, with minor differences between CTRL and CORR over most of western North America (Fig. 10c) and eastern Siberia (Fig. 10d) but substantial acceleration of snow-off dates over western Siberia and eastern Europe (Fig. 10b) due to correction of sub-canopy longwave radiation.
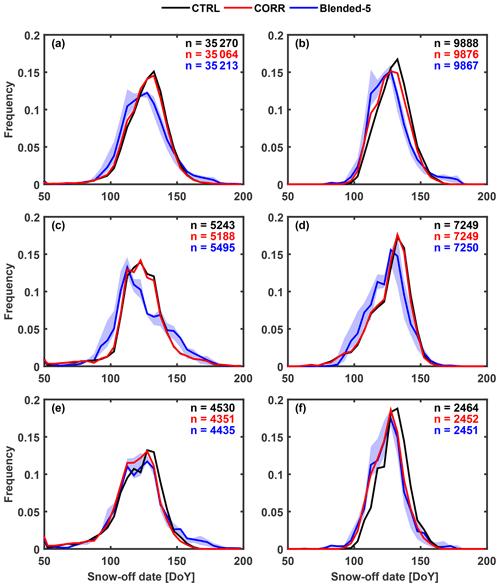
Figure 10PDFs of snow-off dates and sample sizes n for CTRL (black), CORR (red), and observations (blue) over 1982–2010 across grid cells with coverage by evergreen needleleaf trees of at least 50 % and snow cover persisting through December. Observational estimates are shown for SWE thresholds of 1 mm (bold line) and 0.5 to 4 mm (shaded area). Panels show entire Northern Hemisphere (a), eastern Europe and western Siberia (b; 49 to 66∘ N and 29.5 to 90.5∘ E), western North America (c; 39.5 to 66∘ N and 104.5 to 125.5∘ W), and eastern Siberia (d, 44 to 66∘ N and 90.5 to 135.5∘ E). Panels (e) and (f) are as panels (a) and (b), respectively, but only for grid cells with average changes in snow-off dates of at least 3 d (as seen in Fig. 7h).
The regionally limited impact of corrected sub-canopy longwave radiation is highlighted by filtering PDFs of the snow-off date for grid cells with average differences in the snow-off date between CORR and CTRL of at least 3 d (Fig. 10e and f). Correction of sub-canopy longwave radiation improves timing of melt-out in filtered grid cells especially over western Siberia and eastern Europe, where the filtered PDF for CORR, in contrast to CTRL, closely resembles observations. PDFs of snow-off dates derived from the Blended-5 SWE display sensitivity to threshold choices; however, this uncertainty is generally smaller than differences between simulations and observations.
Todt et al. (2018) found roughly similar magnitudes for daytime overestimations and nighttime underestimations of sub-canopy longwave radiation in CLM4.5; however, this study shows that different durations of day and night over the snow cover season result in a net positive impact of correction on daily averages of sub-canopy longwave radiation. Correction factors change throughout the snowmelt season due to increasing insolation and length of day. Consequently, net impact on daily averages of sub-canopy longwave radiation varies, resulting in spatial differences in the impact on cold content over the snow cover season and the melt-out date. Net increase in sub-canopy longwave radiation during the snow cover season is highest for regions with early snowmelt, where snow is already comparatively warm, which results in accelerated snowmelt. Lundquist et al. (2013) showed that forests enhance snowmelt compared to open areas in regions where winters are warm and mid-winter melt events happen, during which longwave enhancement outweighs shading. Spatial differences in change of the melt-out date broadly agree with this pattern, as the highest acceleration of melt occurs for regions with warmer winters as indicated by snow surface temperatures (Fig. 7c), suggesting that mid-winter melt events could be underestimated by CLM4.5. Conversely, correction of sub-canopy longwave radiation results in slightly delayed snowmelt in southeastern Siberia despite average cold content over the entire snow cover season being reduced. This delay is due to melt-out happening substantially later than the boreal spring equinox and high insolation during the snowmelt period, which result in reduction in daytime sub-canopy longwave radiation outweighing increased sub-canopy longwave radiation during night. Consequently, overestimated diurnal cycles of sub-canopy longwave radiation in CLM4.5 lead to spatial differences in the impact on snowmelt timing across boreal forests in offline simulations.
Previous comparison between offline simulations of CLM4 and observations have shown CLM4 failing to accurately simulate the timing of both snow ablation and snow accumulation across boreal forests, with snowmelt compressed into the period of March to May (Thackeray et al., 2014, 2015). This shortened snowmelt season is confirmed by comparison of offline simulations of CLM4.5 with global observations, and correction of sub-canopy longwave radiation is found to have only minor impact on this deficiency. However, offline simulations also display a delay in snow-off dates compared to observations, which is decreased by correction of sub-canopy longwave radiation. This impact is small when considered over the entire Northern Hemisphere, but its importance varies regionally. For example, correction of sub-canopy longwave radiation substantially improves simulated snowmelt timing over western Siberia, which suggests that overestimated diurnal cycles in sub-canopy longwave radiation are a contributing factor to delayed snowmelt in offline simulations of CLM4.5. Thackeray et al. (2014, 2015) also showed snow cover fraction increasing earlier than observed across boreal forests in CLM4, and although this study does not focus on the snow accumulation period, processes governing the influence of correction factors are the same as for the snow ablation period. As most snowfall occurs past the boreal autumn equinox, when daily average sub-canopy longwave radiation is increased due to correction factors, correction could delay the accumulation of snow across boreal forests. Therefore, overestimated diurnal cycles in sub-canopy longwave radiation also potentially contribute to this deficiency in the simulation of snow cover timing.
Changing seasonality in a warming climate may have implications for snowmelt and longwave enhancement. Future warming will lead to earlier snowmelt, when less energy from insolation is available for melt, which will likely result in lower melt rates (Musselman et al., 2017). A shortened snow season indicates more asymmetrical lengths of day and night during snowmelt, and consequently, overestimated diurnal cycles of sub-canopy longwave radiation in CLM4.5 could result in even higher underestimations in daily averages. Moreover, underestimated sub-canopy longwave radiation suggests that CLM4.5 underestimates melt rates in general. In turn, future projections are complex, as corrected and thus increased sub-canopy longwave radiation might cancel out reduced energy from insolation due to earlier snowmelt. Nonetheless, the contribution of longwave enhancement to snowmelt is likely to increase in the future, further necessitating accurate simulation of sub-canopy longwave radiation.
Implementation of correction factors resulted in realistic average diurnal ranges of sub-canopy longwave radiation and longwave enhancement, but more substantial underestimation than overestimation of longwave enhancement seen in Fig. 5 suggests that the impact of shortcomings in CLM4.5 on snow cover and snowmelt might still be underestimated by this study. Gouttevin et al. (2015) and Todt et al. (2018) have shown that the implementation of biomass heat storage results in a net positive impact on sub-canopy longwave radiation as well as a slight reduction of diurnal cycles. This suggests that heat storage by biomass could further reduce nighttime underestimation in CLM4.5 and improve the simulation of sub-canopy longwave radiation and longwave enhancement.
This study assessed the impact of deficiencies in simulated longwave enhancement by forest canopies on snow cover in CLM4.5. Sub-canopy longwave radiation simulated by CLM4.5's single-layer vegetation was corrected based on the damping effect of multiple canopy layers. Correction factors were derived from forest-stand-scale simulations and subsequently implemented for evergreen needleleaf trees in global land-only simulations of CLM4.5. Correction reduces overestimated diurnal cycles of sub-canopy longwave radiation by decreasing daytime overestimations and nighttime underestimations. This results in a net increase of sub-canopy longwave radiation over the entire snow cover season due to longer nights than days. Consequently, correction results in increasing average snow temperatures and earlier melt-out, indicating that CLM4.5 underestimates snow temperatures and delays snowmelt due to overestimated diurnal cycles of sub-canopy longwave radiation. Comparison with observations confirmed a delay of melt-out in land-only simulations of CLM4.5 across boreal forests, which is decreased by correction of sub-canopy longwave radiation. While land-only simulations exhibit a spatially uniform underestimation of snow temperatures by CLM4.5 across evergreen boreal forests, the impact of correction on melt-out timing displays spatial differences that depend on insolation and duration of snow on the ground. The effect of overestimated diurnal cycles on daily average sub-canopy longwave radiation changes throughout the snowmelt season as insolation and length of day increase. Consequently, CLM4.5 delays snowmelt more in regions of warmer snow cover and earlier melt-out. However, spatial variability in the impact on snow cover is limited in land-only simulations of CLM4.5 due to a lack of variability in meteorological conditions.
Code is available on GitHub at https://github.com/mtodt/2018_OfflineSimulations (Todt, 2018a) in order to derive correction factors, implement correction factors in CLM4.5, post-process simulations, and create the figures shown in this study. Meteorological observations for forest stands are available as follows: (1) on GitHub at https://github.com/mtodt/2018_ToyModel (Todt, 2018b) for Alptal and Seehornwald, (2) from the British Atmospheric Data Centre at http://catalogue.ceda.ac.uk/uuid/9c8c86ed78ae4836a336d45cbb6a757c (Natural Environment Research Council et al., 2013a) for Sodankylä and http://catalogue.ceda.ac.uk/uuid/6947880b98d32e249a8638ebe768efd2 (Natural Environment Research Council et al., 2013b) for Abisko, and (3) from the Arctic Data Center at https://doi.org/10.18739/A2BG2H890 (Kropp, 2018) for Cherskiy. Forest-stand-scale simulations were performed by Todt et al. (2018), and the code is available on GitHub at https://github.com/mtodt/2018_ToyModel. The Blended-5 product of the daily observed snow water equivalent is available from the National Snow and Ice Data Center at http://nsidc.org/data/nsidc-0668 (Mudryk and Derksen, 2017).
MT, NR, and CF designed the experiments. MT and LW performed the simulations and MT analysed them. MT prepared the paper, with contributions from all co-authors.
The authors declare that they have no conflict of interest.
We want to thank Tobias Jonas and Clare Webster for providing data from Alptal and Seehornwald as well as Heather Kropp and Mike Loranty for their support using data from Cherskiy. We would also like to thank two anonymous reviewers, whose helpful comments improved this paper.
This research was supported by the Canadian Sea Ice and Snow Evolution (CanSISE) Network, which is funded by the Natural Science and Engineering Research Council of Canada's Climate Change and Atmospheric Research programme. Funding was also provided by the US National Science Foundation (grant PLR-1417745) and the Picker Interdisciplinary Science Institute at Colgate University through Mike Loranty.
This paper was edited by Florent Dominé and reviewed by two anonymous referees.
Bonan, G. B., Patton, E. G., Harman, I. N., Oleson, K. W., Finnigan, J. J., Lu, Y., and Burakowski, E. A.: Modeling canopy-induced turbulence in the Earth system: a unified parameterization of turbulent exchange within plant canopies and the roughness sublayer (CLM-ml v0), Geosci. Model Dev., 11, 1467–1496, https://doi.org/10.5194/gmd-11-1467-2018, 2018. a
Brutel-Vuilmet, C., Ménégoz, M., and Krinner, G.: An analysis of present and future seasonal Northern Hemisphere land snow cover simulated by CMIP5 coupled climate models, The Cryosphere, 7, 67–80, https://doi.org/10.5194/tc-7-67-2013, 2013. a
Derksen, C. and Brown, R.: Spring snow cover extent reductions in the 2008–2012 period exceeding climate model projections, Geophys. Res. Lett., 39, L19504, https://doi.org/10.1029/2012GL053387, 2012. a
Ellis, C. R., Pomeroy, J. W., Brown, T., and MacDonald, J.: Simulation of snow accumulation and melt in needleleaf forest environments, Hydrol. Earth Syst. Sci., 14, 925–940, https://doi.org/10.5194/hess-14-925-2010, 2010. a
Essery, R., Rutter, N., Pomeroy, J., Baxter, R., Stähli, M., Gustafsson, D., Barr, A., Bartlett, P., and Elder, K.: SnowMIP2: An evaluation of forest snow process simulation, B. Am. Meteor. Soc., 90, 1130–1135, https://doi.org/10.1175/2009BAMS2629.1, 2009. a
Gouttevin, I., Lehning, M., Jonas, T., Gustafsson, D., and Mölder, M.: A two-layer canopy model with thermal inertia for an improved snowpack energy balance below needleleaf forest (model SNOWPACK, version 3.2.1, revision 741), Geosci. Model Dev., 8, 2379–2398, https://doi.org/10.5194/gmd-8-2379-2015, 2015. a, b
Harding, R. J. and Pomeroy, J. W.: The energy balance of the winter boreal landscape, J. Climate, 9, 2778–2787, https://doi.org/10.1175/1520-0442(1996)009<2778:TEBOTW>2.0.CO;2, 1996. a
Krinner, G., Derksen, C., Essery, R., Flanner, M., Hagemann, S., Clark, M., Hall, A., Rott, H., Brutel-Vuilmet, C., Kim, H., Ménard, C. B., Mudryk, L., Thackeray, C., Wang, L., Arduini, G., Balsamo, G., Bartlett, P., Boike, J., Boone, A., Chéruy, F., Colin, J., Cuntz, M., Dai, Y., Decharme, B., Derry, J., Ducharne, A., Dutra, E., Fang, X., Fierz, C., Ghattas, J., Gusev, Y., Haverd, V., Kontu, A., Lafaysse, M., Law, R., Lawrence, D., Li, W., Marke, T., Marks, D., Ménégoz, M., Nasonova, O., Nitta, T., Niwano, M., Pomeroy, J., Raleigh, M. S., Schaedler, G., Semenov, V., Smirnova, T. G., Stacke, T., Strasser, U., Svenson, S., Turkov, D., Wang, T., Wever, N., Yuan, H., Zhou, W., and Zhu, D.: ESM-SnowMIP: assessing snow models and quantifying snow-related climate feedbacks, Geosci. Model Dev., 11, 5027–5049, https://doi.org/10.5194/gmd-11-5027-2018, 2018. a, b
Kropp, H.: Siberian boreal forest energy balance (ViPER project), Cherskiy, Sakha Republic, Russia, 2016–2017, Arctic Data Center, https://doi.org/10.18739/A2BG2H890, 2018. a
Lundquist, J. D., Dickerson-Lange, S. E., Lutz, J. A., and Cristea, N. C.: Lower forest density enhances snow retention in regions with warmer winters: A global framework developed from plot-scale observations and modeling, Water Resour. Res., 49, 6356–6370, https://doi.org/10.1002/wrcr.20504, 2013. a, b, c
Mudryk, L. R. and Derksen, C.: CanSISE Observation-Based Ensemble of Northern Hemisphere Terrestrial Snow Water Equivalent, Version 2, Boulder, Colorado USA, NSIDC: National Snow and Ice Data Center, https://doi.org/10.5067/96ltniikJ7vd, 2017. a
Mudryk, L. R., Kushner, P. J., and Derksen, C.: Interpreting observed northern hemisphere snow trends with large ensembles of climate simulations, Clim. Dynam., 43, 345–359, https://doi.org/10.1007/s00382-013-1954-y, 2014. a
Mudryk, L. R., Derksen, C., Kushner, P. J., and Brown, R.: Characterization of Northern Hemisphere Snow Water Equivalent Datasets, 1981-2010, J. Climate, 28, 8037–8051, https://doi.org/10.1175/JCLI-D-15-0229.1, 2015. a
Mudryk, L. R., Kushner, P. J., Derksen, C., and Thackeray, C.: Snow cover response to temperature in observational and climate model ensembles, Geophys. Res. Lett., 44, 919–926, https://doi.org/10.1002/2016GL071789, 2017. a
Musselman, K. N., Clark, M. P., Liu, C., Ikeda, K., and Rasmussen, R.: Slower snowmelt in a warmer world, Nat. Clim. Change, 7, 214–219, https://doi.org/10.1038/nclimate3225, 2017. a
Natural Environment Research Council, Essery, R., Huntley, B., and Rutter, N.: Snow-Vegetation-Atmosphere Interactions over Heterogeneous Landscapes Project: Vegetation and Meteorological Observations at the Sodankyla Site, NCAS British Atmospheric Data Centre, available at: http://catalogue.ceda.ac.uk/uuid/9c8c86ed78ae4836a336d45cbb6a757c (last access: 20 June 2017), 2013a. a
Natural Environment Research Council, Essery, R., Huntley, B., and Rutter, N.: Snow-Vegetation-Atmosphere Interactions over Heterogeneous Landscapes Project: Vegetation and Meteorological Observations at the Abisko Site, NCAS British Atmospheric Data Centre, available at: http://catalogue.ceda.ac.uk/uuid/6947880b98d32e249a8638ebe768efd2 (last access: 20 June 2017), 2013b. a
Oleson, K. W., Lawrence, D. M., Bonan, G. B., Drewniak, B., Huang, M., Koven, C. D., Levis, S., Li, F., Riley, W. J., Subin, Z. M., Swenson, S. C., Thornton, P. E., Bozbiyik, A., Fisher, R., Kluzek, E., Lamarque, J.-F., Lawrence, P. J., Leung, L. R., Lipscomb, W., Muszala, S., Ricciuto, D. M., Sacks, W., Sun, Y., Tang, J., and Yang, Z.-L.: Technical Description of version 4.5 of the Community Land Model (CLM), Tech. rep., National Center for Atmospheric Research, https://doi.org/10.5065/D6RR1W7M, 2013. a, b, c
Pomeroy, J. W., Marks, D., Link, T., Ellis, C., Hardy, J., Rowlands, A., and Granger, R.: The impact of coniferous forest temperature on incoming longwave radiation to melting snow, Hydrol. Proc., 23, 2513–2525, https://doi.org/10.1002/hyp.7325, 2009. a
Rowlands, A., Pomeroy, J., Hardy, J., Marks, D., Elder, K., and Melloh, R.: Small-Scale Spatial Variability of Radiant Energy for Snowmelt in a Mid-Latitude Sub-Alpine Forest, in: Proceedings of the 59th Eastern Snow Conference, Stowe, Vermont, USA, 109–117, available at: http://www.easternsnow.org/proceedings/2002/010_Rowlands.pdf (last access: 11 January 2017), 2002. a
Rupp, D. E., Mote, P. W., Bindoff, N. L., Stott, P. A., and Robinson, D. A.: Detection and Attribution of Observed Changes in Northern Hemisphere Spring Snow Cover, J. Climate, 26, 6904–6914, https://doi.org/10.1175/JCLI-D-12-00563.1, 2013. a
Rutter, N., Essery, R., Pomeroy, J., Altimir, N., Andreadis, K., Baker, I., Barr, A., Bartlett, P., Boone, A., Deng, H., Douville, H., Dutra, E., Elder, K., Ellis, C., Feng, X., Gelfan, A., Goodbody, A., Gusev, Y., Gustafsson, D., Hellström, R., Hirabayashi, Y., Hirota, T., Jonas, T., Koren, V., Kuragina, A., Lettenmaier, D., Li, W.-P., Luce, C., Martin, E., Nasonova, O., Pumpanen, J., Pyles, R. D., Samuelsson, P., Sandells, M., Schädler, G., Shmakin, A., Smirnova, T. G., Stähli, M., Stöckli, R., Strasser, U., Su, H., Suzuki, K., Takata, K., Tanaka, K., Thompson, E. Vesala, T., Viterbo, P., Wiltshire, A., Xia, K., Xue, Y., and Yamazaki, T.: Evaluation of forest snow processes models (SnowMIP2), J. Geophys. Res.-Atmos., 114, D06111, https://doi.org/10.1029/2008JD011063, 2009. a, b
Sellers, P. J.: Canopy reflectance, photosynthesis and transpiration, Int. J. Remote Sens., 6, 1335–1372, https://doi.org/10.1080/01431168508948283, 1985. a
Sicart, J. E., Pomeroy, J. W., Essery, R. L. H., Hardy, J., Link, T., and Marks, D.: A Sensitivity Study of Daytime Net Radiation during Snowmelt to Forest Canopy and Atmospheric Conditions, J. Hydrometeorol., 5, 774–784, https://doi.org/10.1175/1525-7541(2004)005<0774:ASSODN>2.0.CO;2, 2004. a, b
Thackeray, C. W., Fletcher, C. G., and Derksen, C.: The influence of canopy snow parameterizations on snow albedo feedback in boreal forest regions, J. Geophys. Res.-Atmos., 119, 9810–9821, https://doi.org/10.1002/2014JD021858, 2014. a, b, c
Thackeray, C. W., Fletcher, C. G., and Derksen, C.: Quantifying the skill of CMIP5 models in simulating seasonal albedo and snow cover evolution, J. Geophys. Res.-Atmos., 120, 5831–5849, https://doi.org/10.1002/2015JD023325, 2015. a, b, c
Thackeray, C. W., Fletcher, C. G., Mudryk, L. R., and Derksen, C.: Quantifying the Uncertainty in Historical and Future Simulations of Northern Hemisphere Spring Snow Cover, J. Climate, 29, 8647–8663, https://doi.org/10.1175/JCLI-D-16-0341.1, 2016. a
Todt, M.: Calculation, implementation, and analysis of correction of sub-canopy longwave radiation in CLM4.5, available at: https://github.com/mtodt/2018_OfflineSimulations (last access: 4 January 2019), 2018a. a
Todt, M.: Toy Model to analyze simulation of sub-canopy lonwave radiation in CLM4.5, available at: https://github.com/mtodt/2018_ToyModel, last access: 28 May 2018b. a
Todt, M., Rutter, N., Fletcher, C. G., Wake, L. M., Bartlett, P. A., Jonas, T., Kropp, H., Loranty, M. M., and Webster, C.: Simulation of Longwave Enhancement in Boreal and Montane Forests, J. Geophys. Res.-Atmos., 123, 13731–13747, https://doi.org/10.1029/2018JD028719, 2018. a, b, c, d, e, f, g, h, i
Viovy, N.: CRUNCEP Version 7 – Atmospheric Forcing Data for the Community Land Model, Research Data Archive at the National Center for Atmospheric Research, Computational and Information Systems Laboratory, available at: http://rda.ucar.edu/datasets/ds314.3/, last access: 1 May, 2018. a
Webster, C., Rutter, N., Zahner, F., and Jonas, T.: Modeling subcanopy incoming longwave radiation to seasonal snow using air and tree trunk temperatures, J. Geophys. Res.-Atmos., 121, 1220–1235, https://doi.org/10.1002/2015JD024099, 2016. a, b
Woo, M. and Giesbrecht, M. A.: Simulation of snowmelt in a subarctic spruce woodland: 1. Tree model, Water Resour. Res., 36, 2275–2285, https://doi.org/10.1029/2000WR900094, 2000. a


