the Creative Commons Attribution 4.0 License.
the Creative Commons Attribution 4.0 License.
 | 16 Oct 2019
Measurement of specific surface area of fresh solid precipitation particles in heavy snowfall regions of Japan
Masaaki Ishizaka
Hiroki Motoyoshi
Sent Nakai
Vincent Vionnet
Teruo Aoki
Katsuya Yamashita
Akihiro Hashimoto
Akihiro Hachikubo
In countries like Japan, particular solid precipitation particles (PPs), such as unrimed PPs and graupel, often form a weak layer in snow, which triggers slab avalanches. An understanding of weak PP layers is therefore essential for avalanche prevention authorities to design a predictive model for slab avalanches triggered by those layers. Specific surface area (SSA) is a parameter that could characterize the physical properties of PPs. The SSAs of solid PPs in Nagaoka – a city in Japan experiencing the heaviest snowfall in the country – were measured for four winters (from 2013/2014 to 2016/2017). More than 100 SSAs of PP were measured during the study period using the gas absorption method. The measured SSA values range from 42 to 153 m2 kg−1. Under melting conditions, PPs showed comparatively smaller values. Unrimed and slightly rimed PPs exhibited low SSA, whereas heavily rimed PPs and graupel exhibited high SSA. The degree of PP riming depends on the synoptic meteorological conditions. Based on the potential of weak PP layer formation with respect to the degree of riming of PPs, the results indicate that SSA is a useful parameter for describing the characteristics of PP, and consequently predicting avalanches triggered by weak PP layers. The study found that the values of SSA strongly depend on wind speed (WS) and wet-bulb temperature (Tw) on the ground. SSA increases with increase in WS and decreases with increase in Tw. An equation to empirically estimate the SSA of fresh PPs in Nagaoka using WS and Tw was established. The equation successfully reproduced the fluctuation of SSA. The SSA equation, along with the meteorological data, is an efficient first step toward describing the development of weak PP layers in the snow cover models.
- Article
(10394 KB) - Full-text XML
- BibTeX
- EndNote


Individual snow crystals are made of ice structures with unique, intricate geometries (Magono and Lee, 1966). The specific surface area (SSA) of snow is defined as its surface area per unit mass or volume and includes information on the size and shape of the snow particles. Therefore, SSA is a key parameter in understanding the exchange of matter and energy between a snow-covered surface and the atmosphere (Domine et al., 2006, 2007, 2008), as well as in modeling the mass transfer of air or water in snow (e.g. Arakawa et al., 2009; Calonne et al., 2012). To accurately simulate the continuous change in the physical properties of snow, it is important to formulate the temporal variations in the SSA. Several studies (Legagneux et al., 2003, 2004; Legagneux and Domine, 2005; Taillandier et al., 2007) have proposed empirical equations for the time variation in SSA, in which an initial value of SSA was used. Therefore, the initial values of SSA, namely SSA of fresh precipitation particles (PPs), are essential to simulate the time variation in SSA in natural snow cover.
PPs have the potential to form a weak layer in a snowpack, which may trigger slab avalanches (Akitaya and Shimizu, 1988; McClung and Schaerer, 1993). The formation of weak PP layers should be considered to be dependent on the degree of PP riming (LaChapelle, 1967). The degree of PP riming is hence a key factor in designing a predictive model for slab avalanches triggered by weak PP layers. To investigate the types of weak layers in a surface avalanche, McCammon and Schweizer (2002) reported that the main cause of the weak layer in the Swiss Alps and Canada is the recrystallization-type layer with depth hoar, faceted crystal, and surface hoar. However, the main cause of weak layers of snowpack in Japan is the PP type (Ozeki and Akitaya, 1995; Matsumura, 2002; Ikeda, 2007). Therefore, forecast of weak-PP-layer-triggered avalanche is necessary for avalanche prediction in Japan. In recent times, several devastating avalanches have occurred in Japan due to weak-PP-layer formation. In February 2014, hundreds of avalanches occurred simultaneously in the Kanto region alone, which typically receives limited snowfall during the winter. Due to the risk of avalanche, many villages, some with over 9000 residents, were cut off from accessing roads and services (Nakamura et al., 2014; Kamiishi and Nakamura, 2016). In March 2017, eight people, seven of whom were high school students, lost their lives in an avalanche during an extracurricular outing (Nakamura et al., 2017; Araki, 2018).
Akitaya and Shimizu (1988) reported that the large-size falling broad-branched unrimed snow crystals form a weak layer due to low initial density under windless conditions. From the perspective of the physical characteristics of a PP layer, several studies (Shidei, 1953; Nakamura et al., 2014; Ishizaka et al., 2018) reported that snow layers consisting of unrimed snow crystals are fragile and trigger snow avalanches, even when the weak PP layers in the snowpack are shallow. In fact, the measured repose angles with the unrimed snow crystals were 35–45∘ (Ishizaka et al., 2018; Kamiishi et al., 2016), much smaller than those of the rich-rimed snow crystals (> 90∘) reported by Narita and Takeuchi (2009). These results indicate the potential relationship between avalanche behavior and the weak-PP-layer characteristics. However, the dependence of avalanche characteristics on PP, which is necessary to predict the potential of a weak PP layer to trigger an avalanche, is still debated because of the lack of any objective physical information on PP, such as shape, size, and riming ratio. To solve this problem and record detailed information on PP, the SSA of snow is considered an ideal parameter.
Several studies in the past have reported SSA measurements of fresh snow (Legagneux et al., 2002; Cabanes et al., 2002; Domine et al., 2007; Schleef, 2014). Their measurement intervals after the snowfall period showed a wide variation from several hours to a day. In general, SSA decreases with time due to metamorphism (Legagneux et al., 2003; 2004; Cabanes et al., 2003; Legagneux and Domine, 2005; Taillandier et al., 2007). Kerbrat et al. (2008) implied that smoothing of the snow crystal surface due to the Kelvin effect is expeditious; i.e., surface roughness of the size of several micrometers disappears after a day, even at temperatures as low as −40 ∘C, and the smoothing accelerates with increase in the temperature. In general, the size of a riming droplet (cloud drop) is on the order of 1 to 10 µm, as reported by Harimaya (1975) and Mosimann et al. (1994). Therefore, SSA measurement within short intervals is needed to model the degree of PP riming, especially in a warmer environment, which is common in Japan. Snow cover models, which are used for avalanche forecasting (e.g. Brun et al., 1992; Lehning et al., 1999), generally require input data with high time resolution (e.g. 1 h) for avalanche forecasting. Therefore, if information on PP is to be introduced in snow cover models using the SSA, then a dataset of SSA information on fresh PPs with high time resolution must be developed. Moreover, this information should contribute to the improvement of the SSA of PP treatment in the snow cover models, which are basically simplified in the model. For example, in the Crocus snowpack model (Brun et al., 1992; Vionnet et al., 2012), the maximal SSA value of PP is 65 m2 kg−1 for low wind conditions, and it decreases with increasing wind speed down to 25 m2 kg−1 (Vionnet et al., 2012; Carmagnola et al., 2014).
The SSA measurements of fresh PPs were conducted over short intervals (1–2 h) in an area in Japan that receives heavy annual snowfall. The measurements were compared to meteorological data and detailed falling snow data for discussing the dependency of SSA on those parameters. Based on those analyses, an empirical equation to estimate the SSA of fresh PPs using surface meteorological data was proposed for introducing detailed information on PP to the snow metamorphism models.
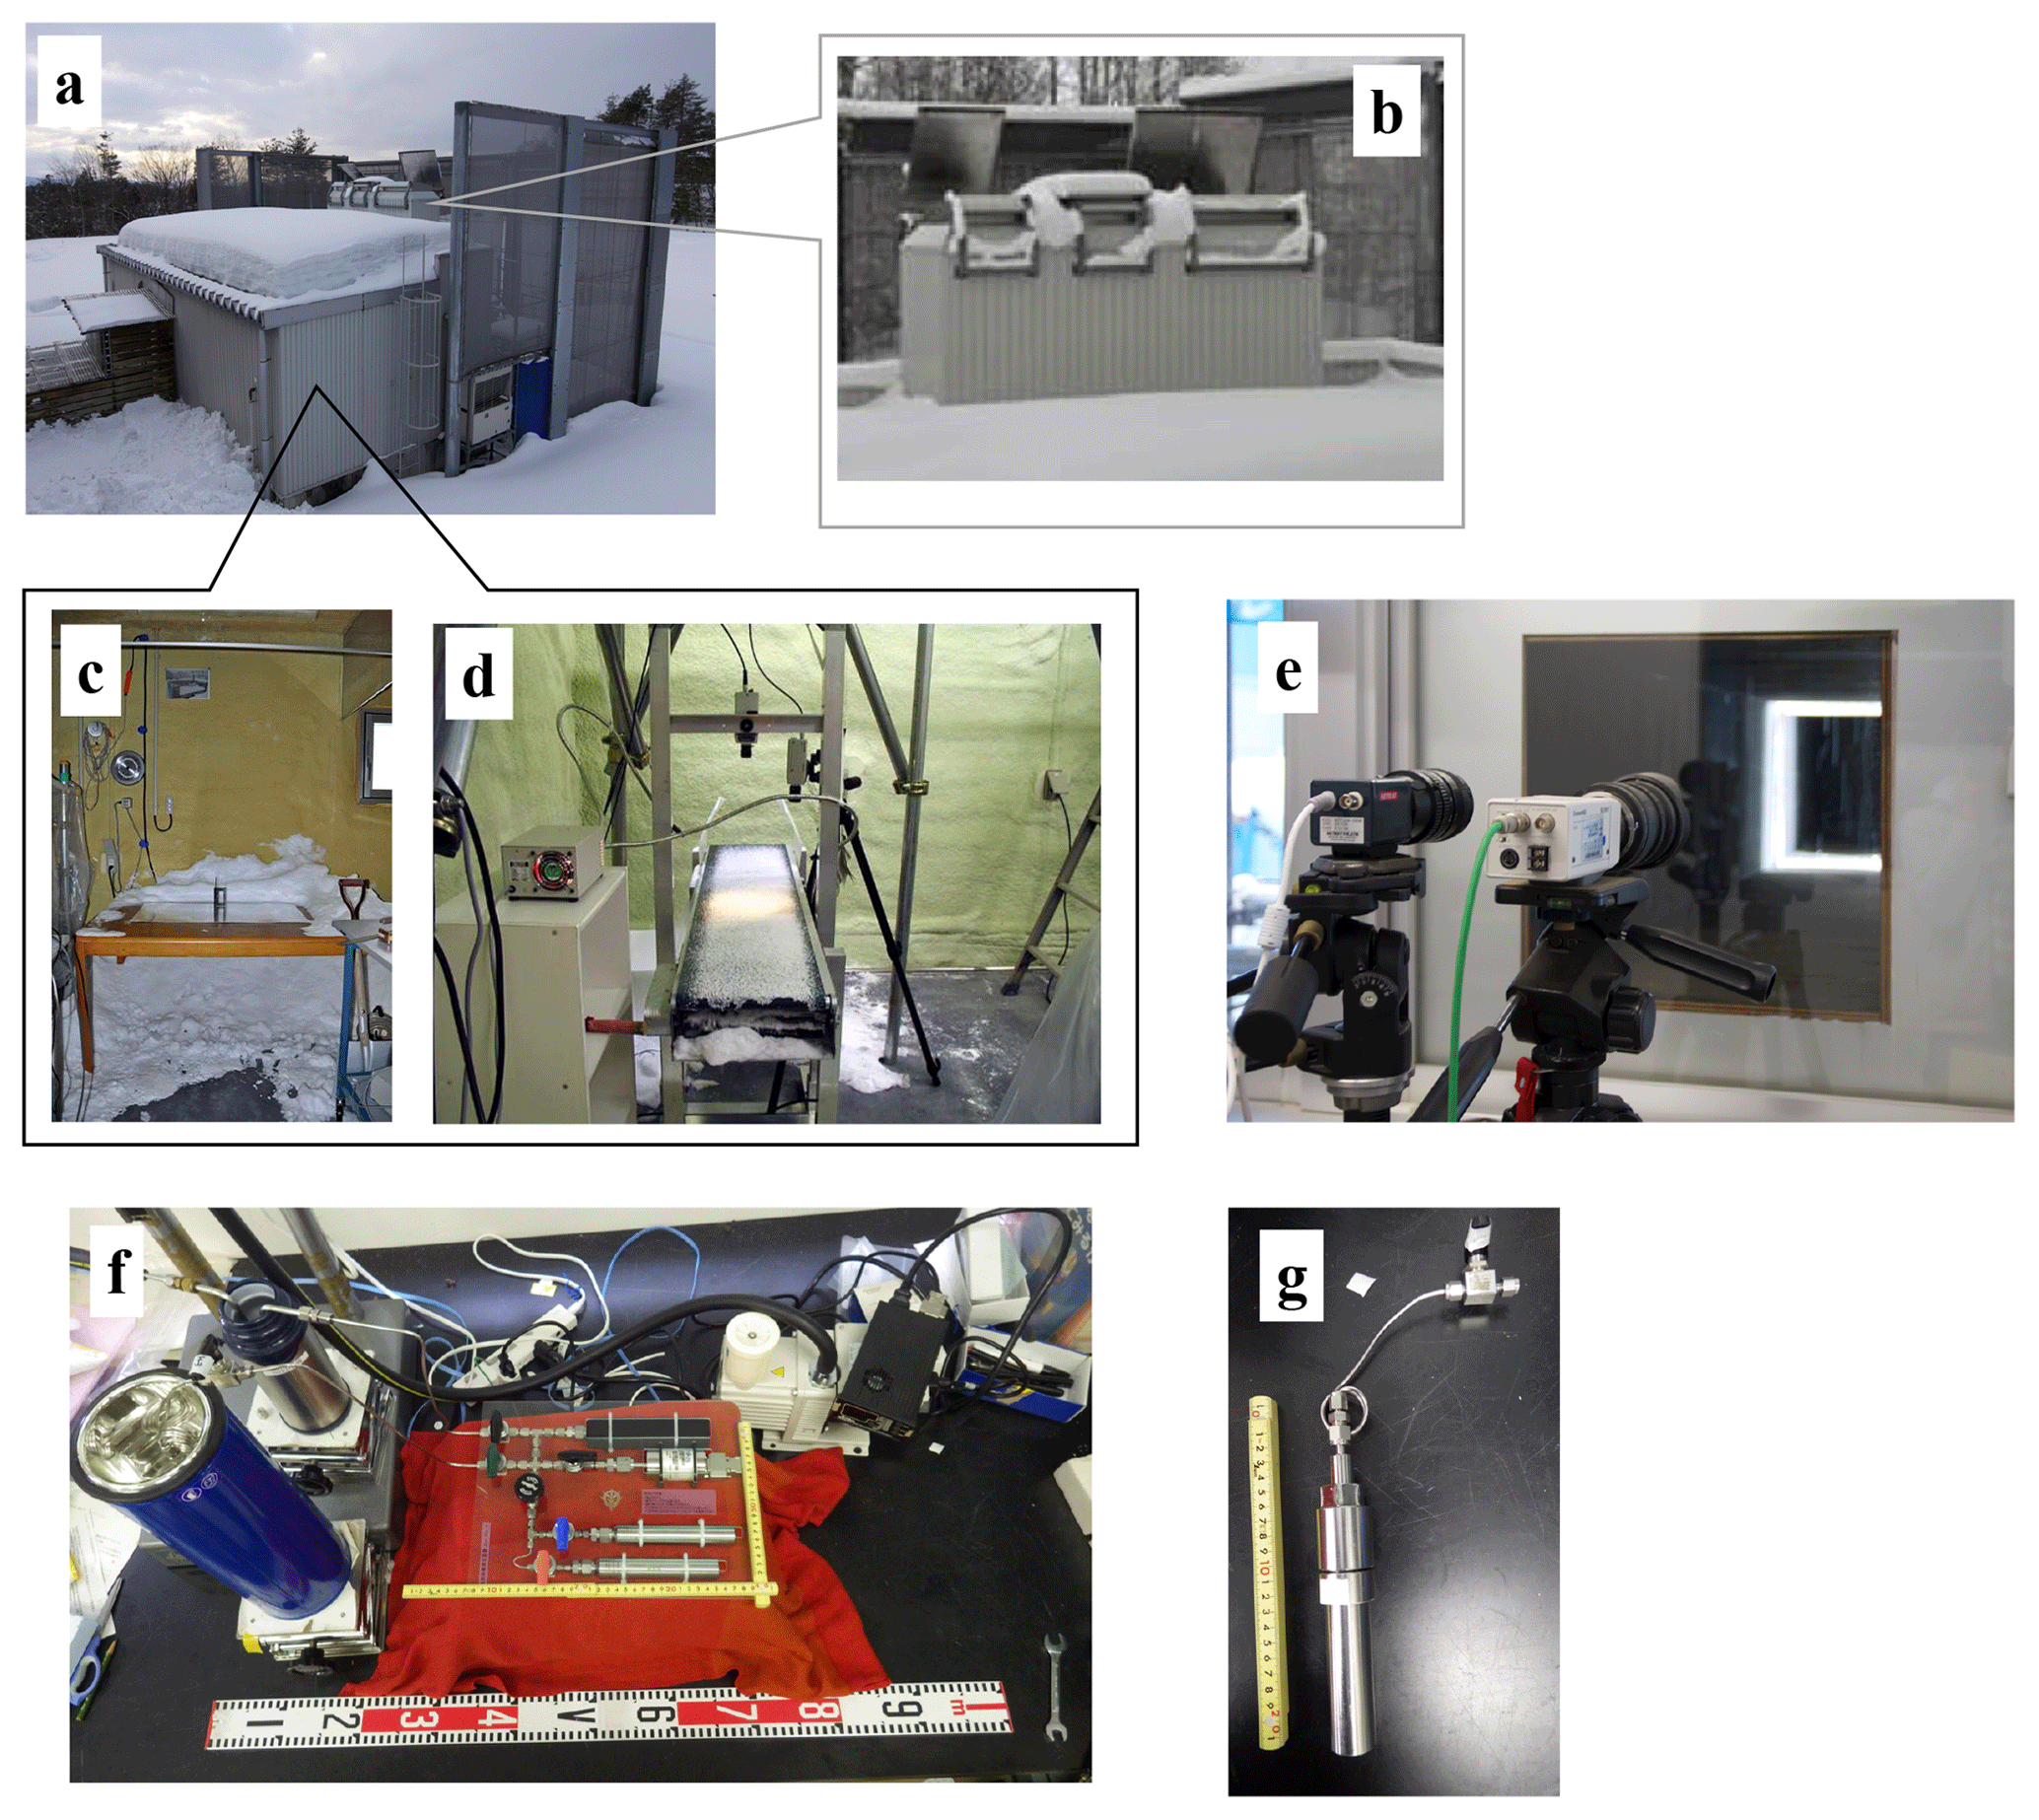
Figure 1Falling snow observatory (FSO) and the device developed for the methane adsorption method at the SIRC. (a) Overview of FSO, which is protected by a defensive fence against wind. (b) Roof opening system for the cold room. (c) Table in the cold room, on which snow samples are naturally deposited through the roof opening (d) The system to automatically capture falling snow crystal photographs on the conveyor belt with a close-up camera. (e) Falling snow particle observation system using a CCD camera. (f) Portable device developed for the methane adsorption method. (g) Sample folder for measurement of SSA.
2.1 Observation site
The SSA observations were conducted over four winters from 2013/2014 to 2016/2017, at the Snow and Ice Research Center (SIRC), National Research Institute for Earth Science and Disaster Resilience (NIED), Nagaoka, Japan (37∘25′ N, 138∘53′ E; 97 m a.s.l.). The SIRC is located in a coastal region facing the Sea of Japan, where strong northwesterly monsoons blow from Siberia to the Japanese islands, accumulating large amounts of water vapor when passing over the warm sea and bringing heavy snowfall. The climatic conditions at the SIRC include a typical maximum winter snow height greater than 1.4 m, but a mean daily winter air temperature (December–February) higher than 2 ∘C (Yamaguchi et al., 2018). Various types of solid PP (snow flake, graupel, riming crystal, unrimed crystal, melting snow crystal, sleet, etc.) appear at the SIRC and the type of PP frequently changes within a short interval due to the change of precipitation mode (Ishizaka et al., 2013).
The falling snow observatory (FSO) (Fig. 1a) at the SIRC has a cold room (−5 ∘C) with a 1.2×0.6 m roof opening (Fig. 1b) (Ishizaka et al., 2013, 2016). This setup allows the accumulation of falling snow on a flat table in the cold room under windless conditions (Fig. 1c). The PP photographs are automatically captured with a close-up camera on a conveyor belt system in the cold room (Fig. 1d). Additionally, the characteristics of falling snowfall particles, including size and fall speed, are automatically measured using a charge-coupled device (CCD) camera system (Fig. 1e), with a particle size resolution of 0.25 mm for the width and 0.50 mm for the height (Ishizaka et al., 2004). Using these characteristics, Ishizaka et al. (2013) presented a new parameter that quantitatively describes the main types of snowfall hydrometeors and reflects the contribution of all hydrometeors to precipitation. In their method, the dominant snowfall type was represented by a pair of characteristics, size and fall speed, which were obtained from the average size and fall speed and weighted by the mass flux of all measured hydrometeors. This is termed the center of mass flux (CMF) distribution. Because the size–fall–speed relationship of hydrometeors is a good representation of particle types, the dominant snow type in a snowfall event may be deduced from the location of the CMF in the size–fall–speed coordinates. Based on the concept of CMF, Ishizaka et al. (2016) also established approximated relationships between the CMF density and initial density. These data were used to check whether the measured SSA fell under the single-PP-type conditions. Moreover, the detailed characteristics of falling snow produced by the CMF were used when discussing the relationship between the measured SSA of fresh PPs and the characteristics of falling snow (Sect. 3.4).
The SIRC also acquires standard meteorological measurements at various time resolutions (1 min, 10 min, and 1 h) in the field (Yamaguchi et al., 2018):
-
air temperature (±0.1∘)
-
relative humidity (±2 %) at 3.5 m above ground level
-
wind speed (±0.3 m s−1) and wind direction (±3∘) at 8.7 m above ground level
-
precipitation (3 %) at 3.1 m above ground level
-
incoming and outgoing shortwave (±10 W m−2) and longwave (±10 W m−2) radiation at 6.5 m above ground level
-
air pressure (±0.35 hPa) measured at 3.0 m above ground level
-
surface temperature (±0.5∘)
-
snow height (±1.5 cm)
-
snow water equivalents (±10 mm).
Here, the values in the parentheses signify the accuracy of each sensor. These meteorological data were used with a 1 min resolution for conditioning the SSA data (Sect. 3.2). The conditioned data were used to discuss the relationship between the measured SSA of fresh PPs and near-surface meteorological data (Sect. 3.5). This study uses these meteorological data with a 10 min resolution for estimating the SSA, with an empirical equation (Sect. 3.6). In addition to these measurements, the SIRC also operates a Doppler radar on the rooftop of its building and gathers information on snow clouds during the winter season (Nakai et al., 2019). This study used the Doppler radar data when discussing the relationship between the SSA and radar echo patterns related to the development of snow clouds (Sect. 3.3). In addition to these data, weather charts produced by the Japan Meteorological Agency (http://www.data.jma.go.jp/fcd/yoho/hibiten/index.html, last access: 20 April 2019) were used in the discussions on the synoptic meteorological conditions (Sect. 3.3).
2.2 Measurement of specific surface area of fresh PPs
The methane gas adsorption method (Domine et al., 2001, 2007; Legagneux et al., 2002) was used to measure the SSA of fresh PPs. Principles of the methane gas adsorption method have been described in detail by Legagneux et al. (2002). Recently, a portable device was developed for the methane adsorption method (Fig. 1f) (Hachikubo et al., 2014, 2018). This device allows us to measure the SSA of snow within a 1 h resolution (measurement repeatability (standard deviation) of 3 %; Hachikubo et al., 2012, 2013). The characteristics of this device make it convenient for use in the current study of the SSA of fresh PPs with a short interval measurement. The samples used in this study were made of fallen snow deposited within 1–2 h on a table in a cold room (−5 ∘C) at the FSO. The device requires a 30 mL sample for each measurement (Fig. 1g). The samples were directly taken from the snow deposited on the table during the measurement interval. However, the PPs gathered by a broom were added to the sample when the snow deposited on the table was not high enough. The measured SSAs in this study were calculated by dividing the measured surface area of the sample by its mass, which was in turn measured by an electronic balance with a 0.01 g resolution. Therefore, units of square meters per kilogram are used. Due to the short deposition time under the cold room conditions, the effect of metamorphism on the sample, which requires longer deposition time, was neglected in this study. The microphotographs of the sample using a microscope were manually captured to determine the crystal types.

2.3 Data selection
In the study, several selected datasets (Table 1) were provided for each analysis. In the discussion of the general characteristics of SSA of PPs in Nagaoka (Sect. 3.1), all measured data were used. In the discussion of the influence of melting effect (Sect. 3.2), all measured data were classified into two datasets, no-melt events (NMEs) not affected by melt and melt events (MEs) affected by melt, and then discussed. In the discussion of the relationship between SSA and synoptic meteorological conditions (Sect. 3.3), only NME was used. In Sect. 3.4 and 3.5, uniform falling events (UFEs), in which only data measured under a single-PP-type condition during the deposition period, were selected from the NMEs and used for the discussion. Information on data selection conditions is detailed in each section.
Table 2Summary of datasets in Domine et al. (2007) and Schleef (2014).

3.1 Measured SSA of fresh PPs
A total of 102 SSA measurements were collected from the samples acquired from over four winters (from 2013/2014 to 2016/2017). For the methane absorption method, the averaged heat of adsorption, which is an indicator of the judgment of measurement quality, for the 102 measurements was 2472 ± 199 J mol−1, which is consistent with the value of 2540 ± 200 J mol−1 recommended by Domine et al. (2007). Therefore, the measurement results stand to reason. Figure 2a shows the comparison results between results of this study and SSA of natural, freshly fallen snow in previous studies (Domine et al., 2007; Schleef, 2014). Hereinafter, data of Domine et al. (2007) will be referred to as Dom2007 and data of Schleef (2014) as Sch2014. Table 2 shows detailed information on Dom2007 and Sch2014. Figure 2a also shows the optical radius (Ropt) for the datasets, estimated from the SSA using the following equation (Grenfell and Warren, 1999):
Here, ρi is the density of ice (917 kg m−3).
The sample numbers of the SSA measurements in this study are larger than those in the previous studies (Domine et al., 2007; Schleef, 2014), and they present a wider range of SSA values. This could be explained by the larger variety of PP types in this study. The average value of data in this study (96 m2 kg−1) is much larger than that in Dom2007 (73 m2 kg−1). The average value in Sch2014 (93 m2 kg−1) is close to that in this study. However, the number of samples in Sch2014 (8 cases) is too small to discuss statistically. Therefore, we compare the results of Dom2007 (68 cases) with those of this study (102 cases). Fassnacht et al. (1999) simulated the amount of change in the SSA of a dendritic snow crystal caused by the presence of riming drops on the surface. They concluded that the SSA could be doubled if 20 % of the surface of the snow crystal were covered by needle- or plate-shaped rime. Therefore, one of the reasons the averaged value in this study is larger than Dom2007 is that the measured data of fresh PPs include many cases of graupel and richly rimed snow crystals. Another reason could be the condition of the samples. The samples in this study were measured within a short time (1–2 h) after deposition, so the effect of metamorphism should be small. On the other hand, the samples in Dom2007 were procured over a longer time span after deposition. Thus, the effect of metamorphism on the samples in those studies should be larger than on the samples in this study. For these reasons, the results of this study show a more realistic value of the SSA of fresh PPs.

Figure 2Measurement results of SSA. (a) Comparison between the measurement results at Nagaoka and those of fresh snow reported in previous studies. Red box plots show SSA values and pink box plots show optical grain radius calculated for the datasets using Eq. (1). Dom2007: data from Domine et al (2007). Sch2014: data of natural snow from Schleef (2014). This study: data at Nagaoka. (b) Measurement results of SSA for each year; 2014: data measured in 2013/2014 winter; 2015: data measured in 2014/2015 winter; 2016: data measured in 2015/2016 winter; 2017: data measured in 2016/2017 winter. Each box plot shows the median, 25 % and 75 % percentiles, 1.5× interquartile ranges, and outliers. Values in parentheses are sample numbers
Large variations in the measured SSA values were observed every fourth winter (2013/2014: 64–153 m2 kg−1; 2014/2015: 43–142 m2 kg−1; 2015/2016: 42–148 m2 kg−1; 2016/2017: 51–110 m2 kg−1) (Fig. 2b). These results indicate that the SSA of fresh PPs in the winter season in Nagaoka usually varies by more than 2- or 3-fold. Snow albedo is essentially a function of the physical parameters of snow including SSA. To evaluate the effect of fluctuation in the SSA of fresh PPs on its surface albedo, surface albedos in the UV (ultraviolet)–visible spectral region and the near-infrared spectral region were simulated using the measured maximum (77 µm) and minimum optical radii (22 µm) of fresh PPs (Fig. 2), via the “physically based snow albedo model” (PBSAM) developed by Aoki et al. (2011). These simulations were conducted for the case of impurity-free snow under a clear-sky condition at a solar zenith angle of 60∘. Previous studies (Wiscombe and Warren, 1980; Aoki et al., 2011) show that the albedo at the near-infrared (NIR) wavelengths are affected more significantly by the change in SSA than the albedo at the UV–visible wavelength range. This is due to the spectral behavior of the imaginary part of the complex refractive index of ice. In fact, the UV–visible (wavelength = 0.2–0.7 µm) albedo values simulated using the measured maximum and minimum optical radii show almost the same values (0.99), while the simulated NIR (wavelength = 0.7–3.0 µm) albedo values vary from 0.75 to 0.80. These results indicate that the information on SSA variation in fresh PPs is important for the simulated evolution of the local surface radiation budget. Therefore, parameterization of SSA fluctuations is essential for the accurate simulation of NIR albedo in natural snow.
3.2 Influence of melting effect in SSA of fresh PPs
According to Yamaguchi et al. (2013), winter precipitation in Nagaoka frequently occurs at an air temperature of approximately 0 ∘C. In fact, the data in this study were partly measured at an air temperature of approximately 0 ∘C. Thus, some of the samples were affected by melting during the fall. To investigate the influence of melting on the measured SSA data, the measured data were classified into two categories – data without melting effect (no-melt events) and data with melting effect (melt events) (Table 1). To classify these data, the wet-bulb temperature (Tw) during the falling snow period was used, which is a good indicator of the melting event (Matsuo et al., 1991); no-melt events (NMEs) followed the Tw<0 ∘C condition, while melt events (EM) followed the Tw ≧ 0 ∘C condition. In this study, the interval of snowfall during the sample period was first determined using the CMF data with a 1 min time resolution because falling snow did not always occur continuously during the sample interval. Then, using the meteorological data (1 min resolution), all the relevant meteorological elements were averaged over the period in which snowfall was observed, instead of averaging over all periods of the sample interval for calculation (hereinafter, the averaged meteorological data will indicate data averaged only over the period of snowfall). In this study, Tw was calculated based on the “forward” analytical psychrometric equations (Bohren and Albrecht, 1998) that employ an iterative approach using averaged air temperature, relative humidity, and air pressure.
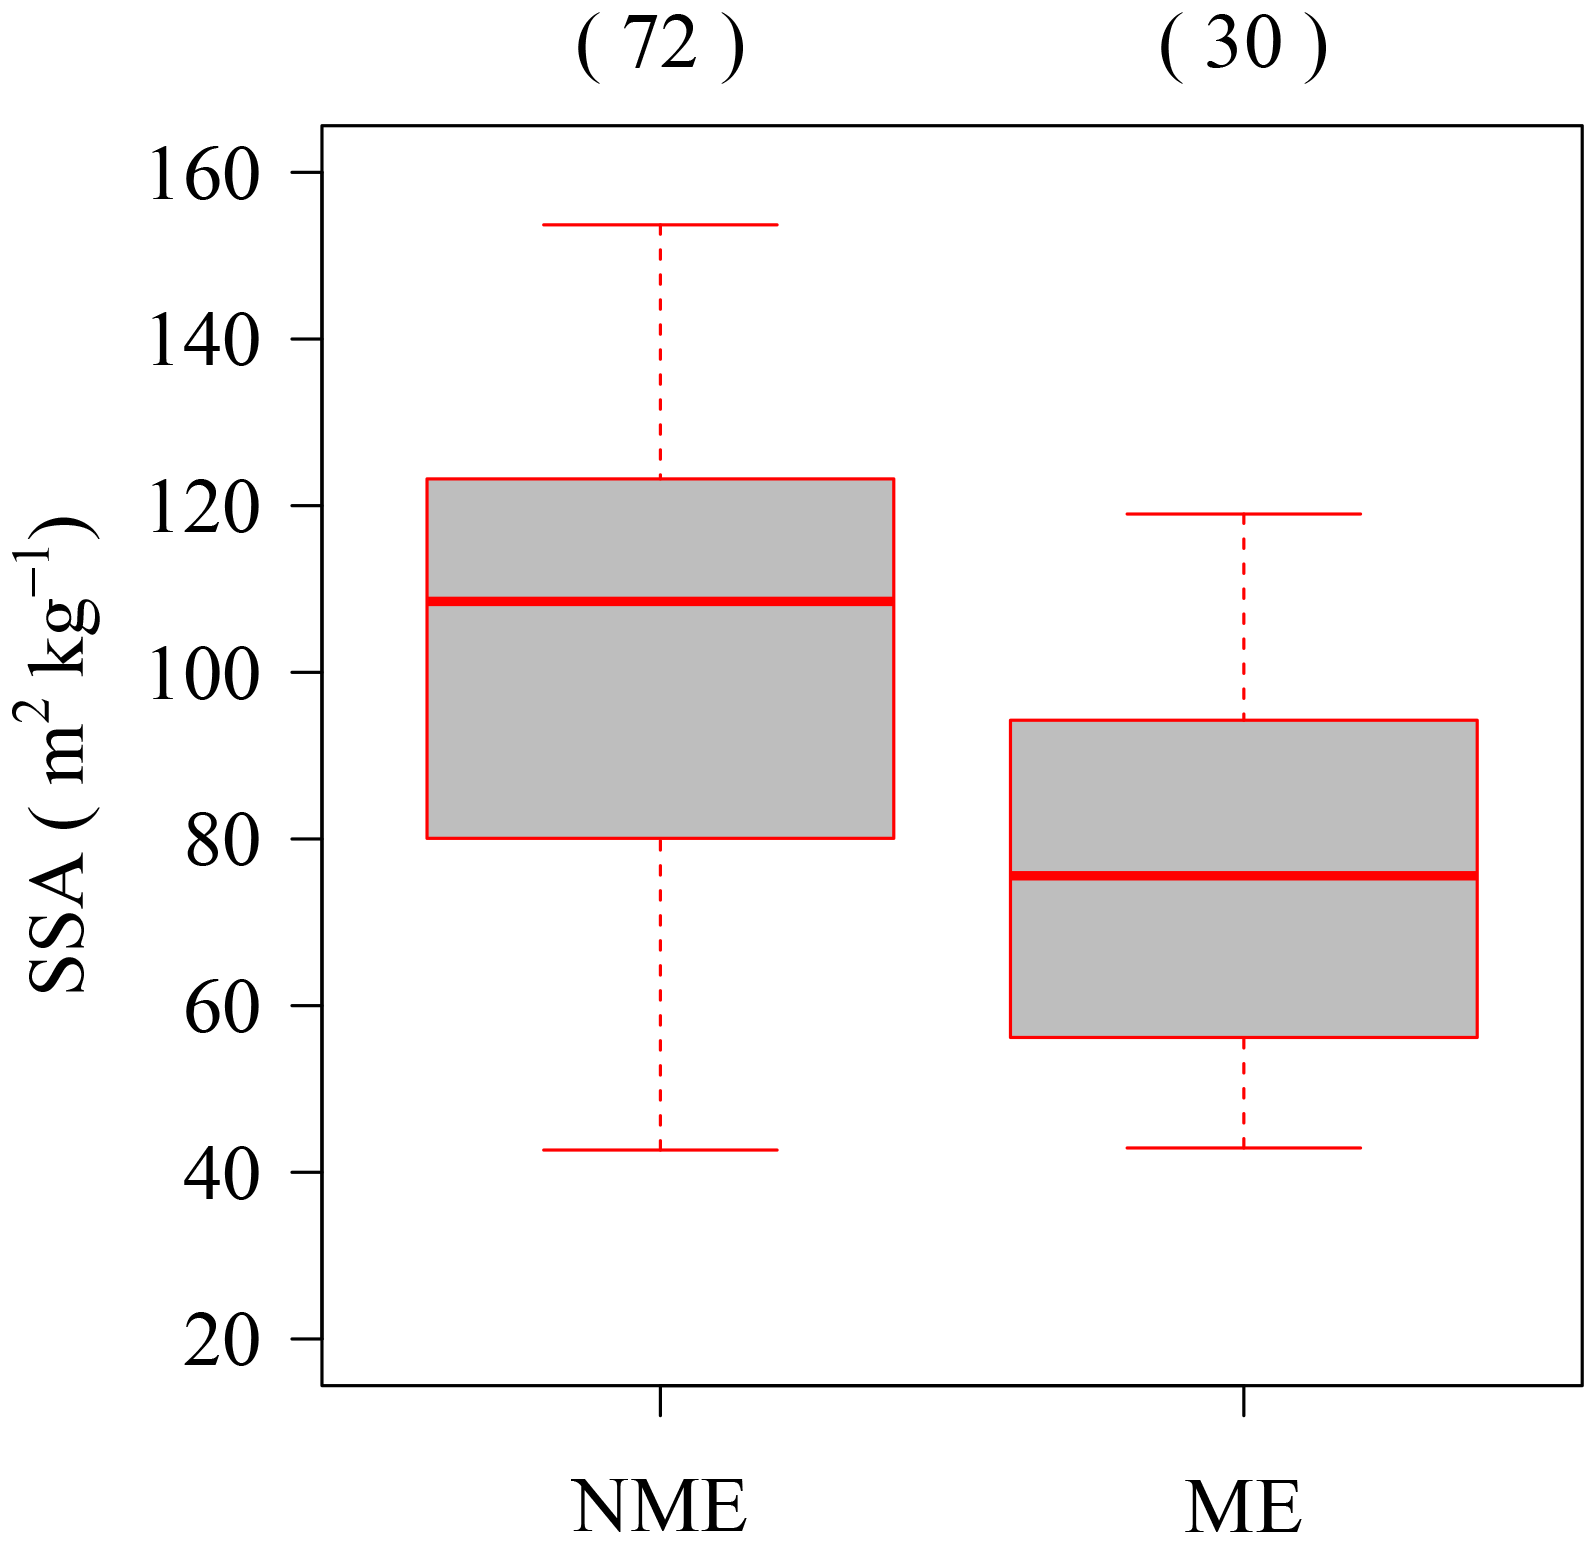
Figure 3Wet-bulb temperature (Tw) melting-based classification of SSA data classification. NME (no-melt events): data with Tw<0 ∘C; ME (melt events): data with Tw ≧ 0 ∘C. Each box plot shows the median, 25 % and 75 % percentiles, 1.5× interquartile ranges, and outliers. Values in parentheses are sample numbers.
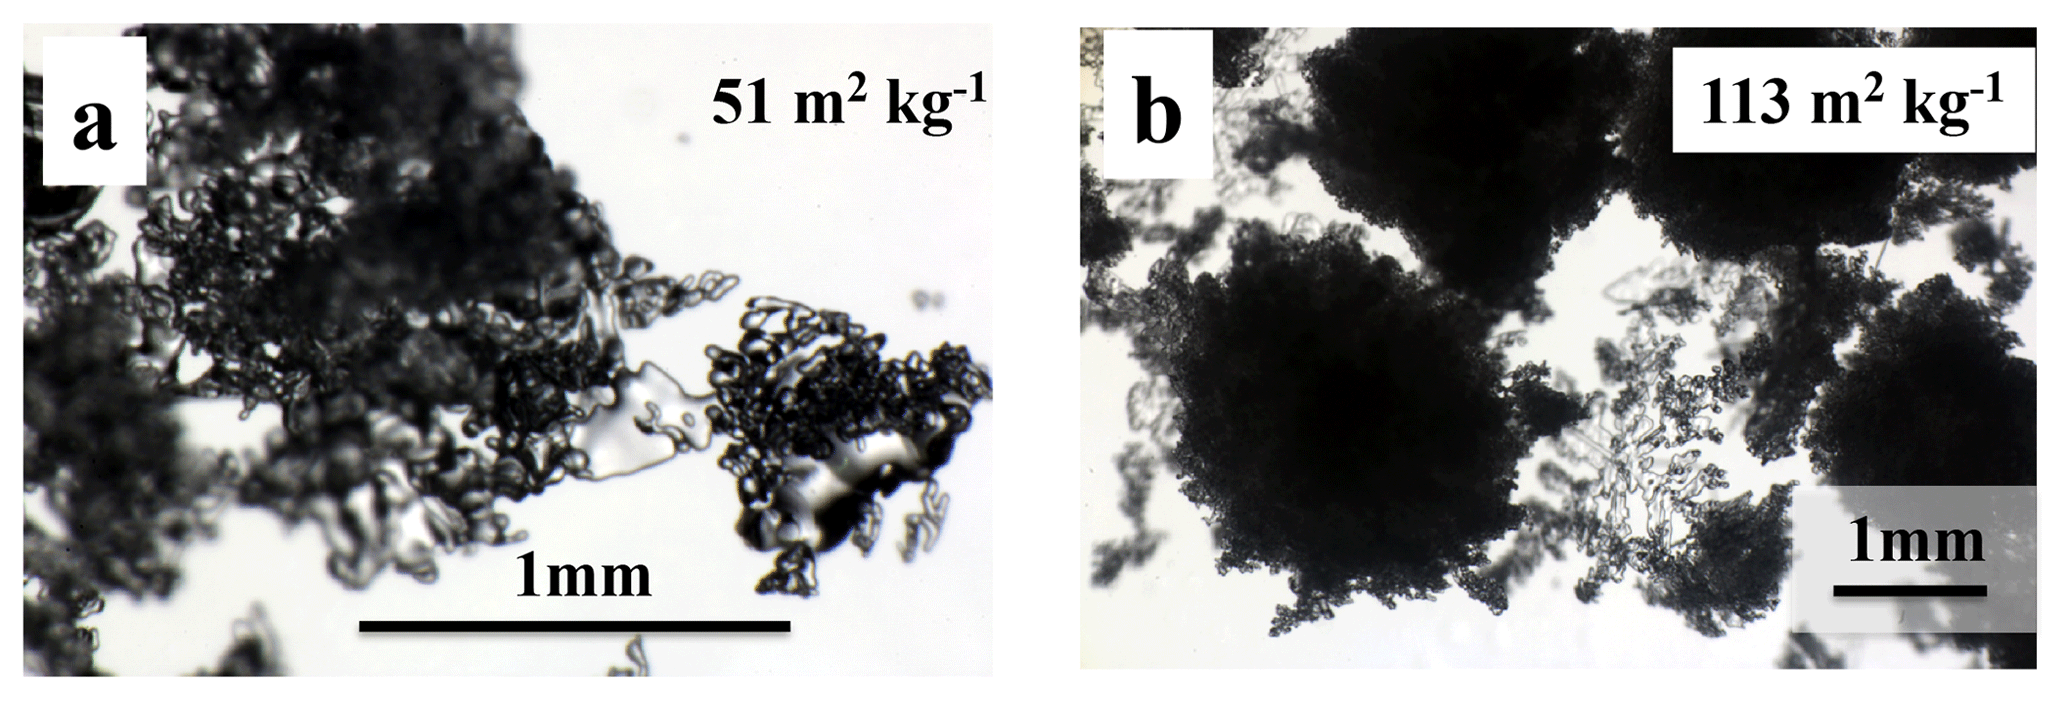
Figure 4Microphotographs of samples taken under melt events. (a) Sample with Tw = 0.6 ∘C; (b) sample with Tw = 0.03 ∘C.
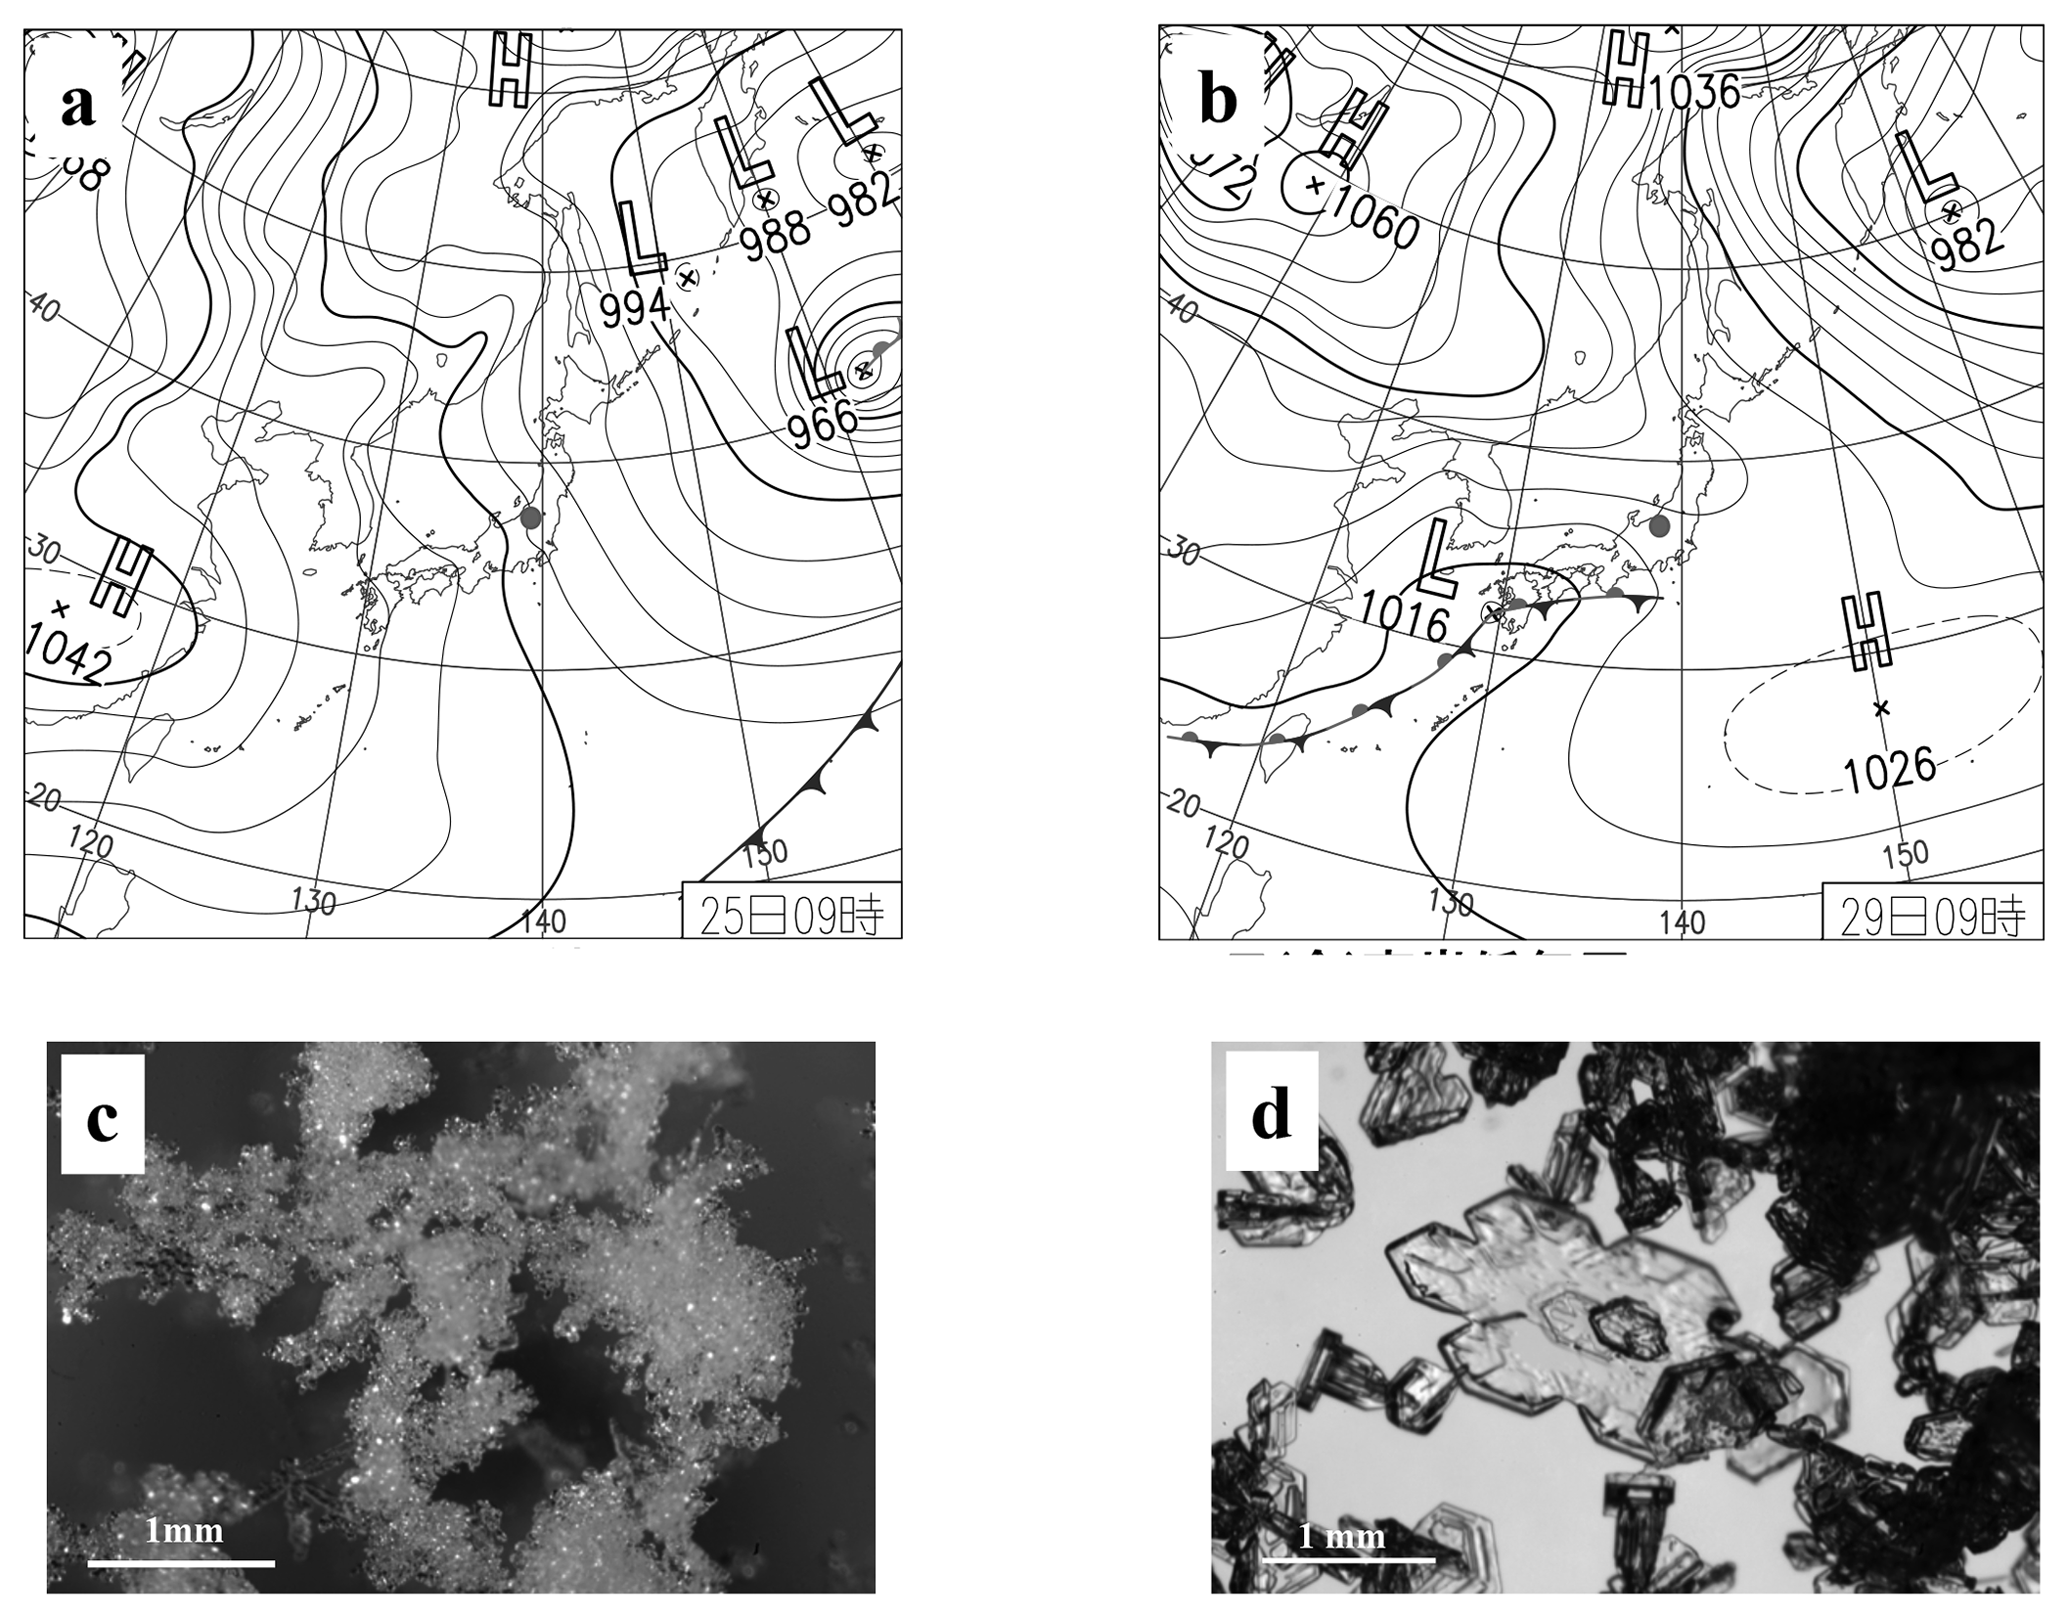
Figure 5Synoptic atmospheric pressure condition of falling snow events in Nagaoka. Gray circles indicate the location of Nagaoka. (a) Synoptic weather chart at 09:00 on 25 January 2016, as an example of the M type; (b) synoptic weather chart at 09:00 on 29 January 2016, as an example of the C type; (c) microphotograph of fresh PPs deposited on a table in a cold room under the conditions of (a); (d) microphotograph of fresh PPs deposited on a table in a cold room under the conditions of (b). Weather charts were produced by the Japan Meteorological Agency (http://www.data.jma.go.jp/fcd/yoho/hibiten/index.html, last access: 20 April 2019).
Figure 3 shows the classified results (MEs and NMEs) using Tw. A total of 30 events were classified as MEs and 72 events as NMEs. The SSA averaged over the MEs (77±23 m2 kg−1) is smaller than that of NMEs (103±28 m2 kg−1). Here the values after “±” represent the standard deviation. The difference in the SSA values between MEs and NMEs should be mainly due to the melting effect. Domine et al. (2007) reported an SSA value of 50±11 m2 kg−1 for fresh PPs with melting effect, i.e., PP falling at T>0 ∘C. Compared with the results of this study, the values in their study are smaller. Moreover, the SSA data under MEs in this study include higher values (> 100 m2 kg−1). Figure 4 shows the microphotographs of the two samples taken under MEs with different Tw. The first sample, which showed the evidence of melting under high Tw (0.6 ∘C), had a small SSA (51 m2 kg−1) (Fig. 4a). The second sample, which falls under MEs with low Tw, slightly higher than 0 ∘C, did not reveal any substantial evidence of melting and had a large SSA (113 m2 kg−1) (Fig. 4b). These results indicate that the degree of melting depends on Tw. Moreover, the results also imply that the Tw-based classification is not sufficient to distinguish between melt and no melt. Basically, data under NMEs show high SSA values but still include lower SSA values (< 77 m2 kg−1). These results indicate that fresh PPs can have a small SSA even without melting, and other factors, such as meteorological conditions within the clouds and the atmosphere, for controlling the SSA of fresh PPs ought to be considered.
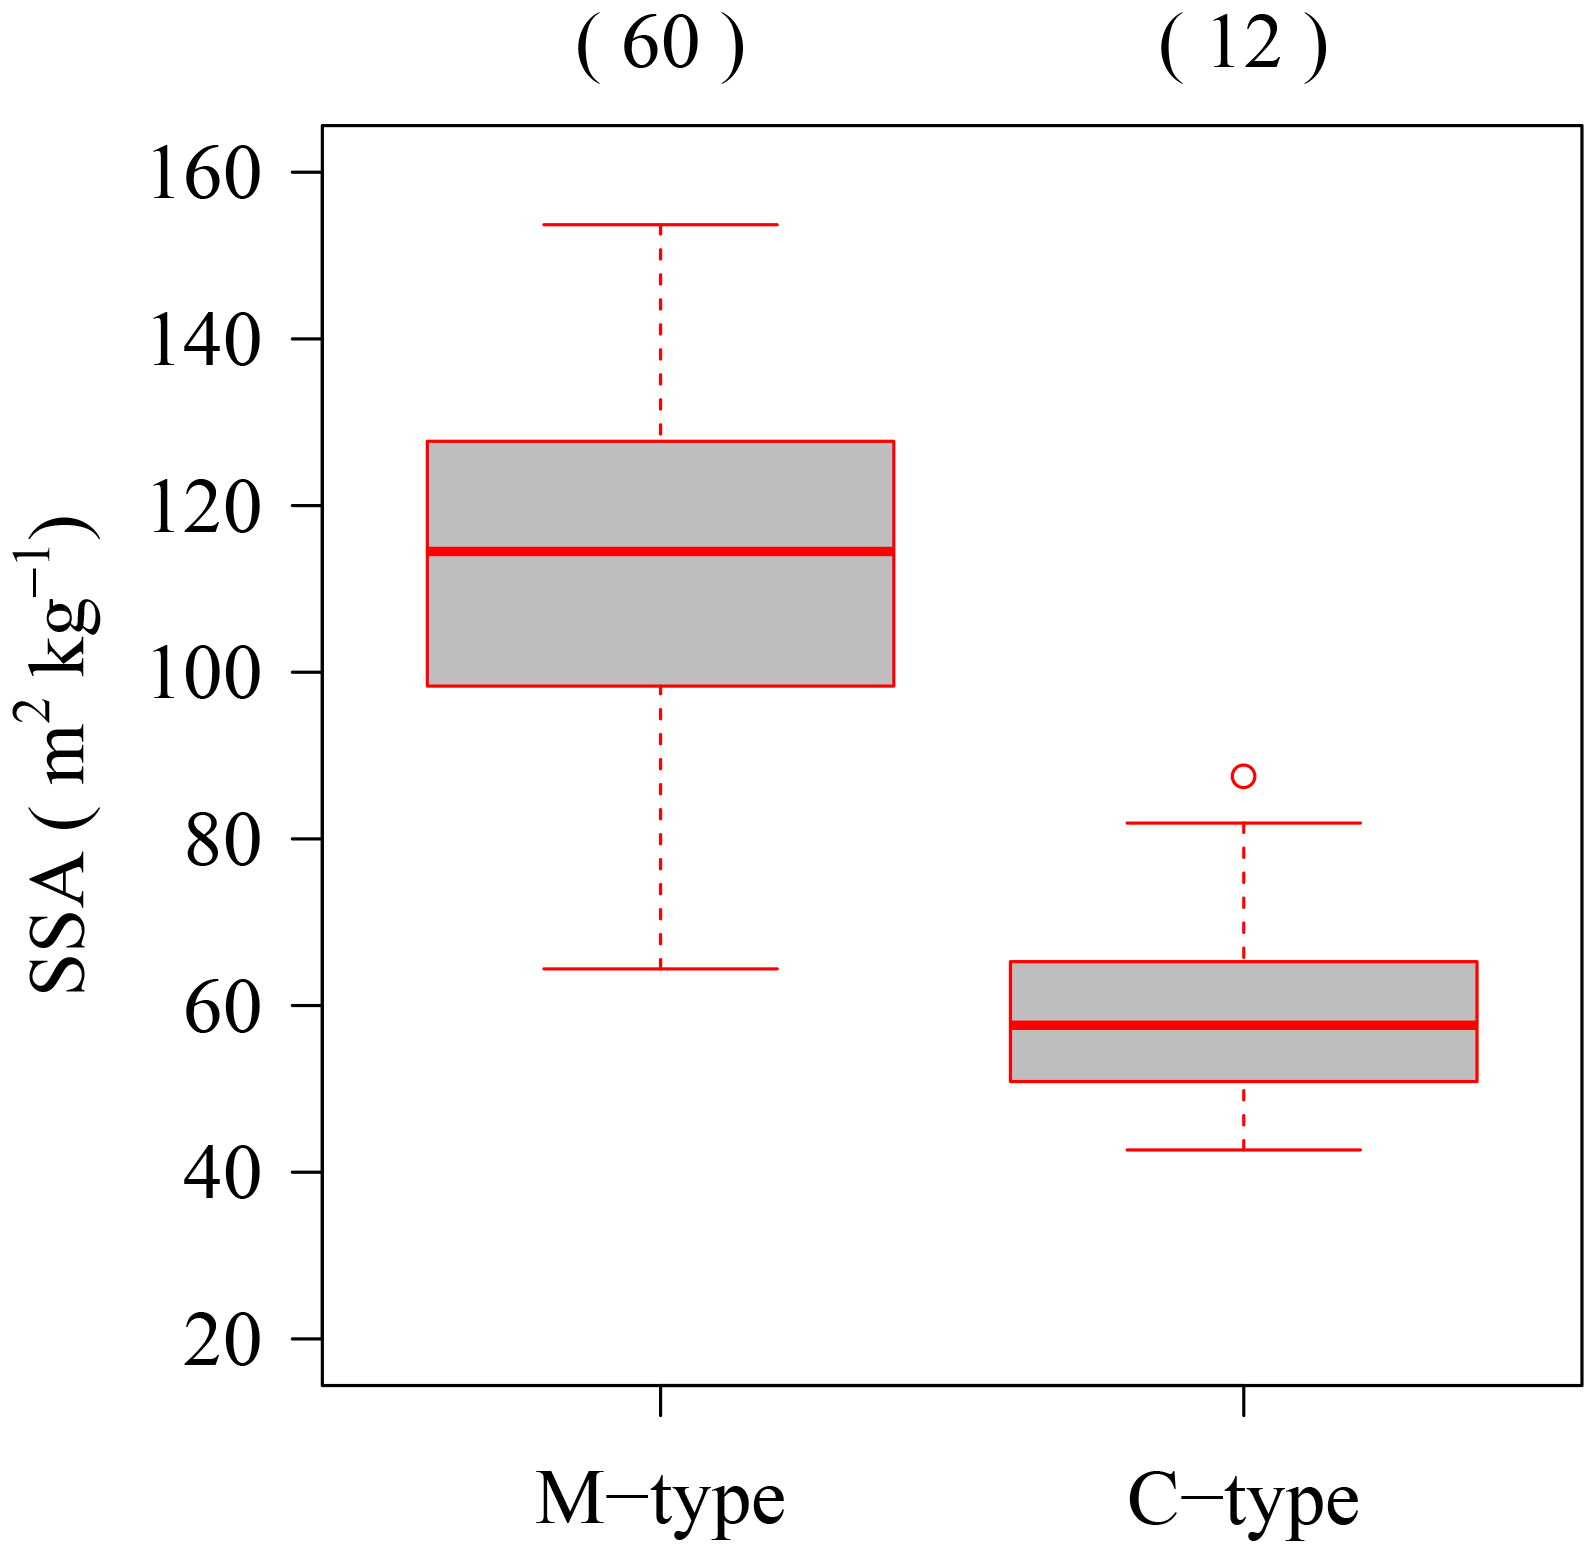
Figure 6Dependency of SSA of fresh PPs on synoptic-scale conditions. M type: monsoon type; C type: cyclone type. Each box plot shows the median, 25 % and 75 % percentiles, 1.5× interquartile ranges, and outliers. Values in parentheses are sample numbers.
3.3 Relationship between SSA of fresh PPs and synoptic meteorological condition
The measured SSA of fresh PPs sometimes reveals small values without melting (Fig. 3). To investigate the cause of these small SSA values, the study will focus on the synoptic meteorological conditions during snowfall. Snowfall patterns in Japan can be roughly grouped into two categories (Nakamura et al., 1987): monsoon-type snowfall, in which strong northwesterly monsoons blow from Siberia to the Japanese islands, and cyclone-type snowfall, in which cyclones blow from the south to the north along the archipelago. The first type was named monsoon type (M type) (Fig. 5a) and the second cyclone type (C type) (Fig. 5b). In Nagaoka, snowfall events under the M type are dominant, while snowfall events under the C type rarely occur during the winter season (Nakamura et al., 1987). Based on classifications using the weather charts produced by the Japan Meteorological Agency (http://www.data.jma.go.jp/fcd/yoho/hibiten/index.html, last access: 20 April 2019), 60 events resulted from the M type and 12 events from the C type in NMEs (a total of 72 events). Figure 6 presents the result of comparison of the SSA values between the M type and C type and reveals a clear difference – SSAs during the M type (average: 112 m2 kg−1) are much larger than those during the C type (average: 60 m2 kg−1). These results indicate that the SSAs of fresh PPs in Nagaoka strongly depend on the synoptic-scale precipitation conditions. In general, the PPs during the M-type pattern generally allow aggregation and riming to be predominant (Fig. 5c). A previous study (Cabanes et al., 2002) reported dendritic snowfall with rich riming as showing high SSA in the Canadian Arctic.
Colle et al. (2014) reported consistent spatial patterns of habit and riming intensity in the fallen snow during a cyclone at Stony Brook in New York on the northeast coast of the United States relative to the cyclone structure. Few to no riming snowfall crystals occurred within the outer comma head to the north and northeast of the cyclone's eye and the western quadrant of the comma head, while moderately rimed snow crystals were observed in the middle of the comma head. In Japan, several studies with meteorological condition analyses (Nakamura et al., 2013; Akitaya and Nakamura, 2013) reported unrimed snow crystals falling at the warm front of the cyclone and subsequently triggering avalanches. These studies corroborate each other, namely in that unrimed snow crystals occurred with the cyclone event. In fact, all observed crystals under the C type showed the unrimed snow crystal types as shown in Fig. 5d. From these results, it was concluded that the characteristics of PPs under the C type, namely unrimed snow crystal types, reveal PPs with small SSA. To predict a weak-PP-layer avalanche, it is necessary to have a description of PP-type information in numerical snow models that can help reproduce the weak PP layer. This study considers the riming conditions of PPs determined based on the SSA values to be a good indicator of the potential of development of weak PP layer in snowpack for numerical snow cover models.
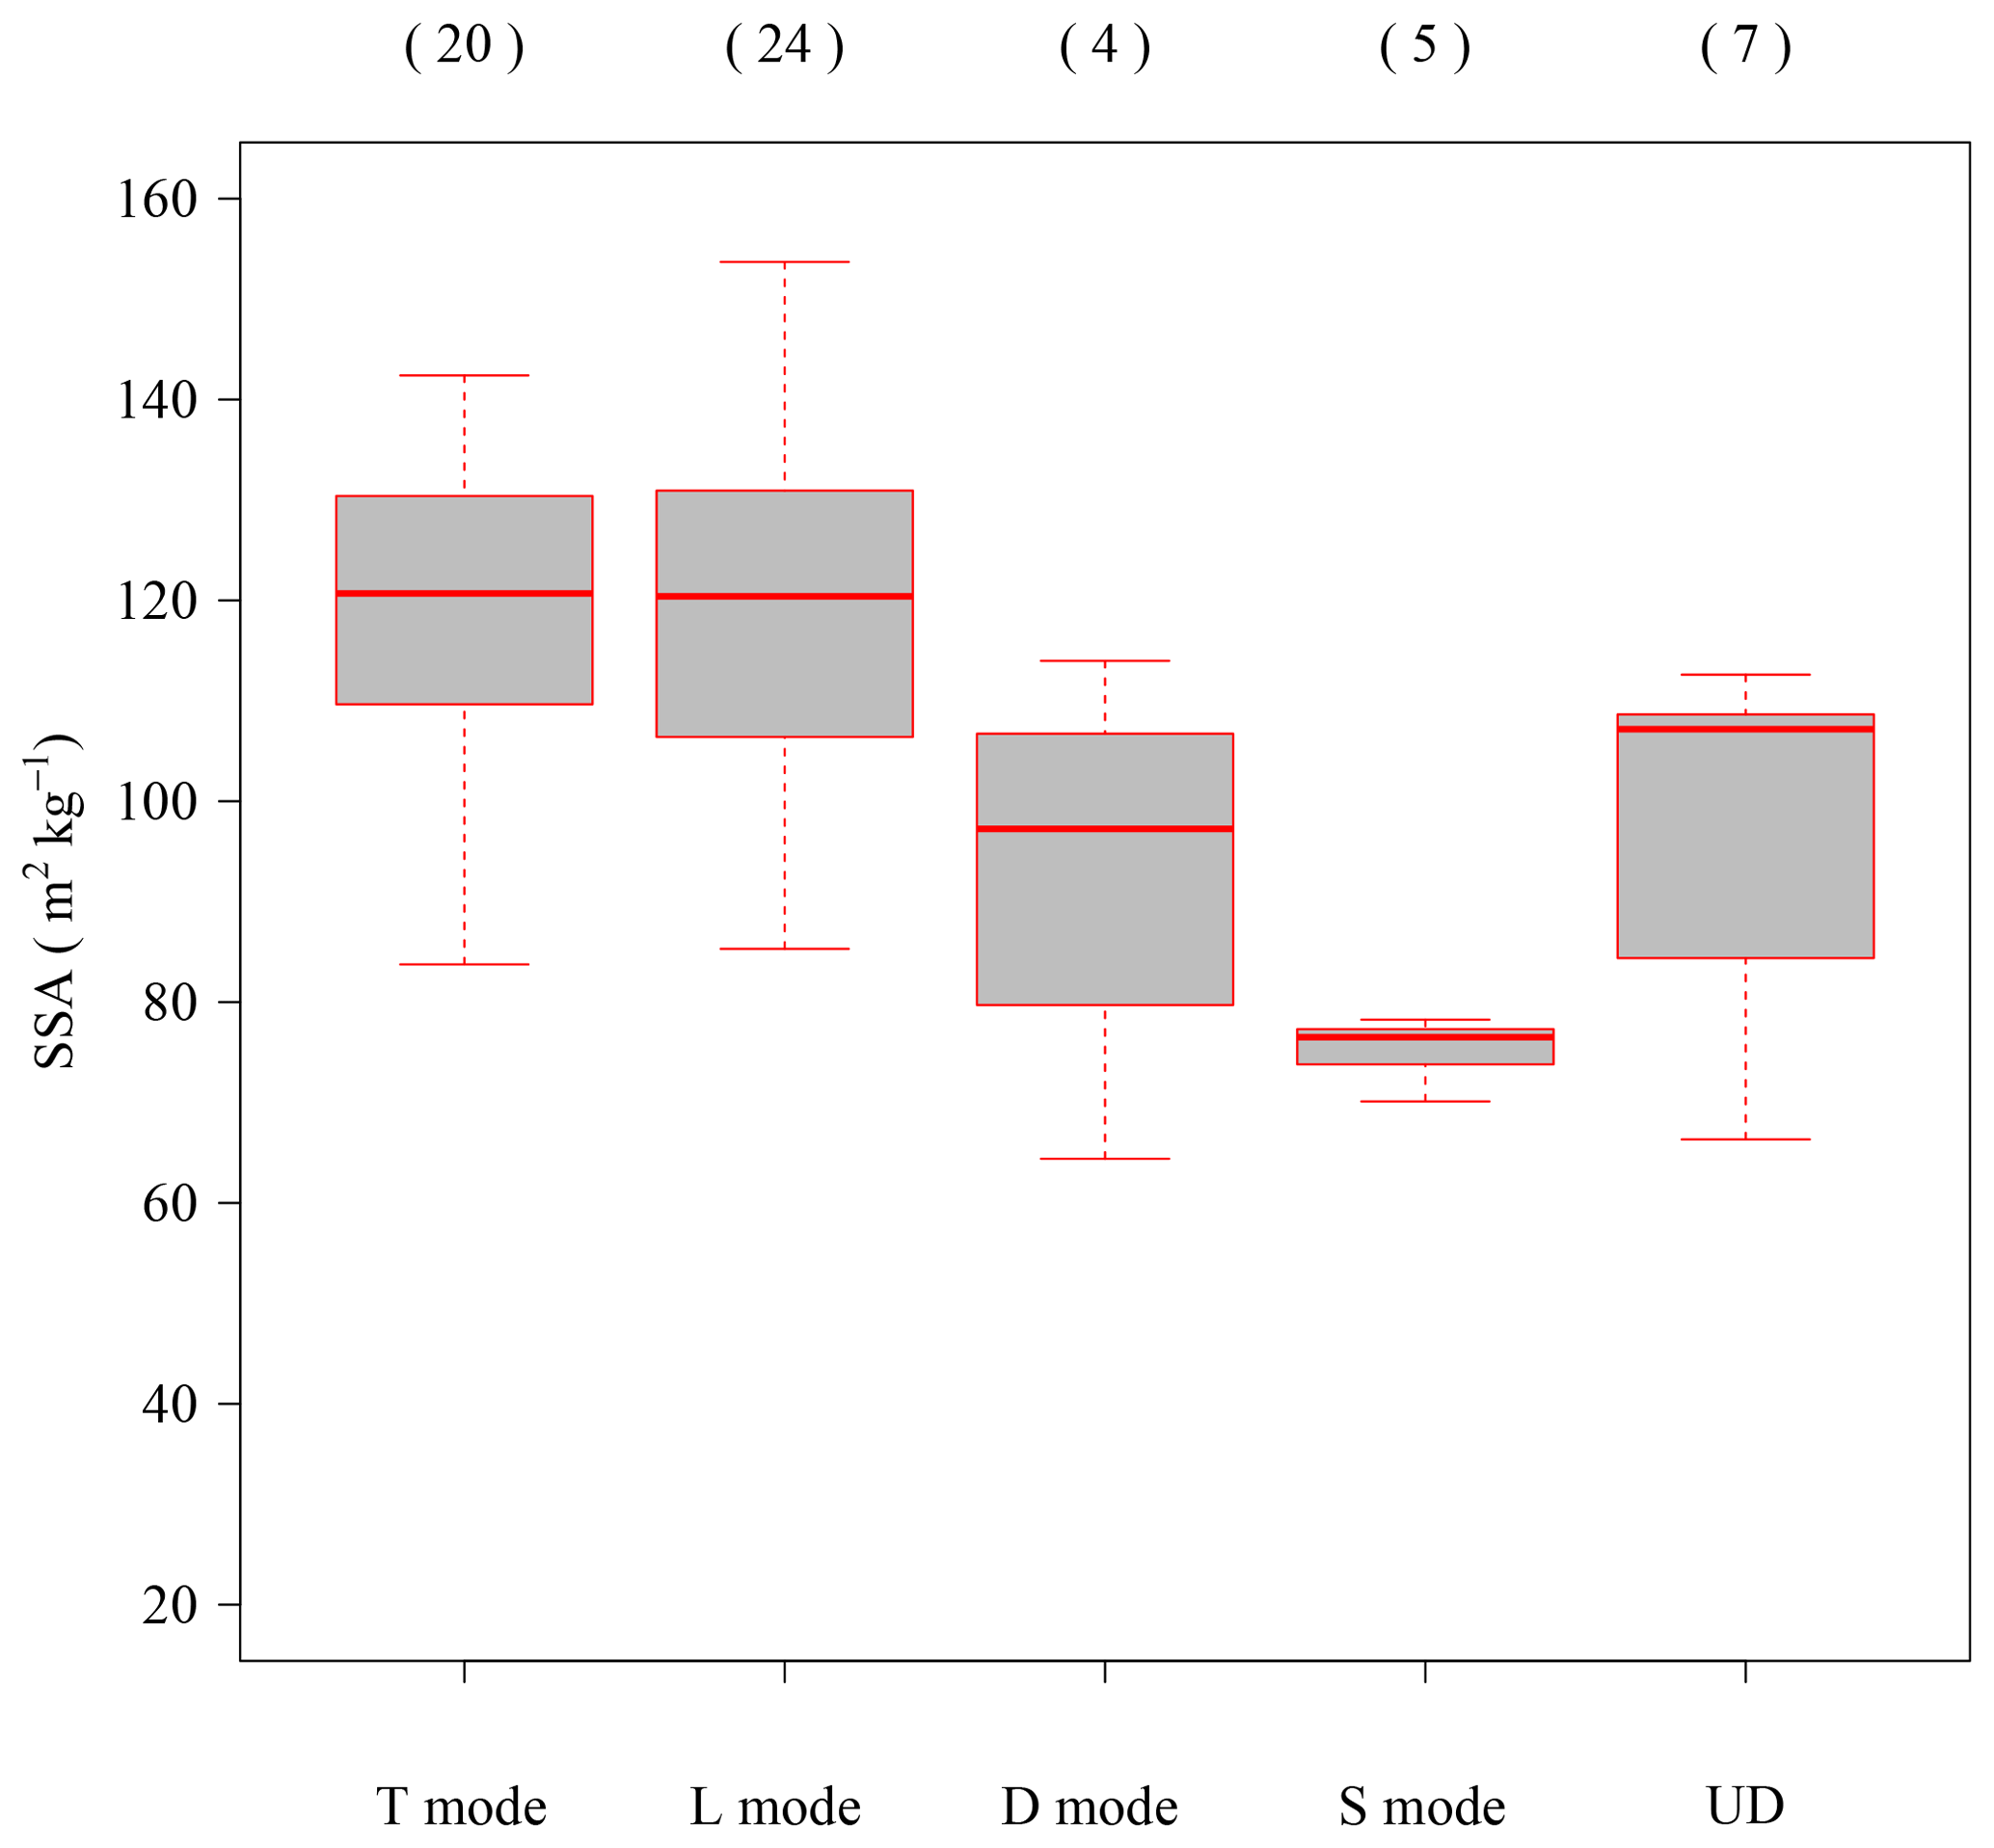
Figure 7Dependency of the SSA of fresh PPs on snowfall modes during the M type. Each mode is described in Table 1. UD indicates data whose snowfall mode could not be determined. Each box plot shows the median, 25 % and 75 % percentiles, 1.5× interquartile ranges, and outliers. Values in parentheses are sample numbers.
Table 3Classification of snowfall mode (modification of Table 1 in Nakai et al., 2005).
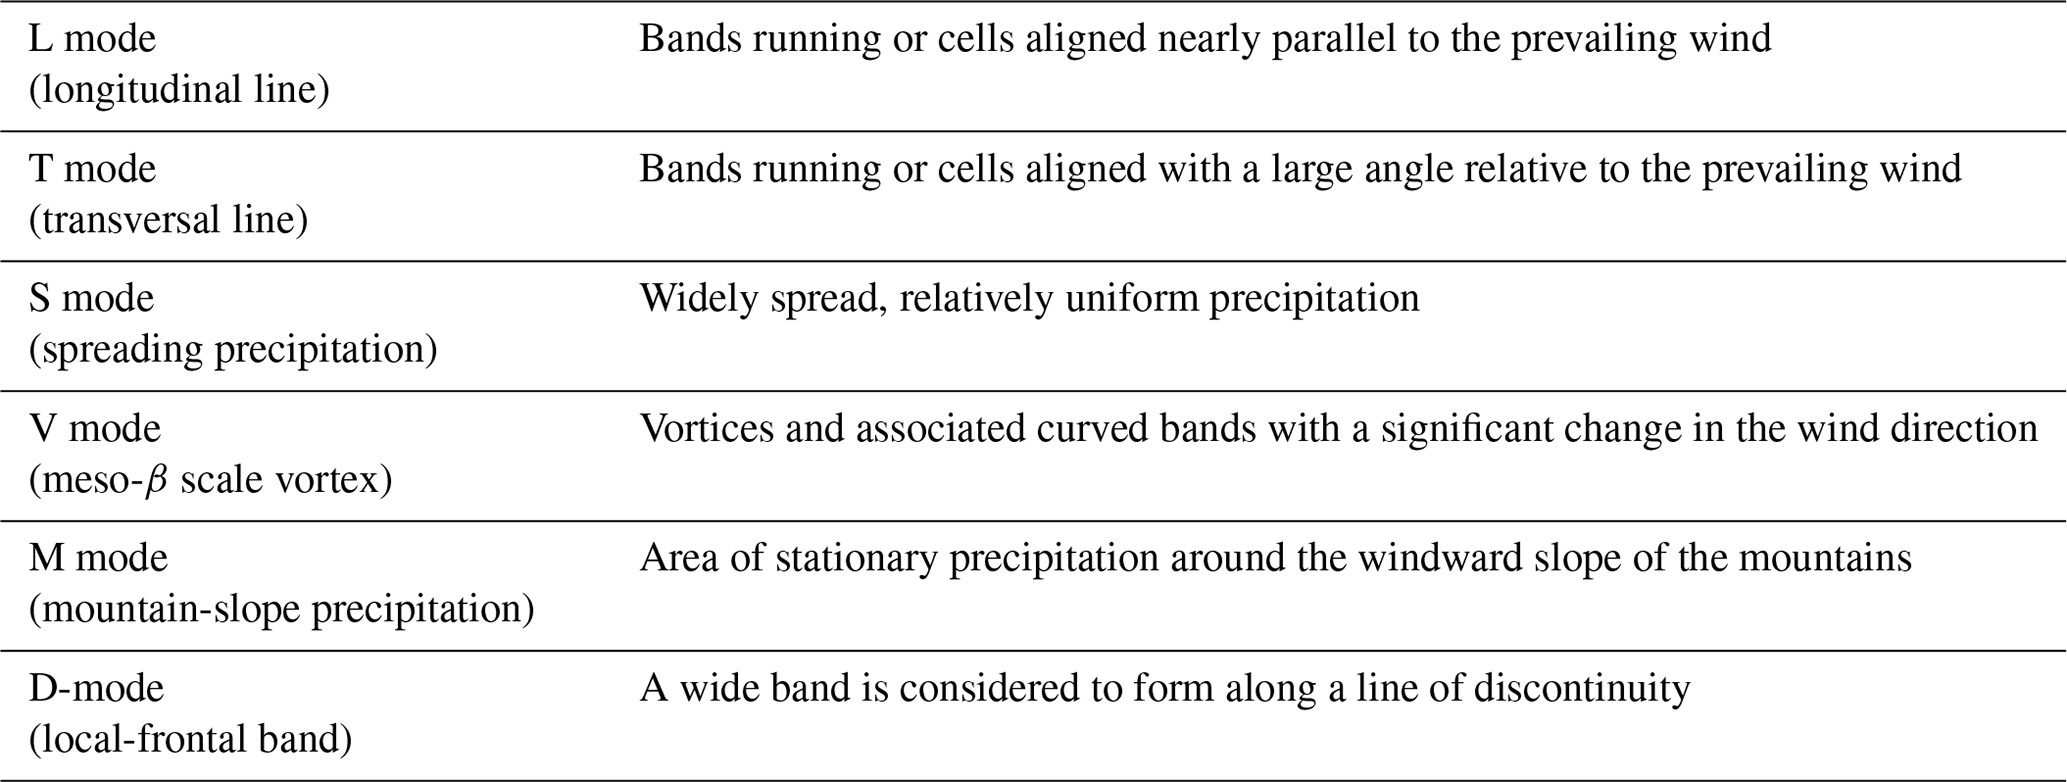
When the measurements of the M type were investigated, SSA values of fresh PPs still showed a large variation in the range of 64–154 m2 kg−1. Nakai et al. (2005) reported that there were several snowfall conditions corresponding to different snow cloud behaviors under the M-type pattern. They investigated this behavior (snowfall modes) in the Niigata Prefecture, including Nagaoka, using Doppler radar echo under the M type, and then classified the snowfall according to six modes (Table 3). Based on their method, in this study, data under the M type were classified into several snowfall modes. A total of 53 out of 60 datasets under the M type were classified into four modes (T mode: 20 events; L mode: 24 events; D mode: 4 events; S mode: 5 events), while seven datasets could not be determined due to the lack of radar data or difficulty in classification resulting from the complexity of the snowfall mode. In this study, SSAs under the V mode and the M mode were not measured. Figure 7 illustrates the results of the SSA for each snowfall mode classification. For more information on grain shape and riming, the reader is directed to the sample microphotographs of PPs taken under each mode in Fig. 8. The values of SSA under the T and L modes show larger values than the other two modes (averaged SSA values of the T and L modes are 120 and 119 m2 kg−1, respectively). A previous study (Harimaya and Nakai, 1999) reported that falling snow crystals contain richly rimed types under the T and L modes. As a matter of fact, the main types under the T and L modes in this study were the graupel and richly rimed snow crystals (Fig. 8a and b). The values of SSA measured under the D mode (averaged SSA value of the D mode is 93 m2 kg−1) show smaller values with those under the T and L modes. However, these values showed large fluctuations from 60 to 120 m2 kg−1. This result implies that a wide range of PP types – from slightly rimed snow crystal to richly rimed snow crystal, should fall under the D mode. The microphotographs in Fig. 8c also show that different crystal types can fall under the D mode. Because of the small sample size of the D mode (only four cases), the critical condition between the PPs with a large SSA and those with a small SSA could not be established in this study. Although slightly larger than the values under the C type, the measured values of SSA under the S mode (averaged SSA value of the S mode is 75 m2 kg−1) are smaller than those under other modes. Microphotographs of all samples under the S mode revealed unrimed and slightly rimed snow crystals as the classification of riming degree for a single crystal (Mosimann et al., 1993) (Fig. 8d). The sample size of the S mode (only five cases) does not help to confirm if all the cases under this mode have small SSA values, but the results do indicate that the PPs with small SSAs (< 80 m2 kg−1) appeared even under the M type. Therefore, the risk of avalanche caused by the weak PP layer, resulting from fallen unrimed snow crystals, should not be neglected even under the monsoon type.
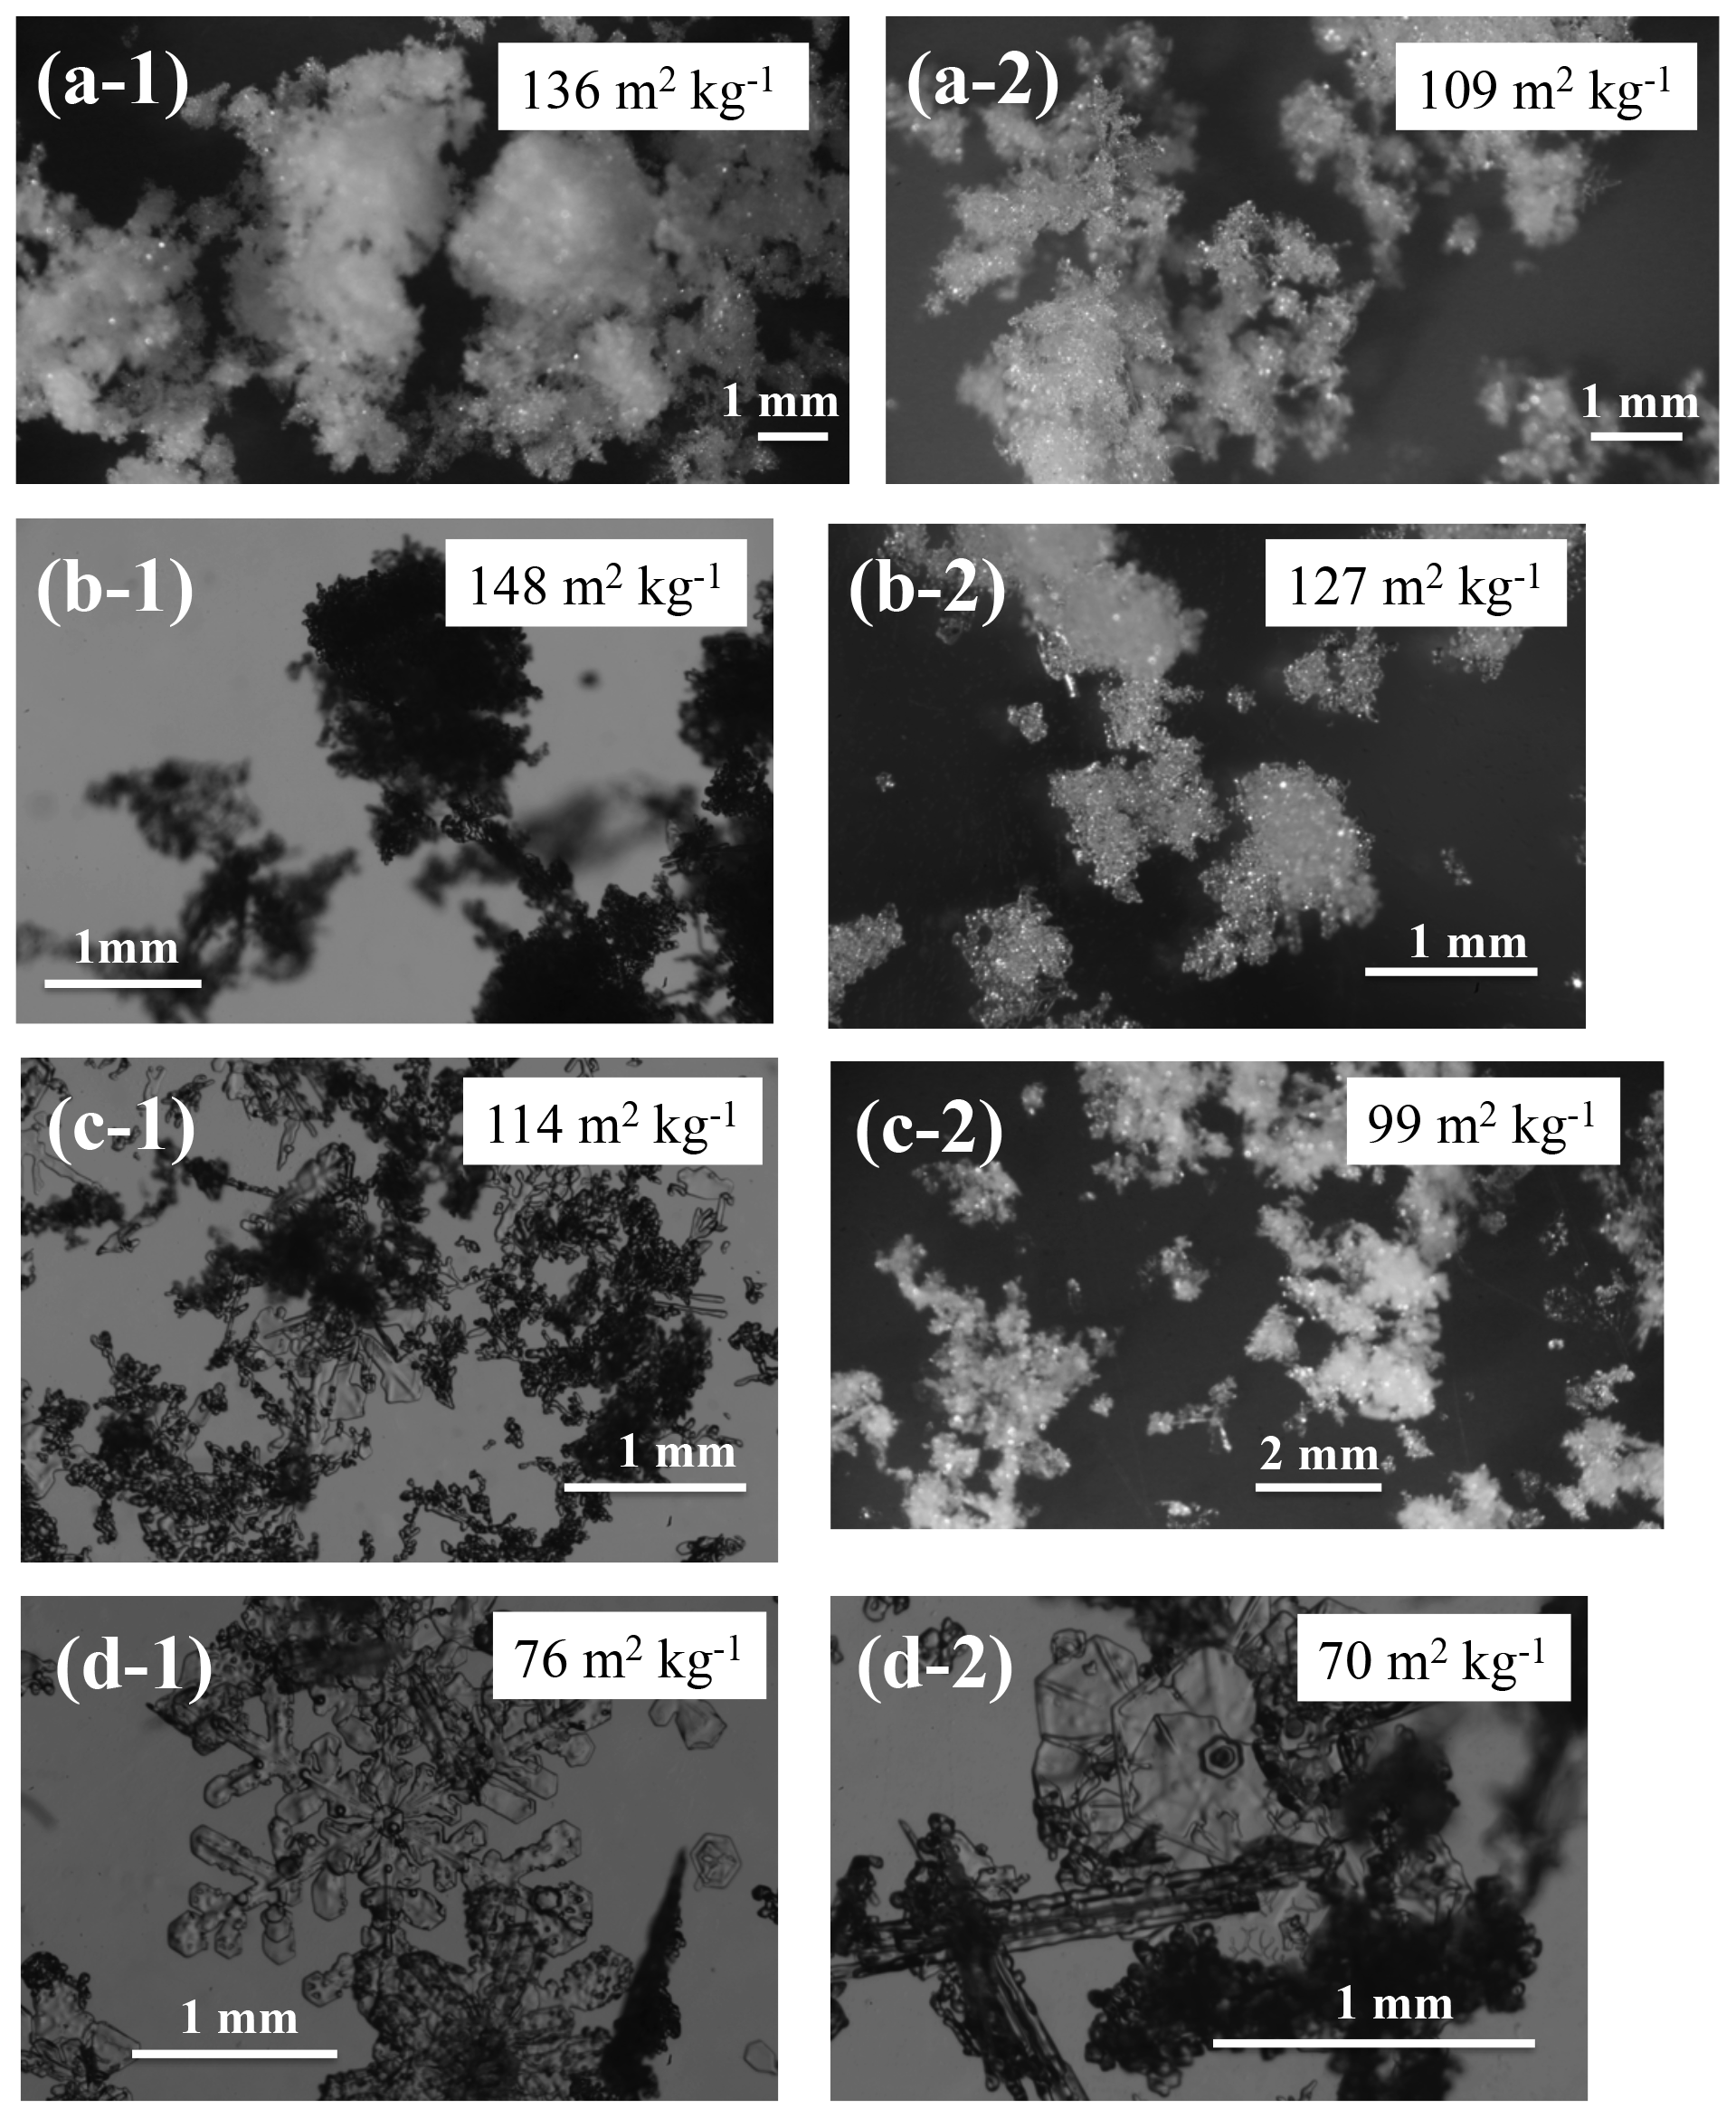
Figure 8Microphotographs of samples for each snowfall mode. Panels (a-1) and (a-2) were captured under T mode; panels (b-1) and (b-2) were captured under L mode; panels (c-1) and (c-2) were captured under D mode; panels (d-1) and (d-2) were captured under S mode. Values in the figures are the measured SSAs.
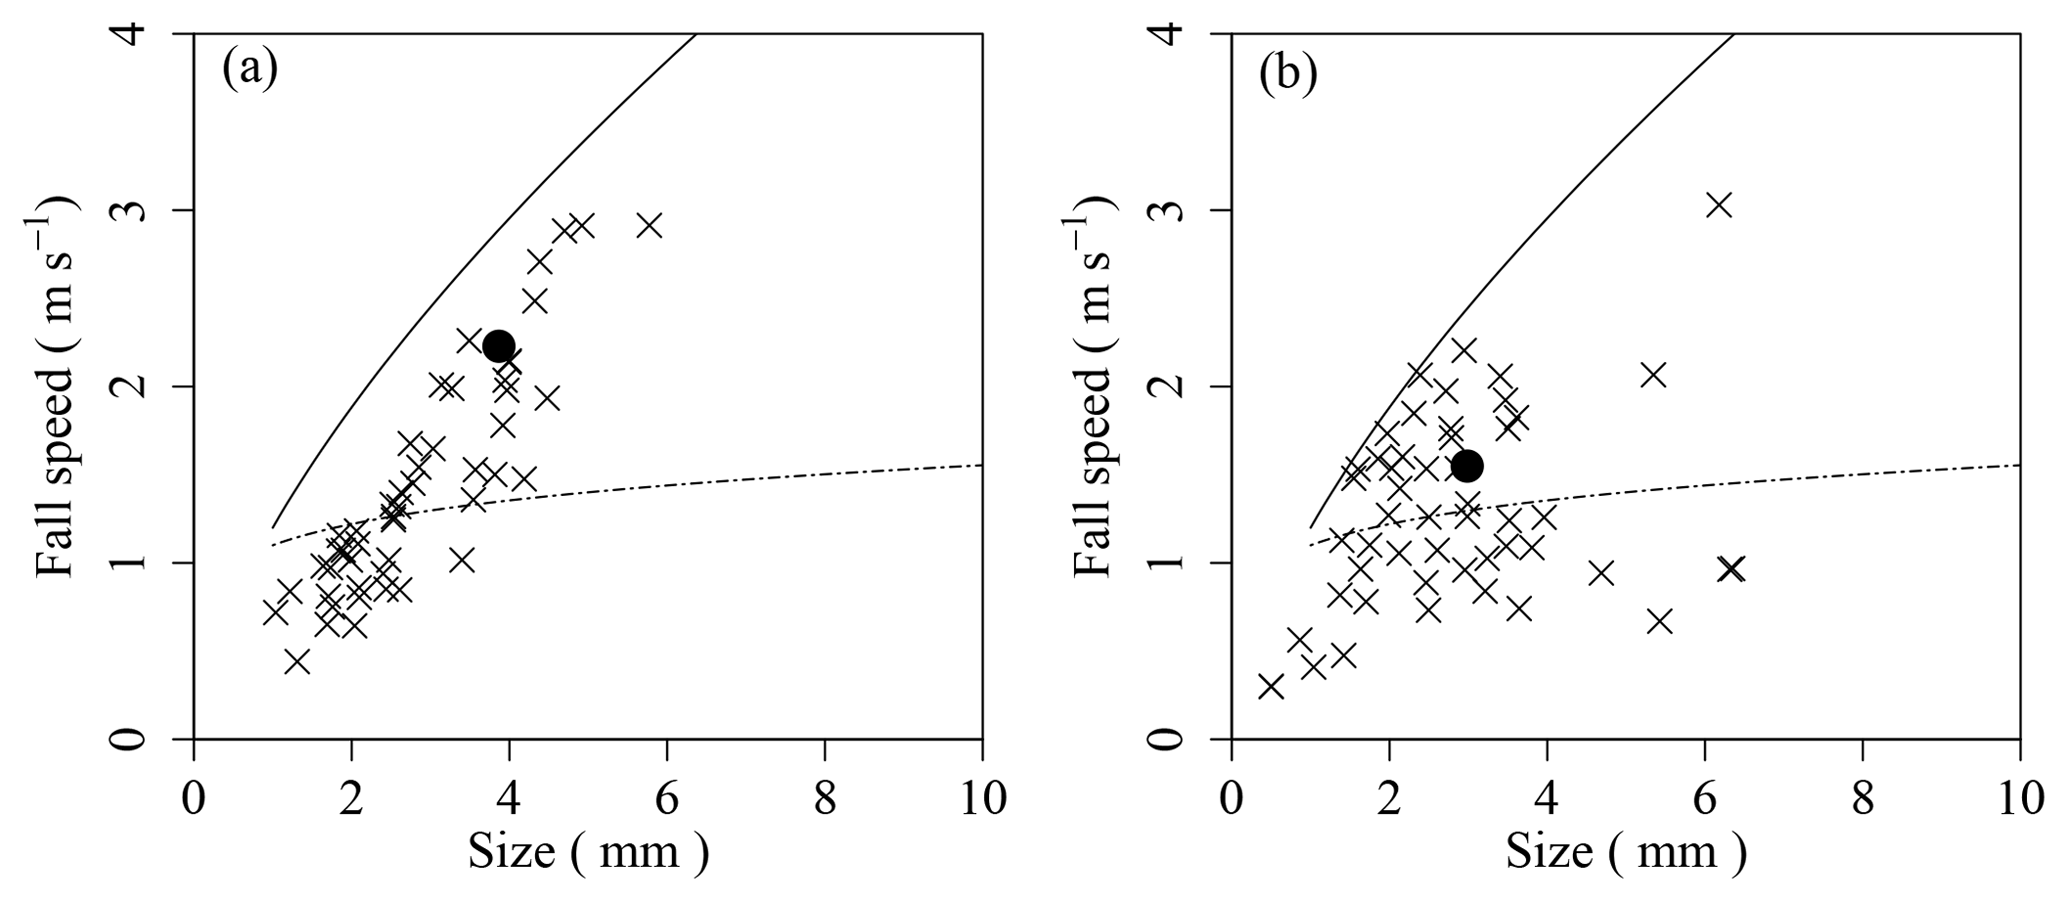
Figure 9Distribution of CMF with 1 min resolution and the integrated CMFs for events. (a) Example of uniform falling event (09:40–10:40: 25 January 2016); (b) example of variant falling event (09:10–10:00: 10 February 2015). The x's: CMF of each minute. Black circle: averaged CMF. Solid line: conical graupel (Locatelli and Hobbs, 1974); broken line: densely rimed aggregate (Locatelli and Hobbs, 1974).
3.4 Relationship between SSA of fresh PPs and detailed characteristics of PPs produced by CMF analyses
In this section, the relationships between the SSA of fresh PPs and their characteristics will be discussed in detail. The PP type sometimes varies even for small observation periods (1–2 h) (Ishizaka et al., 2016). Therefore, it was necessary to select simpler cases with the same PP type during the sample deposition period, to clarify the relationship between the SSA of fresh PP and its characteristics. To examine the quality of PP type variations, the CMF distribution of Ishizaka et al. (2016) during the sample deposition period was considered. In the analyses, CMF was averaged over the sample deposition period (averaged CMF) and over each 1 min interval (1 min CMF). Figure 9 shows the representative CMF plots under different conditions. In Fig. 9a, the pattern of a 1 min CMF can remain unchanged even as the particle size differs during the sample deposition period. In such a case, these events were regarded as uniform falling events (UFEs), which have a single PP type during the deposition period. On the other hand, the pattern of a 1 min CMF in Fig. 9b can also fluctuate in size–fall–speed coordinates, while the averaged CMF in Fig. 9b is located in an intermediate area during the sample deposition period. In such a case, these events were regarded as variant falling events, which have mixed PP types during the deposition period. CMF distributions of all cases in the NMEs were graphed and inspected visually based on these analyses. A total of 49 UFEs were selected from the NMEs (Table 1). Figure 10 illustrates the results of comparison between data of NMEs (72) and data of UFEs (49). Although the number of UFEs is two-thirds the number of NMEs, the UFE dispersion still follows a trend similar to NME dispersion. For this reason, only UFE data will be used for detailed analyses hereinafter.
As shown in Fig. 6, the SSA strongly depends on its synoptic-scale conditions. Therefore, the relationship between SSA of fresh PPs and the detailed characteristics of PPs should also depend on the synoptic-scale conditions. For this reason, firstly UFE data were classified into the two synoptic-scale conditions (M type and C type). In addition, M-type data were classified into three groups based on the PP type (aggregate group, AGG; graupel group, GRA; and small particle group, SMG) using the CMF analyses reported by Ishizaka et al. (2016) (Fig. 11). Although Ishizaka divided a small particle group (SMG) into two subgroups (S1 and S2), this study treated S1 and S2 as one group (SMG) (Fig. 11). Finally, four data groups (C type, AGG, GRA, and SMG) were used for analyses.
In this study, three physical characteristics obtained from the CMF analyses were adopted – averaged fall speed (V) of PP and averaged apparent size (D) of PP. These two elements were determined by the CCD image for each particle and then averaged over all the particles during the sample deposition period (Ishizaka et al., 2013). The third physical characteristics is the initial density (ρ) after the deposition on the ground, which was calculated based on 5 min averaged CMF data using the method of Ishizaka et al. (2016). V and D were directly measured while ρ was estimated using V and D.
Figure 12 shows the relationship between the SSA of fresh PPs and the three physical characteristics of PP produced for each data group. In the C-type group, significant correlations (p value is smaller than 0.05) between the measured SSA and all three physical characteristics could be obtained. Parameters V and ρ decreased with increasing SSA (Fig. 12j and l), while D increased with the increase in SSA (Fig. 12k). The relationship between the measured SSA and ρ under the C-type group shows a similar trend as in Domine et al. (2007).
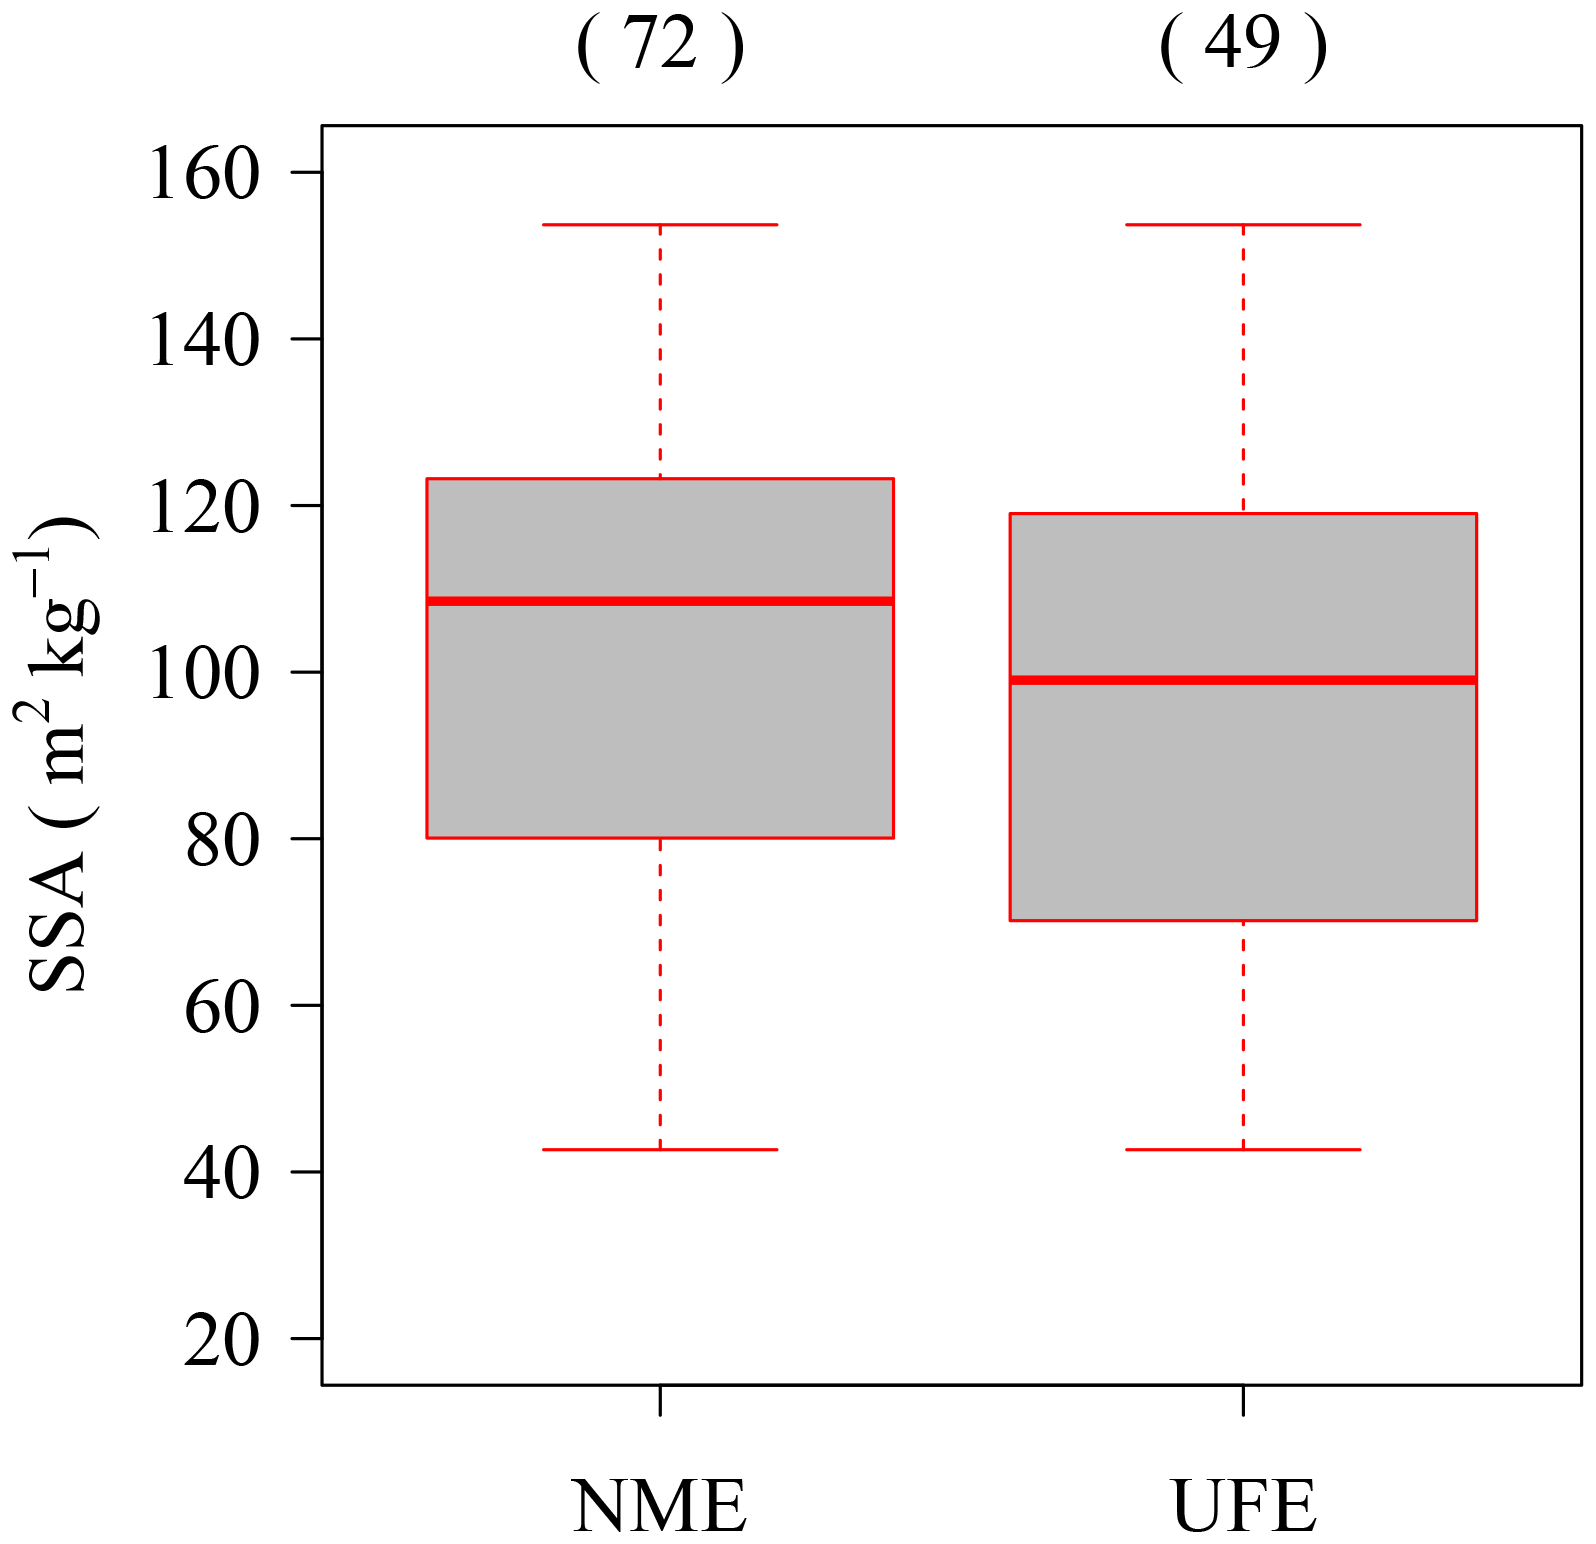
Figure 10Comparison between data of no-melt events and uniform falling events. NME indicates data of no-melt events and UFE indicates uniform falling events. Each box plot shows the median, 25 % and 75 % percentiles, 1.5× interquartile ranges, and outliers. Values in parentheses are sample numbers.
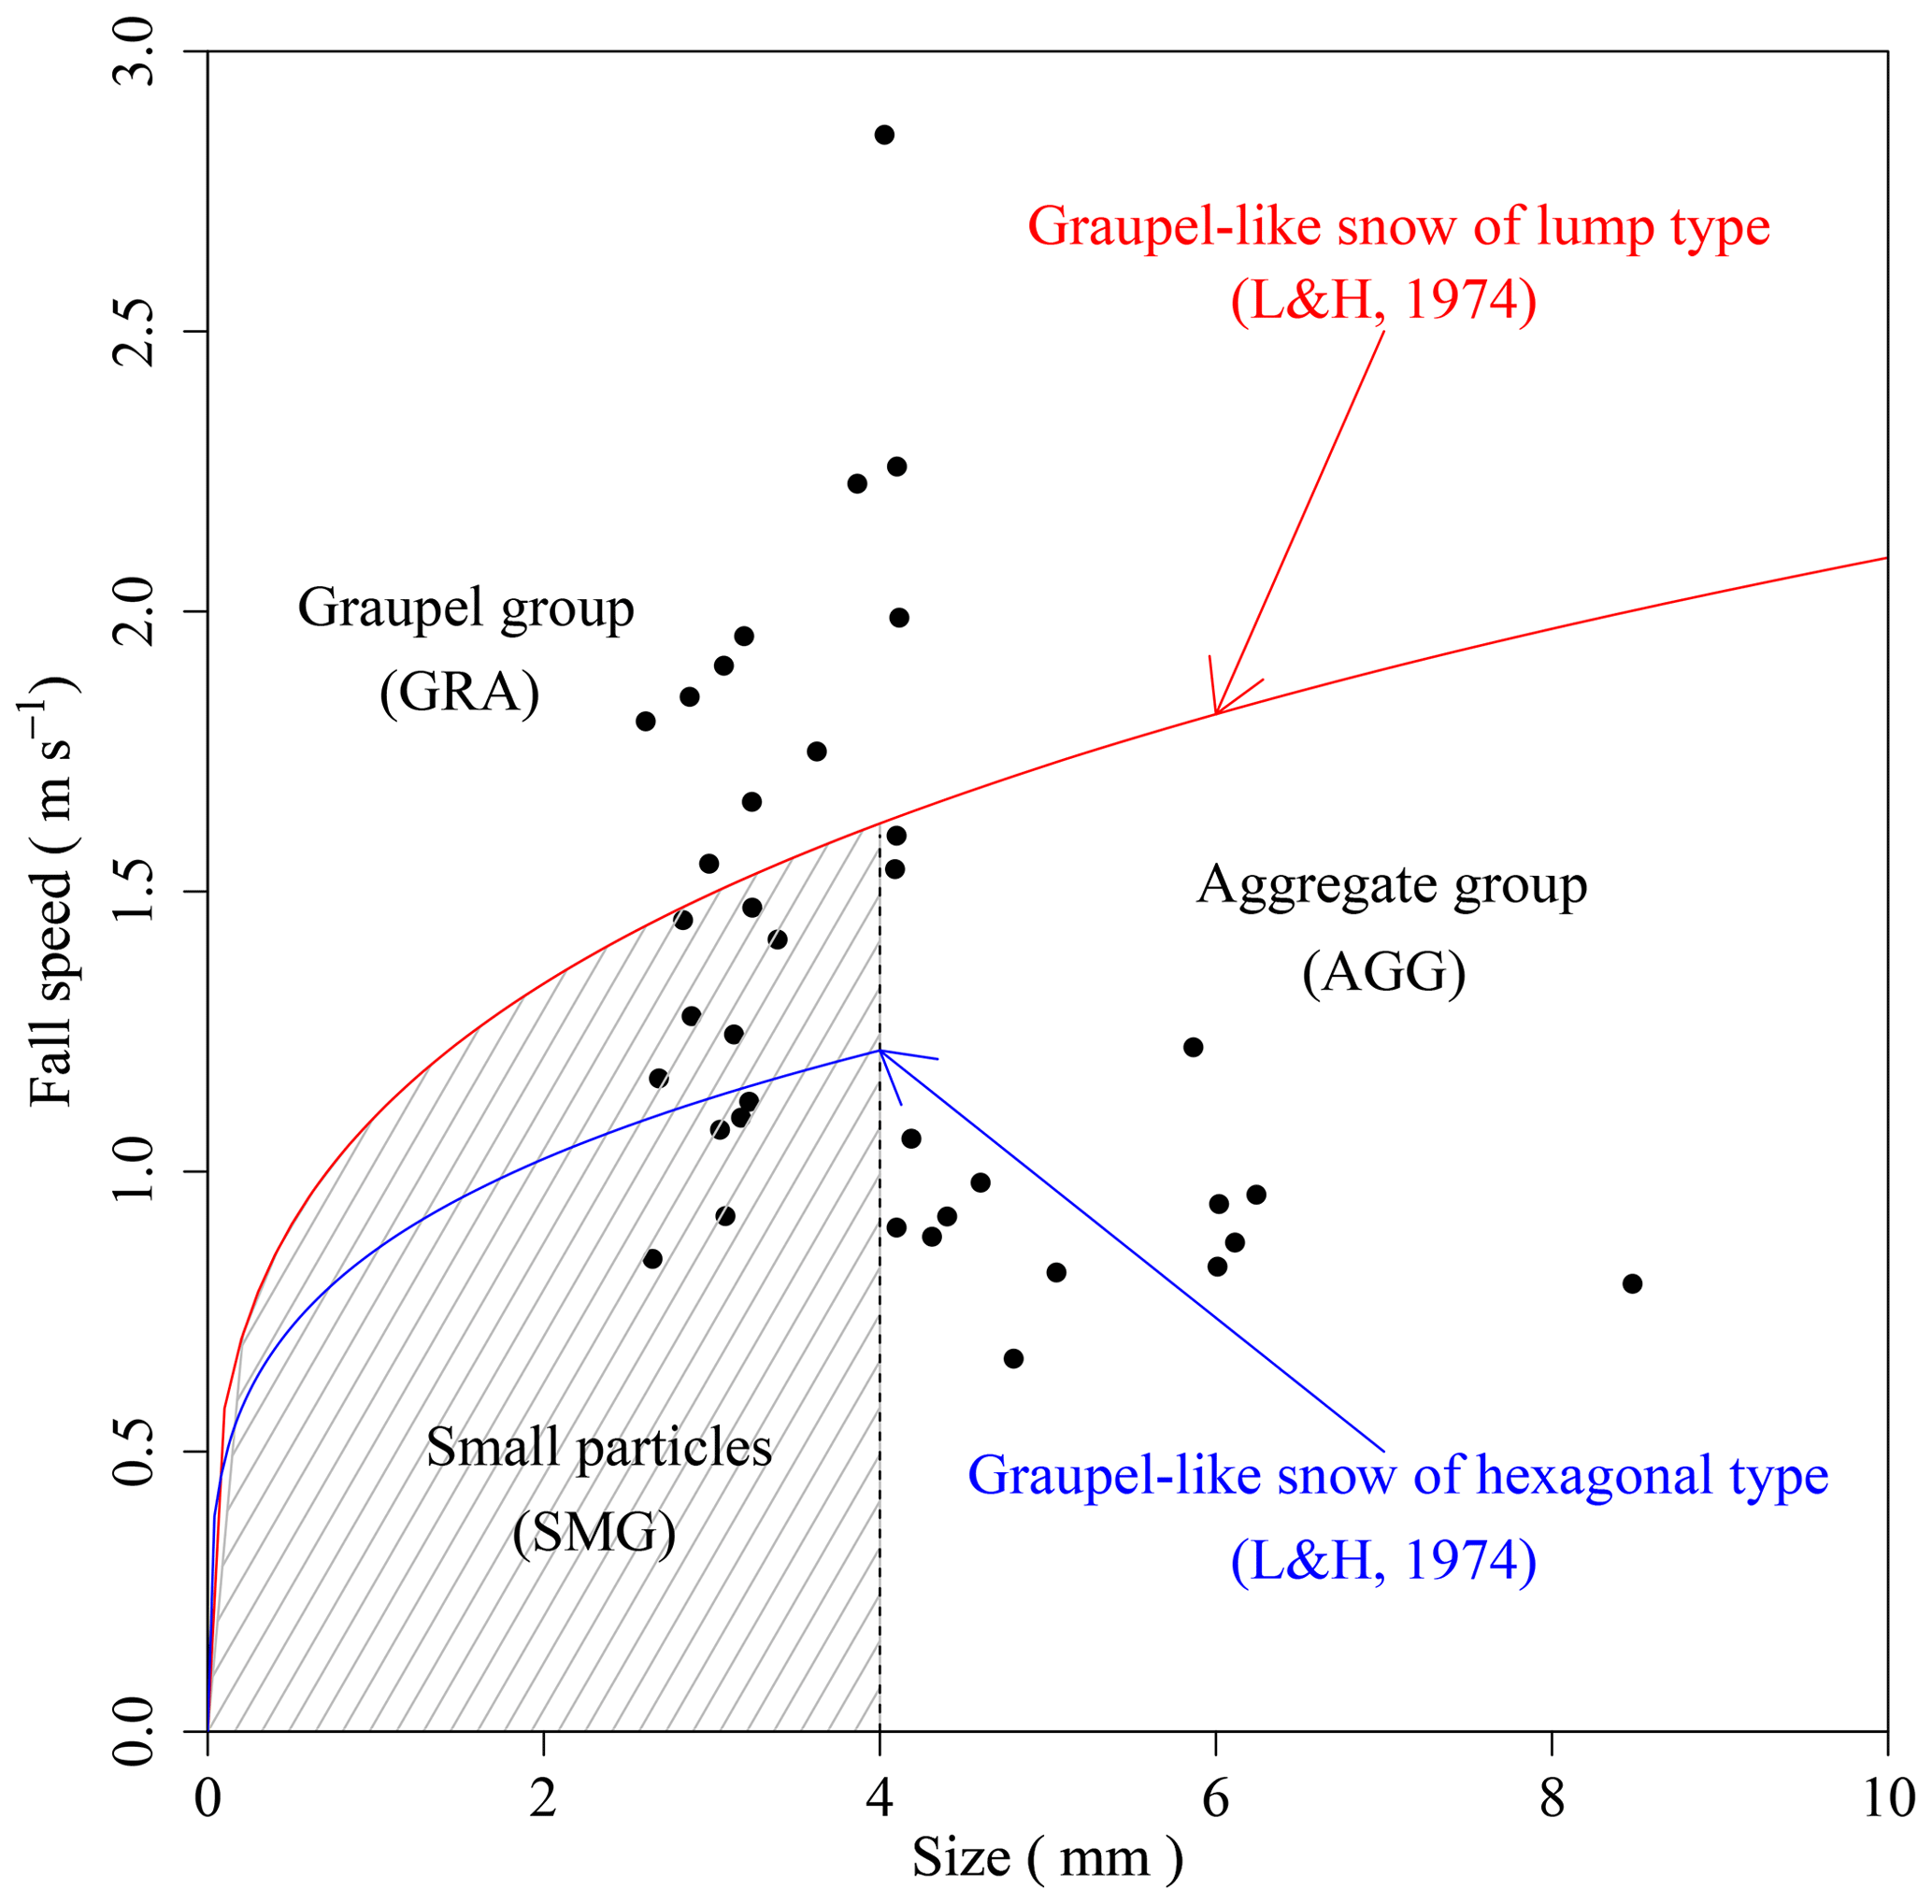
Figure 11Categories used in snowfall event classification, showing their location in terms of size–fall–speed coordinates. The two curves represent size–fall–speed relationships for lump-type (red curve) and hexagonal-type graupels (blue curve) (from Locatelli and Hobbs, 1974, denoted as L&H, 1974, on the graph). Black circles are data under the M type in UFEs.
In the groups of AGG, GRA, and SMA under the M-type condition, only one significant correlation (p value 0.05) between the SSA and D could be obtained in the GRA. The p values for other combinations were not enough to assure significant correlations (p value > 0.05). Basically, the trends of GRA and SMA remain the same, while those of AGG differ from the other two groups. The trend between D and SSA in the GRA, which is a positive correlation, may result from the process of graupel growth. It is likely that larger graupel collects a large number of small-rimed drops, and also protects a larger number of small-rimed drops in its body from sublimation during its fall. Therefore, a larger graupel stored a greater number of small-rimed drops in its body. This is only a hypothesis, and further investigation with more measurements is needed to prove it. Furthermore, a simulation using a detailed cloud physics model, such as that of Hashimoto et al. (2018a, b), will equip this study with some useful information to understand the relationship between D and SSA in the GRA group.
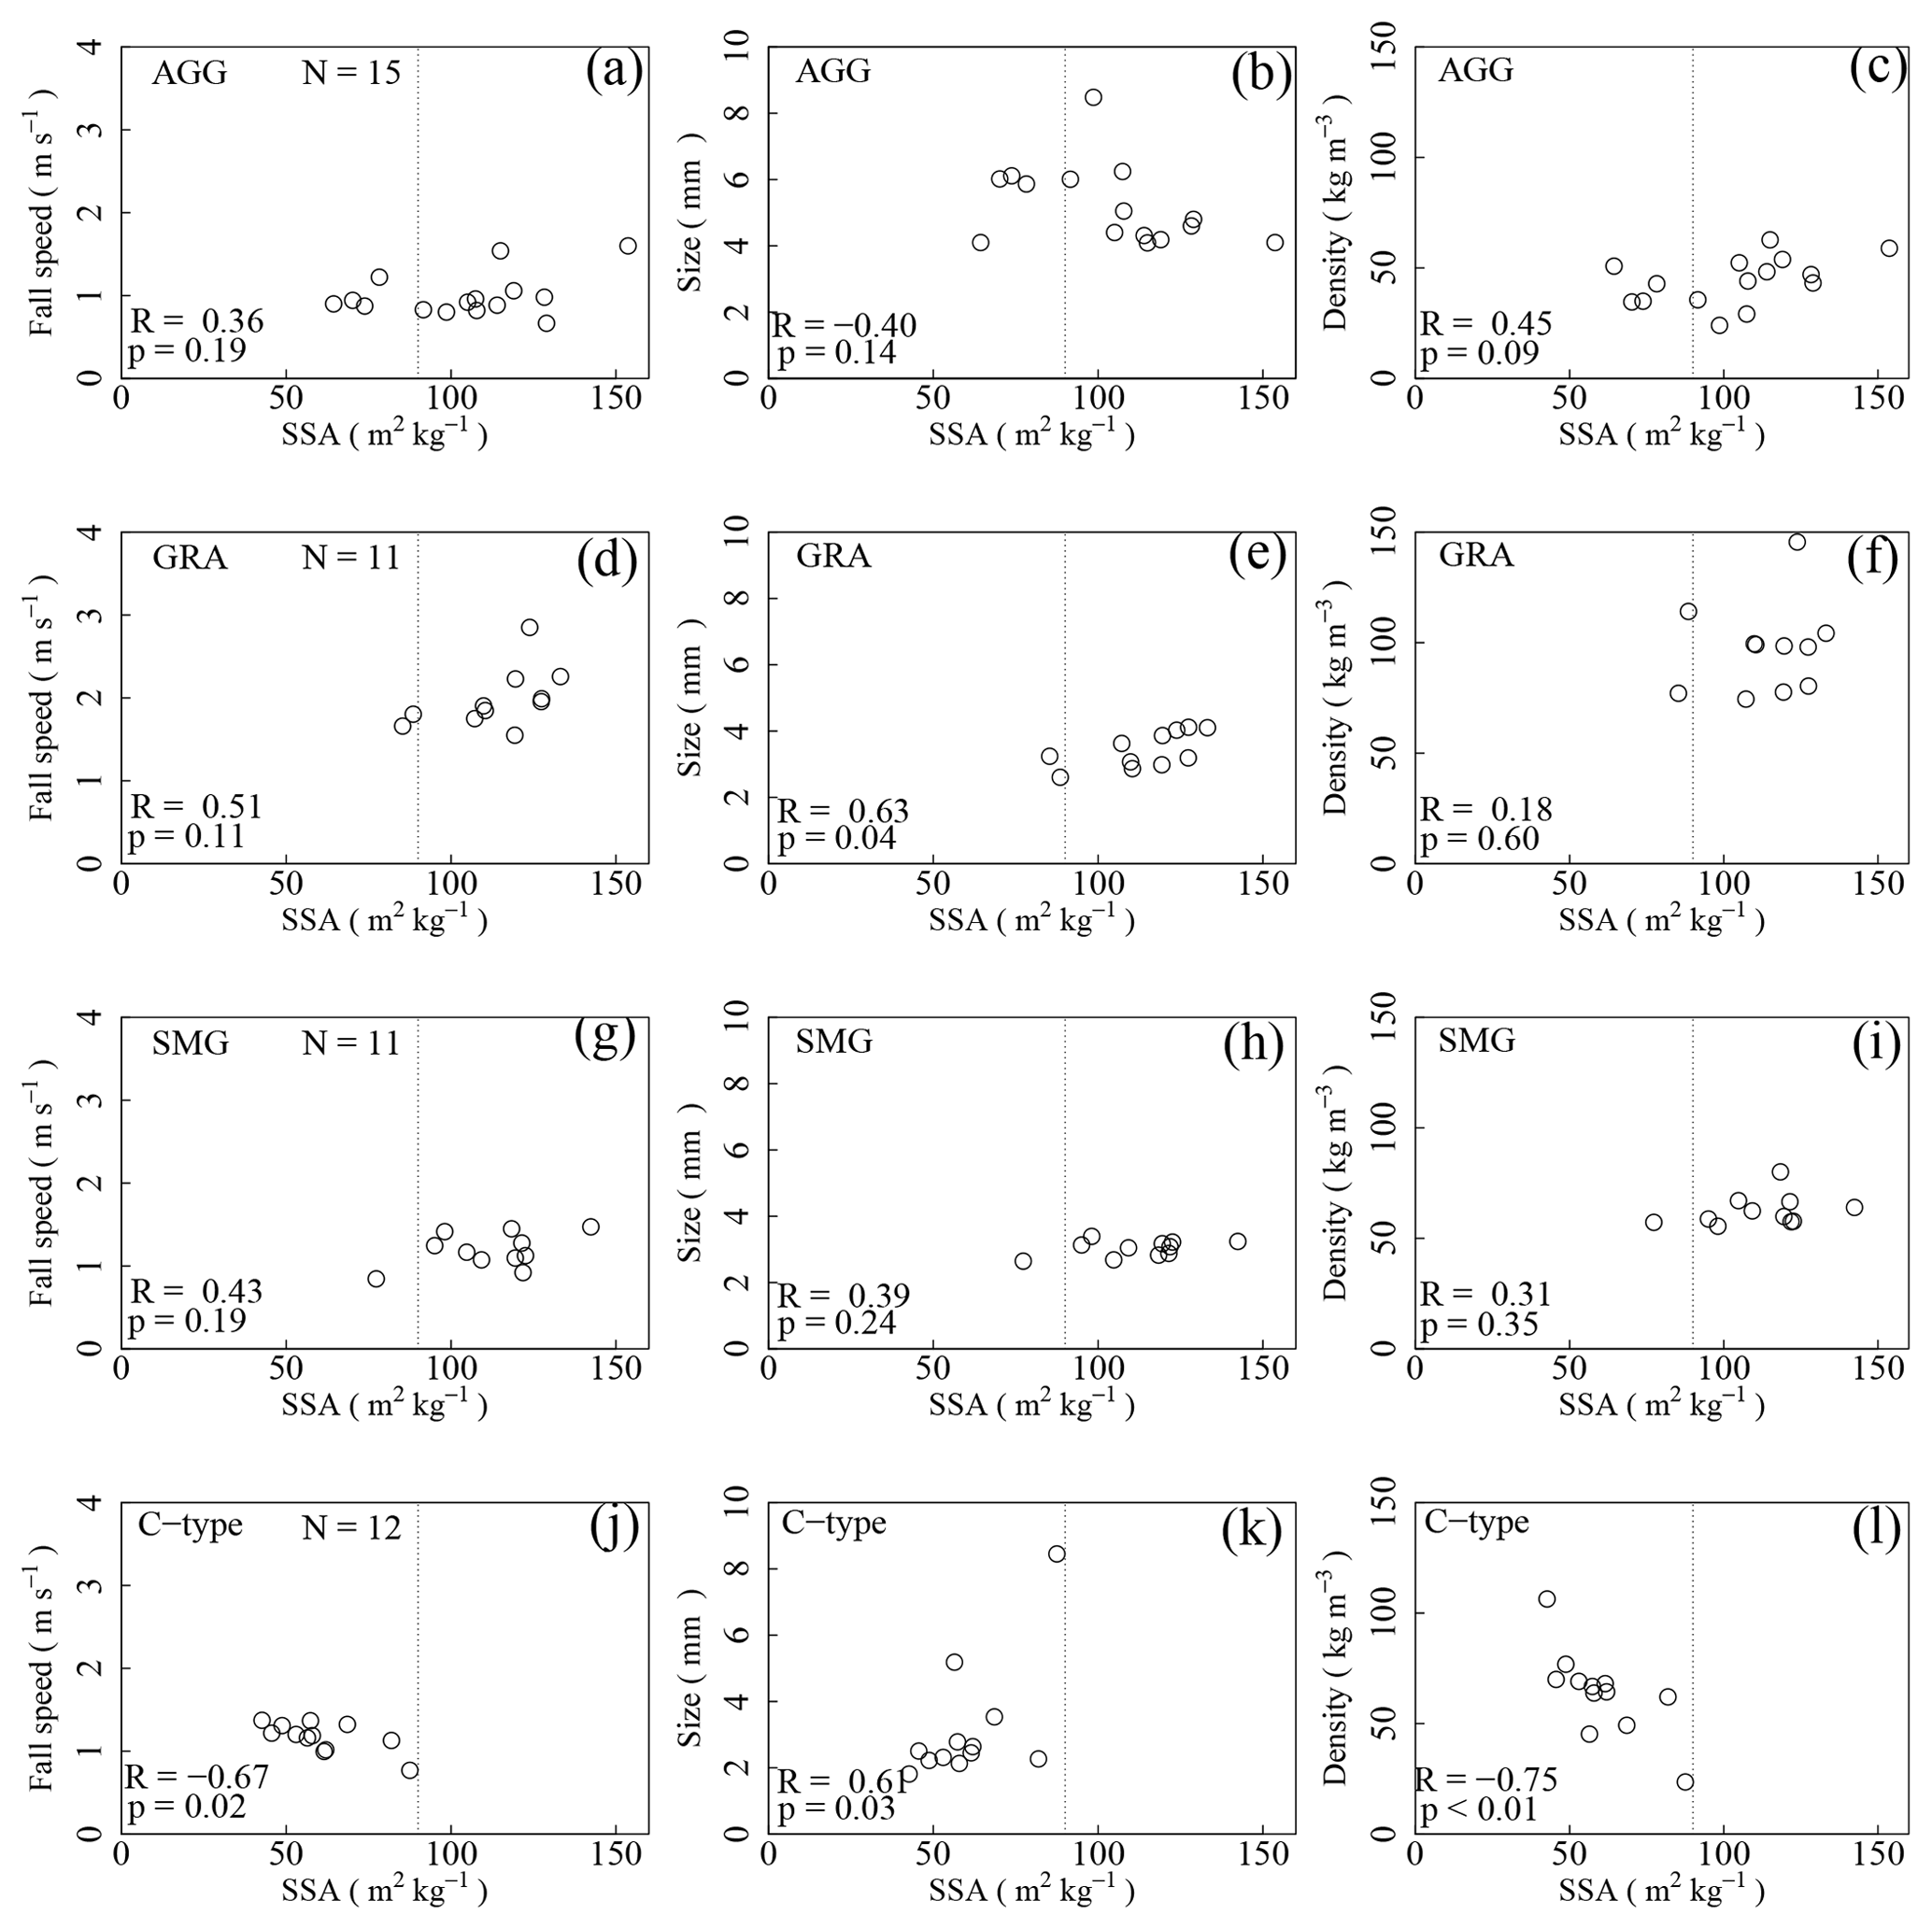
Figure 12Relationship between SSA of freshly fallen snow and detailed characteristics of falling snow produced by the CMF. (a–c) Data of aggregate group events in the M type (AGG); (d–f) data of graupel type events in the M type (GRA); (g–i) data of small particle type events in the M type (SMG); (j–l) data in the C type (C type). N: sample number, R: correlation coefficient, and p: p values. Dotted lines indicate a SSA value of 90 m2 kg−1.
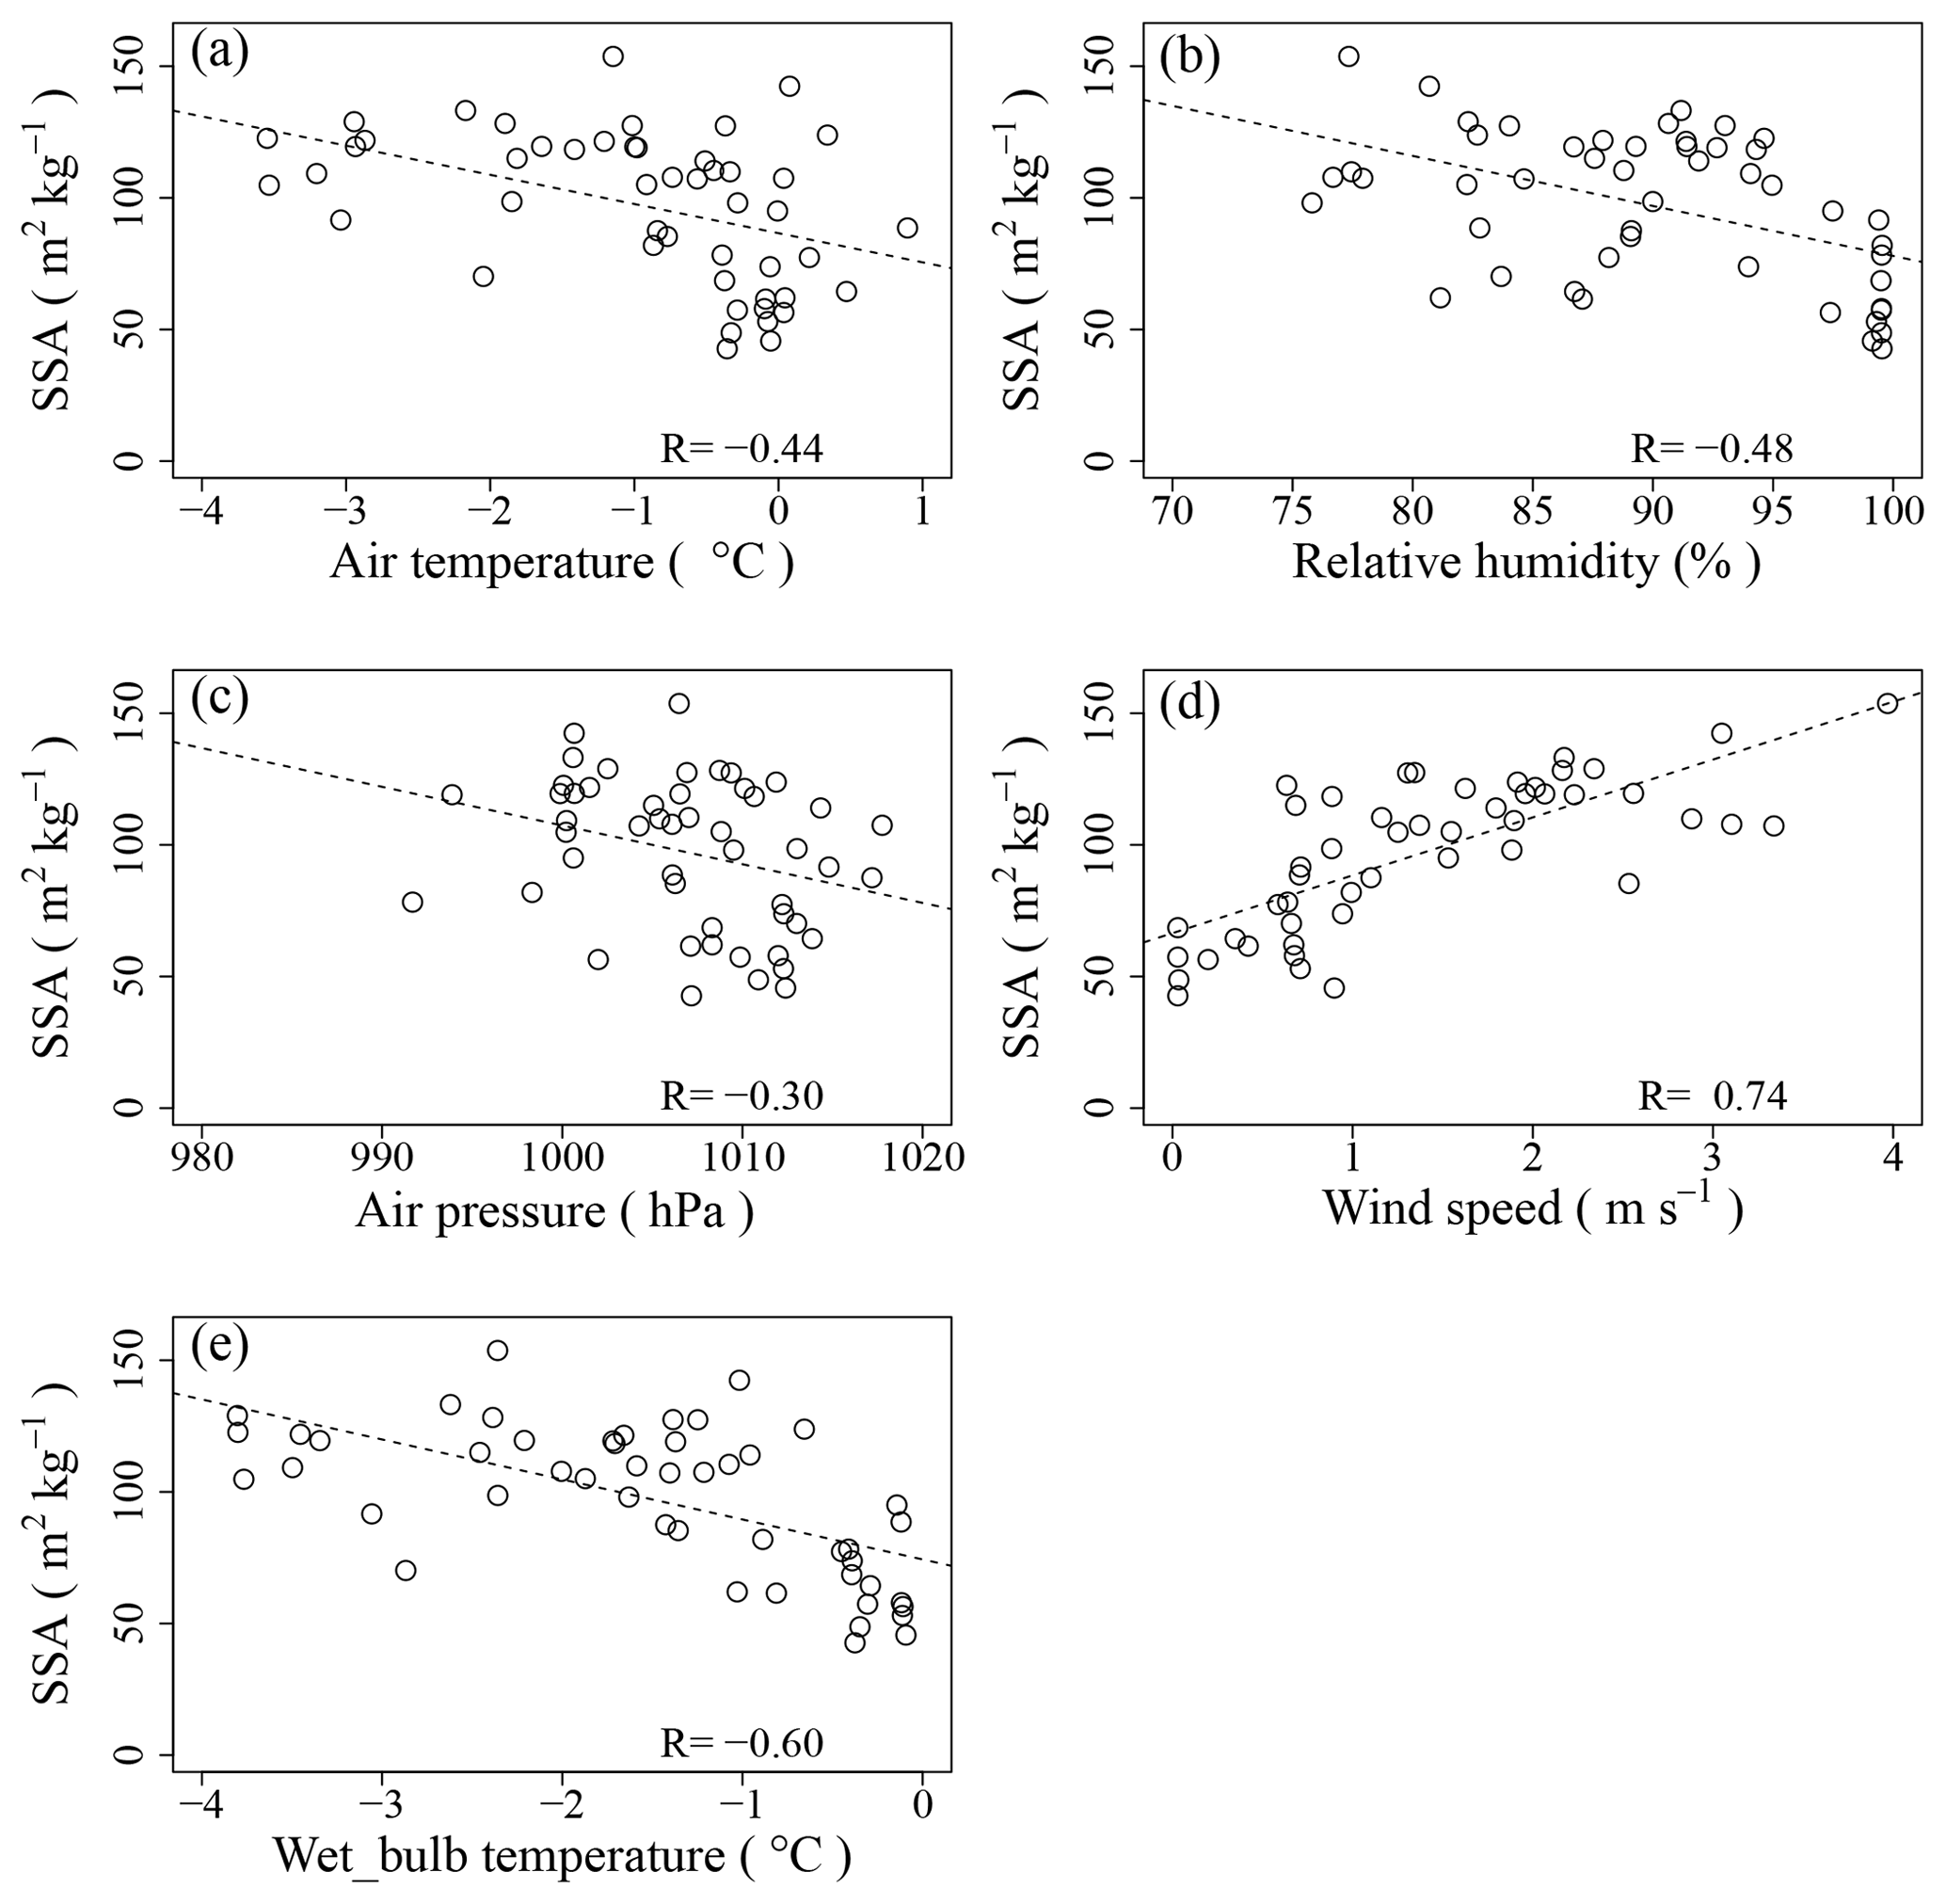
Figure 13Relationships between meteorological elements and measured SSA. (a) Relationship between air temperature and measured SSA; (b) relationship between relative humidity and measured SSA; (c) relationship between air pressure and measured SSA; (d) relationship between wind speed and measured SSA; (e) relationship between wet-bulb temperature and measured SSA. Dashed lines are the linear least-square fit.
As shown in Fig. 6, all measured SSA values of an unrimed crystal in the C-type group are less than 90 m2 kg−1 (the maximum value being 88 m2 kg−1). In addition, the measured SSA values in the S mode under the M-type condition, which include unrimed and lightly rimed snow crystals, are in the range of 70–78 m2 kg−1 (in the AGG). The relationships between the SSA, D, and ρ of the AGG seem to be more complex than those of the other two groups. These results may have resulted from the different degrees of riming on the crystal. This study simply assumes that the crystal having an SSA less than 90 m2 kg−1 is an unrimed crystal type or lightly rimed snow crystal, while the crystal having an SSA of over 90 m2 kg−1 is a rimed crystal; densely rimed, graupel-like, and graupel, are the classifications of riming degree for a single crystal (Mosimann et al., 1993). In fact, a great majority of SSAs of graupels (GRA), which have a large number of rimed drops in them, are larger than 90 m2 kg−1 (Fig. 12d–f). Moreover, SSAs in the SMA, which should be made of small ice crystals with aggregated droplets, are also mostly larger than 90 m2 kg−1 (Fig. 12g–i).
3.5 Relationship between SSA of fresh PPs and meteorological data on the ground
The SSA of PPs should be governed by synoptic conditions and meteorological conditions in the clouds; however, meteorological conditions in the clouds cannot be fully characterized at present. The parameterization of SSA of fresh PPs should be useful to introduce the fresh PP characteristics in the snow cover models, which are essential to predict the avalanche resulting from weak PP layers. A previous study (Domine et al., 2007) concluded that the relationship between measured SSA of fresh PPs and meteorological data on the ground in their data was not legible. One of the reasons for this conclusion originates from the PP samples collected from different sites characterized by different snow climate and synoptic conditions. We propose their SSA values include the influence of different environments. The second reason originates from the presence of various sample measurement intervals, which were longer than those in this study. Their fresh PP samples must have changed due to metamorphism before the measurements, and the metamorphism degrees must have varied depending on their measurement interval. Moreover, meteorological conditions and falling snow types must have varied during the sample deposition because of the longer interval. For these reasons, their conditions complicate the understanding of the relationship between SSA of fresh PPs and meteorological data on the ground. On the other hand, in this study, the SSAs of fresh PPs were measured at the same place with a short time interval (1–2 h), to avoid the effects of pre-measurement metamorphism and meteorological fluctuations. Therefore, in this section, the possibility of parameterizing the SSA of fresh PPs using the meteorological data on the ground is explored. As mentioned in Sect. 3.4, the PP type sometimes varied even for short observation periods (1–2 h) (Ishizaka et al., 2016). Therefore, only the UFE data were used for the analyses (Table 1), to focus on the relationship between the SSA of the uniform PP type and meteorological conditions. The following elements, averaged only over the period of snowfall (see Sect. 3.2), were chosen – air temperature (Ta), relative humidity (RH), wind speed (WS), air pressure (p), and wet-bulb temperature (Tw) calculated using Ta, RH, and p. The reasons for selecting these meteorological elements are that Ta, RH, WS, and Tw are often used for the parameterization of new snow density, as summarized by Helfricht et al. (2018). Although WS is also strongly affected by the local topography and roughness, WS and p should share a relation with the synoptic-scale conditions.
Figure 13 shows the correlations between the measured SSA and each meteorological variable (Ta, RH, WS, p, and Tw). Although all variables show a significant correlation with the measured SSA (p value < 0.05), the relationships vary with each variable. A strong, positive relationship between the measured SSA and WS was obtained with a high correlation coefficient, R (R=0.74); SSA increases with increasing WS (Fig. 13d). The results of this study correspond to those of Harimaya and Nakai (1999), in which the mass proportion of rime reportedly increased with an increase in the wind speed under the T and L modes. Tw shows a strong negative correlation with SSA (); SSA decreases with an increase in Tw (Fig. 13e). Ta and RH show relatively low negative correlations (Ta: ; RH: ) (Fig. 13a and b). On the other hand, the relationship between SSA and p shows a small negative correlation () (Fig. 13c). Based on these analyses, WS and Tw were selected for the parameterization of the SSA of fresh PPs because of their high R values. Moreover, Tw indirectly involves the influences of Ta, RH, and p fluctuations because it is calculated using those parameters. To deduce an estimation equation for SSA using WS and Tw, SSA was assumed to be linearly dependent on WS and Tw. Equation (2) is this parameterization with the least-squares method:
Here, the valid range in Eq. (2) is from 0 to 4 m s−1 for WS and from −4 to 0 ∘C for Tw.
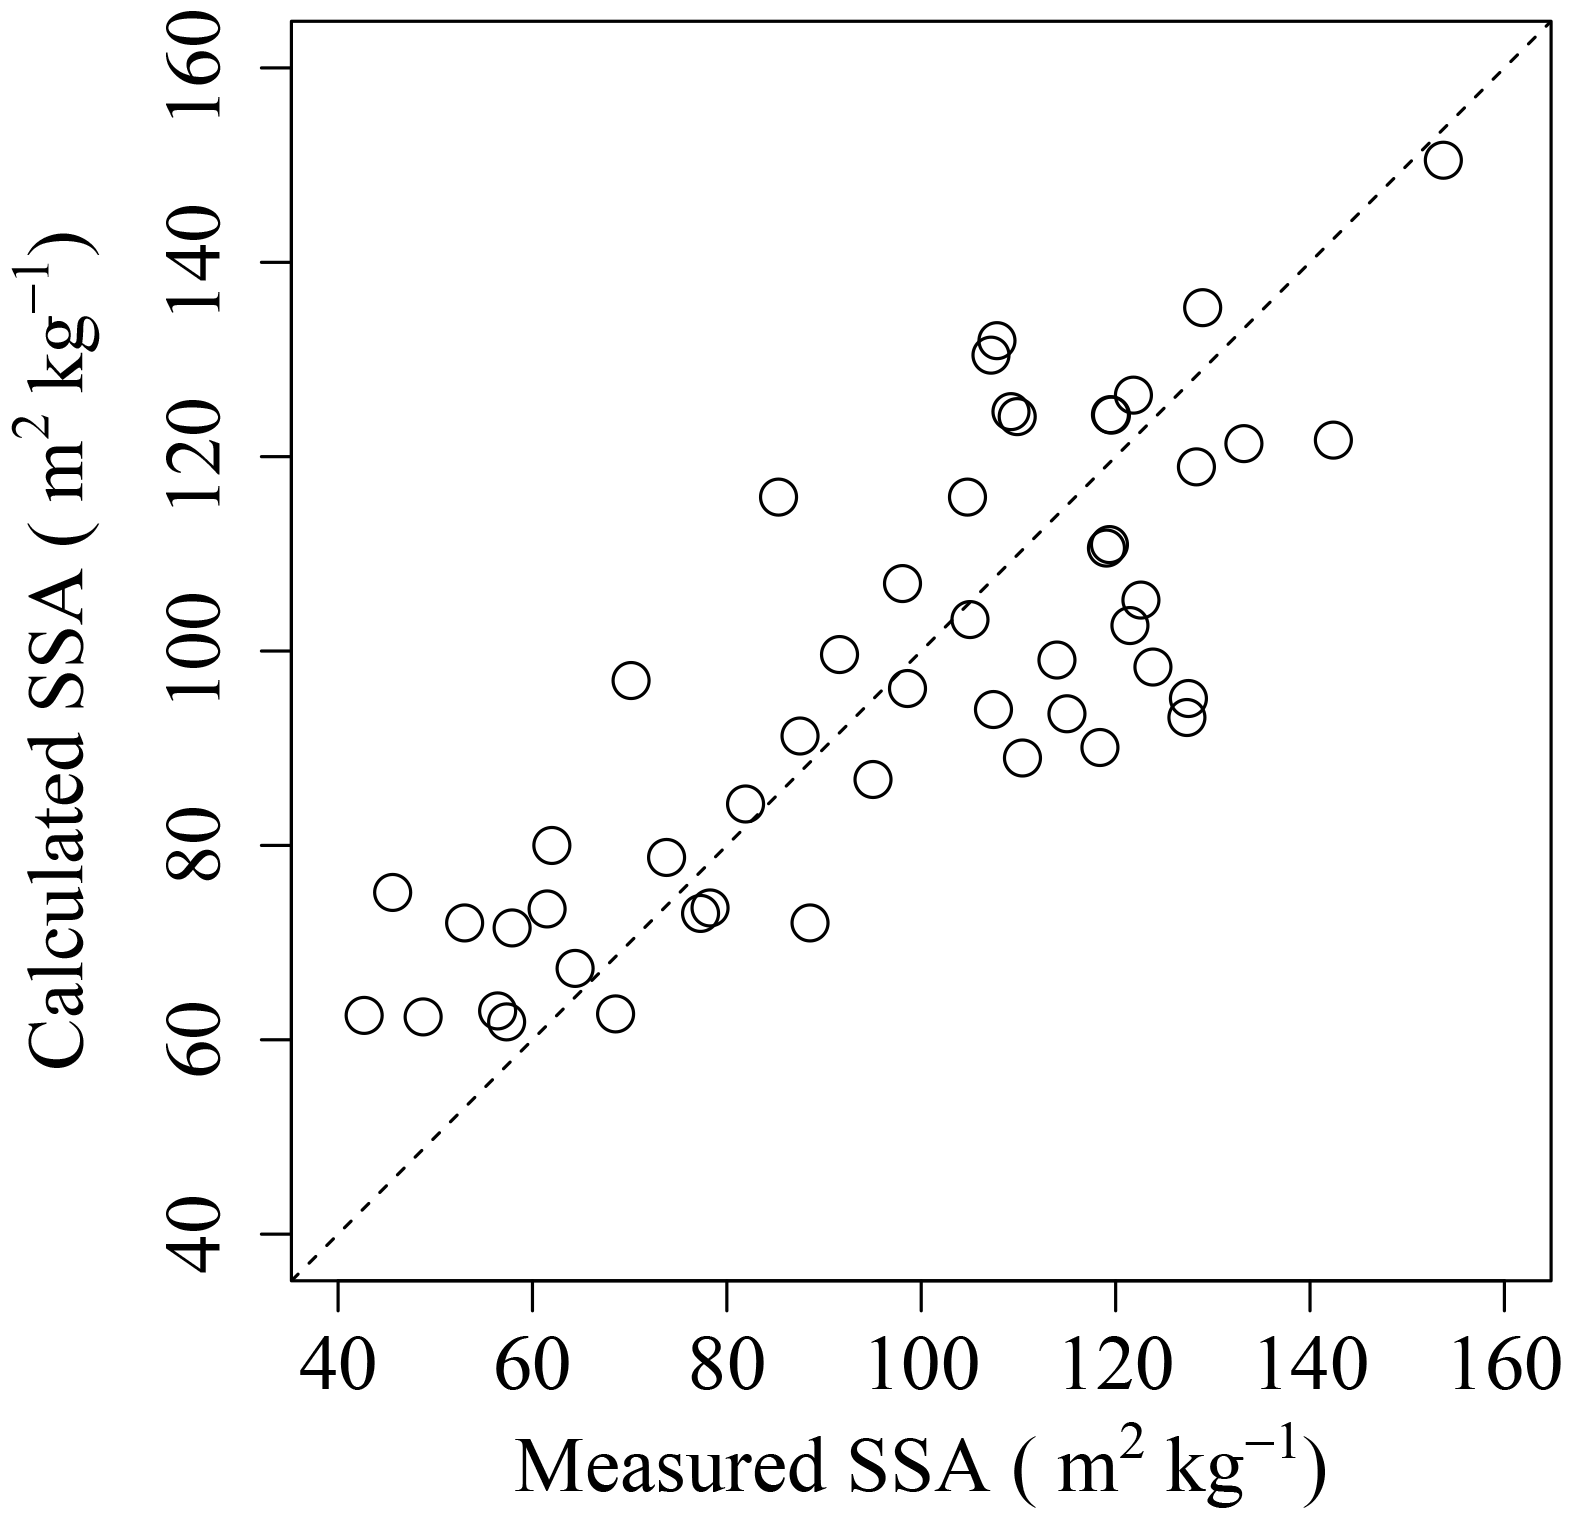
Figure 14Comparison between measured SSA and calculated SSA using Eq. (2) Dotted line indicates 1 : 1 line.
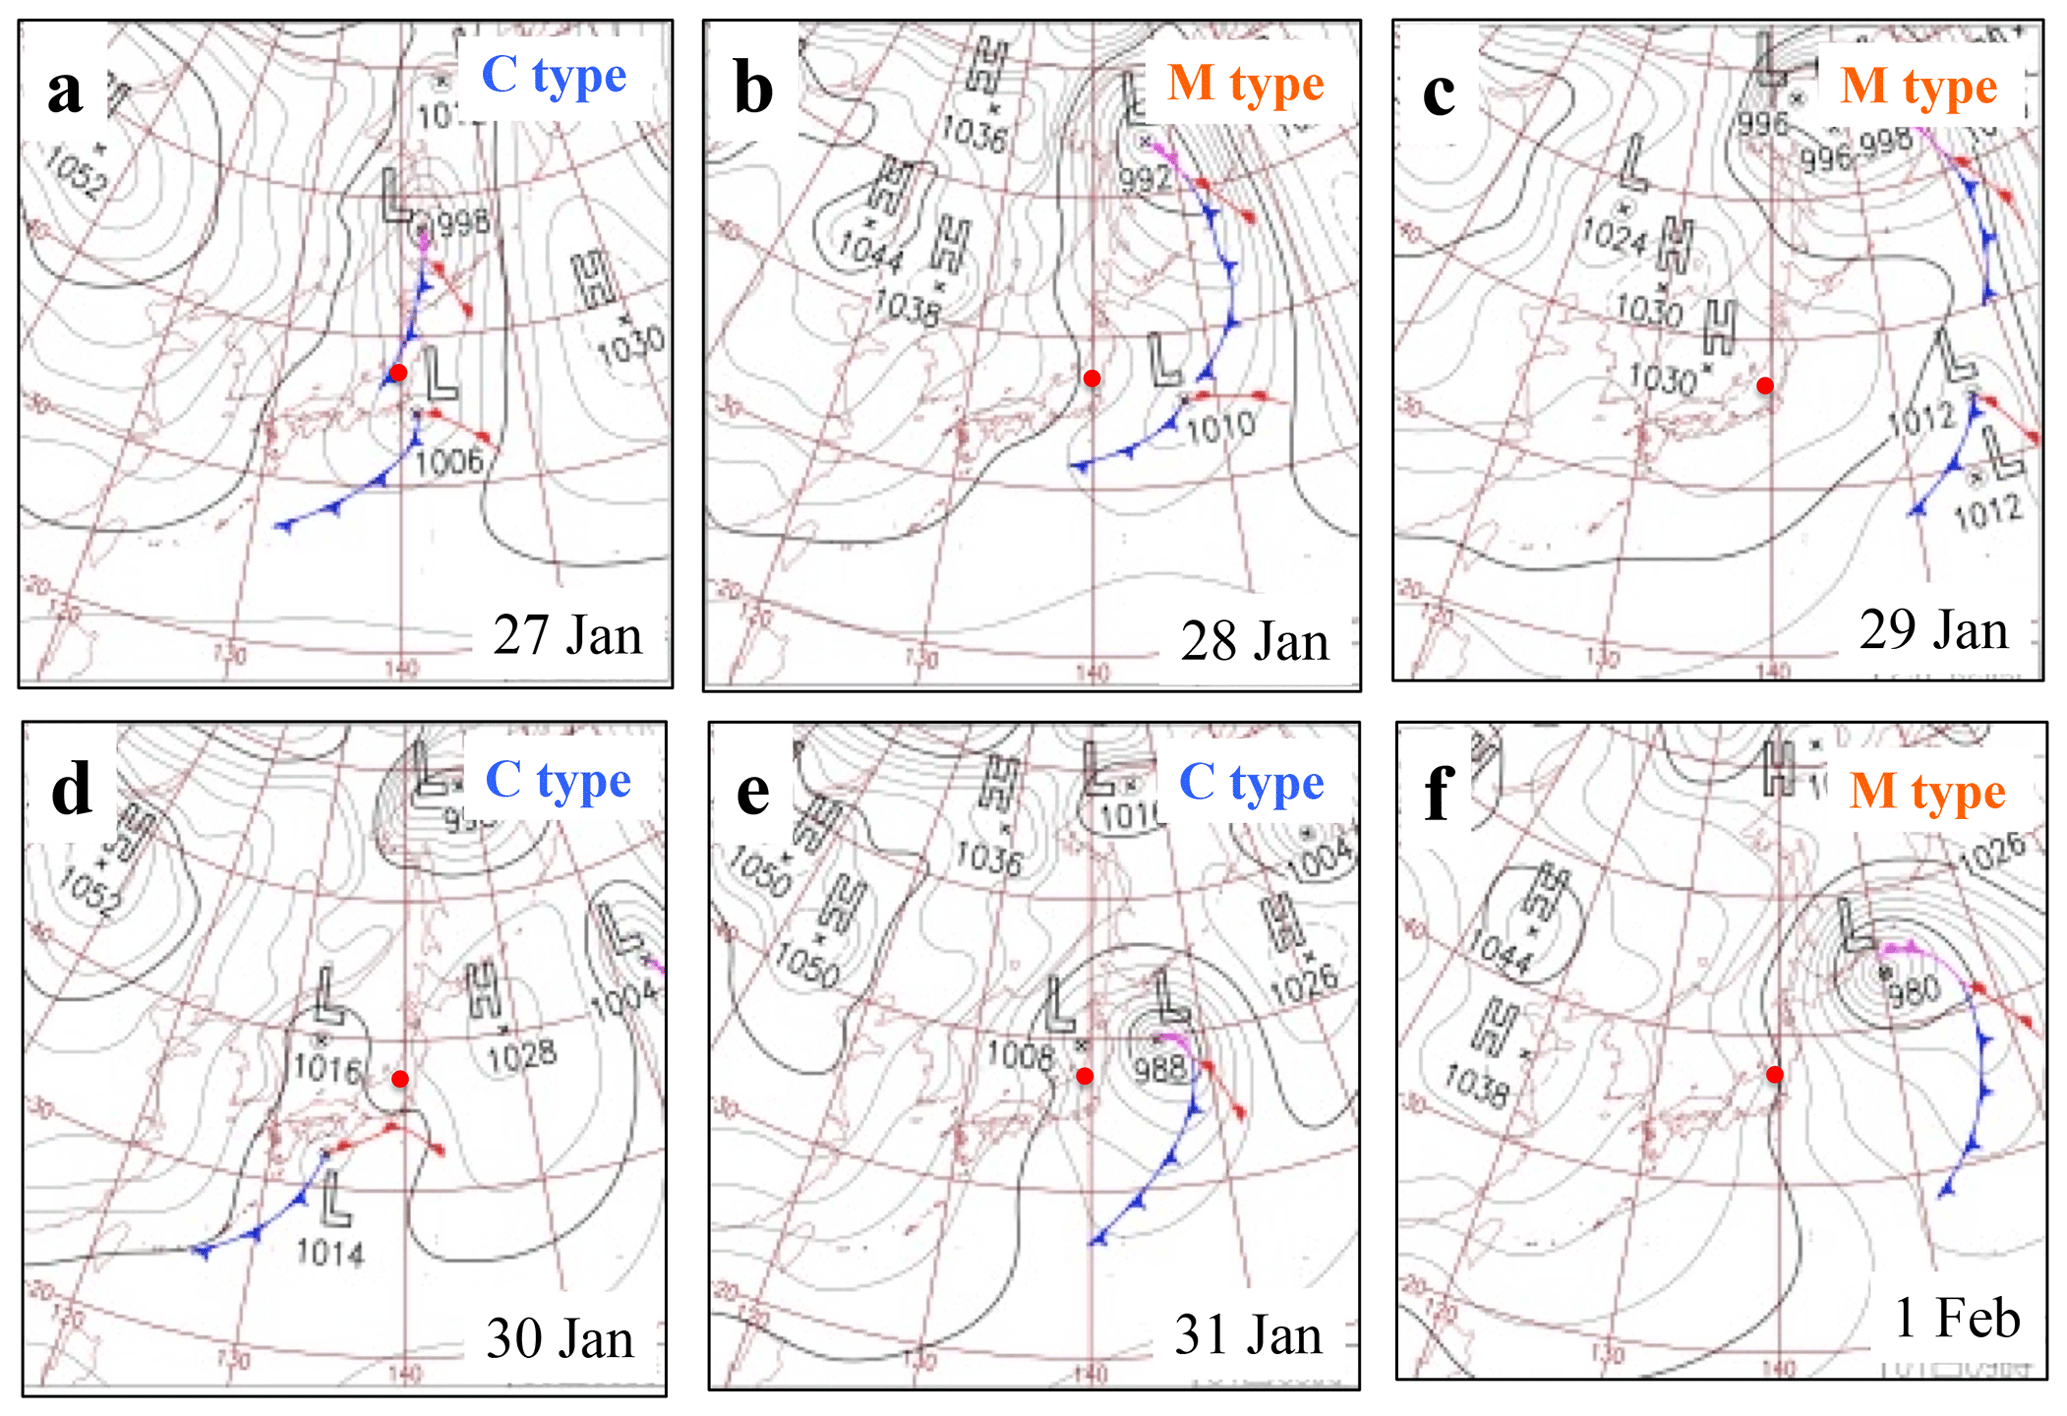
Figure 15Synoptic atmospheric pressure conditions during the period from 27 January to 1 February 2015. Red circles indicate the location of Nagaoka. Each weather chart shows the condition at 09:00 (JST). Weather charts were produced by the Japan Meteorological Agency (http://www.data.jma.go.jp/fcd/yoho/hibiten/index.html, last access: 20 April 2019).
Figure 14 shows the comparison between the measured SSA and the calculated SSA, using Eq. (2) with WS and Tw. The residual standard error is 16.8 m2 kg−1. These results indicate that the SSA of fresh PPs can be calculated using meteorological data of Nagaoka. Although the equation includes the limitation of its parameterization, which is strongly site-specific, especially due to the introduction of wind speed as a parameter, this idea is the first step to introducing falling snow crystals into the snow cover models using SSA. To investigate the adaptable ratio to the valid range in Eq. (2) during winter in Nagaoka, the data of winter 2015 (December 2014–March 2015) were analyzed using meteorological data with 1 h resolution: 445 snowfall events occurred during the winter of 2015 (here, a snowfall event is defined as an event where the snow height increases within 1 h), and 374 cases of 445 snowfall events (84 % cases of snowfall events) were in the valid range of Eq. (2). In the case of outrange in Eq. (2), Tw ≧ 0 ∘C (59 cases) and WS > 4 m s−1 (14 cases) (the case of Tw ≧ 0 ∘C and WS > 4 m s−1: three cases). Therefore, there is still room for improvement to treat SSA under the melting effect simulation in Eq. (2).
3.6 Calculation of time evolution of SSA of fresh PPs
Here, the time-evolution estimation of the SSA of fresh PPs for the period of 27 January to 1 February 2015, in which the synoptic meteorological conditions periodically changed (Fig. 15), is presented using Eq. (2). Figure 16 shows the meteorological conditions (WS: wind speed; Tw: wet-bulb temperature; HS: height of snow; and P: precipitation) during this period. Values of the SSA of fresh PPs calculated using Eq. (2) with 10 min meteorological data (WS and Tw) are also shown in Fig. 16. In this figure, SSA is calculated only for the conditions where Tw<0 ∘C and P>0 mm, based on the 10 min meteorological data, and are then averaged over each hour to obtain hourly data. In the figure, the ranges of fluctuations in the calculated SSA during each hour and the values of the measured SSA are also shown in the figure.
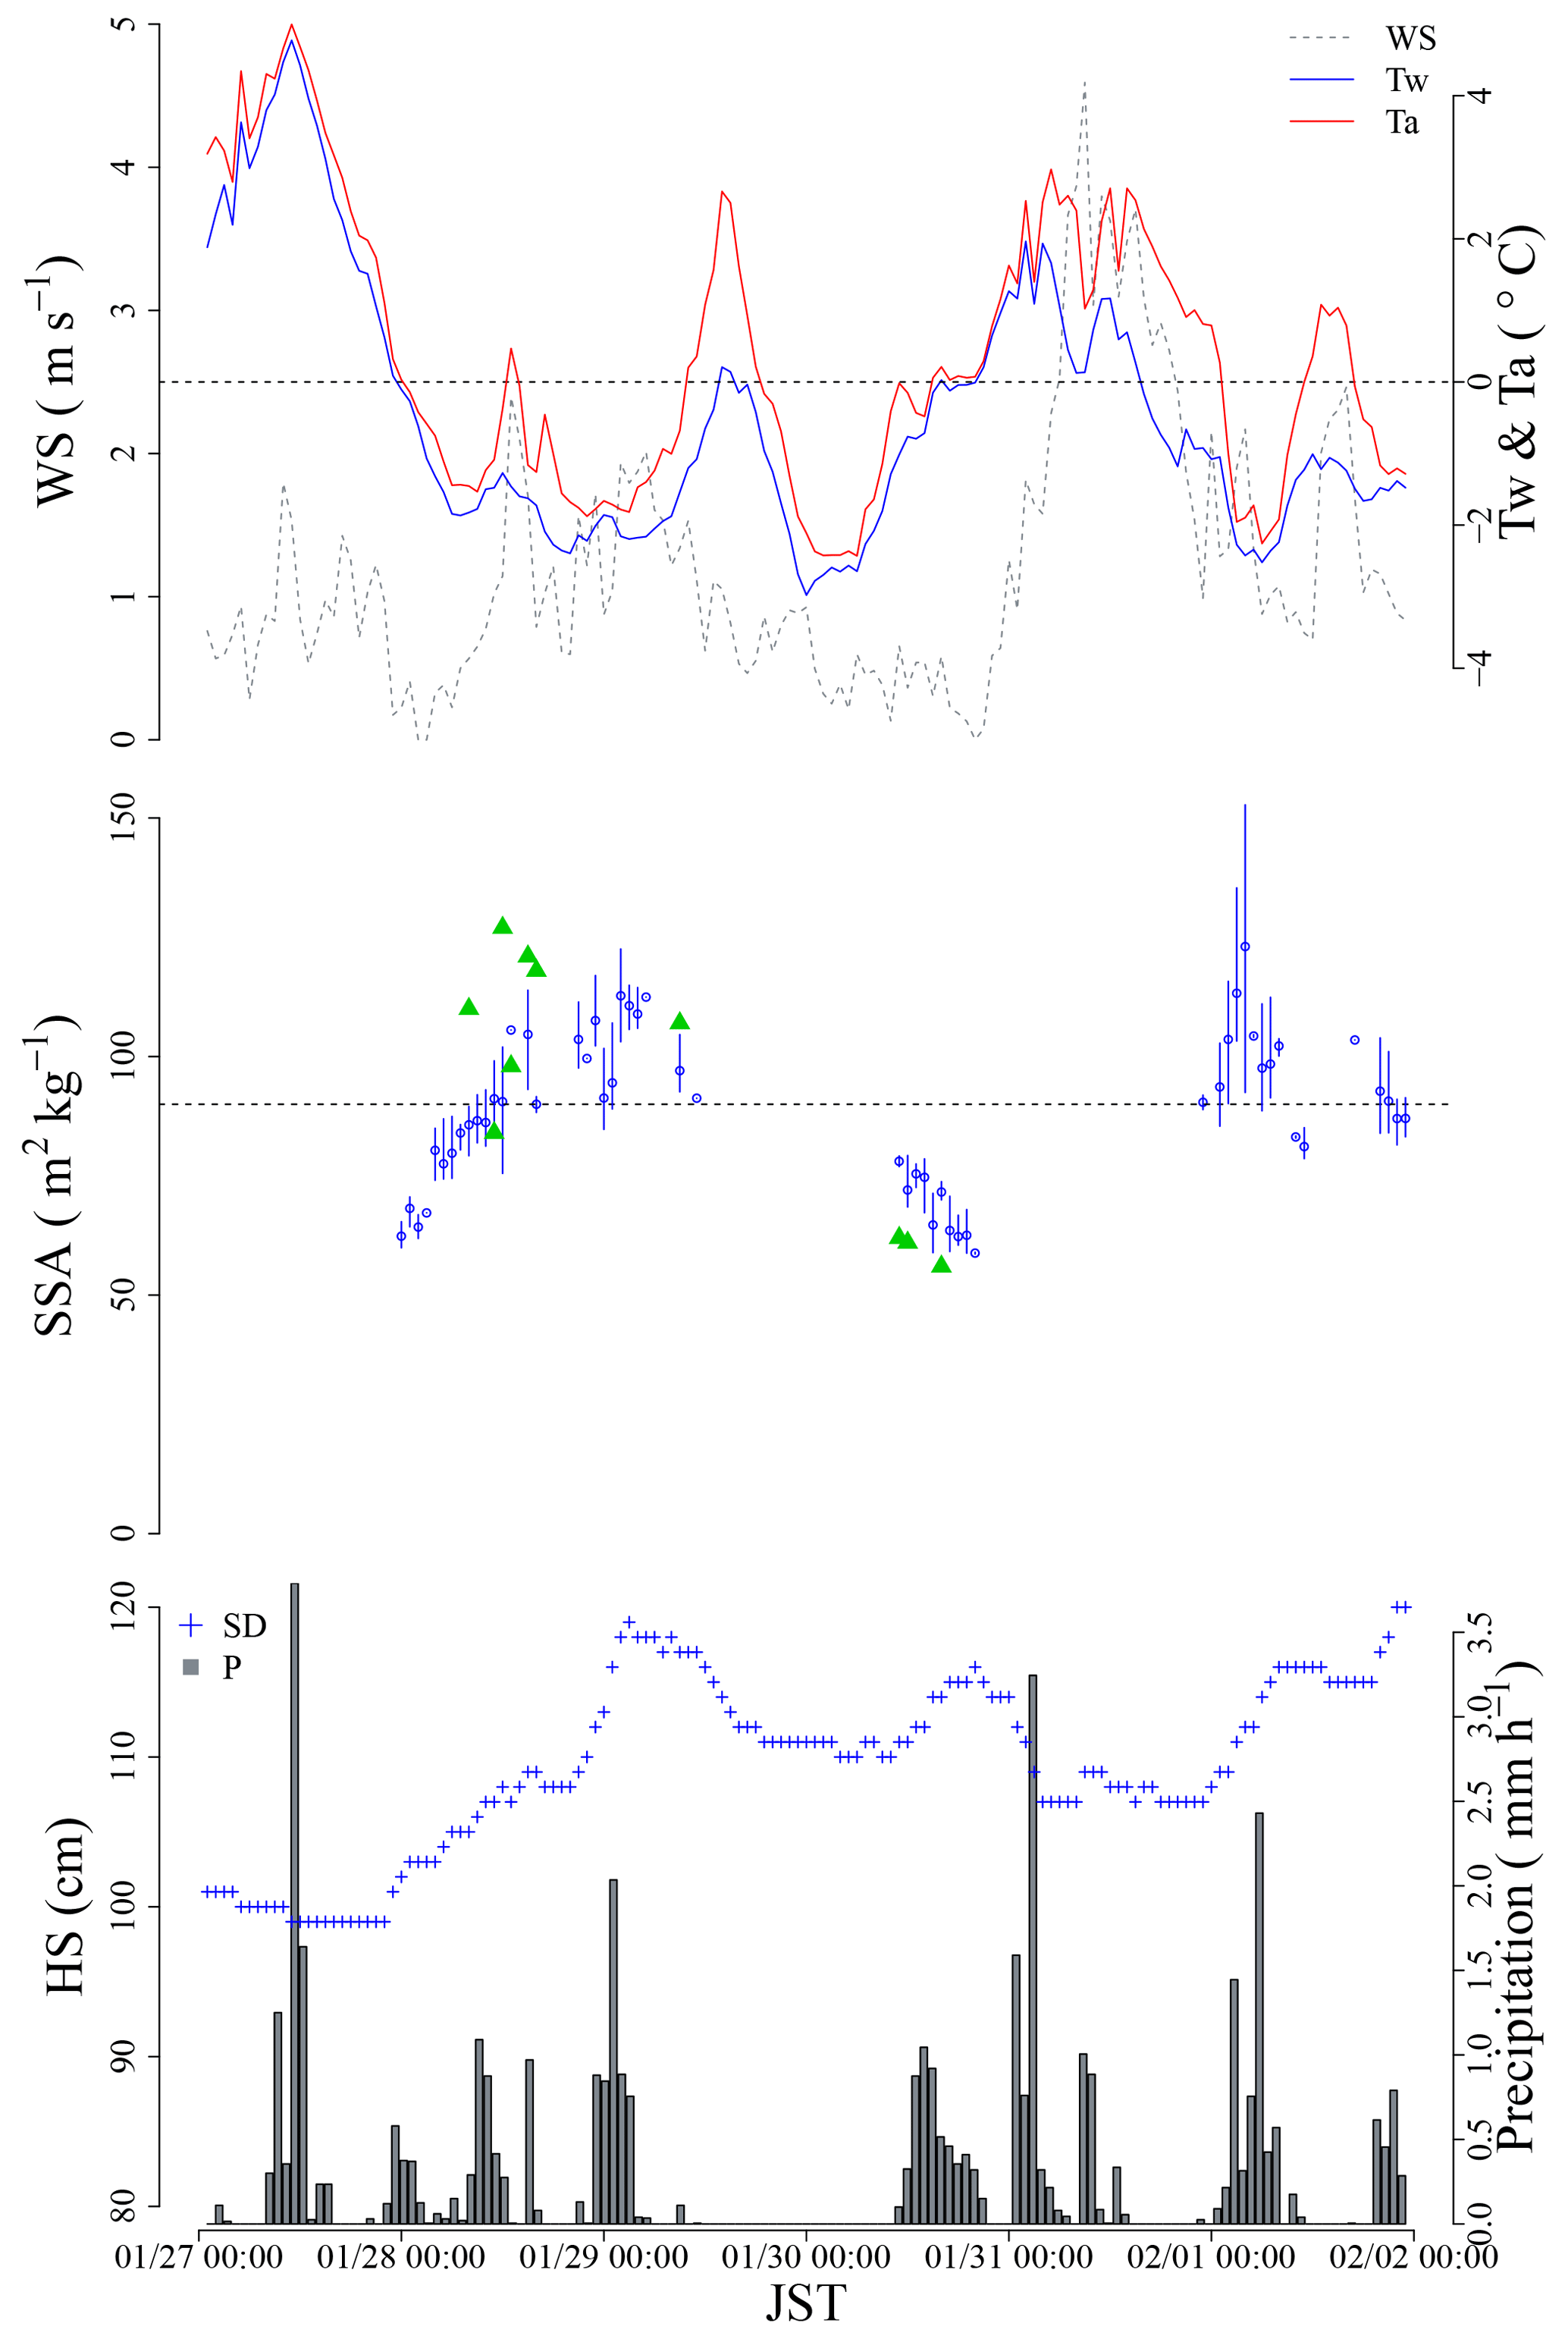
Figure 16Simulation results of SSA fluctuations using meteorological data during the period from 27 January to 1 February 2015 (JST). WS: wind speed; Tw: wet-bulb temperature; Ta: air temperature; HS: height of snow; P: precipitation. Blue bars with circles are the fluctuation of simulated SSA during each hour, and green triangles are the measured SSA.
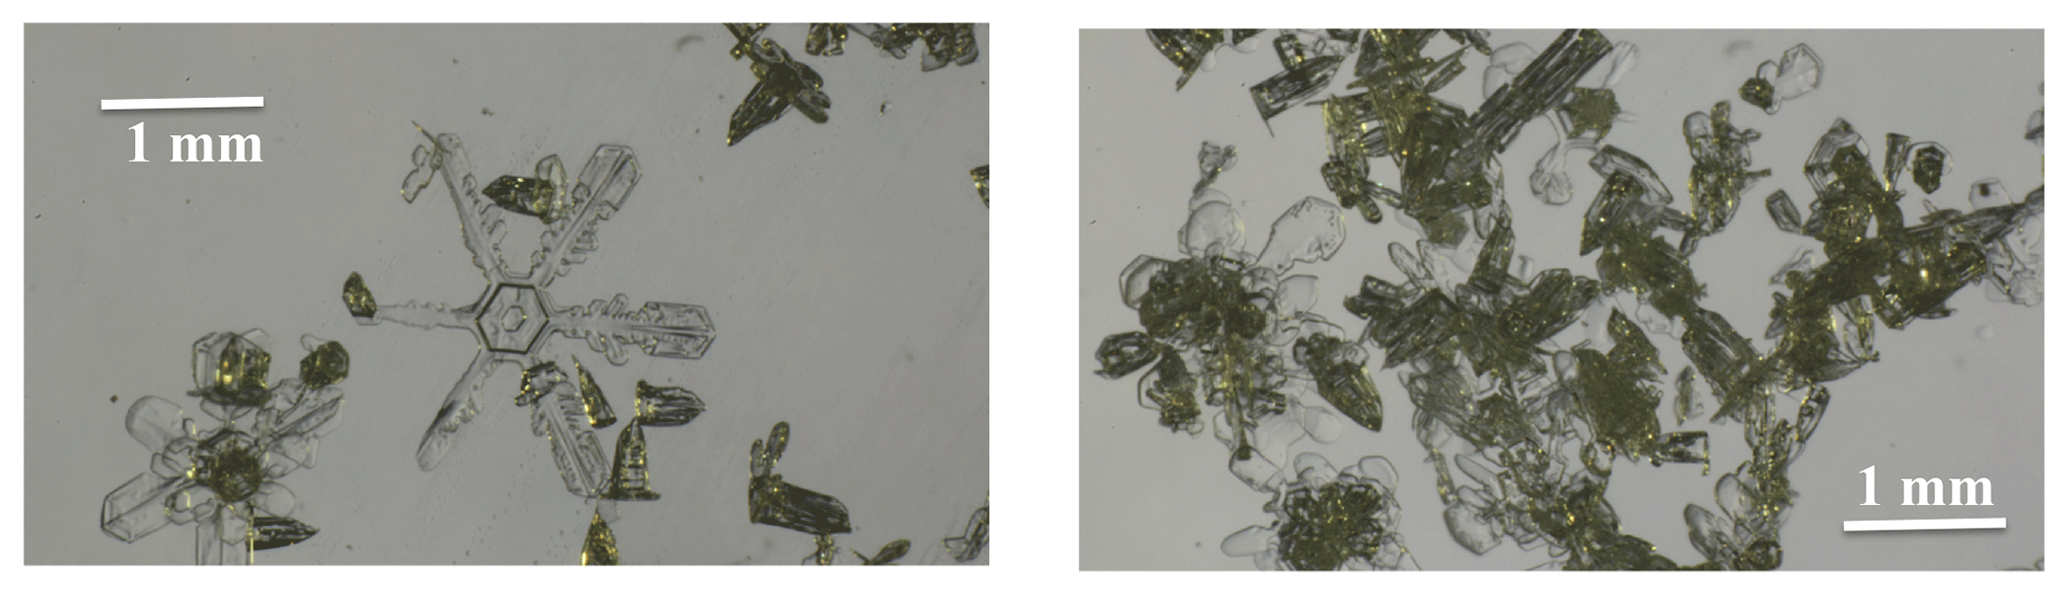
Figure 17Unrimed precipitation particles observed at Nagaoka (11:00 JST on 30 January 2015).
On 27 January, the synoptic precipitation condition was the C type (Fig. 15a). Although precipitation had occurred, the temperature was above 0 ∘C and most of the precipitations should have been in the liquid phase. In fact, the HS did not increase on 27 January. The synoptic meteorological condition changed from the C type to M type during the night of 27 January to the morning of 28 January (Fig. 15b). During this period, the temperature dropped during the period, the precipitation changed from a liquid to solid state, and the HS increased. The calculated SSA also gradually increased (Fig. 16). The M-type condition continued from the morning of 28 January to 29 January (Fig. 15c). During this period, the temperature remained low and the precipitation occurred in a solid state, and the HS increased continuously. In addition, the calculated SSA remained large (Fig. 16). The temperature gradually increased as the cyclone lashed from the south to the north along the Japanese archipelago on 30 January (Fig. 15d). Although no precipitation occurred during the morning of 30 January, solid precipitation occurred in the evening of the same day with small values of the calculated SSA. On 31 January, the synoptic meteorological condition gradually changed from C type to M type (Fig. 15e). Because the temperature was high, only liquid precipitation occurred, and the HS decreased during this period. On 1 February, the condition was M type (Fig. 15f) and the temperature dropped. Therefore, solid precipitation occurred with large values of the calculated SSA. A comparison of the calculated and the measured SSAs reveals that the former can reproduce the fluctuation in the measured SSA (SSA increased after the morning of 28 January and SSA decreased on 30 January), although some difference between the absolute values exists. As discussed in Sect. 3.4, if the PPs with SSA < 90 m2 kg−1 are considered to be unrimed snow crystals, which should transform into a weak PP layer, the results imply two possibilities (28 and 30 January) of weak-PP-layer development during the study period. In fact, the unrimed PPs were observed in Nagaoka on 30 January 2015 (Fig. 17). For these reasons, this study has considered that calculating the SSA using Eq. (2) with meteorological data is an efficient first step toward describing the development of a weak PP layer in the snow cover model.
A total of 102 SSAs of fresh PPs were measured shortly after their deposition (1–2 h) at the SIRC in NIED during four winters (2013/2014, 2014/2015, 2015/2016, 2016/2017) in Nagaoka – one of the regions in Japan (located in a coastal region on Honshu Island facing the Sea of Japan) that receives the heaviest snowfall. The measured SSA values ranged widely between 42 and 153 m2 kg−1. To investigate the cause of variation in the SSA of fresh PPs, the influence of melting during snowfall was analyzed. The SSAs of fresh PPs under melting conditions are smaller than those without melting. In addition, the relationship between the measured SSA and synoptic meteorological conditions – monsoon type (M type) and cyclone type (C type) – was also analyzed. The measured SSAs under the C type are smaller than those of the M type because the snow crystals under the C type are unrimed, while those under the M type are mostly richly rimed snow crystals and graupels. Furthermore, a detailed investigation of SSA under the M type was conducted with various snowfall modes determined using radar data. The results indicate the possibility that unrimed and slightly rimed snow crystals occurred at a specific snowfall mode (S mode) even under the M type. This result implies that the weak PP layer with unrimed/slightly rimed snow crystals can develop not only under the C-type but also under M-type snowfalls. The analysis of comparisons between the SSA values of PPs and their properties (averaged fall speed, averaged apparent size, and initial deposited density) confirms that the SSA of PPs is strongly influenced by its physical properties.
Based on the analyses using the measured on-ground meteorological data, the values of SSA were found to be strongly dependent on wind speed (WS) and wet-bulb temperature (Tw); SSA increases with an increase in WS, while SSA decreases with an increase in Tw. Using WS and Tw, the equation to estimate the SSA of fresh PPs was derived. This equation helped simulate the fluctuation of SSA of fresh PPs during the period in which the C type and M-type snowfall appeared periodically. Regardless of the limiting site-dependent parameterization, the equation to simulate the SSA with meteorological data is an efficient first step towards describing the weak PP layer in the new snow cover model, especially due to introduction of wind speed as a parameter in the empirical equation.
This study focuses on estimating the SSA of fresh PPs, which will help in designing a predictive model for slab avalanche caused by a weak PP layer. However, to implement the development process of the weak PP layer in the snow cover model with SSA, the dependency of physical characteristics of the PP type on SSA should be investigated in future studies. Moreover, this study discussed the SSA of fresh PPs only under one climatic condition. Additional similar measurements of SSA of fresh snow in other climatic conditions are required to further understand the SSA of fresh snow. For further parameterizing of the SSA of fresh PPs, it is necessary to use the meteorological conditions of the cloud on which the SSA of fresh PPs strongly depends. To promote this parameterization, future studies should compare the results of this study with the detailed information on precipitation particles from numerical meteorological models, such as the Japan Meteorological Agency's non-hydrostatic model (JMA-NHM; Saito et al., 2006), with the option of double-moment bulk cloud microphysics scheme (Hashimoto et al., 2018a, b) or the WRF model (Skamarock et al., 2008), which includes the P3 scheme (predicted particles properties; Morrison and Milbrandt, 2015).
Measured SSA data including meteorological data and microphotographs of each precipitation particle are available at https://doi.org/10.1594/PANGAEA.907148 (Yamaguchi et al., 2019).
SY performed measurement of specific surface area (SSA) of PPs. MI, HM, and KY performed measurement of precipitation particle properties. SN analyzed the doppler radar data. TA calculated the albedo using his model (PBSAM). VV and AH discussed the results from the viewpoint of cloud science. AH prepared the device for the methane adsorption method and gave advice on the measurement SSA of PPs using the devise. SY prepared the manuscript with the contribution of all coauthors.
The authors declare that they have no conflict of interest.
We would like to acknowledge members of the Snow and Ice Research Center (SIRC) for their participation in useful discussions. We also appreciate helpful comments and suggestions from Florent Domine, Leena Leppänen and one anonymous reviewer. This study was part of the project “Research on combining risk monitoring and forecasting technologies for mitigation of diversifying snow disasters” and was supported by JSPS KAKENHI, grant numbers JP23221004 (SIGMA PJ), JP15H01733 (SACURA PJ) and JP16K01340.
This research has been supported by the JSPS KAKENHI (grant no. JP23221004), the JSPS KAKENHI (grant no. JP15H01733), and the JSPS KAKENHI (grant no. JP16K01340).
This paper was edited by Florent Dominé and reviewed by Leena Leppänen and one anonymous referee.
Akitaya, E. and Nakamura, K.: Formation of weak layers caused by snow crystals fallen in worm front, Snow and Ice in Hokkaido (a bulletin of the Hokkaido branch, Japanese Society of Snow and Ice), 32, 10–13, 2013 (in Japanese).
Akitaya, E. and Shimuzu, H.: Observations of weak layers in a snow cover. Low Temperature Science, Ser. A, Physical sciences, 46, 67–75, http://hdl.handle.net/2115/18548 (last access: 20 April 2019), 1988 (in Japanese with English abstract).
Aoki, T., Kuchiki, K., Niwano, M., Kodama, Y., Hosaka, M., and Tanaka, T.: Physically based snow albedo model for calculating broadband albedos and the solar heating profile in snowpack for general circulation models, J. Geophys. Res., 116, D11114, https://doi.org/10.1029/2010JD015507, 2011.
Arakawa, H., Izumi, K., Kawashima, K., and Kawamura, T: Study on quantitative classification of seasonal snow using specific surface area and intrinsic permeability, Cold. Reg. Sci. Technol., 59, 163–168, https://doi.org/10.1016/j.coldregions.2009.07.004, 2009.
Araki, K.: Snowfall characteristics of heavy snowfall events associated with cyclones causing surface avalanche in Nasu, Japan, Seppyo, 80, 131–147, 2018 (in Japanese with English abstract).
Bohren, C. F. and Albrecht, A. B.: Atmospheric Thermodynamics, Oxford University Press, 402 pp., 1998.
Brun, E., David, P., Sudul, M., and Brunot, G.: A numerical model to simulate snow-cover stractigraphy for operational avalanche forecasting, J. Glaciol., 38, 13–22, https://doi.org/10.3189/S002214300000955, 1992.
Cabanes, A., Legagneux, L., and Domine, F.: Evolution of the specific surface area and of crystal morphology of Arctic fresh snow during the ALERT 2000 campaign, Atmos. Environ., 36, 2767–2777, https://doi.org/10.1016/S1352-2310(02)00111-5, 2002.
Cabanes, A., Legagneux, L., and Domine, F.: Rate of evaluation of the specific surface area of surface snow layers, Environ. Sci. Technol., 37, 661–666, 2003.
Calonne, N., Geindreau, C., Flin, F., Morin, S., Lesaffre, B., Rolland du Roscoat, S., and Charrier, P.: 3-D image-based numerical computations of snow permeability: links to specific surface area, density, and microstructural anisotropy, The Cryosphere, 6, 939–951, https://doi.org/10.5194/tc-6-939-2012, 2012.
Carmagnola, C. M., Morin, S., Lafaysse, M., Domine, F., Lesaffre, B., Lejeune, Y., Picard, G., and Arnaud, L.: Implementation and evaluation of prognostic representations of the optical diameter of snow in the SURFEX/ISBA-Crocus detailed snowpack model, The Cryosphere, 8, 417–437, https://doi.org/10.5194/tc-8-417-2014, 2014.
Colle, A. B., Stark, D., and Yuter, E. S.: Surface microphysical observations within east coast winter storms on Long Island, New York, Mon. Weather Rev., 142, 3126–3146, https://doi.org/10.1175/MWR-D-14-00035.1, 2014.
Domine, F., Cabanes, A., Taillandier, A.-S., and Legagneux, L.: Specific surface area of snow samples determined by CH4 adsorption at 77 K and estimated by optical microscopy and scanning electron microscopy, Environ. Sci. Technol., 35, 771–780, https://doi.org/10.1021/es001168n, 2001.
Domine, F., Salvatori, R., Legagneux, L., Salzano, R., Fily, M., and Casacchia, R.: Correlation between the specific surface area and the short wave infrared (SWIR) reflectance of snow, Cold Reg. Sci. Tech., 46, 60–68, https://doi.org/10.1016/j.coldregions.2006.06.002, 2006.
Domine, F., Taillandier, A.-S., and Simpson, W. R.: A parameterization of the specific surface area of seasonal snow for field use and for models of snowpack evolution, J. Geophys. Res., 112, F02031, https://doi.org/10.1029/2006JF000512, 2007.
Domine, F., Albert, M., Huthwelker, T., Jacobi, H.-W., Kokhanovsky, A. A., Lehning, M., Picard, G., and Simpson, W. R.: Snow physics as relevant to snow photochemistry, Atmos. Chem. Phys., 8, 171–208, https://doi.org/10.5194/acp-8-171-2008, 2008.
Fassnacht, R. S., Innes, J., Kouwen, N., and Soulis D. E.: The specific surface area of fresh dendritic snow crystals, Hydrol. Process., 13, 2945–2962, 1999.
Grenfell, T. C. and Warren, S. G.: Representation of a nonspherical ice particle by a collection of independent spheres for scattering and absorption of radiation, J. Geophys. Res., 104, 31697–31709, https://doi.org/10.1029/1999JD900496, 1999.
Hachikubo, A., Yamaguchi, S., and Aoki, T.: Improved apparatus for measuring specific surface area of snow by the methane adsorption method. Proceedings International Snow Science Workshop, Innsbruck, Austria, 7–12, October 2018, available at: http://arc.lib.montana.edu/snow-science/objects/ISSW2018_P07.13.pdf (last access: 30 September 2019), 2018.
Hachikubo, A., Yamaguchi, S., Tanikawa, T., Hori, M., Sugiura, K., Niwano, M., Kuchiki, K., and Aoki, T. : Development of the device for measuring snow specific surface area by gas adsorption, Snow and Ice in Hokkaido, Bulletin of the Hokkaido branch, Japanese Society of Snow and Ice, 31, 45–48, 2012 (in Japanese).
Hachikubo, A., Yamaguchi, S., Arakawa, H., Tanikawa, T., Hori, M., Sugiura, K., Niwano, M., Kuchiki, K., and Aoki, T.: Investigation of adsorbent for a measurement of snow specific surface area by the gas-adsorption method, Proceedings International Snow Science Workshop, Grenoble, France, 7–11 October 2013, 73–77, 2013.
Hachikubo, A., Yamaguchi S., Arakawa, H., Tanikawa, T., Hori, M., Sugiura K., Matoba, S., Niwano, M., Kochiki K., and Aoki, T.: Effects of temperature and grain type on time variation of snow specific surface area, Bull. Glaciol. Res., 32, 47–53, https://doi.org/10.5331/bgr.32.47, 2014.
Harimaya, T.: The riming properties of snow crystals, J. Meteor. Soc. Jpn., 53, 384–392, https://doi.org/10.2151/jmsj1965.53.6_384, 1975.
Harimaya, T. and Nakai, Y.: Riming Growth Process Contributing to the Formation of Snowfall in Orographic Areas of Japan facing the Japan Sea, J. Meteor. Soc. Jpn., 77, 101–115, https://doi.org/10.2151/jmsj1965.77.1_101, 1999.
Hashimoto, A., Motoyoshi, H., Misumi, R., and Orikasa, N.: Sophistication of snow property prediction by numerical weather model, Snow and Ice in Hokkaido, a bulletin of the Hokkaido branch, Japanese Society of Snow and Ice, 37, 63–66, https://www.seppyo.org/hokkaido/journal/j37/15_2018_snowhokkaido37_Hashimoto.pdf (last access: 30 September 2019), 2018a (in Japanese).
Hashimoto, A., Motoyoshi, H., Misumi, R., and Orikasa, N.: Multivariable scheme for diagnosing ice particle features in a bulk microphysics model, 15th Conference on Cloud Physics, 1D-94, available at: https://ams.confex.com/ams/15CLOUD15ATRAD/webprogram/Paper346686.html (last access: 20 April 2019), 2018b.
Helfricht, K., Hartl, L., Koch, R., Marty, C., and Olefs, M.: Obtaining sub-daily new snow density from automated measurements in high mountain regions, Hydrol. Earth Syst. Sci., 22, 2655–2668, https://doi.org/10.5194/hess-22-2655-2018, 2018.
Ikeda, S: A study of snow-pack characteristics in Hakuba backcountry, Seppyo, 69, 489–499, 2007 (in Japanese with English abstract).
Ishizaka, M., Motoyoshi, H., Nakai, S., Shiina, T., Kumakura, T., and Muramoto K.: A New Method for Identifying the Main Type of Solid Hydrometeors Contributing to Snowfall from Measured Size-Fall Speed Relationship, J. Meteor. Soc. Jpn., 91, 747–762, https://doi.org/10.2151/jmsj.2013-602, 2013.
Ishizaka, M., Motoyoshi, H., and Yamaguchi, S.: Cold-type Habits Snow Crystals brought by a Low Pressure System and Relevance to an Avalanche, Japan Society Snow Engineering, 34, 186–191, 2018.
Ishizaka, M., Motoyoshi, H., Yamaguchi, S., Nakai, S., Shiina, T., and Muramoto, K.-I.: Relationships between snowfall density and solid hydrometeors, based on measured size and fall speed, for snowpack modeling applications, The Cryosphere, 10, 2831–2845, https://doi.org/10.5194/tc-10-2831-2016, 2016.
Ishizaka, M., Shiina, T., Nakai, S., Sato, A., Iwamoto, K., and Muramoto, K.: A method for automated identification of types of solid precipitation by image processing Part 2 Verification of the method applied to variety of solid precipitations observed at Nagaoka, Seppyo, 66, 647–659, 2004 (in Japanese with English abstract).
Kamiishi, I. and Nakamura, K.: Snow disaster caused by a cyclonic heavy snowfall in February, 2014, and countermeasures taken by the NIED and its future direction for disaster prevention, Natural Disaster Research Report, 49, 1–10, available at: http://dil-opac.bosai.go.jp/publication/nied_natural_disaster/pdf/49/49-02.pdf (last access: 20 April 2019), 2016 (in Japanese with English abstract).
Kamiishi, I., Namakura, K., Adachi, S., and Yamashita, K. : Avalanche Disaster Caused by a Cyclonic Heavy Snowfall on February, 2014. Natural Disaster Research Report, 49, 31–37, available at: http://dil-opac.bosai.go.jp/publication/nied_natural_disaster/pdf/49/49-05.pdf (last access: 20 April 2019), 2016 (in Japanese with English abstract).
Kerbrat, M., Pinzer, B., Huthwelker, T., Gäggeler, H. W., Ammann, M., and Schneebeli, M.: Measuring the specific surface area of snow with X-ray tomography and gas adsorption: comparison and implications for surface smoothness, Atmos. Chem. Phys., 8, 1261–1275, https://doi.org/10.5194/acp-8-1261-2008, 2008.
Lachapelle, R. E.: The relationship of crystal riming to avalanche formation in new snow, Physics of Snow and Ice: Proceedings, 1, 1169–1175, http://hdl.handle.net/2115/20368 (last access: 20 April 2019), 1967.
Legagneux, L. and Domine, F.: A mean field model of the decrease of the specific surface area of dry snow during isothermal metamorphism, J. Geophys. Res., 110, F04011, https://doi.org/10.1029/2004JF000181, 2005.
Legagneux, L., Cabanes, A., and Domineì, F.: Measurement of the specific surface area of 176 snow samples using methane adsorption at 77 K, J. Geophys. Res., 107, 4335, https://doi.org/10.1029/2001JD001016, 2002.
Legagneux, L., Lauzier, T., Domineì, F., Kuhs, W. F., Heinrichs, T., and Techmer, K.: Rate of decay of the specific surface area of snow during isothermal experiments and morphological changes studied by scanning electron microscopy, Can. J. Phys., 81, 459–468, https://doi.org/10.1139/P03-025, 2003.
Legagneux, L., Taillandier, A.-S., and Domine, F.: Grain growth theories and the isothermal evolution of the specific surface area of snow, J. Appl. Phys., 95, 6175–6184, https://doi.org/10.1063/1.1710718, 2004.
Lehning, M., Bartelt, P., Brown, B., Russi, T., Stoeckli, U., and Zimmerli, M.: SNOWPACK model calculations for avalanche warning based upon a new network of weather and snow stations, Cold Reg. Sci. Technol. 30, 145–157, 1999.
Locatelli, J. D. and Hobbs P. V.: Fall speed and mass of solid precipitation particles, J. Geophys. Res., 79, 2185–2197, https://doi.org/10.1029/JC079i015p02185, 1974.
Magono, C. and Lee, C. W.: Meteorological classification of natural snow crystals, J. Fac. Sci. Hokkaido Univ., Ser. VII, 2, 321–335, https://eprints.lib.hokudai.ac.jp/dspace/handle/2115/8672 (last access: 20 April 2019), 1966.
Matsumura, E.: A study of avalanche forecasting in Niseko mountain areas, Master thesis, Faculty of Environmental Earth Science, Hokkaido University, 52 pp., 2002 (in Japanese).
Matsuo, T., Sasyo, Y., and Sato, Y.: Relationship between types of precipitation on the ground and surface meteorological elements, J. Meteor. Soc. Jpn., 59, 462–476, 1991.
McCammon, I., and Schweizer, J.: A field method for identifying structural weaknesses in the snowpack, in: Proceedings of the ISSW 2002, edited by: Stevens, J. R., 2002 International Snow Science Workshop, Penticton, British Columbia, 477–481, 2002.
McClung, D. M. and Schaerer P. A.: The avalanche handbook, The Mountaineers, Seattle, WA, 278 pp., 1993.
Morrison, H. and Milbrandt, J. A.: Parameterization of cloud microphysics based on the prediction of bulk ice particle properties, Part I : Scheme description and idealized tests, J. Atmos. Sci., 72, 287–311, https://doi.org/10.1175/JAS-D-14-0065.1, 2015.
Mosimann, L., Steiner, M., Collett, J. L., Henrich, W., Schmid, W., and Waldvogel, A. : Ice crystal observations and the degree of riming in winter precipitation, Water Air Soil Poll., 68, 29–42, https://doi.org/10.1007/BF00479391, 1993.
Mosimann, L., Weingartner, E., and Waldvogel, A.: An analysis of accreted drop size and mass on rimed snow crystals, J. Atoms. Sci., 51, 1548-1558, 1994.
Nakai, S., Iwanami, K., Misumi, R., Park, S., and Kobayashi, T.: A Classification of Snow Clouds by Doppler Radar Observations at Nagaoka, Japan, SOLA, 1, 161–164, https://doi.org/10.2151/sola.2005?042, 2005.
Nakai, S., Kosugi, K., Yamaguchi, S., Yamshita, K., Sato, K., Adachi, S., Ito, Y., Nemoto, M., Nakamura, K., Motoyoshi, H., Hirashima, H., Kamiishi, I., Oda, K., Ishizaka, M., Abe, O., and Sato, T.: Study on Advanced Snow Information and its Application to Disaster Mitigation: An overview, B. Glaciol. Res., 37, 3–19, https://doi.org/10.5331/bgr.18SW01, 2019.
Nakamura, T., Nakamura H., Abe, O., Higashiura, M., Numano, N., Yuuki, H., and Kutsuzawa, S.: Prefectural distribution of disastrous snow avalanches and prediction of them in the northern part of Japan. Avalanche Formation, Movement and Effect, Proceedings of the Davos Symposium, September 1986, IAHS Publ., 162, 639–646, 1987.
Nakamura, K., Sato, T., and Akitaya, E.: Meteorological condition for formation of weak layers by non-rimed new snow crystals, Snow and Ice in Hokkaido, Bulletin of the Hokkaido branch, Japanese Society of Snow and Ice, 32, 14–17, 2013 (in Japanese).
Nakamura, K., Abe, O., and Kamiishi, I.: Characteristics of avalanches caused by cyclonic heavy snowfall in Februrary, J. Snow Eng. Jpn., 30, 106–113, 2014 (in Japanese).
Nakamura, K., Kosugi, K., and Nemoto, M.: First report of investigation of Nasu avalanche accidents (26 March 2017), available at: http://www.bosai.go.jp/seppyo/kenkyu_naiyou/seppyousaigai/2017/report_20170328_NasuOnsen.pdf (last access: 20 April 2019), 2017 (in Japanese).
Narita, H. and Takeuchi, M.: Difference of repose angle of snow between dry surface avalanche that can slip through the avalanche prevention facilities and a point-starting dry surface avalanche, Snow and Ice in Hokkaido, Bulletin of the Hokkaido branch, Japanese Society of Snow and Ice, 28, 33–36, 2009 (in Japanese).
Ozeki, T. and Akitaya, E.: Wide area survey focusing on weak layers, Snow and Ice in Hokkaido, Bulletin of the Hokkaido branch, Japanese Society of Snow and Ice, 14, 32–35, 1995 (in Japanese).
Saito, K., Fujita, T., Yamada, Y., Ishida, J., Kumagai, Y., Aranami, K., Ohmori, S., Nagasawa, R., Kumagai, S., and Muroi, C.: The operational JMA nonhydrostatic mesoscale model, Mon. Weather Rev., 134, 1266–1298, 2006.
Schleef, S.: X-ray microtomography analysis of isothermal new snow densification, Doctor Thesis, Diss. ETH NO. 21856, 122 pp., 2014.
Shidei, T.: Some observations on one special type of new snow avalanche which occurred in Yamagata and Fukushima prefectures in 1952, Seppyo, 14, 2–5, 1953 (in Japanese).
Skamarock, W. C., Klemp, B. J., Dudhia, J., Gill, O. D., Barker, M. D., Duda, G. M., Huang, X.-Y., Wang, W., and Powers, G. J.: Description of the Advanced Research WRF Version 3. NCAR Technical Note NCAR/TN-475+STR, https://doi.org/10.5065/D68S4MVH, 2008.
Taillandier, A.-S., Domine, F., Simpson, W. R., Sturm, M., and Douglas, T. A.: Rate of decrease of the specific surface area of dry snow: Isothermal and temperature gradient conditions, J. Geophys. Res., 112, F03003, https://doi.org/10.1029/2006JF000514, 2007.
Vionnet, V., Brun, E., Morin, S., Boone, A., Faroux, S., Le Moigne, P., Martin, E., and Willemet, J.-M.: The detailed snowpack scheme Crocus and its implementation in SURFEX v7.2, Geosci. Model Dev., 5, 773–791, https://doi.org/10.5194/gmd-5-773-2012, 2012.
Wiscombe, W. J. and Warren, G. S.: A model for the spectral albedo of snow: I. Pure snow, J. Atmos. Sci., 37, 2712–2733, https://doi.org/10.1175/1520-0469(1980)037<2712:AMFTSA>2.0.CO;2, 1980.
Yamaguchi, S., Iwamoto, K., and Nakai, S.: Interannual fluctuations of the relationship between winter precipitation and air temperature in the heavy-snowfall zone of Japan, Ann. Glaciol., 54, 183–188, https://doi.org/10.3189/2013AoG62A302, 2013.
Yamaguchi, S., Hirashima, H., and Ishii, Y.: Year-to-year changes in preferential flow development in a seasonal snowpack and their dependence on snowpack conditions, Cold Reg. Scie. Technol., 149, 95–105, https://doi.org/10.1016/j.coldregions.2018.02.009, 2018.
Yamaguchi, S., Ishizaka, M., Motoyoshi, H., Nakai, S. Vionnet, V., Aoki, T., Yamashita, K., Hashimoto, A., and Hachikubo, A.: 4 winters measurement data of specific surface area of solid precipitation particles including meteorological data and micro photo in Nagaoka, Japan, https://doi.org/10.1594/PANGAEA.907148, 2019.