the Creative Commons Attribution 4.0 License.
the Creative Commons Attribution 4.0 License.
 | 27 Aug 2019
Evaluation of snow depth and snow cover over the Tibetan Plateau in global reanalyses using in situ and satellite remote sensing observations
Martin Wegmann
Emanuel Dutra
Gianpaolo Balsamo
Patricia de Rosnay
Congwen Zhu
Wenli Wang
Retish Senan
Gabriele Arduini
The Tibetan Plateau (TP) region, often referred to as the Third Pole, is the world's highest plateau and exerts a considerable influence on regional and global climate. The state of the snowpack over the TP is a major research focus due to its great impact on the headwaters of a dozen major Asian rivers. While many studies have attempted to validate atmospheric reanalyses over the TP area in terms of temperature or precipitation, there have been – remarkably – no studies aimed at systematically comparing the snow depth or snow cover in global reanalyses with satellite and in situ data. Yet, snow in reanalyses provides critical surface information for forecast systems from the medium to sub-seasonal timescales.
Here, snow depth and snow cover from four recent global reanalysis products, namely the European Centre for Medium-Range Weather Forecasts (ECMWF) ERA5 and ERA-Interim reanalyses, the Japanese 55-year Reanalysis (JRA-55) and the NASA Modern-Era Retrospective analysis for Research and Applications (MERRA-2), are inter-compared over the TP region. The reanalyses are evaluated against a set of 33 in situ station observations, as well as against the Interactive Multisensor Snow and Ice Mapping System (IMS) snow cover and a satellite microwave snow depth dataset. The high temporal correlation coefficient (0.78) between the IMS snow cover and the in situ observations provides confidence in the station data despite the relative paucity of in situ measurement sites and the harsh operating conditions.
While several reanalyses show a systematic overestimation of the snow depth or snow cover, the reanalyses that assimilate local in situ observations or IMS snow cover are better capable of representing the shallow, transient snowpack over the TP region. The latter point is clearly demonstrated by examining the family of reanalyses from the ECMWF, of which only the older ERA-Interim assimilated IMS snow cover at high altitudes, while ERA5 did not consider IMS snow cover for high altitudes. We further tested the sensitivity of the ERA5-Land model in offline experiments, assessing the impact of blown snow sublimation, snow cover to snow depth conversion and, more importantly, excessive snowfall. These results suggest that excessive snowfall might be the primary factor for the large overestimation of snow depth and cover in ERA5 reanalysis. Pending a solution for this common model precipitation bias over the Himalayas and the TP, future snow reanalyses that optimally combine the use of satellite snow cover and in situ snow depth observations in the assimilation and analysis cycles have the potential to improve medium-range to sub-seasonal forecasts for water resources applications.
- Article
(3965 KB) - Full-text XML
- BibTeX
- EndNote


Often referred to as the Third Pole, the Tibetan Plateau (TP) region is the world's highest plateau, with an average elevation of 4000 m above sea level. Due to its spatial extent, elevation and geographical position in the midlatitudes, it exerts a considerable influence on regional and global climate. The formation and variability of the Asian summer monsoon, in particular, is affected by the TP through thermal and mechanical effects (Wu et al., 2012, 2015; Xiao and Duan, 2016), with remote impacts both downstream (e.g. Zhang et al., 2004; Xue et al., 2018) and upstream (Lu et al., 2017). In autumn or winter, snow anomalies over the TP have been linked to wave trains extending downstream over East Asia and the Pacific (Liu et al., 2017; Li et al., 2018). Given its importance for climate and given that climate change strongly affects the region (Yang et al., 2014), the cryosphere over the TP is closely monitored in terms of glacier shrinking (Yao et al., 2012; Treichler et al., 2018), lake expansion (Zhang et al., 2017; Treichler et al., 2018) or change in the snowpack (Chen et al., 2017; Wang et al., 2017, 2018). The extent and variability of the snowpack over the TP has been a major focus of investigation because of the role of snow in the surface energy balance and in the hydrological cycle, as well as its potential impact on the large-scale circulation through radiative or thermodynamical feedbacks (Xiao and Duan, 2016; Lin et al., 2016; Henderson et al., 2018). In addition, water storage over the TP area affects the headwaters of a dozen major Asian rivers, affecting the livelihood of 22 % of the world's population (Immerzeel et al., 2009). Several studies have aimed at quantifying the seasonal, interannual and decadal variability of the TP snowpack (e.g. Basang et al., 2017, and references therein). The seasonal snow cover over the TP is unique compared to other midlatitude regions or to higher latitudes because of its location in the 27–40∘ N latitude belt, its high elevation and its distinct shallow, patchy and short-lived snowpack. In addition, the TP also receives a high amount of solar radiation; hence the shortwave snow albedo effect tends to be strong over that region. The TP is also a challenging region for snow-related research due to the complex terrain and the relative paucity of in situ observation stations in this vast, sparsely populated expanse, especially in its western part.
There is, nevertheless, a substantial number of meteorological stations over the TP region operated by the Chinese Meteorological Administration (CMA), which have been used in many climatological studies (e.g. for recent studies see Basang et al., 2017; Li et al., 2018). Since most of the stations are located in inhabited valleys, below 4000 m in the southeast TP, the representativeness of these in situ data for the TP as a whole is questionable.
Advances in satellite remote sensing have however provided invaluable information on the state of this high-elevation snowpack (Basang et al., 2017; Basang, 2018; Yang et al., 2015; Ménégoz et al., 2013), often through blending data from multiple instruments to combine the high spatial resolution of optical data with the all-weather capability of microwave (MW) data. Since 2004, NOAA has provided an operational, daily, multi-sensor snow cover product (the Interactive Multisensor Snow and Ice Mapping System or IMS) at a high resolution (4 km) by combining optical, infrared and MW satellite data, and surface observations (Helfrich et al., 2007). The accuracy of the IMS product compared to station data over the TP has been evaluated by Yang et al. (2015) and Li et al. (2018), who found the pixel matching accuracy (snow or no snow) to be over 90 %. Another widely used satellite optical product is the Moderate Resolution Imaging Spectroradiometer (MODIS) 8 d snow cover (Basang et al., 2017). Joint analysis of MODIS and station data by Basang et al. (2017) indicated that, despite large day-to-day snow cover fluctuations and the non-synchronicity of these two datasets, there is a high temporal correlation (0.77) if the station data are preprocessed in 8 d bins in a similar fashion as the MODIS data, i.e. if the station data are considered snow covered in the 8 d period when snow covered for at least 1 d. Nevertheless, Basang et al. (2017) also showed that the spatial distribution of snow cover is uneven: the snow cover fraction is less than 21 % for 70 % of the TP area, and yet it can be up to 40 % in the eastern part of the TP. They also indicated a discrepancy in the seasonality of the maximum snow cover between station data and MODIS: the former had higher snow cover in the spring, when precipitation increases and falls as snow in the southeast TP. On the contrary, MODIS had a higher winter snow cover, which is more representative of the mean conditions over the plateau. These latter discrepancies are indicative of large spatial differences in the characteristics of precipitation. Snow depth products are also available from satellite remote sensing. Snow depth retrieval from MW observations is difficult in regions with complex topography, hampered by non-heterogeneity of snow grain size and by vegetation cover. Few MW snow depth products have been thoroughly evaluated over the TP, a region characterised by a sparse and rapidly melting snowpack where, given the small snow grain size of fresh snow, the MW retrievals can lead to large errors (Dai et al., 2017). Nevertheless, a long-term MW snow depth product has been developed to account for the special conditions of the TP by Che et al. (2008) and Dai et al. (2017).
Atmospheric reanalyses comprehensively assimilate in situ, balloon-borne, aircraft and satellite observations into a forecast model, and they form an essential tool in meteorological and climate research (e.g. Brönnimann et al., 2018; Fujiwara et al., 2017). Furthermore, reanalyses are sometimes used as initial conditions for seasonal hindcasts or reforecasts. A thorough up-to-date description and intercomparison of atmospheric reanalyses is found in Fujiwara et al. (2017). On the other hand, data assimilation in land surface models is performed separately from the atmospheric data assimilation due to the different nature of observations and methodologies involved (Hersbach et al., 2018). Early land reanalyses were performed as offline simulations without any actual assimilation of observations, but land data assimilation is rapidly evolving. For example, the newest operational seasonal forecasting system 5 (known as SEAS5, Johnson et al., 2019) and the Integrated Forecast System (IFS) used for medium-range prediction at the European Centre for Medium-Range Weather Forecast (ECMWF), both rely on a land surface data assimilation system using a two-dimensional optimal interpolation, which blends IMS snow cover and in situ snow depth observations with the model background (de Rosnay et al., 2014, 2015). This evolution is partly motivated by the renewed interest in tapping into the potential of the land surface, and snow in particular, to improve the prediction skill at the sub-seasonal-to-seasonal timescale (Orsolini et al., 2013). Concerning the TP region more specifically, Lin et al. (2016) assimilated snow cover fraction from MODIS and/or water storage from GRACE (Gravity Recovery And Climate Experiment) in a land model and showed improvement in seasonal atmospheric temperature prediction resulting from the improved land conditions. The impact of realistic land initialisation over the TP region on the Indian summer monsoon (ISM) has also been investigated (Senan et al., 2016; Halder and Dirmeyer, 2018; Rai et al., 2015). In particular, the impact of springtime initialisation on predicting the ISM onset was investigated by Senan et al. (2016) using the coupled ocean–atmosphere seasonal forecasting system 4 of the ECMWF. They found that, in years with anomalously high mean snow depth over the TP, as determined from the ECMWF land reanalyses, the ISM onset was delayed by about 8 d. Half of this delay was attributed to the initialisation of snow over the TP region, highlighting the importance of land initialisation over that region for seasonal forecasting of the ISM onset.
While many studies have attempted to validate atmospheric reanalyses over the TP area in terms of temperature, precipitation or snowfall (Wang and Zeng, 2012; Palazzi et al., 2013; Zou et al., 2014; Viste and Sorteberg, 2015), there have been remarkably few studies aimed at evaluating and comparing the snow depth or snow cover in the reanalyses. Snow in long-term climate reanalyses over the plains of central and northern Russia have been evaluated against station data, showing surprisingly good performance (Wegmann et al., 2017). However, the terrain there is not as complex as over the TP. Previous studies of snow evaluation over the TP have focused purely on the remote sensing snow products (Basang et al., 2017; Yang et al., 2015; Dai et al., 2017). We argue that evaluation of snow reanalyses is of interest per se, since these reanalyses provide initial, critical surface information for the forecast systems and link surface conditions with atmospheric dynamics.
The aim of this study is to compare snow cover and snow depth over the TP region among a set of modern atmospheric and land reanalyses, and to evaluate them against in situ snow observations and selected satellite-based remote sensing products. A second goal is also to better characterise the snow biases in the reanalyses and to identify their origin. Sensitivity experiments are then carried out with a land surface model to assess the potential relevance of snow processes in driving the identified biases.
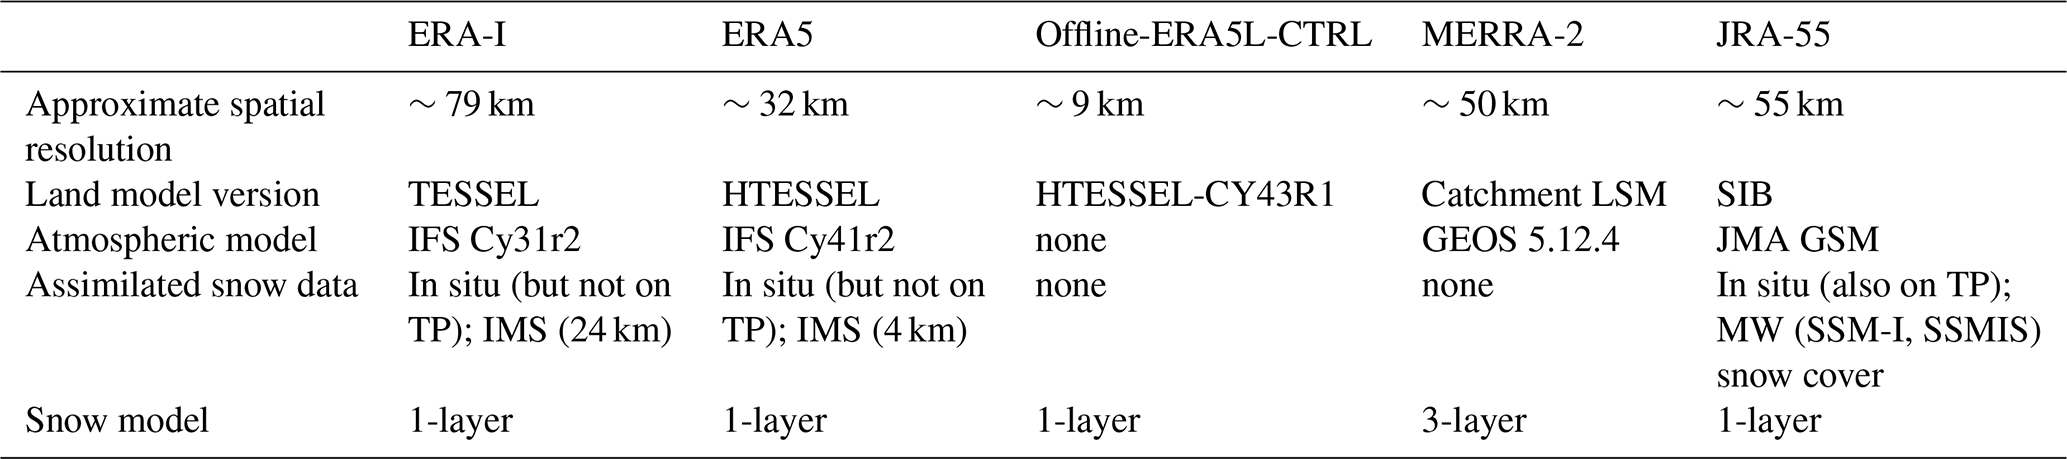
Maps of our study area with the orography at the resolution of the atmospheric reanalyses are shown in Fig. 1. We make use of three reanalyses produced by ECMWF, namely the latest generation of atmospheric reanalyses (ERA5) (Hersbach et al., 2018), its older counterpart (ERA-Interim, hereafter ERA-I) (Dee et al., 2011), as well a land reanalysis obtained by running the ECMWF land model (HTESSEL) offline, forced by the ERA5 meteorological forcing. Here, we refer to the latter as ERA5L-CTRL since it is not yet the officially released version of ERA5-Land available online since July 2019 (https://climate.copernicus.eu/climate-reanalysis, last access: 20 August 2019). In addition, we also make use of the Japanese 55-year Reanalysis (JRA-55) (Kobayashi et al., 2015) and of the NASA Modern-Era Retrospective analysis for Research and Applications, Version 2 (MERRA-2) (Gelaro et al., 2017). We did not carry out an exhaustive inter-comparison of all existing global reanalyses, but we chose the aforementioned analyses because they belong to the latest generation (ERA5, MERRA-2 and JRA-55), or else because they incorporate either local snow observations over the TP region (JRA-55) or satellite snow cover observations that encompass the TP (ERA-I and JRA-55). Some general characteristics of these reanalyses are shown in Table 1, and more detailed information about the treatment and assimilation of snow variables is provided in the Appendix. Further information about the reanalysis systems can be found in Fujiwara et al. (2017) and Wright et al. (2018). For the evaluation of reanalyses, we use station data, the multi-sensor IMS snow cover product and satellite MW data, as detailed below.
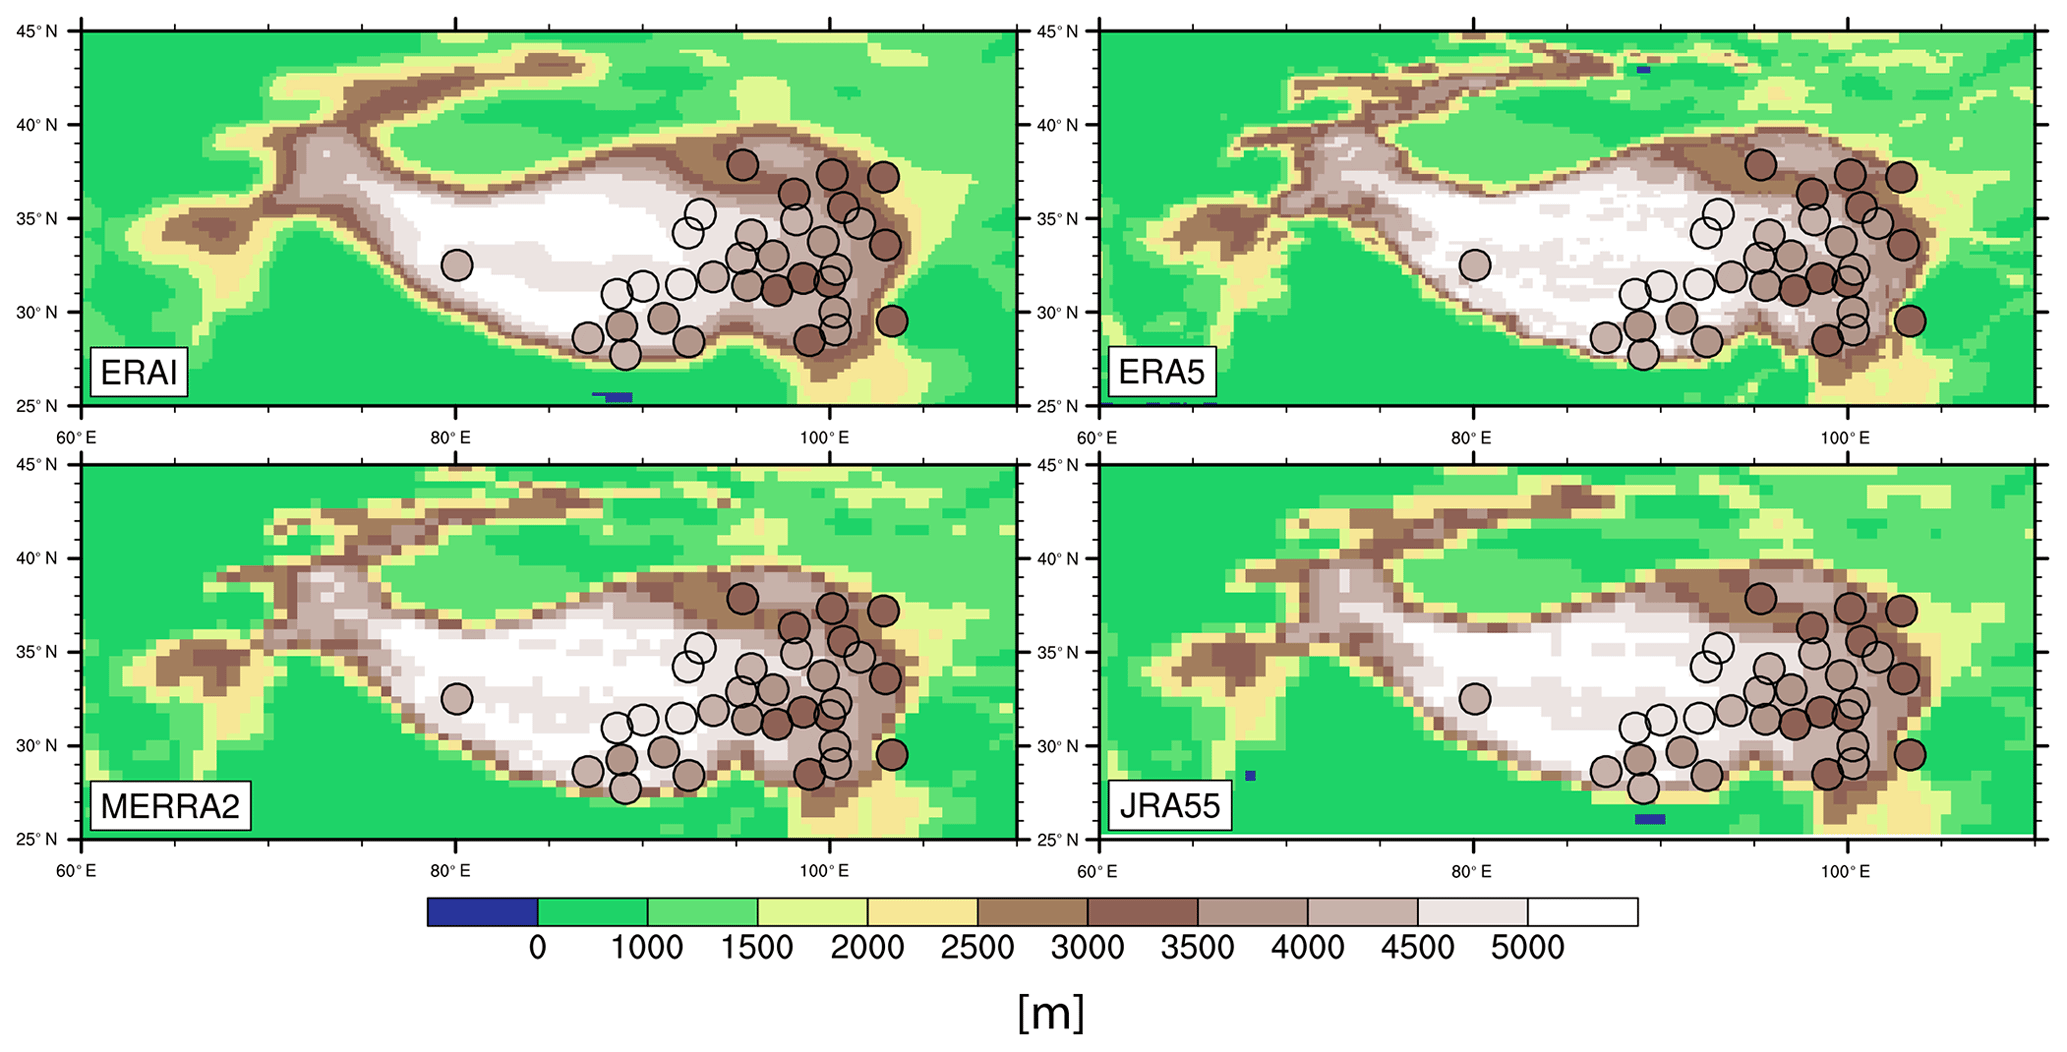
Figure 1Topographic maps of the TP region (altitude in metres) at the horizontal resolution of each reanalysis. The locations of the 33 stations are also shown with the coloured circles indicating the altitude range.
2.1 Station data
We obtained 5 years (2009 to 2013) of in situ daily meteorological observations from 33 stations over the TP from CMA. The observations comprise minimum and maximum temperature, snow depth and total precipitation. The measuring time is 00:00 UTC (08:00 Beijing time). The operational procedures dictate that when more than 50 % of the ground surrounding the weather station is covered by snow, the snow depth (SD) is measured. When converting in situ snow depth to a snow cover fraction (SCF), a 100 % SCF is assumed when snow depth exceeds 1 cm, according to the in situ observing rules of CMA (CMA, 2003). The in situ observations also provide the snow cover days (SCDs), i.e. the number of days when the snow covers more than 50 % of the ground in the sight from the station. The geographical locations of the stations are shown on Fig. 1, along with their altitudes in comparison to the topography resolved by the four atmospheric reanalyses. Most of the stations are located in inhabited valleys, below 4000 m, in the southeastern part and are not representative of the TP region as a whole. There is only one station in the western part of the TP, west of 85∘ E. In situ observations have several sources of uncertainty. Here, we highlight two sources: (i) the stations might not be fully representative of their local surroundings due to the complex nature of the terrain, and (ii) the quality of the records could be affected by the harsh operating conditions. For example, strong winds limit the instrument ability to record the amounts of falling snow or solid precipitation, a phenomenon called undercatch.
2.2 Interactive Multisensor Snow and Ice Mapping System (IMS)
We use SCF from IMS, a multi-instrument, near-real time daily product covering the Northern Hemisphere with a pixel resolution of 4 km. IMS provides a binary (1/0) snow cover information: either 1 if more than 50 % of the 4 km pixel is covered by snow, or otherwise 0 (snow free). Since, in this paper, we compare IMS data to reanalyses, we aggregate the 4 km product to a 0.25∘ grid comparable to the highest horizontal resolution among the reanalyses. This is done by counting the number of pixels with a value of 1 in a grid box, assuming they represent 100 % cover – this gives the high estimate. If we assume that a value of 1 represents only 50 % of the 4 km pixel we obtain the low estimate, for which the maximum SCF possible is 50 %. These two estimates provide a range of values, reflecting the uncertainty inherent to aggregating the 4 km binary data, e.g. a value of 1 in a pixel means 50 % to 100 % snow coverage.
The choice of IMS snow cover is motivated by its use in the ECMWF analysis system. A key point is that it is used differently in ERA-I (Drusch et al., 2004) than in ERA5 (de Rosnay et al., 2014, 2015; Hersbach et al., 2018). First, the high-resolution 4 km product is used in ERA5, while the coarser-resolution 24 km product is used in ERA-I. More importantly, IMS data are not used above 1500 m in ERA5, i.e. in high-altitude regions such as the TP, while it was still in use in ERA-I. When comparing the snow cover in IMS with the one in ERA-I or ERA5, one has to recall that these are not independent datasets. Nevertheless, the different usage of IMS data between ERA5 and ERA-I allows us to highlight the importance of snow cover analysis and assimilation over the TP. In that region, in situ data available for the numerical weather prediction community for real-time applications is still scarce.
2.3 Microwave satellite data
A long-term (1978–2010) MW daily snow depth product has been developed to account for the special conditions of the TP by Che et al. (2008) and Dai et al. (2017) at the Cold and Arid Regions Environmental and Engineering Research Institute (CAREERI) of the Chinese Academy of Sciences. We used the 2 years (2009 and 2010) that overlap with our comparison period (2009–2013), the latter dictated by our station data record. Over these 2 years, the MW product is based on measurements from the NASA Advanced Microwave Scanning Radiometer for the Earth Observing System (AMSR-E). The gridded dataset has a horizontal resolution of 0.25∘.
3.1 Snow depth
Figure 2 presents a comparison of daily SD over the 5-year period (2009–2013) between the observations, comprising both in situ station and MW data, and the four reanalyses collocated at the station coordinates. The comparison is an average over the 33 stations. The in situ observations, even in the mean over all available stations, reveal a very thin and rapidly fluctuating snowpack, with episodes of fast build-up and decay, followed by periods void of snow, even in mid-winter. This concurs with previous studies showing that large parts of the TP can remain snow-free even in winter (Basang et al., 2017; Li et al., 2018). A quantitative estimate of the discrepancy between in situ daily observations and the other datasets as a root mean square error (RMSE) is presented in Fig. 4 (left panel). The RMSE is calculated for the 2 years 2009 and 2010 when satellite MW data are available. We also calculated the temporal correlation matrix between the different SD datasets (Table 2), using daily data year-round over the 5-year period, except for the satellite MW data where only the 2 years 2009 and 2010 are used. It is clearly apparent that, with the exception of MERRA-2, the reanalyses show a regular seasonal cycle, with a snowpack that grows nearly steadily during the cold season and culminates in February or March. This is unlike the in situ observations, which show rapidly fluctuating snow increases with little snow accumulation throughout winter. In comparison with in situ observations, MERRA-2 has the best performance among reanalyses for both the RMSE and the temporal correlation, closely followed by JRA-55. The ERA5 reanalysis overestimates the seasonal maximum SD by a factor of 10. Among the ECMWF family of reanalyses, the older ERA-I performs best in terms of RMSE. Nevertheless, the temporal correlation is similar to the one obtained with ERA5, indicating that the newer, higher-resolution ERA5 similarly captures the snow variability despite its large positive bias. The MW satellite data are also overestimating SD, as noted by Yang et al. (2015) or Dai et al. (2017). Like the reanalyses, they show a progressive snow accumulation throughout the cold season. They also poorly captures short-term SD variability (Fig. 2), and its temporal correlation with the in situ data is 0.32, poorer than for the reanalyses, even though calculated over only 2 years. The RMSE error is nevertheless comparable to ERA-I, and the MW data are able to estimate SDs smaller than 5 cm.

Figure 2Comparison over the 5-year period 2009–2013 of daily SD (in centimetres) between the observations, comprising both in situ station and MW data (over 2009 and 2010), and the four reanalyses collocated at the station coordinates, namely ERA5, ERA-I, MERRA-2 and JRA-55. The average is carried out over the 33 stations shown in Fig. 1.
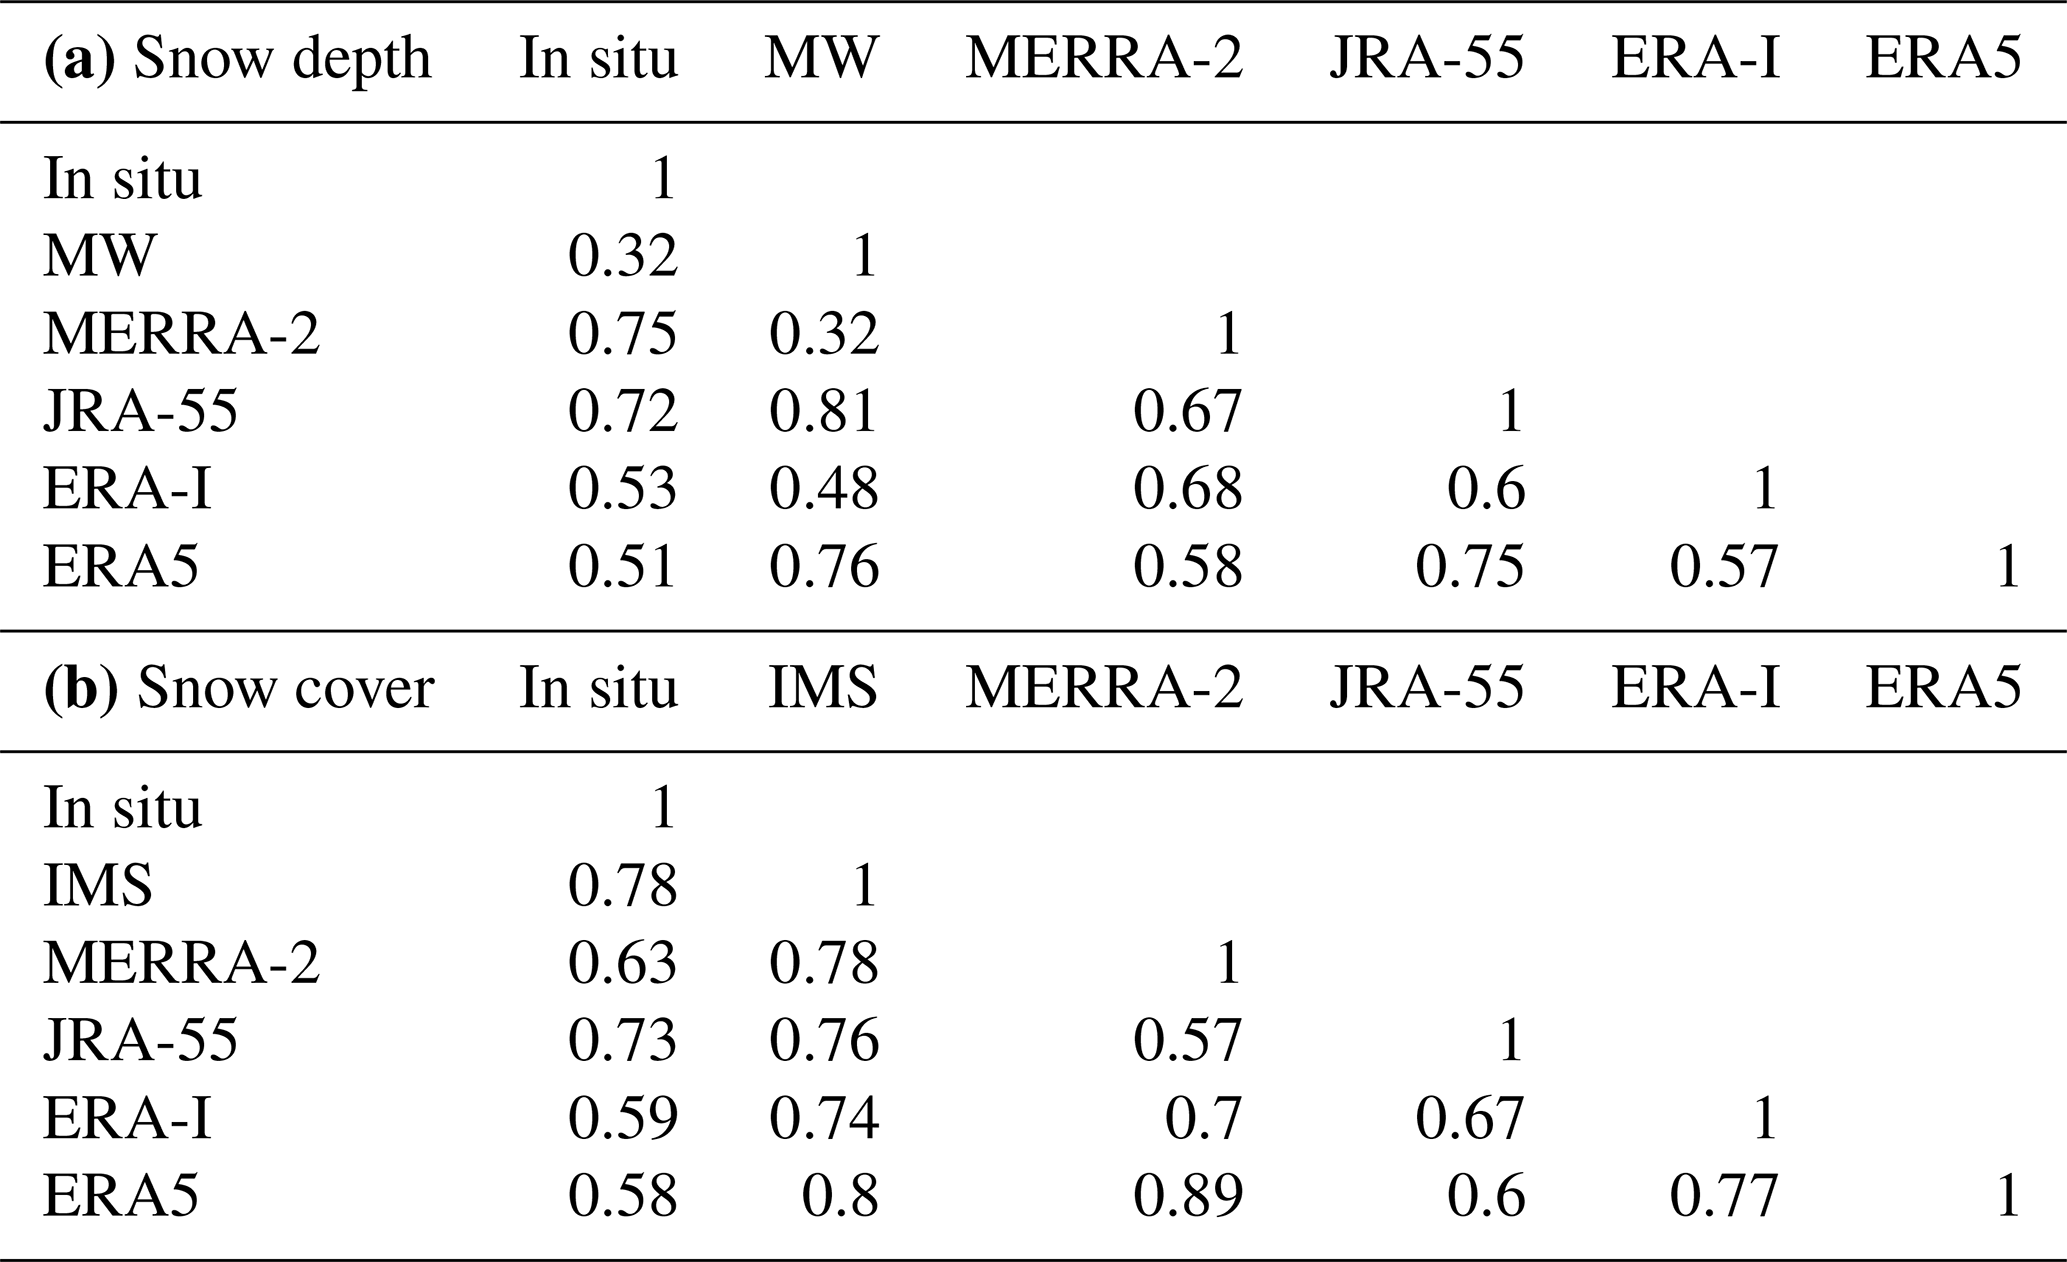
Table 2Temporal correlation matrix between in situ observations and reanalyses or satellite data for daily SD (a) and daily SCF (b). The IMS low estimate has been used. Correlations are calculated over the whole 5-year period, except for MW SD data for which the years 2009 and 2010 are used and are averaged over the 33 stations.
It is not surprising that JRA-55 performs well, since it assimilates SDs from a dozen CMA stations over the TP area and snow cover from satellite MW data (see Appendix). Note that the assimilated MW data are not from the same instrument as the one used in the CAREERI MW data. A key factor in the relatively good performance of ERA-I is the fact that it assimilates SCF from IMS in high-altitude regions, hence also over the TP. On the contrary, as mentioned earlier, assimilation of IMS SCF above 1500 m was discontinued in the production of ERA5. Among the differences in the snow treatment between ERA-I and ERA5, the tendency to reduce or remove the snowpack imposed by the IMS observational constraint during assimilation appears to be the most likely key factor in bringing ERA-I SDs significantly closer to the in situ observations.
3.2 Snow cover and snow maps
Figure 3 presents a comparison of daily SCF over the 5-year period (2009–2013) between the in situ station observations and the IMS satellite data and the five reanalyses, collocated at the station coordinates. Again, an average over the 33 stations is presented. The IMS data are represented by the range between the low and high estimates (see Sect. 2). The correlation matrix and the RMSE for SCF are provided in Table 2 and in Fig. 4b respectively, calculated over the 5-year period. There is good agreement between in situ observations and the IMS low estimate: the station-mean year-round correlation (Table 2) over the 5 years (2009–2013) is 0.78. In Li et al. (2018), the correlations between SCF at 55 CMA stations and IMS SCF during the 10 winters between 2000 and 2010 ranged from 0.39 to 0.79, with a 10-winter average of 0.56. The consistency of the temporal correlation with Li et al. (2018) indicates that the satellite snow cover data readily capture the rapidly fluctuating snowy events. It also provides some confidence in the station data despite the harsh operating conditions for in situ measurements, and the spatial degradation applied to IMS (from 4 km to 0.25∘).
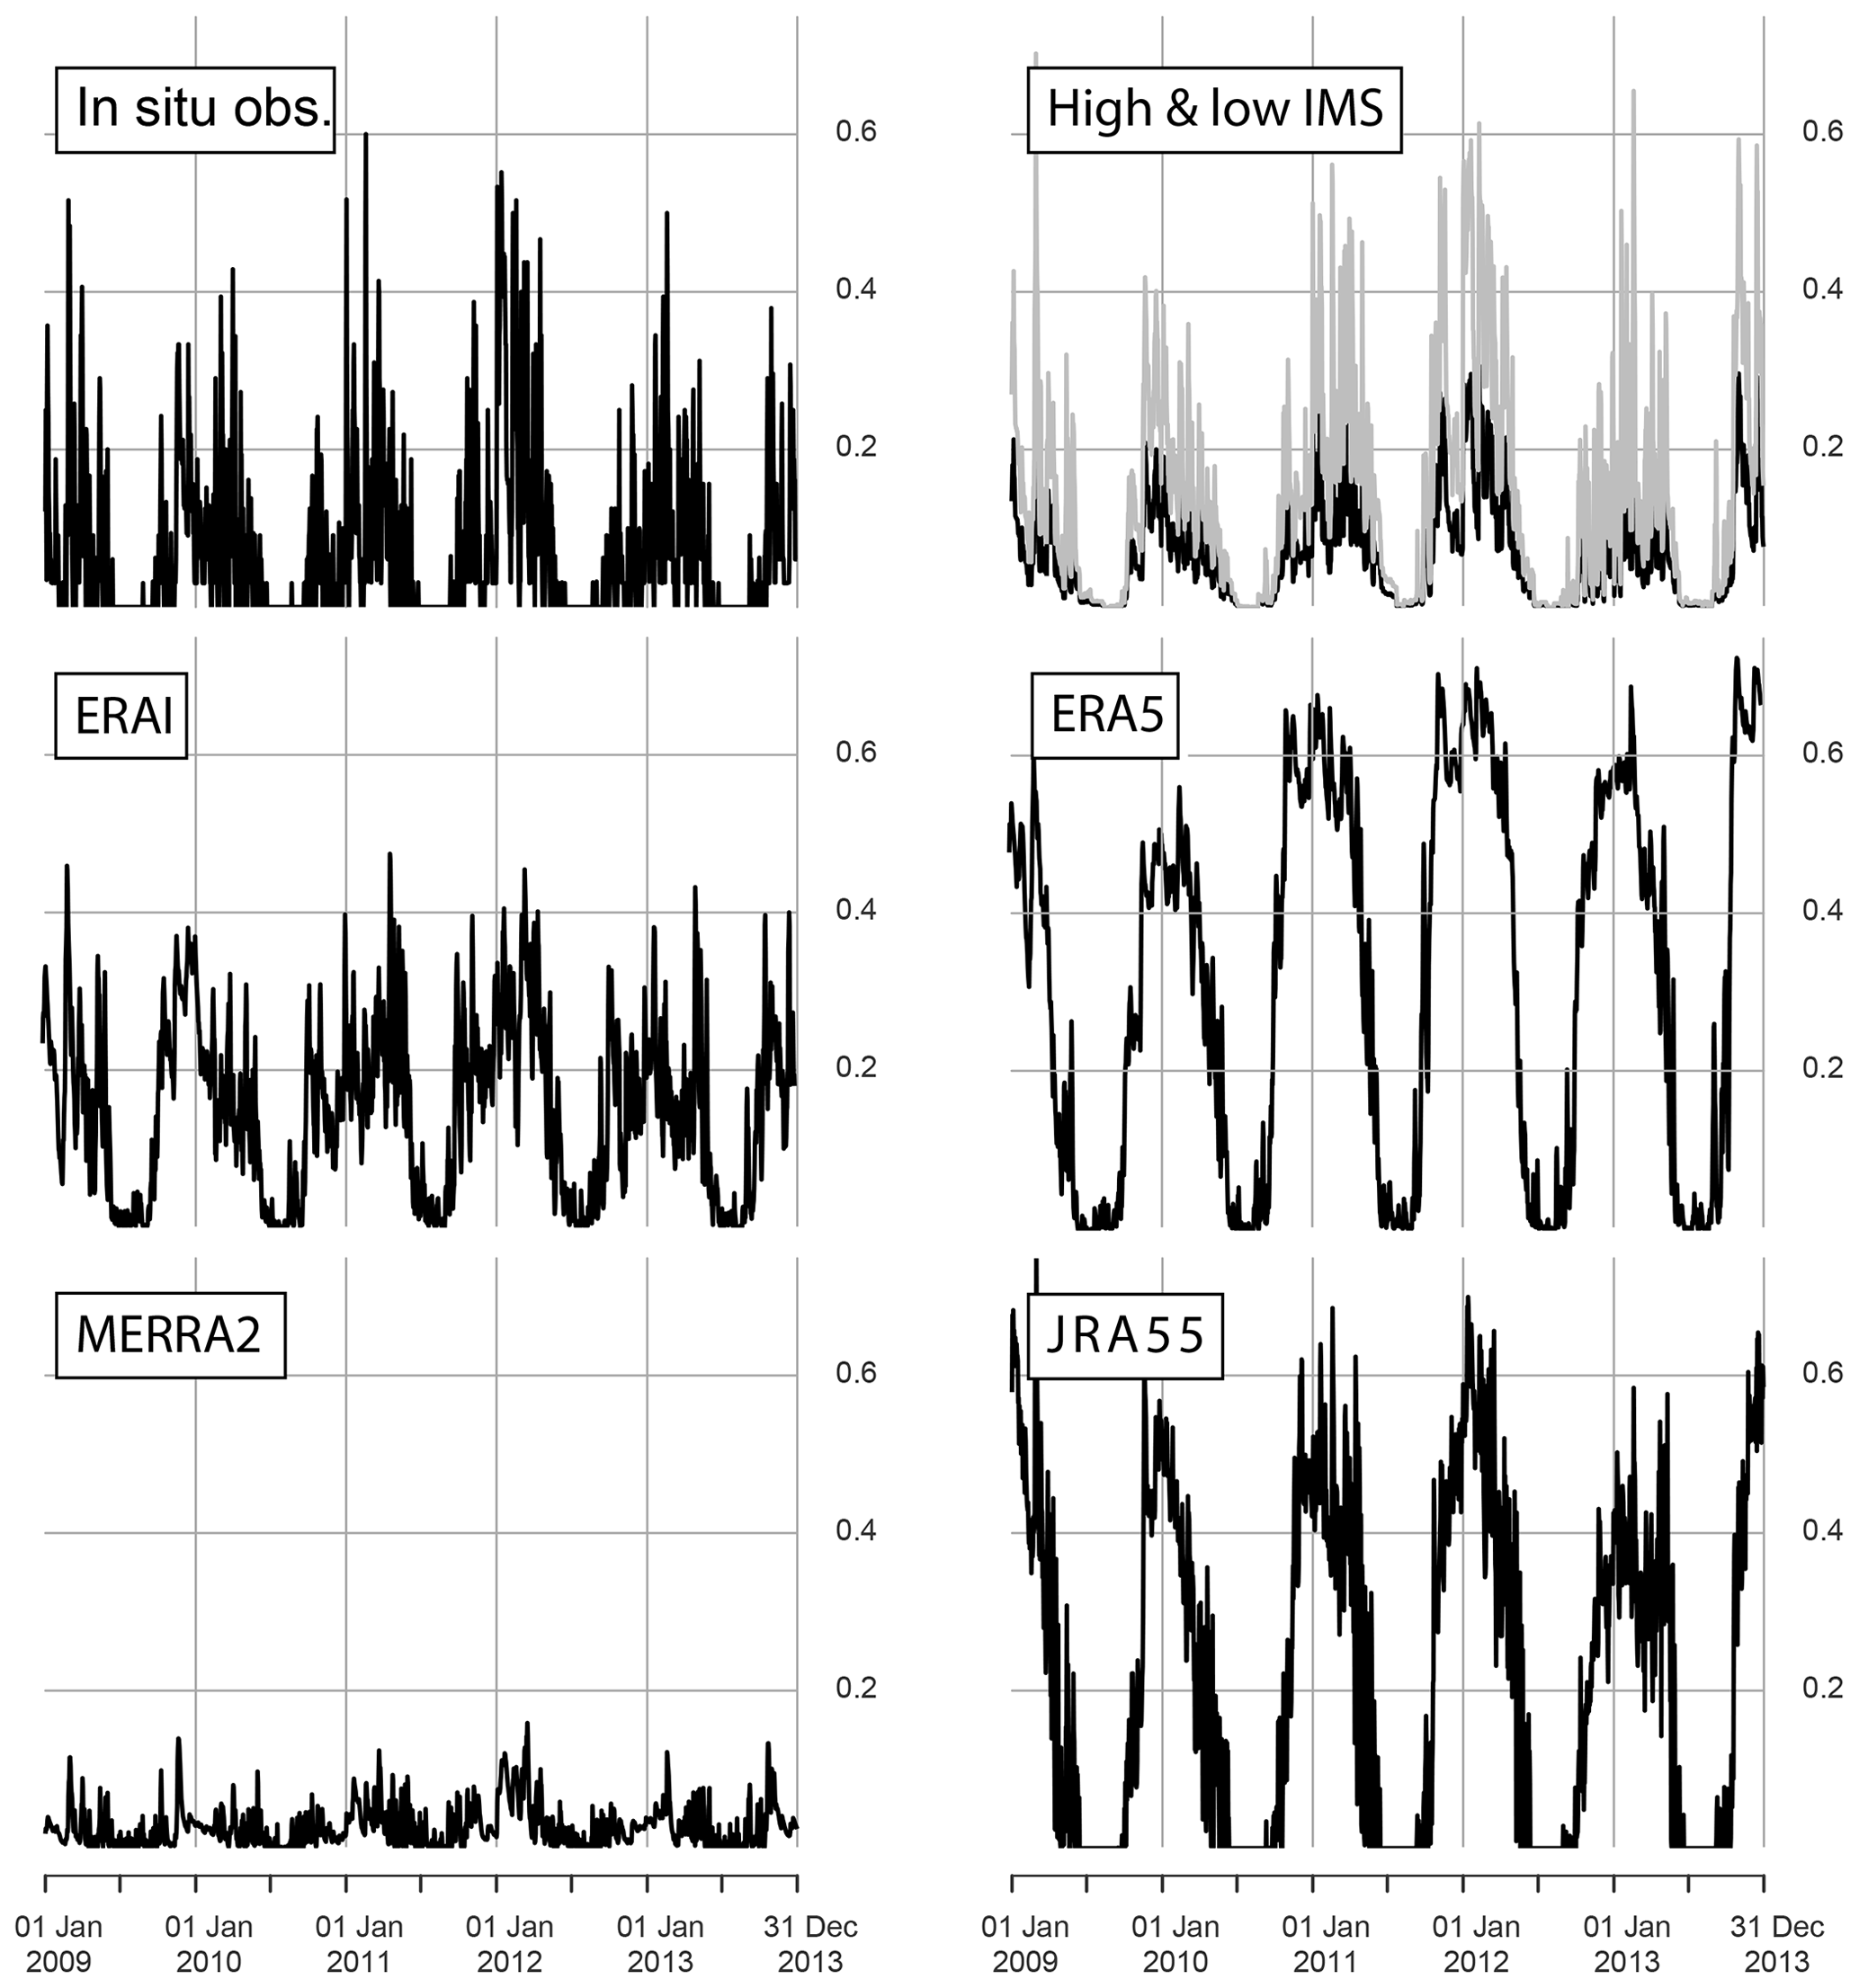
Figure 3Comparison of daily SCF (between 0 and 1) over the 5-year period 2009–2013 between the observations, comprising both the in situ station and IMS satellite data, with the four reanalyses collocated at the station coordinates, namely ERA5, ERA-I, MERRA-2 and JRA-55. The data have been averaged over the 33 stations. The IMS data are represented by the low and high estimates, resulting from converting the binary 4 km data to a grid comparable to the resolution of the reanalyses.
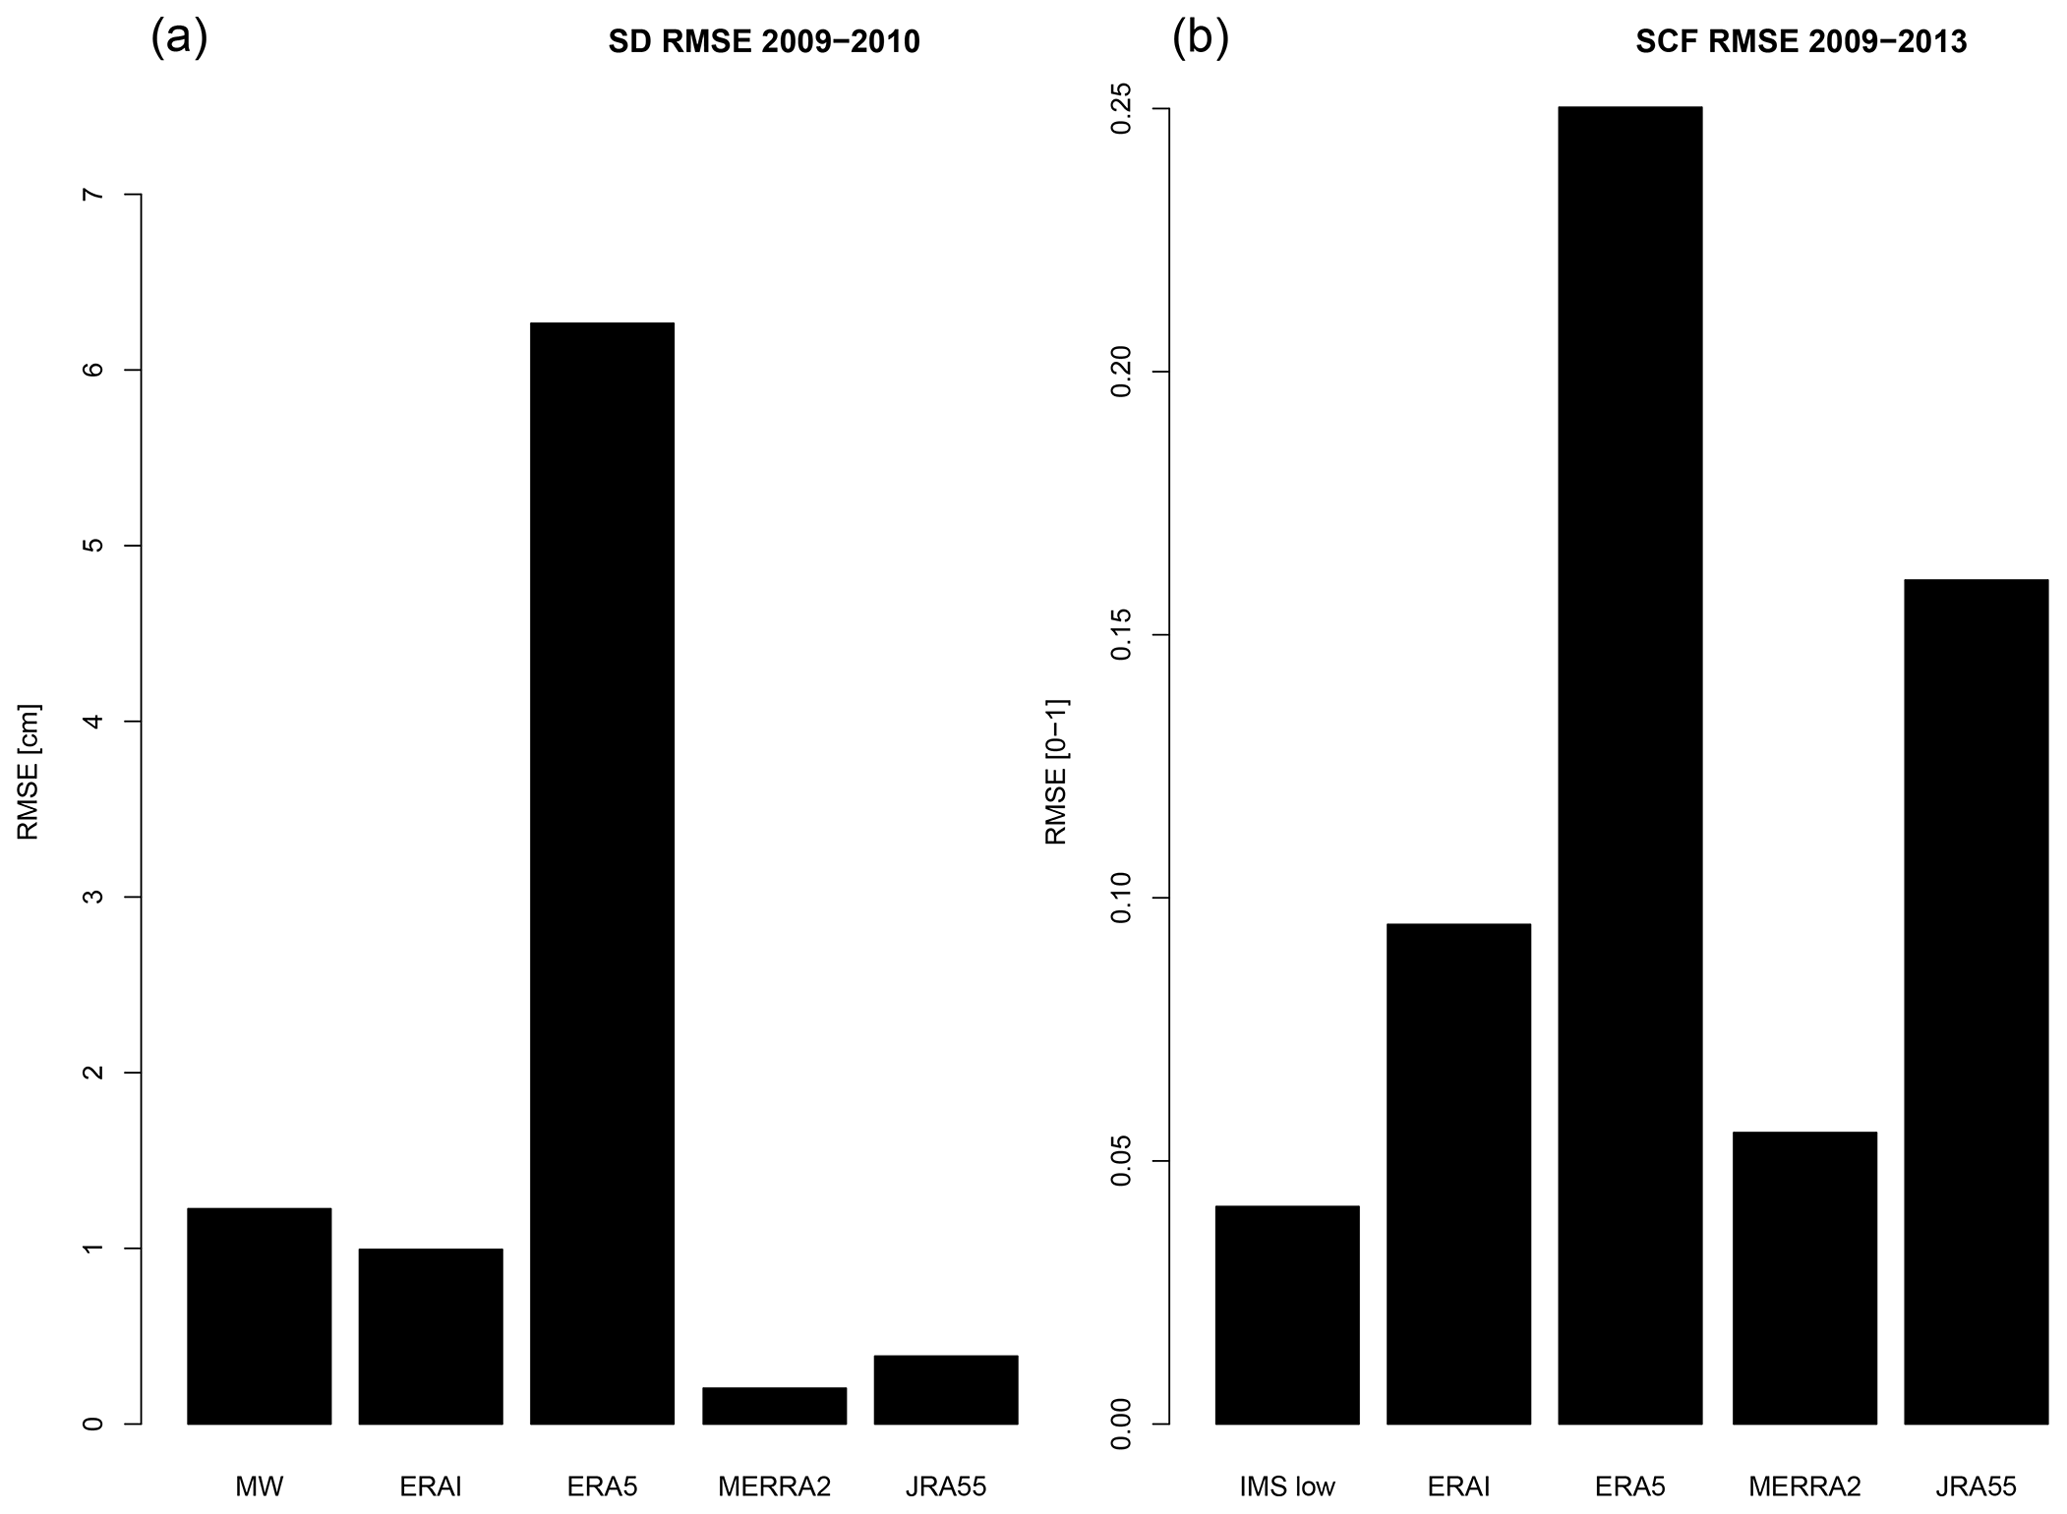
Figure 4Estimate of the root mean square error (RMSE) between daily station data and collocated reanalyses or satellite observations for SD (in centimetres) (a) over 2 years when satellite MW data are available (2009 and 2010) and for SCF (between 0 and 1) (b) over the 5-year period (2009–2013).
Table 3Values of the annual means of monthly snow cover days averaged during the whole 5-year period (the second column) and during the years 2009 to 2013 (the third to seventh columns) for each dataset (a). Temporal correlation matrix between in situ observations and reanalyses for monthly SCD during the whole 5-year period (b). The SCDs are defined as the days when the SCF is greater than 0.5 and are averaged over the 33 stations.

It is clearly apparent that ERA5 again considerably overestimates SCF. JRA-55 is much worse than MERRA-2 for SCF, while their performance for SD was similar. As described in the Appendix, the a posteriori conversion from SD to SCF varies among reanalyses. For JRA-55, a thin 2 cm layer is equivalent to 100 % SCF, and hence JRA SCF is persistently high. On the contrary, in MERRA-2, SCF values are small due to the large SD required to have full snow cover (see Appendix for details). While the in situ station data (e.g. Fig. 3) also display thin layers of a few centimetres, they are very transient. Further validation is provided in terms of the annual-mean SCDs. Table 3 compares SCDs among the datasets, both for the 5-year average and for individual years, based on monthly-mean SCD values. The values of SCDs compare well between in situ observation and IMS. On the other hand, ERA5 and JRA-55 reanalyses largely overestimate SCDs (ERA5 by nearly 3 times), while ERA-I is closer to the observed values. The temporal correlation coefficients for monthly SCDs tend to be higher than that for the daily SCF or SD. Note the values of SCDs in MERRA-2 are small due to the SCF being below the 0.5 threshold used in the SCD definition (see Fig. 3).
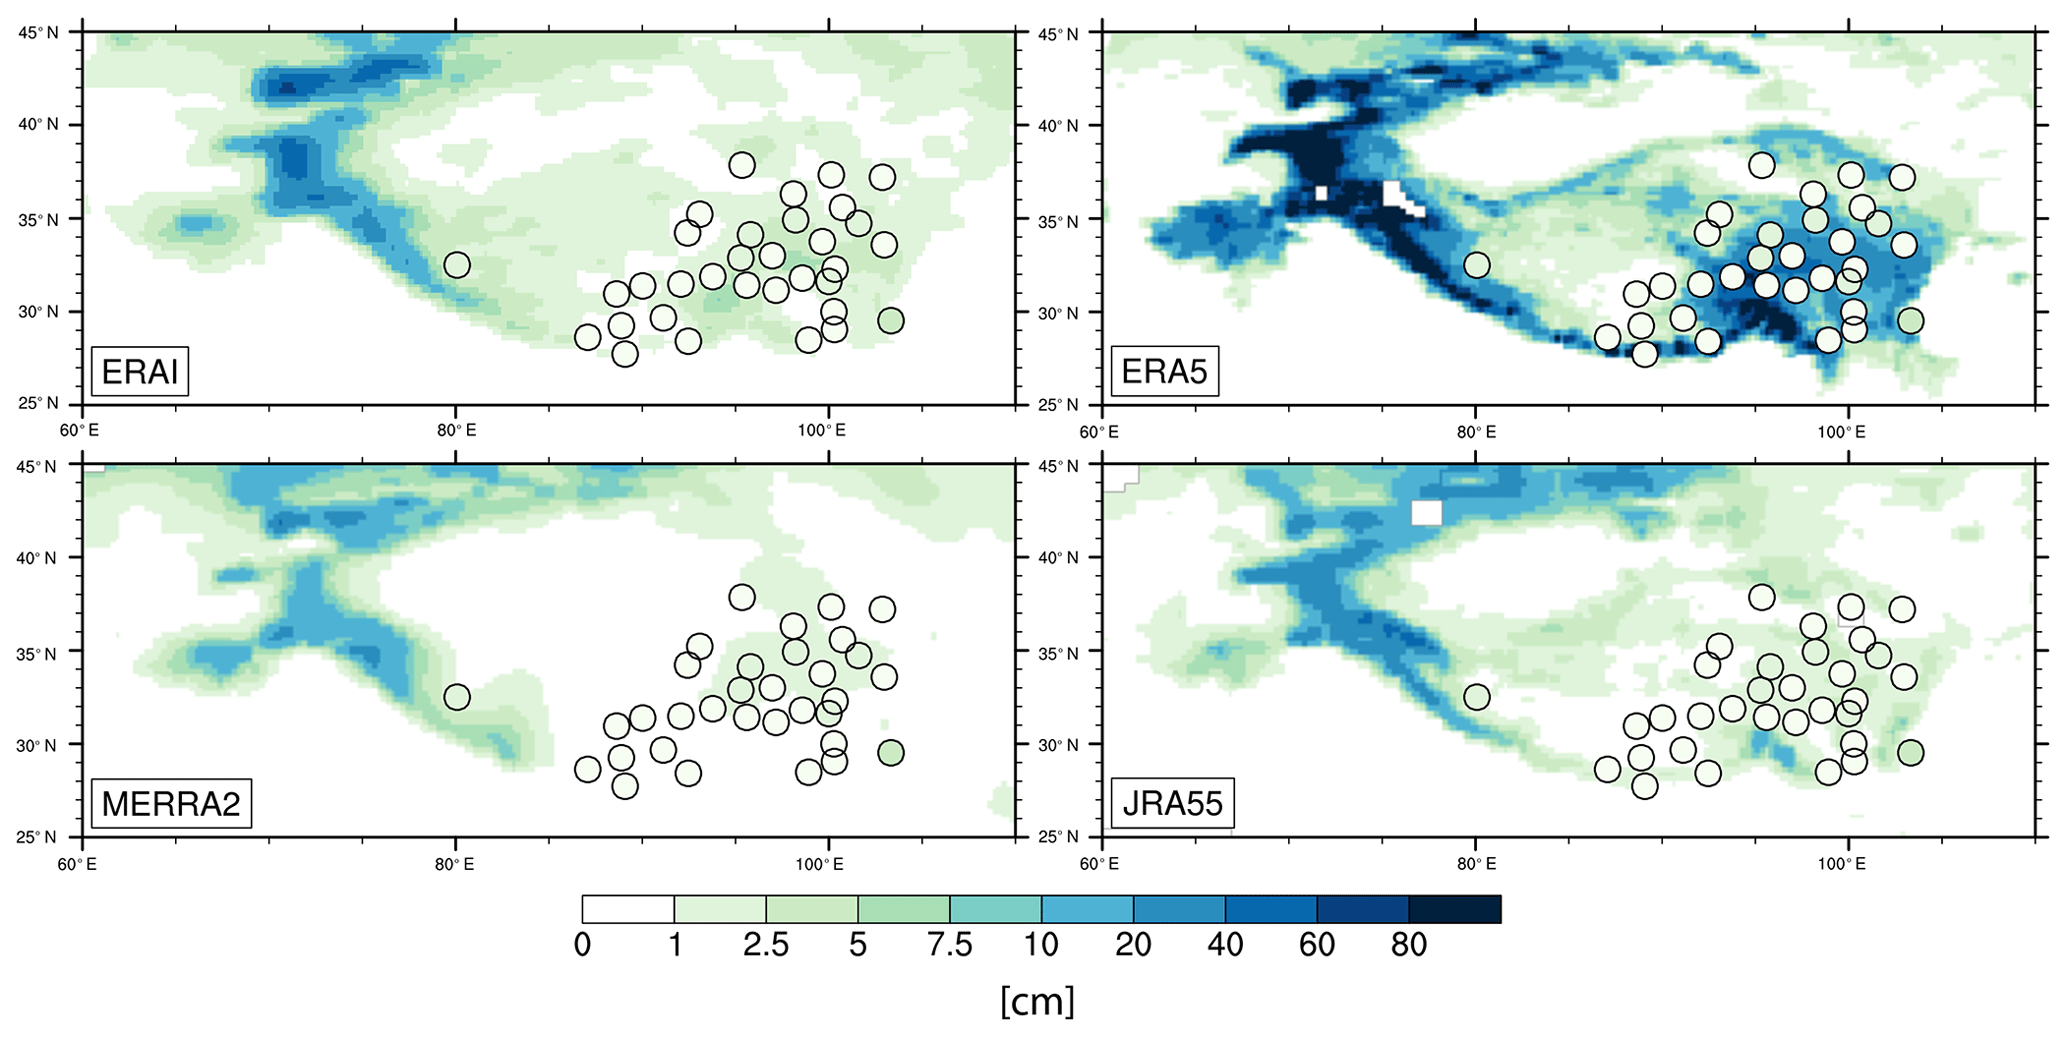
Figure 5Maps of the 5-year mean SD (in centimetres) over the TP region in January for each of the four reanalyses (ERA5, ERA-I, MERRA-2 and JRA-55) with the in situ SD (in centimetres) embedded locally in each map.

Figure 6Maps of the 2-year mean SD January anomalies (in centimetres) from the satellite MW data for the years 2009 and 2010 over the TP region for each of the four reanalyses (ERA5, ERA-I, MERRA-2 and JRA-55).
Moving to the geographical distribution over the TP region, Fig. 5 shows maps of the 5-year mean SD in January for each of the four reanalyses, with the in situ data embedded in each map. January is chosen to illustrate a mid-winter month when snowfall is relatively common and differences between reanalyses are large. In the southeast TP, where the stations are located, MERRA-2, JRA-55 and ERA-I have SDs comparable to in situ observations, as shown in Fig. 2. In the western station-void part, there are also large differences in the snow depth (up to a factor of 5) among the reanalyses, especially along the arc of the Himalayas and other high mountain ranges. Figure 6 is similar to Fig. 5 but represents January anomalies from the satellite MW data for the combined years 2009 and 2010. In the southeastern part, SDs in MERRA-2, ERA-I and JRA-55 are smaller than the MW data, consistent with Fig. 2. Figure 6 also reveals that ERA5 and JRA-55 have an excessive SD over the high mountains of the western Himalayas compared to satellite MW data, unlike ERA-I with its high-altitude snow cover assimilation. Figure 7 shows maps of the 5-year mean SCF in January for each of the reanalyses, for the two (low and high) estimates from IMS, again with the in situ SCF embedded in the maps. While there is a good agreement between the in situ data and the IMS low estimate, as shown earlier at station locations, the overestimation by ERA5 extends over the eastern and western parts of the TP. Nevertheless, some parts of central Tibet and the Taklamakan desert to the north are snow free in January in both IMS and in most reanalyses. ERA-I agrees much better with the IMS data, while JRA-55 SCF is too high, due to the SD vs. SCF conversion as explained above. On the contrary, the MERRA-2 SCF is exceedingly low and featureless.
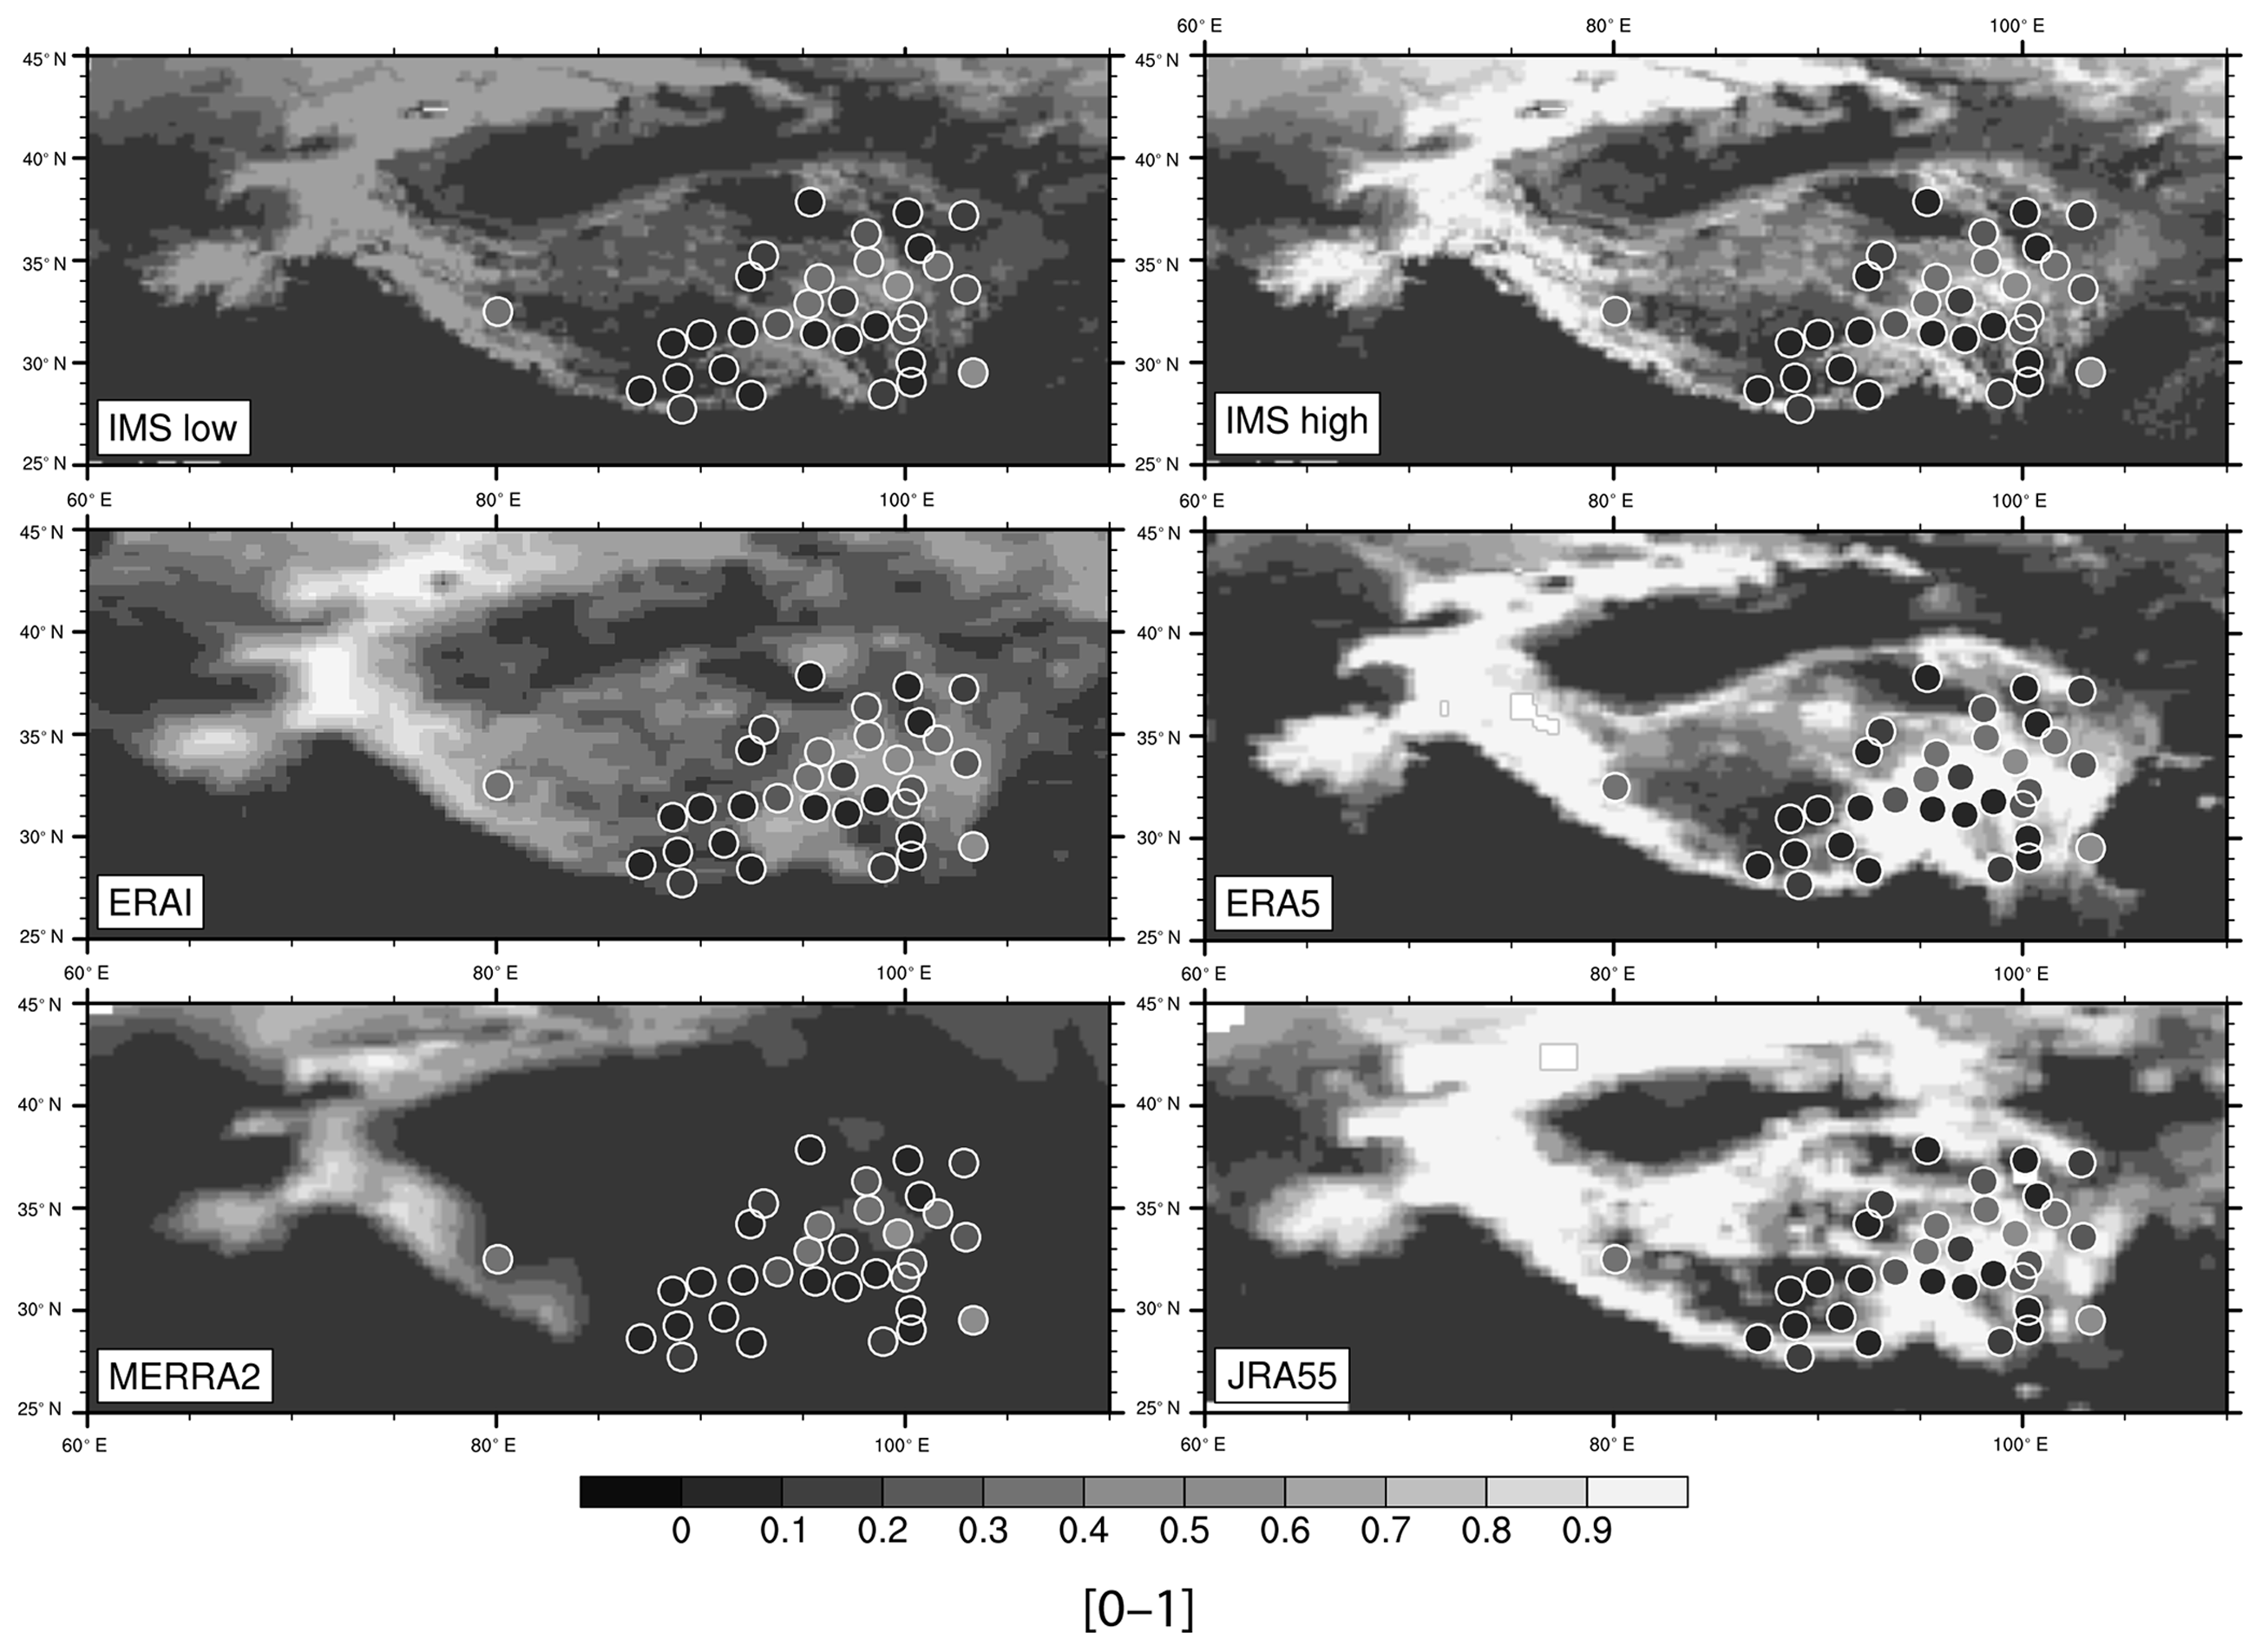
Figure 7Maps of the 5-year mean SCF (between 0 and 1) over the TP region in January for the IMS satellite data (two maps for the high and low estimates) and for each of the four reanalyses (ERA5, ERA-I, MERRA-2 and JRA-55), with the in situ SCF observations (between 0 and 1) embedded locally in each map.
4.1 Snow cover to snow depth conversion
A first important issue to mention is that the conversion of SD to SCF differs significantly among reanalyses. SCF is perhaps the most important snow-related climate driver for the surface budget, since the shortwave snow albedo feedback is strong on the TP, especially in the spring. The snowpack is also quite thin so that thermodynamical feedbacks linked to snow thickness are less important. A 100 % SCF might correspond to snow depths ranging from 26 to 2 cm, depending on the reanalysis considered. There may also be some dependence on snow density as in the cases of ERA-I and MERRA-2. Hence, while JRA-55 has an excellent performance among reanalyses for SD, the snow cover is exaggerated due to the conversion to 100 % SCF obtained with a small SD threshold value of 2 cm. While MERRA-2 SCF compares best with station data among the reanalyses (see Fig. 4b), being close to the low IMS estimate, it is exceedingly low over the TP overall (Fig. 7) given the comparatively high value (26 kg m−2) used for snow mass to get a fully covered snow area (Reichle et al., 2017a).
4.2 Sensitivity in offline ERA5-Land simulations
We carried out simple sensitivity offline experiments with the ERA5-Land model to shed some light on potential explanations for the large biases in the ERA5 reanalysis, which might be partly due to a missing snow removal process or to excessive snowy precipitation. Gordon et al. (2006) reported that blowing snow events are common in the Canadian Prairies and in the Arctic. As snow is carried out in suspension, it may sublimate. In a model study, Pomeroy and Li (2000) predicted that two-thirds of the snow transported from the surface to the atmosphere sublimates in the Prairie regions and one-half sublimates in the Arctic regions. Brun et al. (2013) used Gordon's parameterisation and argued that this was an important process in simulating snow dynamics in northern Eurasia. Processes like the blowing of snow and the sublimation of the blown snow might be important processes in the windy and dry conditions of the TP. To test the hypothesis that sublimation of blowing snow is an important missing process, a simple parameterisation of blown snow sublimation has been introduced, as described in the Appendix. It has been tested for two wind thresholds for blowing snow initiation. Furthermore, the impacts of changing the threshold in the snow depth to snow cover conversion and of reducing snowfall were tested separately. Other processes such as the impacts of blown snow on surface roughness or of snow drifts were not tested. In addition to the ERA5L-CTRL run described in Sect. 2, we hence performed an additional set of five land-only experiments testing (i) the effect of snow sublimation due to blowing snow in BLW and in BLW_L with a lower threshold for blowing snow initiation, (ii) the 100 % SCF threshold, changed from 10 to 5 cm in SCF05 and to 20 cm in SCF20, and (iii) the excessive snowfall by reducing snowfall by 50 % in SNF50. These five experiments with ERA5-Land, as summarised in Table 4, were carried out for the period 1 January 2019 to 31 December 2014, and over the domain 60.125 to 109.875∘ E and 25.125 to 44.875∘ N, with a regular latitude and longitude resolution of 0.25∘. The simulations were driven by the ERA5 meteorological fields interpolated to this regular grid.
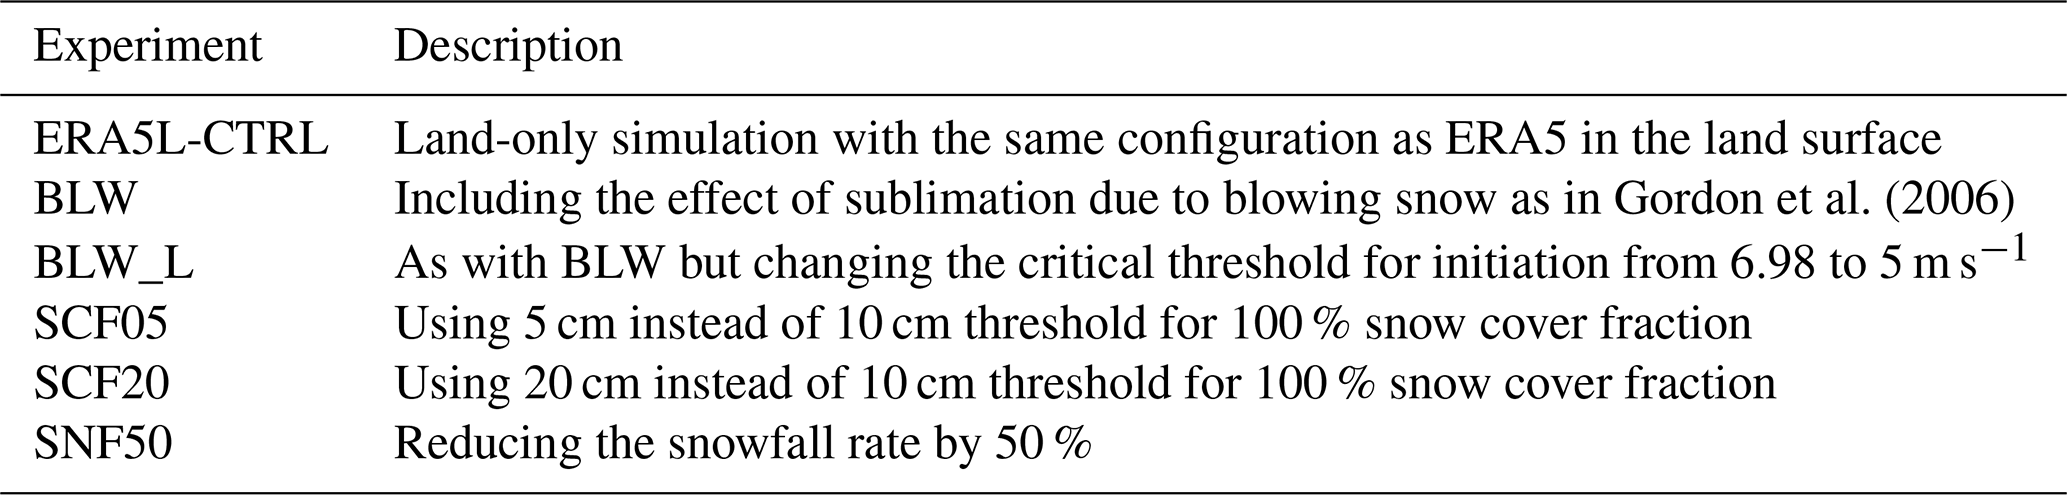
Table 5ERA5 and offline ERA5-Land experiments mean annual snow and associated fluxes averaged over the 33 stations. The fluxes are the annual mean accumulation of the following: snow sublimation, snow sublimation due to blowing snow, snowmelt, and snowfall and rainfall intercepted in the snowpack. The last row (OBS) presents the mean snow depth derived from the station data and the mean snow cover from the IMS satellite data (low estimate).
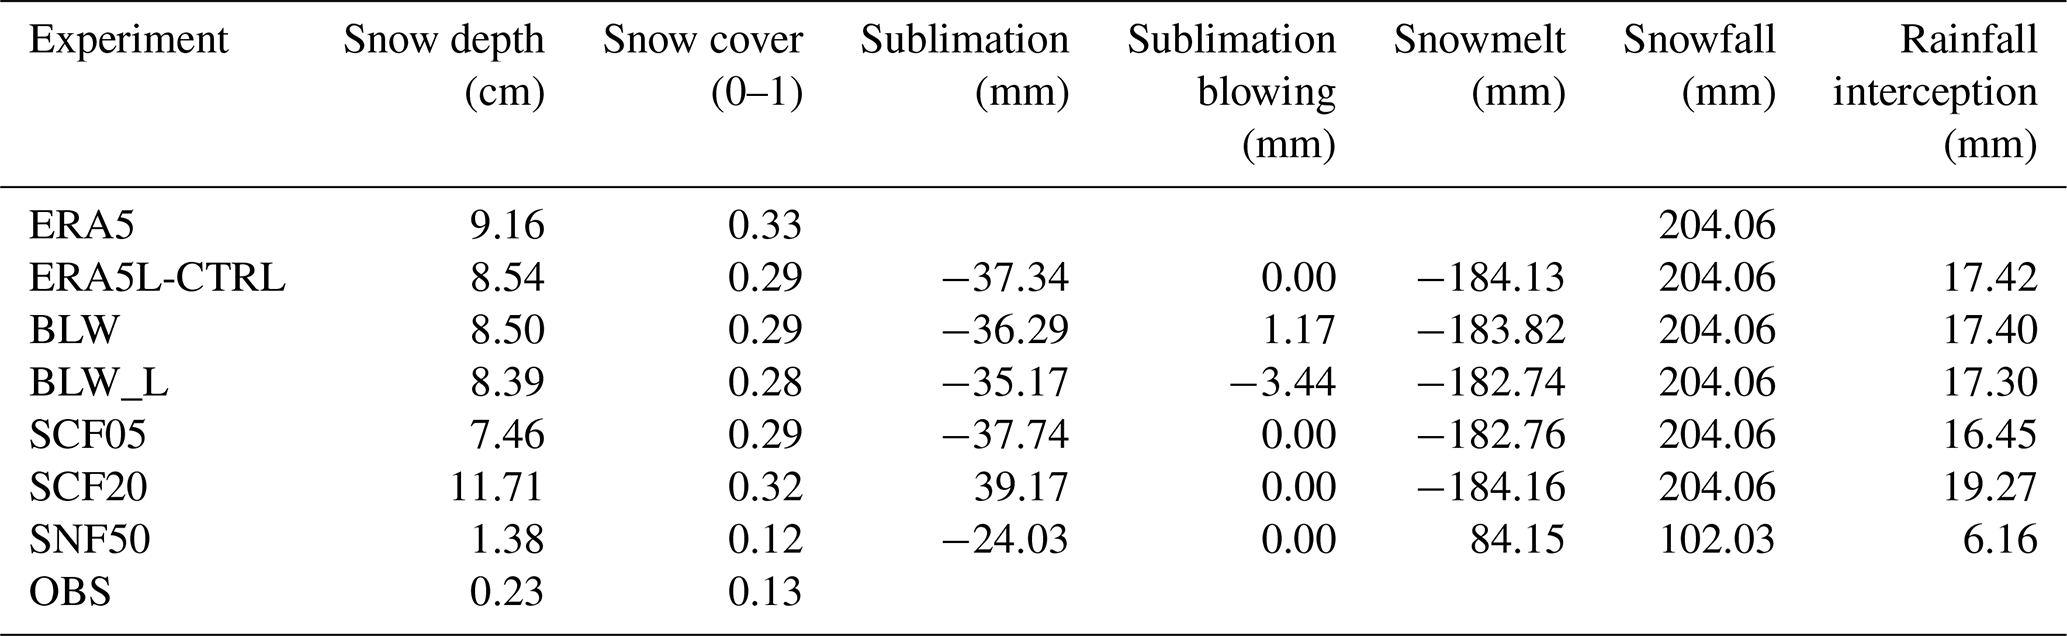
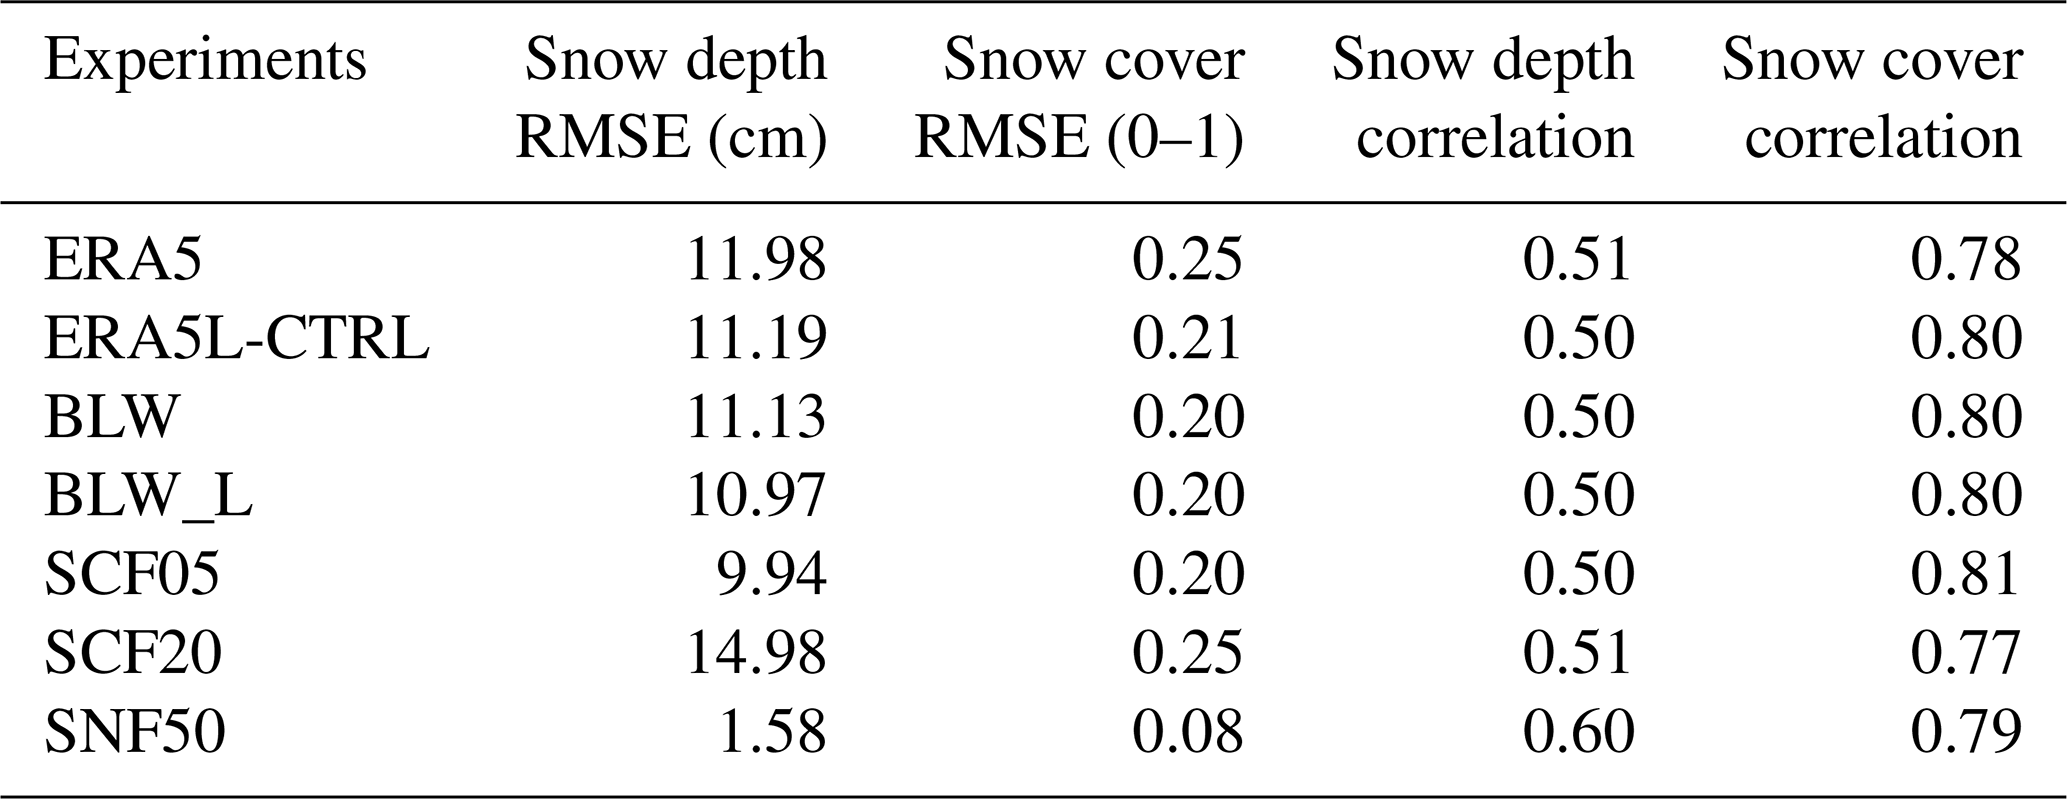
The evaluation of the different budget terms over the 33-station mean snow depth and cover (Table 5) as well as the root mean square errors and the temporal correlation with observations (Table 6) are shown. These results indicate that (i) the offline simulation (CTRL) with the same configuration as ERA5 represents closely the errors found in ERA5 as expected, (ii) the effects of snow sublimation due to blowing snow and of the SCF threshold change are negligible, and (iii) artificially reducing snowfall by 50 % reduces the systematic biases significantly, and it increases the temporal correlation of snow depth as well. The temporal variability of snow cover is captured reasonably well by ERA5 and the other experiments, suggesting that the main dynamic features of snow accumulation and depletion are well represented.
Table 6Root mean square error (RMSE) and temporal correlation for snow depth (versus stations data) and snow cover (versus IMS satellite) for ERA5 and the different experiments. The time series of the observation and experiments were first averaged over the 33 stations before the score calculations were carried out.
4.3 Excessive precipitation issue
These results suggest that excessive snowfall might be a key factor responsible for the large overestimation of snow depth and cover in ERA5 reanalysis. Excessive snowfall over this region is in fact a common bias among climate and forecast models (Su et al., 2013). In fact, the largest relative climate model bias for precipitation over land, globally, is on the TP (Flato et al., 2013). In order to provide further evidence for the precipitation bias, we present in Fig. 8 the 5-year mean seasonal cycles of minimum temperature, maximum temperature, total precipitation rate (i.e. liquid and snowy precipitation), snow cover and snow depth based on monthly means and averaged over all the 33 stations. Figure 8 reveals that all reanalyses have a cold temperature bias compared to in situ observations, especially in maximum temperature, which is largely consistent with their respective thick snowpack bias. For example, ERA-I is warmer and closer to the in situ observations than ERA5, likely due the latter having a higher snow depth. The good performance of ERA-I (and also of the first-generation MERRA) against in situ station temperature data has been noted by Wang and Zeng (2012). All reanalyses have a precipitation excess (Fig. 8c), except MERRA-2 which uses observed precipitation data, including over the TP region. Incidentally, this may explain the excellent performance of MERRA-2 in terms of mean snow depth over the stations (see Fig. 4a). Palazzi et al. (2013) also reported the precipitation excess in ERA-I, for example. In fact, ERA-I displays a precipitation excess greater than the more recent ERA5, despite having smaller SDs. The improvement in precipitation in ERA5 is likely due to its higher horizontal resolution, allowing better representation of synoptic events. Note that the precipitation seasonal cycle is largely dominated by summer monsoonal precipitation in the southeast TP. While our focus here is on the cold season, when precipitation is much smaller but likely falling as snow, there is still a positive bias in the reanalyses, indicating excessive snowfall. It must be kept in mind that in situ observations of snowfall are associated with a large uncertainty due to undercatch and other technical challenges.
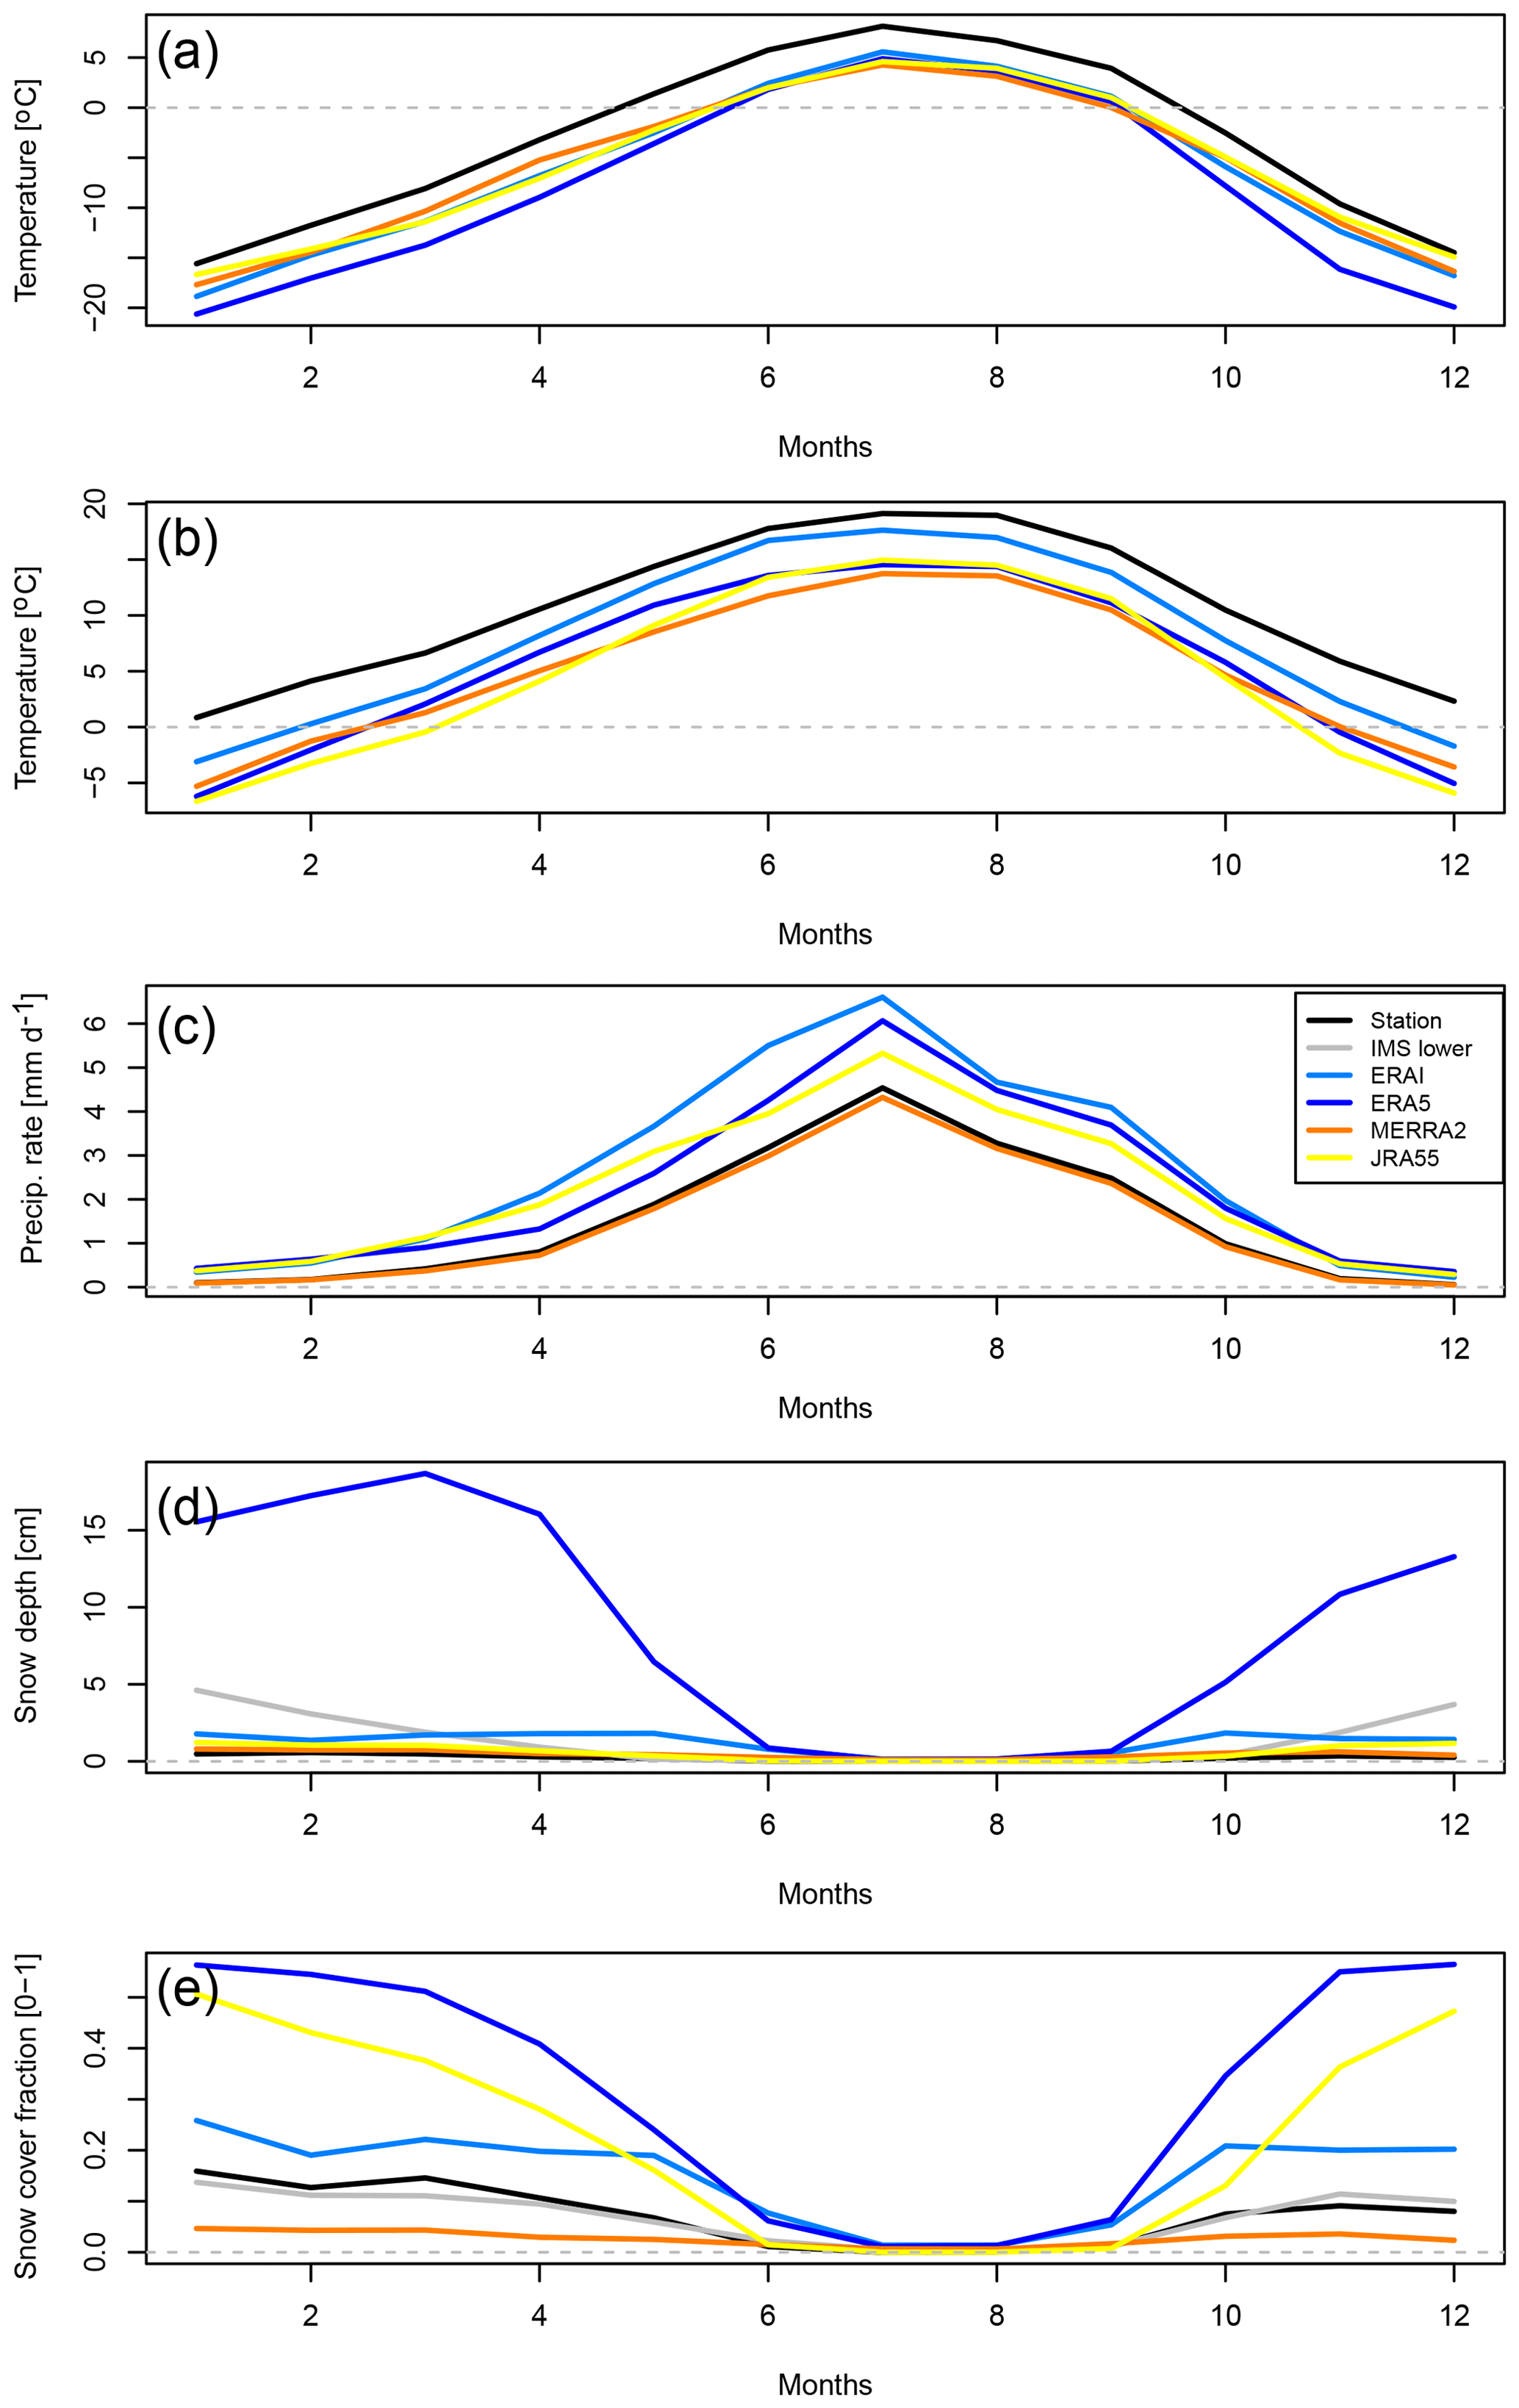
Figure 8The 5-year mean (2009–2013) monthly-mean seasonal cycle for minimum temperature (∘C) (a), maximum temperature (∘C) (b), precipitation rate (in millimetres per day) (c), SD (in centimetres) (d), and SCF (between 0 and 1) (e) averaged over all the 33 stations. The grey line refers to IMS (low estimate) for snow cover or to MW for snow depth.
Hence, a remaining point that must be addressed in future studies is the origin of the seasonal moisture transport to the TP region leading to the excess precipitation in models. While the results of the offline sensitivity tests do not support a role for sublimation due to blowing snow, it could be that the local turbulent surface winds are much higher than in the reanalyses. Hence the importance of the blown snow sublimation cannot be fully discounted. We further note that there is a strong regional seasonality in the precipitation pattern over the TP. The wet season precipitation (May–September) accounts for more than 70 % of the total annual precipitation over the south and southeast TP (where stations are located), a region that falls under the influence of the Asian summer monsoon (Maussion et al., 2014). On the other hand, over the western and northwestern parts of the TP , the wet season precipitation is less than 300 mm. This region is influenced by strong winter and spring westerlies and transient migratory synoptic eddies embedded in them (the so-called westerly disturbances), which provide a significant portion of the annual mean precipitation, especially over the western Himalayas (Tiwari et al., 2017). An effective barrier effect, inhibiting large-scale moisture transport over the region, is not captured by any of the models underpinning the reanalyses used here. The impact of having higher model horizontal resolution to resolve the complex topography has to be considered. Lin et al. (2018) carried out simulations for the summer monsoon season with the Weather Research Forecasting model (WRF) at resolutions of 30, 10 and 2 km and found that the finest resolution (2 km) diminished the water vapour transport to the TP and the precipitation bias. They also noticed a large improvement when model resolution changed from 30 to 10 km. The insufficient sub-scale orography variance and orographic drag seems to be a key factor (Zhou et al., 2019). Based on these results, it appears that the highest resolution in atmospheric reanalyses examined here (near 32 km in ERA5) remains insufficient, as demonstrated by the precipitation excess compared to station data in Fig. 8c.
Finally, we note that the particular relevance of the western TP snowpack for sub-seasonal-to-seasonal prediction, due to the limited snowpack persistence over the eastern and central TP, was already emphasised by Xiao and Duan (2016). Yet, with only one station in our inter-comparison, the western TP snowpack remains the less constrained by in situ data, and further studies on this issue are warranted.
We have shown that several recent, state-of-the-art reanalyses produce an over-extensive snowpack in autumn, winter and spring over parts of the TP. This is at odds with observational studies revealing that snowfall events are very transient, that the snow cover vanishes rapidly on timescales of days and that large parts of the TP can remain snow-free in winter (e.g. Basang et al., 2017; Li et al., 2018). The reanalyses that assimilate local in situ observations or satellite snow cover or precipitation are more capable of representing the shallow, transient snowpack over the TP region. MERRA-2 and JRA-55 have the best performance among reanalyses for snow depth. Considering the family of reanalyses from the ECMWF, we surmise that the underperformance of ERA5, in terms of SD compared to its older counterpart ERA-I, is due to the lack of IMS data assimilation at high altitudes, including over the TP. This issue will be subject of a follow-up publication, using dedicated assimilation experiments. Pending a solution for the common model precipitation bias over the Himalayas and TP, which may require much higher horizontal resolutions than currently used in global reanalyses, improved snow initialisation through better use of observations in the analyses may improve the medium-range to sub-seasonal forecasts.
All reanalyses data are publicly available: atmospheric reanalyses at https://s-rip.ees.hokudai.ac.jp/resources/links.html (last access: 20 August 2019), and ERA5-land at https://cds.climate.copernicus.eu/cdsapp#!/dataset/reanalysis-era5-land?tab=overview (last access: 20 August 2019). The station data have been made available through the National Meteorological Information Center (NMIC), China Meteorological Administration (http://data.cma.cn/en/?r=site/index, last access: 20 August 2019). IMS snow cover is publicly available from NOAA (https://nsidc.org/data/G02156, last access: 20 August 2019; National Ice Center, 2008), and the long-term MW satellite data are available from the National Tibetan Plateau Data Center (http://data.tpdc.ac.cn/en/data/df40346a-0202-4ed2-bb07-b65dfcda9368/, last access: 20 August 2019).
Snow is represented as a single bulk layer on top of the soil column with prognostic temperature, mass, density and albedo. Snow density is constant with depth, increasing exponentially with snow age, and decreasing after snowfall events assuming a constant snowfall density of 100 kg m−3. Snow albedo reduces exponentially as snow ages over low vegetation or bare soil, but is constant in time for snow under high vegetation, and is reset to a maximum value of 0.85 after snowfall event.
A snow depth analysis is performed using a Cressman (1959) interpolation with successive corrections. Station observations of snow depth are used; however there are no stations used over the TP. Gridded snow cover from IMS is also assimilated since 2004, using the coarser 24 km resolution product as detailed in Drusch et al. (2004). The snow depth analysis is relaxed toward a climatology when observations are unavailable.
Snow cover fraction is a diagnostic variable derived from the relation SCF , where SWE is the snow mass (kg m−2). A layer of 15 kg m−2 represents 100 % snow cover (15 cm depth considering a snow density of 100 kg m−3 or 5 cm depth if considering a snow density of 300 kg m−3).
The snow model is also a bulk single layer as in ERA-I, with the same prognostic variables but with several modifications, in particular a diagnostic of snow liquid water content, a revised SCF formulation and snow density evolution (Dutra et al., 2010). A two-dimensional optimal interpolation snow analysis, including the water equivalent, temperature and density of snow is performed using station observations of snow depth and the gridded SCF product from IMS 4 km resolution product (de Rosnay et al., 2014, 2015). Unlike ERA-I, IMS data are not used above 1500 m, i.e. in high altitude regions, which includes the TP. No station data over the TP are used. Unlike ERA-I, the snow depth analysis is not relaxed toward a climatology when observations are unavailable.
Snow cover fraction is a diagnostic variable derived from the relation SCF , where SD is the snow depth in centimetres so that a layer of 10 cm represents 100 % snow cover.
We made several additional offline simulations of the HTESSEL model forced by meteorological data from ERA5. The land model is hence the same as that used in ERA5, but there is no assimilation of snow or land observations in contrast to the ERA5 reanalyses. A simple parameterisation of snow sublimation due to blowing snow, as proposed by Gordon et al. (2006) and used in Brun et al. (2013), is newly implemented in HTESSEL. The sublimation of blowing snow (Qs, kg m−2 s−1) is computed as in Gordon et al. (2006):
where A and B are dimensionless constants (A=0.0018, B=3.6) and γ=4, T0 is the water freezing temperature. The formulation requires the lowest model level (at 10 m height) fields of air temperature (Ta), air density (ρa), wind speed (Ua), relative humidity (RHa) and saturation specific humidity (qsa). Ut (m s−1) is the threshold for initiation of blowing snow also used by Gordon et al. (2006) following Li and Pomeroy (1997):
In the experiments with reduced wind threshold, the first coefficient (6.98) is replaced by 5. This simple parameterisation only represents the snow mass removal by sublimation due to the blowing of snow, but it does not account for the change in the energy budget. Hence, the energy required to sublimate the snow is not taken from the surface or from the lower atmosphere. While this approximation would not be valid in a coupled land–atmosphere simulation, it seems appropriate in an offline simulation. Other experiments tested the impacts of the threshold in snow cover conversion (see SD parameter in the description of ERA5 above) and of reducing snowfall by half. The experiments are summarised in Table 4.
The land surface model in JRA-55 is the Simple Biosphere model (SiB) (Sellers et al., 1986), which represents snow mass on the ground and its evolution by updating several parameters and calculations. A separate optimal interpolation-based snow depth analysis is performed once per day (at 18:00 UTC). The first-guess background state combines the land-surface analysis and Special Sensor Microwave/Imager (SSM/I) and the Special Sensor Microwave Imager Sounder (SSMIS) snow cover satellite observations. The analysis also considers in situ observations of snow depth over China from CMA archives, including a dozen stations over the TP (Onogi et al., 2007; Kobayashi et al., 2015).
Snow cover fraction is a diagnostic variable derived from the relation SCF , where SD is the snow depth in centimetres so that a layer of 2 cm represents 100 % snow cover.
The evolution of snow mass, depth and heat content is simulated within each catchment using a three-layer snow model (Reichle, et al., 2017b). Density in each layer evolves via parameterised representations of compaction due to snow overburden, and melting and refreezing (Stieglitz et al., 2001). Snow is redistributed among layers as necessary to keep the surface layer shallow enough to respond to diurnal variability. The albedo of snow-covered land surface depends on snow density and vegetation type.
No snow data assimilation was performed. However, MERRA-2 performs an online correction for precipitation using two different gridded precipitation datasets from NOAA Climate Prediction Center, namely the Unified Gauge-Based Analysis of Global Daily Precipitation (CPCU) product and the Merged Analysis of Precipitation (CMAP) product (Reichle et al., 2017a, b).
Snow cover fraction is a diagnostic variable derived from the relation SCF , where SWE is the snow mass in kilograms per square metre. A layer of 26 kg m−2 represents 100 % snow cover (i.e. a 26 cm snow depth considering a density of 100 kg m−3).
All co-authors participated in the analyses through the working team mentioned in the Acknowledgements section. MW and ED drafted the figures. BL and CZ analysed and provided the station data.
The authors declare that they have no conflict of interest.
We acknowledge the support of the International Space Science Institute in Beijing, through the working team “Snow reanalyses over the Himalaya-Tibetan Plateau region and the monsoons” over the years 2016–2018 (team leaders: Yvan Orsolini and Gianpaolo Balsamo). Emanuel Dutra was supported by the Portuguese Science Foundation (FCT) under project IF/00817/2015. Joaquín Muñoz Sabater is acknowledged for valuable comments on ERA5L testing. Yvan Orsolini also acknowledges partial support from the Working Group on Subseasonal to Interdecadal Prediction (WGSIP) (https://www.wcrp-climate.org/modelling-wgsip, last access: 20 August 2019) of the World Climate Research Programme (WCRP). We are also grateful to Shinya Kobayashi, Yayoi Harada, Rolf Reichle and Sujay Kumar for help with the reanalyses.
This research has been supported by the International Space Science Institute in Beijing, through the working team “Snow reanalyses over the Himalaya-Tibetan Plateau region and the monsoons”, the Portuguese Science Foundation (FCT) under project IF/00817/2015, and the Working Group on Subseasonal to Interdecadal Prediction (WGSIP) of the World Climate Research Programme (WCRP).
This paper was edited by Ross Brown and reviewed by two anonymous referees.
Basang, D., Barthel, K., and Olseth, J. A.: Satellite and Ground Observations of Snow Cover in Tibet during 2001–2015, Remote Sensing, 9, 1201, https://doi.org/10.3390/rs9111201, 2017.
Basang, D. K.: Snow Cover Distribution and Variation in Tibet, PhD thesis, University of Bergen, Bergen, Norway, ISBN 978-82-308-3713-9, 2018.
Brönnimann, S., Allan, R., Atkinson, C., Buizza, R., Bulygina, O., Dahlgren, P., Dee, D., Dunn, R., Gomes, P., John, V. O., Jourdain, S., Haimberger, L., Hersbach, H., Kennedy, J., Poli, P., Pulliainen, J., Rayner, N., Saunders, R., Schulz, J., Sterin, A., Stickler, A., Titchner, H., Valente, M. A., Ventura, C., and Wilkinson, C.: Observations for Reanalyses, B. Am. Meteorol. Soc., 99, 1851–1866, https://doi.org/10.1175/BAMS-D-17-0229.1, 2018.
Brun, E., Vionnet, V., Boone, A., Decharme, B., Peings, Y., Valette, R., Karbou, F., and Morin, S.: Simulation of Northern Eurasian Local Snow Depth, Mass, and Density Using a Detailed Snowpack Model and Meteorological Reanalyses, J. Hydrometeorol., 14, 203–219, 2013.
Che, T., Li, X., Jin, R., Armstrong, R., and Zhang, T.: Snow depth derived from passive microwave remote-sensing data in China, Ann.Glaciol., 49, 145–153, 2008.
Chen, X., Long, D., Hong, Y., Liang, S., and Hou, A.: Observed radiative cooling over the Tibetan Plateau for the past three decades driven by snow cover-induced surface albedo anomaly, J. Geophys. Res.-Atmos., 122, 6170–6185, 2017.
China Meteorological Administration (CMA): Ground Meteorological Observation Specifications, China Meteorological Press, Beijing, China, 151–153, 2003 (in Chinese).
Cressman, G. P.: An operational objective analysis system, Mon. Weather Rev., 87.10, 367–374, 1959.
Dai, L., Che, T., Ding, Y., and Hao, X.: Evaluation of snow cover and snow depth on the Qinghai–Tibetan Plateau derived from passive microwave remote sensing, The Cryosphere, 11, 1933–1948, https://doi.org/10.5194/tc-11-1933-2017, 2017.
Dee, D. P., Uppala, S. M., Simmons, A. J., Berrisford, P., Poli, P., Kobayashi, S., Andrae U., Balmaseda, M. A., Balsamo, G., Bauer, P. Bechtold, P., Beljaars, A. C. M., van de Berg, L., Bidlot, J., Bormann, N., Delsol, C., Dragani, R., Fuentes, M., Geer, A. J., Haimberger, L., Healy, S. B., Hersbach, H., Hólm, E. V., Isaksen, L., Kållberg, P., Köhler, M., Matricardi, M., McNally, A. P., Monge‐Sanz, B. M., Morcrette, J.‐J., Park, B.‐K., Peubey, C., de Rosnay, P.,Tavolato, C., Thépaut, J.‐N., and Vitart, F.: The ERA-Interim reanalysis: configuration and performance of the data assimilation system, Q. J. Roy. Meteor. Soc., 137, 553–597, 2011.
de Rosnay, P., Balsamo, G., Albergel, C., Muñoz-Sabater, J., and Isaksen, L.: Initialisation of land surface variables for Numerical Weather Prediction, Surv. Geophys., 35, 607–621, https://doi.org/10.1007/s10712-012-9207-x, 2014.
de Rosnay, P., Isaksen, L., and Dahoui, M.: Snow data assimilation at ECMWF, ECMWF Newsletter, 143, 26–31, available at: https://www.ecmwf.int/sites/default/files/elibrary/2015/14587-newsletter-no143-spring-2015.pdf (last access: 20 August 2019), 2015.
Drusch, M., Vasiljevic, D., and Viterbo, P.: ECMWF's Global Snow Analysis: Assessment and Revision Based on Satellite Observations, J. Appl. Meteor., 43, 1282–1294, 2004.
Dutra, E., Balsamo, G., Viterbo, P., Miranda, P. M. A., Beljaars, A., Schar, C., and Elder, K.: An improved snow scheme for the ECMWF land surface model: description and offline validation, J. Hydrometeorol., 11, 899–916, 2010.
Flato, G., Marotzke, J., Abiodun, B., Braconnot, P., Chou, S. C., Collins, W., Cox, P., Driouech,F., Emori, S., Eyring, V., Forest, C., Gleckler, P., Guilyardi, E., Jakob, C., Kattsov, V., Reason, C., and Rummukainen, M.: Evaluation of climate models, Climate Change 2013 – The Physical Science Basis: Working Group I Contribution to the Fifth Assessment Report of the Intergovernmental Panel on Climate Change, Cambridge University Press, 741–866, https://doi.org/10.1017/CBO9781107415324.020, 2013.
Fujiwara, M., Wright, J. S., Manney, G. L., Gray, L. J., Anstey, J., Birner, T., Davis, S., Gerber, E. P., Harvey, V. L., Hegglin, M. I., Homeyer, C. R., Knox, J. A., Krüger, K., Lambert, A., Long, C. S., Martineau, P., Molod, A., Monge-Sanz, B. M., Santee, M. L., Tegtmeier, S., Chabrillat, S., Tan, D. G. H., Jackson, D. R., Polavarapu, S., Compo, G. P., Dragani, R., Ebisuzaki, W., Harada, Y., Kobayashi, C., McCarty, W., Onogi, K., Pawson, S., Simmons, A., Wargan, K., Whitaker, J. S., and Zou, C.-Z.: Introduction to the SPARC Reanalysis Intercomparison Project (S-RIP) and overview of the reanalysis systems, Atmos. Chem. Phys., 17, 1417–1452, https://doi.org/10.5194/acp-17-1417-2017, 2017.
Gelaro, R., McCarty, W., Suárez, M. J., Todlinga, R., Moloda, A., Takacs, L., Randles, C. A., Darmenov, A., Bosilovich, M. G., Reichle, R., Wargan, K., Coy, L., Cullather, R., Draper, C., Akella, S., Buchard, V., Conaty, A., da Silva, A. M., Gu, W., Kim, G.-K., Koster, R., Lucchesi, R., Merkova, D., Nielsen, J. E., Partyka, G., Pawson, S., Putman, W., Rienecker, M., Schubert, S. D., Sienkiewicz, M., and Zhao, B.: The Modern-Era Retrospective Analysis for Research and Applications, Version 2 (MERRA-2), J. Climate, 30, 5419–5454, 2017.
Gordon, M., Simon, K., and Taylor, P. A.: On snow depth predictions with the Canadian land surface scheme including a parametrization of blowing snow sublimation, Atmos.-Ocean, 44, 239–255, https://doi.org/10.3137/ao.440303, 2006.
Halder, S. and Dirmeyer, P. A.: Relation of Eurasian Snow Cover and Indian Summer Monsoon Rainfall: Importance of the Delayed Hydrological Effect, J. Climate, 30, 1273–1289, 2018.
Helfrich, S. R., McNamara, D., Ramsay, B. H., Baldwin, T., and Kasheta, T.: Enhancements to, and forthcoming developments in the Interactive Multisensor Snow and Ice Mapping System (IMS), Hydrol. Process., 21, 1576–1586, 2007.
Henderson, G., Peings, Y., Furtado, J. C., and Kushner, P. J.: Snow–atmosphere coupling in the Northern Hemisphere, Nat. Clim. Change, 8, 954–963, 2018.
Hersbach, H., de Rosnay, P., Bell, B., Schepers, D., Simmons, A., Soci, C., Abdalla, S., Alonso-Balmaseda, M., Balsamo, G., Bechtold, P., Berrisford, P., Bidlot, J.-R., de Boisséson, E., Bonavita, M., Browne, P., Buizza, R., Dahlgren, P., Dee, D., Dragani, R., Diamantakis, M., Flemming, J., Forbes, R., Geer, A. J., Haiden, T., Hólm, E., Haimberger, L., Hogan, R., Horányi, A., Janiskova, M., Laloyaux, P., Lopez, P., Munoz-Sabater, J., Peubey, C., Radu, R., Richardson, D., Thépaut, J.-N., Vitart, F., Yang, X., Zsótér, E., and Zuo, H.: Operational global reanalysis: progress, future directions and synergies with NWP, ECMWF ERA report series, N27, available at: https://www.ecmwf.int/en/elibrary/18765-operational-global-reanalysis-progress-future-directions-and-synergies-nwp (last access: August 2019), 2018.
Immerzeel, W. W., Droogers, P., de Jong, S. M., and Bierkens, M. F. P.: Large-scale monitoring of snow cover and runoff simulation in Himalayan river basins using remote sensing, Remote Sens. Environ., 113, 40–49, 2009.
Johnson, S. J., Stockdale, T. N., Ferranti, L., Balmaseda, M. A., Molteni, F., Magnusson, L., Tietsche, S., Decremer, D., Weisheimer, A., Balsamo, G., Keeley, S. P. E., Mogensen, K., Zuo, H., and Monge-Sanz, B. M.: SEAS5: the new ECMWF seasonal forecast system, Geosci. Model Dev., 12, 1087–1117, https://doi.org/10.5194/gmd-12-1087-2019, 2019.
Kobayashi, S., Ota, Y., Harada, Y., Ebita, A., Moriya, M., Onoda, H., Onogi, K., Kamahori, H., Kobayashi, C., Endo, H., Miyaoka, K., and Takahashi, K.: The JRA-55 Reanalysis: General specifications and basic characteristics, J. Meteorol. Soc. Jpn., 93, 5–48, https://doi.org/10.2151/jmsj.2015-001, 2015.
Li, L. and Pomeroy, J. W.: Probability of occurrence of blowing snow, J. Geophys. Res., 102, 21955–21964, https://doi.org/10.1029/97JD01522, 1997.
Li, W., Guo, W., Qiu, B., Xue, Y., Hsu, P.-C., and Wei, J.: Influence of Tibetan Plateau snow cover on East Asian atmospheric circulation at medium-range time scales, Nat. Commun., 9, 4243, https://doi.org/10.1038/s41467-018-06762-5, 2018.
Lin, C., Chen, D., Yang, K., and Ou, T.: Impact of model resolution on simulating the water vapor transport through the central Himalayas: implication for models' wet bias over the Tibetan Plateau, Clim. Dynam., 51, 3195–3207, 2018.
Lin, P., Wei, J., Yang, Z.-L., Zhang, Y., and Zhang, K.: Snow data assimilation constrained land initialization improves seasonal temperature prediction, Geophys. Res. Lett., 43, 11423–11432, https://doi.org/10.1002/2016GL070966, 2016.
Liu, S., Wu, Q., Ren, X., Yao, Y., Schroeder, S. R., and Hu, H.: Modeled Northern Hemisphere Autumn and Winter Climate Responses to Realistic Tibetan Plateau and Mongolia Snow Anomalies, J. Climate, 30, 9435–9454, 2017.
Lu, M., Yang, S., Li, Z., He, B., He, S., and Wang, Z.: Possible effect of the Tibetan Plateau on the “upstream” climate over West Asia, North Africa, South Europe and the North Atlantic, Clim. Dynam., 4, 1485–1498, https://doi.org/10.1007/s00382-017-3966-5, 2017.
Maussion, F., Scherer, D., Mölg, T., Collier, E., Curio, J., and Finkelnburg, R.: Precipitation Seasonality and Variability over the Tibetan Plateau as Resolved by the High Asia Reanalysis, J. Climate, 27, 1910–1927, https://doi.org/10.1175/JCLI-D-13-00282.1, 2014.
Ménégoz, M., Gallée, H., and Jacobi, H. W.: Precipitation and snow cover in the Himalaya: from reanalysis to regional climate simulations, Hydrol. Earth Syst. Sci., 17, 3921–3936, https://doi.org/10.5194/hess-17-3921-2013, 2013.
National Ice Center: IMS Daily Northern Hemisphere Snow and Ice Analysis at 1 km, 4 km, and 24 km Resolutions, Version 1, Boulder, Colorado USA, NSIDC: National Snow and Ice Data Center, https://doi.org/10.7265/N52R3PMC, 2008.
Onogi, K., Tsutsui, J., Koide, H., Sakamoto, M., Kobayashi, S., Hatsushika, H., Matsumoto, T., Yamazaki, N., Kamahori, H., Takahashi, K., Kadokura, S.,Wada, K., Kato, K., Oyama, R., Ose, T., Mannoji, N., and Taira, R.: The JRA-25 re-analyses, J. Meteorol. Soc. Jpn., 85, 369–432, 2007.
Orsolini, Y. J., Senan, R., Balsamo, G., Doblas-Reyes, F., Vitart, D., Weisheimer, A., Carrasco, A., and Benestad, R.: Impact of snow initialization on sub-seasonal forecasts, Clim. Dynam., 7–8, 1969–1982, https://doi.org/10.1007/s00382-013-1782-0, 2013.
Palazzi, E., von Hardenberg, J., and Provenzale, A.: Precipitation in the Hindu-Kush Karakoram Himalaya: Observations and future scenarios, J. Geophys. Res.-Atmos., 118, 85–100, https://doi.org/10.1029/2012JD018697, 2013.
Pomeroy, J. W. and Li, L.: Prairie and Arctic areal snow cover mass balance using a blowing snow model, J. Geophys. Res., 105, 26619–26634, 2000.
Rai, A., Saha, S. K., Pokhrel, S., Sujith, K., and Halder, S.: Influence of preonset land atmospheric conditions on the Indian summer monsoon rainfall variability, J. Geophys. Res.-Atmos., 120, 4551–4563, 2015.
Reichle, R. H., Liu, Q., Koster, R. D., Draper, C. S., Mahanama, S. P. P., and Partyka, G. S.: Land Surface Precipitation in MERRA-2, J. Climate, 30, 1643–1664, 2017a.
Reichle, R. H., Draper, C. S., Liu, Q., Girotto, M., Mahanama, S. P. P., Koster, R. D., and De Lannoy, G. J. M.: Assessment of MERRA-2 Land Surface Hydrology Estimates, J. Climate, 30, 2937–2960, 2017b.
Sellers, P. J., Mintz, Y., Sud, Y. C., and Dalcher, A.: A Simple Biosphere Model (SIB) for Use within General Circulation Models, J. Atmos. Sci., 43, 505–531, 1986.
Senan, R., Orsolini, Y. J., Weisheimer, A., Vitart, F., Balsamo, G., Stockdale, T., Dutra, E., Doblas-Reyes, F., and Basang, D.: Impact of springtime Himalayan-Tibetan Plateau snowpack on the onset of the Indian summer monsoon in coupled seasonal forecasts, Clim. Dynam., 47, 2709–2725, https://doi.org/10.1007/s00382-016-2993-y, 2016.
Stieglitz, M., Ducharne, A., Koster, R., and Suarez, M.: The Impact of Detailed Snow Physics on the Simulation of Snow Cover and Subsurface Thermodynamics at Continental Scales, J. Hydrometeorol., 2, 228–242, 2001.
Su, F., Duan, X., Chen, D., Hao, Z., and Cuo, L.: Evaluation of the Global Climate Models in the CMIP5 over the Tibetan Plateau, J. Climate, 26, 3187–3208, 2013.
Tiwari, S., Kar, S. C., and Bhatla, R.: Atmospheric moisture budget during winter seasons in the western Himalayan region, Clim. Dynam., 48, 1277–1295, 2017.
Treichler, D., Kääb, A., Salzmann, N., and Xu, C.-Y.: High Mountain Asia glacier elevation trends 2003–2008, lake volume changes 1990–2015, and their relation to precipitation changes, The Cryosphere Discuss., https://doi.org/10.5194/tc-2018-238, in review, 2018.
Viste, E. and Sorteberg, A.: Snowfall in the Himalayas: an uncertain future from a little-known past, The Cryosphere, 9, 1147–1167, https://doi.org/10.5194/tc-9-1147-2015, 2015.
Wang, A. and Zeng, X.: Evaluation of multireanalysis products with in situ observations over the Tibetan Plateau, J. Geophys. Res., 117, D05102, https://doi.org/10.1029/2011JD016553, 2012.
Wang, A., Wua, R., and Huang, G.: Low-frequency snow changes over the Tibetan Plateau, Int. J. Climatol., 38, 949–963, 2018.
Wang, X., Wu, C., Wang, H., Gonsamo, A., and Liu, Z.: No evidence of widespread decline of snow cover on the Tibetan Plateau over 2000–2015, Sci. Rep., 7, 14645, https://doi.org/10.1038/s41598-017-15208-9, 2017.
Wegmann, M., Orsolini, Y., Dutra, E., Bulygina, O., Sterin, A., and Brönnimann, S.: Eurasian snow depth in long-term climate reanalyses, The Cryosphere, 11, 923–935, https://doi.org/10.5194/tc-11-923-2017, 2017.
Wright, J., Fujiwara, M., Long, C., Anstey, J., Chabrillat, S., Compo, G. P., Dragani, R., Ebisuzaki, W., Harada, Y., Kobayashi, C., McCarty, W., Molod, A., Onogi, K., Pawson, S., Simmons, A., Tan, D. G. H., Wargan, K., Whitaker, J. S., and Zou, C.-Z.: Chapter 2: SPARC Reanalysis Intercomparison Project (S-RIP) Description of the Reanalysis Systems, available at: https://s-rip.ees.hokudai.ac.jp/index.html (last access: 20 August 2019), 2018.
Wu, G. X., Liu, Y. M., He, B., Bao, Q., Duan, A. M., and Jin, F. F.: Thermal Controls on the Asian Summer Monsoon, Sci. Rep., 2, 404, https://doi.org/10.1038/srep00404, 2012.
Wu, G. X., Duan, A. M., Liu, Y. M., Mao, J. Y., Ren, R. C., Bao, Q., He, B., Liu, B. Q., and Hu, W. T.: Tibetan Plateau climate dynamics: recent research progress and outlook, Natl. Sci. Rev., 2, 100–116, https://doi.org/10.1093/nsr/nwu045, 2015.
Xiao, Z. X. and Duan, A. M.: Impacts of Tibetan Plateau Snow Cover on the Interannual Variability of the East Asian Summer Monsoon, J. Climate, 29, 8495–8514, https://doi.org/10.1175/JCLI-D-16-0029.1, 2016.
Xue, Y., Diallo, I., Li, W., Neelin, J. D., Chu, P. C., Vasic, R., Guo, W., Li, Q., Robinson, D. A., Zhu, Y., Fu, C., and Oaida, C. M.: Spring land surface and subsurface temperature anomalies and subsequent downstream late spring-summer droughts/floods in North America and East Asia, J. Geophys. Res.-Atmos., 123, 5001–5019, https://doi.org/10.1029/2017JD028246, 2018.
Yang, J., Jiang, L., Ménard, C. B., Luojus, K., Lemmetyinen, J., and Pulliainen, J.: Evaluation of snow products over the Tibetan Plateau, Hydrol. Process., 29, 3247–3260, 2015.
Yang, K., Wu, H., Qin J., Lin, C., Tang W., and Chen, Y.: Recent climate changes over the Tibetan Plateau and their impacts on energy and water cycle: A review, Global Planet. Change, 112, 79–91, 2014.
Yao, T., Thompson, L., Yang, W., Yu, W., Gao, Y., Guo, X., Yang, X., Duan, K., Zhao, H., Xu, B., Pu, J., Lu, A., Xiang, Y., Kattel, D. B., and Joswiak, D.: Different glacier status with atmospheric circulations in Tibetan Plateau and surroundings, Nat. Clim. Change, 2, 663–667, 2012.
Zhang, G., Yao, T., Piao, S., Bolch, T., Xie, H., Chen, D., Gao, Y., O'Reilly, C. M., Shum, C. K., Yang, K., Yi, S., Lei, Y., Wang, W., He, Y., Shang, K., Yang, X., and Zhang, H.: Extensive and drastically different alpine lake changes on Asia's high plateaus during the past four decades, Geophys. Res. Lett., 44, 252–260, https://doi.org/10.1002/2016GL072033, 2017.
Zhang, Y., Li, T., and Wang, B.: Decadal change of the spring snow depth over the Tibetan Plateau: The associated circulation and influence on the East Asian summer monsoon, J. Climate, 17, 2780–2793, 2004.
Zhou, X., Yang, K., Beljaars, A., Li, H., Lin, C., Huang, B., and Wang, Y.: Dynamical impact of parameterized turbulent orographic form drag on the simulation of winter precipitation over the western Tibetan Plateau, Clim. Dynam., 1–2, 707–720, https://doi.org/10.1007/s00382-019-04628-0, 2019.
Zou, H., Zhu, J., Zhou, L., Li, P., and Ma, S.: Validation and application of reanalysis temperature data over the Tibetan Plateau, J. Meteorol. Res., 28, 139–149, 2014.
- Abstract
- Introduction
- Data and methods
- Results
- Discussion
- Summary
- Data availability
- Appendix A: ERA-Interim
- Appendix B: ERA5
- Appendix C: ERA5L-CTRL and dedicated experiments
- Appendix D: JRA-55
- Appendix E: MERRA-2
- Author contributions
- Competing interests
- Acknowledgements
- Financial support
- Review statement
- References