the Creative Commons Attribution 4.0 License.
the Creative Commons Attribution 4.0 License.
 | 02 Jan 2019
Definition differences and internal variability affect the simulated Arctic sea ice melt season
Abigail Smith
Alexandra Jahn
Satellite observations show that the Arctic sea ice melt season is getting longer. This lengthening has important implications for the Arctic Ocean's radiation budget, marine ecology and accessibility. Here we assess how passive microwave satellite observations of the melt season can be used for climate model evaluation. By using the Community Earth System Model Large Ensemble (CESM LE), we evaluate the effect of multiple possible definitions of melt onset, freeze onset and melt season length on comparisons with passive microwave satellite data, while taking into account the impacts of internal variability. We find that within the CESM LE, melt onset shows a higher sensitivity to definition choices than freeze onset, while freeze onset is more greatly impacted by internal variability. The CESM LE accurately simulates that the trend in freeze onset largely drives the observed pan-Arctic trend in melt season length. Under RCP8.5 forcing, the CESM LE projects that freeze onset dates will continue to shift later, leading to a pan-Arctic average melt season length of 7–9 months by the end of the 21st century. However, none of the available model definitions produce trends in the pan-Arctic melt season length as large as seen in passive microwave observations. This suggests a model bias, which might be a factor in the generally underestimated response of sea ice loss to global warming in the CESM LE. Overall, our results show that the choice of model melt season definition is highly dependent on the question posed, and none of the definitions exactly match the physics underlying the passive microwave observations.
- Article
(6946 KB) - Full-text XML
-
Supplement
(6489 KB) - BibTeX
- EndNote


Arctic sea ice melt season characteristics play an important role in the radiation balance of the Arctic. Changes in the melt season have important implications for the Arctic climate system as a whole (Markus et al., 2009), and therefore are crucial for anticipating ecological changes and informing economic development in the region. In this study, we quantify the impact of definition choices and internal variability on Arctic sea ice melt season characteristics (averages and trends of melt onset, freeze onset and melt season length). This allows us to assess how best to compare observed and modeled melt season changes and diagnose model biases.
The timing of melt and freeze onset greatly affects regional oceanic heat budgets (Bitz and Roe, 1996; Perovich et al., 2007, 2011; Stroeve et al., 2014). In situ observations indicate that melt onset is driven primarily by synoptic frontal systems that produce northward warm air advection (Persson, 2012). Cloud formation and light drizzle in the warm air layer then increase downwelling longwave radiation and initiate melt onset. For each day that melt onset occurs earlier, 8.7 MJ m−2 is absorbed by the surface (Perovich et al., 2007). As summer energy absorption increases with earlier melt onset dates, positive ocean heat content anomalies in the near-surface temperature maximum (NSTM) layer increase in magnitude (Timmermans, 2015). At the end of the summer, the heat stored in the NSTM layer is then mixed toward the surface by shear-driven mixing and entrainment, delaying freeze onset (Perovich et al., 2007; Steele et al., 2008; Stroeve et al., 2012). For each day that freeze onset occurs later, an additional 1.5 MJ m−2 is absorbed by the surface (Perovich et al., 2007).
Relationships between sea ice extent and melt season length (Stroeve et al., 2014), and specifically between sea ice extent and melt onset date (Wang et al., 2011), have been found. Furthermore, because the timing of melt onset has a large impact on radiation absorption in the Arctic, observed melt onset dates have been used to predict freeze onset dates in some regions, such as Baffin Bay and the Laptev and East Siberian seas (Stroeve et al., 2016). The existence of these relationships raises the possibility that melt season biases might be contributing to biases in sea ice extent simulations.
Melt and freeze onset dates also have important ecological and societal implications in the Arctic. For example, delayed freeze onset has been shown to decrease snowpack on sea ice, thereby reducing the area that ringed seals can use for snow caves necessary for birthing (Hezel et al., 2012). Polar bears are also dependent on the timing of melt and freeze onset, as they use sea ice as a platform for seasonal hunting and breeding (Stern and Laidre, 2016). Moreover, prediction of melt onset dates is increasingly important for operational sea ice forecasts that inform local decision-making in the Arctic (Collow et al., 2015).
Previous efforts to assess melt onset, freeze onset and melt season length in climate models have used a variety of definitions, as no model definition of melt and freeze onset directly corresponds to remote sensing definitions (Holland and Landrum, 2015; Jahn et al., 2012; Johnson and Eicken, 2016; Mortin and Graversen, 2014; Wang et al., 2011, 2017). This inconsistent definition of melt and freeze onset complicates both comparisons between models and between models and observations. Furthermore, because of the chaotic nature of the climate system, there will always be a limit to how well model projections fit observations, even for trends of more than 35 years (Kay et al., 2015; Notz, 2015; Swart et al., 2015). In particular, it has been shown that the full CMIP5 distribution of 35-year September sea ice extent trends could be due to internal variability (Swart et al., 2015). Recent work suggests that sea ice trends similar to observations are only found in climate models with too much global warming (Rosenblum and Eisenman, 2017). But global warming, known to drive sea ice extent trends (Mahlstein and Knutti, 2012), is also strongly impacted by internal variability (Jahn, 2018). Furthermore, observational estimates of the sea ice sensitivity are highly uncertain due to observational uncertainties in both sea ice extent and global temperature (Niederdrenk and Notz, 2018).
Further complicating the issue, even observational assessments of melt season characteristics do not use just one definition of melt onset and freeze onset (Belchanksy et al., 2004; Bliss et al., 2017; Drobot and Anderson, 2001; Markus et al., 2009; Smith, 1998). Passive remote sensing techniques utilize brightness temperatures, which are sensitive to the changes in emissivity that occur when snow and ice change phase. Algorithms for deriving melt and freeze onset dates from brightness temperature vary in their methodologies, and differences between algorithms can arise from inconsistencies in source data, inter-sensor calibration, masking techniques and other factors (Bliss et al., 2017).
This study addresses two main questions: what are the impacts of different definition choices and internal variability on diagnosing and projecting Arctic sea ice melt season characteristics (melt onset, freeze onset and melt season length)? How can we use melt season characteristics from satellite observations for model evaluation, despite those effects? We seek to answer these questions by using the longest available satellite-derived melt and freeze onset dataset (Stroeve et al., 2014) to compare multiple plausible definitions of melt and freeze onset in the Community Earth System Model Large Ensemble (CESM LE) (Kay et al., 2015). By using the CESM LE, we are able to account for the role of internal variability and utilize daily model variables that are not available from the CMIP5 archive, thereby allowing us to assess the comparability of different melt and freeze onset definitions. We also show how melt and freeze onset dates and melt season length are projected to change by the end of the 21st century under a strong emission scenario (RCP8.5) and how internal variability and definition differences impact those projections.
In this study, we use both model and passive microwave (PMW) satellite data to assess the timing of continuous sea ice melt and freeze onset in the Arctic, defined here as north of 66∘ N. A map of the major Arctic seas and features referred to throughout the text is shown in Fig. S1 in the Supplement. Pan-Arctic means are taken between 66 and 84.5∘ N. Pan-Arctic trends in melt season characteristics are calculated as the slope of the least-squares linear regression of the pan-Arctic mean from 1979 to 2014. Individual grid cell trends in melt season characteristics are calculated where there are melt onset dates, freeze onset dates or melt season lengths available for at least 20 years of the 36-year period (as was done in Stroeve et al., 2014). Individual grid cell trends represent the slope of the least-squares linear regression of each melt season characteristic from 1979 to 2014.
2.1 Community Earth System Model Large Ensemble
To analyze the impact of different model definitions and internal variability on melt season characteristics, we use the CESM LE (Kay et al., 2015). The CESM LE is a 40-member ensemble of simulations conducted for the period 1920–2100. Each ensemble member starts from slightly different initial atmospheric conditions and is subject to historical forcing from 1920 to 2005 and RCP8.5 forcing from 2006 to 2100. The CESM LE uses CESM1-CAM5 (Hurrell et al., 2013), and has a nominal resolution of . The CESM LE has been used in multiple studies of Arctic sea ice cover, performing well overall (Barnhart et al., 2016; Jahn, 2018; Jahn et al., 2016; Labe et al., 2018; Massonnet et al., 2018; Rosenblum and Eisenman, 2017; Swart et al., 2015). Under RCP8.5 forcing, Arctic sea ice in the CESM LE first reaches September ice-free conditions by the middle of the 21st century (2032–2053 using monthly means of ice extent; Jahn et al., 2016). By the end of the 21st century, ice-free conditions persist for 4–5 months in most years (Jahn, 2018).
2.2 Passive microwave melt and freeze onset data
We utilize the PMW dataset of melt and freeze onset dates from Markus et al. (2009), updated by Stroeve et al. (2014), gridded to 25 km × 25 km (data accessed on 16 May 2016; available at the NASA Cryosphere Science Research Portal). This dataset applies the PMW melt and freeze onset algorithm to passive microwave brightness temperatures collected over the period 1979–2014 from the Nimbus 7 Scanning Multichannel Microwave Radiometer (SMMR), the Special Sensor Microwave/Imager (SSM/I) and the Special Sensor Microwave Imager and Sounder (SSMIS). The PMW algorithm uses brightness temperatures from the 37 V GHz and 19 V GHz (18 V GHz on SMMR) sensor channels.
Specifically, the PMW melt and freeze onset algorithm describes and utilizes three parameters (Δ37, GRice, P) based on brightness temperatures. The parameters are described in detail in Markus et al. (2009). The parameters are weighted based on their respective normalized expected ranges, and the sum of the weights is used to determine the dates of melt and freeze onset at each pixel for each year. In order to minimize the effects of noise in the data, the validity of the produced melt and freeze onset date is assessed at each pixel using the neighboring eight pixels. Dates are considered valid if more than four of the surrounding pixels do not vary by more than 1 day. In areas of thin ice, ice concentration information supplements the brightness temperature parameters. If no clear melt signal is available in thin ice areas, the melt onset date is taken as the day at which ice concentration drops below 80 % for the last time. Similarly, if no clear freeze signal is detected, the freeze onset date is taken as the first day at which ice concentration exceeds 80 %.
As noted earlier, other melt and freeze onset algorithms exist in addition to the PMW algorithm, such as the advanced horizontal range algorithm (AHRA). AHRA computes melt onset (but not freeze onset) over both first-year ice and multiyear ice based on passive microwave temperatures (Drobot and Anderson, 2001), improving upon earlier work that only provided melt onset over multiyear sea ice (Smith, 1998). While both the PMW and AHRA algorithms utilize passive microwave brightness temperatures, they are not equally sensitive to changes in brightness temperatures. The PMW dataset includes early melt and freeze onset dates as well as continuous melt and freeze onset dates. The former is defined as the first day of melt/freeze, while the latter is the day that melting or freezing conditions begin and persist throughout the rest of the season. Comparison of the PMW Combined data (which are composed of PMW early melt onset dates except when early melt is not detected, then the PMW continuous melt onset date is used) versus the AHRA data shows large mean differences in early melt onset dates and differences in trends over 1979–2012 (Bliss et al., 2017). When reproduced with the same inter-sensor calibration adjustments and masking techniques, trend agreement improves between PMW Combined and AHRA, but large differences in mean early melt onset dates remain (Bliss et al., 2017).
Because the PMW algorithm can be used to derive both melt and freeze onset dates across the entire Arctic for a 36-year period, the resulting data are best suited for climate model evaluation. In this study, we use the continuous melt and freeze onset dates so that we can determine the continuous melt season length. By using continuous melt season length, we aim to evaluate changes in season-long characteristics of the melt season. All further discussion of melt and freeze onset refers to continuous melt and freeze onset. Note that by using continuous melt and freeze onset dates, we use an observational melt season length definition that differs from the Stroeve et al. (2014) definition of melt season length, which incorporates early melt and freeze onset dates.
2.3 Model definitions of melt and freeze onset
Because climate models, including the CESM LE, do not simulate brightness temperatures, we cannot apply the same methodology as used in the PMW algorithm to define melt and freeze onset in the model. However, in contrast to PMW data, we can obtain the actual melt and freeze onset from physical variables in the model. Here, we define several melt and freeze onset dates from the existing daily output of the CESM LE that make physical sense to assess the importance of definition choices and their suitability for comparisons with the PMW data. Details of the definitions can be found in Table 1. In particular, we make use of daily means of snowmelt, surface temperature, frazil and congelation ice growth, and thermodynamic ice volume tendency. Of these, only surface temperature and thermodynamic ice volume tendency are available for all 40 ensemble members. All others were only saved for two ensemble members (34 and 35). Furthermore, the surface temperature is from the atmospheric model, while all other variables are from the sea ice model. To minimize errors associated with regridding, we generally use the variables on their original grid, which differs between the sea ice and atmospheric models in CESM. That means that surface temperature is only regridded onto the sea ice grid when necessary for melt season length calculations.
Table 1CESM LE definitions for melt and freeze onset, showing the model output variable name used, the threshold used and the number of consecutive days over which the variable must exceed the threshold for each definition. Details on how these thresholds and consecutive days were chosen can be found in the Supplement.
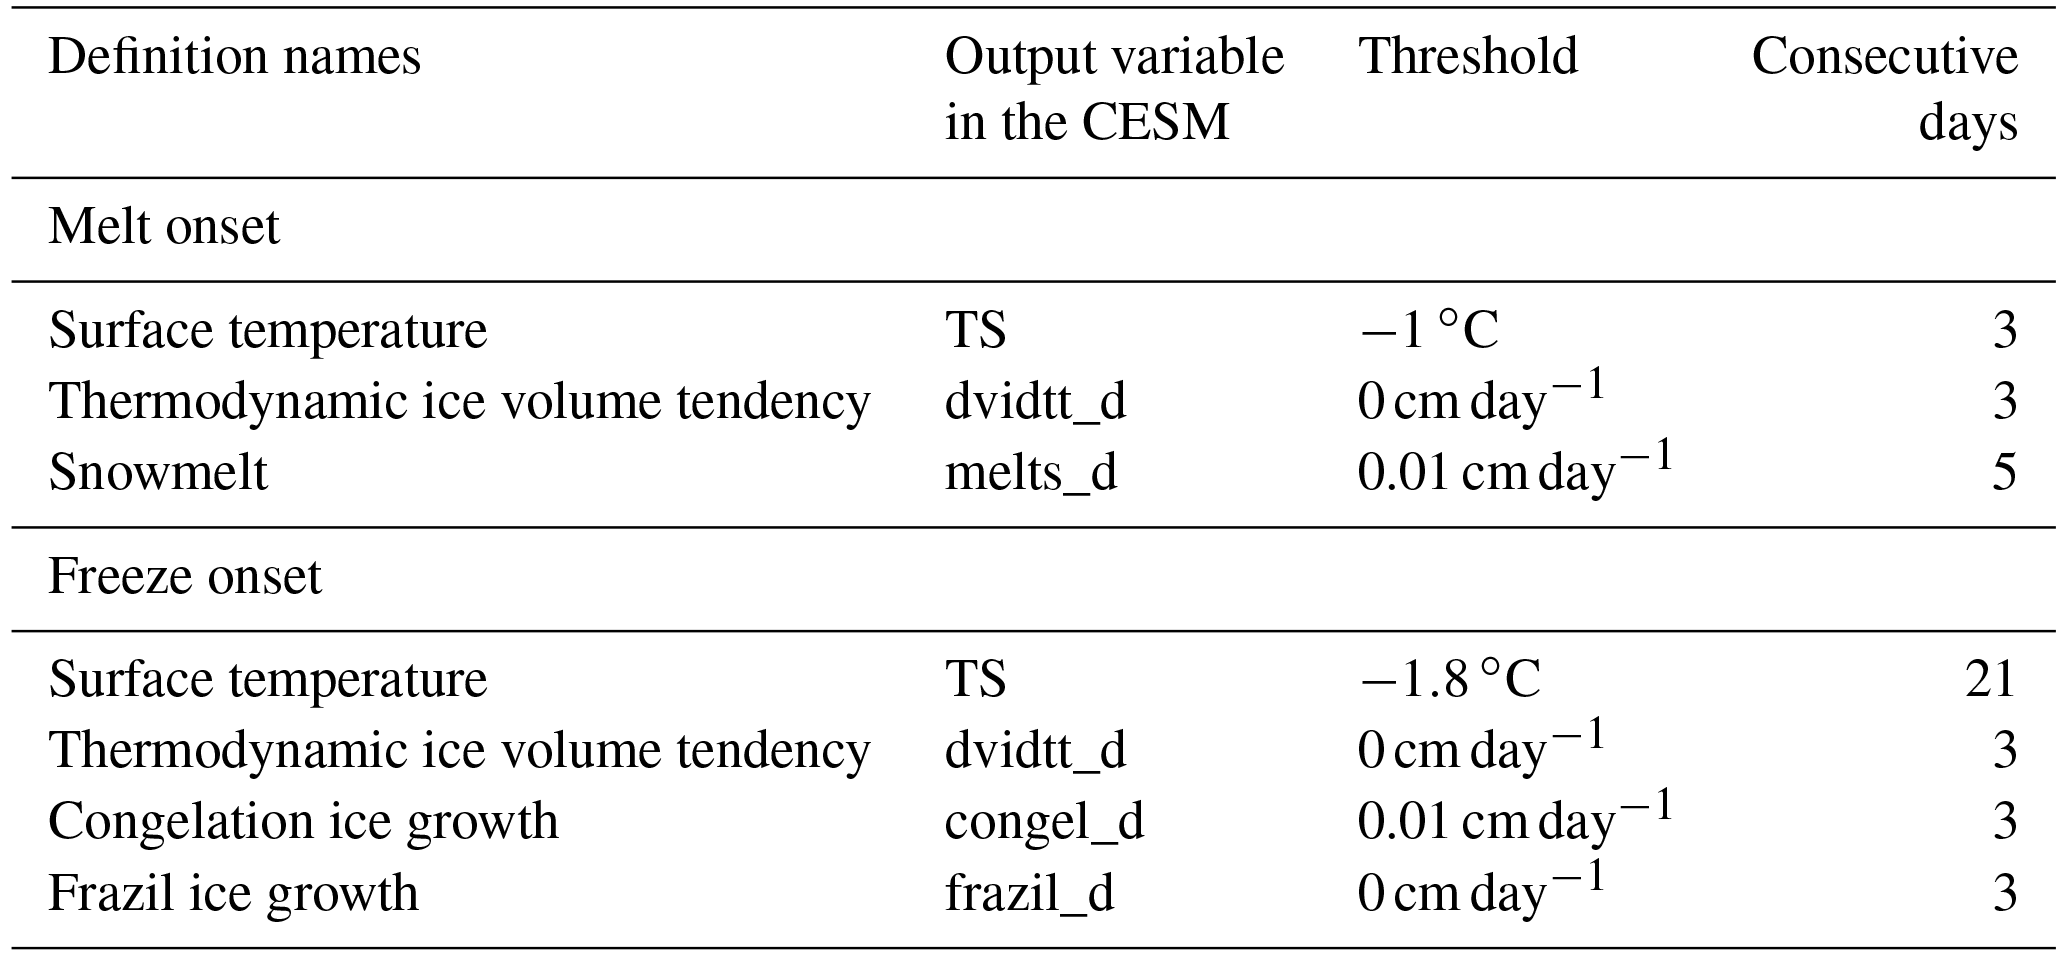
For melt onset in the CESM LE, we create three different definitions, based on the available output (Table 1): one definition using thermodynamic ice volume tendency (for all 40 members), a second using surface temperature where ice concentration is greater than zero (for all 40 members) and a third definition using snowmelt (for two members). We expect that the snowmelt definition matches the PMW definition most closely, as the brightness temperature melt criteria capture changes in liquid water content in the snow. The temperature criteria likely also capture snowmelt onset, but less directly than if melt onset is based on actual snowmelt. In contrast, the thermodynamic volume tendency captures the onset of surface, basal and lateral ice melt rather than snowmelt. These different CESM LE definitions of melt onset provide insight into a range of melt processes. While not all of them are expected to correspond to satellite observations, the differences in timing between the model definitions themselves may be important for certain applications, such as for biophysical processes (Jin et al., 2007) and the transport of sediments and contaminants by sea ice (Pfirman et al., 1995).
As the PMW is based on liquid water content in the snowpack, and the snowmelt definition is due to snowmelt itself, even the snowmelt melt onset definition likely does not correspond perfectly to the PMW-based definition. Furthermore, snowmelt is only saved in two ensemble members, which does not allow an assessment of the impact of internal variability on this definition. We will compare all three definitions in order to quantify how the diagnosed melt onset in the model varies based on the variable used.
For freeze onset in the CESM LE, we create four different definitions (Table 1): one using thermodynamic ice volume tendency (for all 40 members) and a second using surface temperature where ice concentration is greater than zero (for all 40 members). It is important for comparisons with PMW observations that we define freeze onset using both surface temperature and thermodynamic ice volume tendency, since refreezing of liquid water in the snow on sea ice is not accounted for as ice growth in the CESM LE. In the CESM LE, thermodynamic ice volume tendency is a sum of congelation ice growth along existing sea ice and frazil ice growth in the water column. Thus, only a surface-temperature-based definition is able to capture potential freeze onset processes within the snowpack, which are detected in satellite observations. We also create two additional freeze onset definitions using frazil ice growth and congelation ice growth, in order to compare the impact of these two ice growth processes.
Table 2CESM LE definitions for melt season length, showing the various melt and freeze onset definition combinations used to compute melt season length. For each combination, the melt onset date is subtracted from the freeze onset date at each grid cell every year.
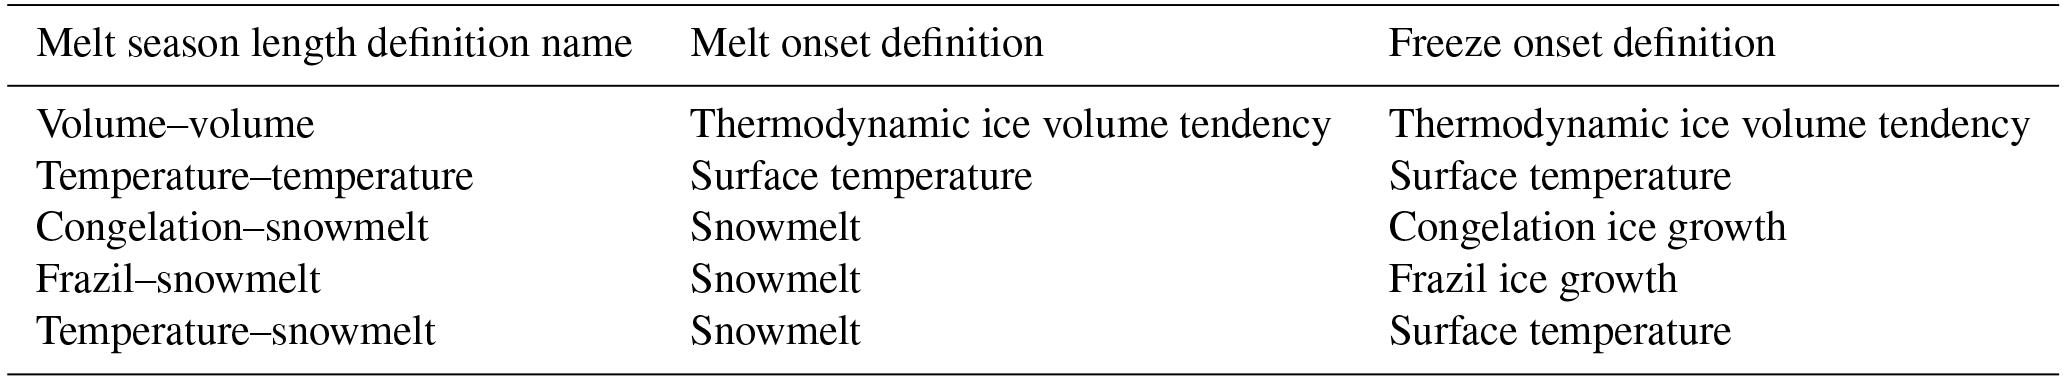
Melt season length is calculated at each grid cell for each year as the difference between local freeze onset date and melt onset date. In total, we create five unique definitions of melt season length, which are detailed in Table 2. Two definitions of melt season length keep like variables together (i.e., use both melt and freeze onset dates from surface temperature definitions or thermodynamic volume tendency definitions), while the other three combine variable definitions (e.g., use melt onset dates from the snowmelt definition and freeze onset dates from the frazil ice growth definition) in order to span the full range of possible melt season length definitions in the CESM.
Three key definition decisions were found to impact the melt and freeze onset definitions in the CESM LE. (1) The period over which one should check for melt and freeze onset, (2) the threshold each variable must meet for melt and freeze onset and (3) the number of consecutive days each definition must pass the threshold for melt and freeze onset to occur. The choices are shown in Table 1. Decisions on these three components were based on what makes physical sense, whether they provide sensible continuous melt and freeze onset dates and the percent area of the Arctic where melt and freeze onset conditions are met. Details on the reasons for each of these choices can be found in the Supplement. We did not use any smoothing techniques such as running means or medians, which were used in other studies (Holland and Landrum, 2015; Mortin and Graversen, 2014). We found that smoothing techniques excessively reduce the number of times that the melt and freeze onset criteria are met in the CESM LE, at least for some variables. Details can be found in the Supplement.
3.1 CESM LE definitions: average melt season characteristics
3.1.1 Pan-Arctic averages
Using the definitions described in Sect. 2.3, we find that there are large differences in the pan-Arctic averages of melt season characteristics between CESM LE definitions (Fig. 1). To quantify pan-Arctic definition differences, we define the spread as the average difference between the earliest and latest melt and freeze onset definitions over 1979–2014, as well as the difference between the shortest and longest melt season length definitions over this time period. Here we discuss only ensemble member 35, as differences in spreads between ensemble members 34 and 35 are small (Figs. 1 and S2). We find that the spread in pan-Arctic melt onset definitions in the chosen ensemble member is 35 days, due largely to the early melt onset dates from the thermodynamic ice volume tendency definition, which captures ice melt (including basal melt; see Sect. 3.1.2 for a discussion of the spatial fields, which explains the large spread). This spread of 35 days in melt definitions is much larger than the 13-day spread found between the freeze definitions. The large spread in melt onset dates also affects differences between melt season length definitions, leading to a spread of 43 days in ensemble member 35. Note that spreads in pan-Arctic melt and freeze onset do not sum to the spread in melt season length, as the melt season length is calculated at each grid cell and not as a difference in the pan-Arctic means.
Internal variability introduces additional differences in diagnosed pan-Arctic melt onset, freeze onset and melt season length (Fig. 2). However, these are much smaller than the definition spreads, ranging between 4 and 8 days. Average melt onset dates are less impacted by internal variability than average freeze onset dates, based on the temperature and thermodynamic ice volume tendency definitions where all 40 ensemble members are available. Pan-Arctic melt onset dates fall within a range of 5 days, while pan-Arctic freeze onset dates fall within a range of 8 days. Average melt season length is affected by internal variability similarly to average freeze onset dates, with a range of 7 days in both definitions.
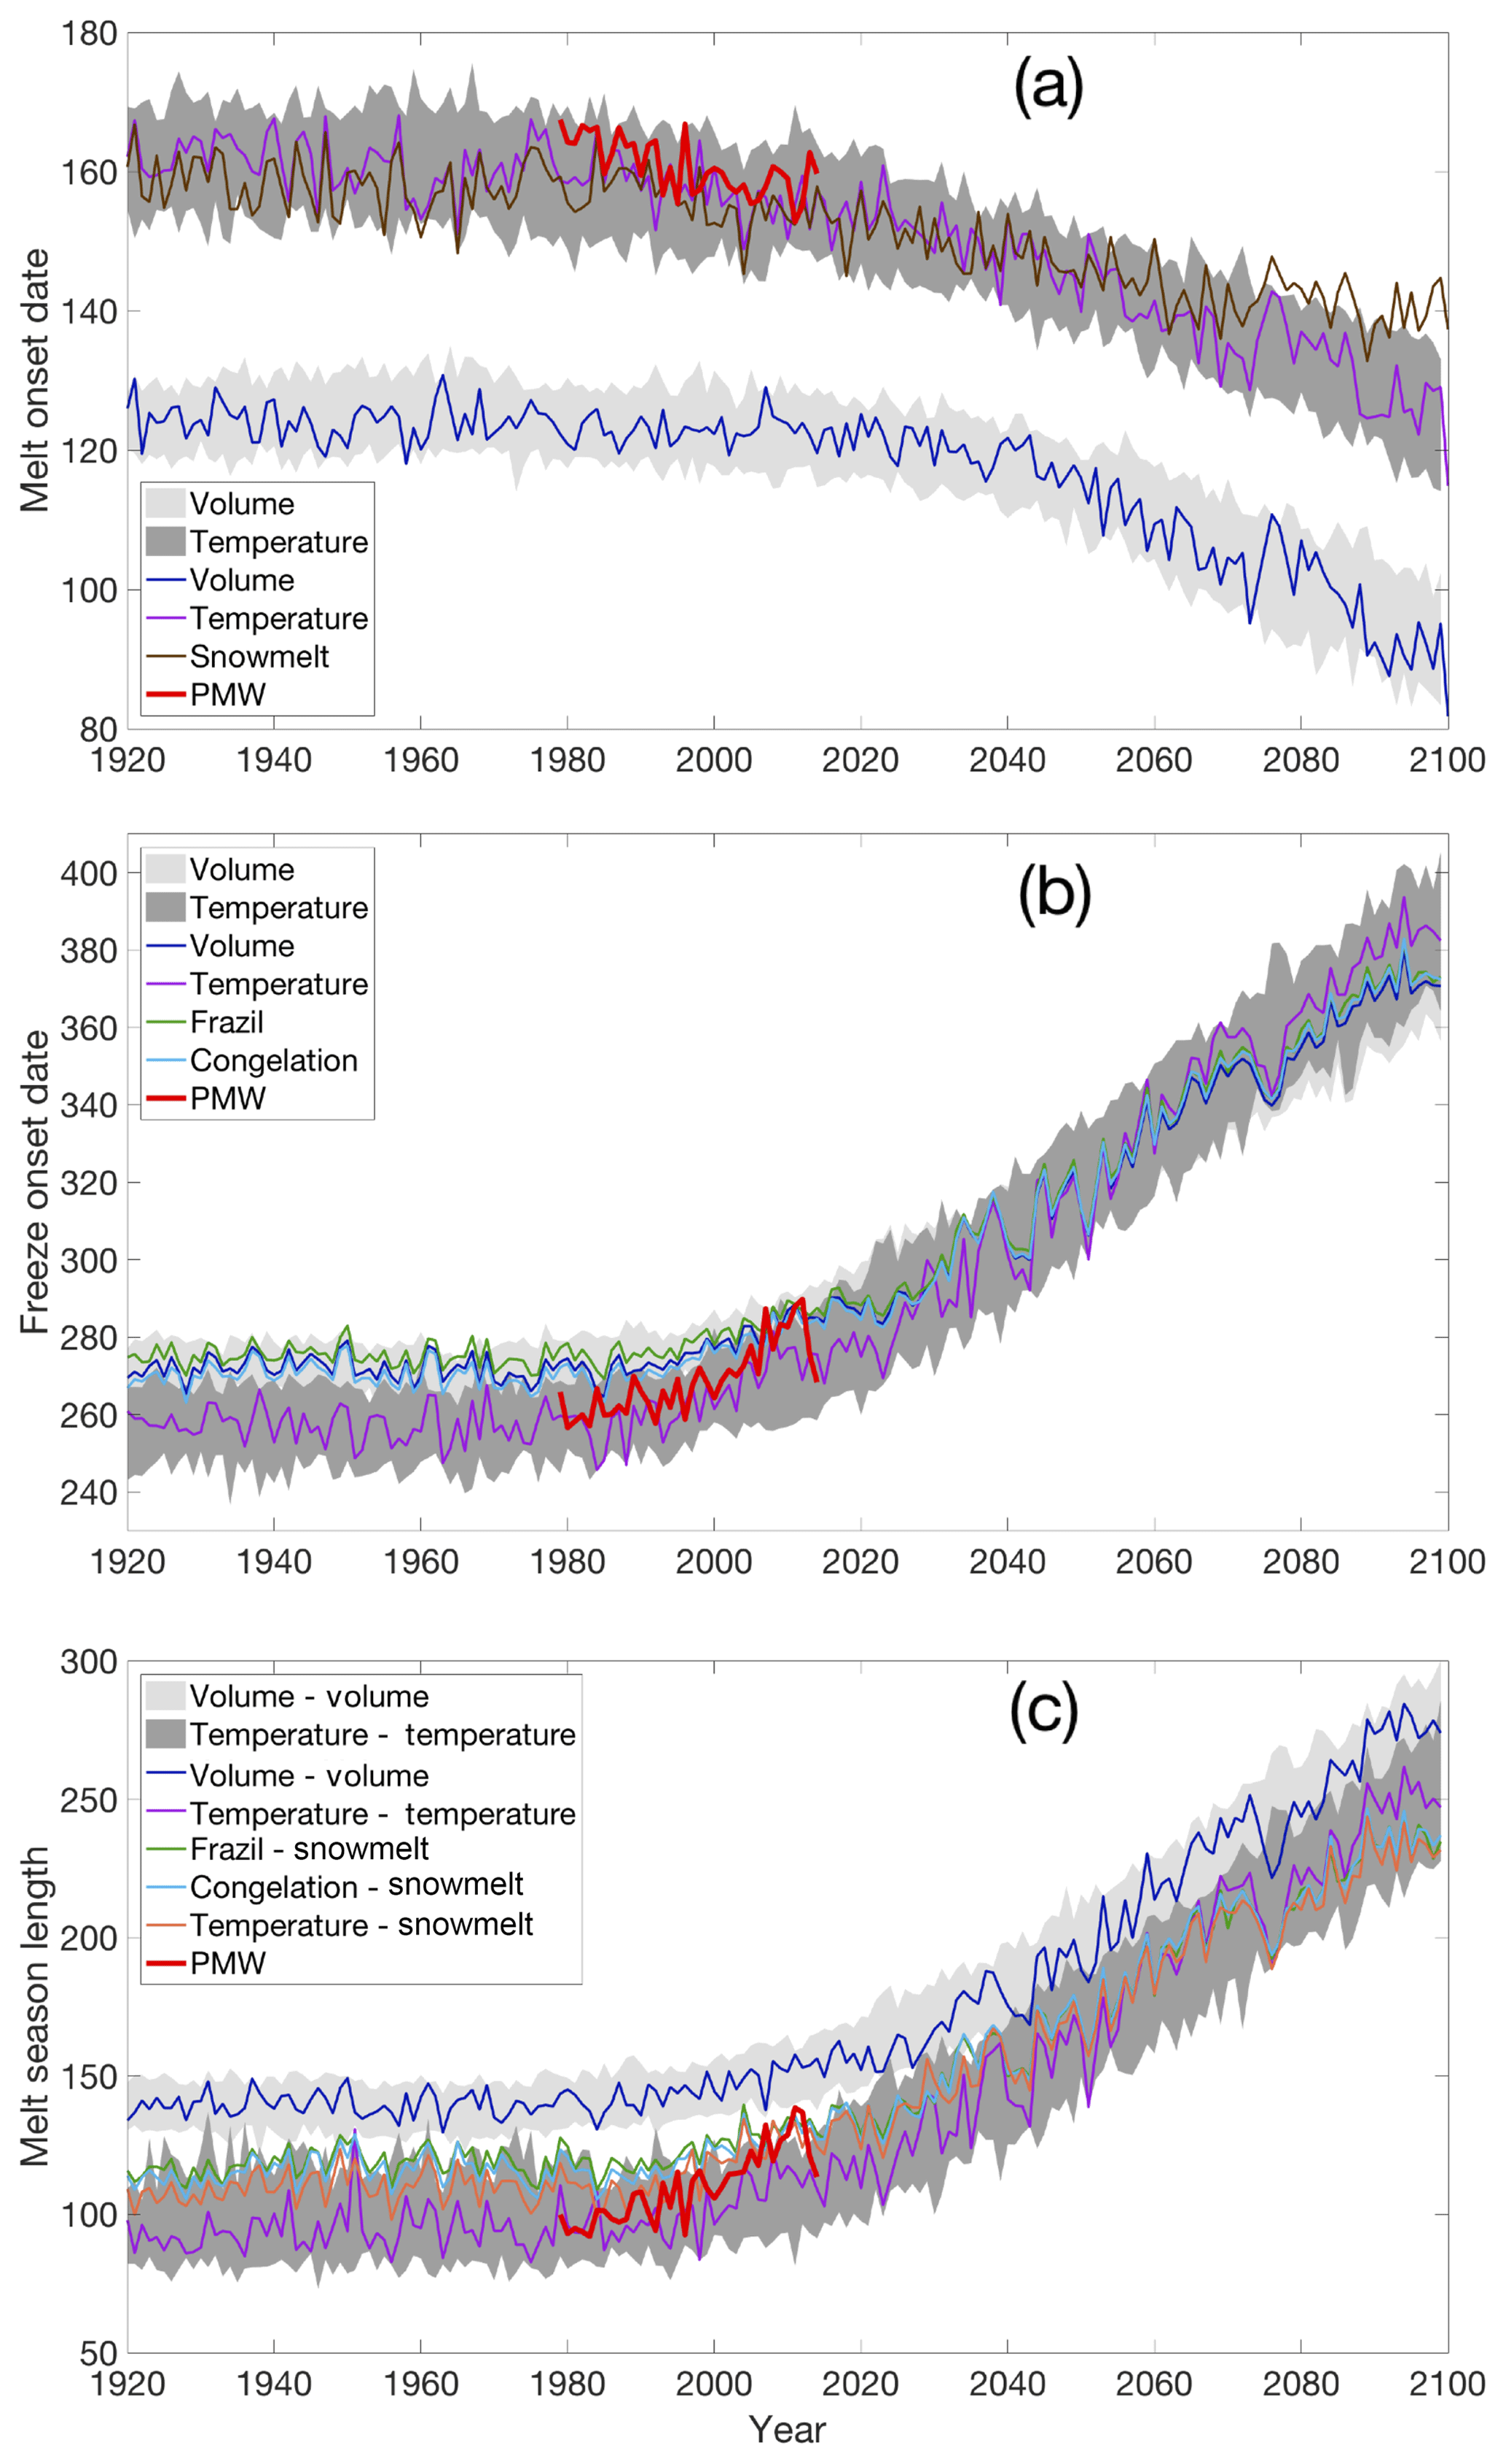
Figure 1Melt season characteristics averaged over 66 to 84.5∘ N for PMW satellite observations and each CESM LE definition for (a) melt onset, (b) freeze onset and (c) melt season length. PMW satellite observations are shown in red. Other colored lines represent ensemble member 35, and the gray shading represents the ensemble spread for the two definitions (surface temperature and thermodynamic ice volume tendency) that have 40 ensemble members. Plots are reproduced with member 34 in colored lines in Fig. S2.
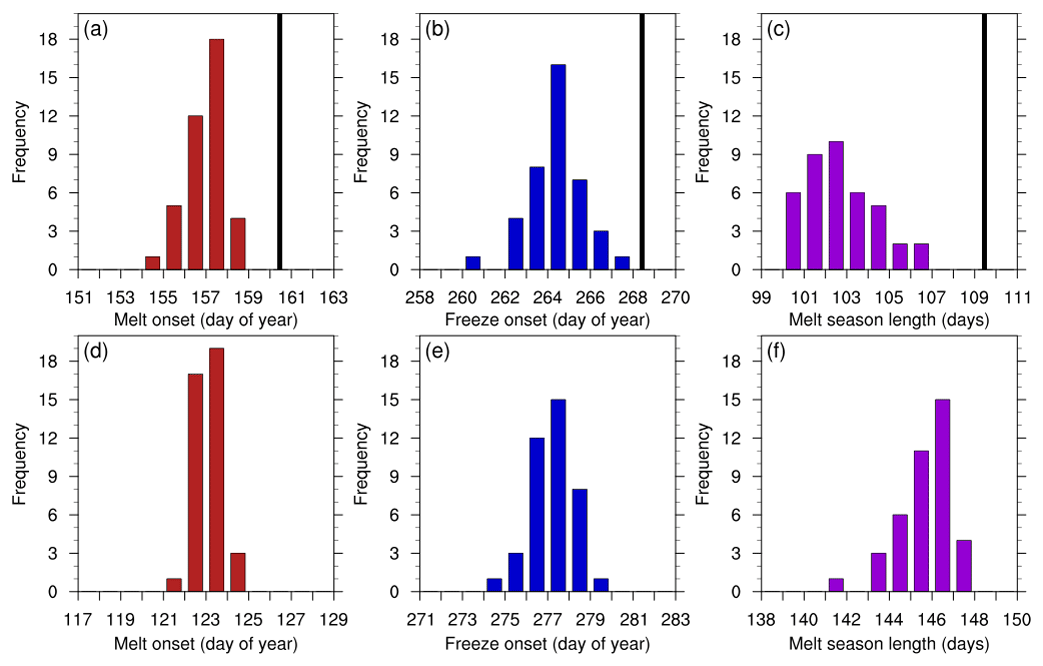
Figure 2Histograms of the pan-Arctic average melt season characteristics over 1979–2014 using the surface temperature definitions (a–c) and thermodynamic ice volume tendency definitions (d–f) for all 40 CESM LE ensemble members, showing the impact of internal variability. PMW observations are denoted by black lines (a–c). Note that the x-axis limits are different in each panel, but the range is the same (12 days), to facilitate the assessment of the impact of internal variability for different processes and definitions.
3.1.2 Spatial averages
Areas in the marginal ice zone have earlier melt onset dates and later freeze onset dates than those in the central Arctic, but specific spatial distributions of average melt season characteristics in the CESM LE depend on the definition. For example, melt onset derived from the snowmelt definition occurs in mid-June to late June in the central Arctic and parts of the Laptev Sea (Fig. 3a). Melt onset dates in the surface temperature definition are generally later than in the snowmelt definition (Fig. 3b), with mid-June to late June melt onsets stretching from the central Arctic into the East Siberian, Chukchi and Beaufort seas. The thermodynamic ice volume tendency melt onset definition yields central Arctic melt onset dates about 10 days earlier than the other definitions, as well as earlier onset dates in the Barents and Chukchi seas (Fig. 3c). Average melt onset dates from the thermodynamic ice volume tendency definition over the satellite era are earlier in the inflow regions than those derived from surface definitions in the CESM LE (snowmelt, surface temperature) and PMW observations, since the thermodynamic ice volume tendency definition reflects basal melt during spring. Spring basal melt in the CESM LE is largest in the inflow regions, particularly in the Greenland and Barents seas. Averages of melt season characteristics over 1979–2014 are similar for ensemble members 34 (shown in Figs. S3–S5) and 35 (Figs. 3–5), as the impact of internal variability on the 36-year means of the selected variables is small.
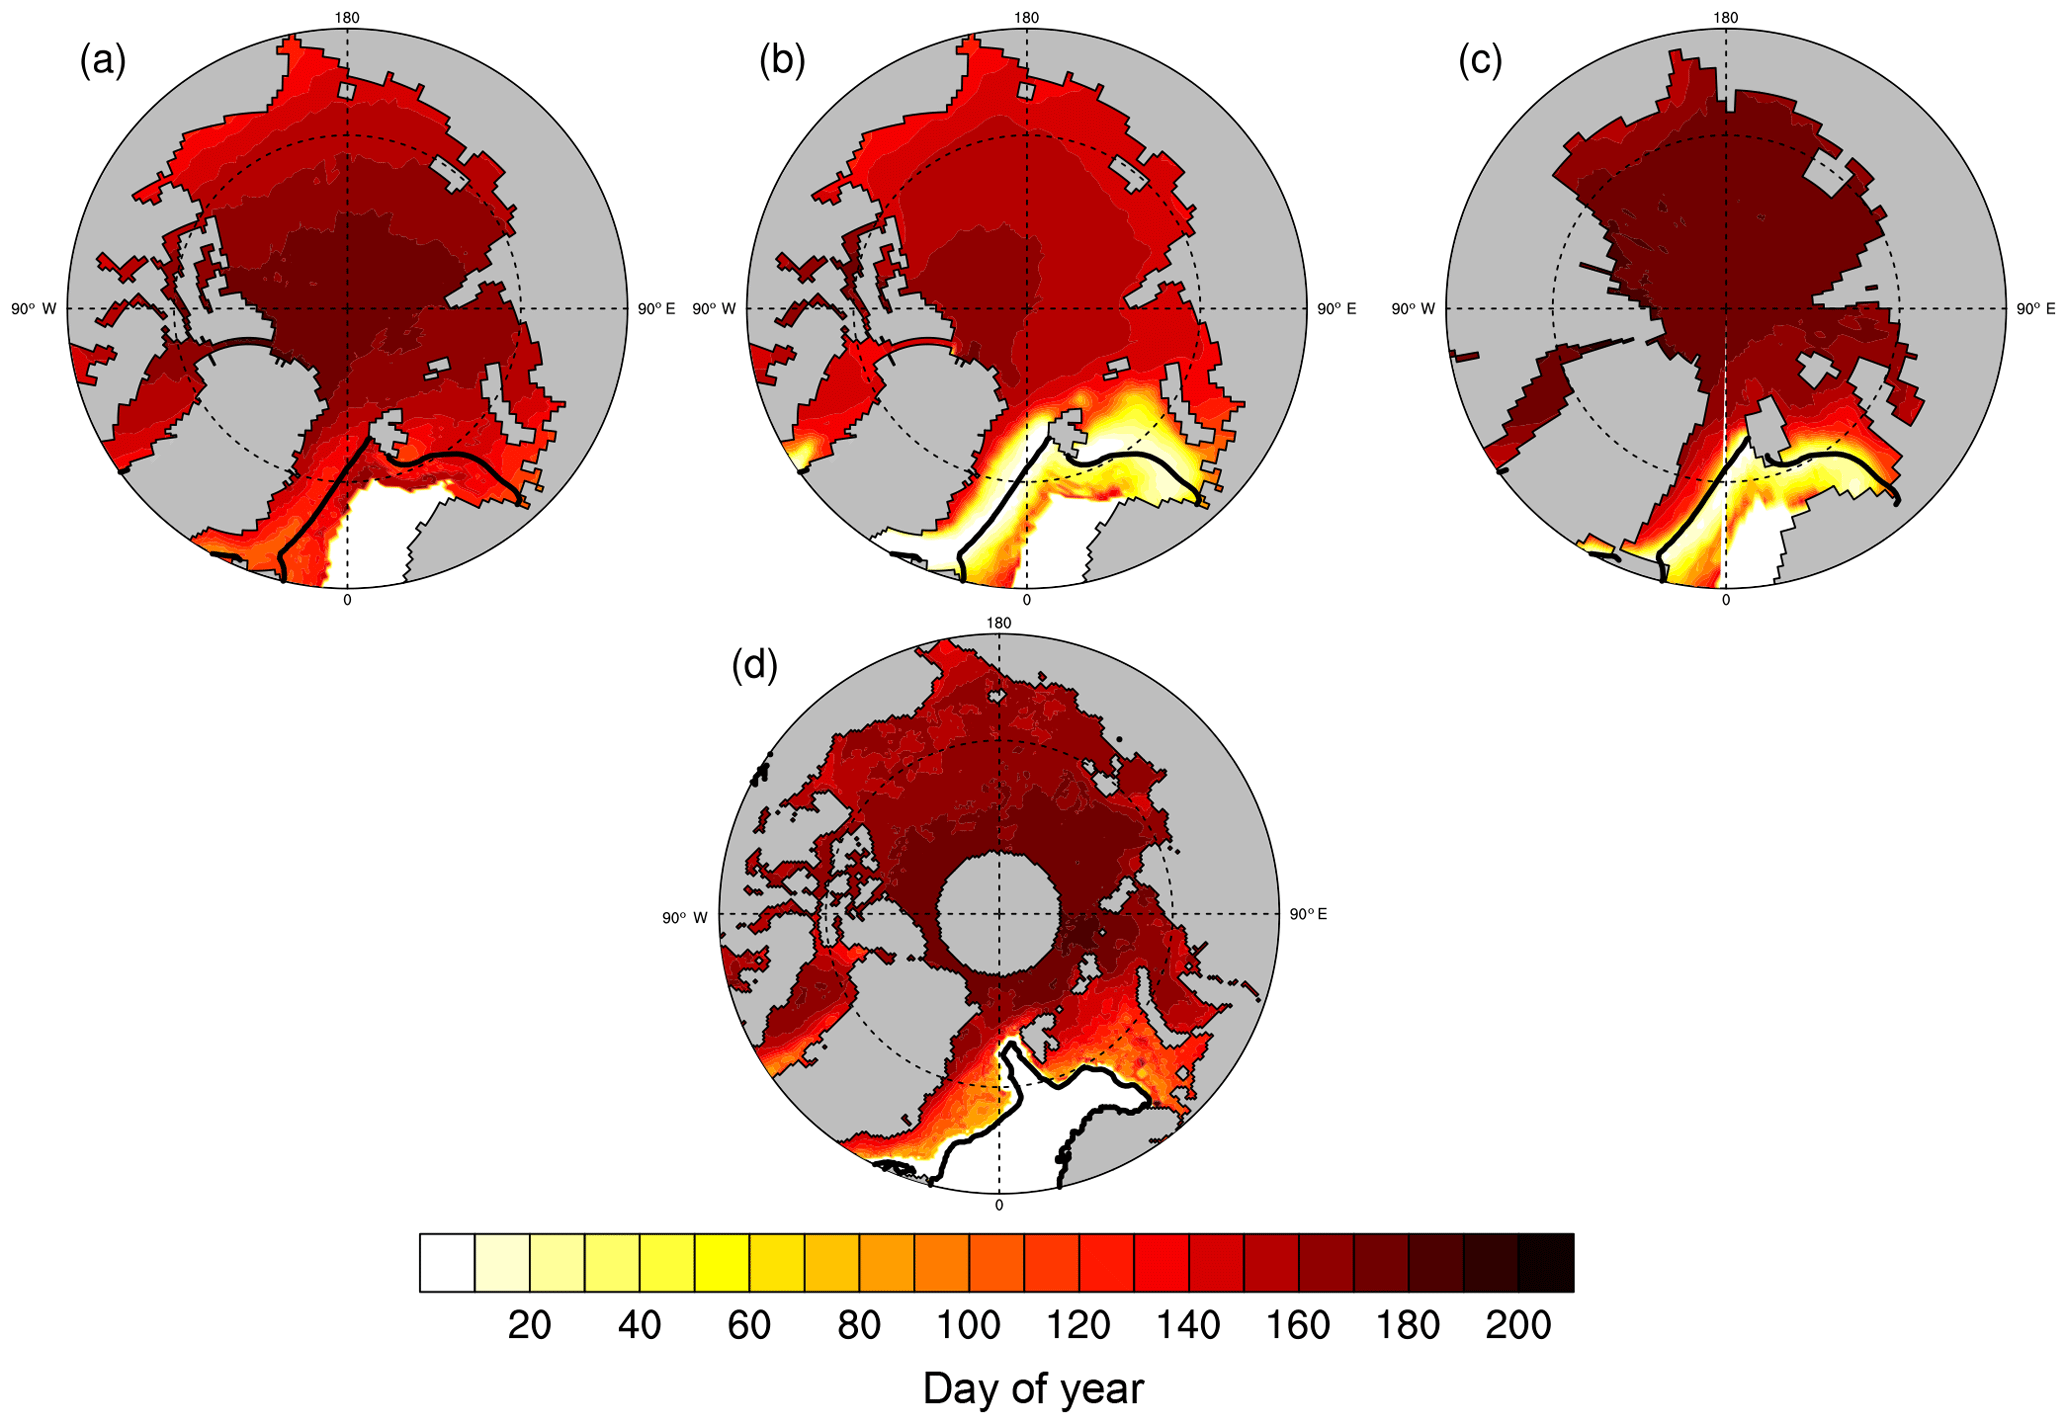
Figure 3Average melt onset dates over 1979–2014 for each CESM LE definition using ensemble member 35: (a) snowmelt definition, (b) thermodynamic ice volume tendency definition, (c) surface temperature definition and (d) PMW satellite observations. The black line denotes the mean March ice edge (15 % ice concentration) from 1979 to 2014 using (a–c) the CESM LE and (d) NSIDC Bootstrap sea ice concentrations (Comiso, 2017). Melt onset dates south of the mean ice edge are less reliable than those north of the edge. Plots from ensemble member 34 are very similar and shown in Fig. S3.
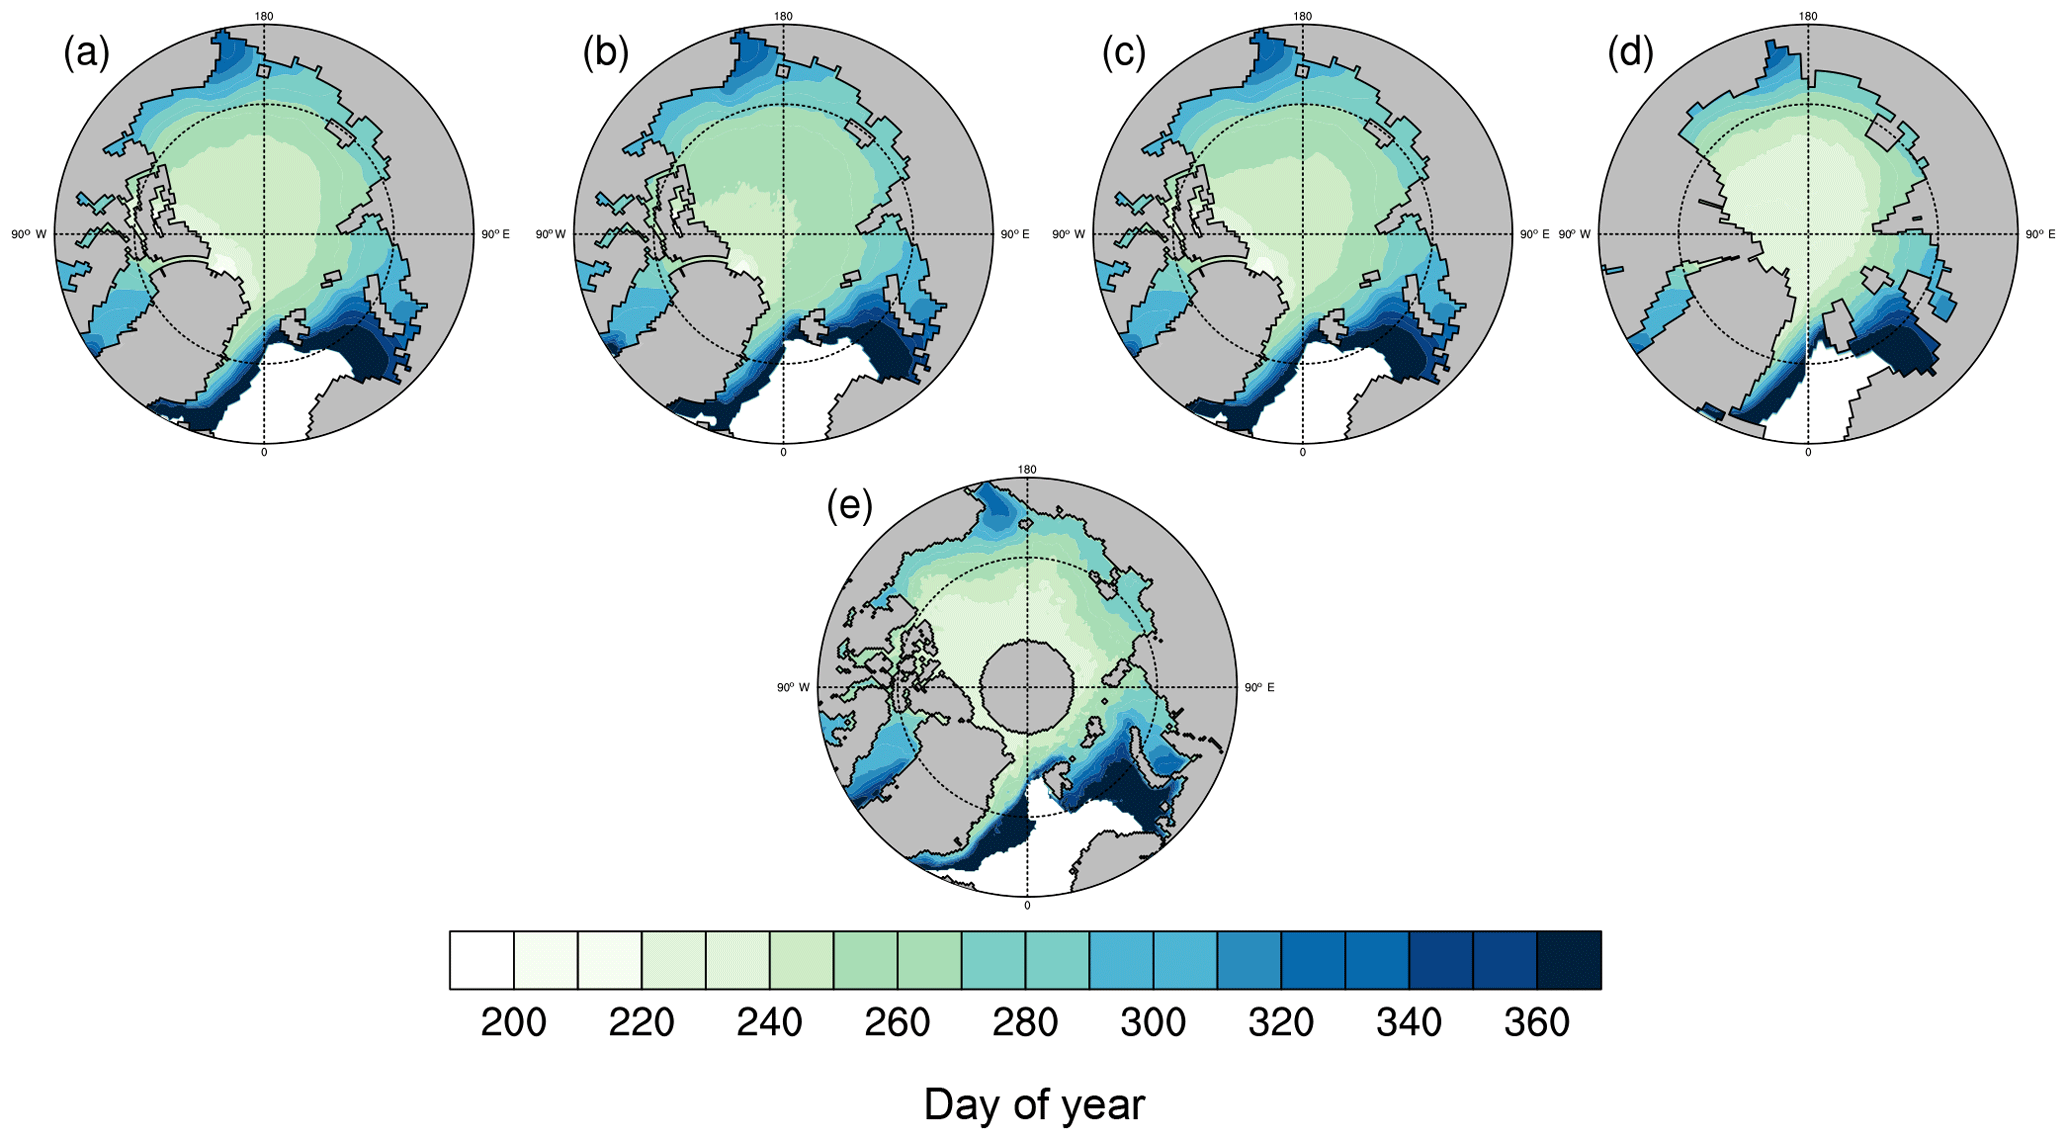
Figure 4Average freeze onset dates for 1979–2014 for each CESM LE definition using ensemble member 35: (a) congelation ice growth definition, (b) frazil ice growth definition, (c) thermodynamic ice volume tendency definition, (d) surface temperature definition and (e) PMW satellite observations. Plots from ensemble member 34 are very similar and shown in Fig. S4.
Average freeze onset dates over the satellite era also vary spatially by definition (Fig. 4a–e). In the central Arctic, the surface temperature definition yields freeze onset dates in early August to mid-August. Freeze onset definitions based on sea ice variables also show early August to mid-August freeze onset dates in the region north of the Canadian Arctic and Greenland, but later freeze onset dates throughout the rest of the central Arctic. In all definitions, there are strong gradients in freeze onset in the marginal seas. For example, in the Chukchi Sea, which is impacted by Pacific water inflow, freeze onset occurs between mid-September and the end of November. Even stronger gradients exist in the Barents Sea, which is impacted by Atlantic inflow. Strong gradients in the marginal ice zones are expected, as these areas show the largest trends in winter ice loss and are impacted most strongly by sensible and latent heat fluxes (Deser et al., 2000).

Figure 5Average melt season lengths over 1979–2014, for each CESM LE definition using ensemble member 35: (a) congelation–snowmelt, (b) frazil–snowmelt, (c) volume–volume, (d) temperature–snowmelt, (e) temperature–temperature and (f) PMW satellite observations. Plots from ensemble member 34 are very similar and shown in Fig. S5.
As expected, all definitions show the shortest melt seasons in the central Arctic and the longest melt seasons in the marginal seas. Melt seasons along the Atlantic ice edge and in the Barents Sea are particularly long relative to the other marginal seas (Fig. 5). However, the previously discussed differences in melt and freeze onset dates between definitions are noticeable when comparing definitions of melt season length. For example, thermodynamic ice volume tendency melt onset dates (which occur earlier than in the other definitions) drive the longer melt season lengths found along the Atlantic ice edge and in the Barents Sea when using the volume–volume definition (Fig. 5c). Additionally, in the Laptev Sea, surface temperature melt onset dates are later than those from the other definitions, and this drives shorter melt season lengths in the temperature–temperature definition than the other CESM LE definitions by about 25 days (Fig. 5e).
3.2 CESM LE definitions: trends in melt season characteristics
3.2.1 Pan-Arctic trends
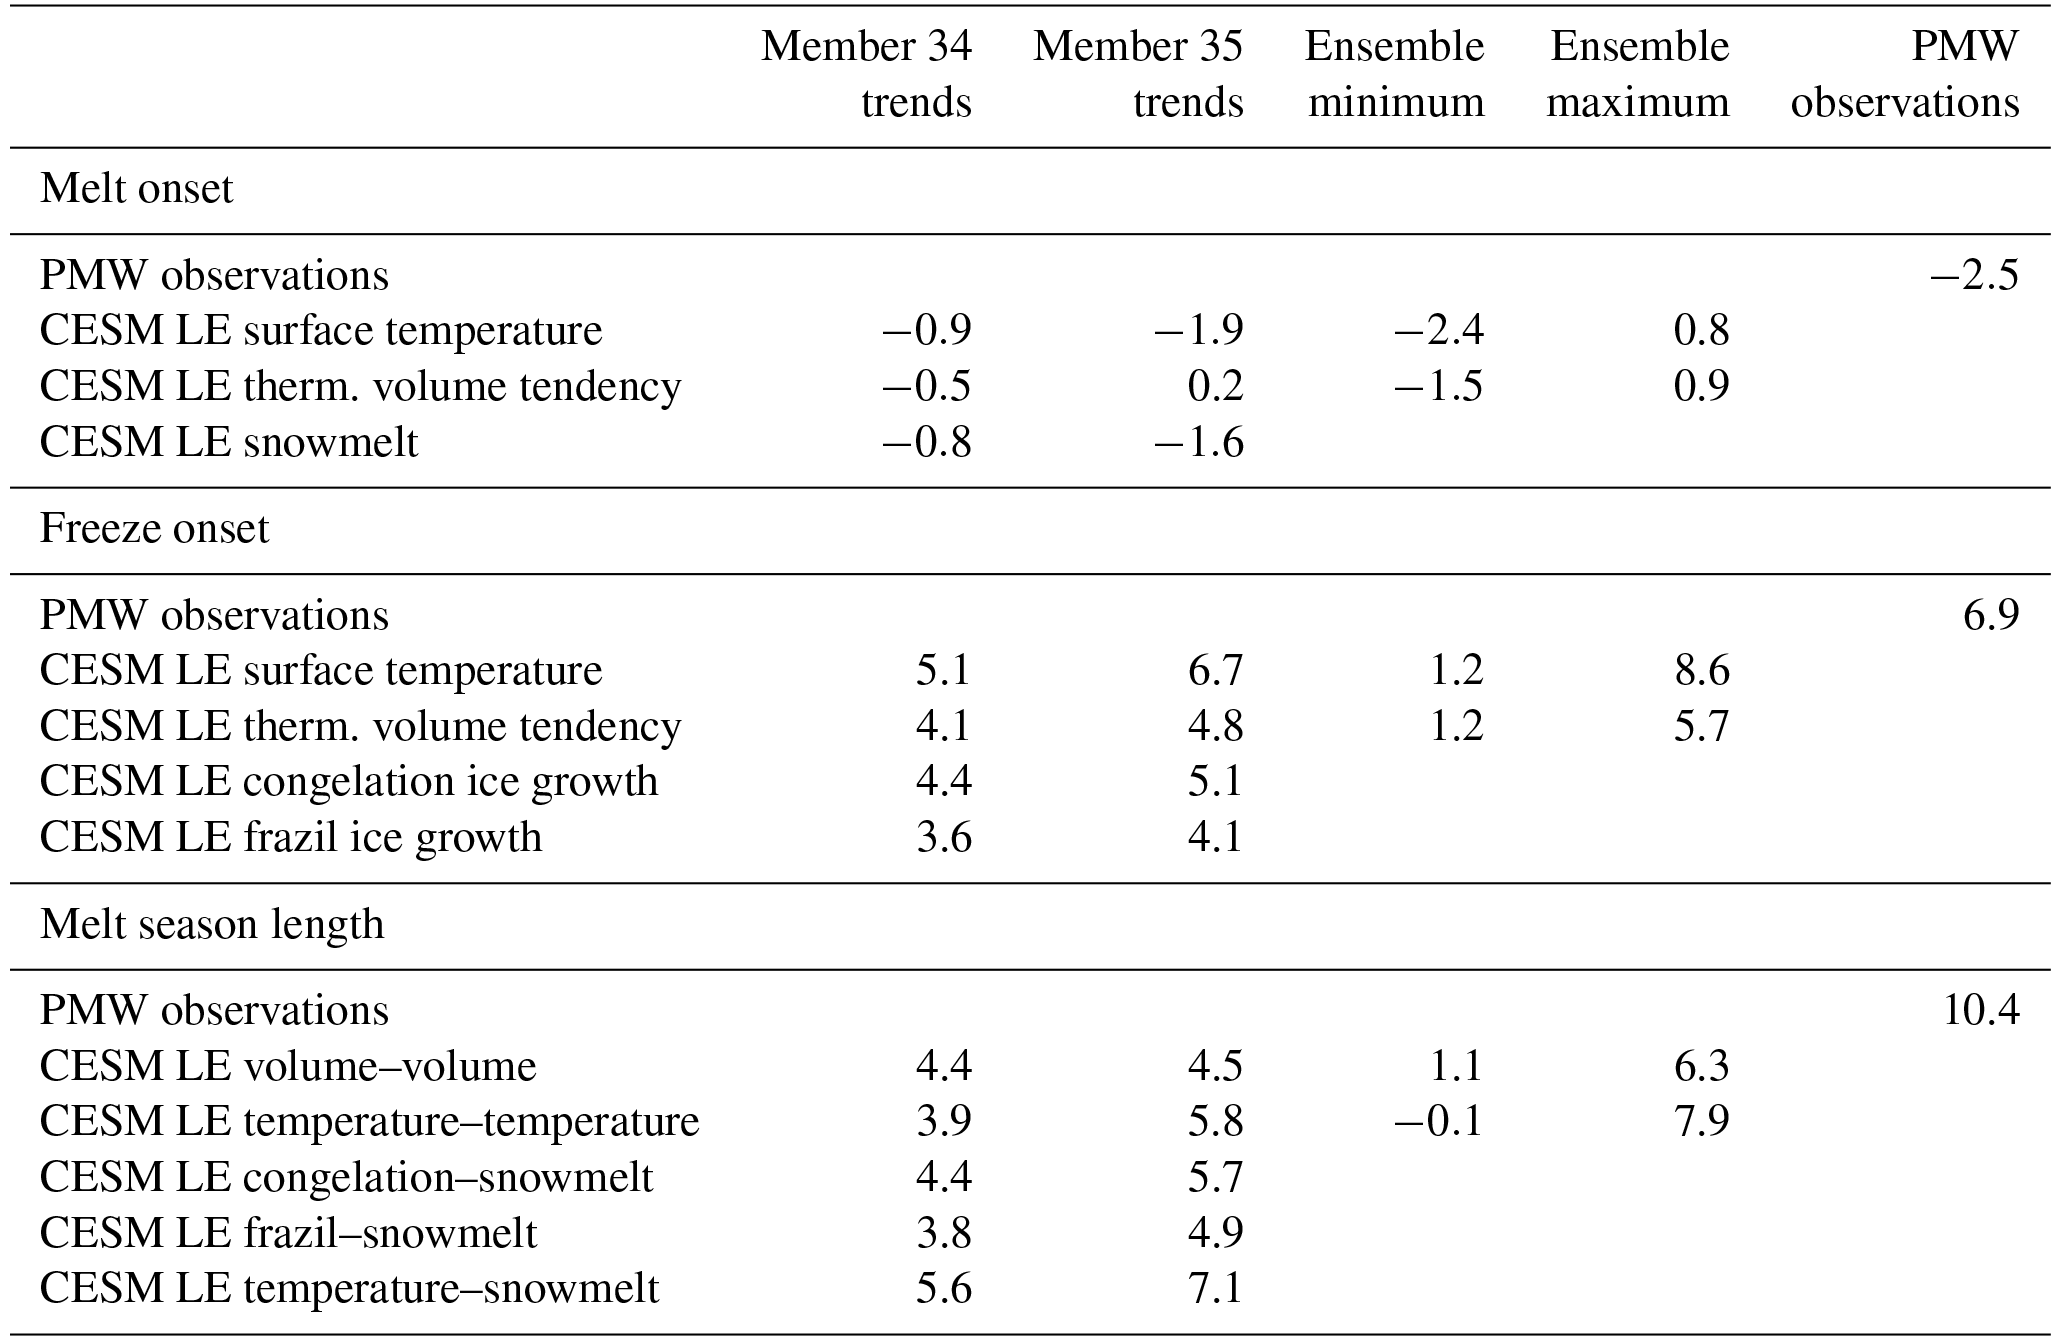
Definitions in the CESM LE generally show pan-Arctic melt onset dates trending earlier and pan-Arctic freeze onset trending later over the period 1979–2014 (Table 3, Fig. 6), in agreement with previous work (Johnson and Eicken, 2016; Mortin and Graversen, 2014; Stroeve et al., 2014). But in the CESM LE, internal variability affects the magnitude of these 36-year trends, and in a few cases for melt onset and melt season length even the sign of the trends. The large effect of internal variability on these trends is already evident when comparing trends between ensemble members 34 and 35 (Table 3). Ensemble member 35 shows larger pan-Arctic trends than ensemble member 34 over 1979–2014 for almost all model definitions and melt season characteristics. The only exception is the trend in melt onset derived from thermodynamic ice volume tendency, which is the smallest trend in both ensemble members, and shows a negative trend in member 34 but a small positive trend in member 35 (Table 3). The impact of internal variability on the 1979–2014 melt onset trends is even more pronounced using the full 40-member CESM ensemble, where melt onset trends fall between −2.4 and 0.8 days decade−1 for the surface temperature and thermodynamic volume tendency definitions (Fig. 6). However, all members show negative 36-year melt onset trends for the rest of the model simulation if we shift the trend start year to 1990 for the surface temperature definition and to 2008 for the volume tendency definition. This shows that forced melt onset trends over the observed period can be masked by internal variability for some of the definitions of melt onset in the model.
Pan-Arctic freeze onset trends in the CESM LE are larger than trends in melt onset in all 40 ensemble members, regardless of definition, and are always positive over the satellite era (indicating later freeze onset). The 36-year trends in freeze onset are positive throughout the remainder of the model simulation as well. The surface temperature definition of freeze onset yields the largest trend over the satellite era in ensemble members 34 and 35 (Table 3). The maximum trend of all ensemble members is also larger in the surface temperature definition than in the thermodynamic volume tendency definition (Table 3). In Fig. 2, the pan-Arctic average freeze onset dates are more affected by internal variability than the averages melt onset dates. This is true for the pan-Arctic trends as well: there is greater variability between ensemble members in the freeze onset trends than in the melt onset trends (Fig. 6).
Table 3Trends in pan-Arctic melt onset, freeze onset and melt season length (days decade−1) over 1979–2014 using PMW observations and CESM LE definitions.
Relative to the magnitude of the pan-Arctic trends from 1979 to 2014, the impact of internal variability is very large. For melt onset in the CESM LE, the range of ensemble trends due to internal variability is larger than the magnitude of the melt onset trends. Internal variability even leads to melt onset trends of both signs, even though trends towards earlier melt onset dates dominate. Freeze onset trends over the satellite era are all positive, but the ensemble spread due to internal variability of 7.4 days decade−1 is larger than most of the trends in all ensemble members except two (7.5 and 8.6 days per decade, both found using the surface temperature definition).
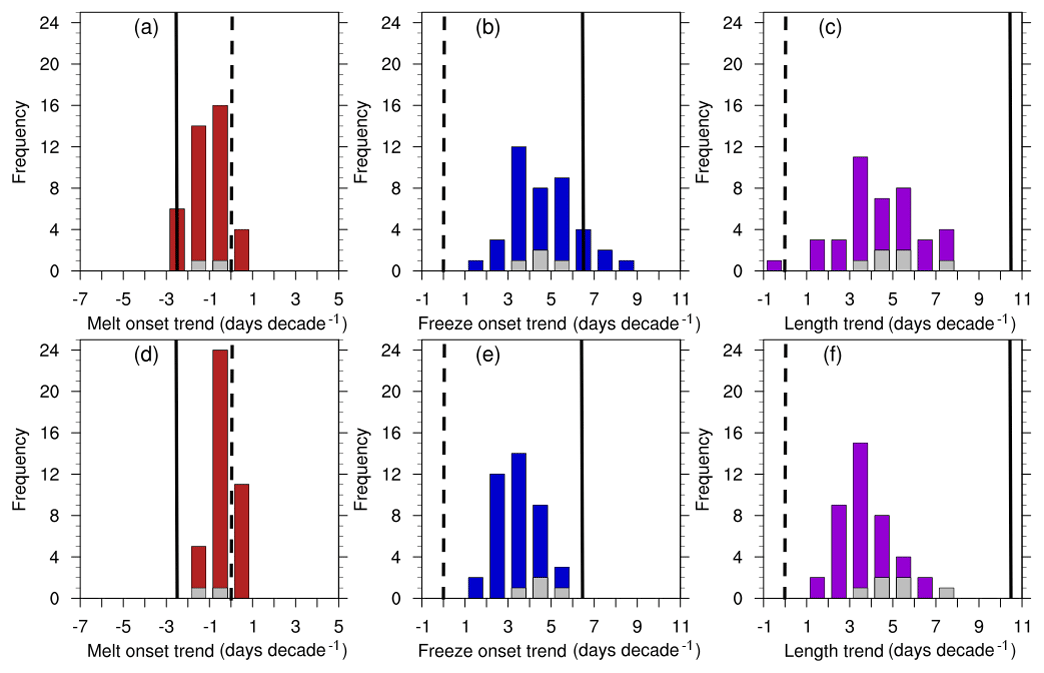
Figure 6Histograms of the trends in pan-Arctic melt season characteristics over 1979–2014 using the surface temperature definitions (a–c) and thermodynamic volume tendency definitions (d–f) for all 40 CESM LE ensemble members. Gray bars represent trends from the other CESM LE definitions for ensemble members 34 and 35. PMW observations are denoted by solid black lines. The zero line is denoted by dashed black lines. Given the magnitude of the trends, the internal variability is very large. Note that the x-axis limits are different in each panel, but the range is the same (12 days decade−1), to facilitate the assessment of the impact of internal variability for different processes and definitions.
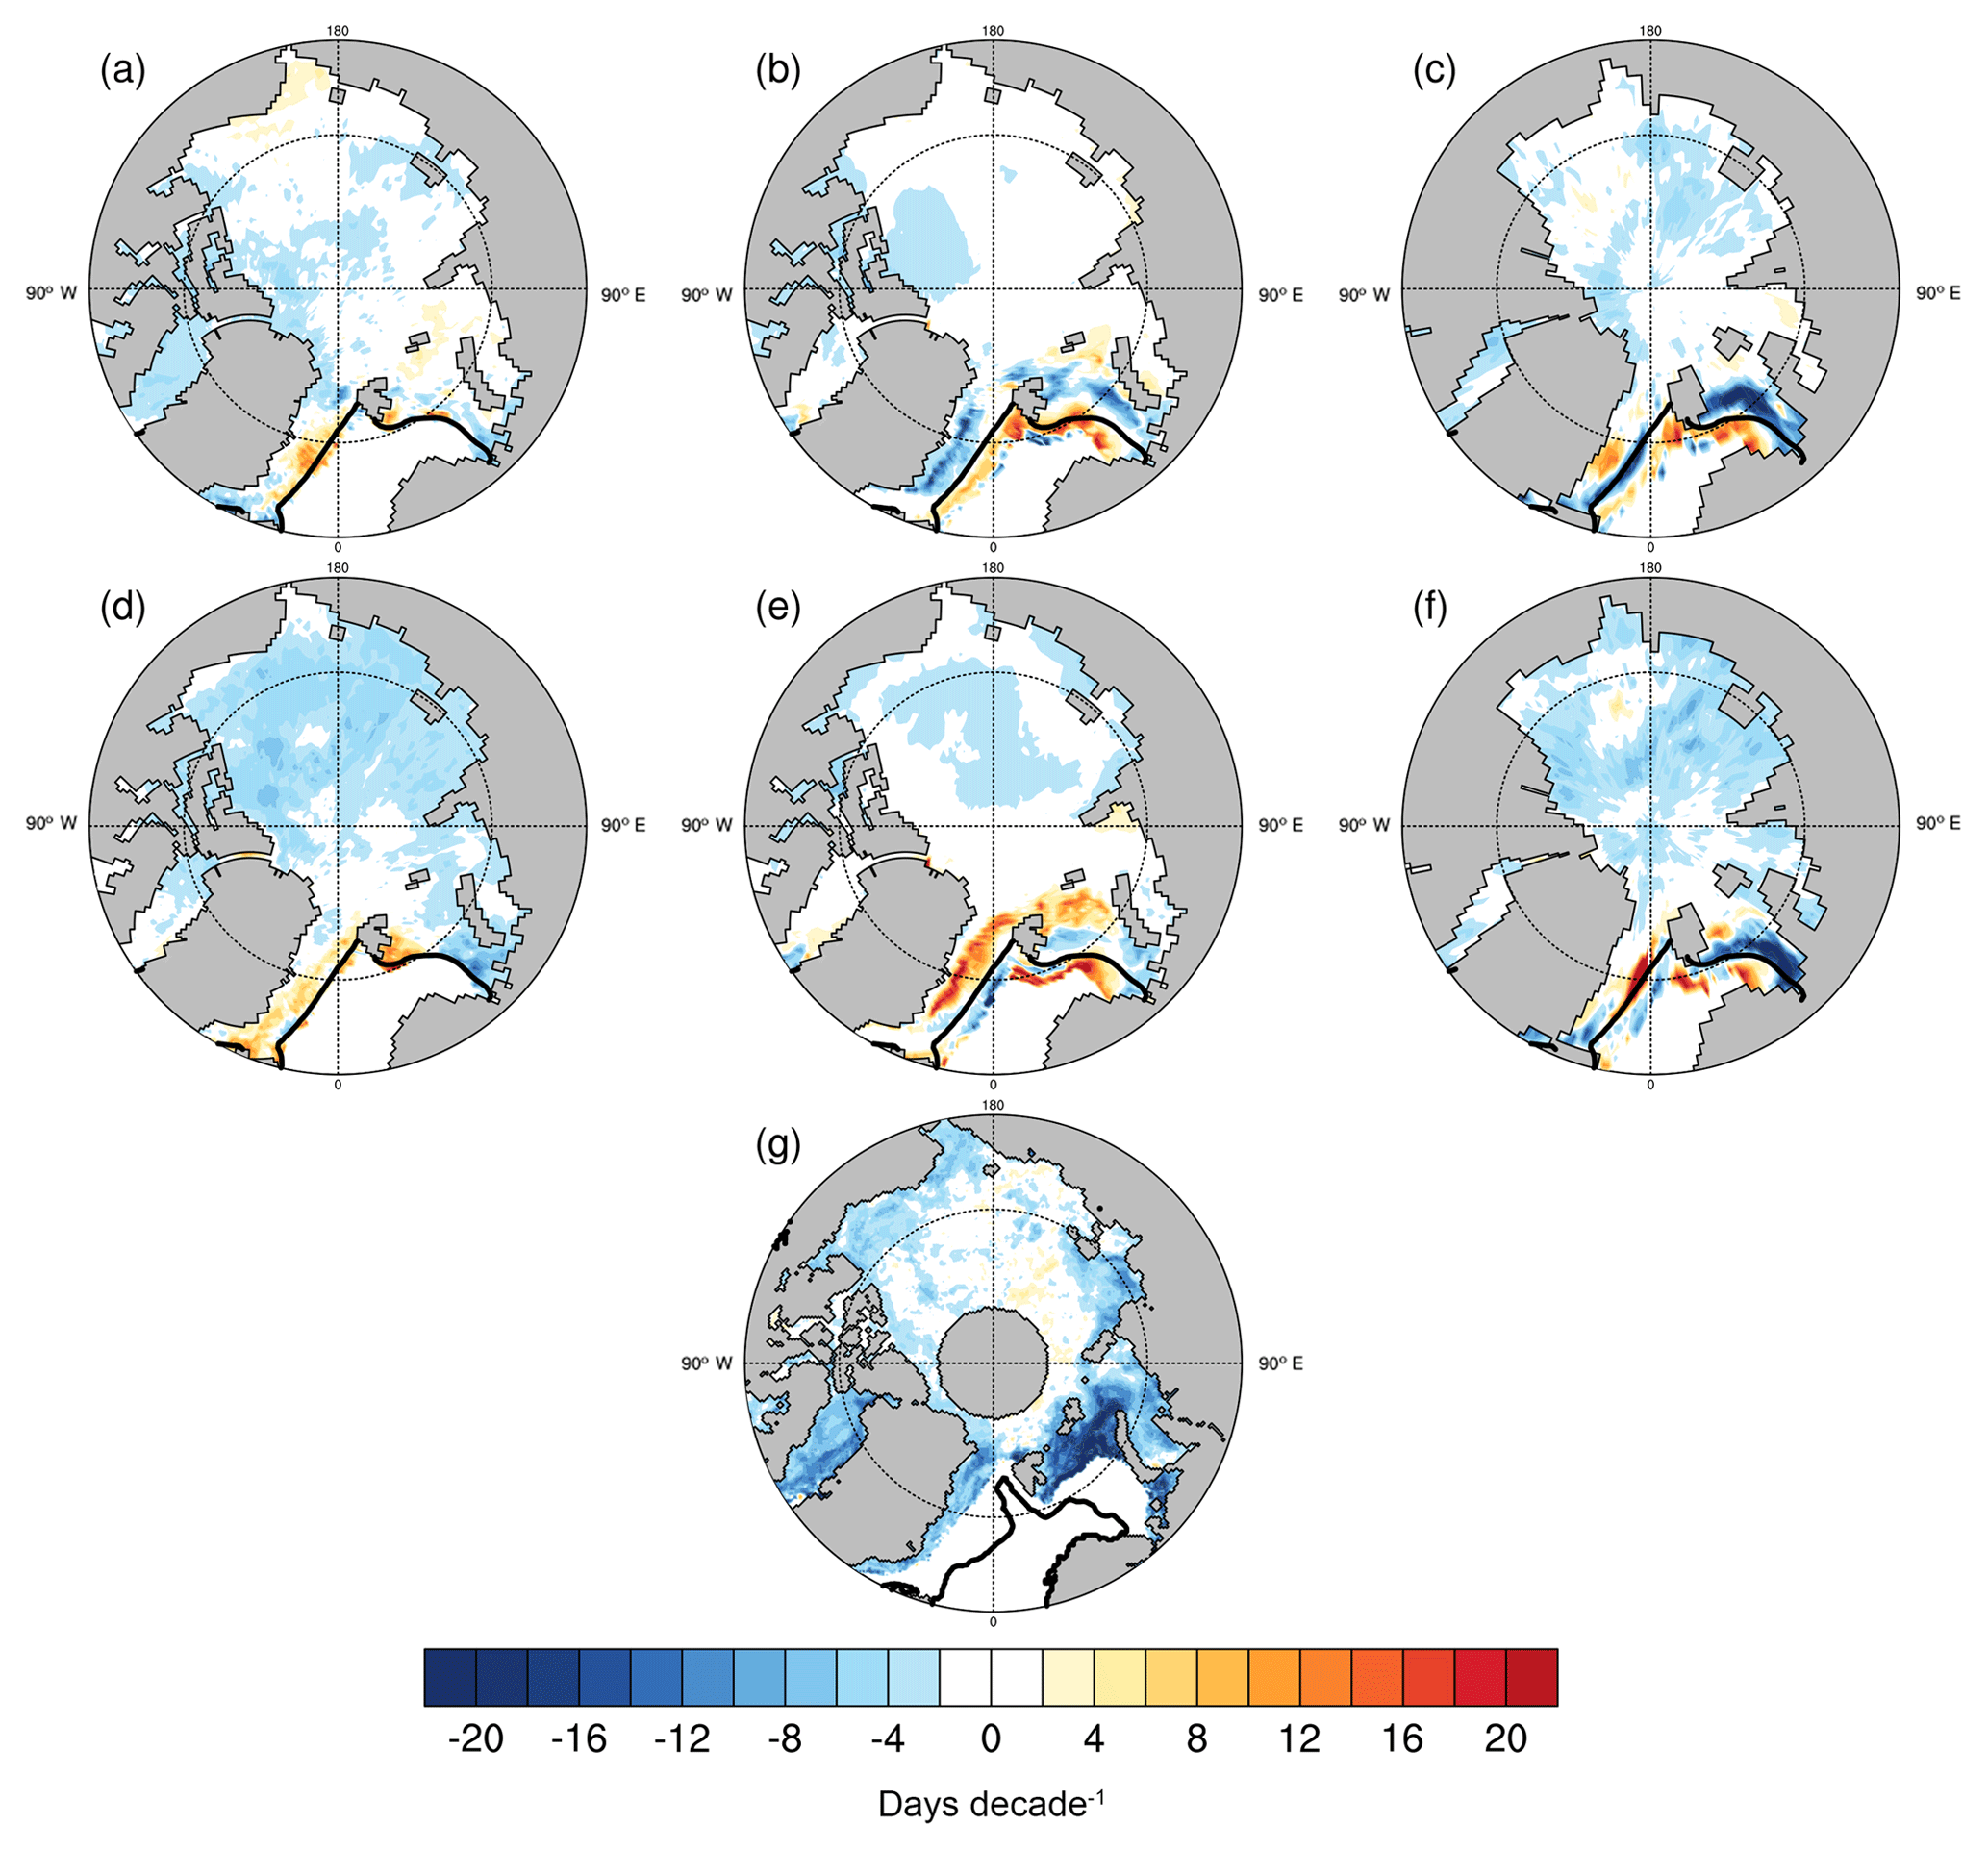
Figure 7Trends in melt onset dates over 1979–2014 for each CESM LE definition in the two members where they are available (member 34 in a–c, member 35 in d–f) as well as in the PMW satellite observations (g). The snowmelt definition is shown in (a) and (d), the thermodynamic ice volume tendency definition is shown in (b) and (e) and the surface temperature definition is shown in (c) and (f). The black line denotes the mean March ice edge (15 % ice concentration) from 1979 to 2014 using (a–f) the CESM LE and (g) NSIDC Bootstrap sea ice concentrations (Comiso, 2017).
Since trends in pan-Arctic freeze onset are consistently larger than melt onset trends, the majority of the trend in melt season length over 1979–2014 stems from the freeze onset component, in agreement with PMW observations (Stroeve et al., 2014). For ensemble members 34 and 35, the temperature–snowmelt definition produces the largest trend in melt season length (Table 3). Internal variability in melt season length trends is as large as for the freeze onset trends, with pan-Arctic trends in melt season length between −0.1 and 7.9 days decade−1 using the surface temperature and thermodynamic ice volume tendency definitions (Fig. 6). While the majority of ensemble members show a trend toward a longer pan-Arctic melt season as expected, one member shows a trend toward a shorter melt season over 1979–2014. This demonstrates that internal variability can have a large impact on trends, even over 36-year periods. The selection of the trend start date also impacts the trend distribution. By start year 1981, just 2 years past the beginning of the satellite period, all ensemble members and definitions have positive 36-year trends in melt season length for the remainder of the model simulation.
3.2.2 Spatial trends
Spatially, trends in melt onset vary differently than trends in freeze onset. Melt onset trends are generally negative except along the Atlantic ice edge, indicating earlier melt onsets across most of the Arctic (Fig. 7). The complex pattern of spatial trends near the Atlantic ice edge is likely related to the change in location of the ice edge over 1979–2014. A moving ice edge means that conditions for melt and freeze onset may be met in grid cells along the edge during some years but not others. As noted in Sect. 2, trends are only evaluated at grid cells where there are at least 20 years of valid melt characteristics over the 36-year period.
Because the temperature and snowmelt melt onset definitions capture surface processes only, we find that the trends in these definitions are more similar to each other than to the thermodynamic volume tendency definition, which depends on sea ice melt. In both ensemble members 34 and 35, the snowmelt and surface temperature definitions of melt onset show negative trends in the Laptev, East Siberian and Chukchi seas that are not present in the thermodynamic ice volume tendency definition, indicating that these trends towards earlier melt represent snowmelt, rather than sea ice melt.
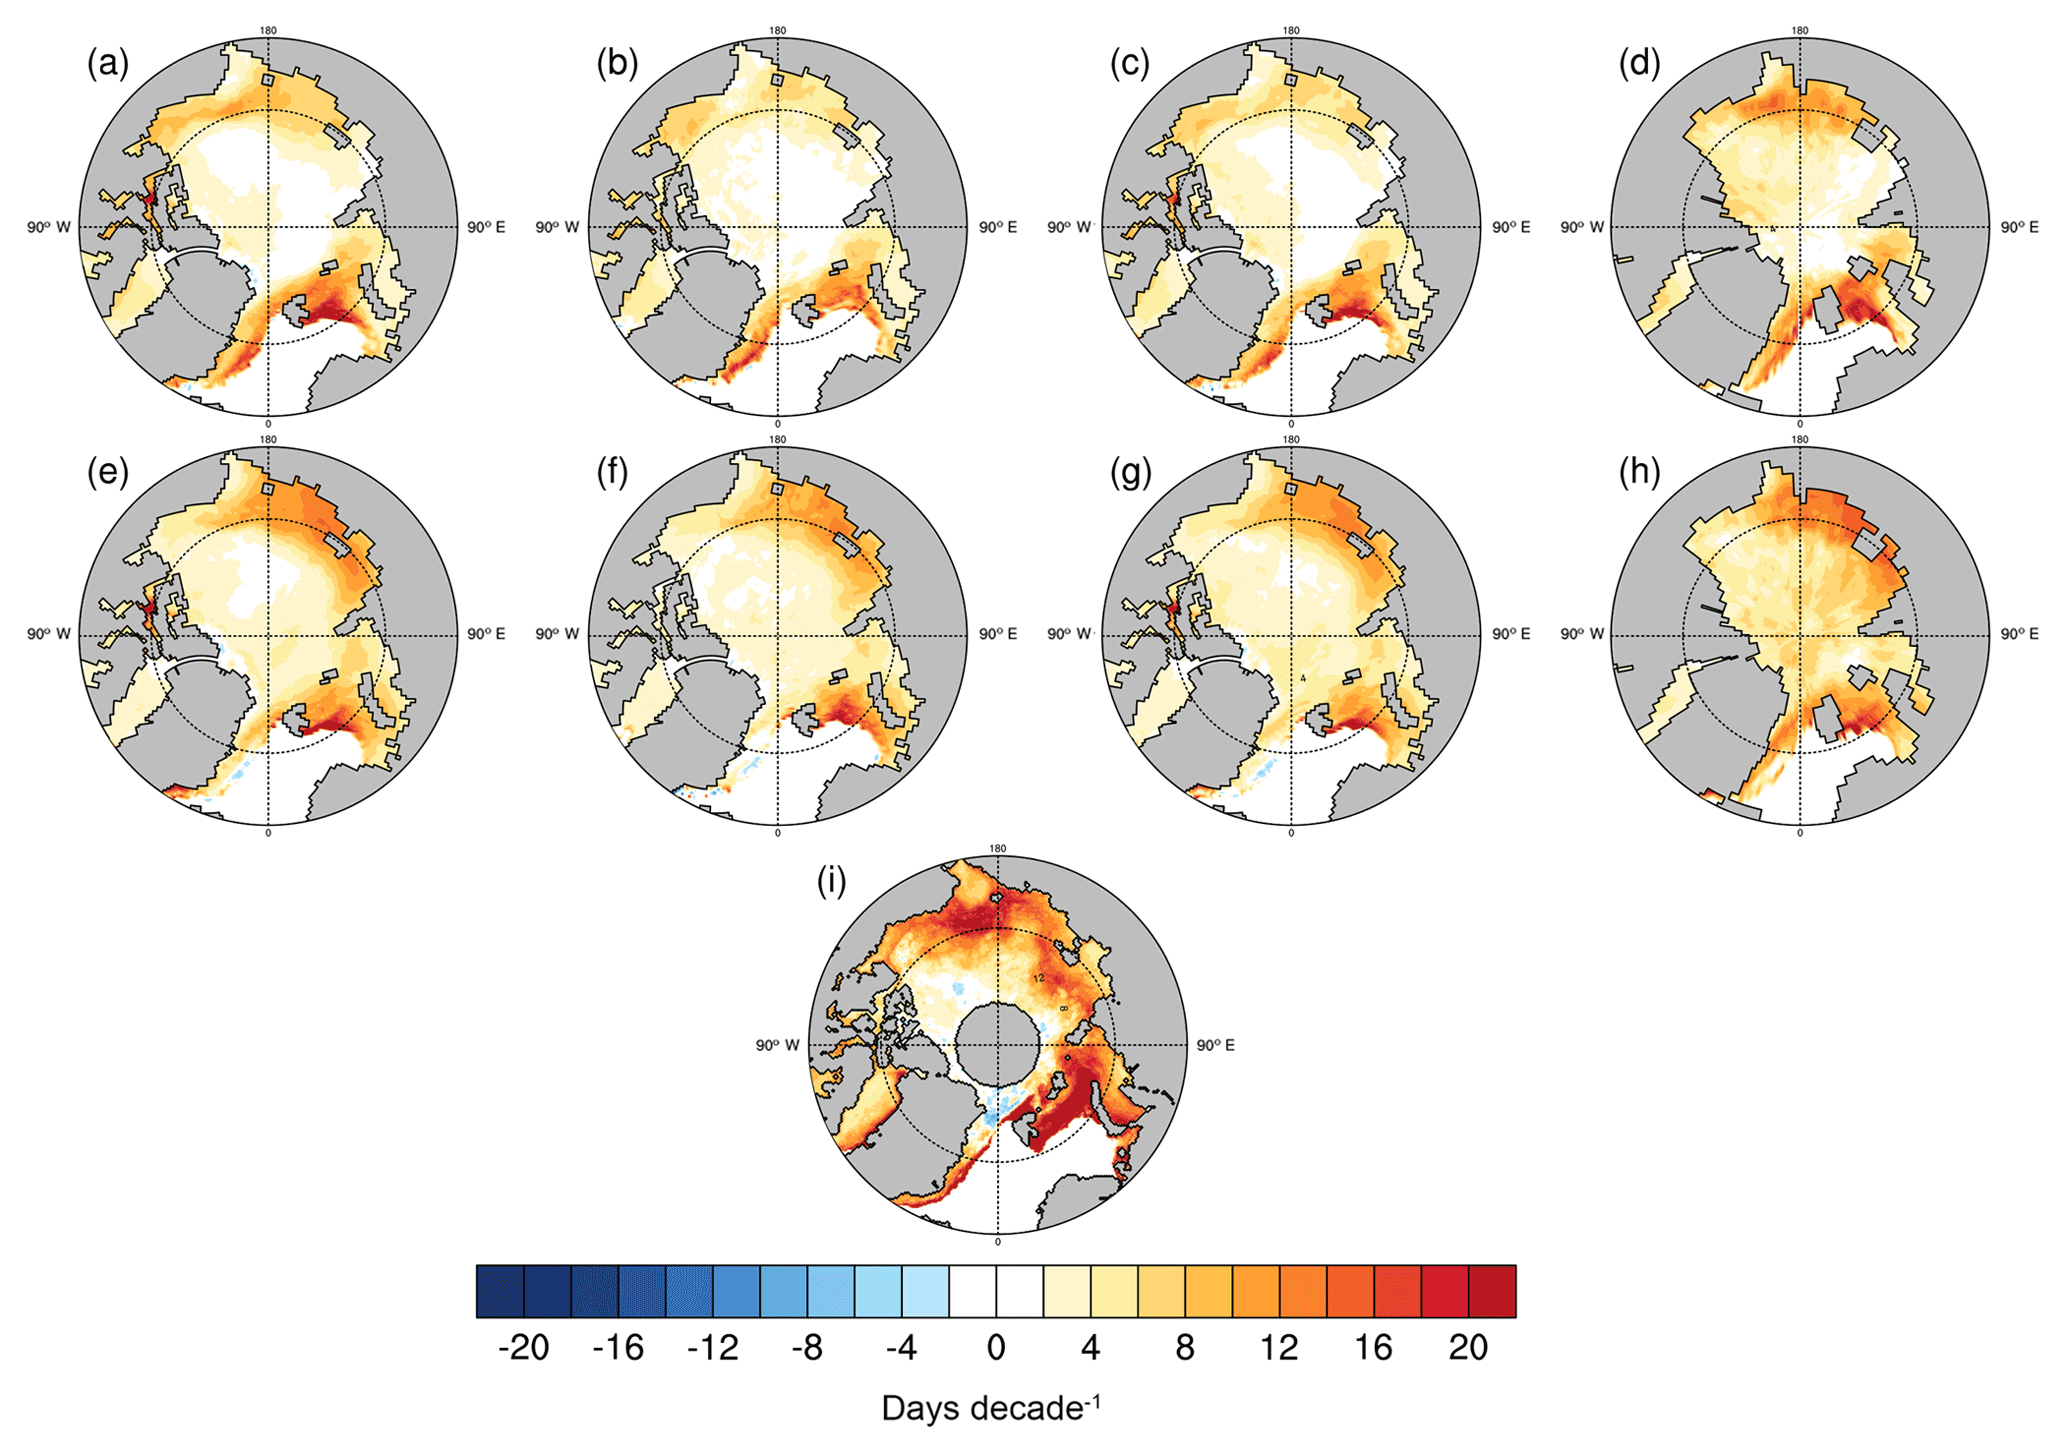
Figure 8Trends in freeze onset dates over 1979–2014 for each CESM LE definition in the two members where they are available (member 34 in a–d, member 35 in e–h) as well as in the PMW satellite observations (i). The congelation ice growth definition is shown in (a) and (e), the frazil ice growth definition is shown in (b) and (f), the thermodynamic ice volume tendency definition is shown in (c) and (g) and the surface temperature definition is shown in (d) and (h).
CESM LE definitions of freeze onset produce positive trends throughout almost all of the Arctic, indicating later freeze-up, with the largest trends occurring in marginal ice zones (Fig. 8). The marginal ice zones show the greatest ice loss over the satellite era, and with more open water exposed, trends in sensible and latent heat fluxes have increased (Deser et al., 2000). These fluxes further warm the surface ocean and delay freeze onset. The magnitudes of the freeze onset trends vary between definitions, and there are also regional differences between ensemble members due to internal variability (Fig. 8). However, unlike the trends in melt onset definitions, the regional patterns in freeze onset trends are largely consistent between definitions. The similarity in trends between definitions based on surface temperature and sea ice variables indicates that temperature trends are driving the delayed freeze-up.
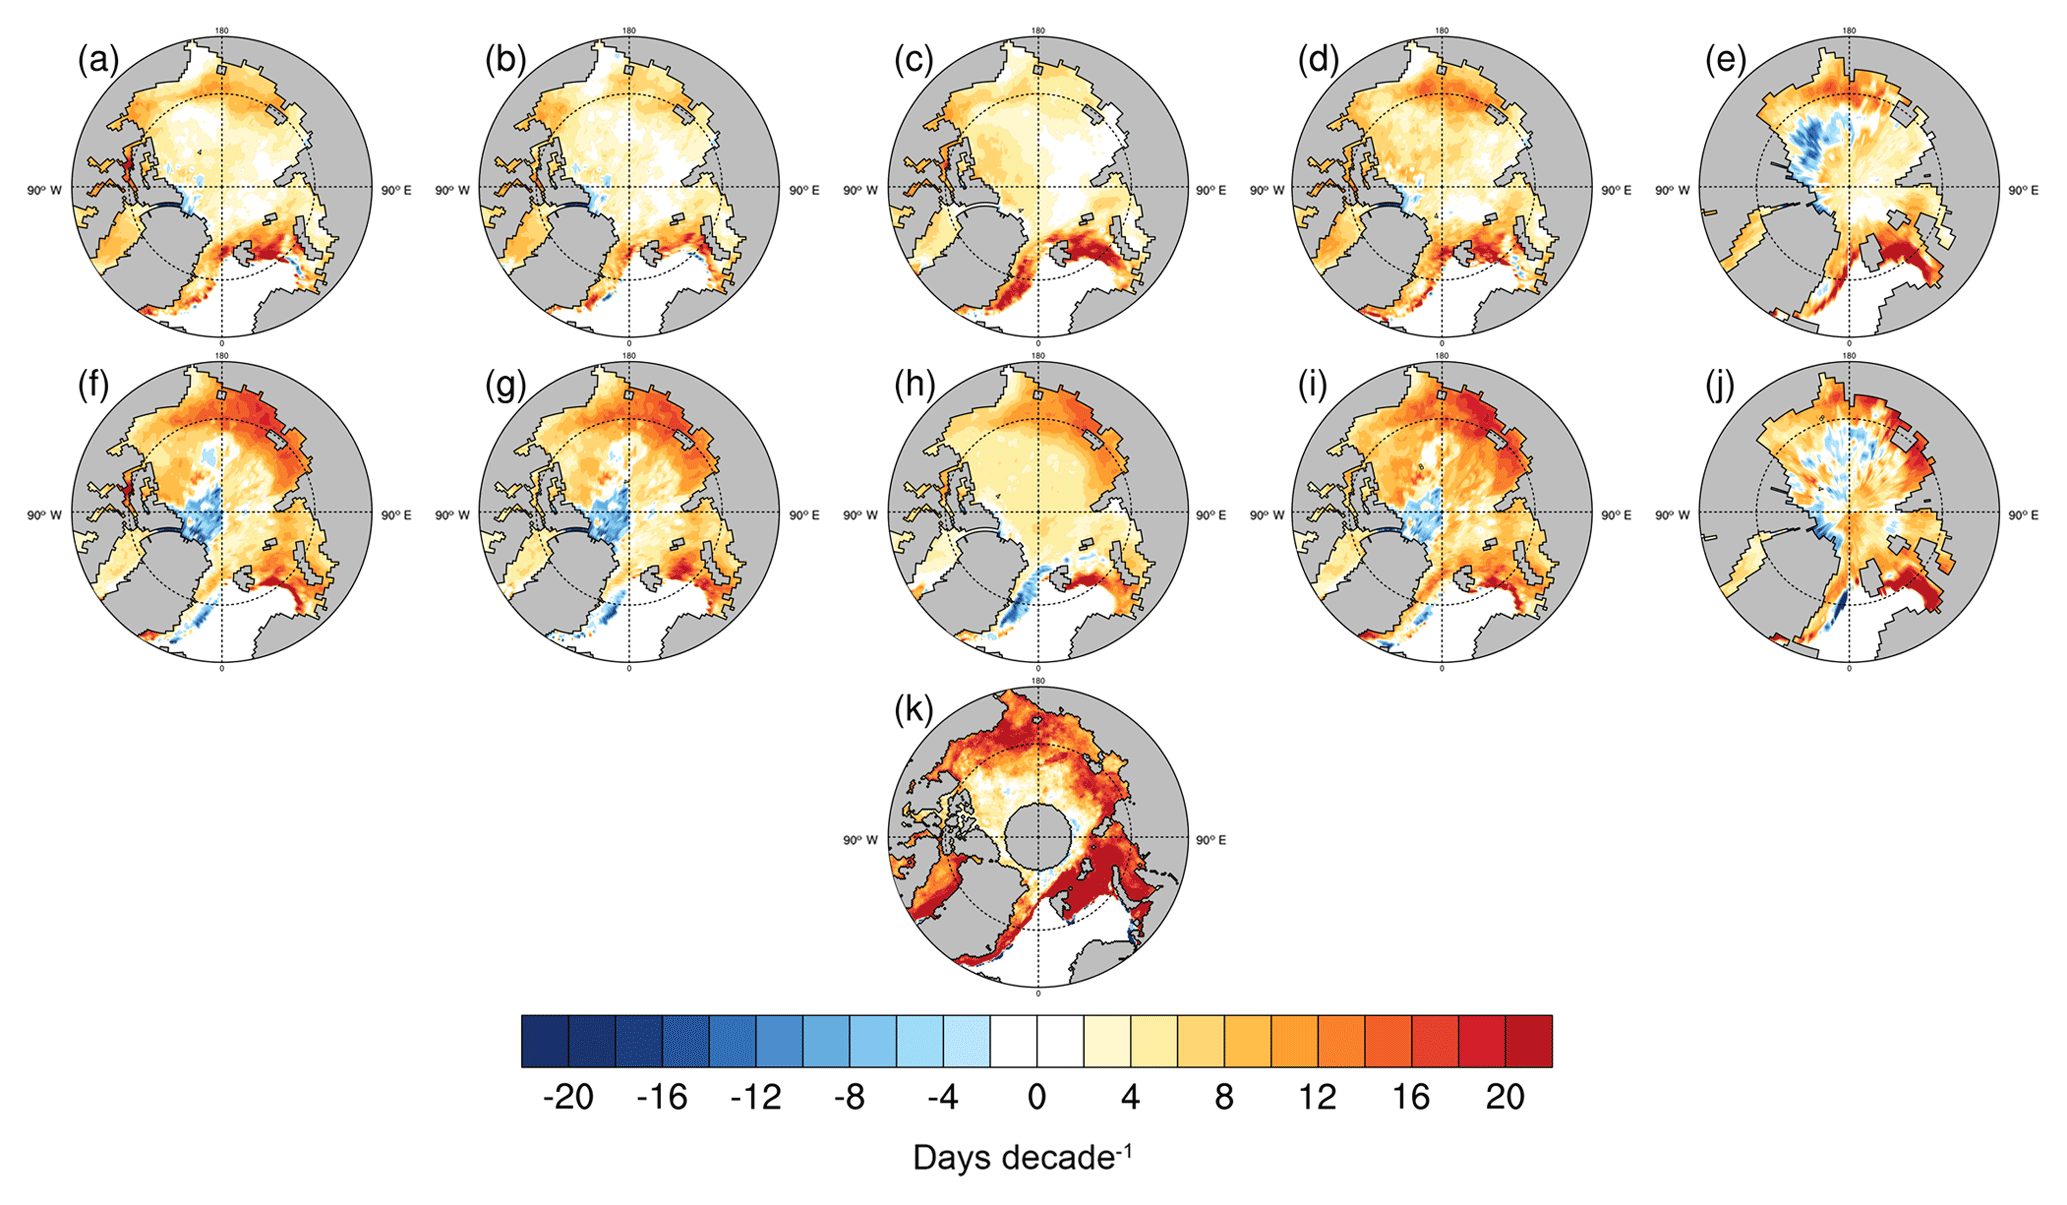
Figure 9Trend in melt season length over 1979–2014 for each CESM LE definition in the two members where they are available (member 34 in a–e, member 35 in f–j) as well as in the PMW satellite observations (k). The congelation–snowmelt definition is shown in (a) and (f), the frazil–snowmelt definition in (b) and (g), the volume–volume definition in (c) and (h), the temperature–snowmelt definition in (d) and (i) and the temperature–temperature definition in (e) and (j).
All CESM LE definitions show large positive trends in melt season length in the Barents Sea and in the Laptev and East Siberian seas, driven by the freeze onset trends in these regions (Fig. 9). Changes in freeze onset are particularly important to changes in the melt season in the marginal ice zones, where sea ice has retreated the most over the satellite period. However, definition differences and internal variability introduce large variations in the magnitude and even the sign of the diagnosed melt season lengths. The effect of definition differences is most pronounced to the north of the Beaufort Sea, where temperature-based definitions indicate a negative trend in melt season length, while all other definitions show no or small positive trends in that region (Fig. 9e, j). The effect of internal variability is seen most clearly in the central Arctic, where even the sign of the trend varies between ensemble members (Fig. 9). Internal variability also affects the magnitude of the melt season trends in the marginal seas (Fig. 9), as sea ice loss is simulated differently in ensemble members 34 and 35.
3.3 Comparing CESM LE and PMW
3.3.1 Average melt season characteristics
Pan-Arctic average PMW observations (Markus et al., 2009; Stroeve et al., 2014) fall within the range of model definitions and internal variability for all melt season characteristics (Fig. 1a). Spatially, the greatest melt onset similarities exist between the CESM LE snowmelt definition and PMW observations, particularly in the central Arctic Ocean and Laptev Sea (Fig. 3). This agrees with the initial expectation that PMW data are most closely related to the snowmelt criteria, as the PMW algorithm is designed to detect surface liquid water. Histograms of 1979–2014 average melt onset show that the snowmelt definition agrees best with PMW observations in terms of areal median and the areal distribution over the satellite era (Fig. 10). However, the snowmelt definition and PMW observations of average melt onset still do not match exactly. In particular, the snowmelt definition has a greater areal fraction of melt onset dates before June than the PMW data. As both ensemble members 34 and 35 show a similar mismatch, this is likely not due to internal variability, but due to definition differences and/or an early melt onset model bias in the CESM LE. It is also possible that no model bias exists and that later melt onset in the PMW data is due to observational uncertainty. Uncertainty in satellite-derived melt onset dates was assessed by Bliss et al. (2017) using two different algorithms, the AHRA and the PMW Combined algorithm (which, as noted earlier, is composed of PMW early melt onset dates except when early melt is not detected, then the PMW continuous melt onset date is used). It was found that the AHRA algorithm shows earlier melt onset dates than the PMW Combined algorithm in nearly all locations across the Arctic (Bliss et al., 2017). The difference between pan-Arctic average PMW melt onset dates and the melt onset dates found in the CESM LE using surface-based definitions (snowmelt and surface temperature) is less than the approximately 20-day melt onset difference found between the two satellite algorithms in Bliss et al. (2017). Therefore the difference between PMW and CESM LE melt onset dates might be within the observational uncertainty rather than a model bias. However, Bliss et al. (2017) compared early melt onset algorithms, while we assess continuous melt onset. It is therefore unclear if the observational uncertainty is the same for early and continuous melt onset.
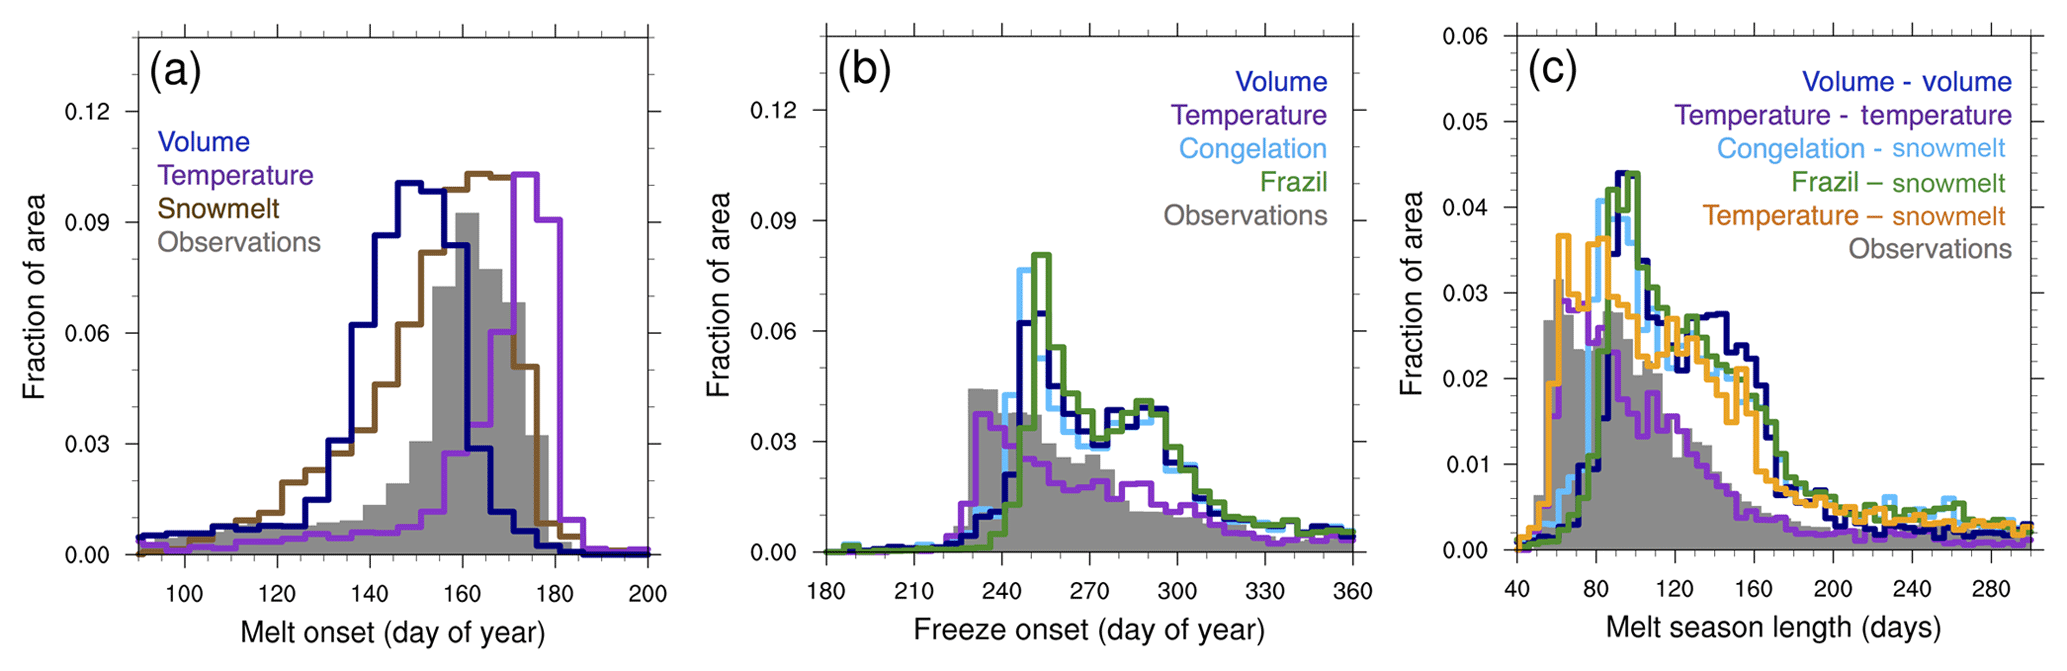
Figure 10Average melt season characteristics from 66 to 84.5∘ N for 1979–2014 for PMW satellite observations (filled gray) and each CESM LE definition (in ensemble member 35): (a) melt onset using the surface temperature, thermodynamic ice volume tendency and snowmelt definitions, (b) freeze onset using the surface temperature, thermodynamic ice volume tendency, frazil ice growth and congelation ice growth definitions and (c) melt season length using the temperature–temperature, temperature–snowmelt, volume–volume, frazil–snowmelt and congelation–snowmelt definitions. Plots from ensemble member 34 are very similar and are shown in Fig. S6.
For freeze onset, the surface temperature definition agrees best with PMW observations in terms of median and distribution (Fig. 10). Surface temperature is the only definition for which freeze onset dates in the central Arctic, Laptev Sea and Kara Sea are not later than PMW observations over the satellite era (Fig. 4). It is likely that PMW observations agree well with the CESM's surface temperature definition, since both represent strictly surface processes. Particularly in the central Arctic, a surface temperature definition may capture the timing of snow cover or melt pond refreezing. However, refreezing of ponds or liquid water in the snow on sea ice is not accounted for in the CESM LE. Therefore this kind of freeze onset is not captured by the model definitions based on ice growth, explaining the later freeze onset of those definitions compared to PMW data in the central Arctic.
Comparisons of melt season length emphasize that no one definition fully captures the PMW observations. All CESM LE definitions show longer melt seasons in the Barents Sea than shown by the PMW data (Fig. 5). By areal fraction, most definitions show a longer melt season length in the CESM compared to PMW data (Fig. 10). In terms of pan-Arctic averages, CESM LE melt season lengths are both shorter and longer than PMW data depending on the definitions used.
3.3.2 Trends in melt season characteristics
In the PMW observations spanning 1979–2014 (Markus et al., 2009; Stroeve et al., 2014), pan-Arctic melt onset is occurring 2.5 days earlier per decade and pan-Arctic freeze onset is occurring 6.9 days later per decade (Table 3, Fig. 6). In agreement with PMW data and past studies (Stroeve et al., 2014; Wang et al., 2017), a larger trend in freeze onset than melt onset is produced by all CESM definitions. The PMW melt onset trend falls just outside the range of model definition trends (spanning −2.4 to 0.9 days decade−1), while the PMW freeze onset trend is bracketed by model definition trends (spanning 1.2 to 8.6 days decade−1).
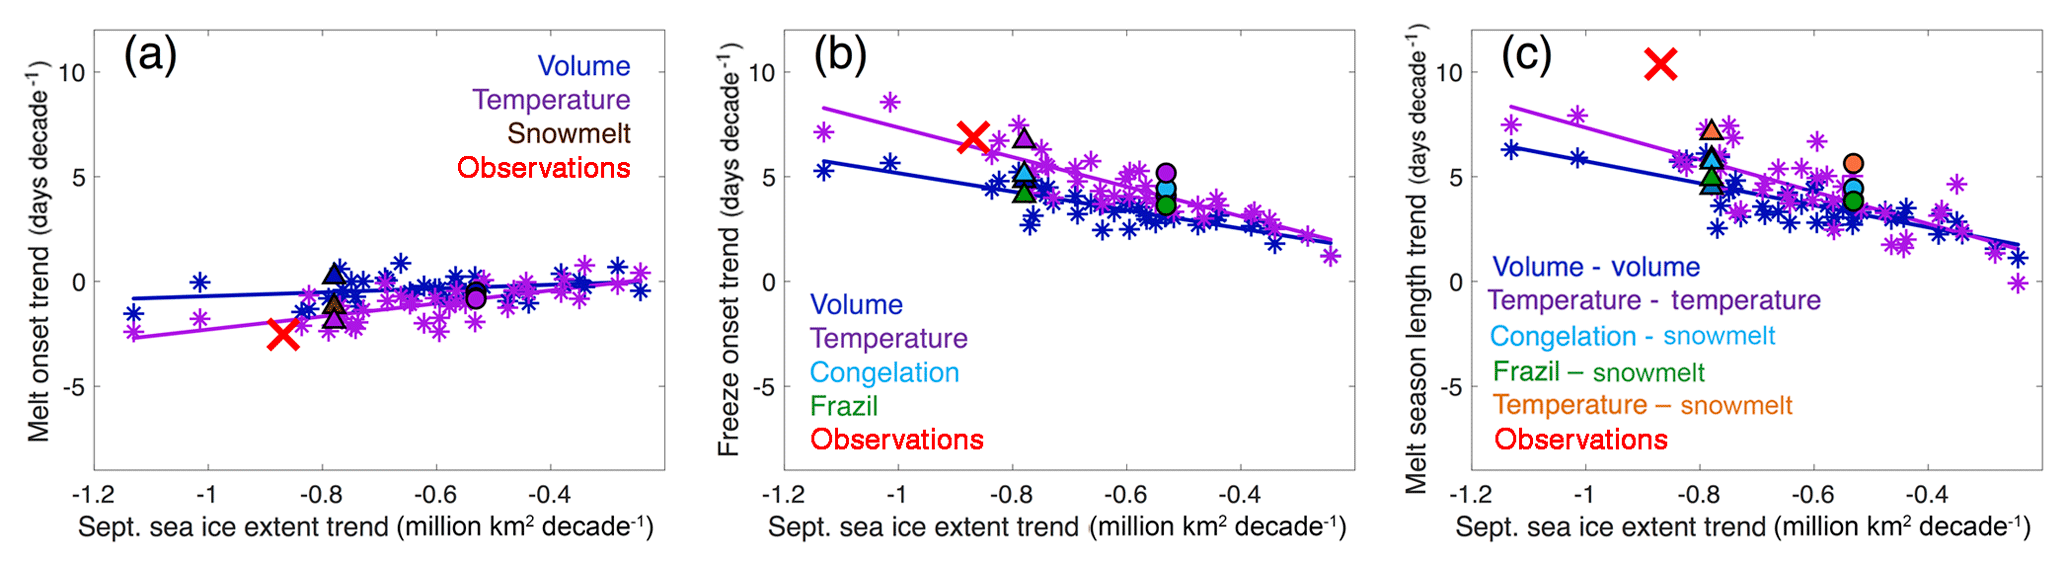
Figure 11Trends in melt season characteristics versus trends in September sea ice extent from 1979 to 2014 for PMW observations and all available CESM LE ensemble members. Each marker represents an ensemble member. Circles represent ensemble member 34 and triangles represent ensemble member 35. The red markers represent the PMW melt and freeze onset observations and NSIDC September sea ice extent (Fetterer et al., 2017). (a) Trends in melt onset using the surface temperature, thermodynamic ice volume tendency and snowmelt definitions. (b) Trends in freeze onset using the surface temperature, thermodynamic ice volume tendency, frazil ice growth and congelation ice growth definitions. (c) Trends in melt season length using the temperature–temperature, temperature–snowmelt, volume–volume, frazil–snowmelt and congelation–snowmelt definitions. Lines represent the least-squares linear fits.
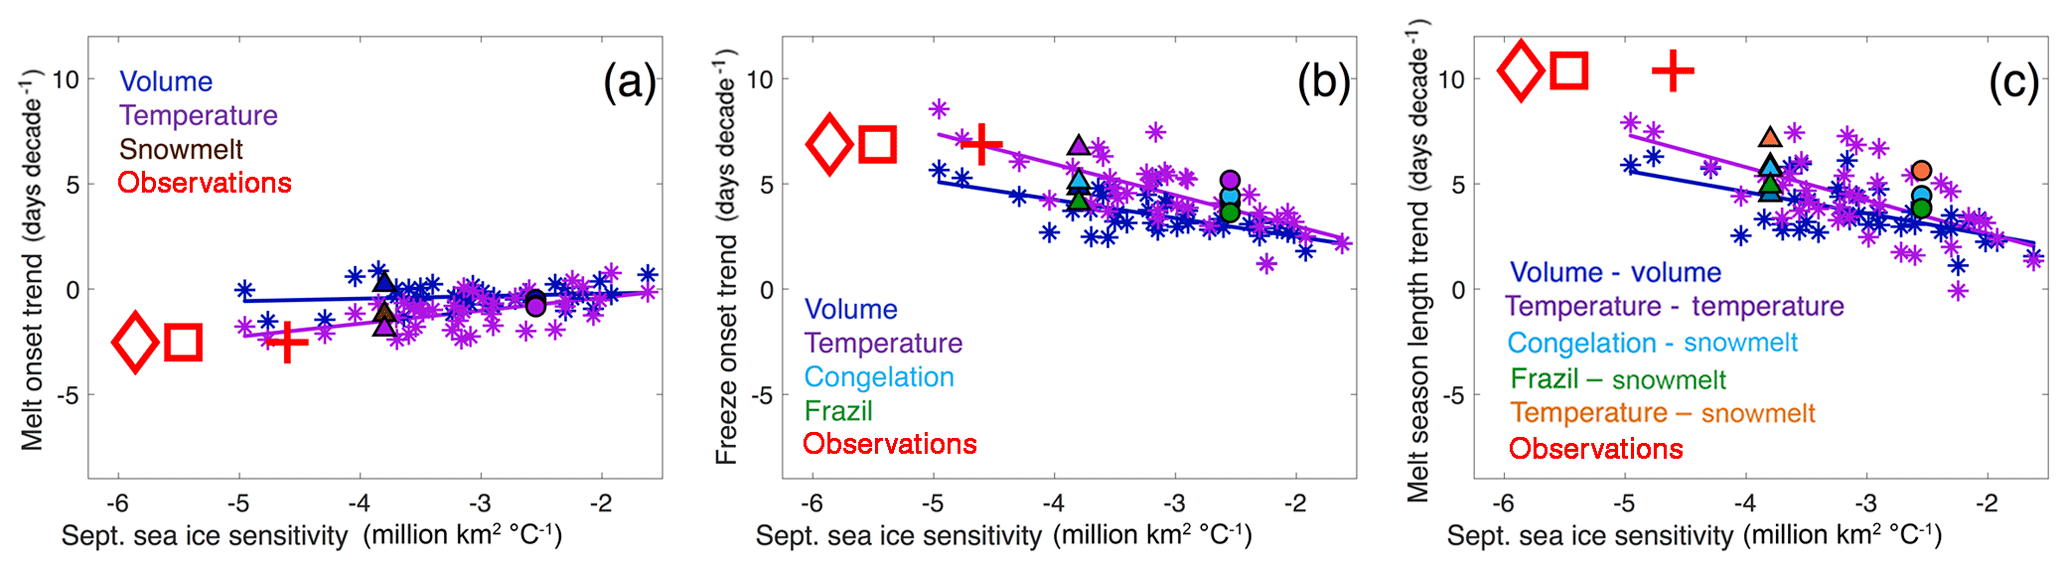
Figure 12Trends in melt season characteristics versus trends in September sea ice sensitivity from 1979 to 2014 for PMW observations and all available CESM LE ensemble members. Each marker represents an ensemble member. Circles represent ensemble member 34 and triangles represent ensemble member 35. The red markers represent the PMW melt and freeze onset observations and sea ice sensitivity derived from HadCRUT (square), GISTEMP (+) and NCDC (diamond) global temperature observations and NSIDC September sea ice extent (Fetterer et al., 2017). (a) Trends in melt onset using the surface temperature, thermodynamic ice volume tendency and snowmelt definitions. (b) Trends in freeze onset using the surface temperature, thermodynamic ice volume tendency, frazil ice growth and congelation ice growth definitions. (c) Trends in melt season length using the temperature–temperature, temperature–snowmelt, volume–volume, frazil–snowmelt and congelation–snowmelt definitions. Lines represent the least-squares linear fits.
None of the CESM LE definitions yield trends in melt season length (spanning −0.1 to 7.9 days decade−1) as large as the trends found in the PMW observations (Table 3, Fig. 6). In the PMW observations and all but one ensemble member of the CESM LE definitions, the pan-Arctic melt season is lengthening, and this change is driven predominately by later freeze onset dates. But PMW observations show that the average pan-Arctic melt season is lengthening at a rate of 10.4 days per decade, which is over 30 % larger than any of the melt season trends found using CESM LE definitions over the satellite era in any ensemble member (Table 3, Fig. 6). Regionally, we find that the CESM melt season length trends in the marginal ice zones are consistently smaller than the PMW melt season length trends, for all definitions in members 34 and 35 (Fig. 9). In definitions where all 40 ensemble members are available, some members show trends as large satellite observations in certain regions (such as the Barents and Chukchi seas), but not across the entire marginal ice zone, like what is seen in satellite observations. This is driven in particular by smaller freeze onset trends in the marginal seas compared to PMW data. These pan-Arctic and regional trend differences suggest that the CESM LE underestimates the melt season length trend, in particular in the marginal seas.
3.3.3 Relationship between melt and freeze onset
Earlier melt and later freeze onset dates are related in both CESM LE definitions and PMW observations (Fig. S7). In previous work, earlier melt onset has been shown to delay fall freeze onset through increased solar absorption in the Arctic Ocean (Stroeve et al., 2014). There is moderate correlation between modeled melt and freeze onset in the CESM LE, but there is also substantial internal variability and variations between model definitions. The correlations of melt and freeze onset in the model range between −0.64 and 0.12, while the PMW correlation is −0.26 (Fig. S7). However, only about 3.5 % of all available ensemble members and definitions in the CESM LE show positive correlations, indicating that in general, earlier melt onset dates are related to later freeze onset dates in the same year. This forced relationship between melt onset and freeze onset is also apparent in the ensemble mean, which shows negative correlation coefficients that bracket the observations (−0.21 using thermodynamic ice volume tendency and −0.49 using surface temperature).
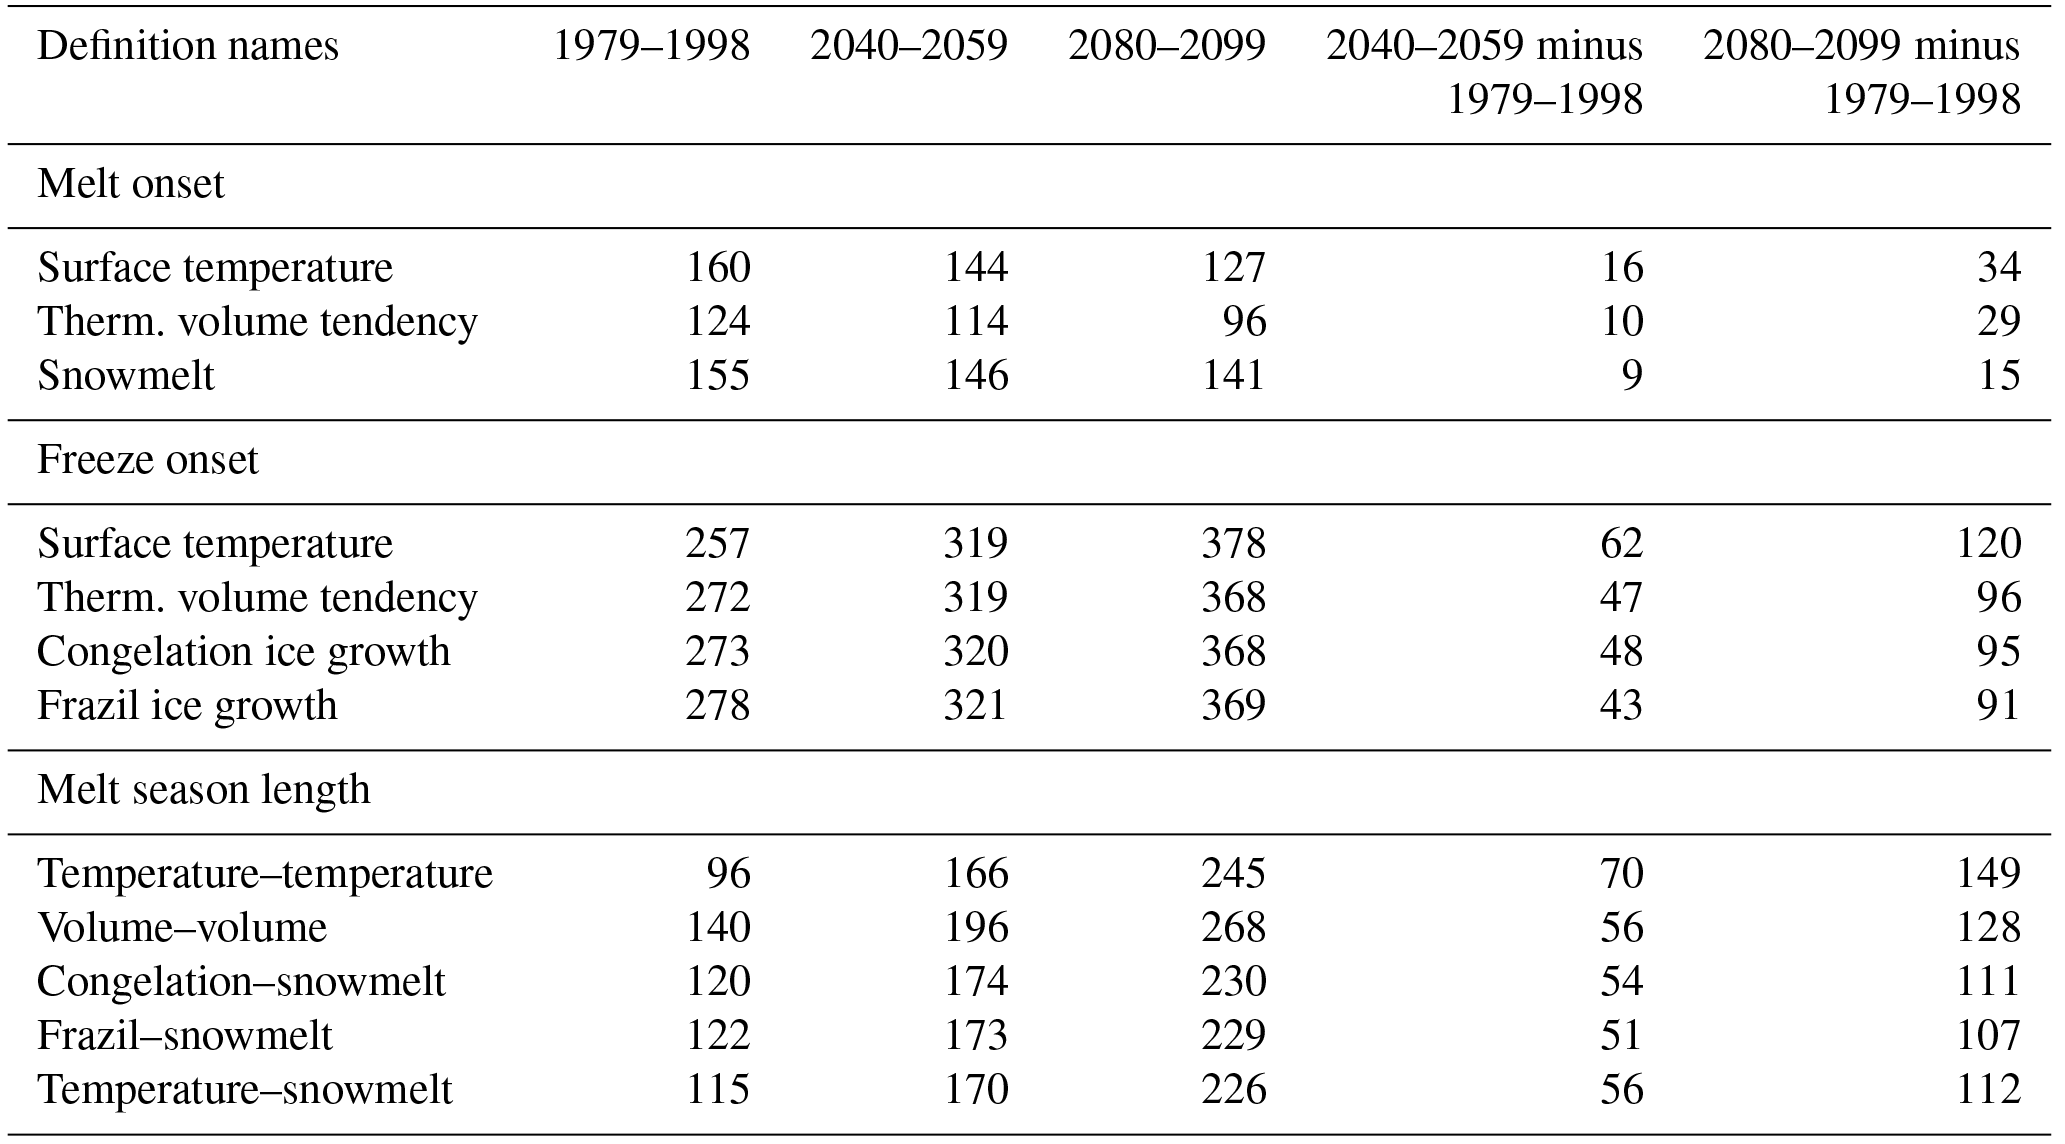
Table 4Pan-Arctic ensemble means of melt season characteristics averaged over the time periods 1979–1998, 2040–2059 (mid-century) and 2080–2099 (end of century). Surface temperature and thermodynamic ice volume tendency definitions are averaged over 40 ensembles, and all other definitions are averaged over the two ensemble members for which they are available (members 34 and 35).
3.4 Melt season characteristics and September sea ice
CESM LE members that have the largest trend in September sea ice extent over the period 1979–2014 also have the largest melt season length trend (Fig. 11). Correlations between trends in September sea ice extent and trends in the two CESM LE melt season length definitions with 40 available ensemble members (surface temperature and thermodynamic ice volume tendency) are both −0.79. In Sect. 3.2 we showed that 36-year trends in melt season characteristics are affected strongly by internal variability. The same is true for September sea ice extent trends, as shown in previous work (Kay et al., 2011; Swart et al., 2015). But unlike the observed trend in melt season length, the observed trend in September sea ice extent falls within the range of internal variability in the CESM LE (Jahn, 2018; Swart et al., 2015).
While we cannot discern a bias in CESM LE September sea ice extent trends over the satellite era, a bias may exist for the September sea ice sensitivity (Jahn, 2018; Rosenblum and Eisenman, 2017), and an underestimation of melt season length trends could be a contributing factor. Sea ice sensitivity is defined as the change in September sea ice extent per degree of global temperature change. Both models and observations have been shown to have an approximately linear relationship between Arctic sea ice extent and global surface temperature (Mahlstein and Knutti, 2012). It has also been found that climate models producing global warming similar to observations have slower than observed sea ice loss (Rosenblum and Eisenman, 2017). However, large observational uncertainty in sea ice sensitivity (Niederdrenk and Notz, 2018) complicates model assessment. This agrees with findings for the CESM LE, where the identification of a September sea ice sensitivity bias depends on the selected observations and period (Jahn, 2018). Over the period 1979–2014, September sea ice sensitivity using the GISTEMP (GISTEMP, 2017) global warming trend falls within the ensemble spread, but all ensemble members underestimate the sea ice sensitivity compared to those derived from HadCRUT4 (HadCRUT.4.5.0.0, 2017) and NCDC (NCDC, 2017) global warming trends (Fig. 12). In contrast, all CESM LE ensemble members and definitions underestimate the pan-Arctic trend in melt season length from 1979 to 2014 (as shown earlier, Figs. 11 and 12). Hence, if the CESM LE is indeed underestimating the September sea ice sensitivity, it is possible that the underestimation of the melt season length trend is a contributing factor.
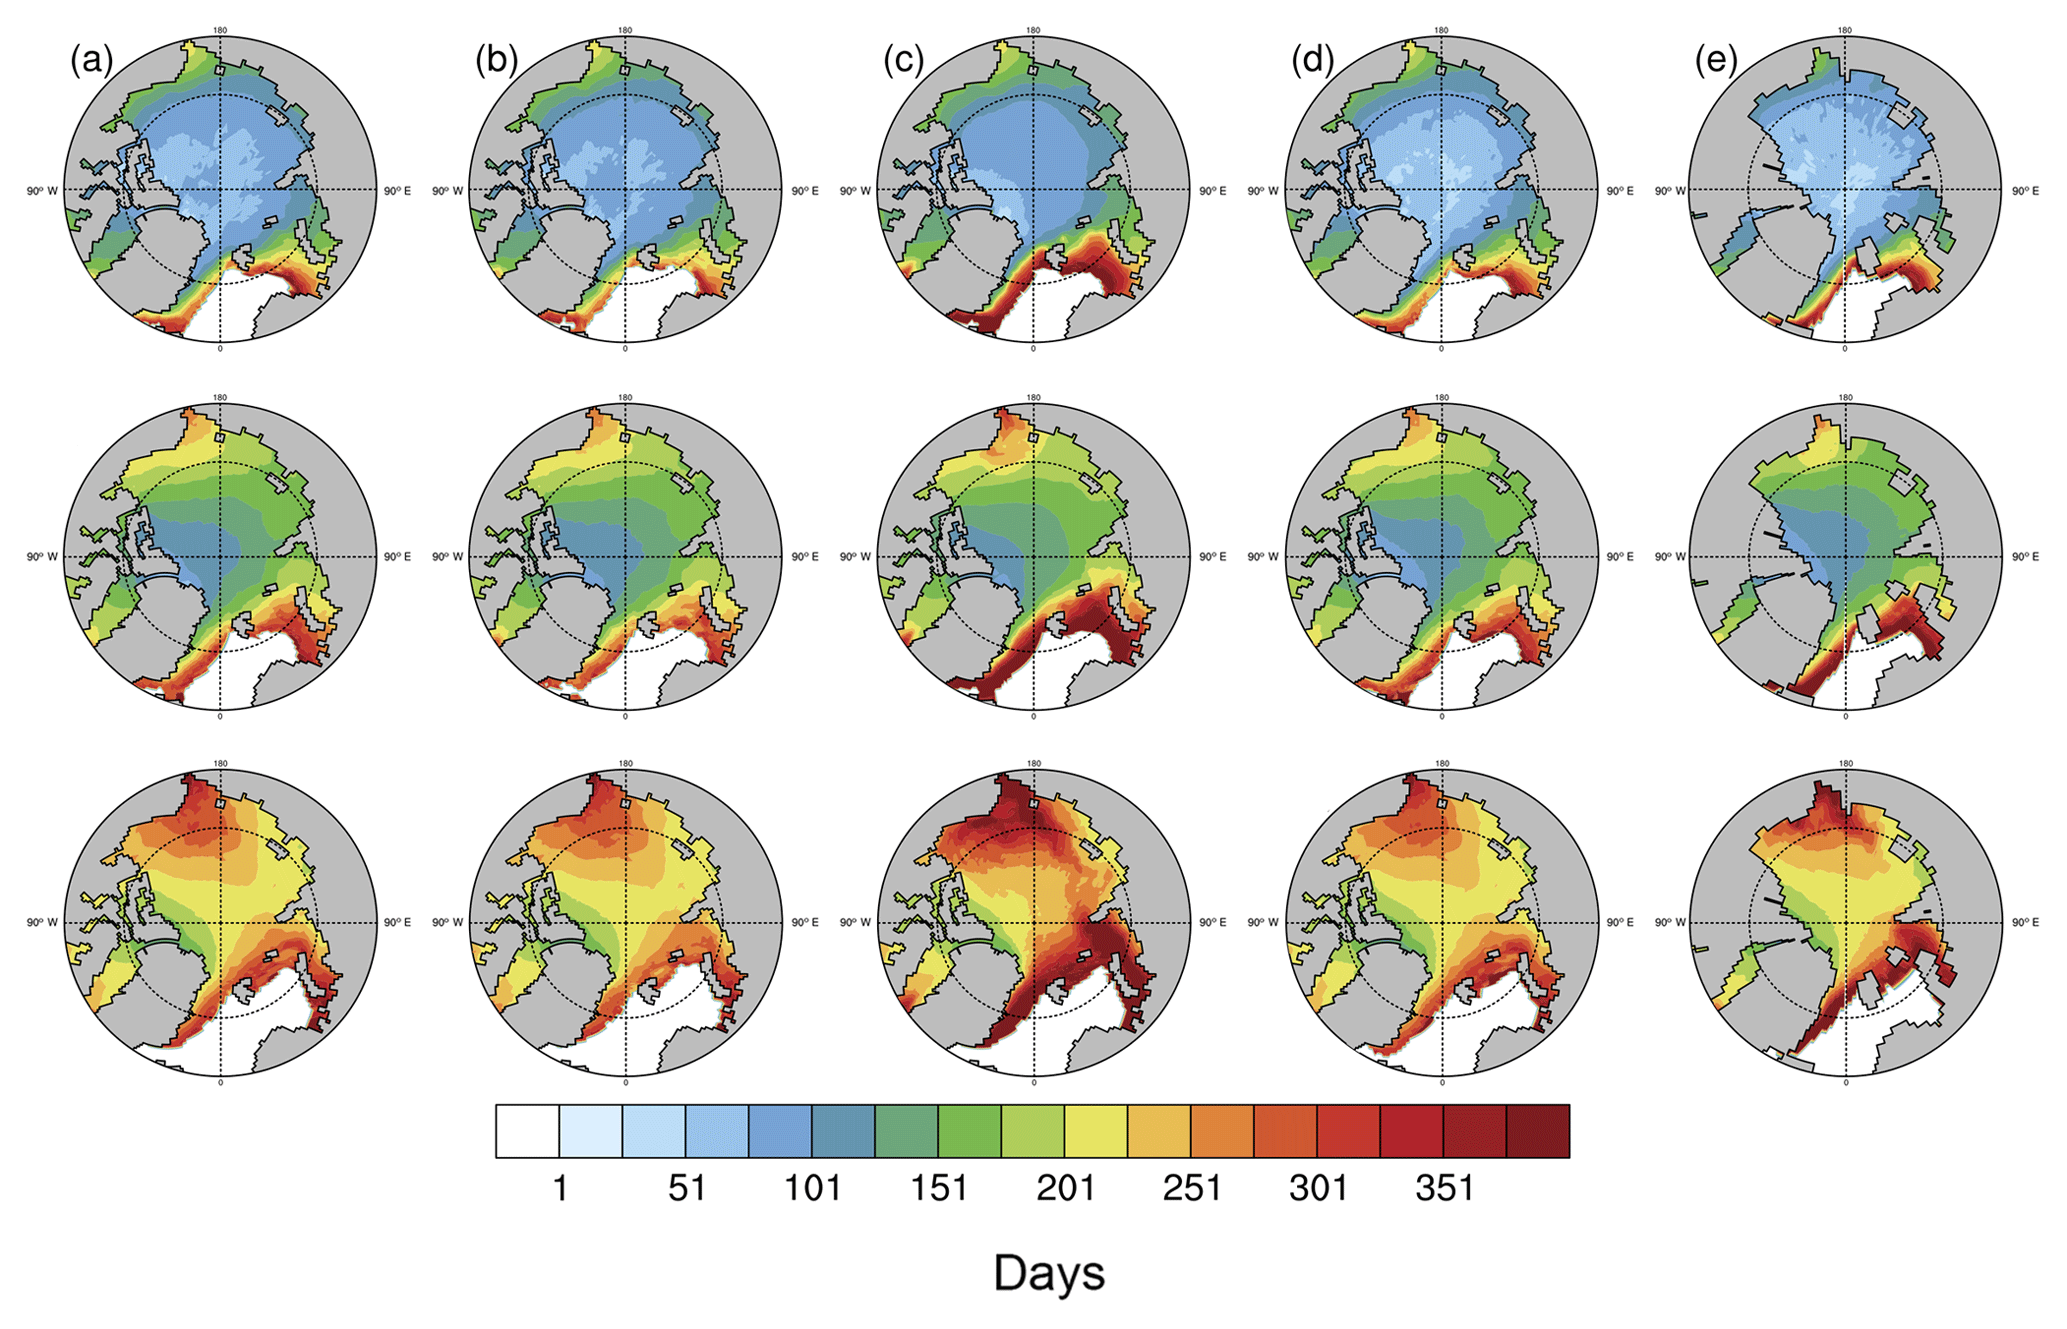
Figure 13Melt season length averaged over the time periods 1979–1998 (top row), 2040–2059 (middle row) and 2080–2099 (bottom row) using ensemble member 35. Each column is a different definition: (a) congelation–snowmelt, (b) frazil–snowmelt, (c) volume–volume, (d) temperature–snowmelt and (e) temperature–temperature.
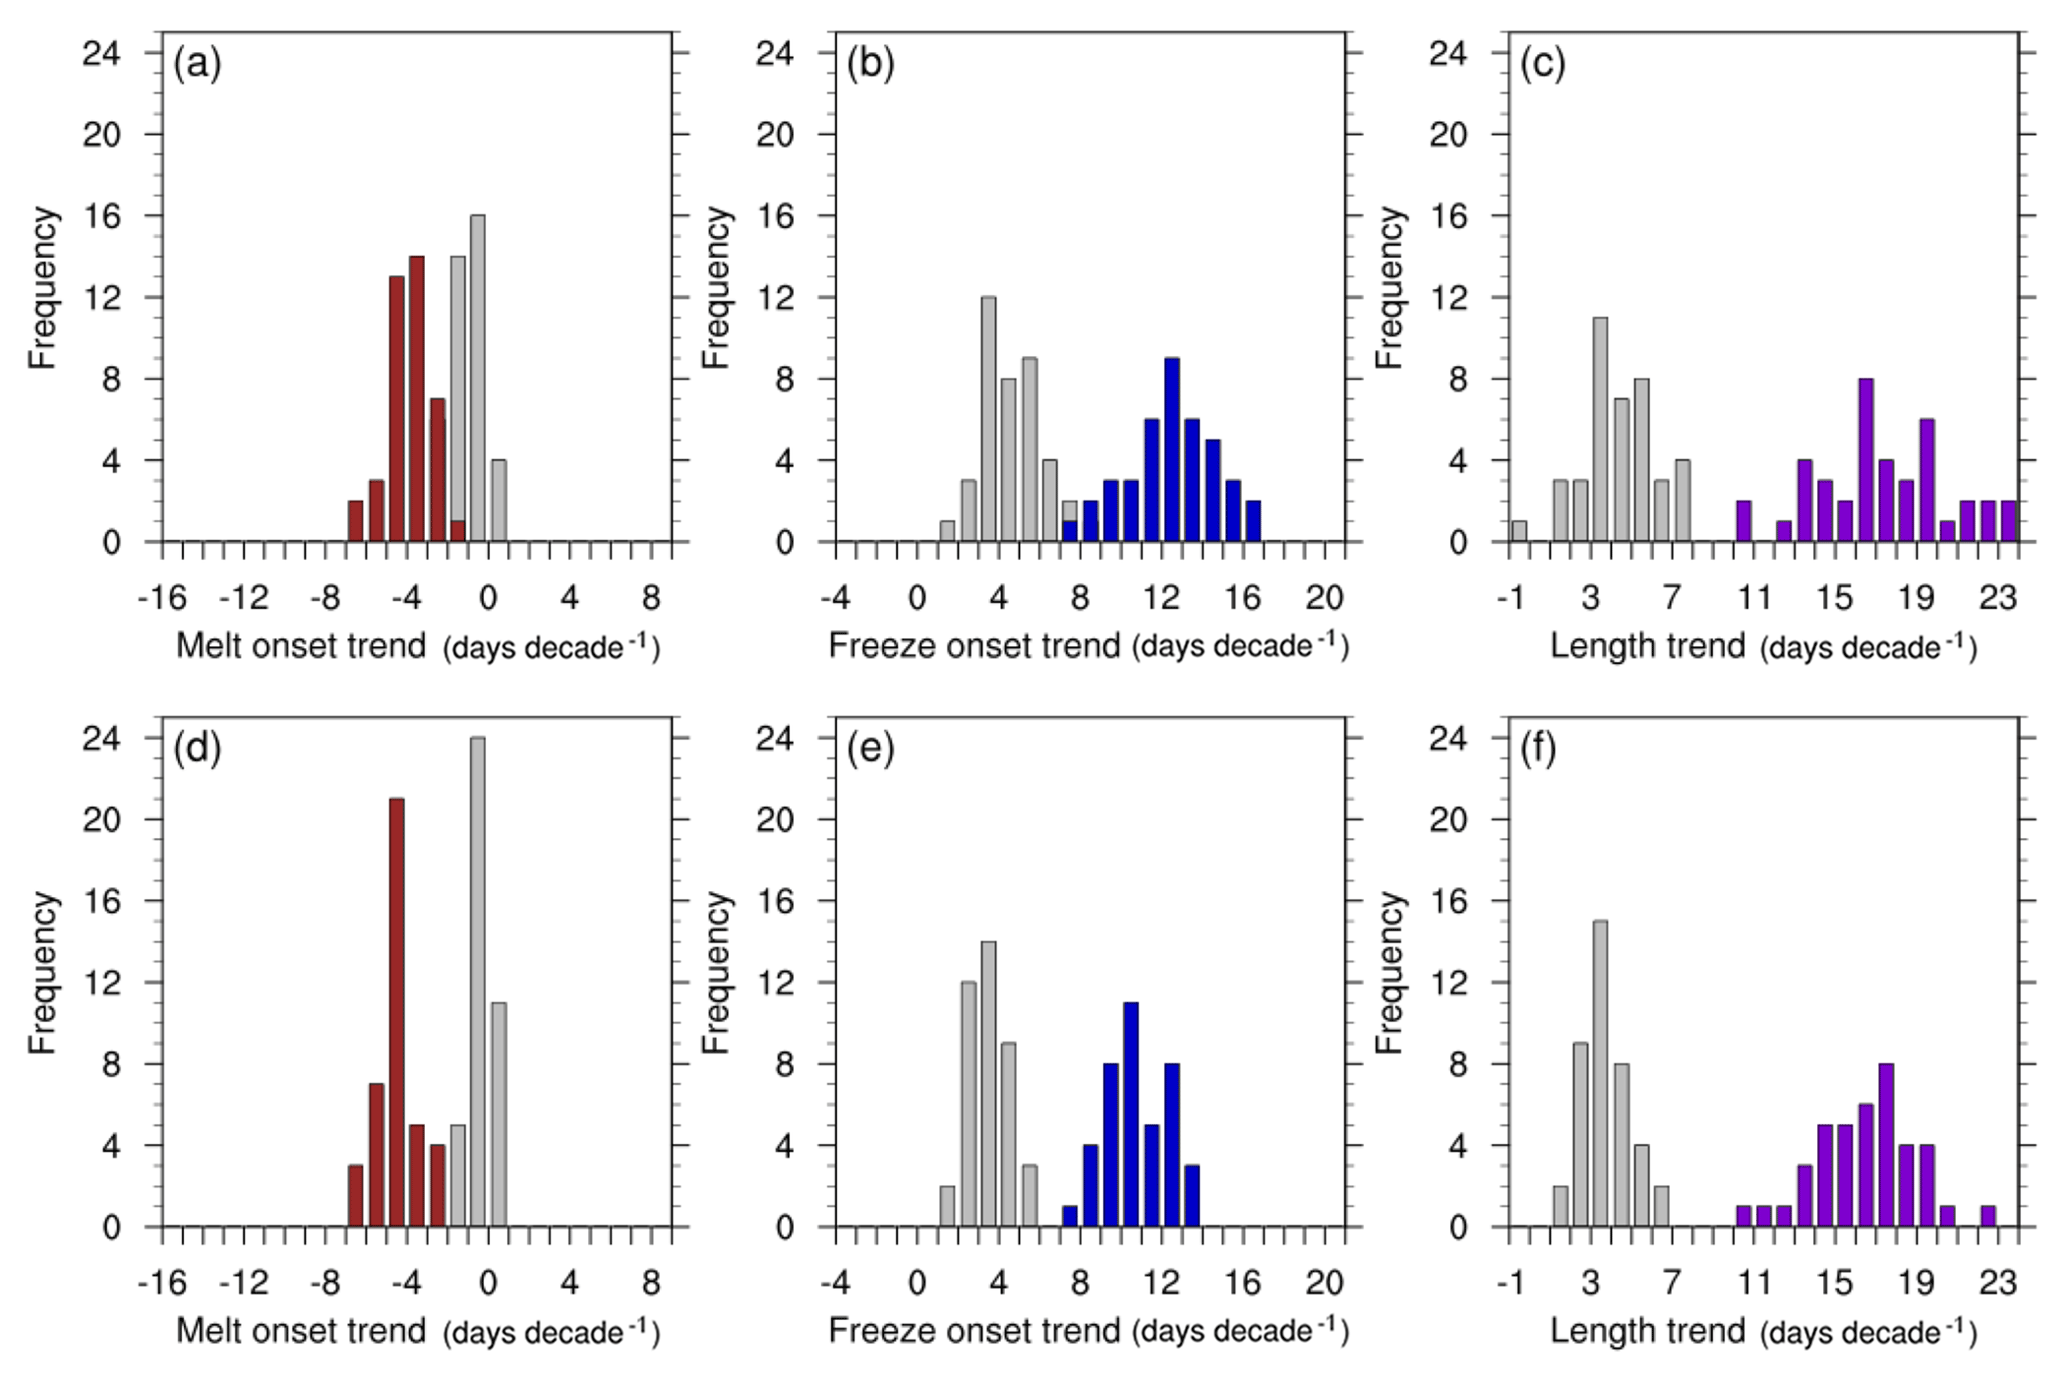
Figure 14Histograms of the pan-Arctic trends in melt season characteristics for 1979–2014 (shaded in gray) and for the end of the 21st century (2064–2099, shaded in red for melt onset, blue for freeze onset and purple for melt season length). This shows the change in the trends over the 21st century as well as the changing impact of internal variability on these trends. The histograms use the surface temperature definitions (a–c) and thermodynamic ice volume tendency definitions (d–f) for all 40 CESM LE ensemble members. Note that the x-axis range is the same (25 days decade−1) for all panels shown in this figure, but different from Fig. 6.
3.5 Pan-Arctic projections under RCP8.5 forcing
All CESM LE definitions project larger changes in freeze onset than in melt onset by the end of the 21st century, and this pattern is consistent with modeled and observed trends over the satellite era. Under RCP8.5 forcing, pan-Arctic melt onset dates are projected to occur 1–2 weeks earlier by the middle of the 20th century, while freeze onset dates are projected to occur 1–2 months later (Table 4). By the end of the 21st century, pan-Arctic melt onset dates are projected to occur 2 weeks to a month earlier under RCP8.5. At the same time, pan-Arctic freeze onset dates are projected to occur in January of the following year, which is 3–4 months later than modeled and observed freeze onset dates over the satellite era. Later freeze onset dates are the primary driver of future changes in pan-Arctic melt season length under RCP8.5, and the melt season is projected to be 5–6 months long by the middle of the 21st century and 7–9 months long by the end of the 21st century (compared to 3–4 months long over the satellite era). The largest changes in projected melt season length are seen in the Chukchi, Beaufort and Barents seas (Fig. 13).
Spatial differences between definitions of melt season length decrease over the 21st century (Fig. 13). This is consistent with the increasing similarity seen in the pan-Arctic means of melt season length (Fig. 1). Variations between definitions decrease as the sea ice extent, and therefore the areal coverage of melt and freeze onset, decreases over the simulation, shrinking the region of study towards the central Arctic (Fig. S8). The only definition that gets less similar to the others over time is the snowmelt-derived melt onset definition. This is caused by a more dramatic decrease in areal coverage compared to other melt definitions (Fig. S8), due to the projected decline of spring snow cover on sea ice (Blanchard-Wrigglesworth et al., 2015).
Melt season length definitions become more similar in large part due to the freeze onset component. In particular, the area covered by the surface temperature freeze onset definition becomes more similar to the area covered by the thermodynamic ice volume tendency freeze onset definition (Fig. S8). This is likely due to the ice growth–thickness relationship (Bitz and Roe, 2004), since thinner ice is less insulating and hence allows freeze onset quickly after temperatures drop below freezing. A lack of insulation also affects the increasingly large area of open water (Barnhart et al., 2016), where changes in surface temperature can quickly trigger frazil ice growth. Thus, as ice coverage decreases, the dates of freeze onset get more similar between surface temperature and thermodynamic ice volume tendency definitions.
Additionally, the internal variability of melt season characteristics depends on definition and is projected to increase through the 21st century. Figures 2 and 6 show that surface temperature definitions of melt onset, freeze onset and melt season length yield greater variations between ensemble members than thermodynamic ice volume tendency definitions over the satellite era. This is also true over the period 2064–2099, as seen in Fig. 14, which shows the shift in ensemble trends between 1979–2014 and 2064–2099. In all melt season characteristics and definitions, the range of the pan-Arctic trends increases between 1979–2014 and 2064–2099, indicating melt onset, freeze onset and melt season length could be even more affected by internal variability in the future. Average pan-Arctic melt season characteristics also yield greater ranges over 2064–2099 (not shown). Changing internal variability means that future observations will be compared to a wider possible range of modeled melt season characteristics, making model bias detection even more challenging.
Melt season length plays an important role in the radiation balance of the Arctic and the predictability of sea ice cover. Ideally, we could compare model simulations of melt season characteristics to remote sensing observations to quantify model biases, but there are three major sources of uncertainty in this approach. First, internal variability in the climate system inherently limits how well model projections fit satellite observations of melt and freeze onset (Notz, 2015). Second, there are multiple possible definitions for sea ice melt and freeze onset in climate models, and none of them exactly correspond to the definitions used by remote sensing methods (Jahn et al., 2012), which rely on PMW brightness temperatures (Markus et al., 2009). Third, observational data of melt and freeze onset have uncertainties, for example due to inconsistencies in source data, inter-sensor calibration and masking techniques (Bliss et al., 2017). In this study, we investigate the first two sources of uncertainty, namely the impact of definition choices and internal variability for diagnosing Arctic sea ice melt season characteristics (melt onset, freeze onset and melt season length). We utilize model simulations of the CESM LE with the goal of assessing how melt season projections are impacted by these factors, and to determine how satellite observations can be used for model evaluation using melt season characteristics.
We find that while some similarities exist between PMW observations and CESM LE definitions, no single definition fully captures the satellite observations. Definitions of melt season length show impacts of both melt and freeze onset definitions: a large range between definitions, related primarily to the melt onset, and a large range between ensemble members, related primarily to the freeze onset. The average spread between the shortest and longest pan-Arctic melt season length definitions is over 40 days during the satellite period, primarily because of differences in the melt onset definitions. In particular, the thermodynamic ice volume tendency definition (which is affected by surface, lateral and basal melt) produces melt onset dates much earlier than the surface definitions using snowmelt or surface temperature, which capture snowmelt rather than ice melt. These results indicate that the choice of melt onset definition is highly dependent on the application, and therefore on which processes one is aiming to capture – sea ice melt or snowmelt. The PMW observations of melt onset, which capture snowmelt, therefore cannot be used for comparison to model definitions based on sea ice variables that capture ice melt. Even the snowmelt melt onset definition is not a perfect fit to PMW satellite observations. Furthermore, we find that in the late 21st century, the snowmelt melt onset definition in the model could become less effective for capturing melt onset over large areas of the Arctic, as spring snow cover on sea ice is projected to decline under RCP8.5 forcing (Blanchard-Wrigglesworth et al., 2015). How this decline might impact PMW brightness temperature-derived satellite observations is unclear.
In contrast to the melt onset definitions, the investigated freeze onset definitions show greater agreement between each other in terms of averages, spatial patterns and trends over the satellite era. However, they are still not identical, as the surface temperature definition produces slightly earlier freeze onset dates than the other three definitions, which are derived from sea ice variables. The earlier freeze onset dates from the surface temperature definition indicate that changes in surface temperature are driving sea ice formation, therefore producing more comparable definitions for freeze onset than for melt onset (where surface temperature predominantly affects snowmelt, but not ice melt). The earlier freeze onset dates found in the surface temperature definition also agree well with PMW observations, particularly in the central Arctic. As PMW observations likely capture refreezing of liquid water within the snow on the sea ice in the central Arctic, rather than the formation of new ice, a better agreement with the surface temperature definition than the ice-based definitions makes sense. Furthermore, since refreezing of liquid water in the snow is not accounted for in the CESM LE, only the surface temperature definition in the CESM captures surface processes.
Future projections show that the CESM LE definitions of freeze onset become even more similar to each other over time. This is likely due to thinning ice, which reduces insulation and allows for faster ice growth once surface temperatures fall below freezing (Bitz and Roe, 2004). The fact that surface temperature drives ice growth also has important implications for internal variability. CESM LE freeze onset definitions experience greater internal variability than melt onset definitions. Similarly, surface temperature definitions are more variable than those based on thermodynamic ice volume tendency. This shows that the internal variability of a selected definition variable impacts the internal variability of the derived melt and freeze onset.
In both PMW observations and CESM LE definitions, earlier pan-Arctic melt onset tends to be followed by later pan-Arctic freeze onset over the satellite era, in agreement with previous work (Stroeve et al., 2014). However, while the ensemble mean clearly shows this forced response, internal variability affects this relationship and can reverse this relationship for individual years in the CESM LE over the satellite era.
The pan-Arctic trend in melt season length is driven mostly by the trend in freeze onset in the CESM LE, in agreement with previous work for the PMW melt season length (Stroeve et al., 2014). Yet, despite the use of multiple plausible definitions and 40 ensemble members, no model definition produces trends in the pan-Arctic melt season as large as PMW observations. The inability of the CESM to produce pan-Arctic melt season lengths as large as observations suggests a model bias. In particular, the marginal ice zones consistently show smaller trends for all model definitions of freeze onset and melt season length than PMW observations. This melt season trend bias may have important implications for September sea ice. High correlations exist between September sea ice sensitivity and melt season length over the satellite era in the CESM LE. Observational uncertainty in sea ice sensitivity is substantial (Niederdrenk and Notz, 2018), but the data used here indicate that the CESM LE may underestimate September sea ice sensitivity. It is therefore possible that an underestimation of the trend in CESM LE melt season length is one factor contributing to the potential biases in the simulated sea ice sensitivity in the CESM.
Under RCP8.5 forcing, the CESM LE projects that the Arctic sea ice melt season will last 7–9 months by the end of the 21st century, compared to 3–4 months over the satellite era, with later freeze onset dates continuing to be the dominant driver of these changes. Internal variability in melt season characteristics is also projected to increase by the end of the 21st century. This means that definition differences and internal variability will continue to be factors complicating model–observation comparisons of the Arctic sea ice melt season, particularly since they are both projected to change over time.
CESM LE data are publicly available at the National Center for Atmospheric Research Climate Data Gateway (https://www.earthsystemgrid.org/, last access: 8 November 2017). PMW satellite observations are publicly available at the NASA Cryosphere Science Research Portal (https://neptune.gsfc.nasa.gov/csb/index.php?section=54, last access: 16 May 2016).
The supplement related to this article is available online at: https://doi.org/10.5194/tc-13-1-2019-supplement.
AJ conceived the study, and AS analyzed the data and prepared the manuscript, with guidance and edits from AJ.
The authors declare that they have no conflict of interest.
This work is supported by the National Science Foundation Graduate Research
Fellowship under grant no. DGE 1144083. We thank Julienne Stroeve and
Thorsten Markus for sharing their passive microwave dataset of melt and
freeze onset dates and helpful discussions. We also thank two anonymous
referees for their constructive comments. Discussions with David Bailey,
Julienne Stroeve, Maxwell Boykoff and Jennifer Kay on this work and
discussions at the 2016 FAMOS workshop are appreciated. The CESM project is
supported by the National Science Foundation and the Office of Science (BER)
of the U.S. Department of Energy. Computing resources for the CESM ensembles
were provided by the Climate Simulation Laboratory at NCAR's Computational
and Information Systems Laboratory (CISL), sponsored by the National Science
Foundation and other agencies. Five of the CESM LE simulations were produced
at the University of Toronto under the supervision of Paul Kushner. NCL
(NCL, 2017) was used for data analysis.
Edited
by: John Yackel
Reviewed by: two anonymous referees
Barnhart, K. R., Miller, C. R., Overeem, I., and Kay, J. E.: Mapping the future expansion of Arctic open water, Nat. Clim. Change, 6, 1–36, https://doi.org/10.1038/NCLIMATE2848, 2016. a, b
Belchanksy, G., Douglas, D., and Platonov, N.: Duration of the Arctic Sea Ice Melt Season: Regional and Interannual Variability, J. Climate, 17, 67–80, https://doi.org/10.1175/1520-0442(2004)017<0067:DOTASI>2.0.CO;2, 2004. a
Bitz, C. and Roe, G.: Low-frequency variability in the Arctic atmosphere, sea ice, and upper-ocean climate system, J. Climate, 9, 3623–3632, https://doi.org/10.1175/1520-0442(1996)009<0394:LFVITA>2.0.CO;2, 1996. a
Bitz, C. M. and Roe, G. H.: A Mechanism for the High Rate of Sea Ice Thinning in the Arctic Ocean, J. Climate, 17, 3623–3632, https://doi.org/10.1175/1520-0442(2004)017<3623:AMFTHR>2.0.CO;2, 2004. a, b
Blanchard-Wrigglesworth, E., Farrell, S. L., Newman, T., and Bitz, C. M.: Snow cover on Arctic sea ice in observations and an Earth System Model, Geophys. Res. Lett., 42, 10342–10348, https://doi.org/10.1002/2015GL066049, 2015. a, b
Bliss, A. C., Miller, J. A., and Meier, W. N.: Comparison of passive microwave-derived early melt onset records on Arctic sea ice, Remote Sensing, 9, 1–23, https://doi.org/10.3390/rs9030199, 2017. a, b, c, d, e, f, g, h, i
Collow, T. W., Wang, W., and Kumar, A.: Prediction of Arctic Sea Ice Melt Date as an Alternative Parameter for Local Sea Ice Forecasting, Science and Technology Infusion Climate Bulletin, 40th NOAA Annual Climate Diagnostics and Prediction Workshop, Denver, CO, USA, 26–29 October 2015, 26–29, available at: http://www.nws.noaa.gov/ost/climate/STIP/40CDPW/40cdpw-TCollow.pdf (last access: 17 December 2018), 2015. a
Comiso, J.: Bootstrap Sea Ice Concentrations from Nimbus-7 SMMR and DMSP SSM/I-SSMIS, Version 3. March monthly means 1979–2014, Boulder, Colorado USA. NASA National Snow and Ice Data Center Distributed Active Archive Center, https://doi.org/10.5067/7Q8HCCWS4I0R, 2017. a, b
Deser, C., Walsh, J. E., and Timlin, M. S.: Arctic sea ice variability in the context of recent atmospheric circulation trends, J. Climate, 13, 617–633, https://doi.org/10.1175/1520-0442(2000)013<0617:ASIVIT>2.0.CO;2, 2000. a, b
Drobot, S. D. and Anderson, M. R.: An improved method for determining snowmelt onset dates over Arctic sea ice using scanning multichannel microwave radiometer and Special Sensor Microwave/Imager data, J. Geophys. Res.-Atmos., 106, 24033–24049, https://doi.org/10.1029/2000JD000171, 2001. a, b
Fetterer, F., Knowles, K., Meier, W., Savoie, M., and Windnagel, A.: Sea Ice Index, Version 3, updated daily. September monthly sea ice extent 1979–2014. Boulder, Colorado USA. NSIDC: National Snow and Ice Data Center, https://doi.org/10.7265/N5K072F8, 2017. a, b
GISTEMP: GISS Surface Temperature Analysis (GISTEMP), available at: https://data.giss.nasa.gov/gistemp, last access: 7 February 2017. a
HadCRUT.4.5.0.0: HadCRUT.4.5.0.0 near surface temperature data, available at: http://www.metoffice.gov.uk/hadobs/hadcrut4/data/current/download.html, last access: 7 February 2017. a
Hezel, P. J., Zhang, X., Bitz, C. M., Kelly, B. P., and Massonnet, F.: Projected decline in spring snow depth on Arctic sea ice caused by progressively later autumn open ocean freeze-up this century, Geophys. Res. Lett., 39, 6–11, https://doi.org/10.1029/2012GL052794, 2012. a
Holland, M. M. and Landrum, L.: Factors affecting projected Arctic surface shortwave heating and albedo change in coupled climate models, Philos. T. R. Soc. A, 373, 1–20, https://doi.org/10.1098/rsta.2014.0162, 2015. a, b
Hurrell, J. W., Holland, M. M., Gent, P. R., Ghan, S., Kay, J. E., Kushner, P. J., Lamarque, J.-F., Large, W. G., Lawrence, D., Lindsay, K., Lipscomb, W. H., Long, M. C., Mahowald, N., Marsh, D. R., Neale, R. B., Rasch, P., Vavrus, S., Vertenstein, M., Bader, D., Collins, W. D., Hack, J. J., Kiehl, J., and Marshall, S.: The Community Earth System Model: A Framework for Collaborative Research, B. Am. Meteorol. Soc., 94, 1339–1360, https://doi.org/10.1175/BAMS-D-12-00121.1, 2013. a
Jahn, A.: Reduced probability of ice-free summers for 1.5 ∘C compared to 2 ∘C warming, Nat. Clim. Change, 8, 409–413, https://doi.org/10.1038/s41558-018-0127-8, 2018. a, b, c, d, e, f
Jahn, A., Sterling, K., Holland, M. M., Kay, J. E., Maslanik, J. A., Bitz, C. M., Bailey, D. A., Stroeve, J., Hunke, E. C., Lipscomb, W. H., and Pollak, D. A.: Late-twentieth-century simulation of Arctic sea ice and ocean properties in the CCSM4, J. Climate, 25, 1431–1452, https://doi.org/10.1175/JCLI-D-11-00201.1, 2012. a, b
Jahn, A., Kay, J. E., Holland, M. M., and Hall, D. M.: How predictable is the timing of a summer ice-free Arctic?, Geophys. Res. Lett., 43, 9113–9120, https://doi.org/10.1002/2016GL070067, 2016. a, b
Jin, M., Deal, C., Wang, J., Alexander, V., Gradinger, R., Saitoh, S., Iida, T., Wan, Z., and Stabeno, P.: Ice-associated phytoplankton blooms in the southeastern Bering Sea, Geophys. Res. Lett., 34, 1–6, https://doi.org/10.1029/2006GL028849, 2007. a
Johnson, M. and Eicken, H.: Estimating Arctic sea-ice freeze-up and break-up from the satellite record: A comparison of different approaches in the Chukchi and Beaufort Seas, Elementa, 4, 1–16, https://doi.org/10.12952/journal.elementa.000124, 2016. a, b
Kay, J. E., Holland, M. M., and Jahn, A.: Inter-annual to multi-decadal Arctic sea ice extent trends in a warming world, Geophys. Res. Lett., 38, 2–7, https://doi.org/10.1029/2011GL048008, 2011. a
Kay, J. E., Deser, C., Phillips, A., Mai, A., Hannay, C., Strand, G., Arblaster, J. M., Bates, S. C., Danabasoglu, G., Edwards, J., Holland, M., Kushner, P., Lamarque, J. F., Lawrence, D., Lindsay, K., Middleton, A., Munoz, E., Neale, R., Oleson, K., Polvani, L., and Vertenstein, M.: The Community Earth System Model (CESM) Large Ensemble project: A community resource for studying climate change in the presence of internal climate variability, B. Am. Meteorol. Soc., 96, 1333–1349, https://doi.org/10.1175/BAMS-D-13-00255.1, 2015. a, b, c
Labe, Z., Magnusdottir, G., and Stern, H.: Variability of Arctic sea ice thickness using PIOMAS and the CESM Large Ensemble, J. Climate, 31, 3233–3247, https://doi.org/10.1175/JCLI-D-17-0436.1, 2018. a
Mahlstein, I. and Knutti, R.: September Arctic sea ice predicted to disappear near 2 ∘C global warming above present, J. Geophys. Res.-Atmos., 117, 1–11, https://doi.org/10.1029/2011JD016709, 2012. a, b
Markus, T., Stroeve, J. C., and Miller, J.: Recent changes in Arctic sea ice melt onset, freezeup, and melt season length, J. Geophys. Res.-Oceans, 114, 1–14, https://doi.org/10.1029/2009JC005436, 2009. a, b, c, d, e, f, g
Massonnet, F., Vancoppenolle, M., Goosse, H., Docquier, D., Fichefet, T., and Blanchard-Wrigglesworth, E.: Arctic sea-ice change tied to its mean state through thermodynamic processes, Nat. Clim. Change, 8, 599–603, https://doi.org/10.1038/s41558-018-0204-z, 2018. a
Mortin, J. and Graversen, R. G.: Evaluation of pan-Arctic melt-freeze onset in CMIP5 climate models and reanalyses using surface observations, Clim. Dynam., 42, 2239–2257, https://doi.org/10.1007/s00382-013-1811-z, 2014. a, b, c
NCDC: NCDC global surface temperature anomalies, available at: https://www.ncdc.noaa.gov/cag/time-series/global/globe/land-ocean/ytd/12/1880-2016.csv, last access: 7 February 2017. a
NCL: The NCAR Command Language (Version 6.4.0), Boulder, Colorado, UCAR/NCAR/CISL/TDD, https://doi.org/10.5065/D6WD3XH5, 2017. a
Niederdrenk, A. L. and Notz, D.: Arctic Sea Ice in a 1.5 ∘C Warmer World, Geophys. Res. Lett., 45, 1963–1971, https://doi.org/10.1002/2017GL076159, 2018. a, b, c
Notz, D.: How well must climate models agree with observations?, Philos. T. Roy. Soc. Lond. A, 373, 20140164, https://doi.org/10.1098/rsta.2014.0164, 2015. a, b
Perovich, D. K., Nghiem, S. V., Markus, T., and Schweiger, A.: Seasonal evolution and interannual variability of the local solar energy absorbed by the Arctic sea ice-ocean system, Journal of Geophysical Research: Oceans, 112, C03005, https://doi.org/10.1029/2006JC003558, 2007. a, b, c, d
Perovich, D. K., Jones, K. F., Light, B., Eicken, H., Markus, T., Stroeve, J., and Lindsay, R.: Solar partitioning in a changing Arctic sea-ice cover, Ann. Glaciol., 52, 192–196, https://doi.org/10.3189/172756411795931543, 2011. a
Persson, P. O. G.: Onset and end of the summer melt season over sea ice: Thermal structure and surface energy perspective from SHEBA, Clim. Dynam., 39, 1349–1371, https://doi.org/10.1007/s00382-011-1196-9, 2012. a
Pfirman, S., Eicken, H., Bauch, D., and Weeks, W.: The potential transport of pollutants by Arctic sea ice, Sci. Total Environ., 159, 129–146, https://doi.org/10.1016/0048-9697(95)04174-y, 1995. a
Rosenblum, E. and Eisenman, I.: Sea ice trends in climate models only accurate in runs with biased global warming, J. Climate, 30, 6265–6278, https://doi.org/10.1175/JCLI-D-16-0455.1, 2017. a, b, c, d
Smith, D. M.: Observation of perennial Arctic sea ice melt and freeze-up using passive microwave data, J. Geophys. Res.-Oceans, 103, 27753–27769, https://doi.org/10.1029/98JC02416, 1998. a, b
Steele, M., Ermold, W., and Zhang, J.: Arctic Ocean surface warming trends over the past 100 years, Geophys. Res. Lett., 35, 1–6, https://doi.org/10.1029/2007GL031651, 2008. a
Stern, H. L. and Laidre, K. L.: Sea-ice indicators of polar bear habitat, The Cryosphere, 10, 2027–2041, https://doi.org/10.5194/tc-10-2027-2016, 2016. a
Stroeve, J. C., Kattsov, V., Barrett, A., Serreze, M., Pavlova, T., Holland, M., and Meier, W. N.: Trends in Arctic sea ice extent from CMIP5, CMIP3 and observations, Geophys. Res. Lett., 39, 1–7, https://doi.org/10.1029/2012GL052676, 2012. a
Stroeve, J. C., Markus, T., Boisvert, L., Miller, J., and Barret, A.: Geophysical Research Letters, Geophys. Res. Lett., 41, 1216–1225, https://doi.org/10.1002/2013GL058951, 2014. a, b, c, d, e, f, g, h, i, j, k, l, m, n
Stroeve, J. C., Crawford, A. D., and Stammerjohn, S.: Using timing of ice retreat to predict timing of fall freeze-up in the Arctic, Geophys. Res. Lett., 43, 6332–6340, https://doi.org/10.1002/2016GL069314, 2016. a
Swart, N. C., Fyfe, J. C., Hawkins, E., Kay, J. E., and Jahn, A.: Influence of internal variability on Arctic sea-ice trends, Nat. Clim. Change, 5, 86–89, https://doi.org/10.1038/nclimate2483, 2015. a, b, c, d, e
Timmermans, M. L.: The impact of stored solar heat on Arctic sea ice growth, Geophys. Res. Lett., 42, 6399–6406, https://doi.org/10.1002/2015GL064541, 2015. a
Wang, L., Wolken, G. J., Sharp, M. J., Howell, S. E. L., Derksen, C., Brown, R. D., Markus, T., and Cole, J.: Integrated pan-Arctic melt onset detection from satellite active and passive microwave measurements, 2000–2009, J. Geophys. Res., 116, 2000–2009, https://doi.org/10.1029/2011JD016256, 2011. a, b
Wang, M., Yang, Q., Overland, J. E., and Stabeno, P.: Sea-ice cover timing in the Pacific Arctic: The present and projections to mid-century by selected CMIP5 models, Deep-Sea Res. Pt. II, 152, 22–34, 2017. a, b