the Creative Commons Attribution 4.0 License.
the Creative Commons Attribution 4.0 License.
 | 19 Nov 2018
What historical landfast ice observations tell us about projected ice conditions in Arctic archipelagoes and marginal seas under anthropogenic forcing
Frédéric Laliberté
Stephen E. L. Howell
Jean-François Lemieux
Frédéric Dupont
Ji Lei
Arctic landfast ice extent and duration are examined from observations, ice assimilations, ocean reanalyses and coupled models. From observations and assimilations, it is shown that in areas where landfast ice conditions last more than 5 months the first-year ice typically grows to more than 2 m and is rarely less than 1 m. The observed spatial distribution of landfast ice closely matches assimilation products but less so for ocean reanalyses and coupled models. Although models generally struggle to represent the landfast ice necessary to emulate the observed import/export of sea ice in regions favourable to landfast ice conditions, some do exhibit both a realistic climatology and a realistic decline of landfast ice extent under an anthropogenic forcing scenario. In these more realistic simulations, projections show that an extensive landfast ice cover should remain for at least 5 months of the year, well into the end of the 21st century. This is in stark contrast with the simulations that have an unrealistic emulation of landfast ice conditions. In these simulations, slow and packed ice conditions shrink markedly over the same period. In all simulations and in areas with landfast ice that lasts more than 5 months, the end-of-winter sea ice thickness remains between 1 and 2 m, well beyond the second half of the century. It is concluded that in the current generation of climate models, projections of winter sea ice conditions in the Canadian Arctic Archipelago and the Laptev Sea are overly sensitive to the representation of landfast ice conditions and that ongoing development in landfast ice parameterization will likely better constrain these projections.
- Article
(7602 KB) - Full-text XML
-
Supplement
(1095 KB) - BibTeX
- EndNote


Sea ice that is immobile because it is attached to land is termed “landfast”. In shallow coastal regions, large pressure ridges can be anchored to the sea floor. These grounded ridges might then act as anchor points to stabilize and maintain a landfast ice cover (Mahoney et al., 2007). However, landfast ice is also present in some coastal regions that are too deep for pressure ridges to become grounded. In this case, the ice can stay in place due to the lateral propagation of internal ice stresses that originate where the ice is in contact with the shore. Sea ice typically becomes landfast if its keel extends all the way to the sea floor or if ice stresses cannot overcome lateral friction at the coastline (Barry et al., 1979). Most landfast ice melts or becomes mobile each summer. Multi-year landfast ice (also termed an “ice-plug”) is rare but it is known to occur within the Nansen Sound and Sverdrup Channel regions within the Canadian Arctic Archipelago (CAA) (Serson, 1972, 1974). These ice-plugs were a prominent feature within the CAA from the 1960s (Nansen Sound) and 1970s (Sverdrup Channel) until they were both removed during the anomalously warm summer of 1998 and have since rarely re-formed (Alt et al., 2006). The disappearance of multi-year landfast ice is coincident with a decline in pan-Arctic landfast ice extent of approximately 7 % decade−1 from 1976 to 2007 (Yu et al., 2014). Landfast ice has not only shrunk in extent but has also thinned. While few long-term records of sea ice thickness exist, they all show a thinning of springtime landfast ice. The largest declines are generally found in the Barents Sea at 11 cm decade−1 (Gerland et al., 2008). Along the Russian coast and in the CAA, the thinning has generally been less pronounced and is on average less than 5 cm decade−1 (Polyakov et al., 2010 for Russia, Howell et al., 2016 for Canada).
Landfast ice is immobile and, therefore, its maximum ice thickness is primarily driven by thermodynamics from air temperature and the timing and amount of snowfall during the growth period (Brown and Cote, 1992). Because it isolates thermodynamics from import/export of sea ice, landfast ice is a convenient bellwether of the effect of anthropogenic forcing on the Arctic environment. This convenience has motivated several studies that investigated the sensitivity of landfast ice to anthropogenic forcing in both one-dimensional thermodynamic models (Flato and Brown, 1996; Dumas et al., 2006) and CAA-focused regional three-dimensional ice-ocean coupled models (e.g. Sou and Flato, 2009). Since the Sou and Flato (2009) study, several high-resolution global ocean and sea ice models have become available, thus making it possible to study the coupled response of landfast ice to anthropogenic forcing. These models include the Community Earth System Model Large Ensemble (CESM-LE), coupled climate models from the Coupled Model Intercomparison Project phase 5 (CMIP5) and from the Ocean Reanalysis Intercomparison Project (ORA-IP). Howell et al. (2016) provide a preliminary investigation of the aforementioned climate models within the CAA over a 50+ year record from 1957 to 2014 and found that they provide a reasonable climatology but trends were unrealistic compared to observations.
In this study, we provide a more comprehensive investigation into the variability of landfast ice extent and thickness from the current generation of climate models for the Arctic-wide domain and also evaluate their response to anthropogenic forcing. As climate models do not output a dedicated landfast ice variable and as the ice velocity does not completely vanish when landfast ice is simulated, we first develop an approach to characterize landfast ice. We then describe the historical evolution of landfast ice extent and springtime landfast ice thickness as well as their future projections in models. Finally, we compare the coupled model simulations with our own pan-Arctic ice-ocean simulations.
2.1 Observations
One of the longest records of landfast ice thickness and duration comes from several coastal stations throughout Canada that date back to the late 1940s, depending on the location. The data set is available online at the Canadian Ice Service (CIS) website (http://www.ec.gc.ca/glaces-ice/, last access: 30 October 2018; see Archive followed by ice thickness data). The thickness measurements are usually performed weekly from freeze-up to break-up, as long as it is safe to walk on the ice. For these reasons, the landfast ice duration at these stations, measured as the number of weeks with measurements, is always biased on the shorter side, possibly by a few weeks. From these station records, we selected the four sites in the CAA that had continuous records up to 2015: Alert, Eureka, Resolute and Cambridge Bay. From these weekly records available from 1960 to 2015, we extracted the landfast ice duration and springtime landfast ice thickness. A thorough analysis of these quantities as derived from these records was initially presented by Brown and Cote (1992) from 1957 to 1989 and recently updated to 2014 by Howell et al. (2016).
For additional ice thickness information we use ice thickness surveys in landfast regions of the CAA carried out by means of airborne electromagnetic induction (AEM) sounding in 2011 and 2015 previously described in Haas and Howell (2015). These surveys were averaged on a 25 km EASE 2.0 grid and are shown in Fig. S1 in the Supplement. We also use weekly ice thicknesses retrieved from CryoSat-2/SMOS in netCDF format for the years 2010–2016, obtained from data.scienceportal.de and remapped using a nearest-neighbour remapping to a 25 km EASE 2.0 grid. The resulting winter maximum sea ice thicknesses are shown in Fig. S2 in the Supplement.
In order to spatially map landfast ice we use the National Ice Center (NIC) ice charts products from the NSIDC (data set ID G02172) and ice charts from the Canadian Ice Service Digital Archive (CISDA). The NIC ice charts are available from 1972 to 2007 but we restrict the time period to 1980–2007 to be consistent with CISDA. Indeed, the CISDA provide ice information before 1980 but landfast ice was not explicitly classified. We refer readers to Tivy et al. (2011) (CISDA) and Yu et al. (2014) (NIC) for in-depth descriptions of ice chart data and their validity as a climate record. Following Galley et al. (2010), who also used the CIS ice chart data to map landfast ice, we consider grid cells with sea ice concentration of 10/10ths to be landfast. We defined pan-Arctic landfast extent using the NIC ice charts (given their larger spatial domain) as the regions that are covered by landfast ice for at least 1 month in the climatology. Both the NIC and CISDA ice charts were converted from shape files to a 0.25∘ latitude–longitude grid and then converted using a nearest-neighbour remapping to a 25 km Equal-Area Scalable Earth (EASE) 2.0 grid. We compute the number of months (equivalent to “percent of the year” in Galley et al., 2012) during which each grid cell was landfast for each time period from September to August.
2.2 Models
Climate simulations and reanalyses do not provide a variable that explicitly characterizes landfast ice conditions. This makes it challenging to verify how it emulates landfast ice conditions compared to observations. To circumvent this limitation, we use daily sea ice thickness (hereafter, sit), sea ice concentration (hereafter, sic) and sea ice velocities (hereafter, usi and vsi) to synthetically characterize landfast sea ice conditions using the following procedure:
-
On the original model grid, we set the land mask to its nearest neighbour and remap using a nearest-neighbour remapping usi, vsi and sit to the sic native grid. Finally, we use a nearest-neighbour remapping to put all variables on a EASE 2.0 grid.
-
The sea ice speed (hereafter, speedsi) is computed from usi and vsi on this new grid.
-
Daily speedsi, sit and sic are averaged to weekly means.
-
A grid cell is identified as having “packed ice” if the remapped weekly mean sic is larger than 85 %.
-
A grid cell is identified as having “slow ice” if the remapped weekly mean speedsi is less than 1 cm s−1 (∼1 km day−1).
-
Slow, packed ice is used as a proxy for landfast ice.
At each grid cell we then compute the number of months in each year with slow, packed ice. Using slow, packed ice is representative because we are interested in one specific aspect of landfast ice: the fact that its growth is primarily driven by thermodynamics and not by the import/export of sea ice. This procedure is used with the Pan-Arctic Ice-Ocean Modeling and Assimilation System (PIOMAS) (Zhang and Rothrock, 2003), a subset of the highest-resolution models (see Table 3, Storto et al., 2011; Forget et al., 2015; Haines et al., 2014; Zuo et al., 2015; Masina et al., 2015) from the ORA-IP (Balsameda et al., 2015; Chevallier et al., 2017). Finally, we use the CESM-LE and CMIP5 models to analyze climatological landfast ice extent and thicknesses. Some ORA-IP models (ORAP5.0, UR025.4) do not provide daily output. For these models, monthly data were first interpolated to daily frequency and from then on the analysis was performed using the procedure described above. It should be noted that sea ice velocities are not provided by all models and only for a few simulations, constraining the scope of the intercomparison presented here (see available models in Table 1). The data for this study were retrieved from the ESGF using the cdb_query tool (https://github.com/laliberte/cdb_query, last access: 9 April 2017). Finally, the 1980–2005 historical experiment followed by the 2006–2015 Representative Concentration Pathway 8.5 (RCP85) experiment (Taylor et al., 2012) are used with daily sea ice velocities, thickness and concentration.
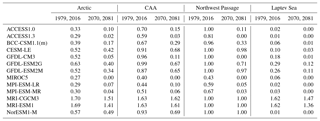
Table 1Fraction of NIC landfast ice extent (magenta line in Fig. 2b) covered by slow, packed ice with a duration of more than 5 months for different models, regions and periods.
In the summer, the sea ice concentration drops below 100 % for some models but it stills remains relatively high throughout the melt season. In these models (e.g. NorESM1 and ACCESS1.0), the reduction in summer ice concentration is not associated with increased sea ice speed (i.e. close to 0 correlation between the two variables over a year), unlike in the PIOMAS product, where a strong anti-correlation between the two variables can be measured. This suggests that these models may indeed have an ice concentration below 100 % during the summer but the import/export of sea ice remains quite limited because the packed ice never becomes mobile enough in narrow channels, particularly within the CAA. As a result, one must allow for some flexibility in the definition of packed ice in modelled products and a number below 100 % needs to be chosen as a cut-off. Here, we have chosen 85 % because (i) it represents landfast ice that ice grows according to thermodynamics and not because of export/import and (ii) it is widely accepted that in historical observational products a 15 % uncertainty in sea ice concentration is to be expected. Since we are using historical observation products in our comparison, we argue that the same 15 % uncertainty should be used when assessing model behaviour. We acknowledge that, by using an 85 % ice concentration to define packed ice, the lead fraction could be large at the boundary of the slow, packed ice, due to the proximity of mobile ice. In these regions, the argument presented above might break down. In this work, we will primarily focus on archipelagoes and marginals seas where this is not an issue. It is, however, important to keep in mind that, for applications that focus on those boundary regions, this criterion might be too lenient.
The models listed above do not represent the grounding of pressure ridges. Hence, they are not expected to perform well in regions where grounding is known to be an important mechanism for the formation and stabilization of a landfast ice cover. Observations show that grounding is important in the Laptev Sea (Haas et al., 2005; Selyuzhenok et al., 2018), in the Beaufort Sea (Mahoney et al., 2007) and in the Chukchi Sea (Mahoney et al., 2014). Nevertheless, these models can simulate landfast ice in some regions because the models dynamics take into account the aforementioned mechanical interactions. For most of these sea ice models, ice interactions are represented by a viscous–plastic rheology with an elliptical yield curve (Hibler, 1979).
Recently, a basal stress parameterization representing the effect of grounding was developed (Lemieux et al., 2015). This parameterization calculates, based on simulated ice conditions, the largest ridge(s) at each grid point. When these subgrid-scale ridge(s) are able to reach the sea floor, a basal (or seabed) stress term is added to the sea ice momentum equation. This grounding scheme clearly improves the simulation of landfast ice in regions such as the Alaskan coast, the Laptev Sea and the East Siberian Sea. However, in deeper regions such as the Kara Sea, Lemieux et al. (2015) pointed out that their model systematically underestimates the area of landfast ice. As the grounding scheme is less active in these deeper regions, Lemieux et al. (2016) modified the viscous–plastic rheology to promote ice arching.
Following the work of Lemieux et al. (2016), we conducted simulations that combined the grounding scheme and a modified viscous–plastic rheology. We used the optimal parameters k1=8 and k2=15 Nm−3 for the grounding scheme (Lemieux et al., 2015). Given a certain mean thickness in a grid cell and a concentration, the grounding scheme determines whether the parameterized ridges reach the sea floor or not (which depends on k1) and defines the maximum seabed stress that can be sustained by the grounded ridges (which is proportional to k2). As opposed to the standard elliptical yield curve, the ellipse aspect ratio is set to 1.5 (instead of 2) and a small amount of isotropic tensile strength is used (kt = 0.05).
For these simulations, we used the ocean model NEMO version 3.1 and the sea ice model CICE version 4.0 with code modifications to include the grounding scheme and to add tensile strength (Lemieux et al., 2016). Our 0.25∘ grid is a subset of the global ORCA mesh. It covers the Arctic Ocean, the North Atlantic and the North Pacific. This ice-ocean prediction system, which includes tides, was developed as part of the CONCEPTS (Canadian Operational Network of Coupled Environmental PredicTion Systems) initiative. We refer to our 0.25∘ model set-up and simulations as CREG025 (CONCEPTS-regional 0.25∘).
Note that, while adding the tides to our ice-ocean prediction systems, we found that unrealistic sea thicknesses developed in late winter in tidally active regions (e.g. Foxe Basin). To mitigate this problem, the Hibler (1979) ice strength parameterization is used as opposed to the default Rothrock (1975) formulation. The ice strength parameter P* was set to 27.5 k Nm−2 for our CREG025 simulation.
The sea ice model was initialized with sea ice thicknesses and concentrations from the GLORYS2V1 ocean reanalyses. The ocean model was initialized by the World Ocean Atlas (WOA13) climatology and forced at open boundaries by GLORYS2V3 (Ferry et al., 2010; Chevallier et al., 2017). A spin-up from October 2001 to September 2004 was performed. Free runs (no assimilation) are then restarted from the fields in September 2004 and conducted up to the end of 2010. The simulation was forced by 33 km Environment Canada atmospheric reforecasts (Smith et al., 2014).
3.1 Landfast ice duration and thickness
The CAA is almost entirely covered by landfast ice for up to 8 months of the year (i.e. November to July) (Canadian Ice Service, 2011) and is therefore a useful region in which to begin evaluating a model representation of landfast ice duration and thickness. Figure 1 illustrates the relationship between landfast ice thickness and duration within the CAA for the observed data sets (e.g. CryoSat-2, AEM and in situ) in addition to PIOMAS and CREG025. When combining these heterogeneous data sources, a general picture of their representativeness of ice thickness over landfast ice duration emerges. Based on in situ observations landfast ice within the CAA lasts from 4 to ∼9 months and grows to ∼2 m, which is in agreement with previous studies (e.g. Brown and Cote, 1992; Canadian Ice Service, 2011; Howell et al., 2016). For PIOMAS, CREG025 and CryoSat-2 ice thickness standard deviations are close to the variability observed at the in situ locations. However, very thick ice upwards of ∼4 m is encountered at the 95th percentile in both the CryoSat-2 and the PIOMAS data when the landfast ice lasts for more than 9 months. These very stable and thick landfast conditions are the result of large multi-year ice floes, thus increasing the average ice thickness. It has long been known that MYI forms in situ within the CAA, and very thick MYI from the Arctic Ocean is also advected into the region (e.g. Melling, 2002), which is evident from the airborne EM measurements thickness values (Haas and Howell, 2015). This mix of ice types makes it challenging for models to represent ice thickness within the CAA but, overall, they are in reasonable agreement with observations.
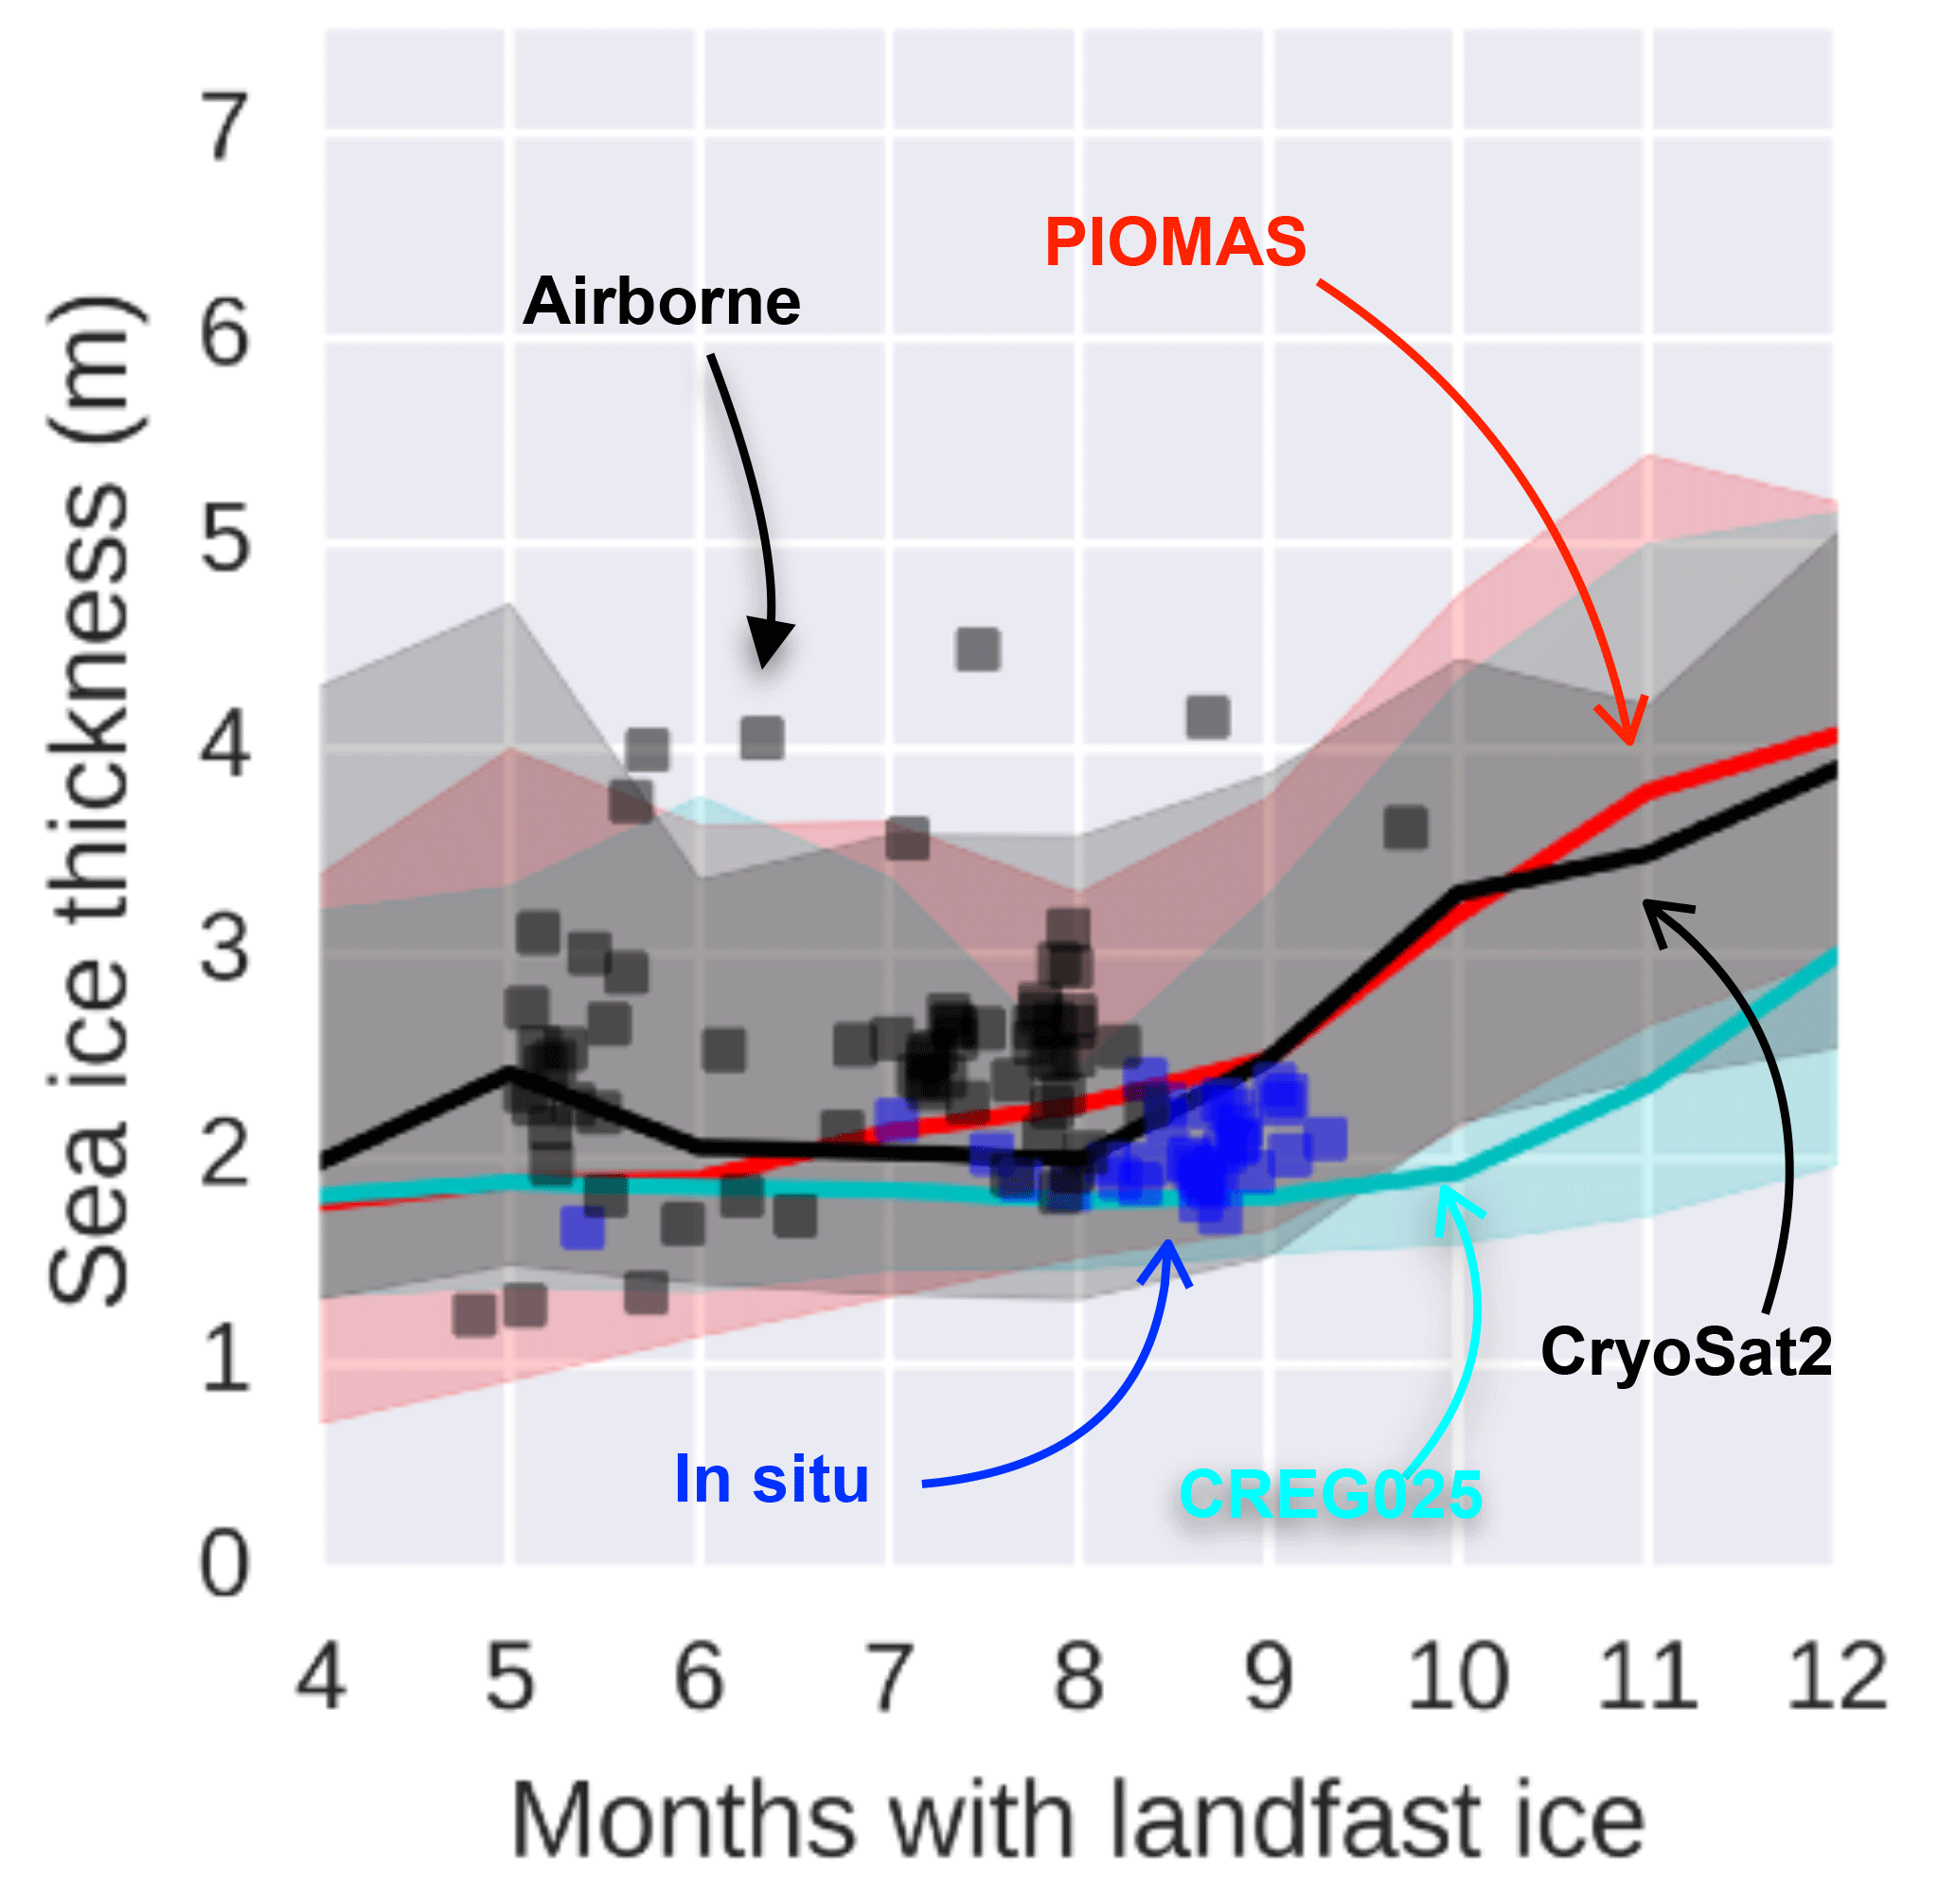
Figure 1Canadian Arctic Archipelago (CAA) PIOMAS maximum ice thickness against landfast ice duration from Canadian Ice Service (CIS) ice charts over the 1980–2015 period (the mean is the thick red line, 95 one-sided percentile is the red shading). In black, the same is shown for CryoSat2 instead of PIOMAS over the period 2010–2015 (see Fig. S1 in the Supplement for coverage). In cyan, the same is shown for the operational model CREG025 instead of PIOMAS over the years 2004–2010. In black squares, the same is shown for airborne electromagnetic measurements in spring 2011 and 2015 over a small region of the CAA (see Fig. S2 for coverage). In blue squares, the same in shown for the in situ CIS Ice Monitoring programme at Cambridge Bay, Resolute Bay, Eureka and Alert over the period 1980–2015.
3.2 Geographical distribution and climatology
The spatial distribution of annual landfast duration from observations (CIS and NIC), PIOMAS and selected ocean reanalysis models is shown in Fig. 2. Both ice charts products (CIS and NIC) show similar landfast ice extents and durations in the CAA (Fig. 2a and b). This landfast ice extent is also very similar in the two ice chart products over their regions of overlap (Fig. 2a and b, magenta curve). In PIOMAS, the duration of slow and packed ice conditions compares relatively well to the overall landfast extent and duration in the ice chart products (Fig. 2c). There is, however, too much of the slow and packed ice in the Beaufort Sea but too little in the Laptev and Kara seas. Most ocean reanalysis products have a suitable representation of slow, packed ice conditions in the CAA, the notable exception being CGLORS and UR025.4 (not shown). In the CGLORS case, the ice component appears to still be in spin-up at the beginning of the integration period because there is an unphysical interannual variability in the first few years of the simulation, and therefore results should not be expected to conform to observations. In the UR025.4 case, winter ice is packed but is too mobile in the Parry Channel and the M'Clintock Channel.

Figure 2(a) Historical landfast ice annual duration as reported in the CIS ice charts. (b) Same as (a) but as reported in the National Ice Center (NIC) ice charts. (c) Slow (<0.864 km day−1), packed (>85 % concentration) ice annual duration as modelled by the assimilation product PIOMAS. (d)–(f) Same as (c) but for different ocean reanalyses participating in the ORA-IP. The landfast ice extent, calculated as the 1980–2007 average 1-month landfast duration contour from NIC ice charts, is shown in magenta.
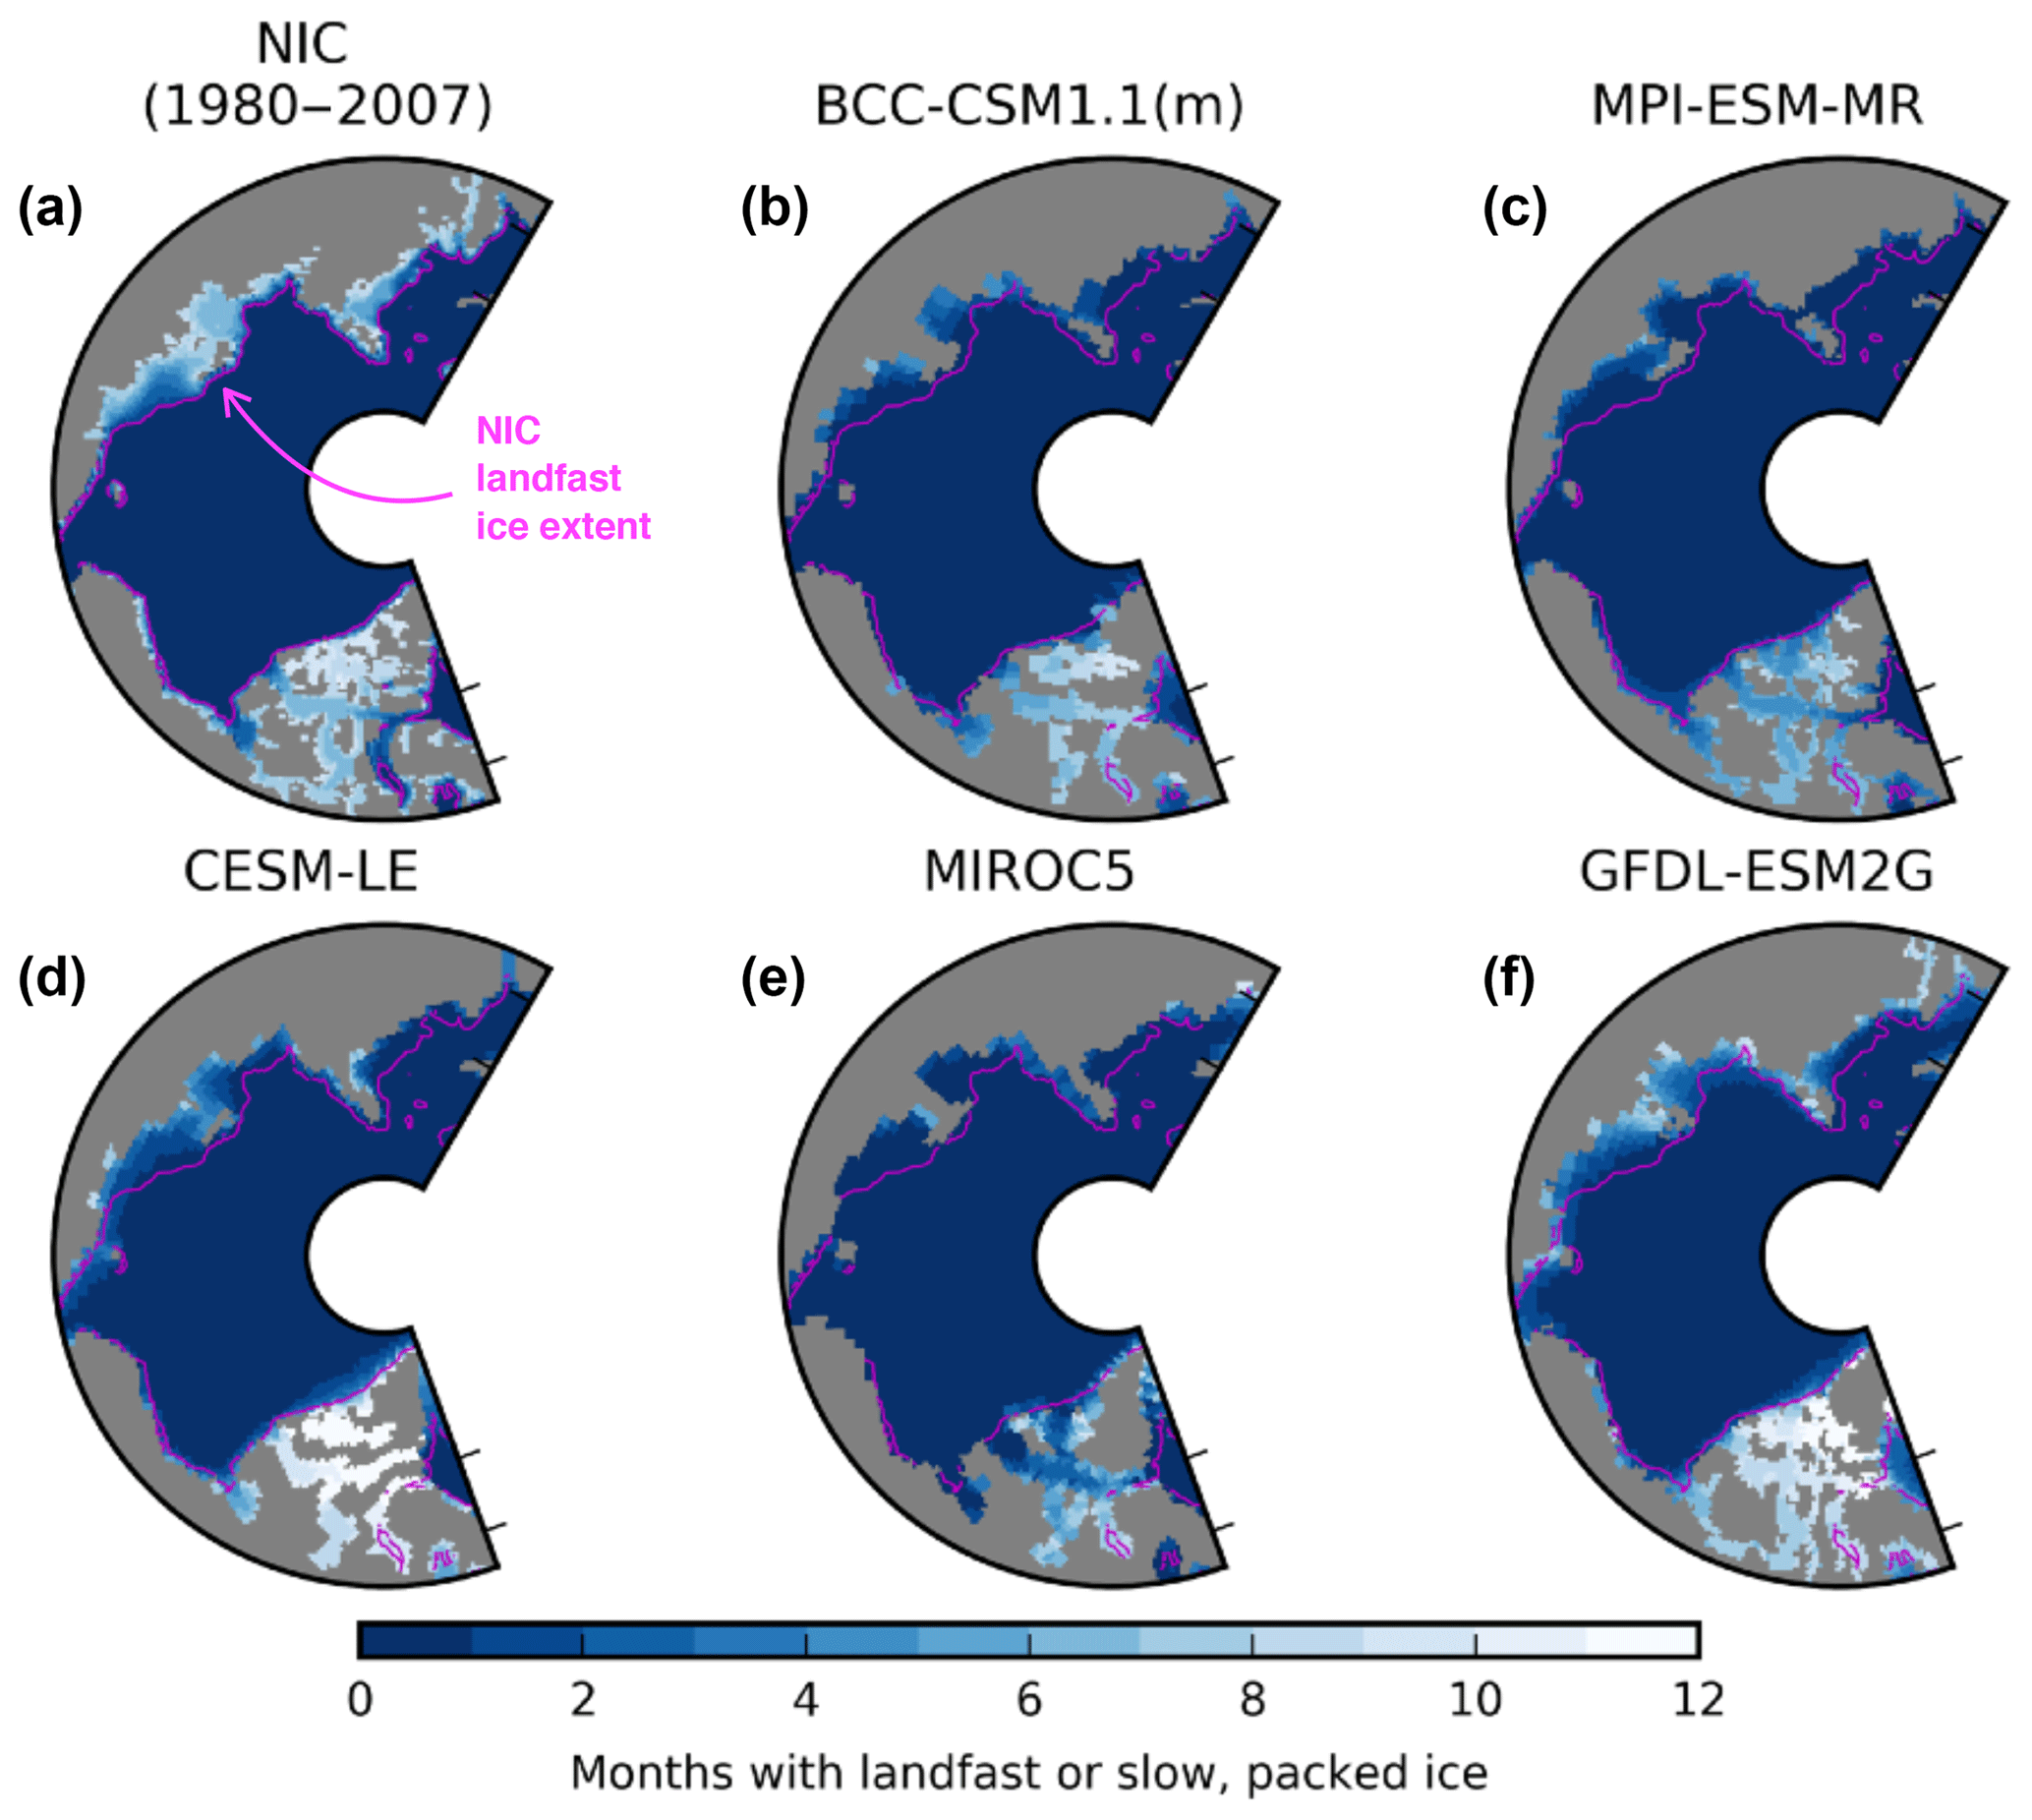
Figure 3(a) Same as Fig. 2b. (b)–(f) Same as Fig. 2d–h except for a subset of simulations from the CMIP5 RCP8.5 scenario over the period 1980–2015.
The spatial distribution of annual landfast ice duration in CMIP5 models with higher resolution is illustrated in Fig. 3b–h. These models exhibit a reasonable slow, packed ice extent and duration but it is mostly confined to the CAA (Fig. 3b–h). The exception is the MRI-ESM1 (and applies to the other models from the MRI), which simulates slow, packed ice conditions year-round across the Arctic (not shown). This is likely due to its sea ice being modelled as a simple viscous fluid without a sophisticated rheology. Compared to the NIC analyses, all the CMIP5 models and reanalyses do not have enough months of landfast ice on the Russian coast. GFDL-ESM2G , CESM-LE and PIOMAS are the ones that provide the best landfast ice simulation in the Laptev, Kara and East Siberian seas (Figs. 2c and 3d, f). Another important feature of the import/export of sea ice in coupled models (ACCESS 1.0, CESM-LE, GFDL-ESM2G) seems to be the tendency for many of them to emulate year-round or close to year-round landfast ice in the Parry Channel regions of the CAA (Fig. 3d, f, ACCESS 1.0 not shown). This is peculiar, since this would mean that ice likely takes years to transit through the Parry Channel, allowing thermodynamic forcing to create very thick ice in a region. Note that, in the remaining models, the MIROC5 and MPI-ESM-MR both emulate a landfast ice duration in the Parry Channel that is too short (Fig. 3c, e).
3.3 Trends in landfast ice duration
The largest observed negative trends in landfast ice duration of up to 1 month decade−1 is found primarily in the East Siberian Sea but a general negative trend is located across the Arctic (Fig. 4a, b), as also reported by Yu et al. (2014). In the CAA, trends are larger in the NIC ice charts but both the CIS and NIC show relatively weak decline in duration in the Parry Channel and the M'Clintock Channel. These relatively small trends are in stark contrast with the very large trends almost everywhere in the CAA in the PIOMAS simulations. For CGLORS, the model with sea ice still in spin-up, there is a large positive increase in slow, packed ice duration (not shown). Such increases are also seen in the Beaufort Sea in the GLORYS2V3 reanalysis, indicating that towards the end of the reanalysis the Beaufort Sea is covered by slow, packed ice for a few months per year (Fig. 4f). This is in complete disagreement with observations and mandates that extra care should be taken when using this product to analyze the import/export of sea ice in the Beaufort Sea. In summary, reanalysis products appear to have a particularly difficult time reproducing the long-term stability of the slow, packed ice distribution, suggesting that targeted efforts to improve this aspect of their import/export of sea ice are likely necessary.

Figure 4Same as Fig. 2 but for the trends in landfast ice duration over the indicated period. Significant trends (p>0.05) are indicated with stippling. Stippling was removed from some grid points to account for the false discovery rate (Wilks, 2006).
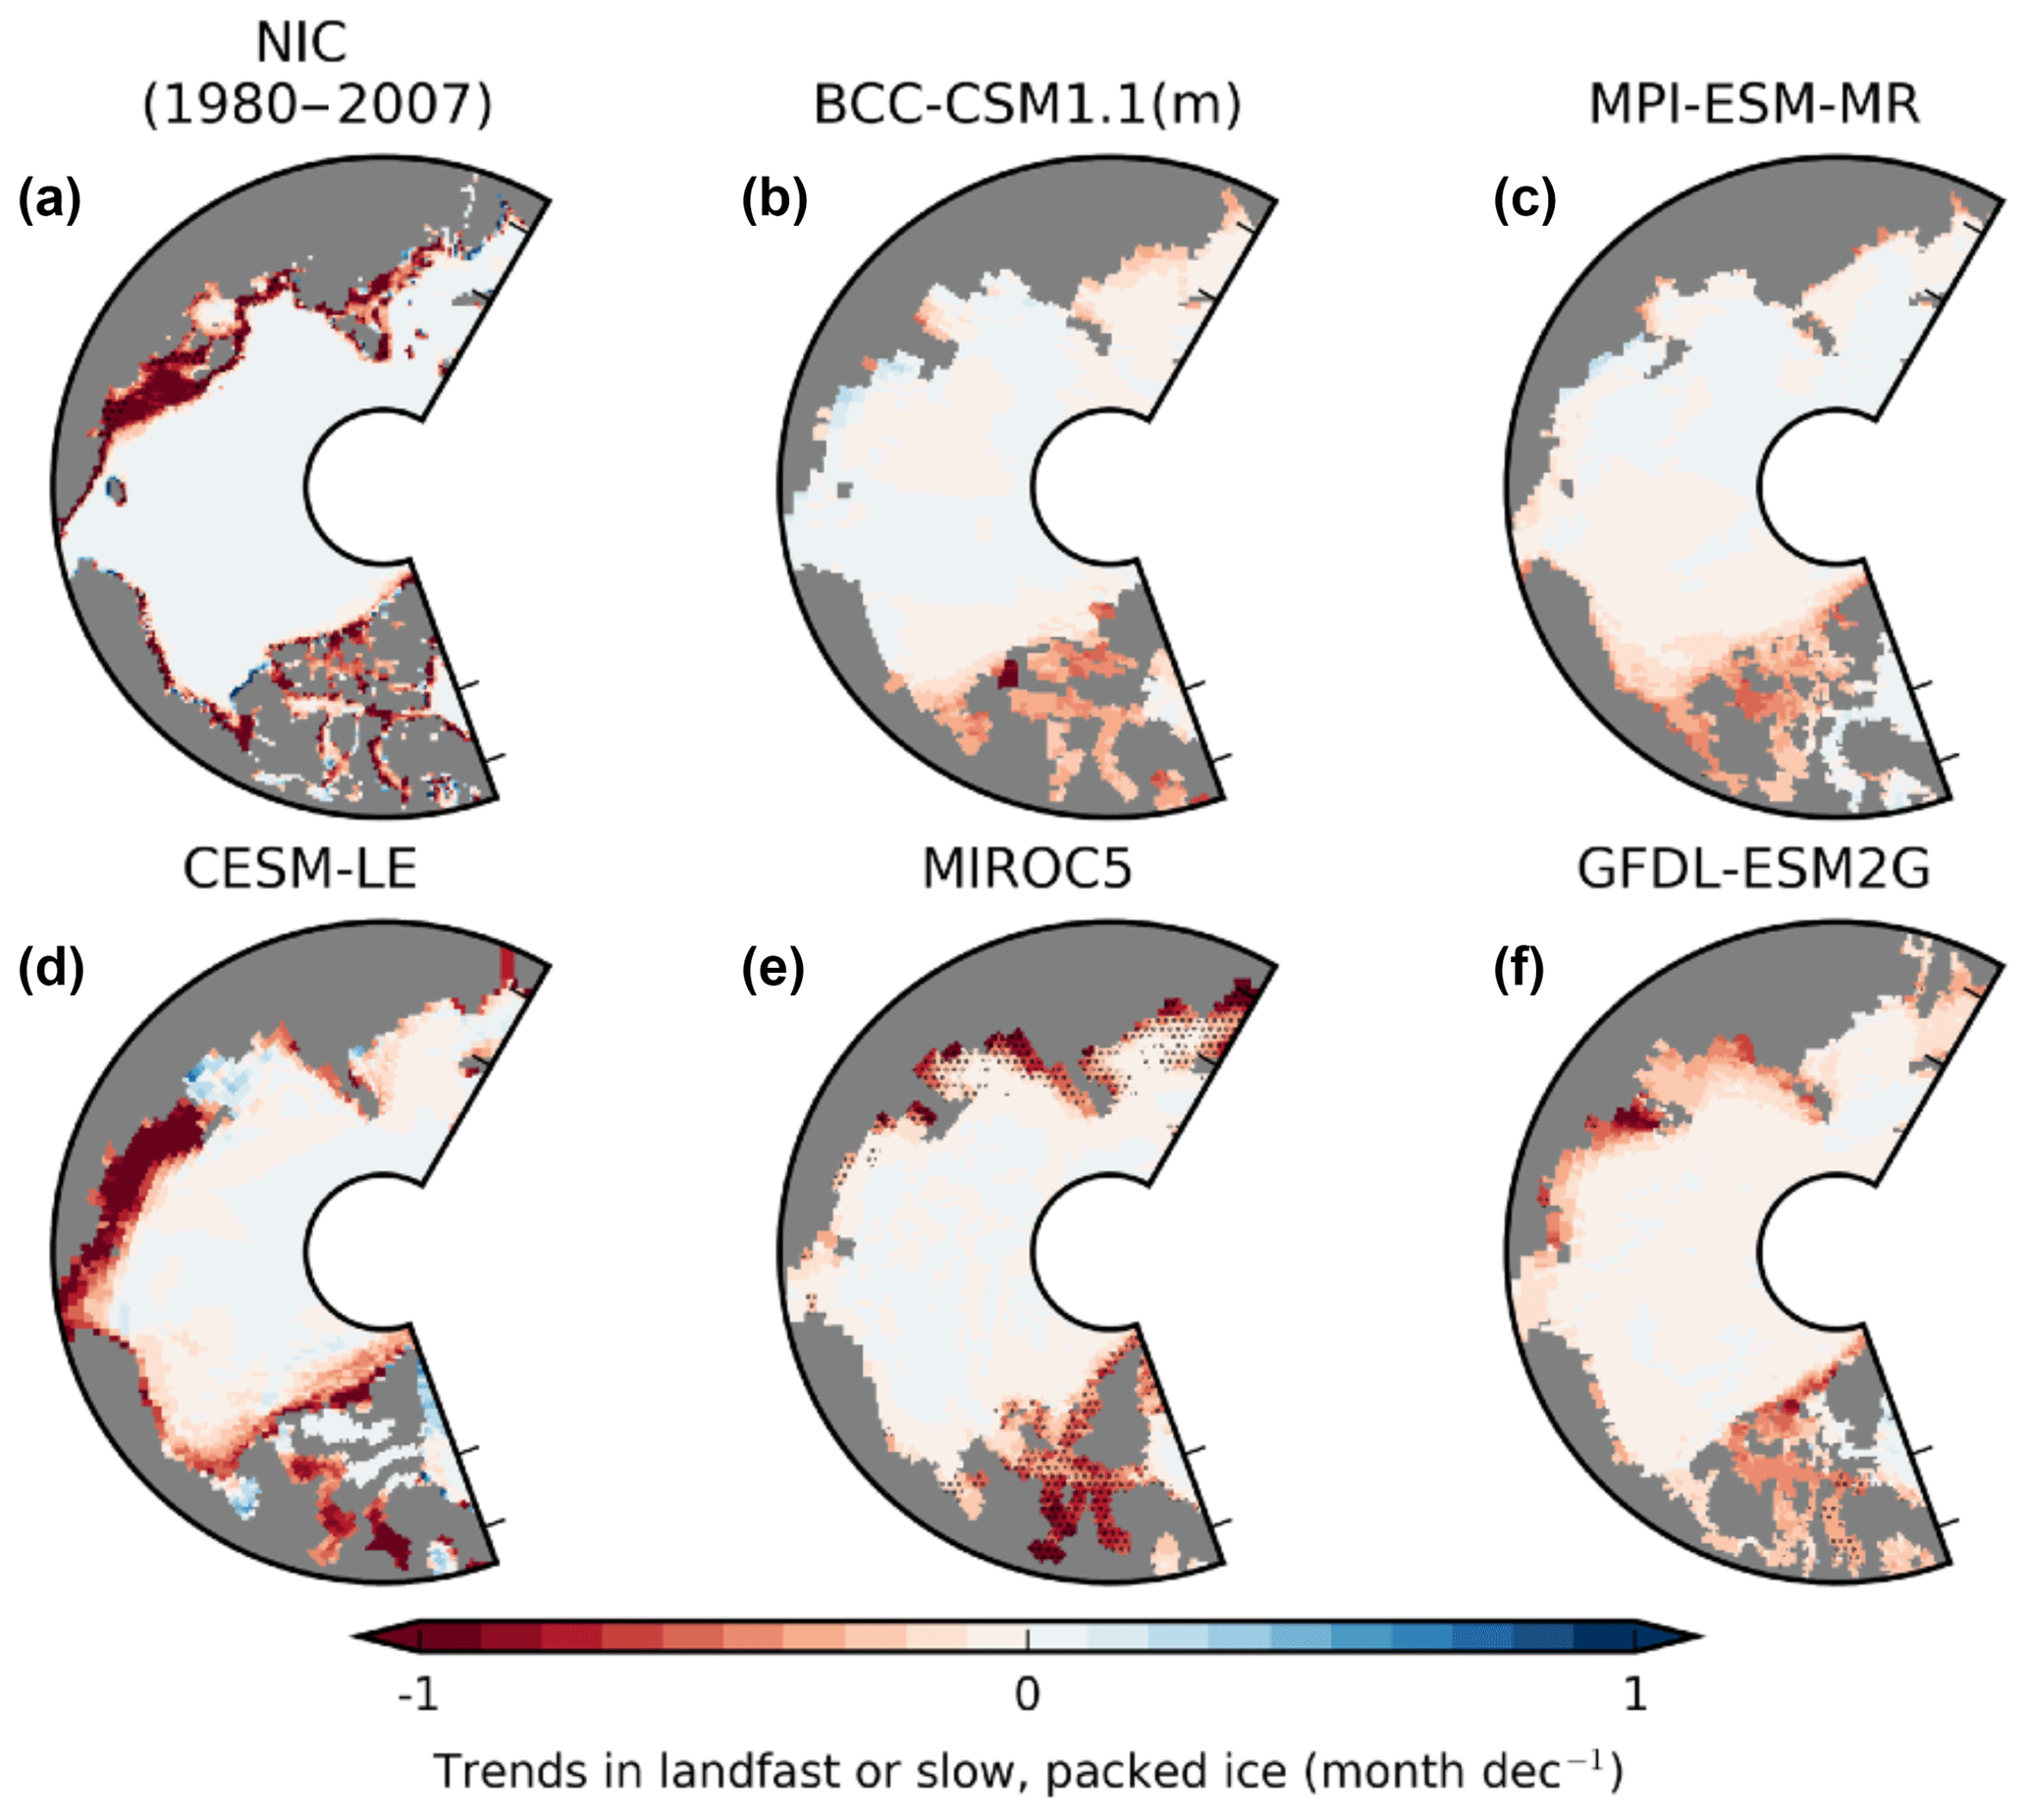
Figure 5(a) Same as Fig. 5. (b)–(f) Same as (a) but for the models in Fig. 3b–f over the period 1980–2015.
CMIP5 models sea ice simulations (except the MRI models for the reason explained above), on the other hand, fare relatively well at representing negative trends in landfast ice duration when compared to observations (Fig. 5). Most models tend to show an enhanced disappearance of slow, packed conditions along the Beaufort Sea edge of the CAA and declines that are in general agreement with observation in the Parry Channel. One exception is the CESM-LE where some year-round slow, packed ice conditions do not decline over the 1980–2015 period (Fig. 5d). The models with less slow, packed ice than in observations, MIROC5 and MPI-ESM-MR, show relatively strong declines that, if they continued, would indicate an almost complete disappearance of slow, packed ice by the middle of the 21st century.
3.4 Regional evaluation of landfast ice extent and thickness
We now take a closer regional examination of landfast ice extent in the CAA, Northwest Passage (Parry Channel route) and Laptev seas. These regions are expected to experience increases in shipping activity from the middle to late 21st century according to model simulations (Smith and Stephenson, 2013; Melia et al., 2016). Instead of using an absolute measure of extent, we report extent as a fraction of the ocean surface within the bounds of the NIC 1-month duration landfast ice extent climatology (magenta line in Fig. 2b). This approach is necessary to appropriately compare observations to models that represent the islands and channels of the CAA differently.
Over the 1980–2015 time period, landfast ice extent has declined dramatically for durations longer than 5 months with a marked decline in the extent of landfast ice with a 7 to 8 months duration within the Northwest Passage (Fig. 6). What is, however, striking is how the extent of landfast ice extent with duration of 5 months or less has been mostly constant over the last 35 years (Fig. 6). It is because of this observation that we have not included a trend analysis in Fig. 6. If the trend in landfast area depends so strongly on landfast ice duration, it would probably be misleading to attribute a hard number to the decline in landfast ice. If sea ice-albedo feedback is an important player in recent sea ice decline (e.g. Perovich et al., 2007) then it is not entirely surprising that during the polar night landfast ice conditions re-establish themselves year after year, even in the context of rapid Arctic warming. Finally, it is also worth noting that Fig. 6a indicates that the small amounts of multi-year landfast ice within the CAA have virtually disappeared in recent years (i.e. the 11-month line has been at 0 since 2002), consistent with Alt et al. (2006).
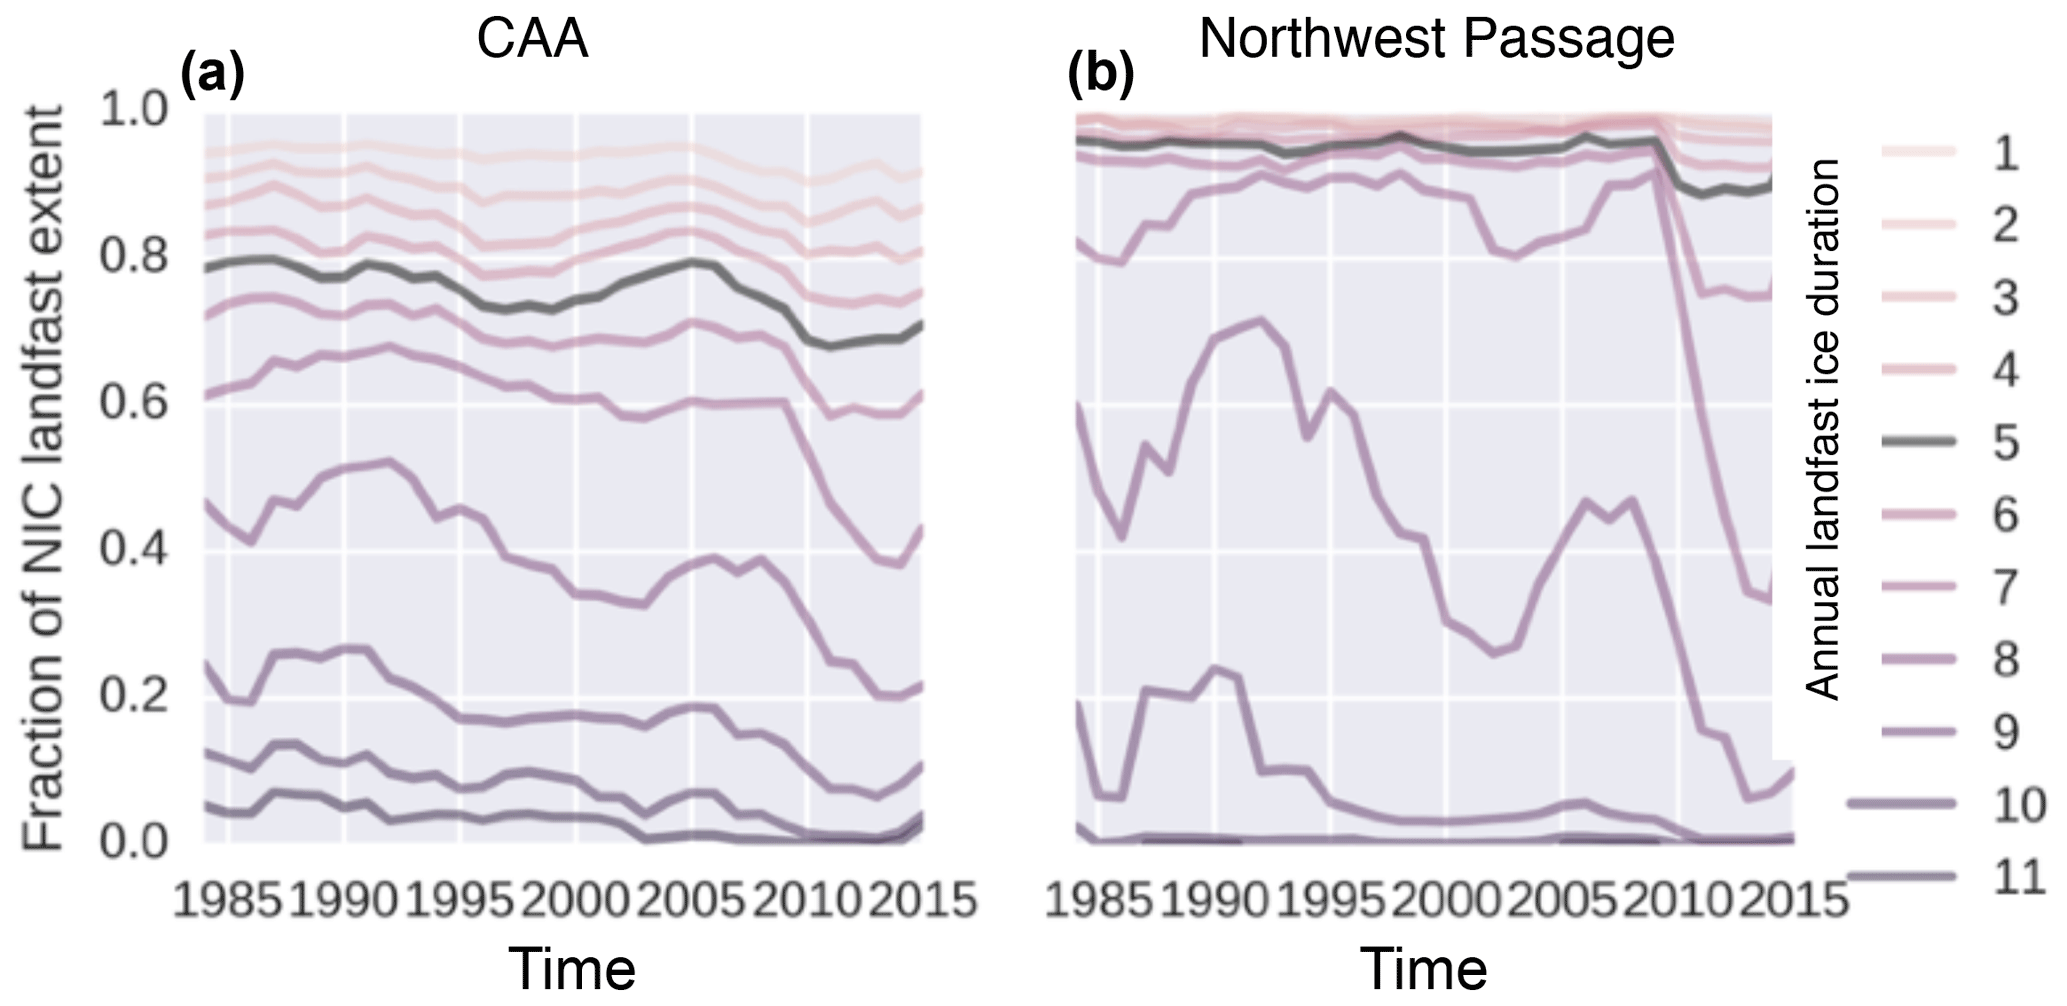
Figure 6(a) Time series (5-year running-mean) of the fraction of NIC landfast ice extent over the CAA (magenta line in Fig. 2b) covered by landfast ice from CIS ice charts for more than the number of months indicated by the line colour. (b) Same as (a) but over the Northwest Passage.

Figure 7(a) Time series of the fraction of NIC landfast ice extent (magenta line in Fig. 2b) covered by landfast ice (slow, packed ice for PIOMAS and CREG025) with a duration of more than 5 months over the CAA. (b) Same as (a) but over the Northwest Passage. (c) Same as (b) but over the Laptev Sea.
Landfast ice extent in the CAA and Northwest Passage is well represented in the PIOMAS data assimilation product as it compares well with the CIS and NIC ice chart products, although the NIC product does exhibit stronger interannual variability (Fig. 7a, b). In the Laptev Sea, PIOMAS clearly underestimates the area of landfast ice when compared to the NIC ice charts (Fig. 7c). This is likely due to the fact that PIOMAS does not represent the effect of grounding, an important mechanism for the formation and stability of the Laptev Sea landfast ice cover (Selyuzhenok et al., 2017). Despite this area of landfast ice in the Laptev Sea being too small, PIOMAS exhibits a decline of ∼25 % of the landfast extent over the last 35 years, which is consistent with the one from the NIC ice charts.
Comparing current (1980–2015) to projected (2070–2080) landfast ice extent from CMIP5 in these regions reveals considerable changes, which are summarized in Table 1. The seven models with the smallest extent of 1979–2015 CAA slow, packed ice (ACCESS1.0, ACCESS1.3, BCC-CSM1.1(m), GFDL-CM3, MIROC5, MPI-ESM-LR, MPI-ESM-MR) lose most of it by 2070–2080, while the four models with a large extent of 1979–2015 CAA slow, packed ice (CESM-LE, GFDL-ESM2G, GFDL-ESM2M, NorESM1-M) retain most of it by 2070–2080. As mentioned earlier, two models have unrealistic behaviour (MIR-ESM, MRI-CGCM3) because their sea ice model is based on a simple perfect fluid.
Looking specifically in the CAA, current conditions (Fig. 8a, black) indicate that the CMIP5 distribution is trimodal: one mode has an extent comparable to observations (at 0.6 to 0.8 of NIC extent), a second mode has a much lower extent (at 0.2–0.6 of NIC extent) and a third mode has an extent that covers most of the area (∼1.0 of NIC extent). In the CAA, this trimodal distribution yields a bimodal distribution in 2070–2080 projections (Fig. 8a, yellow): one mode still has an extent comparable to observations and a second mode has virtually no 5-month landfast ice extent left. In the Northwest Passage, the story is much simpler (Fig. 8b). All considered models are entirely covered with slow, packed ice conditions at least 5 months every year for their historical simulations but in the 2070–2080 projections about half become devoid of it, while the other half retain their historical conditions. This highlights the difficulty of projecting how the import/export of sea ice will react to anthropogenic forcing in the narrow channels of the CAA. Finally, in the Laptev Sea, almost all considered models have little slow, packed ice now and by 2070–2080 (Fig. 8c).
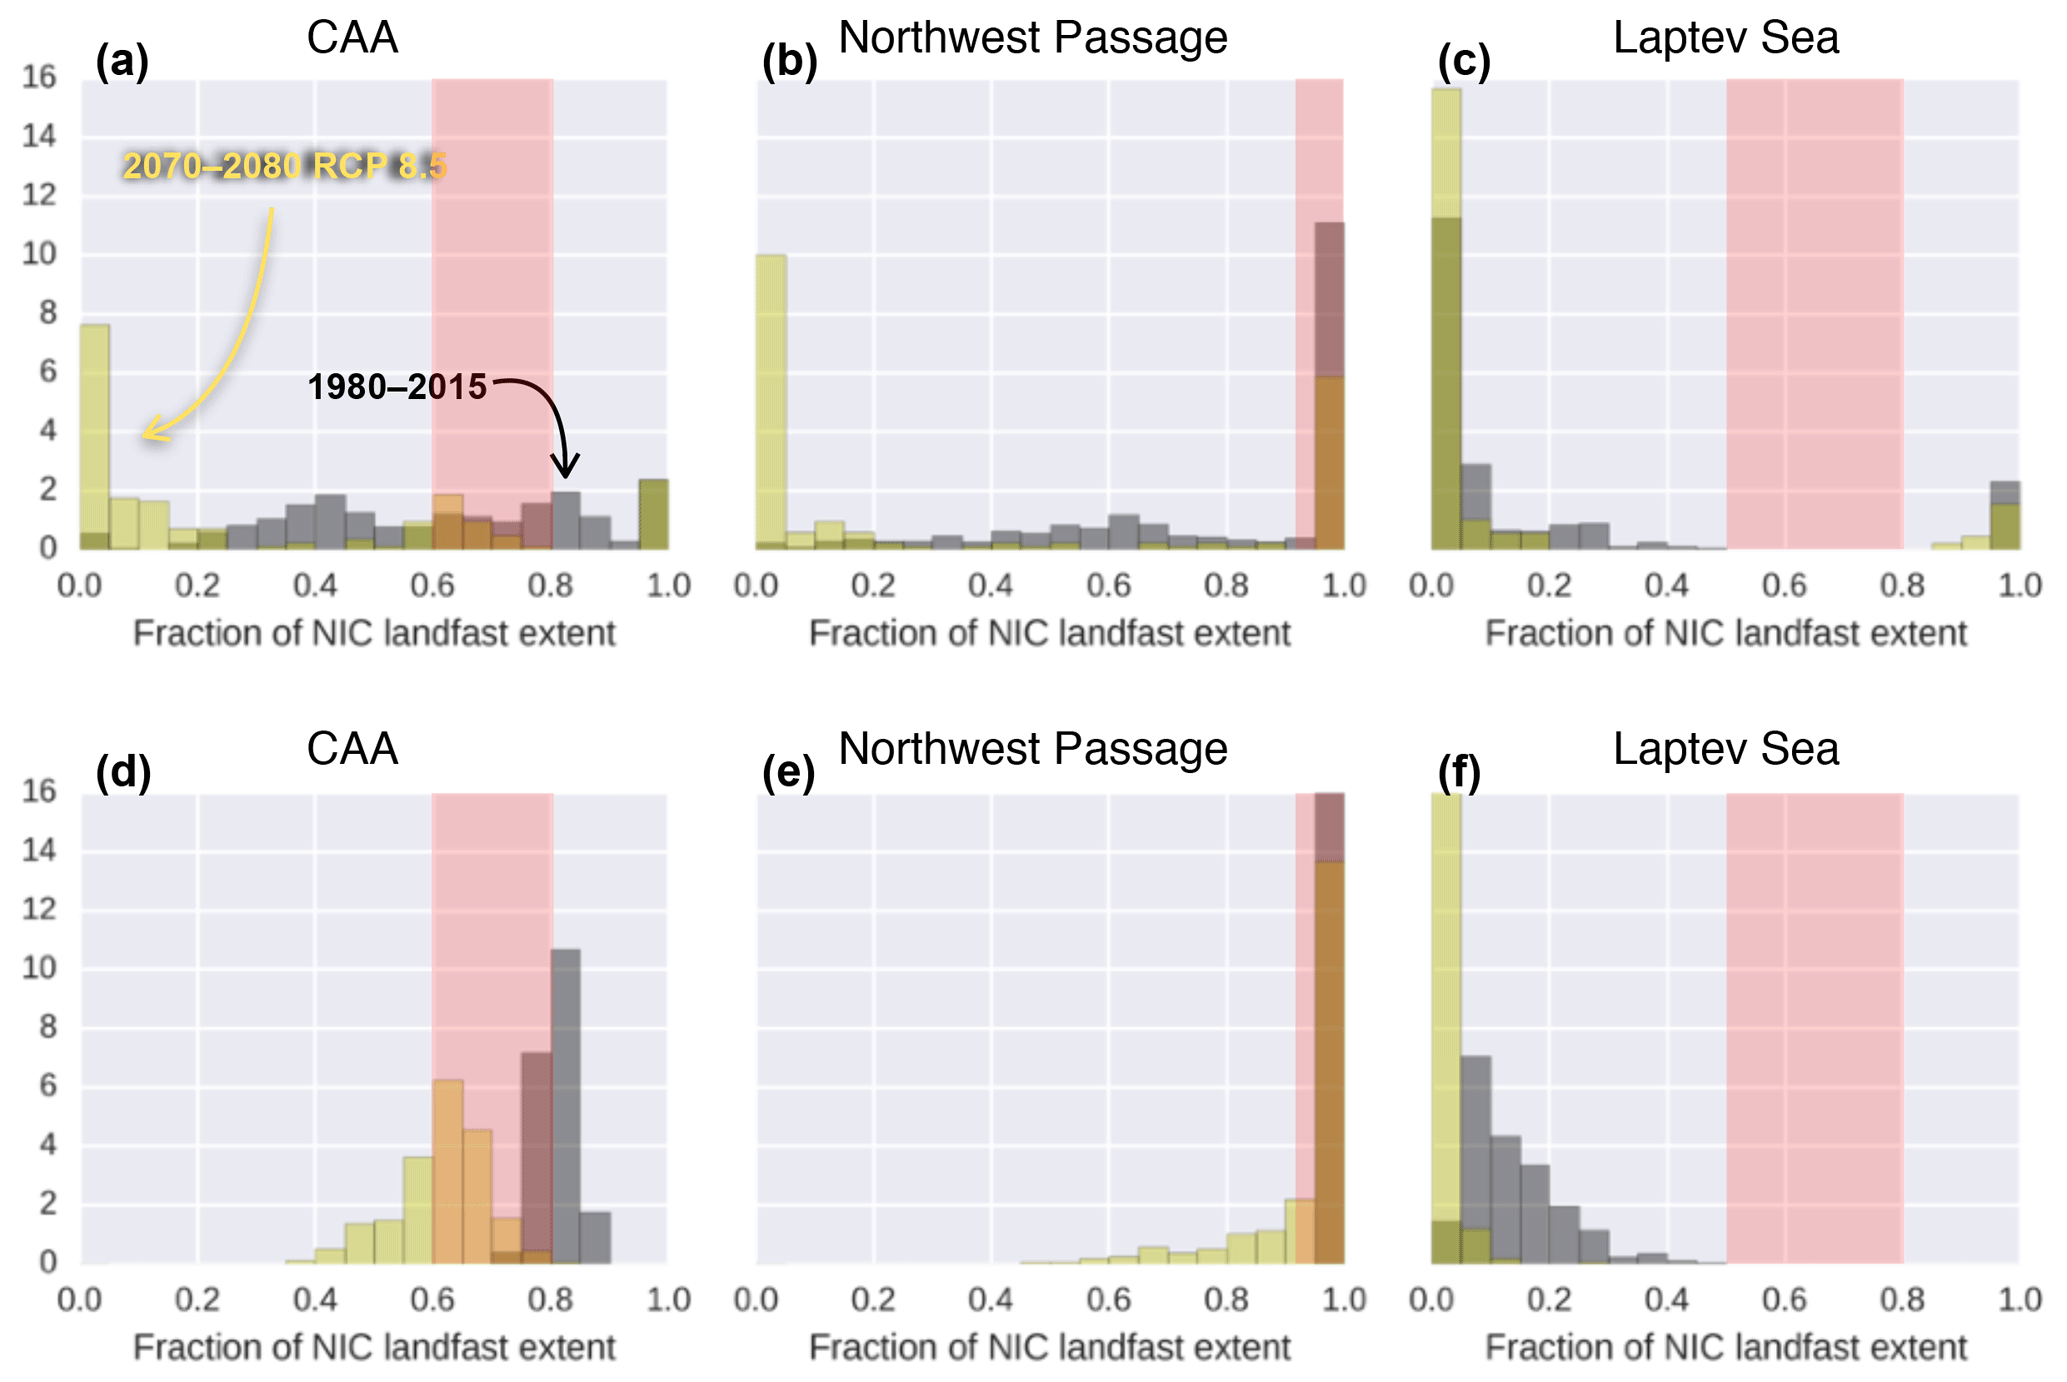
Figure 8(a) Distribution (across simulations and years) of the fraction of NIC landfast ice extent (magenta line in Fig. 2b) covered by slow, packed ice with a duration of more than 5 months over the CAA for the 1980–2015 period in black and the 2070–2080 period of the RCP 8.5 scenario in yellow. (b) Same as (a) but over the Northwest Passage. (c) Same as (b) but over the Laptev Sea. (b)–(f) Same as (a)–(c) but for the CESM-LE. Note that in (e)–(f) the highest bins go to 21 and 19, respectively. In red shading, we identify the range of observations over the same period, as seen in Fig. 7, disregarding PIOMAS in the Laptev Sea.
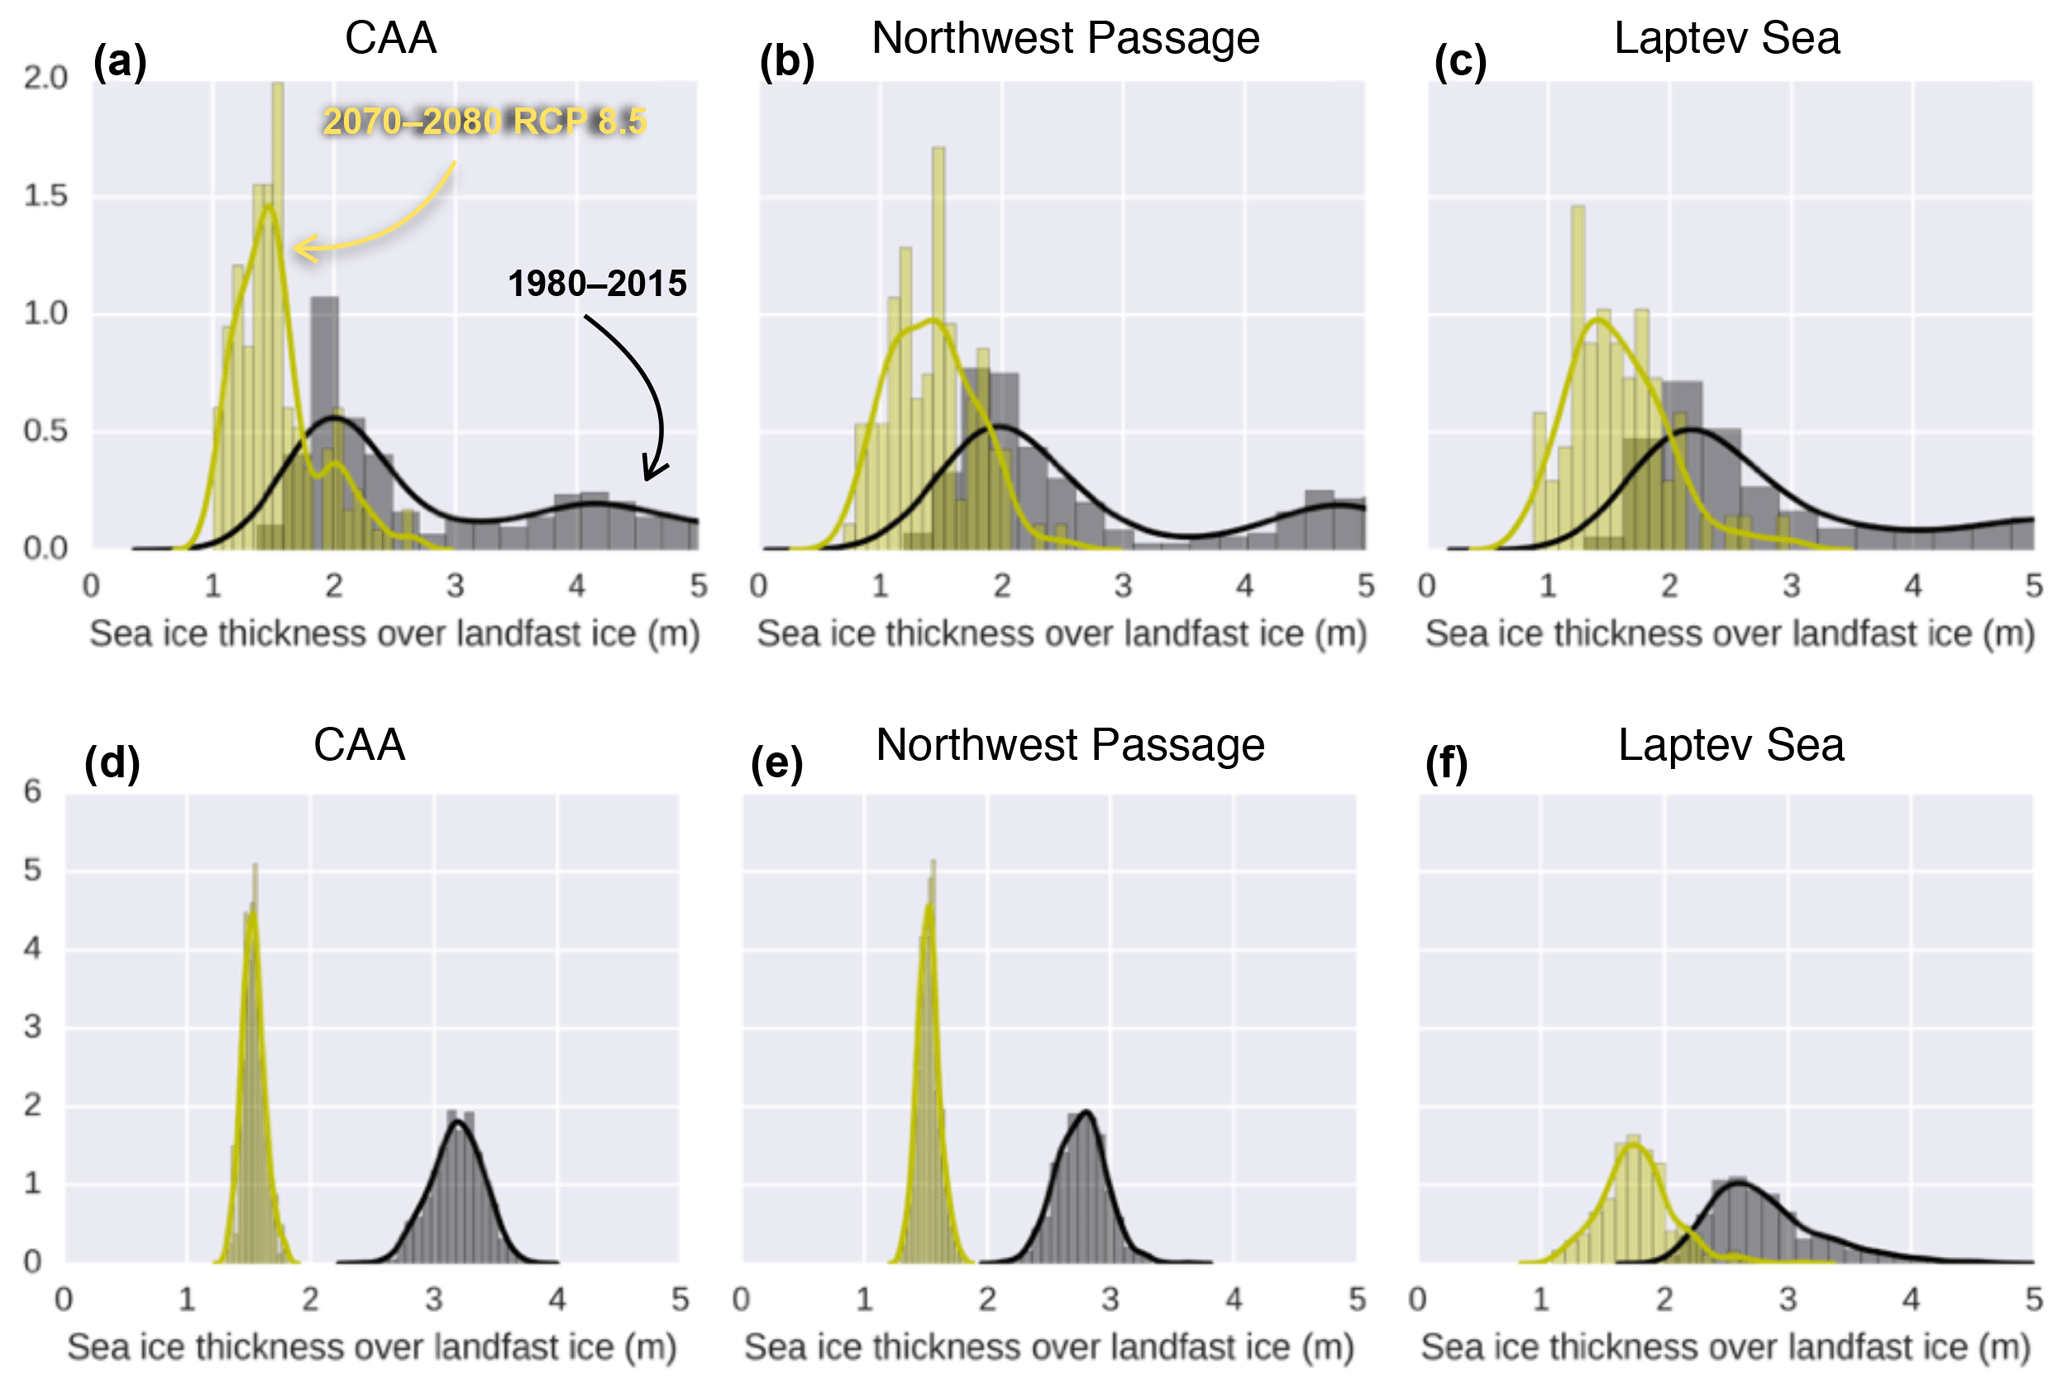
Figure 9(a) Distribution (across simulations and years) of the annual maximum ice thickness averaged over landfast ice duration of more than 5 months over the CAA for the 1980–2015 period in black and the 2070–2080 period of the RCP 8.5 scenario in yellow. (b) Same as (a) but over the Northwest Passage. (c) Same as (b) but over the Laptev Sea. (d)–(f) Same as (a)–(c) but for the CESM-LE.
The picture is generally clearer for the CESM-LE. In that model, the CAA and the Northwest Passage has slow, packed ice comparable to observations (Fig. 8d, e). In the projection, the CAA is expected to lose only 0.2 of its slow, packed ice coverage and almost none in the Northwest Passage. In the Laptev Sea, the CESM-LE is only performing marginally better that the CMIP5 multi-model ensemble and the projection shows the complete disappearance of 5-month slow, packed ice by 2070–2080 (Fig. 8f).
When we look at ice thickness, models show a wide range of ice thicknesses over landfast ice during the 1980–2015 period for all regions (Fig. 9a–c). However, for the 2070–2080 period they are essentially in agreement, indicating that in all three regions landfast ice thickness is found to grow between 1 and 2 m over the cold season (Fig. 9a–c). Moreover, the projections indicate about a 0.5 m decrease in landfast ice thickness towards the end of the 21st century. A similar growth range is apparent when just looking at the CESM-LE but there is, however, a larger magnitude of projected thickness decreases towards the end of the 21st century (Fig. 9d–f).
3.5 Ice-ocean simulations with landfast ice parameterizations
The results we have presented so far have been focused on high-resolution observational data sets, 25 km resolution reanalyses and coarser climate models. From these different data sources we were able to demonstrate the capabilities and limitations at emulating landfast ice conditions of models of the current generation. In the remainder of this section, we will look at our 6-year CREG025 simulations and see the benefits of using landfast ice parameterizations.
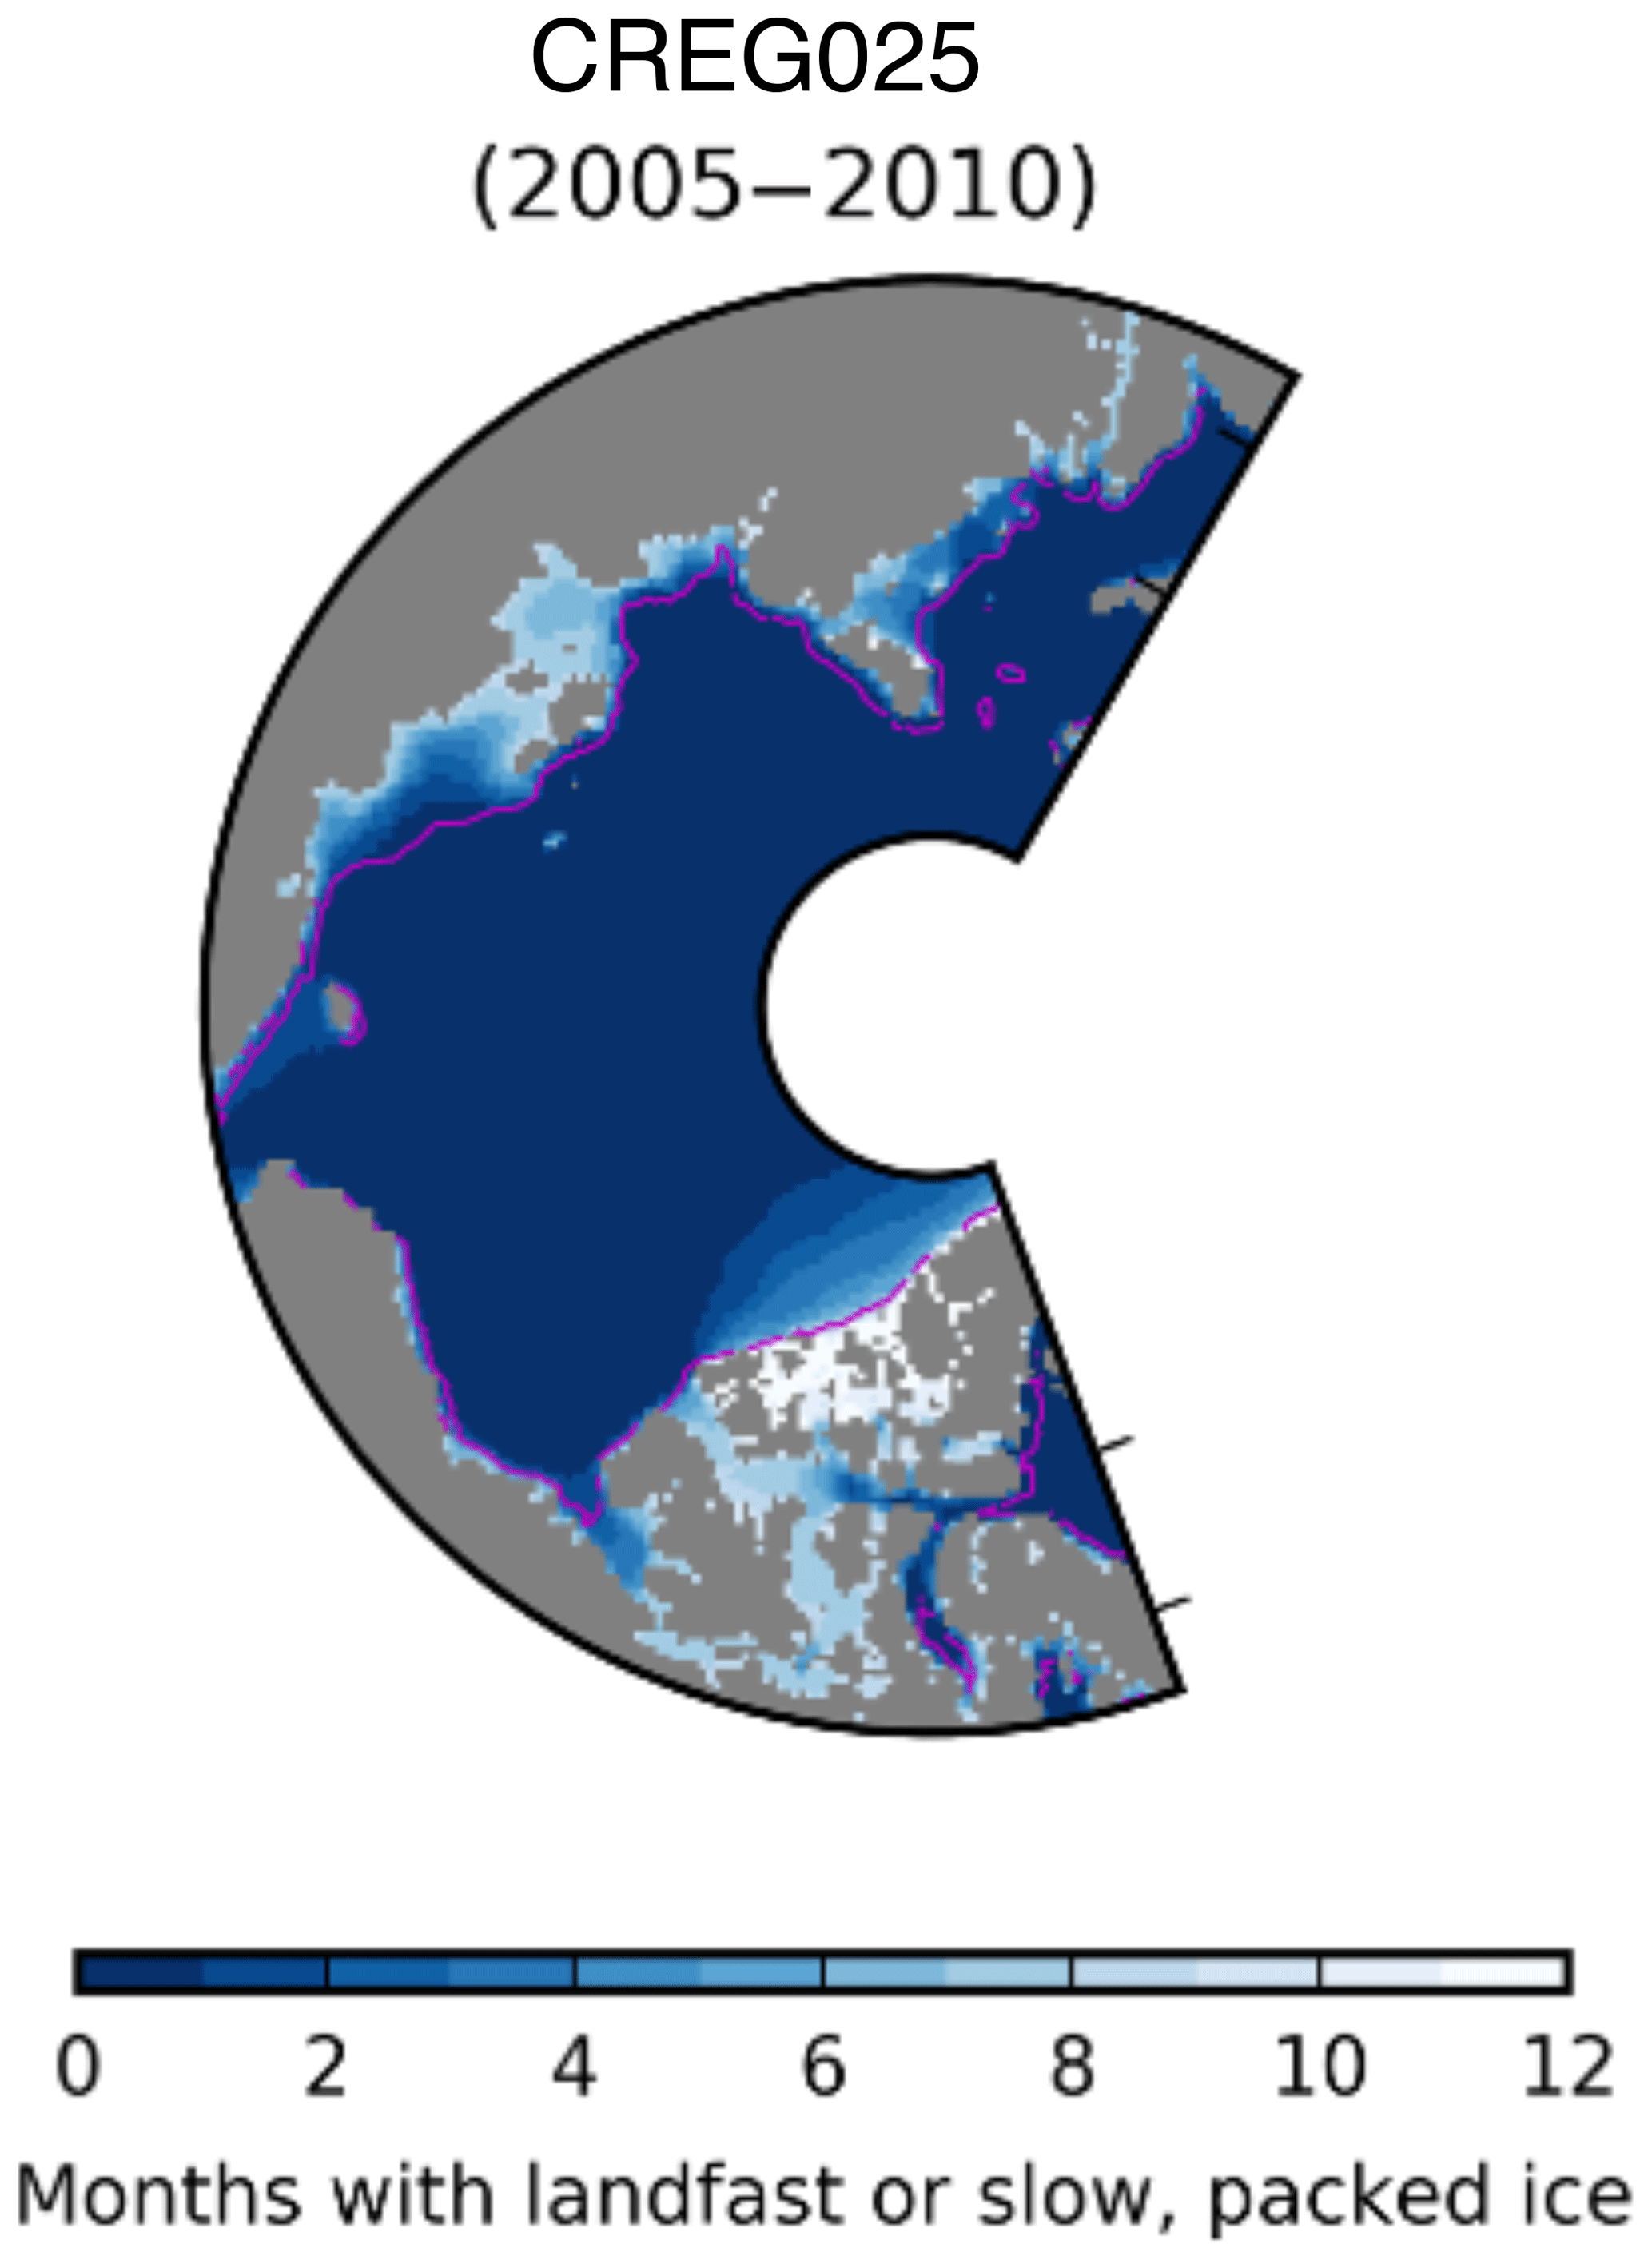
As evident in Fig. 10, the CREG025 simulations show quite an accurate representation of landfast ice duration in the Laptev Sea, the East Siberian Sea and along the Alaskan Coast where grounding is crucial for simulating landfast ice (Lemieux et al., 2015). The overestimation of landfast ice north of the CAA is likely a consequence of our imperfect criterion for determining whether the ice is landfast or not (slow-drifting ice for a NIC analyst can be identified as landfast in our study).
Overall, in the CAA, the CREG025 landfast ice duration is in good agreement with the ones of the NIC and CIS (Fig. 2a, b). In both NIC and CIS products, the duration of landfast ice is small in tidally active regions such as the Gulf of Boothia, Prince Regent Inlet, Lancaster Sound and Foxe Basin. In accordance with observations, the CREG025 simulation (which includes explicit tides) exhibits mobile ice in these regions throughout the winter (Fig. 10b). However, CREG025 underestimates the landfast ice duration in Barrow Strait and north of M'Clintock Channel.
We are currently conducting a thorough investigation of the impact of tides (and the mechanisms involved) on simulated landfast ice. This will be the subject of a future publication. Preliminary results suggest that including tides is crucial to properly simulate landfast ice in certain regions of the CAA. We speculate that the fact that many models (e.g. GFDL-ESM2G, CESM-LE, PIOMAS) presented in this paper, overestimate landfast ice in parts of the CAA (e.g. Gulf of Boothia and Prince Regent Inlet) is due to the absence of tides in their simulations.
Looking at time series of 5-month landfast ice extent, the CREG025 simulation follows observations very closely in the CAA and Laptev Sea (Fig. 7a, c). In the Northwest Passage, however, the CREG025 simulation leads to too little landfast ice (again due to the underestimation of landfast ice in Barrow Strait and north of M'Clintock Channel). This could be due to the fact that our CREG025 simulation seems to have ice thinner (and therefore weaker) than observations (see Fig. 1). Overall, however, landfast ice extent in CREG025 is much more in line with observations in all three regions than most Earth system models (shown in Fig. 8).
In this study, we have compared the geographical distribution of landfast ice extent and duration in ocean reanalyses and coupled climate models to that in historical ice charts. To achieve this comparison, we have used slow, packed ice in models as a proxy for landfast ice. Using this proxy we find that some current-generation models provide a reasonable representation of landfast ice conditions (e.g. PIOMAS, CESM-LE and GFDL-ESM2G) but others still have a hard time emulating landfast ice particularly in the CAA and even more so in the Laptev Sea. Ice-ocean simulations with a grounding scheme and a modified rheology to promote arching indicate that these parameterizations have the capability to provide better projections for seasonal economic activities in the Arctic. This is particularly important for reducing uncertainty in Arctic shipping projections based on model simulations from the current generation of models (e.g. Melia et al., 2016).
While many models do not emulate landfast ice accurately, their biases help to explain why they project dramatic ice thickness decreases in the CAA, which are not supported by long observational records (Howell et al., 2016). Specifically, in regions with landfast ice, models tend to have very thick ice in their historical simulations that is very sensitive to anthropogenic forcing. Later in the 21st century, once multi-year ice essentially disappears from the Arctic, the thickness distribution in models becomes much more in line with the thickness expected from a simple extrapolation of springtime landfast ice thickness records of less than ∼50 cm thinning over a century from typically ∼2 m springtime thickness (Howell et al., 2016). This is also observed in the projections analyzed in this study. Indeed, in the bulk of models and ensemble members in regions where landfast ice lasts more than 5 months, the end-of-winter ice thickness remains between 1 and 2 m until the end of the 21st century.
Finally, this analysis indicates that, although the sea ice cover is projected to shrink for many months and in many regions (Laliberté et al., 2016), landfast ice should cover most of the CAA for much of the winter well past the middle of the century. This landfast ice should reasonably be expected to grow to 1.5 m each winter, meaning that, by the time the ice breaks up, hazardous ice floes should remain in the region for several weeks, if not months every year. The presence of these hazardous ice floes during the months with the most economic activity will likely have negative implications, especially for shipping in the CAA. As a consequence, in order to deal with the annual replenishing of thick sea ice in the CAA, ships will probably require reinforced hulls to ward off environmental disasters as the shipping season extends earlier.
All data except for the AEM data by Haas and Howell (2015) are openly available and can be accessed as described in the text. The AEM data can be obtained directly from S. E. L. Howell upon demand.
The supplement related to this article is available online at: https://doi.org/10.5194/tc-12-3577-2018-supplement.
FBL performed the analyses. JFL, FD and JL performed the CREG simulations. FBL, SELH and JFL wrote the paper.
The authors declare that they have no conflict of interest.
FBL was supported by the Natural Sciences and Engineering Research Council of Canada through visiting fellowship 469877-2016 VFG3.
Edited by: Daniel Feltham
Reviewed by: David Bailey and David Schroeder
Alt, B., Wilson, K., and Carrieres, T.: A case study of old ice import and export through Peary and Sverdrup channels in the Canadian Arctic Archipelago: 1998–2004, Ann. Glaciol., 44, 329–338, https://doi.org/10.3189/172756406781811321, 2006.
Balmaseda, M. A., Hernandez, F., Storto, A., Palmer, M. D., Alves, O., Shi, L., Smith, G. C., Toyoda, T., Valdivieso, M., Barnier, B., Behringer, D., Boyer, T., Chang, Y.-S., Chepurin, G. A., Ferry, N., Forget, G., Fujii, Y., Good, S., Guinehut, S., Haines, K., Ishikawa, Y., Keeley, S., Köhl, A., Lee, T., Martin, M. J., Masina, S., Masuda, S., Meyssignac, B., Mogensen, K., Parent, L., Peterson, K. A., Tang, Y. M., Yin, Y., Vernieres, G., Wang, X., Waters, J., Wedd, R., Wang, O., Xue, Y., Chevallier, M., Lemieux, J.-F., Dupont, F., Kuragano, T., Kamachi, M., Awaji, T., Caltabiano, A., Wilmer-Becker, K., and Gaillard, F.: The Ocean Reanalyses Intercomparison Project (ORA-IP), J. Oper. Oceanogr., 8, 80–97, https://doi.org/10.1080/1755876X.2015.1022329, 2015.
Barry, R. G., Moritz, R. E., and Rogers, J. C.: The fast ice regimes of the Beaufort and Chukchi sea coasts, Alaska, Cold Reg. Sci. Technol., 1, 129–152, 1979.
Brown, R. and Cote, P.: Interannual variability of landfast ice thickness in the Canadian high arctic, 1950–89, Arctic, 45, 273–284, 1992.
Canadian Ice Service: Sea Ice Climatic Atlas: Northern Canadian Waters 1981–2010, 995 pp., Ottawa, 2011.
Chevallier, M., Smith, G. C., Dupont, F., Lemieux, J. F., Forget, G., Fujii, Y., Hernandez, F., Msadek, R., Peterson, K. A., Storto, A., and Toyoda, T.: Intercomparison of the Arctic sea ice cover in global ocean–sea ice reanalyses from the ORA-IP project, Clim. Dynam., 49, 1107–1136, 2017.
Dumas, J. A., Flato, G. M., and Brown, R. D.: Future projections of landfast ice thickness and duration in the Canadian Arctic, J. Climate, 19, 5175–5189, 2006.
Ferry, N., Parent, L., Garric, G., Barnier, B., and Jourdain, N. C.: Mercator global Eddy permitting ocean reanalysis GLORYS1V1: description and results, Mercator-Ocean Q. Newslett., 36, 15–27, 2010.
Flato, G. M. and Brown, R. D.: Variability and climate sensitivity of landfast Arctic sea ice, J. Geophys. Res., 101, 25767–25777, 1996.
Forget, G., Campin, J.-M., Heimbach, P., Hill, C. N., Ponte, R. M., and Wunsch, C.: ECCO version 4: an integrated framework for non-linear inverse modeling and global ocean state estimation, Geosci. Model Dev., 8, 3071–3104, https://doi.org/10.5194/gmd-8-3071-2015, 2015.
Galley, R. J., Else, B. G. T., Howell, S. E. L., Lukovich, J. V., and Barber, D. G. : Landfast sea ice conditions in the Canadian Arctic: 1983–2009, Arctic, 65, 133–144, 2012.
Gerland, S., Renner, A. H. H., Godtliebsen, F., Divine, D., and Loyning, T. B.: Decrease of sea ice thickness at Hopen, Barents Sea, during 1966–2007, Geophys. Res. Lett., 35, L06501, https://doi.org/10.1029/2007GL032716, 2008.
Haas, C. and Howell, S. E. L.: Ice thickness in the Northwest Passage, Geophys. Res. Lett., 42, https://doi.org/10.1002/2015GL065704, 2015.
Haas, C., Dierking, W., Busche, T., and Hoelemann, J.: ENVISAT ASAR monitoring of polynya processes and sea ice production in the Laptev Sea, Proc. of the 2004 Envisat & ERS Symposium, Salzburg, Austria 6–10 September 2004, 2005.
Haines, K., Valdivieso, M., Zuo, H., and Stepanov, V. N.: Transports and budgets in a 1/4∘ global ocean reanalysis 1989–2010, Ocean Sci., 8, 333–344, https://doi.org/10.5194/os-8-333-2012, 2012.
Hibler, W. D.: A dynamic thermodynamic sea ice model, J. Phys. Oceanogr., 9, 815–846, 1979.
Howell, S. E. L., Laliberté, F., Kwok, R., Derksen, C., and King, J.: Landfast ice thickness in the Canadian Arctic Archipelago from observations and models, The Cryosphere, 10, 1463–1475, https://doi.org/10.5194/tc-10-1463-2016, 2016.
Laliberté, F., Howell, S. E. L., and Kushner, P. J.: Regional variability of a projected sea ice-free Arctic during the summer months, Geophys. Res. Lett., 43, 256–263, https://doi.org/10.1002/2015GL066855, 2016.
Lemieux, J.-F., Tremblay, L. B., Dupont, F., Plante, M., Smith, G. C., and Dumont, D.: A basal stress parameterization for modeling landfast ice, J. Geophys. Res.-Oceans, 120, 3157–3173, https://doi.org/10.1002/2014JC010678, 2015.
Lemieux, J.-F., Dupont, F., Blain, P., Roy, F., Smith, G. C., and Flato, G. M.: Improving the simulation of landfast ice by combining tensile strength and a parameterization for grounded ridges, J. Geophys. Res.-Oceans, 121, 3157–3173, https://doi.org/10.1002/2016JC012006, 2016.
Mahoney, A., Eicken, H., and Shapiro, L.: How fast is landfast sea ice? A study of the attachment and detachment of nearshore ice at Barrow, Alaska, Cold Reg. Sci. Tech., 47, 233–255, 2007.
Mahoney, A. R., Eicken, H., Gaylord, A. G., and Gens, R.: Landfast sea ice extent in the Chukchi and Beaufort Seas: The annual cycle and decadal variability, Cold Reg. Sci. Technol., 103, 41–56, https://doi.org/10.1016/j.coldregions.2014.03.003, 2014.
Masina, S., Storto, A., Ferry, N., Valdivieso, M., Haines, K., Balmaseda, M., Zuo, H., Drevillon, M., and Parent, L.: An ensemble of eddy-permitting global ocean reanalyses from the MyOcean project, Clim. Dynam., 49, 1–29, https://doi.org/10.1007/s00382-015-2728-5, 2015.
Melia, N., Haines, K., and Hawkins, E.: Sea ice decline and 21st century trans-Arctic shipping routes, Geophys. Res. Lett., 43, 9720–9728, https://doi.org/10.1002/2016GL069315, 2016.
Melling, H.: Sea ice of the northern Canadian Arctic Archipelago, J. Geophys. Res., 107, 3181, https://doi.org/10.1029/2001JC001102, 2002.
Perovich, D. K., Light, B., Eicken, H., Jones, K. F., Runciman, K., and Nghiem, S. V.: Increasing solar heating of theArcticOcean and adjacent seas, 1979–2005: attribution and role in the ice-albedo feedback, Geophys. Res. Lett., 34, L19505, https://doi.org/10.1029/2007GL031480, 2007.
Polyakov, I. V., Timokhov, L. A., Alexeev, V. A., Bacon, S., Dmitrenko, I. A., Fortier, L., Frolov, I. E., Gascard, J.-C., Hansen, E., Ivanov, V. V., Laxon, S., Mauritzen, C., Perovich, D., Shimada, K., Simmons, H. L., Sokolov, V. T., Steele, M., and Toole, J.: Arctic Ocean Warming Contributes to Reduced Polar Ice Cap, J. Phys. Oceanogr., 40, 2743–2756, 2010.
Rothrock, D. A.: The energetics of the plastic deformation of pack ice by ridging, J. Geophys. Res., 80, 4514–4519, 1975.
Selyuzhenok, V., Mahoney, A. R., Krumpen, T., Castellani, G., and Gerdes, R.: Mechanisms of fast-ice development in the south-eastern Laptev Sea: a case study for winter of 2007/08 and 2009/10, Polar Res., 36, 1, https://doi.org/10.1080/17518369.2017.1411140, 2017.
Serson, H. V.: Investigations of a plug of multiyear old sea icein the mouth of Nansen Sound, Ottawa, Ont., Department of National Defence, Canada, Defence Research Establishment Ottawa, (DREO Tech. Note 72-6), 1972.
Serson, H. V.: Sverdrup Channel, Ottawa, Ont., Department of National Defence, Canada, Defence Research Establishment Ottawa, (DREO Tech. Note 74-10), 1974.
Smith, L. C. and Stephenson, S. R.: New Trans-Arctic shipping routes navigable by midcentury, P. Natl. Acad. Sci. USA, 13, 4871–4872, https://doi.org/10.1073/pnas.1214212110, 2013.
Smith, G. C., Roy, F., Mann, P., Dupont, F., Brasnett, B., Lemieux, J.-F., Laroche, S., and B_elair, S.: A new atmospheric dataset for forcing ice-ocean models: evaluation of reforecasts using the Canadian global deterministic prediction system, Q. J. Roy. Meteor. Soc., 140, 881–894, https://doi.org/10.1002/qj.2194, 2014.
Sou, T. and Flato, G.: Sea ice in the Canadian Arctic Archipelago: Modeling the past (1950–2004) and the future (2041–60), J. Clim., 22, 2181–2198, https://doi.org/10.1175/2008JCLI2335.1, 2009.
Storto, A., Dobricic, S., Masina, S., and Di Pietro, P.: Assimilating along-track altimetric observations through local hydrostatic adjustments in a global ocean reanalysis system, Mon. Weather Rev., 139, 738–754, 2011.
Taylor, K. E., Stouffer, R. J., and Meehl, G. A.: An overview of CMIP5 and the experiment design, B. Am. Meteorol. Soc., 93, 485–498, https://doi.org/10.1175/BAMS-D-11-00094.1, 2012.
Tivy, A., Howell, S. E. L., Alt, B., McCourt, S., Chagnon, R., Crocker, G., Carrieres, T., and Yackel, J. J.: Trends and variability in summer sea ice cover in the Canadian Arctic based on the Canadian Ice Service Digital Archive, 1960–2008 and 1968–2008, J. Geophys. Res., 116, C03007, https://doi.org/10.1029/2009JC005855, 2011.
Wilks, D. S.: On “field significance” and the false discovery rate, J. Appl. Meteorol. Climatol., 45, 1181–1189, https://doi.org/10.1175/JAM2404.1, 2006.
Yu, Y., Stern, H., Fowler, C., Fetterer, F., and Maslanik, J.: Interannual Variability of Arctic Landfast Ice between 1976 and 2007, J. Climate, 27, 227–243, https://doi.org/10.1175/JCLI-D-13-00178.1, 2014.
Zhang, J. L. and Rothrock, D. A.: Modeling global sea ice with a thickness and enthalpy distribution model in generalized curvilinear coordinates, Mon. Weather Rev., 131, 845–861, 2003.
Zuo, H., Balmaseda, M. A., and Mogensen, K.: The new eddy-permitting ORAP5 ocean reanalysis: description, evaluation and uncertainties in climate signals, Clim. Dynam., 49, 1–21, https://doi.org/10.1007/s00382-015-2675-1, 2015.