the Creative Commons Attribution 4.0 License.
the Creative Commons Attribution 4.0 License.
 | 19 Nov 2018
Modelling the fate of surface melt on the Larsen C Ice Shelf
Daniel Feltham
Daniela Flocco
Surface melt lakes lower the albedo of ice shelves, leading to additional surface melting. This can substantially alter the surface energy balance and internal temperature and density profiles of the ice shelf. Evidence suggests that melt lakes also played a pivotal role in the sudden collapse of the Larsen B Ice Shelf in 2002.
Here a recently developed, high-physical-fidelity model accounting for the development cycle of melt lakes is applied to the Larsen C Ice Shelf, Antarctica's most northern ice shelf and one where melt lakes have been observed. We simulate current conditions on the ice shelf using weather station and reanalysis data and investigate the impacts of potential future increases in precipitation and air temperature on melt lake formation, for which concurrent increases lead to an increase in lake depth.
Finally, we assess the viability in future crevasse propagation through the ice shelf due to surface meltwater accumulation.
- Article
(3154 KB) - Full-text XML
- BibTeX
- EndNote


The Antarctic Peninsula, home of several ice shelves including the Larsen ice shelves, experiences temperatures that frequently exceed 0 ∘C. As much as 66 % of the total volume of Antarctic snowmelt occurs here (Kuipers Munneke et al., 2012) and on some of the peninsula ice shelves the accumulation of meltwater has led to the formation of surface melt lakes. The presence of these lakes is significant for two reasons:
-
The lakes are darker than surrounding ice and so will have a lower albedo, thus absorbing more shortwave radiation in a feedback loop that can lead to further melting.
-
The lakes have been implicated in ice shelf break-up.
In 2002, the Larsen B Ice Shelf collapsed spectacularly, with the loss of 3200 km2 of ice (Scambos et al., 2000, 2004). The region of the Larsen B Ice Shelf that experienced sudden disintegration lay almost completely within the region of observed melt lakes on the ice shelf surface (Scambos et al., 2004), which were noted to drain shortly before the break-up event (Banwell et al., 2013). The pattern of break-up of Larsen B suggests that fracturing driven by the weight of accumulated surface melt water played a key role in the disintegration of the ice shelf (Rack and Rott, 2004). The glaciers that previously fed into Larsen B were observed to accelerate after the break-up due to the loss of the buttressing effect that the ice shelf had been providing (De Angelis and Skvarca, 2003; Rignot et al., 2004). Some glaciers showed a 2- to 6-fold increase in centreline speed after the collapse (Scambos et al., 2004), the ice from which will contribute to sea level rise, although a slowdown of glacier speeds has since been observed (Rott et al., 2018; Wuite et al., 2015).
Antarctica's most northern, as yet undisturbed, ice shelf is now the Larsen C Ice Shelf, which is located immediately to the south of the former Larsen B. Surface melting on this ice shelf has occurred for centuries (Bevan et al., 2017) and it thus may be one of the ice shelves most susceptible to sudden collapse based on melt activity (Scambos et al., 2000), firn characteristics and melt season length (Scambos et al., 2004). The annual mean temperature isotherm, which has been suggested as being the northern limit of ice shelf viability (Morris and Vaughan, 2003), now reaches Larsen C, where surface melt lakes have been observed, as shown in Fig. 1.
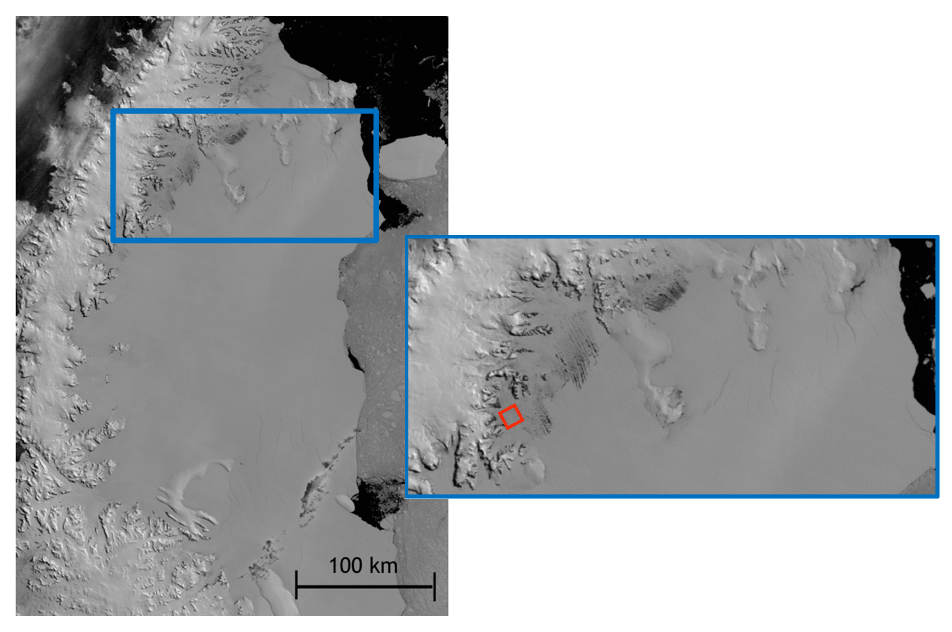
Figure 1NASA MODIS imagery of the Larsen C Ice Shelf (Scambos et al., 2001). The image was captured on 7 January 2007 at 13:15. The presence of melt lakes is shown through the zoomed image of the northern part of Larsen C, where the red outlined area shows the location of the data used to produce Fig. 4.
Surface melt and firn densification are important processes that contribute to the future change of the Larsen C Ice Shelf and are precursors to surface melt lake development. Lakes of tens of metres in width and tens of kilometres in length have been observed on the ice shelf (Luckmann et al., 2014). The ice shelf is lowering and losing air content due to surface melting (Holland et al., 2011) and meltwater will remain on the ice shelf due to a negligible amount being lost as runoff (van Wessem et al., 2016). This means that the firn is becoming less permeable to meltwater as it densifies (Khazendar et al., 2011). Therefore, in order to begin to understand the conditions and possible future outcome for the Larsen C Ice Shelf, an understanding of the potential for melt lake formation on the ice shelf and the effect melt lakes may have is essential.
In addition to surface melt, the Larsen C Ice Shelf is thinning from underneath due to warming from the ocean (Holland et al., 2015). The influence of sea ice on the ice shelf can have a stabilizing effect on preventing rift or crevasse propagation (Jansen et al., 2010), although the stability of the ice shelf has recently become much less certain with the discovery of a growing rift, which in July 2017 lead to the loss of an iceberg of more than 5000 km2 from the ice shelf front (Hogg and Gudmundsson, 2017; Jansen et al., 2015). Understanding these processes alongside those leading to surface melt are essential in gaining a full understanding of possible future conditions on the Larsen C Ice Shelf.
In this paper we present a modelling study of lakes on the Larsen C Ice Shelf under current and future conditions. We then investigate in further detail the response of lakes to changes in precipitation and air temperature. Finally, we examine the possibility of lakes providing sufficient meltwater for water-driven crevasse propagation through the ice shelf.
A 1-D model has been developed that accounts for the entire life cycle of a surface melt lake over multiple years. The model is described in detail in Buzzard et al. (2018) but, briefly, it includes the following processes:
-
surface energy balance at the top of the ice shelf;
-
heat transfer through the upper ice shelf;
-
the percolation and subsequent refreezing or storage of surface meltwater within the firn, including possible formation of impermeable lenses of ice;
-
the formation and development of a surface lake and the subsequent refreezing of the lake;
-
the addition of meltwater to the lake from its surrounding catchment area.
A key process in lake formation is the formation of an ice lens within the firn. This impermeable layer of refrozen meltwater forces further meltwater to saturate the firn from the point of lens formation upwards, meaning that full saturation of the firn (and thus lake formation) is achieved more rapidly than if the firn had to be saturated upwards from the pore closure depth (the depth at which the firn becomes impermeable, taken to be 830 kg m−3). This is simulated in 1-D by modelling two firn columns: one for the lake and one for the surrounding catchment area. Only once an ice lens has formed in both columns is it assumed one is present.
This method allows us to simulate the addition of meltwater from a catchment area by assuming a surface gradient within the catchment area that, subsequent to lens formation, will result in meltwater produced in the catchment area being transported into the lake. Full details of the assumptions made here are found in Buzzard et al. (2018), but we ultimately calculate a ratio of lake area to catchment area (1 : 6) to determine overall meltwater transport into the lake.
The model is driven with atmospheric forcing and for this we use automatic weather station (AWS) data from May 2010 to April 2011 provided by the British Antarctic Survey from a station located at 67∘ S, 61∘47′ W. Snow is added from ERA-Interim data (Dee et al., 2011). As would be expected, simulations using only these data did not result in lake formation, given that the AWS is closer to the ice shelf edge than the observed lakes. Therefore, in order to simulate lake formation we also include a simulated foehn wind effect to account for the conditions on the ice shelf near the grounding line (Elvidge et al., 2015). A foehn effect is added into the model by increasing the air temperature by 5 K and the wind speed by 5 m s−1 to match observations from currently unpublished weather station data (Jennifer Turton, personal communication, 2016). We simulate foehn events for 18 h in every 52 h between the months of January and March following the observation in Elvidge et al. (2015) of foehn events occurring 30 % of the time on Cole Peninsula during these months.
The initial density profile has a surface density of 500 kg m−3 and a pore closure depth of 37 m from field measurements of Jarvis and King (1995) and uses the formula of Schytt (1958).
The initial temperature profile is linear, starting at 253 K at the surface and increasing to 263 K at the bottom of the model domain at 35 m below the ice shelf surface, based on ice core data from a field expedition to Larsen C in 2009–2010 (Andrew Shepherd, unpublished data).
The IPCC's Atlas of Global and Regional Climate Projections (IPCC, 2013) provides predictions of future Antarctic Peninsula precipitation and air temperature under the RCP4.5 emissions scenario based on the results of the Coupled Model Intercomparison Project Phase 5 (CMIP5) (Taylor et al., 1998). Based on these values, a set of model simulations were carried out under several possible future conditions. Here the same conditions for the reference case presented above were used, but the precipitation and air temperature values were increased by set amounts or proportions. Air temperature and precipitation were chosen, as these are conditions that show changes over the Antarctic Peninsula in climate models (Bracegirdle et al., 2008) and also there is high agreement among models that these two forcing parameters will increase in the future (Bracegirdle et al., 2016).
It is expected that under a future warming climate snowfall will increase over the Antarctic Peninsula (Krinner et al., 2007). In order to investigate the impact of snowfall values greater than those examined in the future climate simulations, further tests were carried out. Although some of these tests go far beyond the precipitation values predicted in the CMIP5 scenarios, it is nevertheless interesting to determine how much snowfall would be needed in order to alter the way it impacts the lakes. We also separately investigate the impact of further increases in air temperature.
The data from May 2010 to April 2011 were looped over for 10 years in order to provide a reference simulation of the evolution of the ice shelf over multiple years of lake formation, with a sufficient spin-up period to allow the ice shelf to evolve away from its initial transient conditions (here this was 5 years). The results of this simulation are shown in Fig. 2. Here we are simulating conditions within a lake basin specifically; we would not expect these conditions to be representative of the whole ice shelf.
After the first lake has formed and refrozen this lake can then act as an ice lens in subsequent years, bringing forward the time of lake formation. We found an ice lens to form at 20.2 m below the surface (i.e. 20.2 m below the value shown as 0 m in Fig. 2) and found an average lake depth of 1.24 m and a maximum lake depth of 1.29 m for this simulation, with a total of 6.09 m of water-equivalent firn melt over the whole 10-year simulation. As the model includes the addition of water from the catchment area, it is the lateral melt that explains the sharp increases in surface height and overall increase in height of the firn.

Figure 2The development of surface melt lakes over a 10-year model run using 2010–2011 data. Here, the blue line shows the firn surface, the red line the lake surface, and the green line the refrozen lid. On the vertical axis 0 is the initial ice shelf surface and the subsequent surface heights are plotted relative to this.
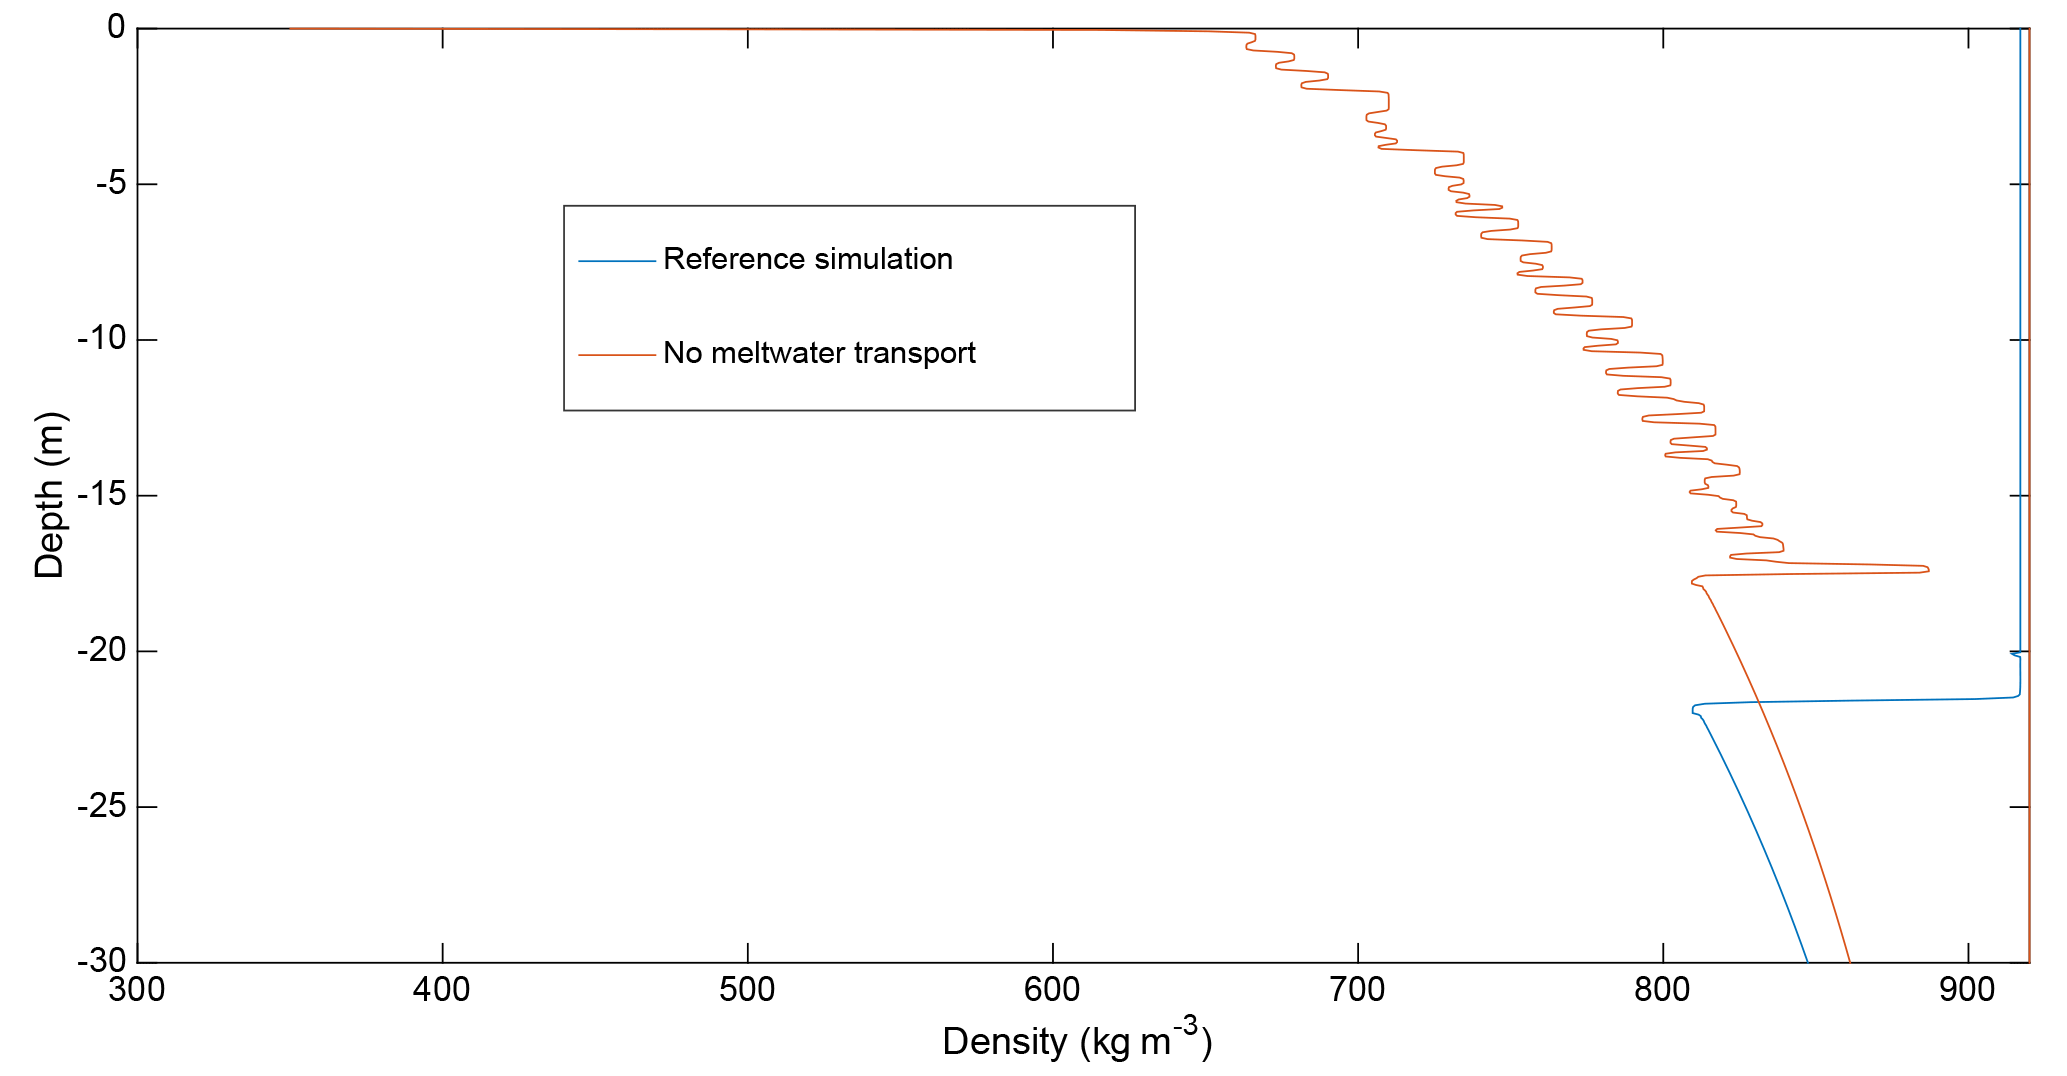
Figure 3The density changes at the end of the spin-up period (after 5 years) for the reference case (blue) and the case in which all meltwater subsequent to ice lens formation leaves the model domain upon formation (red). Here 0 on the vertical axis is the ice shelf surface. Low densities at the surface are due to new snowfall.
As melt lakes have a lower albedo than snow, they alter the surface energy balance of the ice shelf in a manner that allows more melting. The importance of this change can be examined by running the model with all meltwater removed from the lake area once an ice lens has formed and comparing the result with the reference case simulation. This has the consequence that all meltwater produced subsequent to ice lens formation is treated as if it percolates immediately out of the model domain. Carrying out this simulation we find a cumulative surface melting of 0.76 m of water-equivalent firn melt over the final 5 years of a 10-year simulation in the lake basin; this is 69.7 % less melt than the reference simulation presented above, in which 2.50 m of water-equivalent melt occurs in the final 5 years. This decrease in melting also means that the density profile without a surface lake is different to that of the reference case. Figure 3 compares the change in density after a 5-year spin-up period and demonstrates that the saturation of the firn and refreezing of the lake impact the density significantly in the reference simulation in comparison to the simulation in which meltwater is removed. As the simulations continue the latter simulation continues to densify but no lakes are formed.
This density increase from saturation of the firn and melt lake refreezing has implications for future ice shelf stability. The loss of pore space has been suggested as a precursor for ice shelf collapse by Kuipers Munneke et al. (2014). The more widespread the sinks of meltwater are on the ice shelf, the more pore space will be lost and the less space there will be to retain meltwater within the firn.
Both field observations and remote sensing can be used to provide validation for the modelling results described above. The occurrence of ice lensing within the firn has been observed in Cabinet Inlet, Larsen C, by Hubbard et al. (2016) and annual layers of high density were observed on Larsen C by Gourmelen et al. (2009). Furthermore, the large features of solid ice observed by Hubbard et al. (2016) suggest that significant saturation of the firn and refreezing of meltwater had previously occurred.
Evidence of surface lakes occurring on Larsen C is visible in MODIS imagery for several years between 2001 and 2017, an example of which is given in Fig. 1. Although cloud-free MODIS imagery is not always available, we can still see that for the year examined (the 2010–2011 melt season) lakes were present even if their onset day is unclear. Evidence from previous years suggests that lakes often form in November or December, which agrees with the modelled lakes' appearance in November. Furthermore, we found that the number of melt days from Envisat data (Luckmann et al., 2014) matched well with the 50 melt day occurrences recorded in the model.
In addition to this evidence, we can learn more about lake area and depth using data from NASA's Landsat. Examining an area with a high density of lakes as shown in Fig. 4, we can determine a ratio of approximately 1 : 40 of lake to snow pixels, suggesting that the lake-to-catchment area ratio of 1 : 6 used in the simulation above is well within the bounds of the available catchment area. This suggests that in this case the volume of available water does not constrain lateral transport; it is the distance that this water will travel across the ice shelf (according to Darcy's law and the temperature of the ice shelf, which may lead to refreezing of the water before it can reach the lake).
Lake depths have been calculated from Landsat 8 imagery by Pope et al. (2016). Here this calculation has been carried out for the region shown in Fig. 4, which provided a clear image of many lakes, and from this we obtain Fig. 5. The range of lake depths is concentrated around the 0.1–1.3 m range with the average lake depth being 0.52 m. The modelled average lake depth falls within this range and it is unsurprising that it is towards the higher end of these values given that we continuously force the model with data from a warm melt season and that our calculations for the lake catchment assume a somewhat larger lake.
For the period modelled here, with available weather station data, the Landsat 7 rather than Landsat 8 satellite was in use. The method used for Landsat 8 was adapted for Landsat 7 and results suggested that average lake depths ranged from 0.34 to 0.47 m for various scenes analysed for the period of 2007–2009, and lakes fell within a similar range of values as those in Fig. 5. Although this method is more uncertain for Landsat 7, given that it has not been tested as thoroughly, it is still worth noting that these values also match the modelling results reasonably well.
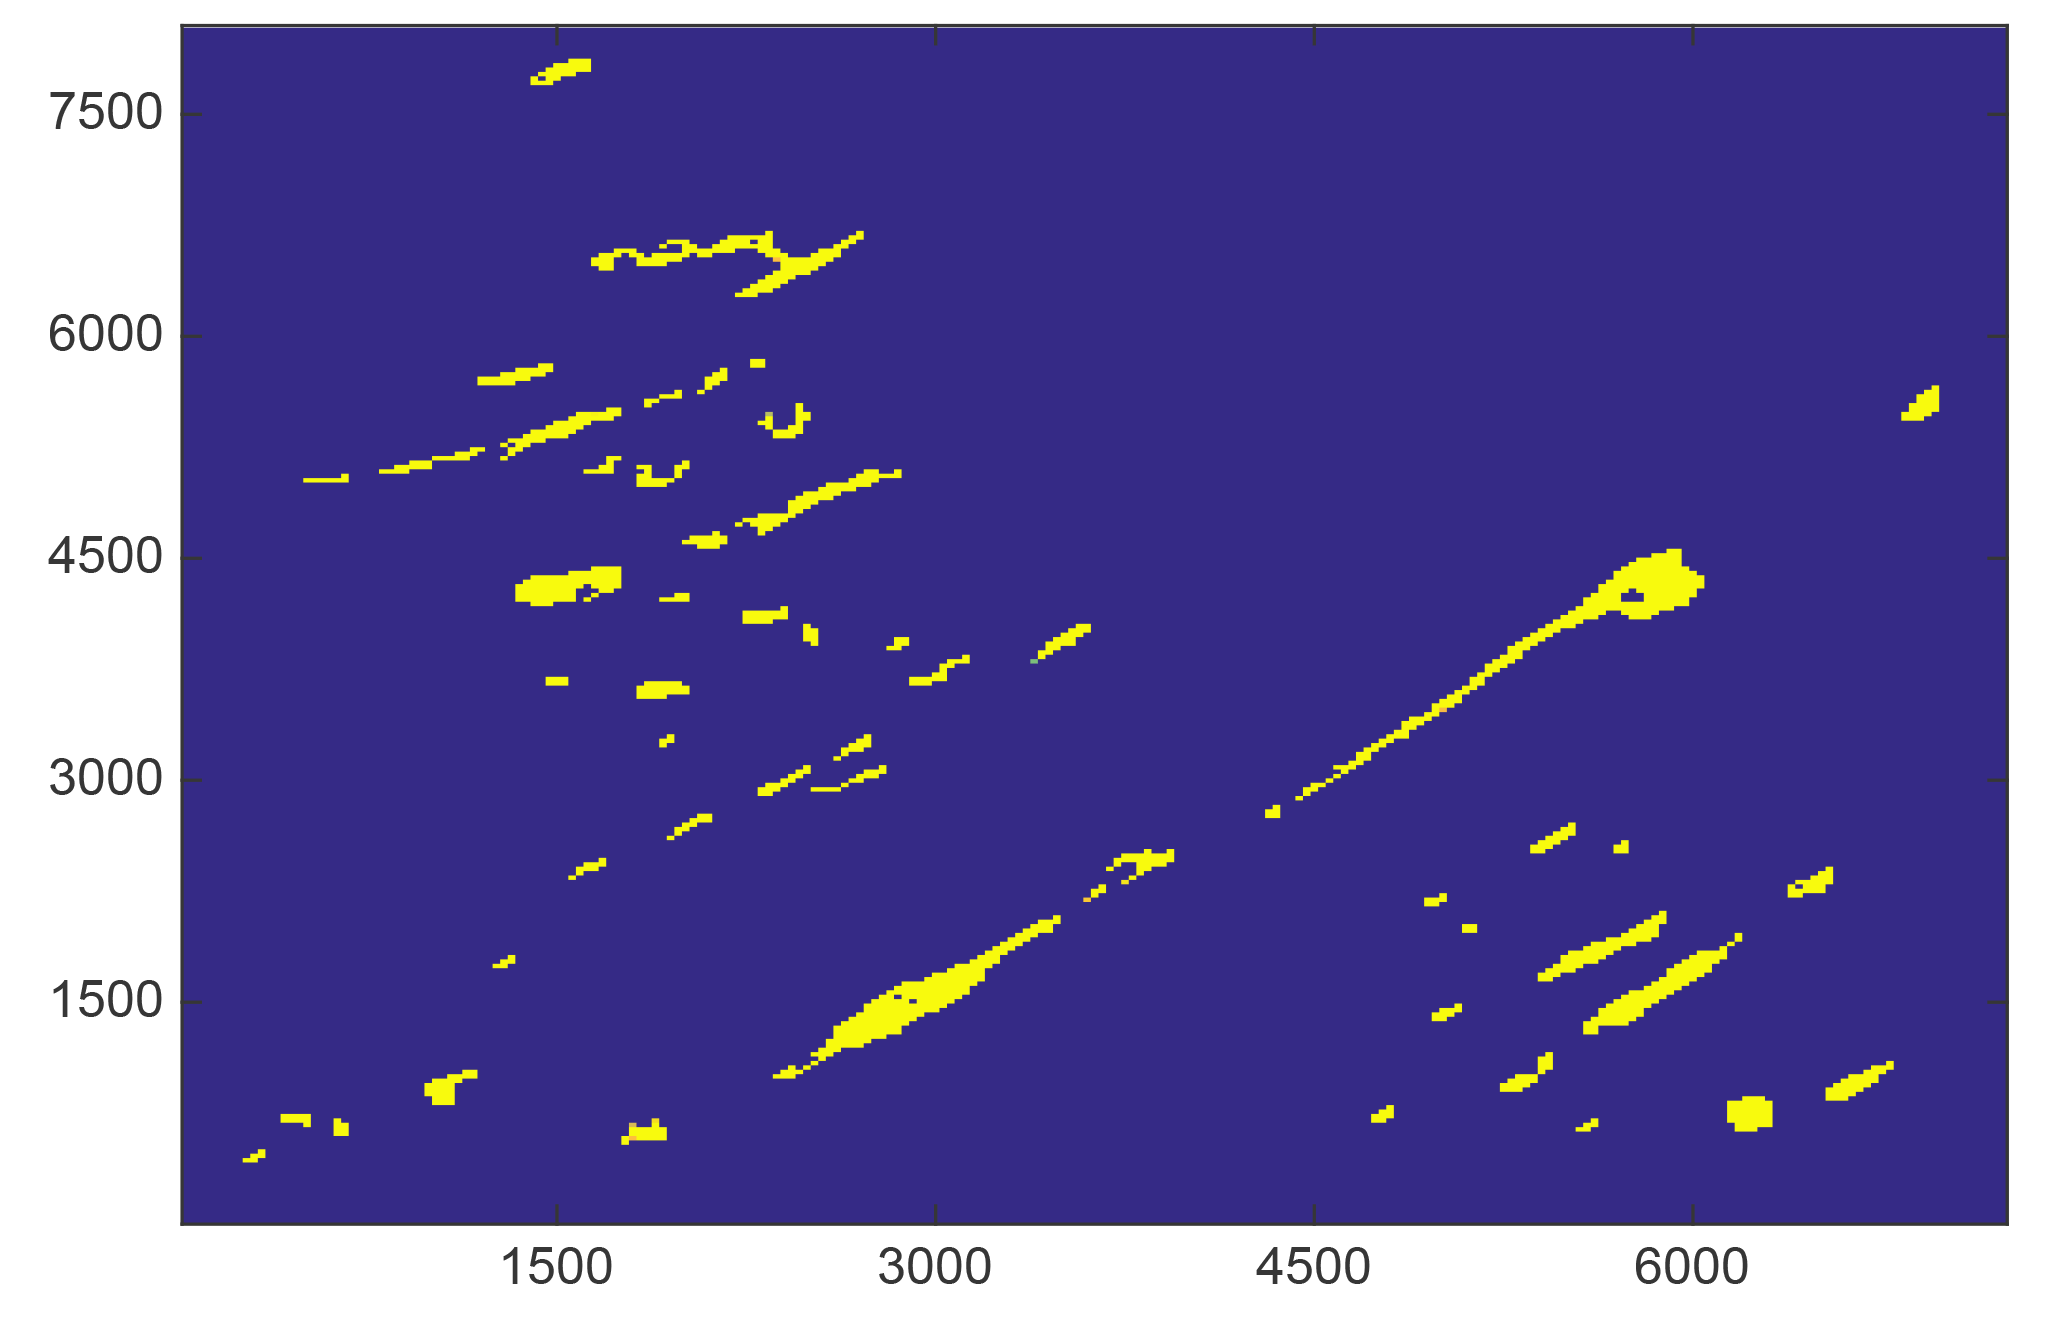
Figure 4Landsat image of a section of the Larsen C Ice Shelf where melt lakes were present on 6 January 2016. Both axes have units of metres. Here the lakes are coloured yellow and areas where lakes were not present are coloured blue. Although these data were taken from the Landsat 8 mission at a later time than the simulation using the 2010–2011 melt season, it is likely that the lakes will be similar in many aspects due to the role of topography in the location of lake basins. Landsat 8 image courtesy of the U.S. Geological Survey.

Figure 5Lake depths on the Larsen C Ice Shelf as calculated from Landsat data from 6 January 2016 using the method of Pope et al. (2016). The horizontal axis gives lake depths in millimetres and the vertical axis gives the number of 30 m pixels for each depth.
In order to gain insights into how future changes in conditions on the Larsen C Ice Shelf may affect lake depth, we run simulations increasing both the air temperature and precipitation. The values used and results of these simulations for the average lake depth are presented in Table 1.
Table 1The average lake depths (m) for a variety of possible future climate scenarios for Larsen C. The reference case simulation value with no increase in either temperature or precipitation was 1.237 m.
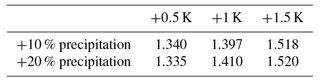
All of the simulations presented in Table 1 show an increase over the reference case simulation presented above. Increasing air temperature increases the average lake depth, as does increasing the snowfall in all except the +0.5 K simulations. This was found to be due to the extra snowfall delaying the lake onset time; this was not observed in the higher-temperature simulations.
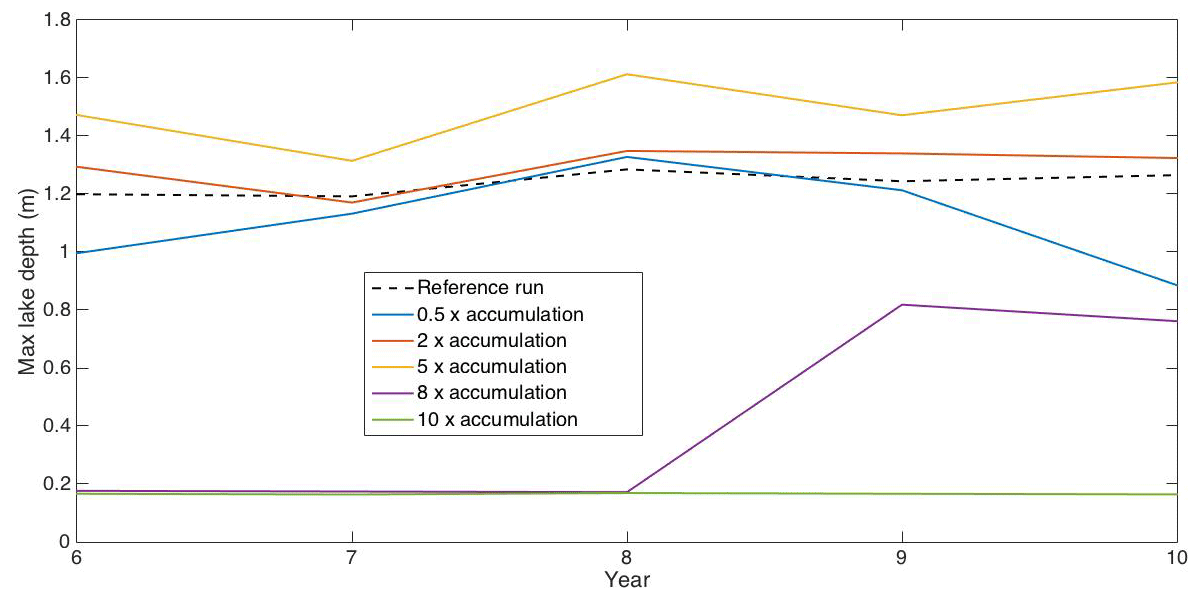
Figure 6The maximum lake depth for years 6–10 of the simulations carried out for varying snow accumulation rates.
In each of these simulations it was found that the lakes did not freeze over completely between melt seasons and that some water persisted in the firn. It was found that only a small increase in catchment area (approximately 5 %) was needed for this to occur, with no increase in precipitation or air temperature (see Buzzard et al., 2018). Although the model here was intentionally simulating one of the larger observed lakes and was run with the forcing from a warm year repeated, this still suggests that meltwater remaining in the firn between melt seasons on Larsen C could be observed in the future.
Due to the complex nature of the interaction of these two parameters and the uncertainty of future conditions on Larsen C, the two parameters were also investigated separately and for a wider range of values.
Initial sensitivity studies suggested that halving and doubling the snowfall led to a decrease and increase in average lake depth, respectively. This suggests that the snow available to melt is a limiting factor. Fresh snow is less dense than compacted older firn and so more accumulation leads to melting over a greater vertical distance into the firn for the same energy input, leading to quicker exposure of melt lakes and enhanced melt (and deepening) due to the change in albedo. It was found that when multiplying the snowfall by 5 this pattern continued: both the average and maximum lake depths are increased compared to the smaller accumulation values. The maximum lake depths for each year after the initial 5-year spin-up period can be seen in Fig. 6.
However, when examining 10 times the reference snowfall rate, it appears that this upwards trend in average lake depths does not continue; although lakes form, they are far smaller with an average depth of 0.17 m. In order to examine this change more clearly, an additional simulation of 8 times the reference case accumulation was also run. The results of this are also plotted in Fig. 6.
We can see that the lakes in the 8-times accumulation case are also shallow, similar to the 10-times accumulation case for the first 2 years, but then they become deeper in the final 3 years of the simulation. In fact, if we look at the 5-times accumulation case, we can see that this period of initially shallow, but then deeper, lakes also occurs at the start of this simulation, but as this occurs during the spin-up period it is not immediately noticeable in the analysis carried out above.
If we look at the density and water content of the 10-times accumulation case it becomes clear why the lakes do not reach the depth that they do in the other cases; the accumulation level is high enough that each year's lake does not melt through the new snow. This means that each year the density profile near the surface loses memory of the previous year's lake and a completely new layer of low-density snow needs to be densified and saturated and a new ice lens formed for a lake to develop.
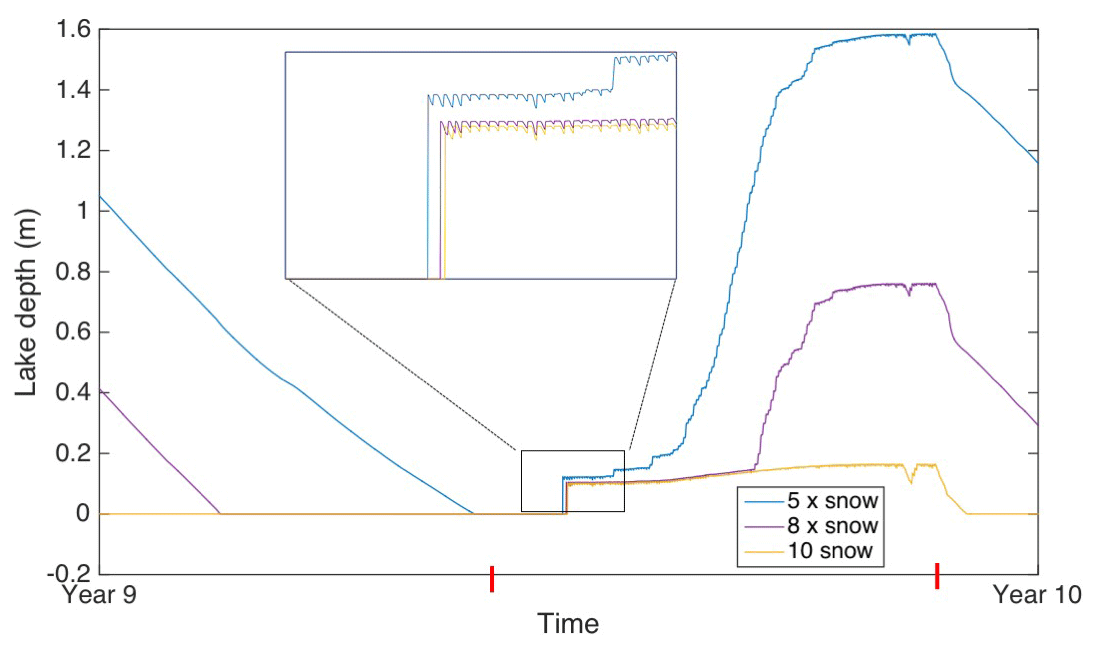
Figure 7The evolution of lake depth of the final year of each of the simulations for 5, 8, and 10 times the reference case level of accumulation. The zoomed in area shows that the time of onset is different for each case. Red lines on the horizontal axis indicate the first and final occurrence of melt during this year.
The lakes in the 8-times accumulation case occur after several years of steady densification of the firn profile. However, they are still shallower than those of the cases with lower accumulation levels. This is partly due to there being a greater amount of snow to saturate each year. This can be seen in the later onset time of the lake with increasing snowfall as shown in Fig. 7.
The thermal conductivity of the ice of previous years' lakes plays a role in the cause of the deeper lakes in the lower accumulation cases. This is because for the lower accumulation cases the solid ice of the previous year's refrozen lake will be exposed as the snow above it melts much more quickly than cases with higher accumulation (if it is exposed at all), meaning that the ice with a higher thermal conductivity is given longer exposure to the warmer temperatures at the surface than in the other cases, allowing the upper part of the ice shelf to heat up more quickly. This was confirmed by running the model as a slab of solid ice with constant positive forcing with two different values of thermal conductivity; in this case the higher-thermal-conductivity case had the greater value of melting. Therefore it can be concluded that the time of exposure of dense ice could also play a role in lake depth.
Table 2Maximum and average lake depths for the final 5 years of simulations for the reference case and the cases of increased air temperatures of 0.5, 1, 1.5, and 2 K.
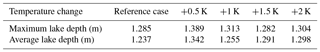
The effect of an increasing air temperature on the lake depth was also investigated. It would be expected that an increase in temperature would lead to an increase in lake depths and the opposite for a decrease in temperature, and this was found to be the case for an increase and decrease in the average air temperature of 0.5 K. However, this was not found to be the case when the temperature was increased by 1 K. Although the lakes in the +1 K simulation were deeper than the reference case simulation, they were shallower than the +0.5 K simulation. The average and maximum lake depths are shown in Table 2.
We can gain insight into this seemingly counter-intuitive behaviour by considering the duration of exposed melt lakes and snowfall. For the +0.5 K simulation the lakes are exposed (so no ice lid is present) for an average of 83.6 days a year, whereas in the +1 K simulation they are exposed for 85.7. Yet the lakes are not as deep in the 1 K simulation. This appears to be because the raised air temperatures are enough to prevent a permanent ice lid forming for an extended period when compared to the +0.5 K simulation but not enough that the lake warms to cause further basal melting. This then leads to a situation in which, as a lid does not form as early, less snowfall is able to accumulate on the lid when it does form. Then the reduced snowfall will limit the depth of lakes that can form in subsequent years and this counteracts the increased melting that occurs as a result of the increased air temperature and its effect on the surface energy balance.
This effect continues to be observed with temperatures increased to 1.5 and 2 K higher than the reference case simulation. Although more melting occurs with the increased temperatures and the lakes become deeper than in the +1 K simulation, the lakes do not become as deep as those in the +0.5 K simulation. Climate projections, however, suggest a simultaneous increase in both snowfall and air temperature and, as shown in Table 1, the combination of these two factors does lead to an increase in lake depths, and a larger increase than seen when increasing the snowfall alone.
Crevasse propagation caused by meltwater infiltration has been suggested as a possible mechanism for ice shelf disintegration (Scambos et al., 2000). The weight of the water in the crevasse can exceed the overburden pressure from the ice (acting to close the crevasse) so that the fracture toughness is exceeded and the crack propagates vertically and laterally.
Scambos et al. (2000) state that crevasses that are more than 90 % filled with water will tend to propagate through the ice shelf, whereas those that have a lower water content than this will tend to close. For this to occur the crevasses need to be of a critical initial depth, which depends on the surface density (the higher the density the larger the critical depth). The deeper the crevasse the greater the water pressure; the critical depth is defined as the depth at which the hydrostatic pressure of the water exceeds the glaciostatic pressure and full penetration of the ice shelf will occur. Scambos et al. (2000) found that this critical depth varied between 6 and 30 m depending on density and fracture toughness, although for surface densities similar to those found in the modelling efforts here crevasses can initially be as small as 6–10 m.
Using the results of Scambos et al. (2000) it is possible to use the modelled values of meltwater availability on the Larsen C Ice Shelf calculated in this study to infer whether or not this ice shelf may be at risk of crevasses propagating through the ice shelf either now or in the future.
Here we follow the crevasse sizes used by Sergienko and MacAyeal (2005) of 30 m wide and 20 m deep. In order to be 90 % filled with water these crevasses must therefore be filled to within 2 m of the surface. Basic geometrical calculations allow us to determine that the cross-sectional area of this crevasse that needs to be filled with meltwater would be 243 m2 should the crevasse be triangular. However, should the crevasse be more rectangular with a triangular tip then the area would be much larger, 540 m2 if we assume that the triangular tip is very small relative to the overall crevasse depth. These two crevasse geometries are illustrated in Fig. 8. In reality the crevasse shape would likely be somewhere between these two extremes.
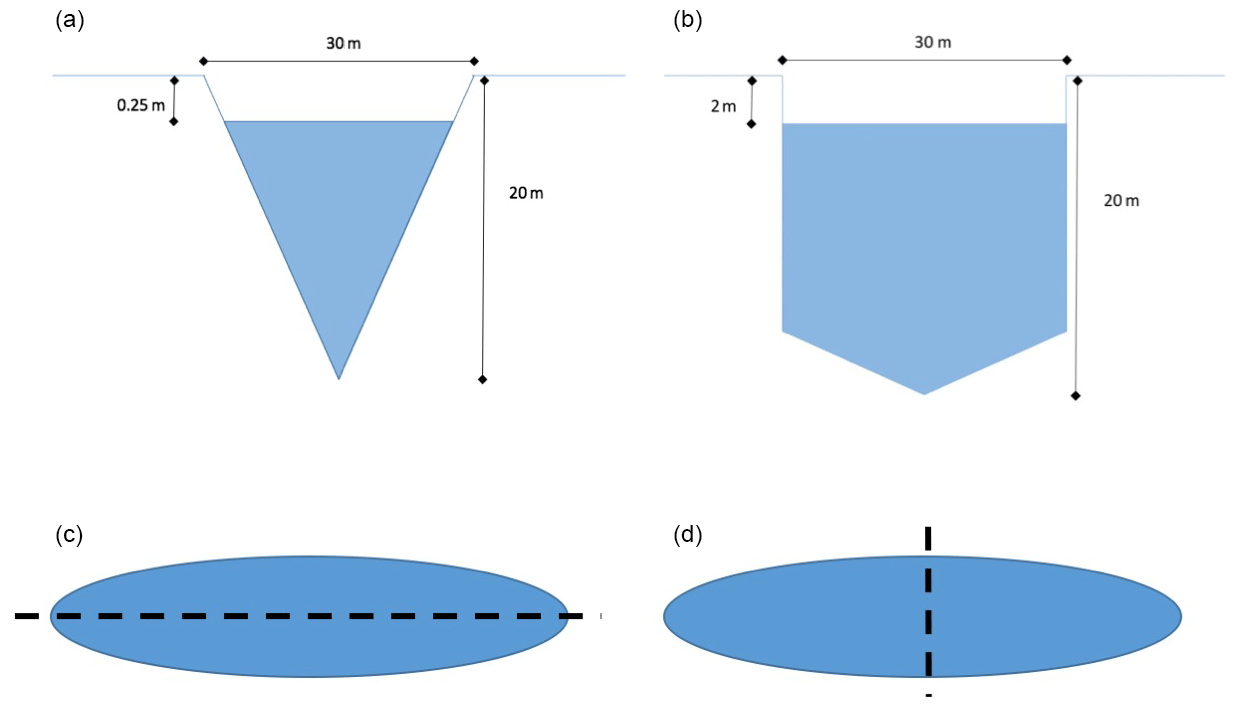
Figure 8The crevasse geometries modelled (a, b) and possible alignments with an oblong lake (c, d). The two idealized crevasses, 90 % filled with meltwater, are a purely triangular crevasse (a) and a rectangular crevasse with a triangular tip (b). The modelled crevasse alignments with the lake are shown using a dashed line to represent the crevasse (c, d).
If we assume that a lake such as that modelled above forms in the location of a pre-existing crevasse, we can use the volumes of water that are output by the model in order to estimate if the lake could contain enough water to cause propagation of that existing crevasse. The lake size that was used in the above simulations was 3150×390 m (based on a simplification of a larger lake from Landsat imagery).
If we assume that the crevasse is aligned with the lake along the direction of the lake's length (i.e. the crevasse runs 3150 m along the lake; the bottom left orientation in Fig. 8) then there will not be enough water to cause this crevasse to propagate through the ice shelf for either the average or maximum lake depth found in the reference case run for the case of a rectangular crevasse, but there will be for the triangular crevasse geometry. However, were the crevasse to run along the lake's width (so running for 390 m; the bottom right orientation in Fig. 8), there would be ample water available in the lake to cause the crevasse to fill to more than 90 % of its depth for either geometry.
For the lake depths and catchment area calculated, the minimum width of a lake for crack propagation with a crevasse running down the lake's length is 189 m for the triangular crevasse geometry and the maximum lake depth (196 m for the average lake depth) and 420 m for the rectangular crevasse geometry and maximum lake depth (437 m for the average lake depth). Therefore some of the long, thin lakes observed on Larsen C may be candidates for causing crevasse propagation, but many are not yet wide enough.
For the possible future conditions simulated above, all except the +0.5 K temperature +10 % accumulation simulation provided enough water for crevasse propagation for both crevasse geometries.
These considerations are, of course, prefatory and other factors will likely play a role. For example, the existence of a crevasse is likely to change the amount of meltwater produced, both due to the radiative effects of a crevasse and the albedo change due to lake formation being altered by water pooling in the crevasse. Crevasses can substantially alter the amount of heat absorbed by the ice shelf as radiation is able to be absorbed at depth (rather than having to be transferred from the surface by conduction) and the surface is exposed to different angles of incidence of the radiation (Pfeffer and Bretherton, 1987). Furthermore, the tensile and lithostatic stresses acting on the ice will influence propagation and factors such as the rate at which meltwater is added to the crevasse have been shown to be important (van der Veen, 2007).
Nevertheless, we have taken the simplistic approach here to demonstrate that meltwater levels are sufficient enough that this mechanism could warrant further investigation. Should these lakes spread further downstream of the ice shelf, the situation could be very different to that of the Larsen B Ice Shelf; the Larsen C lakes appear to be oriented with their longer axis following the direction of ice flow (Fig. 1) whereas on Larsen B both lakes and fractures were parallel to the calving front. This may mean more water availability for crevasse propagation should future Larsen C lakes have the same orientation as those currently present (which would depend on topographic control) and if they are perpendicular to crevasse orientation, leading to the possibility of collapse mechanisms such as the chain reaction descried in MacAyeal et al. (2003) should the lakes become much more widespread.
Surface melt lakes were shown to significantly alter the surface energy balance of the Larsen C Ice Shelf, with 70 % less melt occurring when they were not present. The formation and refreezing of these lakes impacts the ice shelf density profile and may contribute to future instability (Holland et al., 2015). Although current temperature changes on the peninsula may be within the range of natural variability, a large anthropogenic warming signal is observed in climate model projections forced with medium emission scenarios (Turner et al., 2016). Lakes are likely to become more significant, with each of six simulations of possible future conditions on the Larsen C Ice Shelf presented resulting in deeper lakes forming.
The model results here have been evaluated against satellite observations and where possible field observations.
Future scenarios with increases in precipitation and air temperature were found to lead to an increase in lake depths sufficient for the lakes not to freeze over entirely between melt seasons. However, only a small increase in the catchment area of the modelled lakes (of 5 %) was needed for this to occur under current conditions, suggesting that this may already occur on the Larsen C Ice Shelf.
It was found that there was a non-linear response in melt lake depth to increases in snowfall, although for snowfall to become great enough to start to reduce lake depth would need precipitation levels far above those predicted for Larsen C in the coming decades.
The response of melt lake formation to increases in air temperature was also not straightforward; although warmer temperatures led to more melting, the increased period of lake exposure with higher temperatures can act to reduce the time for snowfall to settle on top of the lake once it has frozen. This then reduces the depth of snow that can then be melted during subsequent lake formation in later years. Former lakes also play a role in future lake formation not only through acting as an impermeable layer but through their higher thermal conductivity allowing the top of the ice shelf to heat more rapidly than if it consisted purely of less-dense firn.
A consideration for future work could be to incorporate the wintertime foehn winds that have been shown by Kuipers Munneke et al. (2018) to lead to surface melt. Although it is unlikely these winds would impact the results presented here significantly (any melting would likely refreeze within the firn before the summer melt season; although it may speed up ice lens formation it would not add to the total meltwater available for summer lake formation), the authors of the study anticipate an increase in wintertime melt in response to increasing greenhouse gas concentration, which could enhance firn densification even further.
Melt lakes may provide enough water for the propagation of surface crevasses through the ice shelf. When penetration does occur, the ice shelf will remain weak as the refrozen ice will remain warmer (and therefore softer) than the older glacial ice for many years. Furthermore, seawater can also infiltrate the crevasse below, which will create permanently weaker zones of frozen saline ice within the interior of the ice shelf (Scambos et al., 2003). Although lakes have currently only been observed close to the grounding line on Larsen C, calculations suggest that they may already contain enough meltwater to cause hydrofracture should future temperature increases cause them to occur closer to the ice shelf front and this could be a factor in ice shelf instability.
The model code used in this study is available at https://doi.org/10.17864/1947.121 (Buzzard, 2017).
The modelling work and preparation of the manuscript were carried out by SB, under the supervision of DaFe and DaFl.
The authors declare that they have no conflict of interest.
The authors would like to acknowledge Allen Pope (NSIDC) for his contribution to the model validation, including the production of Fig. 5 and calculation of lake depths from Landsat data. We would also like to thank the two anonymous reviewers and editor Michiel van den Broeke for their helpful comments in improving this paper.
Sammie Buzzard was supported by a NERC Doctoral Training
Grant NE/J500082/1.
Edited by: Michiel van den Broeke
Reviewed by: two anonymous referees
Banwell, A., MacAyeal, D., and Sergienko, O.: Breakup of the Larsen B Ice Shelf triggered by chain reaction drainage of supraglacial lakes, Geophys. Res. Lett., 40, 5872–5876, https://doi.org/10.1002/2013GL057694, 2013. a
Bevan, S. L., Luckman, A., Hubbard, B., Kulessa, B., Ashmore, D., Kuipers Munneke, P., O'Leary, M., Booth, A., Sevestre, H., and McGrath, D.: Centuries of intense surface melt on Larsen C Ice Shelf, The Cryosphere, 11, 2743–2753, https://doi.org/10.5194/tc-11-2743-2017, 2017. a
Bracegirdle, T., Connolley, W., and Turner, J.: Antarctic climate change over the twenty first century, J. Geophys. Res., 113, D03103, https://doi.org/10.1029/2007JD008933, 2008. a
Bracegirdle, T., Barrand, N., Kusahara, K., and Wainer, I.: Predicting Antarctic climate using climate models, Antarctic Environments Portal, https://doi.org/10.18124/D4VC76, 2016. a
Buzzard, S.: A Mathematical Model of Melt Lake Formation on an Ice Shelf, University of Reading, Software, https://doi.org/10.17864/1947.121, 2017. a
Buzzard, S., Feltham, D., and Flocco, D.: A mathematical model of meltlake development on an ice shelf, J. Adv. Model. Earth Sy., 10, 262–283, https://doi.org/10.1002/2017MS001155, 2018. a, b, c
De Angelis, H. and Skvarca, P.: Glacier surge after ice shelf collapse, Science, 299, 1560–1562, 2003. a
Dee, D. P., Uppala, S. M., Simmons, A. J., Berrisford, P., Poli, P., Kobayashi, S., Andrae, U., Balmaseda, M. A., Balsamo, G., Bauer, P., Bechtold, P., Beljaars, A. C. M., van de Berg, L., Bidlot, J., Bormann, N., Delsol, C., Dragani, R., Fuentes, M., Geer, A. J., Haimberger, L., Healy, S. B., Hersbach, H., Hólm, E. V., Isaksen, L., Kållberg, P., Köhler, M., Matricardi, M., McNally, A. P., Monge-Sanz, B. M., Morcrette, J.-J., Park, B.-K., Peubey, C., de Rosnay, P., Tavolato, C., Thépaut, J.-N., and Vitart, F.: The ERA-Interim reanalysis: configuration and performance of the data assimilation system, Q. J. Roy. Meteor. Soc., 137, 553–597, https://doi.org/10.1002/qj.828, 2011. a
Elvidge, A., Renfrew, I., King, J., Orr, A., Lachlan-Cope, T., Week, M., and Gray, S.: Foehn jets over the Larsen C Ice Shelf, Antarctica, Q. J. Roy. Meteor. Soc., 141, 698–713, https://doi.org/10.1002/qj.2382, 2015. a, b
Gourmelen, N., Shepherd, A., Jenkins, A., and Houlie, N.: Basal melt rate at the Larsen-C Ice Shelf, Poster C21D-0473, AGU Fall meeting 2009, San Francisco, USA, 2009. a
Hogg, A. and Gudmundsson, G.: Impacts of the Larsen-C Ice Shelf calving event, Nature Climate Change, 7, 540–542, 2017. a
Holland, P., Corr, H. F. J., Pritchard, H. D., Vaughan, D. G., Arthern, R. J., Jenkins, A., and Tedesco, M.: The air content of Larsen Ice Shelf, Geophys. Res. Lett., 38, L10503, https://doi.org/10.1029/2011GL047245, 2011. a
Holland, P. R., Brisbourne, A., Corr, H. F. J., McGrath, D., Purdon, K., Paden, J., Fricker, H. A., Paolo, F. S., and Fleming, A. H.: Oceanic and atmospheric forcing of Larsen C Ice-Shelf thinning, The Cryosphere, 9, 1005–1024, https://doi.org/10.5194/tc-9-1005-2015, 2015. a, b
Hubbard, B., Luckman, A., Ashmore, D., Bevan, S., Kulessa, B., Kuipers Munneke, P., Philippe, M., Jansen, D., Booth, A., Sevestre, H., Tison, J., O'Leary, M., and Rutt, I.: Massive subsurface ice formed by refreezing of ice-shelf melt ponds, Nat. Commun., 7, 1–6, https://doi.org/10.1038/ncomms11897, 2016. a, b
IPCC: Annex I: Atlas of Global and Regional Climate Projections, edited by: van Oldenborgh, G. J., Collins, M., Arblaster, J., Christensen, J. H., Marotzke, J., Power, S. B., Rummukainen, M., and Zhou, T., in: Climate Change 2013: The Physical Science Basis. Contribution of Working Group I to the Fifth Assessment Report of the Intergovernmental Panel on Climate Change, edited by: Stocker, T. F., Qin, D., Plattner, G.-K., Tignor, M., Allen, S. K., Boschung, J., Nauels, A., Xia, Y., Bex, V., and Midgley, P. M., Cambridge University Press, Cambridge, United Kingdom and New York, NY, USA, 2013. a
Jansen, D., Kulessa, B., Sammonds, P. R., Luckman, A., King, E. C., and Glasser, N. F.: Present stability of the Larsen C ice shelf, Antarctic Peninsula, J. Glaciol., 56, 593–600, 2010. a
Jansen, D., Luckman, A. J., Cook, A., Bevan, S., Kulessa, B., Hubbard, B., and Holland, P. R.: Brief Communication: Newly developing rift in Larsen C Ice Shelf presents significant risk to stability, The Cryosphere, 9, 1223–1227, https://doi.org/10.5194/tc-9-1223-2015, 2015. a
Jarvis, E. and King, E.: Seismic investigation of the Larsen Ice Shelf, Antarctica: in search of the Larsen Basin, Antarct. Sci., 7, 181–190, 1995. a
Khazendar, A., Rignot, E., and Larour, E.: Acceleration and spatial rheology of Larsen C Ice Shelf, Antarctic Peninsula, J. Geophys. Res., 38, L09502, https://doi.org/10.1029/2011GL046775, 2011. a
Krinner, G., Magand, O., Simmonds, I., Genthon, C., and Dufresne, J. L.: Simulated Antarctic precipitation and surface mass balance at the end of the twentieth and twenty-first centuries, Clim. Dynam., 28, 215–230, https://doi.org/10.1007/s00382-006-0177-x, 2007. a
Kuipers Munneke, P., Picard, G., Van Den Broeke, M. R., Lenaerts, J. T. M., and Van Meijgaard, E.: Insignificant change in Antarctic snowmelt volume since 1979, Geophys. Res. Lett., 39, 6–10, 2012. a
Kuipers Munneke, P., Ligtenberg, S., Van den Broeke, M., and Vaughan, D.: Firn air depletion as a precursor of Antarctic ice-shelf collapse, J. Glaciol., 60, 205–214, 2014. a
Kuipers Munneke, P., Luckman, A. J., Bevan, S. L., Smeets, C. J. P. P., Gilbert, E., and van den Broeke, M. R.: Intense winter surfacemelt on an Antarctic ice shelf, Geophys. Res. Lett., 45, 7615–7623, 2018. a
Luckmann, A., Elvidge, A., Jansen, D., Kulessa, B., Kuipers Munneke, P., King, J., and Barrand, N.: Surface melt and ponding on Larsen C Ice Shelf and the impact of foehn winds, Antarct. Sci., 26, 625–635, 2014. a, b
MacAyeal, D. R., Scambos, T. A., Hulbe, C. L., and Fahnestock, M. A.: Catastrophic ice-shelf break-up by an ice-shelf-fragment-capsize mechanism, J. Glaciol., 49, 22–36, https://doi.org/10.3189/172756503781830863, 2003. a
Morris, E. and Vaughan, D.: Spatial and temporal variation of surface temperature on the Antarctic Peninsula and the limit of viability of ice shelves, Antarctic Peninsula Climate Variability: Historical and Paleoenvironmental Perspectives, Anarct. Res. Ser., 79, 61–68, 2003. a
Pfeffer, W. and Bretherton, C.: The effect of crevasses on the solar heating of a glacier surface, in: The Physical Basis of Ice Sheet Modelling, Proceedings of the Vancouver Symposium, August 1987, IAHS Publ. no. 170, 191–206, 1987. a
Pope, A., Scambos, T. A., Moussavi, M., Tedesco, M., Willis, M., Shean, D., and Grigsby, S.: Estimating supraglacial lake depth in West Greenland using Landsat 8 and comparison with other multispectral methods, The Cryosphere, 10, 15–27, https://doi.org/10.5194/tc-10-15-2016, 2016. a, b
Rack, W. and Rott, H.: Pattern of retreat and disintegration of the Larsen B ice shelf, Antarctic Peninsula, Ann. Glaciol., 39, 505–510, 2004. a
Rignot, E., Casassa, G., Gogineni, P., Krabill, W., Rivera, A., and Thomas, R.: Accelerated ice discharge from the Antarctic Peninsula following the collapse of Larsen B ice shelf, Geophys. Res. Lett., 31, L18401, https://doi.org/10.1029/2004GL020697, 2004. a
Rott, H., Abdel Jaber, W., Wuite, J., Scheiblauer, S., Floricioiu, D., van Wessem, J. M., Nagler, T., Miranda, N., and van den Broeke, M. R.: Changing pattern of ice flow and mass balance for glaciers discharging into the Larsen A and B embayments, Antarctic Peninsula, 2011 to 2016, The Cryosphere, 12, 1273–1291, https://doi.org/10.5194/tc-12-1273-2018, 2018. a
Scambos, T., Hulbe, C., Fahnestock, M., and Bohlander, J.: The link between climate warming and break-up of ice shelves in the Antarctic Peninsula, J. Glaciol., 46, 516–530, 2000. a, b, c, d, e, f
Scambos, T., Bohlander, J., and Raup, B.: Images of Antarctic Ice Shelves, Larsen C Ice Shelf, January 2007, National Snow and Ice Data Center, Boulder, Colorado, USA, https://doi.org/10.7265/N5NC5Z4N, 2001. a
Scambos, T., Hulbe, C., and Fahnestock, M.: Climate-induced ice shelf disintegration in the Antarctic Peninsula, Antarctic Peninsula Climate Variability, Antar. Res. S., 79, 335–347, 2003. a
Scambos, T., Bohlander, J., Schuman, C., and Skvarca, P.: Glacier acceleration and thinning after ice shelf collapse in the Larsen B embayment, Antarctica, Geophys. Res. Lett., 31, L18402, https://doi.org/10.1029/2004GL020670, 2004. a, b, c, d
Schytt, V.: A. Snow studies at Maudheim. B. Snow studies inland. C: The inner structure of the ice shelf at Maudheim as shown by core drilling, in: Vol. IV: Glaciology II, Norwegian-British-Swedish Antarctic Expedition, 1949-5, Norsk Palarinstitutt, Oslo, 1958. a
Sergienko, O. and MacAyeal, D.: Surface melting on Larsen Ice Shelf, Antarctica, Ann. Glaciol., 40, 215–218, 2005. a
Taylor, K. E., Stouffer, R. J., and Meehl, G. A.: 2012: A summary of the CMIP experiment design, B. Am. Meteorol. Soc., 93, 485–498, 1998. a
Turner, J., Lu, H., White, I., King, J., Phillips, T., Hoskingt, J., Bracegirdle, T., Marshall, G., Mulvaneyt, R., and Deb, P.: Absence of 21st century warming on Antarctic Peninsula consistent with natural variability, Nature, 535, 411–415, 2016. a
van der Veen, C. J.: Fracture propagation as means of rapidly transferring surface meltwater to the base of glaciers, Geophys. Res. Lett., 34, L01501, https://doi.org/10.1029/2006GL028385, 2007. a
van Wessem, J. M., Ligtenberg, S. R. M., Reijmer, C. H., van de Berg, W. J., van den Broeke, M. R., Barrand, N. E., Thomas, E. R., Turner, J., Wuite, J., Scambos, T. A., and van Meijgaard, E.: The modelled surface mass balance of the Antarctic Peninsula at 5.5 km horizontal resolution, The Cryosphere, 10, 271–285, https://doi.org/10.5194/tc-10-271-2016, 2016. a
Wuite, J., Rott, H., Hetzenecker, M., Floricioiu, D., De Rydt, J., Gudmundsson, G. H., Nagler, T., and Kern, M.: Evolution of surface velocities and ice discharge of Larsen B outlet glaciers from 1995 to 2013, The Cryosphere, 9, 957–969, https://doi.org/10.5194/tc-9-957-2015, 2015. a
- Abstract
- Introduction
- Methods
- Modelling current melt lake formation on the Larsen C Ice Shelf
- Model validation
- Future conditions on the Larsen C Ice Shelf
- The impact of increased snowfall on surface melt lake formation
- The impact of increased air temperature on surface melt lake formation
- Contribution of meltwater to crevasse propagation
- Conclusions
- Code availability
- Author contributions
- Competing interests
- Acknowledgements
- References