the Creative Commons Attribution 4.0 License.
the Creative Commons Attribution 4.0 License.
 | 06 Jun 2018
Mercury in the Arctic tundra snowpack: temporal and spatial concentration patterns and trace gas exchanges
Yannick Agnan
Thomas A. Douglas
Detlev Helmig
Jacques Hueber
Daniel Obrist
In the Arctic, the snowpack forms the major interface between atmospheric and terrestrial cycling of mercury (Hg), a global pollutant. We investigated Hg dynamics in an interior Arctic tundra snowpack in northern Alaska during two winter seasons. Using a snow tower system to monitor Hg trace gas exchange, we observed consistent concentration declines of gaseous elemental Hg () from the atmosphere to the snowpack to soils. The snowpack itself was unlikely a direct sink for atmospheric . In addition, there was no evidence of photochemical reduction of HgII to in the tundra snowpack, with the exception of short periods during late winter in the uppermost snow layer. The patterns in this interior Arctic snowpack thus differ substantially from observations in Arctic coastal and temperate snowpacks. We consistently measured low concentrations of both total and dissolved Hg in snowpack throughout the two seasons. Chemical tracers showed that Hg was mainly associated with local mineral dust and regional marine sea spray inputs. Mass balance calculations show that the snowpack represents a small reservoir of Hg, resulting in low inputs during snowmelt. Taken together, the results from this study suggest that interior Arctic snowpacks are negligible sources of Hg to the Arctic.
- Article
(3602 KB) - Full-text XML
-
Supplement
(554 KB) - BibTeX
- EndNote


Mercury (Hg) is a neurotoxic pollutant of worldwide importance that is transported over long distances in the atmosphere as gaseous elemental Hg () and thus reaches remote environments (Cobbett et al., 2007; Driscoll et al., 2013; Sprovieri et al., 2010). In the Arctic, modern atmospheric Hg deposition has increased about 3-fold from pre-industrialized background levels (Fitzgerald et al., 2005), similar to increases observed in temperate locations, although other studies suggest much stronger increases (e.g., Enrico et al., 2017). The increase in Hg loading has led to vulnerability of polar ecosystems to Hg contamination due to detrimental impacts to wildlife and humans, in particular through biomagnification processes across trophic levels (Atwell et al., 1998).
Representing about 26 % of the global land surface area, polar regions are unique environments with specific physical, chemical, and biological processes affecting pollutant cycles including that of Hg (Douglas et al., 2012). In particular, most of the northern latitudes are covered by a laterally continuous snowpack during long periods of the year. In the Alaskan tundra, the surface snow cover is present about two-thirds of the year (Cherry et al., 2014). The snowpack hence forms a critical interface between the Arctic atmosphere, tundra ecosystems, and underlying tundra soils. Trace gas exchanges between the atmosphere and the tundra are modulated by sinks and sources below and within snowpack, by snow diffusivity, snow height, and snow porosity (Dominé and Shepson, 2002; Lalonde et al., 2002; Monson et al., 2006). The snowpack accumulates nutrients, pollutants, and impurities that are deposited by snowfall and dry deposition processes, all of which can subsequently be transported to underlying ecosystems during snowmelt (Bergin et al., 1995; Uematsu et al., 2000).
The snowpack plays an important role for the cycling of Hg as well, including for atmospheric deposition, photochemical redox reactions, and associated phase changes between solid and gaseous Hg that can volatilize Hg to the atmosphere (Douglas et al., 2008, 2012; Faïn et al., 2013; Mann et al., 2014; Steffen et al., 2013). In particular, temperate and Arctic studies have shown that the snowpack can serve as sink or source of , whereby photochemical reduction of snow-bound HgII can produce , and oxidation processes can reversely scavenge atmospheric in snow (Faïn et al., 2013; Lalonde et al., 2002; Mann et al., 2011). Photochemical reactions occur primarily in the top 10 cm of the snowpack, where sunlight radiation transmits and is absorbed and scattered by snow crystals (Faïn et al., 2007; King and Simpson, 2001). The degree of photochemical production of and subsequent atmospheric re-volatilization from the snowpack can be significant, as shown in temperate snowpacks with strong recurring daytime atmospheric emissions of throughout the winter season (Faïn et al., 2013). In global models, snowpack emissions can account for ∼ 50 % of all snowpack Hg (Corbitt et al., 2011). The reverse process – oxidation of to HgII – has also been proposed to occur in the dark snowpack deeper in the snow profile (Faïn et al., 2007, 2013; Mann et al., 2015), resulting in concentration declines of with depth in the snowpack. To our knowledge, however, no direct in situ measurement of snowpack dynamics is available in the field in the interior Arctic snowpack.
In the Arctic and Antarctic, Hg cycling is also affected by atmospheric Hg depletion events (AMDEs), which are observed primarily in the springtime along coastal locations (Angot et al., 2016a; Dommergue et al., 2010; Schroeder et al., 1998; Steffen et al., 2008). During AMDEs, atmospheric concentrations fluctuate strongly due to atmospheric conversion of to oxidized HgII. Because HgII is subject to faster deposition (Schroeder and Munthe, 1998; Selin, 2009), AMDEs result in Hg temporarily deposited from the atmosphere to the Arctic ecosystems. AMDEs are considered to be initiated by halogens (Brooks et al., 2008; Obrist et al., 2011; Steffen et al., 2008), such as bromine and chlorine radicals released from sea salt by photochemical processes (Simpson et al., 2007). AMDEs have been mainly observed along the coasts, e.g., at Barrow in Alaska (Douglas et al., 2008), Alert in Canada (Steffen et al., 2002), Ny-Ålesund in Svalbard (Ferrari et al., 2008), McMurdo in Antarctica (Brooks et al., 2008), and directly over the sea ice (Moore et al., 2014; Nerentorp Mastromonaco et al., 2016). The impact of AMDEs at inland sites is reduced with increasing distance from the coast (Douglas and Sturm, 2004; Obrist et al., 2017; Van Dam et al., 2013).
The objective of this study was to characterize Hg dynamics in the inland Arctic snowpack at Toolik Field Station and along a 170 km transect between this site and the Arctic coast. For the first time, we comprehensively linked trace gas fluxes of in interstitial snow air with the seasonal development of total Hg (Hgtot) and dissolved Hg (Hgdiss) bound in the snowpack to assess conversions between volatile and solid Hg in the Arctic snowpack. We specifically aimed to assess (1) temporal and vertical patterns to quantify exchanges of in the atmosphere–snowpack–soil continuum; (2) impacts of springtime AMDEs on snowpack Hg deposition to and emission from the inland Arctic snowpack; (3) temporal and vertical concentration and mass patterns of the snowpack Hgtot and Hgdiss to estimate Hg deposition throughout the snow accumulation period and pool of Hg available through snow melt; and (4) relationships of snow Hg concentrations with major ion concentrations and oxygen and hydrogen stable isotopes in precipitation to determine potential origins of Hg contained in the snowpack.
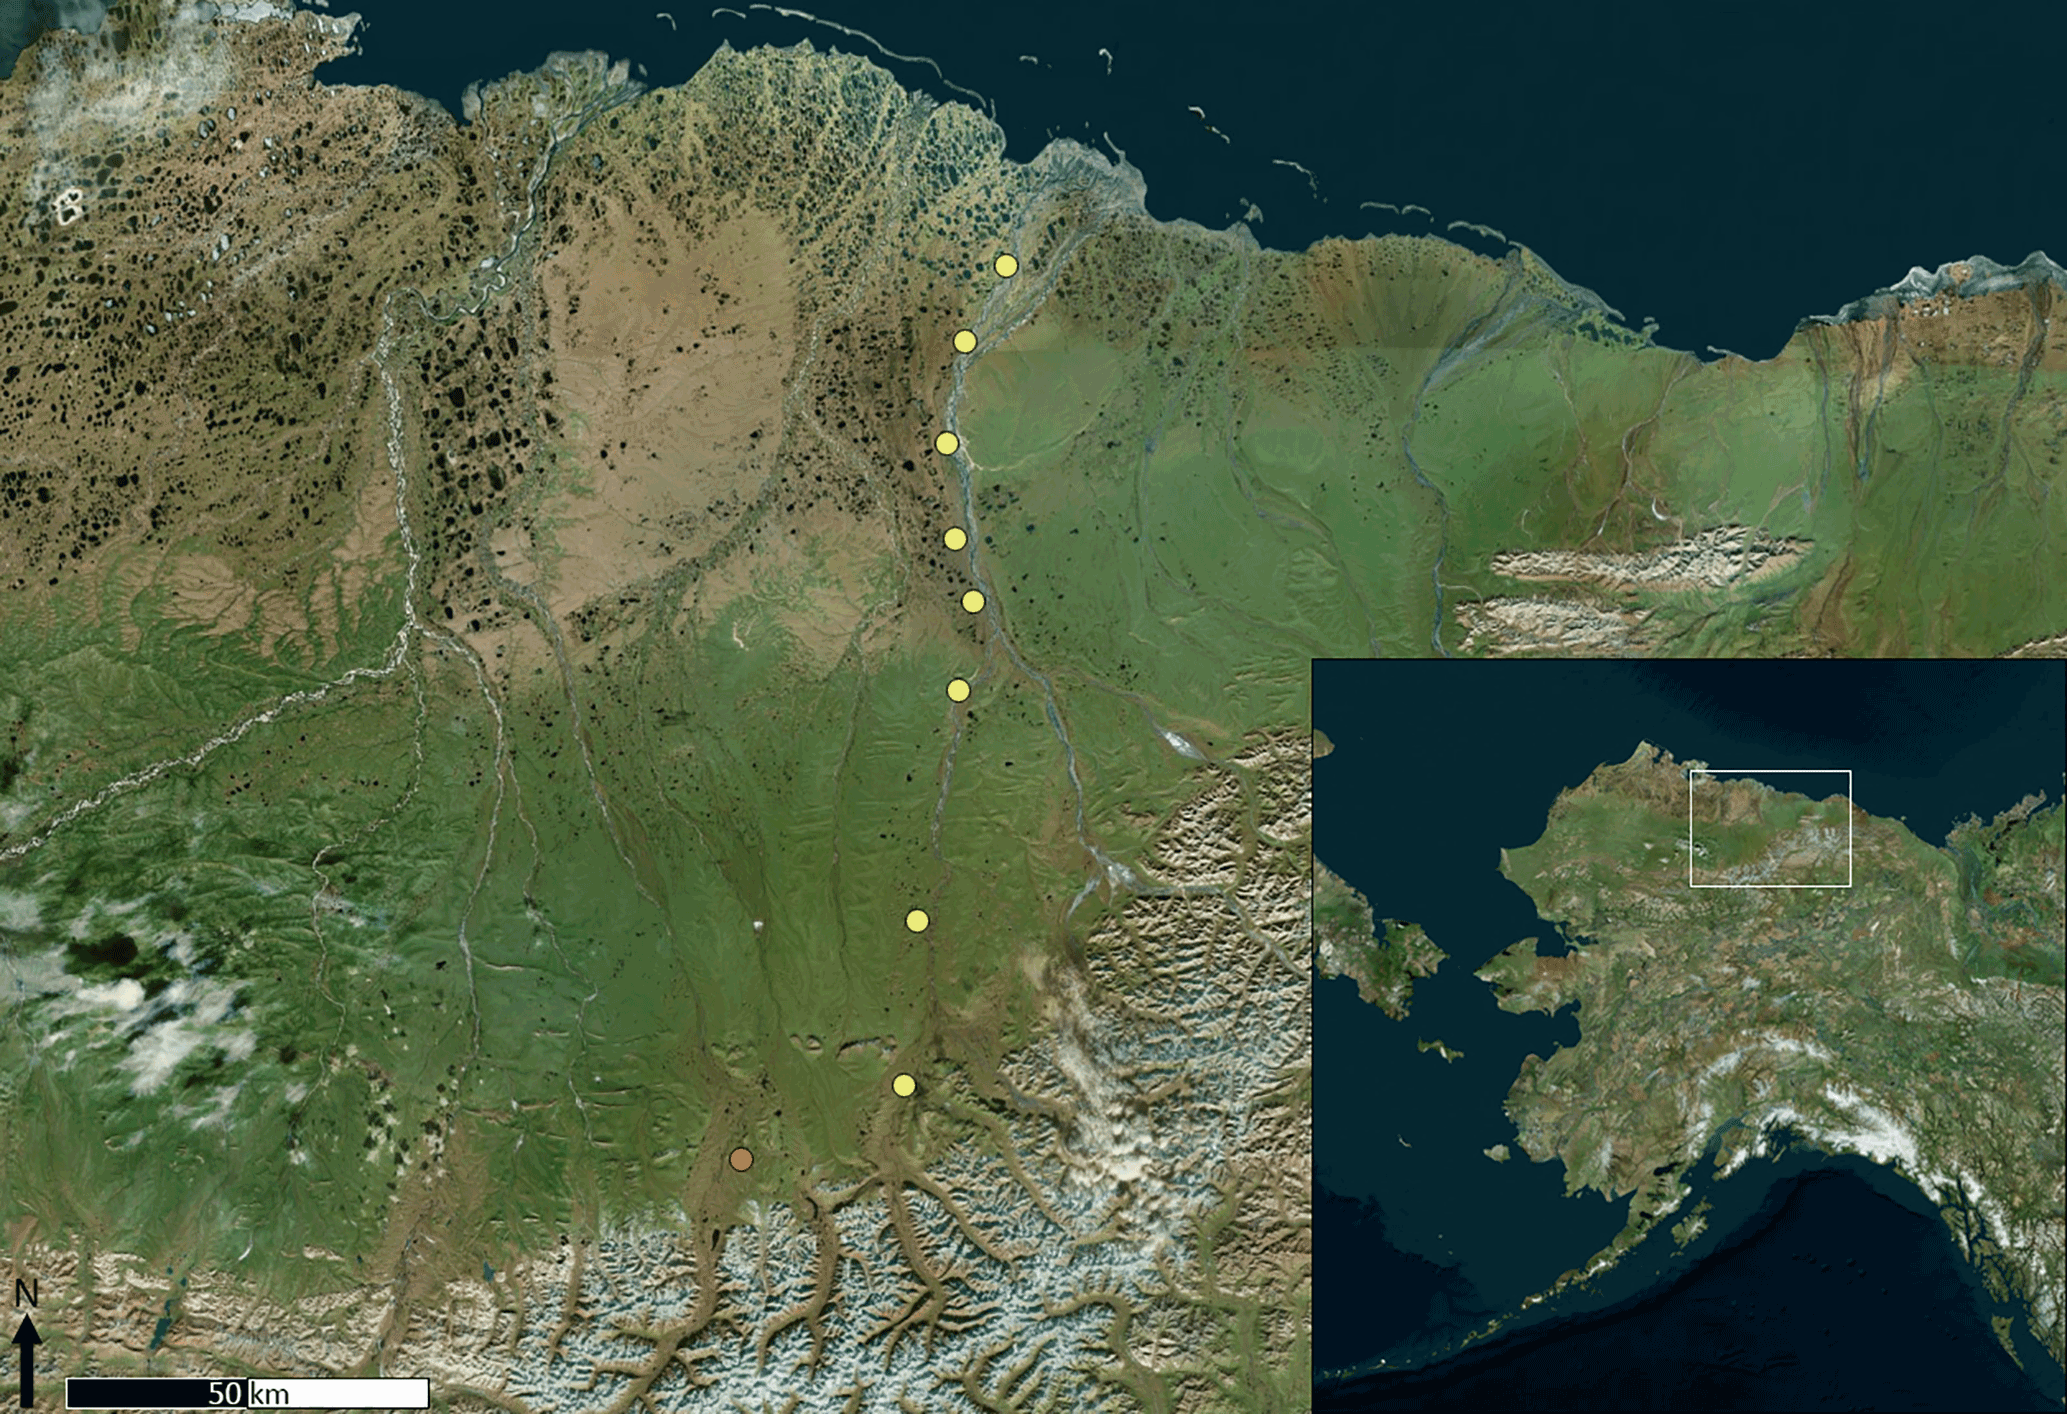
Figure 1Study area in northern Alaska, including Toolik Field Station (orange bullet point) and the eight transect sites (yellow bullet points). Satellite images are true color images (Earthstar Geographics SIO, 2017).
2.1 Study site
Measurements were mainly performed at Toolik Field Station (Alaska, USA) over two full snow cover seasons from October 2014 to May 2016. The research station is located on the north slopes of the Brooks Range (68∘38′ N, 149∘36′ W) at an elevation of 720 m a.s.l, approximately 200 km south of the Arctic Ocean (Fig. 1, orange bullet). The area is characterized by gently sloping hills comprised of poorly drained silty loams underlain by continuous permafrost 250–300 m deep (Barker et al., 2014). Lithology is characterized by glacial till over Cretaceous sedimentary substrates (shale, claystone, siltstone, and sandstone; Alaska Division of Oil and Gas, 2008). The ecotype is classified as an acidic tussock tundra (Shaver and Chapin, 1991) with vegetation composed of scrubby plants (e.g., Cassiope tetragona (L.) D.Don, Arctostaphylos alpinus (L.) Spreng.), shrubs (e.g., Betula nana L., Salix pulchra Cham.), tussock grasses (Carex), and a variety of mosses and lichens. The mean annual air temperature is −8.5 ∘C, and mean annual precipitation is 312 mm (Cherry et al., 2014). In the two measurement years, the tundra was covered by snow for 236 and 248 days (i.e., 65 and 68 % of the year) in the 2014–2015 and 2015–2016 seasons, respectively.
Snowpack sampling was also performed along a transect between Toolik and the Arctic Ocean in March 2016 (Fig. 1, yellow bullets). Detailed geographical characteristics of the sample sites are given in Table S1 in the Supplement. A total of eight study sites were sampled from south (500 m a.s.l.) to north (20 m a.s.l.). All the sampled sites were characterized by similar ecosystems and lithology (including undifferentiated volcanic Upper Cenozoic beds to the north) as described above for the Toolik area.
2.2 Trace gas in the atmosphere, interstitial snow air, and soil pores
We continuously sampled and analyzed interstitial air of the tundra snowpack at Toolik using a snow tower (Fig. S1 in the Supplement) as described in detail by Seok et al. (2009) and Faïn et al. (2013). In summary, a snow tower consists of an air inlet manifold placed in the snowpack, so sampling of trace gases can be remotely alternated between various snow depths for undisturbed sampling of interstitial snow air throughout an entire snow season. The snow tower used at Toolik consisted of six 60 cm aluminum cross arms mounted at heights of 0, 10, 20, 30, 40, and 110 cm above the ground surface. Gas inlets were mounted to each cross arm, allowing vertical sampling of snow interstitial air for analysis for multiple trace gases, including , CO2, and O3. Each cross arm supported a pair of air inlets fitted with 25 mm syringe filters with 1 µm glass fiber membranes (Pall Life Sciences, Ann Arbor, MI, USA). Perfluoroalkoxy Teflon® tubing with equal lengths (35 m) were directed in a heated conduit to solenoid valves in the laboratory that allowed for sequential sampling of trace gases at the six different snowpack heights. The snow tower was deployed over the tundra in August of each year prior to the onset of snowfall. When the snow tower was subsequently covered by the accumulating snowpack, this setup allowed sequentially continuous sampling of snow interstitial air without any disturbance. Inlets were sampled sequentially, 10 min at a time (i.e., averages of two individual measurements of 5 min), resulting in a 60 min sampling cycle. Corresponding trace gas sampling was performed below the snowpack in tundra soils at depths of 10, 20, and 40 cm using Teflon® soil trace gas wells (Obrist et al., 2014, 2017). Both organic and mineral soil profiles, at a distance of 5 m from each other, were considered in this study, as described in Obrist et al. (2017). Atmospheric air sampling was performed using the top snow tower air inlets which were always above the developing snowpack as well as on a nearby micrometeorological tower at a height of 3.6 m above ground. All interstitial snow, soil pore, and atmospheric inlets were connected by Teflon® tubing and solenoid valves to trace gas monitors in a nearby (10–30 m distance) field laboratory that were operated year-round.
Gaseous Hg0 concentrations were measured using two Tekran 2537B analyzers (Tekran Instruments Corporation, Toronto, ON, Canada), one shared for interstitial snow air and atmospheric measurements, and the other shared for soil gas and atmospheric measurements. The discrepancy in measurements observed between the two Tekran instruments along the two seasons was on average 7 %; concentration data showed here were adjusted using the differences between the two atmospheric inlets. Air sampling was alternated between different snowpack heights every 5 min so that a full sequence of air extraction from the snowpack (six inlet heights) was achieved every 30 min. Interstitial snow, soil pore, and atmospheric measurements continued through the entire winter with only small time periods of interruptions due to power failures or other technical problems. Additional trace gases were measured along with , including concentrations of CO2 using a LI-840A (LI-COR Inc., Lincoln, NE, USA).
2.3 Snow sampling and physical and chemical characterization
2.3.1 Snow sampling
At Toolik, we characterized Hg in the snowpack both over the undisturbed tundra and the adjacent frozen Toolik Lake (within 200 m of the tundra location). Two snow pits were sampled on five dates between October and May in the 2014–2015 season and on four dates between December and June in 2015–2016. For each pit, we vertically excavated snow samples using a stainless-steel snow cutter (RIP 1 cutter 1000 cc), clean latex gloves, and trace metal Nasco Whirl-Pak® (The Aristotle Corporation, Stamford, CT, USA) HDPE plastic bags. We sampled at 10 cm layer increments from the top to the bottom of the snowpack. Samples from two perpendicular walls of the pit were each pooled together per layer for analysis. Snow height, density, and temperature were measured for each layer, and frozen snow samples were stored in a cooler before transferring to a −20 ∘C freezer. Snow water equivalent (SWE), which represents the amount of water stored in the snowpack, was calculated using snow density measurements in incremental 10 cm layers, multiplied by snow height. Additional sampling of surface snow was performed over the tundra for a total of 17 sampling dates. The top 3 cm of the snowpack was collected in triplicate within a distance of 5 m into Nasco Whirl-Pak® plastic bags using clean latex gloves. Sampling along the south to north transect was performed over 2 days in March 2016.
2.3.2 Chemical analyses
In the laboratory, we melted snow samples overnight in the Nasco Whirl-Pak® bags at room temperature in the dark, and melted snow samples were subsequently analyzed for Hg. A fraction of snowmelt was directly transferred to 50 mL polypropylene tubes (Falcon®, Corning Incorporated, Corning, NY, USA) for analysis of Hgtot. For Hgdiss, snowmelt water was filtered using 0.45 µm Acrodisc® filter with polyethersulfone membrane (Pall Corporation, Port Washington, NY, USA) into 50 mL Falcon® polypropylene tubes. In addition, filtered meltwater was used in 60 mL high-density polyethylene tubes (VWR®, Radnor, PA, USA) for determination of major cations, anions, and stable isotopes (2H and 18O). Total Hg and Hgdiss concentrations were determined using Tekran 2600 cold-vapor atomic fluorescence spectrometry (Tekran Instruments Corporation, Toronto, ON, Canada) using a bromine monochloride (BrCl) digestion and reduction by stannous chloride (SnCl2) following EPA method 1631 (US EPA, 2002). The detection limits (DL), determined as 3 times the standard deviation of blank samples, averaged 0.08 ng L−1. For statistic purpose, values below the DL were included as 0.5 × DL. Analyzer performance was determined by 5 ng L−1 standards analyzed every 10 samples, and recovery averaged between 93 and 107 %. Laboratory and field blanks were conducted, and we evaluated any potential metal contamination of the stainless-steel snow cutter by analyzing Milli-Q water in contact with the snow cutter; all these blank determinations were below DL.
Major cation and anion concentrations were quantified at the US Army Cold Regions Research and Engineering Laboratory's (CRREL) Alaska Geochemistry Laboratory in Fort Wainwright, Alaska, with a Dionex ICS-3000 ion chromatograph. An AS-19 anion column and a CS-12A cation column (Dionex Corporation Sunnyvale, California) were used, each with a 10 µL injection volume. A gradient method using potassium hydroxide (20 to 35 µmol L−1) was used for anion analyses, while cation analyses used methane sulfonic acid eluent with a concentration of 25 µmol L−1 in isocratic mode. The flow rate was 1 mL min−1 and the operating temperature was 30 ∘C. The ion chromatograph was calibrated using standards with a range from 0.5 to 50 mg L−1. Repeat analyses of calibration standards from 0.5 to 50 mg L−1 yielded a precision of ±5 %. Peaks were identified using Chromeleon (Dionex) and verified visually.
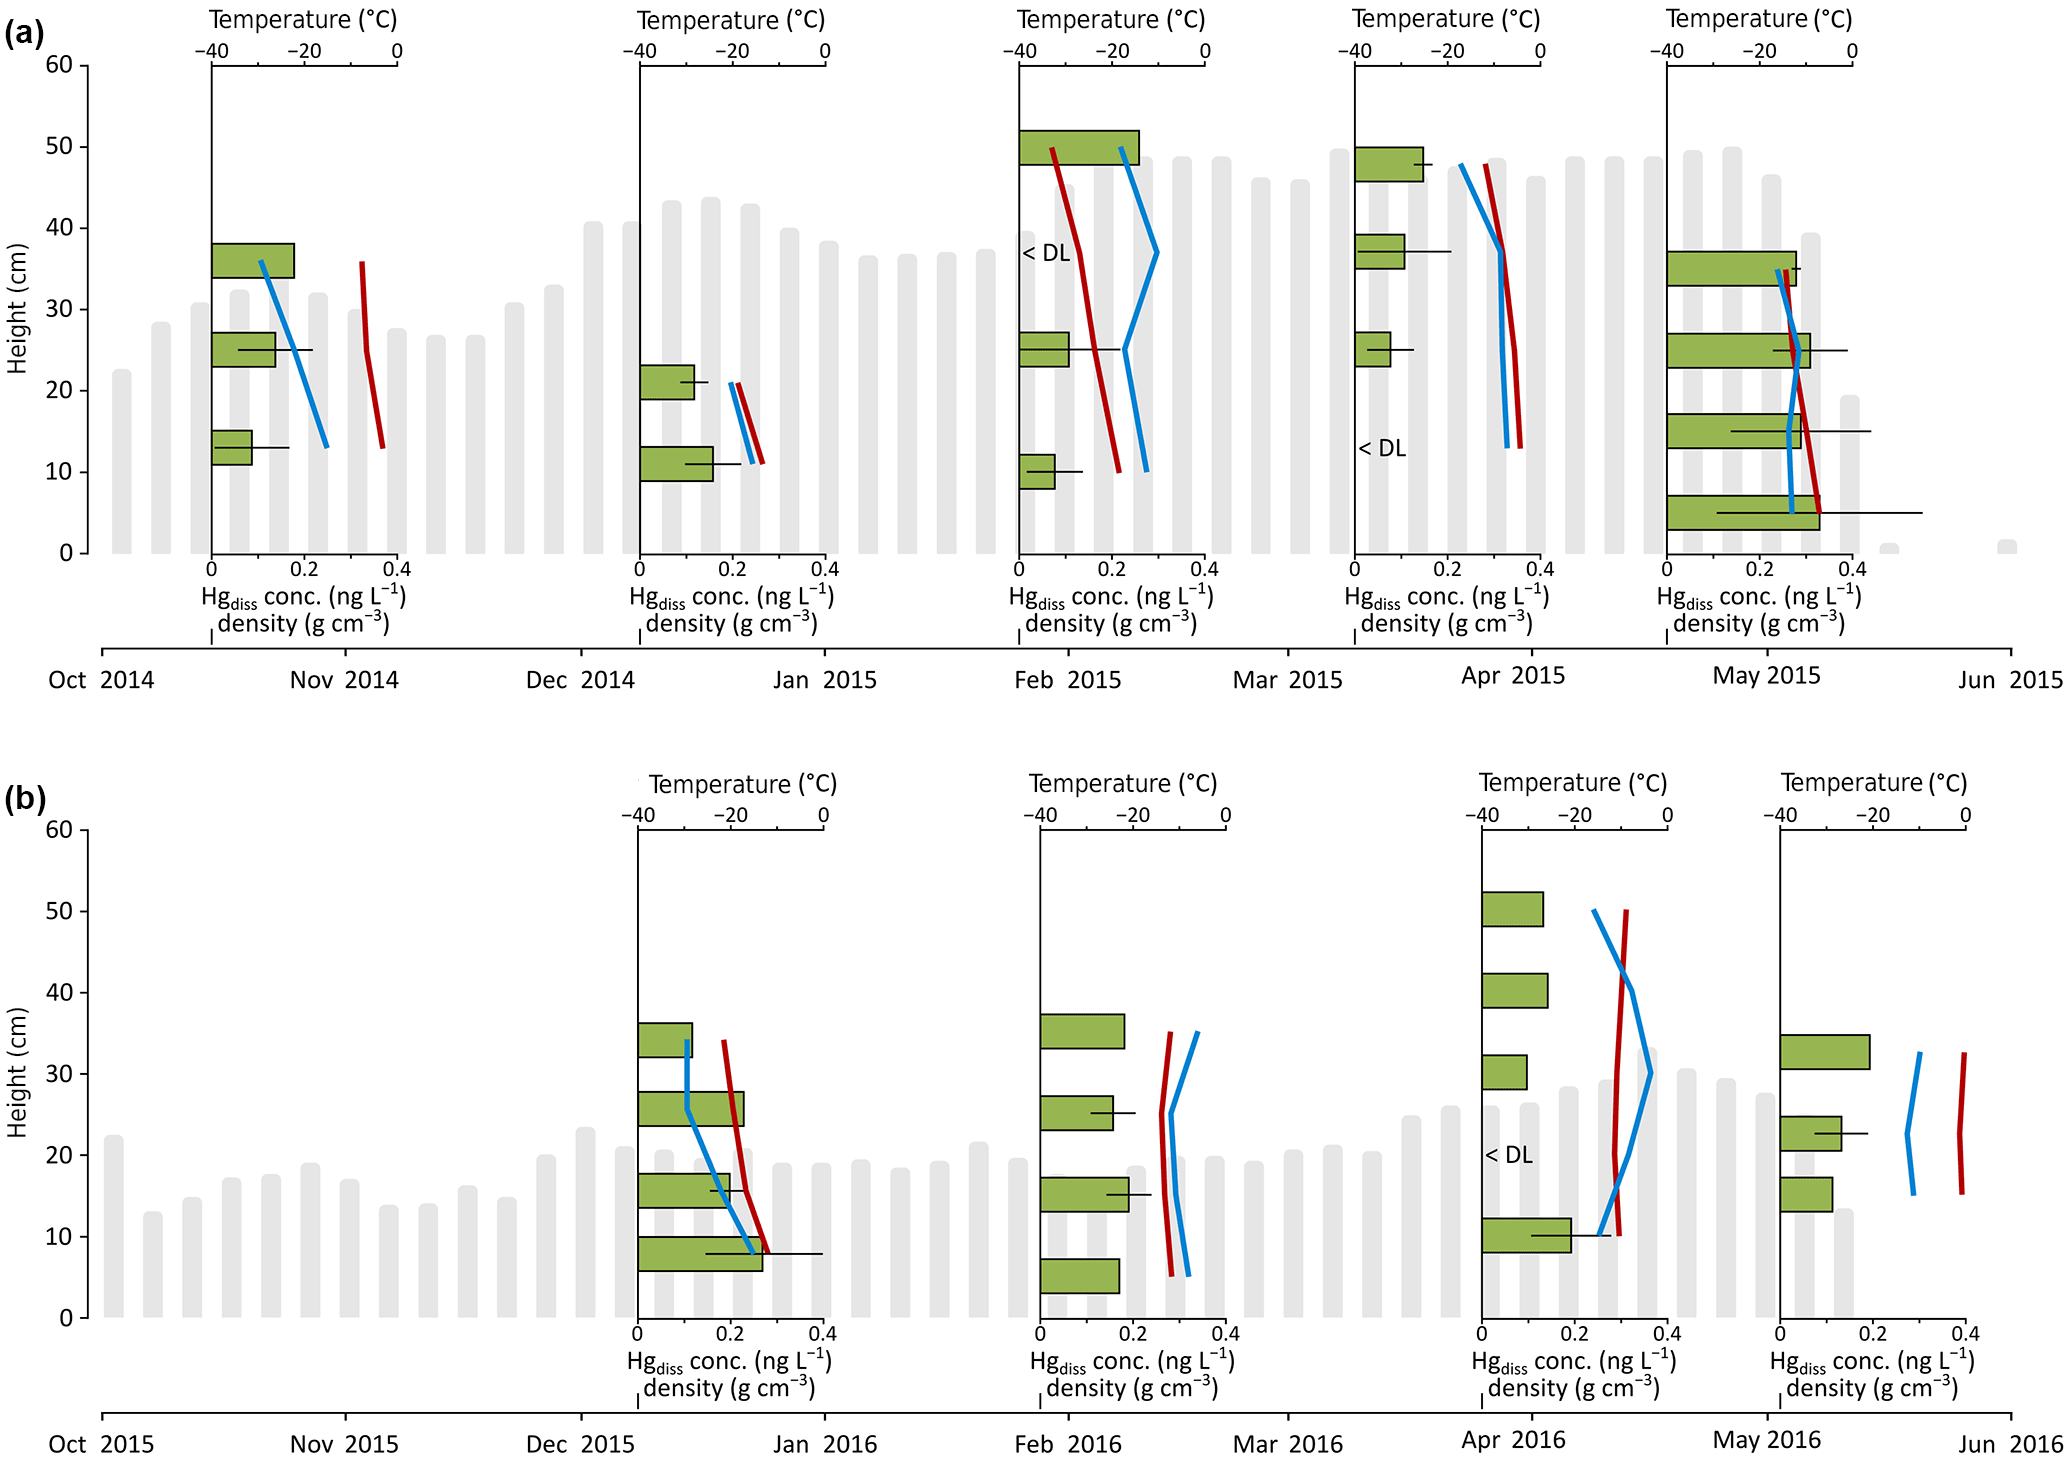
Figure 2Snowpack temperatures (red lines) and densities (blue lines) and dissolved Hg concentrations (green bars, including mean values and standard deviations) for five snow pits in the 2014–2015 season (a) and four snow pits in the 2015–2016 season (b) over the Arctic tundra at Toolik Field Station. The gray bars illustrate the average snow heights.
Stable isotopes of oxygen and hydrogen were also measured at CRREL Alaska using wavelength-scanned cavity ring-down spectroscopy on a Picarro L2120i (Sunnyvale, California). Standards and samples were injected into the analyzer for seven separate analyses. Results from the first four injections were not used to calculate the stable isotope values to eliminate internal system memory. The mean value from the final three sample injections was used to calculate the mean and standard deviation value for each sample. Values are reported in standard per mil notation. Repeated analyses of five internal laboratory standards representing a range of values spanning the samples analyzed and analyses of SMOW, GISP, and SLAP standards (International Atomic Energy Agency) were used to calibrate the analytical results. Based on thousands of these standards analyses and of sample duplicate analyses we estimate the precision is ±0.2 ‰ for δ18O and ±0.5 ‰ for δ2H.
2.4 Data processing and statistical analyses
We performed all data processing and statistical analyses with RStudio 1.1.383 (RStudio Inc., Boston, Massachusetts, USA) using R 3.4.2 (R Foundation for Statistical Computing, Vienna, Austria). Averaged data and variance in figures and tables are shown as mean ± standard deviation. Significant differences were determined with the Kruskal–Wallis test (α=0.05). We performed plots with ggplot2, ggtern, and lattice R packages and used normality (eq. L−1) for the ternary diagram. Geographical maps were prepared using Quantum GIS 2.18 (Quantum GIS Development Team, 2017).
3.1 Snowpack development and snowpack physics
Due to high wind conditions in the Arctic tundra (Cherry et al., 2014), the physical development of the snowpack and its depth and the thickness of wind slab layers at Toolik were subject to significant drifts and changes in snowpack height and were thus highly variable spatially and temporally throughout the winter season. The average snow height over the tundra site (shown in gray bars in Fig. 2) was continuously measured in both winters using a camera set to record daily pictures and using reference snow stakes placed in the snowpack. In the 2014–2015 season, the average snowpack height was 37 cm, with a standard deviation of 12 cm and a maximum depth of 60 cm. In the 2015–2016 season, the snowpack was almost half of that of the previous year, with an average snowpack height of 19 cm, a standard deviation of 7 cm, and a maximum depth of 35 cm.
Based on snow pit measurements in the 2014–2015 season, we observed an increase of snow density with time, from an average of 0.18 g cm−3 in October to 0.26 g cm−3 in March (blue lines in Fig. 2). No clear temporal pattern was observed in the 2015–2016 season when average snow density; it ranged between 0.28 and 0.30 g cm−3. Results showed similar temporal evolution as snow heights, with maximum SWE observed in March in both snow seasons of 158 and 116 mm, respectively.
Snowpack temperatures were highly variable throughout the seasons and also strongly differed vertically within the snowpack (red lines in Fig. 2). Temperatures ranged from −34 to 0 ∘C in the top of the snowpack and from −21 to −1 ∘C in the bottom of the snowpack; temperatures showed strong increases from the top to the bottom of the snowpack, illustrating the important insulating function that the snowpack has in the cold Arctic winter and spring months. Minimum snowpack temperatures were recorded during the 26 January 2015 sampling event when air temperatures were −40 ∘C.
The snowpack over the adjacent frozen lake showed an average density of 0.23 g cm−3 and temperatures ranged between −18 and 0 ∘C. The snow height over Toolik Lake was much lower than that over the tundra, with snow heights consistently < 15 cm for both seasons. The maximum SWE calculated above the lake was 40 and 42 mm for the two snow seasons, respectively.
The transect between Toolik and the Arctic Ocean performed in March 2016 showed snowpack height ranging between 30 and 66 cm. The maximum height was observed at one site located 55 km from the Arctic Ocean where presence of dense shrubs up to 40 cm height induced accumulation of local drifting snow due to high roughness. Snow density (between 0.19 and 0.26 g cm−3) and temperatures (between −20 and −10 ∘C) followed the same trends as observed at Toolik with decreasing density and increasing temperatures with snowpack thickness. The calculated SWE averaged 104 mm and ranged between 70 and 164 mm.
3.2 Gaseous Hg0 in the atmosphere–snowpack–soil continuum
3.2.1 Gaseous Hg0 concentration profiles
Gaseous Hg0 concentrations were measured at Toolik over 2 years in the atmosphere, in snowpack interstitial air at up to five inlet heights, and in soil pore air in the tundra ecosystem. Data coverage was 183 and 207 days for the 2014–2015 and 2015–2016 seasons, respectively, with only a few periods when system failures resulted in lack of data. A continuous temporal record of the concentration profile in the snowpack is presented in Fig. 3a for the 2014–2015 season, i.e., when the snowpack was deeper compared to the 2015–2016 season, and compared to a similar record from a temperate snowpack based on published data (Fig. 3b; Faïn et al., 2013; note different y axis of figure panels). In addition, full time-averaged atmosphere–snowpack–soil diffusion profiles are shown for the entire two winter seasons: 2014–2015 (Fig. 4a–c) and 2015–2016 (Fig. 4d–f). Gaseous Hg0 concentrations were averaged for each season for three different periods, i.e., November to December (representing early winter and full darkness), January to February (representing mid-winter and full darkness), and March to April (when sunlight emerged and when occasional AMDEs were active). Note that standard deviations indicate natural fluctuations in concentrations as observed in Obrist et al. (2017).
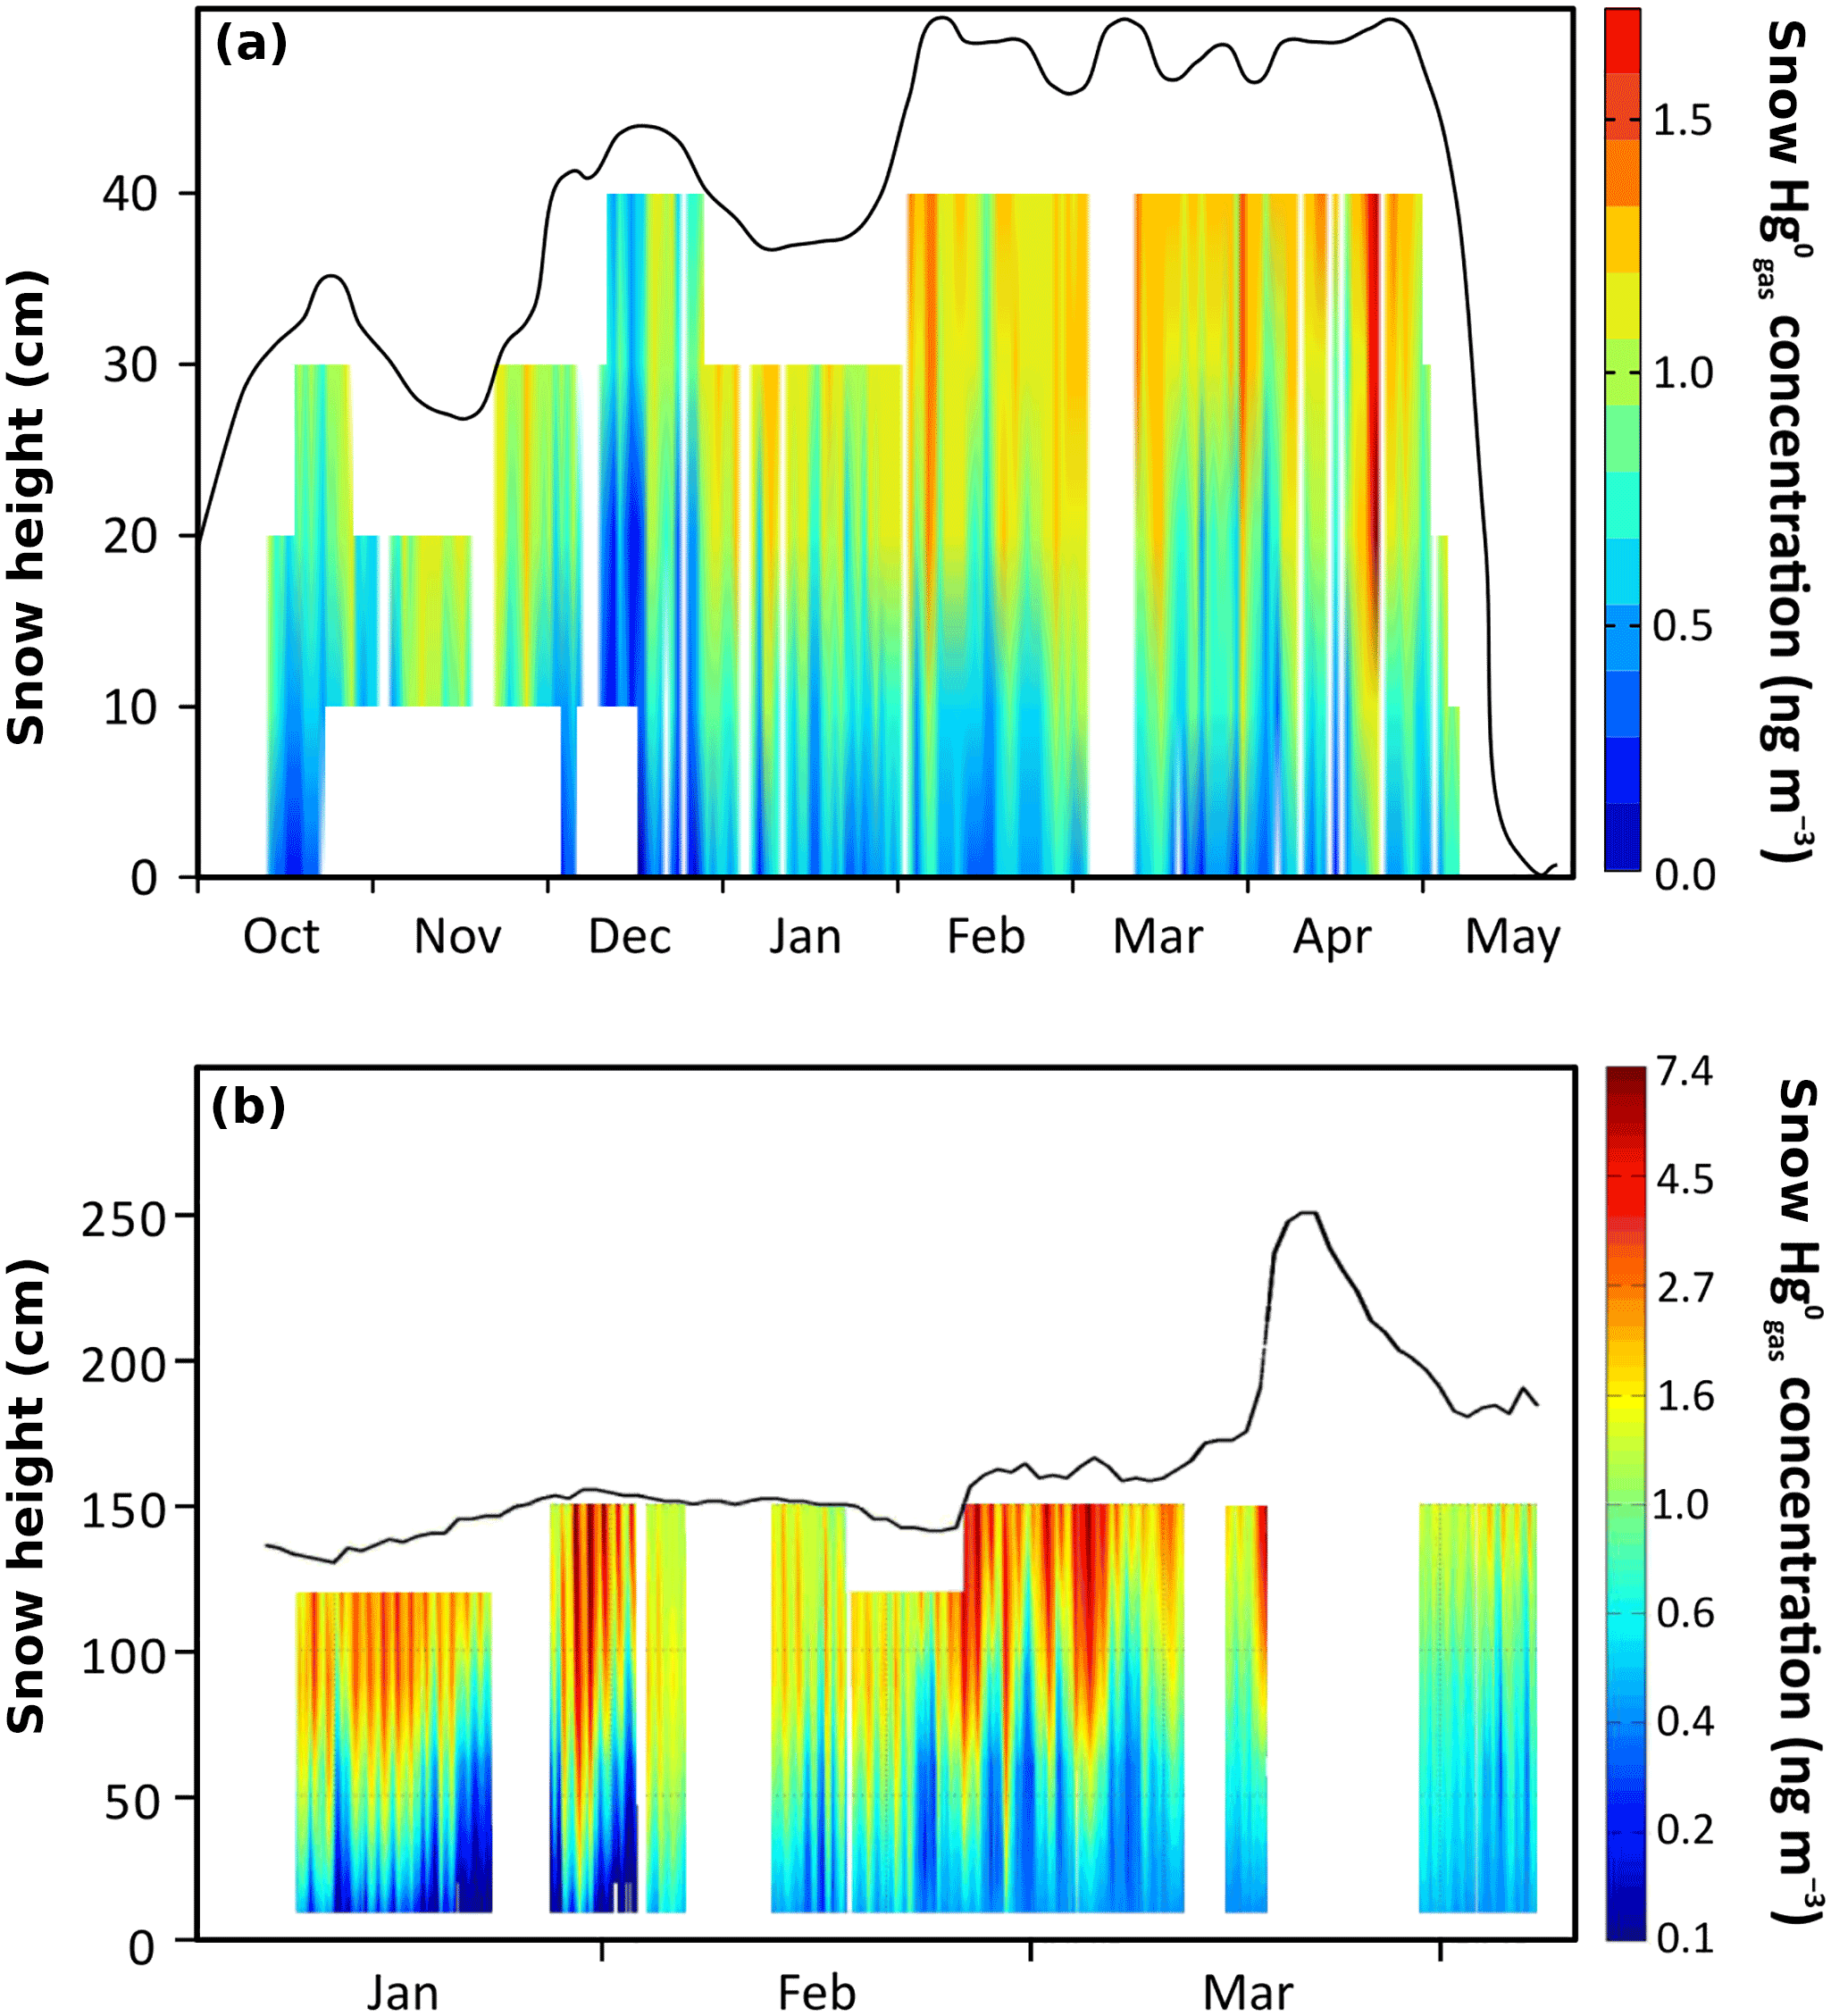
Figure 3Gaseous Hg0 concentration profiles in snowpack interstitial air during the snow-covered season from October 2014 to May 2015 over the Arctic tundra measured at Toolik Field Station based on continuous observations at up to five heights in the snowpack each hour, and interpolation of these data across the entire snowpack (a). Missing data in the lower snowpack in 2014 were due to line freezing of the lowest inlet. For comparison, interpolated concentration profiles in snowpack interstitial air during the snow-covered season based on similar measurements at Niwot Ridge, Rocky Mountains, Colorado, USA, during the winter of 2009 (b) (adapted with permission; Faïn et al., 2013).

Figure 4 concentration profiles in the atmosphere, snowpack interstitial air, and soil interstitial air in early winter (from November to December; a and d), in winter (from January to February; b and e), and in early spring (from March to April; c and f) for 2014–2015 (a–c) and 2015–2016 (d–f) snow-covered periods over the Arctic tundra measured at Toolik Field Station.
The measurements consistently showed strong concentration gradients in the atmosphere–snowpack–soil continuum with highest concentrations in the atmosphere (on average, 1.18 ± 0.13 and 1.09 ± 0.13 ng m−3, respectively) and lowest concentrations in soils (often below DL of 0.10 ng m−3). This pattern was consistent over two independent soil profiles measured at this site, one mainly consisting of organic soils and one soil profile dominated by mineral soil horizons. concentrations in the snowpack were between concentration in the atmosphere and in soils and showed pronounced patterns of decreasing concentrations from the top to the bottom of the snow profile. In the first year, concentrations decreased from the top snowpack inlet (i.e., 40 cm above the ground; average concentration of 1.18 ng m−3) to the lower snowpack sampling heights (30, 20, and 10 cm above the ground; average concentrations of 1.11, 1.00, and 0.76 ng m−3, respectively) and showed the lowest concentrations at the soil–snowpack interface (0 cm: 0.53 ng m−3). Due to a much shallower snowpack in the 2015–2016 season and an absence of measurements at 0 cm height due to line freezing of the lowest inlet, the profile of was less pronounced compared to 2014–2015. However, we similarly found a decline from upper to lower snowpack heights (e.g., concentrations of 1.09 ng m−3 in the atmosphere, 1.02 ng m−3 at 20 cm, and 0.88 ng m−3 at 10 cm height above ground). In a previous paper, we reported a small rate of continuous deposition from the atmosphere to the tundra – measured by a micrometeorological tower – during much of the snow-covered season, with the exception of short time periods in spring when AMDEs occurred at Toolik (Obrist et al., 2017). Here, we show that these flux measurements are supported by consistent concentration gradients that existed through both seasons and that showed that snowpack concentrations were consistently lower than atmospheric levels above. In addition, snowpack declined with depth in the snowpack and were lowest in the underlying soil, showing evidence of a consistent concentration gradient from the atmosphere to surface snow to tundra soils.
The top of the snowpack (ranging between 2 and 12 cm depth below the atmosphere depending on snow depth) generally showed highest concentrations close to concentrations measured in the atmosphere. This pattern is inconsistent with other Arctic snowpack measurements that showed snowpack concentrations higher than those in the atmosphere (Steffen et al., 2014). Indeed, the uppermost snowpack concentrations can reach 3 times the atmospheric levels in the interior Antarctic regions (Angot et al., 2016b). It also differed to patterns observed in lower-latitude snowpacks: in the Rocky Mountains, for example, the upper snowpack showed strong enrichments of throughout most of the winter (i.e., up to 6 times higher concentrations than in the atmosphere; Fig. 3b, Faïn et al., 2013). Such concentration enrichments were attributed to strong photochemically initiated reduction of snow-bound HgII to (Lalonde et al., 2002). The implications of production is that subsequent volatilization of the from the porous snowpack to the atmosphere can alleviate atmospheric deposition loads, and it is estimated that globally 50 % of snow-bound Hg is volatilized back to the atmosphere prior to snowmelt (Corbitt et al., 2011). Our trace gas concentration measurements showed that re-volatilization does not occur in this interior tundra snowpack during most of the winter. An absence of direct solar radiation likely explains the lack of photochemical formation and volatilization between December and mid-January. However, springtime is a photochemically active period in the Arctic when strong volatilization from snow has been reported further north along the Arctic Ocean coast (Brooks et al., 2006; Kirk et al., 2006). Even in late spring, however, when abundant solar radiation is present (400–600 W m−2), volatilization losses were rare and largely limited to periods of active AMDEs. We speculate that a reason for the general lack of formation and volatilization in snow is substrate limitation due to low snow Hgtot concentrations (Fig. 2). An alternative possibility may be that our sampling setup (between 5 and 7 cm below the surface during the three main AMDEs) may have limited our ability to detect and observe photo-reduction processes that may occur only in the upper few centimeters of the snowpack surface (King and Simpson, 2001; Poulain et al., 2004). However, using the same measurement system, concentration enhancements in temperate snowpacks were large (up to 8 ng m−3) and detectable up to a depth of > 90 cm from the snowpack surface (Fig. 3b). Unlike in Faïn et al. (2013), we did not observe formation after fresh snowfall, although it also is important to note that snowfall amounts at Toolik were much lower than in temperate snowpack (Cherry et al., 2014).
During March and April, snowpack concentrations were highly variable (Fig. 4c and f) following concentration changes in the atmosphere above, indicating an apparently high snowpack diffusivity (Fig. S2). During these time periods, snowpack concentrations in the top of the snowpack at times exceeded concentrations in the atmosphere above (less than 5 % of the time), and these occurrences were mainly related to periods of AMDEs when depletion occurred in the overlying atmosphere. Our measurements of showed that early spring was the only time period when we observed small rates of formation in the uppermost snowpack layer, suggesting some photochemical reduction and re-volatilization of after AMDE-Hg deposition. However, production was small, limited in time, and no photochemical production or re-emission was observed in deeper snow layers, suggesting that the process was limited to the snowpack surface. These patterns in March and April were also consistent with flux measurements when we observed periods of net emission from the tundra ecosystem to the atmosphere (Obrist et al., 2017), in support of the typical Hg dynamics often reported during AMDEs (HgII deposition followed by photochemical reduction and re-emission; Ferrari et al., 2005). We propose that, in addition to relatively infrequent and generally weaker AMDE activity, rapid photochemical re-emission losses of Hg following AMDEs render these events relatively unimportant as a deposition source of Hg in this interior Arctic tundra site. We provided support for this notion using stable Hg isotope analysis in soils from this site in Obrist et al. (2017), which showed that atmospheric is the dominant Hg source to the interior tundra snowpack, accounting for over 70 % of Hg present.
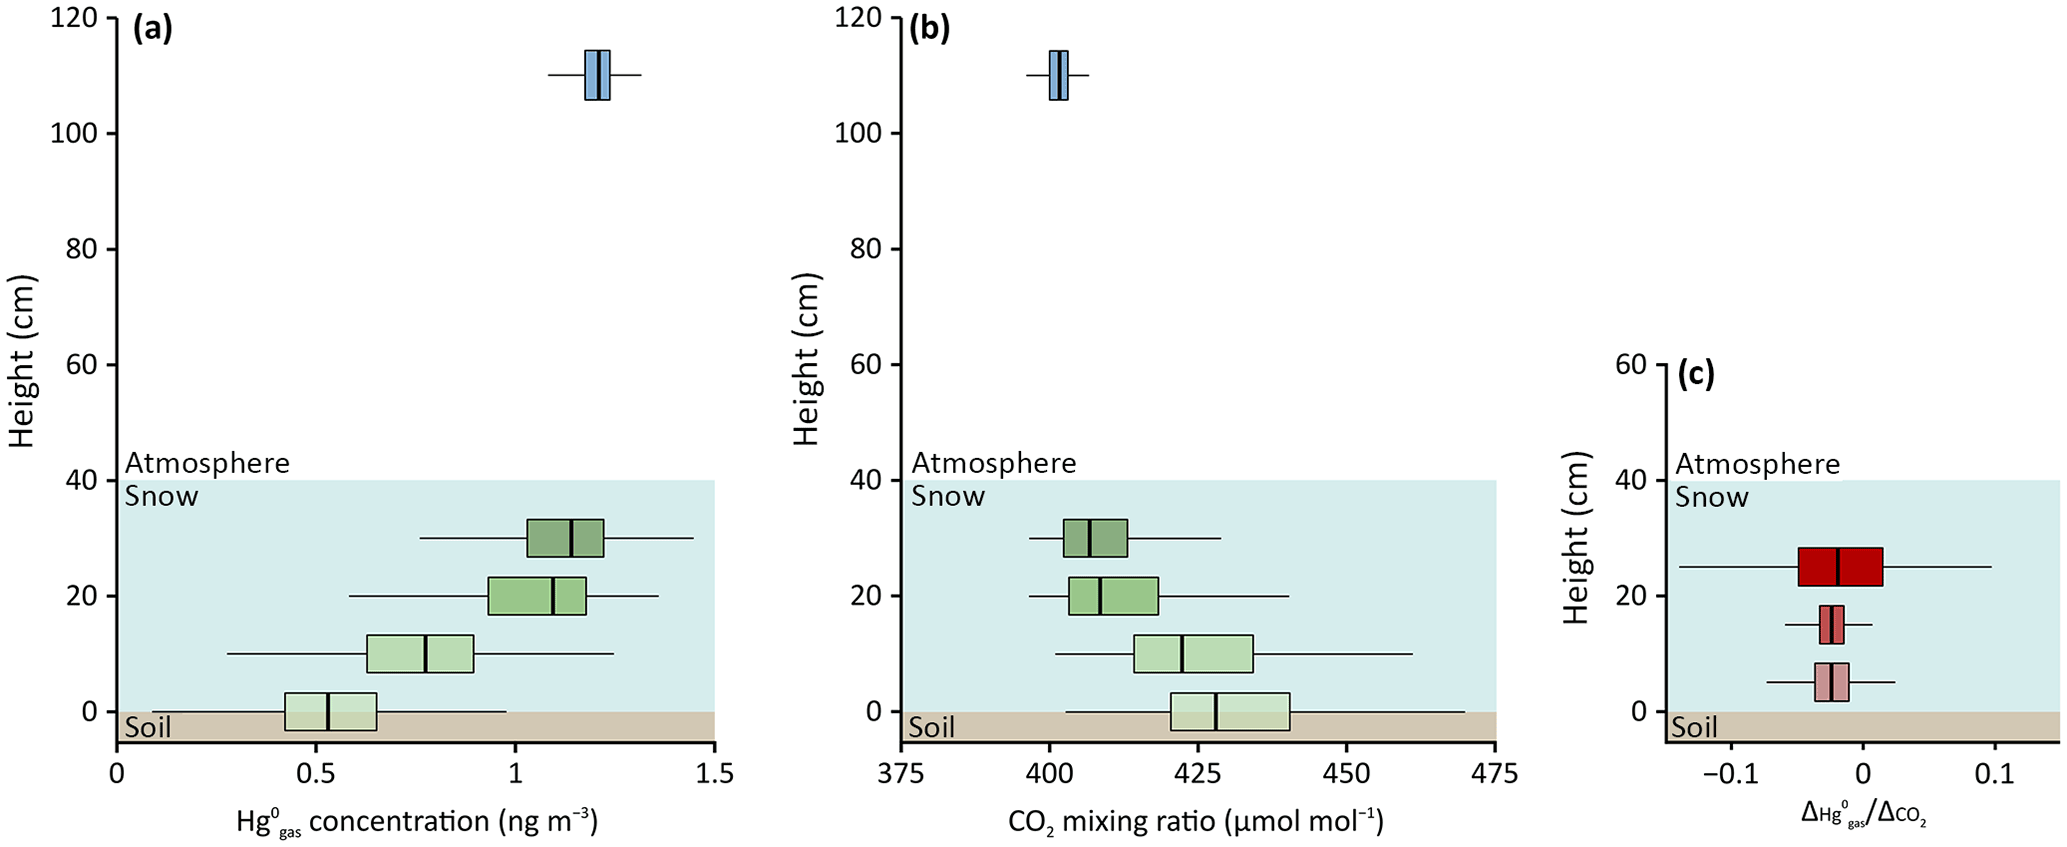
Figure 5Snow concentration profiles for (a) and CO2 (b) concentrations and ratios for 0–10, 10–20, and 20–30 cm snowpack height based on daily averages (c) in January 2015 (snow height averaged 40 cm) over the Arctic tundra measured at Toolik Field Station.
3.2.2 Snowpack diffusivity of trace gases
A key question pertaining to the wintertime snowpack concentration profiles and measured deposition is whether the observed deposition and concentration declines in the snowpack are driven by sinks in the snowpack or by uptake by underlying tundra soils. Sinks of in the snowpack have been suggested in a few studies (Dommergue et al., 2003; Faïn et al., 2008, 2013) and have been attributed to dark oxidation of to divalent, non-volatile HgII, possibly including oxidation by halogen species, O3, or related to NOx chemistry. To address this question, we compared the ratios of to CO2 gradients in the snowpack to determine commonality or differences between sinks and sources of both gases. Because CO2 in the atmosphere is relatively stable in winter and soils are the only wintertime source, CO2 can be used to assess how the snowpack affects diffusion and advective exchange processes between soils and the atmosphere. Comparing to CO2 allows assessment of whether concentrations in the snowpack are driven by processes in the underlying soils (i.e., similar to CO2) or whether in-snowpack chemistry affects concentration profiles. The gas diffusion model, based on Fick's first law of diffusion, is defined as follows:
where F is the molecular flux in the snowpack airspace (mol m−2 s−1), D is the diffusivity in the snowpack airspace (m2 s−1), and δC∕δz is the gas concentration gradient in the snowpack integrated in the snow depth (mol m−4).
Since diffusivity is determined by both snowpack porosity and tortuosity – both of which are poorly known and not directly measured – we used the flux ratios between and CO2 to determine whether both gases show similar flux behavior across the snowpack (Faïn et al., 2013):
where and are the δC∕δz gradients for both and CO2, respectively. Assuming similar gas diffusivity for both and CO2, the ratio of concentration gradients of the two gases ( gives direct information about their respective flux ratios between different snowpack trace gas inlets. Please note that these fluxes are in the opposite direction.
We focused our analysis of and CO2 concentration gradients at Toolik for the month of January 2015, when the snow height was among the highest (approximatively 40 cm) and when strong decreases in interstitial concentrations from the top to the bottom of the snowpack were present. At this time, soils still were a relatively active source of CO2 to the snowpack (Fig. 5), facilitating a comparison to the soil CO2 source. In contrast to (Fig. 5a), profiles for CO2 showed strong increases in concentrations with increasing depth in the snowpack (Fig. 5b). Highest CO2 concentrations were present in the soil (up to 5000 µmol mol−1, data not shown), and these patterns are consistent with an expected source of soils for CO2 and diffusive and advective mixing of CO2 produced in snow through the snowpack with the atmosphere (Liptzin et al., 2009; Oechel et al., 1997). Analysis of ratios showed no statistically significant differences from the top to the bottom of the snowpack, as evidenced from calculated gradients between 0 and 10 cm, 10 and 20 cm, and 20 and 30 cm heights (Fig. 5c).
The constant and negative ratios between CO2 and and the fact that CO2 is largely non-reactive in snowpack indicate that was also not subject to snowpack chemical reactions; both profiles are affected by underlying soil processes, i.e., soil sources for CO2 and soil sinks (for ). These wintertime atmosphere–snowpack–soil concentration profiles at Toolik were also consistent with a measured net deposition of throughout winter using flux measurements (Figs. 2 and 4; Obrist et al., 2017). Both net flux measurements, combined with snowpack concentration profiles, hence suggest that a soil sink was active throughout the Arctic winter, notably under very cold wintertime soil temperatures as low as −15 ∘C. Such soil sinks were previously reported to occur in temperate soils (Obrist et al., 2014), although the mechanisms for the sinks are currently not clear. It is notable that ratios in the upper snowpack (i.e., between 20 and 30 cm height) were more variable compared to lower snowpack heights, which we attribute to much smaller concentrations differences for both CO2 and between these inlets.
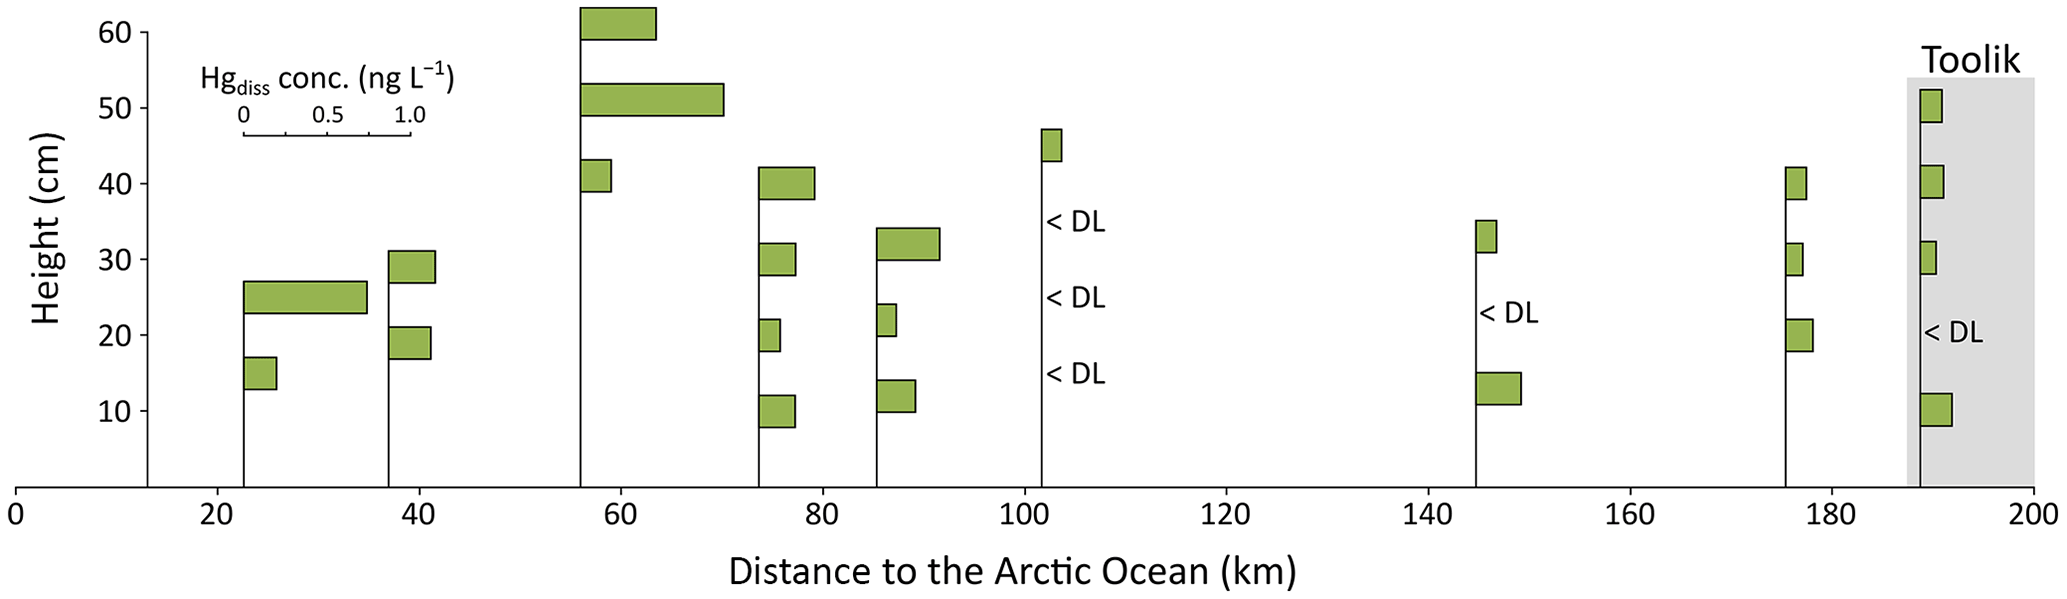
Figure 6Spatial pattern of dissolved Hg concentrations (Hgdiss) in snowpack profiles across the north slope transect on 27–28 March 2016, and comparison with Toolik Field Station (gray box) in 25 March 2016.
3.3 Snowbound mercury in the interior Arctic snowpack
3.3.1 Spatial patterns
Snow samples were analyzed at Toolik for Hgtot and Hgdiss (Fig. 2 and Table S1). Concentrations in snowpack samples over the tundra averaged 0.70 ± 0.98 ng L−1 for Hgtot concentrations and 0.17 ± 0.10 ng L−1 for Hgdiss concentrations (both seasons, average of entire snowpack height). Total Hg concentrations were always higher than Hgdiss levels, likely due to impurities and deposition of Hg associated with plant detritus or soil dust, and showed higher variability in Hgtot concentrations compared to Hgdiss. We thus focused our discussions on Hgdiss data. Measurements performed at Toolik, with Hgdiss concentrations averaging 0.17 ng L−1 and ranging between 0.08 and 1.15 ng L−1, showed very low levels compared to many other high-latitude studies. This is generally lower than Hg concentrations in interior Arctic sites reported by Douglas and Sturm (2004) (i.e., Hgdiss concentrations between 0.5 and 1.7 ng L−1) and at the low end of concentrations found in Arctic studies along the coastal zone (0.14–820 ng L−1, for both Hgdiss and Hgtot; Douglas et al., 2005; Douglas and Sturm, 2004; Ferrari et al., 2004, 2005; Kirk et al., 2006; Nerentorp Mastromonaco et al., 2016; St. Louis et al., 2005; Steffen et al., 2002). The low concentrations we measured result in very small pool sizes of Hgdiss stored in the snowpack during wintertime compared to temperate studies (Pearson et al., 2015). At Toolik, snowpack pool sizes amounted to 26.9 and 19.7 ng m−2 during peak snowpack and prior to the onset of snowmelt in 2014–2015 and 2015–2016, respectively.
The snowpack sampled over the adjacent frozen lake showed Hgtot and Hgdiss concentrations of 0.80 ± 0.61 and 0.15 ± 0.08 ng L−1, respectively (Table S1). These values were not statistically different from concentrations measured in the tundra snowpack. Snowpack Hgdiss loads on the frozen lake were lower (6.2 ± 0.2 ng m−2), i.e., only about one-quarter, compared to snowpack Hgdiss load on the adjacent tundra (23.3 ± 5.0 ng m−2). Three reasons may explain the large difference between lake and tundra snowpack Hg loads: (1) the lake did not accumulate the snowpack on open water prior to the lake surface freezing in the early fall (Sturm and Liston, 2003); (2) low surface roughness over the lake likely prevent settling of snowfall and facilitate remobilization of snow by wind transport (Essery et al., 1999; Essery and Pomeroy, 2004); and (3) the lake ice is warmer than the tundra soil resulting in higher sublimation over the lake. The implication of the latter process is a reduction of direct atmospheric deposition over Arctic lakes and is consistent with studies that estimated that annual Hg contribution to Arctic lakes via direct wet deposition is small, generally less than 20 % of total deposition (Fitzgerald et al., 2005, 2014). Spatial redistribution of snow across the tundra landscape further implies that both wet deposition and snow accumulation rates are variable, leading to spatial heterogeneity of snowmelt Hg inputs.
Most Arctic studies of snowpack Hg have been performed close to the coast (i.e., Alert and Barrow), and few studies include inland sites such as Toolik (Douglas and Sturm, 2004). In our study, measurements of Hgtot and Hgdiss in the snowpack across a large north slope transect (about 170 km from Toolik to the Arctic Coast) in March 2016 showed concentrations of 0.70 ± 0.79 and 0.24 ± 0.20 ng L−1, respectively (Fig. 6 and Table S3). Concentrations in Hgdiss of the five northernmost locations (< 100 km distance from the Arctic Ocean) were statistically significantly (p< 0.05, Kruskal–Wallis test) higher compared to those measured at the four stations located in the interior tundra (> 100 km), which included the Toolik site where mean Hgdiss concentrations were 0.33 ± 0.22 and 0.11 ± 0.07 ng L−1 for the same period, respectively. These patterns are consistent with previous observations in Alaska in springtime that suggested an ocean influence leading to higher Hg deposition, possibly linked to the presence of halogens (Douglas and Sturm, 2004; Landers et al., 1995; Snyder-Conn et al., 1997). We propose that low snowpack Hg concentrations (< 0.5 ng L−1 for Hgdiss) are common in inland northern Alaska areas and that the interior Arctic snowpacks exhibit lower levels compared to coastal locations that are subjected to more significant ocean influences and impacts by AMDEs.
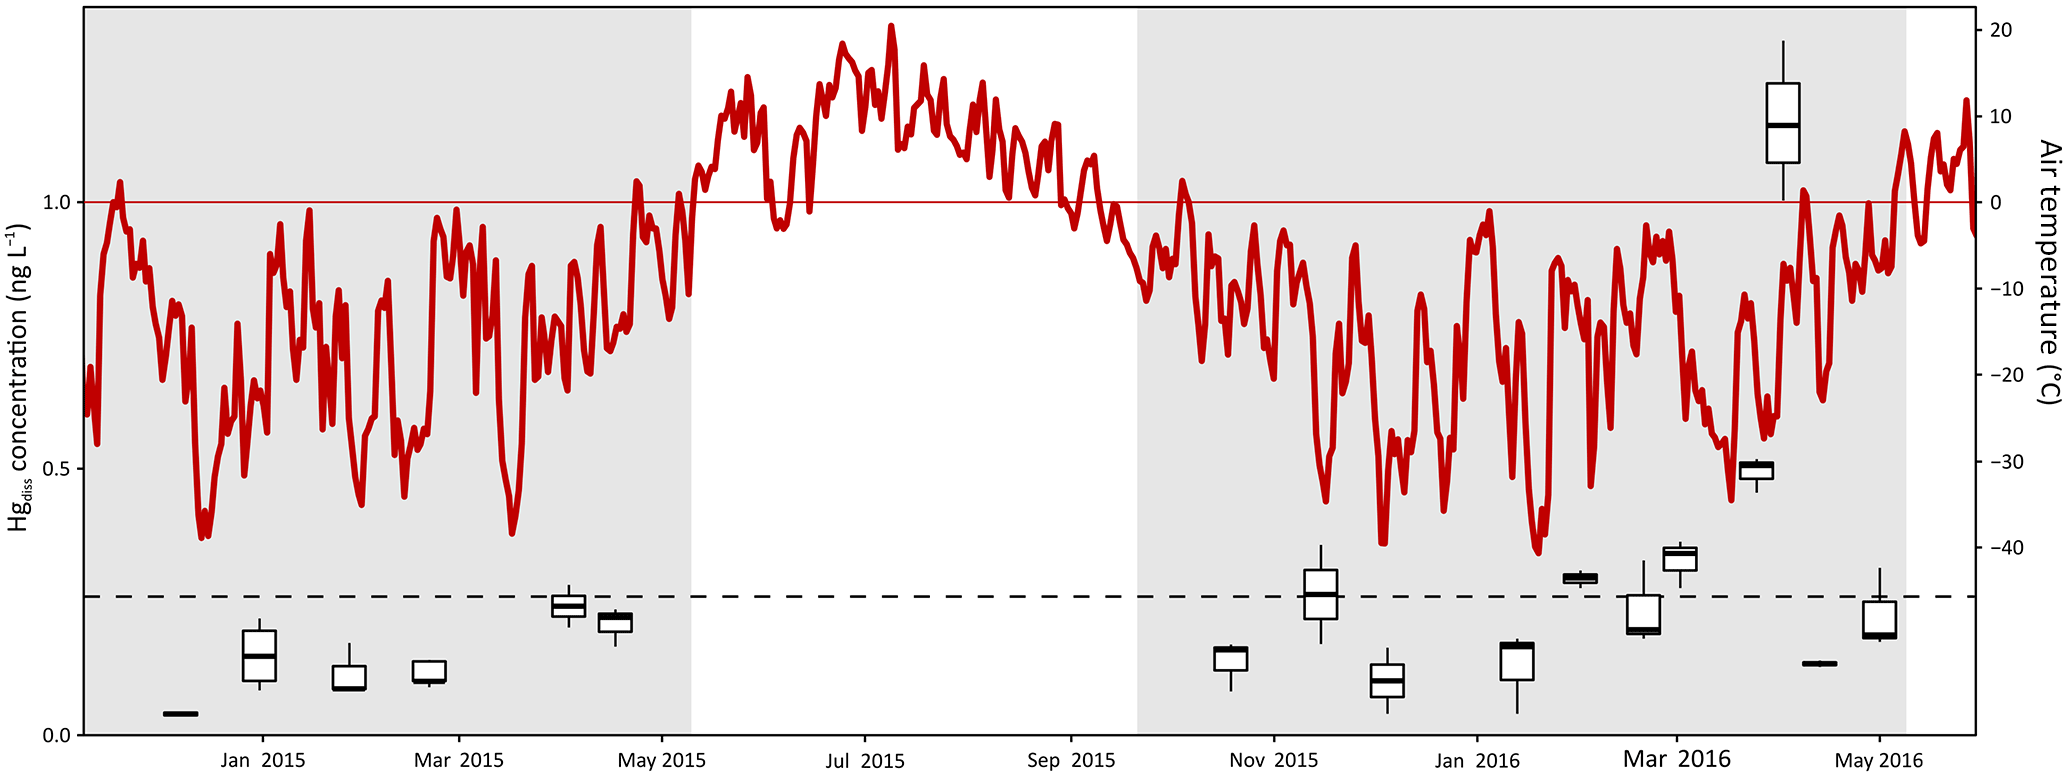
Figure 7Temporal pattern of dissolved Hg (Hgdiss) concentrations in surface snow samples (top 3 cm) throughout the 2014–2015 and 2015–2016 snow-covered seasons (in gray) at Toolik Field Station. The broken line indicates the average surface snow Hgdiss concentration (0.26 ng L−1). The red line indicates the daily average air temperature.
3.3.2 Seasonal patterns
Surface snow that was collected throughout the season can serve as an estimate for atmospheric wet deposition Hg concentrations and loads (Faïn et al., 2011). Concentrations of Hgtot and Hgdiss in the surface snow layer (top 3 cm only) averaged 0.53 ± 0.39 and 0.26 ± 0.26 ng L−1, respectively (Fig. 7 and Table S1), and were not statistically significantly different compared to that of full snow pits or bottom snow layers. Both low concentrations measured in surface snow and low pool sizes as discussed above suggest low wet deposition rates during winter at our inland Arctic sites. However, estimation of deposition loads using snow collection can be compromised by quick re-volatilization losses of Hg from fresh snowfall (within the first few hours; e.g., Faïn et al., 2013) or snowmelt losses, but we do not consider these processes to be important at this site. The low Hgdiss concentrations measured in surface snow (0.26 ± 0.26 ng L−1) are lower than the 10th percentile of wet deposition Hg concentrations reported for Kodiak Island in Alaska during the same time period (National Atmospheric Deposition Program, 2017). Also, snowfall Hgdiss concentrations measured at Alert were between 100 and 200 times higher than in our measurements (Alexandra Steffen, personal communication, 2017). Using median concentrations in the surface snow multiplied by the amount of wet deposition for each snow-covered season, we estimated the Hgdiss load annually deposited by snowfall to 41.3 and 15.3 ng m−2 in the 2014–2015 and 2015–2016 winters, respectively. This is 1∕100 of values recently provided from a coastal location 400 km northwest of our study site (Douglas et al., 2017) and 1∕200 of long-term measurements from Alert between 1998 and 2010 (Alexandra Steffen, personal communication, 2017).
Little temporal variation in snowpack Hg concentrations was observed between the early season snowpack evolving mainly under darkness and the late season snowpack exposed to solar radiation (Figs. 2 and 6), although some temporal differences were evident during March and April when AMDEs were present in the region. Snowpack Hgdiss concentrations averaged 0.16 ng L−1 both during the completely dark period (i.e., December and January) and after 1 March. Such patterns support measurements of throughout the winter that indicated the snowpack to be a relatively inert matrix with few redox processes affecting Hg concentrations (oxidation of or reduction of HgII). An apparent trend in surface snow, however, emerged during springtime, when both Hgtot and Hgdiss concentrations exceeded 1 ng L−1 (i.e., 4 times the average values observed through the rest of the season; Fig. 7). This was a period when AMDEs occurred at this site, as evident by depletions of atmospheric with formation and deposition of oxidized atmospheric HgII (Obrist et al., 2017; Van Dam et al., 2013). Surface snow Hg concentration enhancements during AMDEs are commonly reported in polar regions, with at times Hg concentration enhancements up to 100 times the base concentration in the Arctic (Lalonde et al., 2002; Lindberg et al., 1998; Poulain et al., 2004; Steffen et al., 2002). The presence of AMDEs generally results in increased deposition of Hg to snow and ice surfaces, yet such additional deposition often is short-lived due to the photochemical re-emission of (Kirk et al., 2006). In our study, we did not have sufficient temporal resolution of snow sampling during the period of AMDEs to closely track the fate of Hg deposition during AMDEs and subsequent re-emissions. However, we find that snow Hg enhancements during AMDEs were much lower than at coastal sites (e.g., Steffen et al., 2014), but a coarse temporal sampling could just have missed peak snow Hg levels at this site. We also found that after AMDEs, snow Hgdiss in surface snow declined to levels as was observed prior to AMDEs, and no concentration enhancements were observed deeper in the snowpack. This is consistent with observations of net volatilization during that time. The fact that we found no lasting impact of AMDEs on snow Hg concentrations, which also were supported by stable Hg isotope analysis (Obrist et al., 2017), may be due to the large distance to the coast from our study site and the scarcity of AMDEs – and O3 depletion events – that occur at this inland Arctic location (Van Dam et al., 2013).
Table 1Mean concentration (µg L−1), including standard deviation (italics), of cations and anions in tundra and lake snowpack and in surface snow at Toolik Field Station.
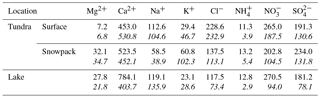
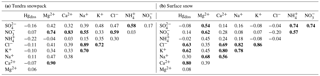
Table 2Spearman's coefficient correlations (ρ, in bold if ≥ 0.5 or ≤ −0.5) between chemical elements (dissolved Hg [Hgdiss] and major ions) in the tundra snowpack (a) and surface snow over the tundra (b).
Concentrations of Hgdiss measured in the snowpacks at Toolik did not show consistent vertical patterns (Fig. 2). Indeed, the upper snowpack Hgdiss concentrations were not significantly different from those in the deeper layers, which is in contrast to patterns observed in Arctic snowpacks (Ferrari et al., 2004), as well as in Alpine ones (Faïn et al., 2011), where strong concentration enhancements (i.e., more than 2 times the average snowpack concentrations) were observed in the top 3 cm of the snowpack. Seasonal measurements at Toolik indicate a generic lack of atmospheric gaseous HgII during most of the year and very low amounts of total HgII deposition, i.e., wet, aerosols, plus gaseous HgII (Obrist et al., 2017). The lack of significant HgII dry deposition would prevent a Hg enhancement in surface snow and also is consistent with the low pool sizes of Hg in this tundra snowpack. Further support of this notion that snow collected at the surface throughout the Arctic winter and spring was not statistically different from snow Hg concentrations contained in the entire snowpack (0.26 ± 0.26 vs. 0.17 ± 0.10 ng L−1, respectively). Another factor to explain a lack of depth gradients in snow Hg concentrations may be that snow layers can be continuously mixed and redistributed by wind gust (e.g., wind speed of Toolik were > 5 m s−1 12 % of the time) across the landscape in the Arctic (Cherry et al., 2014).
3.4 Origin of mercury in the interior Arctic snowpack
3.4.1 Cation and anion concentrations
Major cations (Ca2+, K+, Mg2+, Na+, and ) and anions (Cl−, , and ) were measured in snowpack and surface snow samples at Toolik to assess the chemical composition and potential origins for Hg in the snowpack (Table 1). Concentrations of these compounds were comparable to other inland Alaskan sites and, similar to concentrations of Hg, were lower than data reported from several Arctic coastal locations (de Caritat et al., 2005; Douglas and Sturm, 2004). Surface snow samples (top 3 cm) generally showed somewhat higher Cl− and Na+ concentrations and lower Mg2+ and K+ concentrations than samples collected across the entire snowpack height, although only Mg2+ and Na+ were significantly different (p< 0.005 and p< 0.05, respectively). Comparison between tundra and lake snowpack locations showed no statistical differences in elemental concentrations.
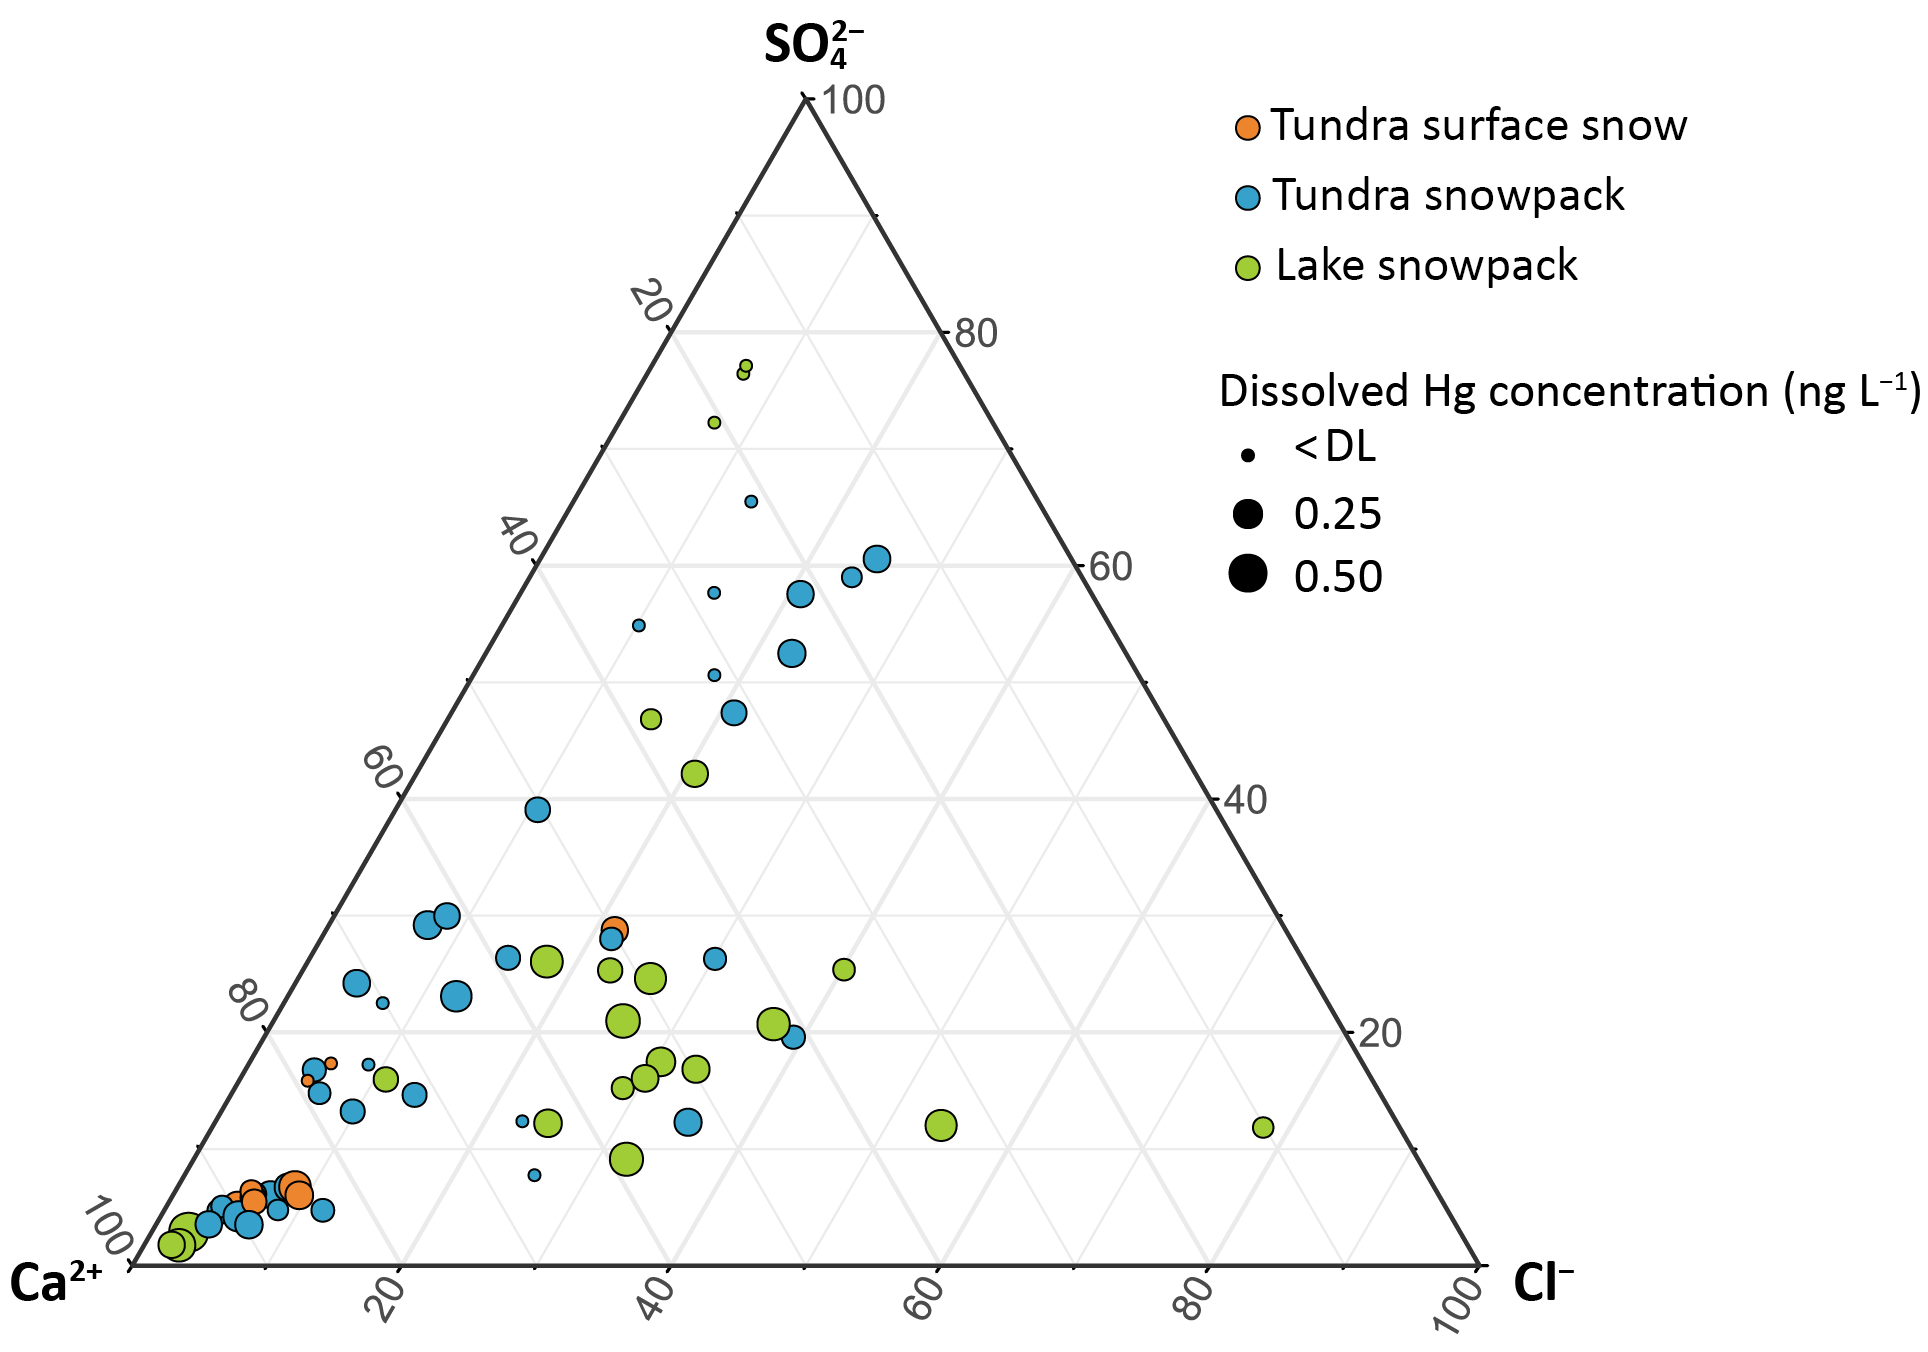
Figure 8Ternary diagram of tundra surface snow (orange), tundra snowpack (blue), and lake snowpack (green) samples from Toolik Field Station ordered by dissolved Hg concentration between Ca2+, Cl−, and (proportions based on meq L−1).
Spearman correlation coefficient (ρ) between Hgdiss and major ion concentrations were calculated for tundra and lake snowpack samples and surface snow collected over the tundra (Table 2). Using a correlation matrix, three groups of correlated major ions could be determined in the snowpack over the tundra: (1) and ; (2) Ca2+, Mg2+, and ; (3) Cl−, K+, and Na+. In the tundra snowpack, Hgdiss was not statistically significantly (−0.22 < ρ < 0.11) correlated to any of these major ion groups when considering the entire depth of the tundra snowpack. Relationships, however, were present in surface snow over the tundra where Hgdiss was correlated (ρ up to 0.80) with Ca2+, Cl−, and K+, indicating that Hgdiss may have originated from a mix of natural sources possibly linked to both mineral dust (Ca2+) and sea spray (Cl−). The lack of strong correlation between Hgdiss and Na+ (ρ=0.30) in surface snow samples may indicate that a part of Cl− originated from mineral dust as CaCl2. A minor influence of sea salt was consistent with coastal observations that showed the highest Hg concentrations close to the Arctic Ocean related particularly to active bromine chemistry (Fig. 6; Douglas and Sturm, 2004). In addition, local or regional dust from rock and soil weathering contributed to the wintertime Hg deposition, particularly at interior sites close to the Brooks Range where higher snow pH reported were from mineral dust that contained carbonates (Douglas and Sturm, 2004). Indeed, the mountain influence was dominant during the two snow-covered seasons at Toolik where 50 % of snow events and 80 % of dry periods (i.e., periods without snowfall, 90 % of the time) came from the south (i.e., Brooks Range). An additional group of correlated elements was identified in surface snow samples over the tundra: , , and . Note that the low number of lake snowpack samples (≤ 12) did not allow us to perform a meaningful correlation matrix analyses for lake snowpack samples.
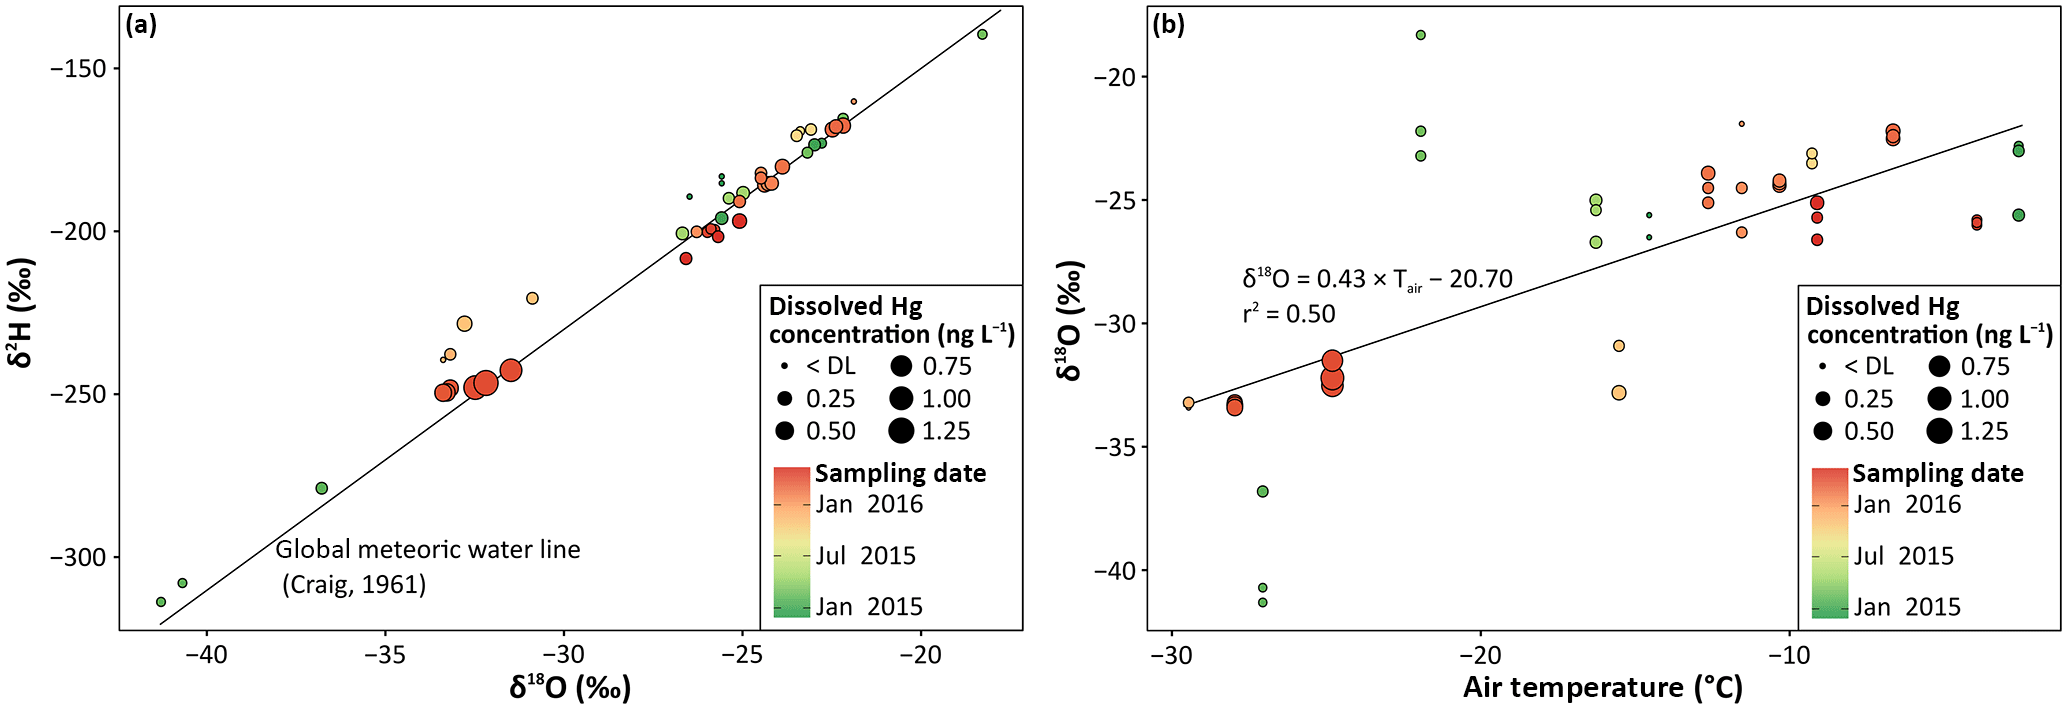
Figure 9Dissolved Hg concentrations in surface snow samples for 2014 to 2016 in: (a) the δ2H vs. δ18O diagram and (b) a plot of δ18O vs. air temperature (Tair) during the previous snowfall at Toolik Field Station.
To further visualize the relationships between analytes, we plotted a ternary diagram using three endmembers according to Garbarino et al. (2002), Krnavek et al. (2012), Poulain et al. (2004), and Toom-Sauntry and Barrie (2002) (Fig. 8). We considered Ca2+ as one endmember to represent a potential crustal signature, a second endmember with Cl− as a sea salt signature, and a third endmember with as a potential anthropogenic signature, i.e., from regional or long-range transport. Since sea salt represented on average less than 1.2 % of total according to the calculation of Norman et al. (1999), we consider not indicative of a marine source. The different snow types (surface snow over the tundra, tundra snowpack, and lake snowpack) are presented with different colors in Fig. 8, and Hgdiss concentrations are represented by different symbol sizes. Relative concentrations of Cl− (i.e., sea salt influence) showed statistically significant differences between snow samples collected over the tundra and those collected over the frozen lake (on average, 14 and 24 % of proportion based on normality data, respectively; p< 0.05). However, no statistically significant differences were observed for relative concentrations of Ca2+ and between tundra and lake locations. In general, snow surface samples showed low and Cl− relative concentrations (< 30 %) compared to integrated snowpack samples. Overall, Hgdiss concentrations were weakly correlated, except according to the relative concentrations: Hgdiss concentrations averaged 0.10 and 0.17 ng L−1 for > 30 and < 30 % of , respectively (p< 0.005). These patterns indicate that anthropogenic influences from combustion processes were minor or absent for snow Hg deposition. In fact, Alaska generally showed the lowest concentrations among Arctic sites (de Caritat et al., 2005). Norman et al. (1999) also reported relatively small contributions of anthropogenic in snow at Alert (Canada). From this, we propose that the Hg sources in the Arctic snowpack are mainly derived from local lithological erosion and that Arctic Ocean sources are minor contributions. However, this is not likely the case of in tundra soils which mainly derived from global sources (Obrist et al., 2017). It should be noted that the proximity of Toolik to the Dalton Highway may influence our measurements, but this is difficult to evaluate.
The lack of consistent statistically significant associations between major ions and Hgdiss across the entire snowpack depth (Table 2a) further suggests that initial snowfall Hg content was maintained and largely unaltered after deposition, with no clear accumulation or depletion zones as found in other snowpacks (Ferrari et al., 2005; Poulain et al., 2004; Steffen et al., 2014). We found a small relative enrichment of alkaline earth elements in snowpack samples compared to surface snow, which indicates some additional contributions of local mineral dust, yet this did not result in a measurable increase in snowpack Hg levels. Hence, we suggest no significant additional deposition of Hg (e.g., by dry deposition of gaseous or particulate Hg) to exposed older snow consistent with the lack of correlation to pollution tracers ( and ). We also suggest an absence or minor importance of re-emission losses or elution losses from snowmelt as occurs in temperate snowpacks (discussed in Faïn et al., 2013, and Pearson et al., 2015). Elution losses are unlikely, given that no temperatures above freezing were present in the Arctic until May, and atmospheric re-emissions losses of volatile were not important in this Arctic snowpack for most of the season as discussed above.
3.4.2 Stable oxygen and hydrogen isotope signatures
Oxygen (18O) and hydrogen (2H) isotopes are frequently used as tracers for precipitation sources (Gat, 2010). The stable isotope signatures in surface snow samples collected at Toolik are presented in a δ2H vs. δ18O diagram for different ranges of Hgdiss concentrations and different sampling dates (Fig. 9a). All the samples were distributed close to the global meteoritic water line (Craig, 1961). Despite a large variability in values (from −41.3 to −18.3 ‰ for δ18O and from −314 to −140 ‰ for δ2H), samples collected on the same date were relatively close (mean standard deviation of 0.88 and 6.5 ‰, respectively). No clear relationships were observed between isotope signatures and Hgdiss concentrations (with size scale in Fig. 9) across the entire spectrum of values. However, samples with high Hgdiss concentrations (e.g., the three highest measured in 2 April 2016) and low Hgdiss concentrations (e.g., samples below the DL in 5 December 2015) were found clustered together at similar δ18O and δ2H values. The δ18O values were also plotted against air temperatures (Tair) during the snowfall events (Fig. 9b). A statistically significant linear relationship was found between the two variables (r2=0.50) with the lowest δ18O values being measured during the coldest temperatures. Neither the origin of precipitation as shown by the wide range of stable isotope ratios nor the physical conditions that often cause isotopic variation in precipitation (e.g., air temperatures that explain up to 50 % of isotopic values via mass effects; Siegenthaler and Oeschger, 1980) shaped the Hg concentrations measured in the snowpack.
In this study, we investigated snow Hg dynamics in the interior Arctic tundra at Toolik Field Station, Alaska, simultaneously analyzing Hg in (1) the gas phase () of the atmosphere, interstitial snowpack, and soil pores; and (2) the solid phase in snow (Hgtot and Hgdiss). Gaseous Hg0 in the atmosphere–snowpack–soil continuum showed consistent concentration patterns throughout most of the snow season with the Arctic tundra soil serving as a continuous sink for , important to consider in Arctic Hg cycling. To our surprise, photochemical formation of in the snowpack was largely absent and played a minor role in the interior tundra largely limited to periods of active AMDEs. These observations are in contrast with strong photochemical formation of in surface snow observed at temperate sites and along the Arctic coast, resulting in significant photochemical losses of from these snowpacks. This calls for a regional adjustment of photochemical losses from the snowpack in models, which should have different treatment for the Arctic snowpack compared to temperate snowpacks. Small Hgdiss enhancements were temporarily observed in surface snow during springtime, when AMDEs were present, reflecting the typical sequence of Hg deposition to the top snowpack followed by fast photochemical volatilization losses of during that time. At this interior Arctic site, however, AMDEs, resulted in negligible deposition loads. Low concentrations of both Hgtot and Hgdiss were measured in the snowpack across this northern Alaska region, resulting in a small reservoir of Hg stored in this snowpack available for potential mobilization during snowmelt (< 30 ng m−2 for Hgdiss). These low values suggest that wet Hg deposition via snow is not a major source of Hg to this interior Arctic site, a notion we previously supported by direct measurements and stable Hg isotopes that showed that two-thirds of the Hg source are derived from deposition. Multielement analysis of surface snow (top 3 cm) indicated that Arctic snowpack Hg originated from a mix of diffuse and likely natural sources, including local mineral dust (associated with Ca2+ and Mg2+) and, to a lesser extent, regional marine sea spray (associated with Cl− and Na+).
Snow chemistry data can be found in an Excel file in the Supplement.
The supplement related to this article is available online at: https://doi.org/10.5194/tc-12-1939-2018-supplement.
The authors declare that they have no conflict of interest.
We thank Toolik Field Station staff for their support in this project over
2 years, especially Jeb Timm, Joe Franish, and Faye Ethridge for helping
with snow collection. We also thank Martin Jiskra (Geosciences Environnement
Toulouse) and Christine Olson (DRI) for their field support, Christopher
Pearson, Olivia Dillon, and Jacob Hoberg (DRI) for their support with
laboratory analyses, and Dominique Colegrove and Tim Molnar (University of
Colorado) for helping with field work and data processing. We finally thank
Alexandra Steffen for providing mercury snow data from Alert. Funding was
provided by the US National Science Foundation (NSF) under award no. PLR
1304305 and cooperative agreement from National Aeronautics and Space
Administration (NASA EPSCoR NNX14AN24A).
Edited by: Becky Alexander
Reviewed by: two anonymous referees
Alaska Division of Oil and Gas: Regional geology of the north slope of Alaska, 1 ∕ 1 000 000, State of Alaska, Department of Natural Resources, Division of Oil and Gas, Anchorage, 2008.
Angot, H., Dastoor, A., De Simone, F., Gårdfeldt, K., Gencarelli, C. N., Hedgecock, I. M., Langer, S., Magand, O., Mastromonaco, M. N., Nordstrøm, C., Pfaffhuber, K. A., Pirrone, N., Ryjkov, A., Selin, N. E., Skov, H., Song, S., Sprovieri, F., Steffen, A., Toyota, K., Travnikov, O., Yang, X., and Dommergue, A.: Chemical cycling and deposition of atmospheric mercury in polar regions: review of recent measurements and comparison with models, Atmos. Chem. Phys., 16, 10735–10763, https://doi.org/10.5194/acp-16-10735-2016, 2016a.
Angot, H., Magand, O., Helmig, D., Ricaud, P., Quennehen, B., Gallée, H., Del Guasta, M., Sprovieri, F., Pirrone, N., Savarino, J., and Dommergue, A.: New insights into the atmospheric mercury cycling in central Antarctica and implications on a continental scale, Atmos. Chem. Phys., 16, 8249–8264, https://doi.org/10.5194/acp-16-8249-2016, 2016b.
Atwell, L., Hobson, K. A., and Welch, H. E.: Biomagnification and bioaccumulation of mercury in an arctic marine food web: insights from stable nitrogen isotope analysis, Can. J. Fish. Aquat. Sci., 55, 1114–1121, https://doi.org/10.1139/f98-001, 1998.
Barker, A. J., Douglas, T. A., Jacobson, A. D., McClelland, J. W., Ilgen, A. G., Khosh, M. S., Lehn, G. O., and Trainor, T. P.: Late season mobilization of trace metals in two small Alaskan arctic watersheds as a proxy for landscape scale permafrost active layer dynamics, Chem. Geol., 381, 180–193, https://doi.org/10.1016/j.chemgeo.2014.05.012, 2014.
Bergin, M. H., Jaffrezo, J.-L., Davidson, C. I., Dibb, J. E., Pandis, S. N., Hillamo, R., Maenhaut, W., Kuhns, H. D., and Makela, T.: The contributions of snow, fog, and dry deposition to the summer flux of anions and cations at Summit, Greenland, J. Geophys. Res.-Atmos., 100, 16275–16288, https://doi.org/10.1029/95JD01267, 1995.
Brooks, S., Lindberg, S., Southworth, G., and Arimoto, R.: Springtime atmospheric mercury speciation in the McMurdo, Antarctica coastal region, Atmos. Environ., 42, 2885–2893, https://doi.org/10.1016/j.atmosenv.2007.06.038, 2008.
Brooks, S. B., Saiz-Lopez, A., Skov, H., Lindberg, S. E., Plane, J. M. C., and Goodsite, M. E.: The mass balance of mercury in the springtime arctic environment, Geophys. Res. Lett., 33, L13812, https://doi.org/10.1029/2005GL025525, 2006.
de Caritat, P., Hall, G., Gìslason, S., Belsey, W., Braun, M., Goloubeva, N. I., Olsen, H. K., Scheie, J. O., and Vaive, J. E.: Chemical composition of arctic snow: concentration levels and regional distribution of major elements, Sci. Total Environ., 336, 183–199, https://doi.org/10.1016/j.scitotenv.2004.05.031, 2005.
Cherry, J. E., Déry, S. J., Cheng, Y., Stieglitz, M., Jacobs, A. S., and Pan, F.: Climate and hydrometeorology of the Toolik Lake region and the Kuparuk River basin, in: Alaska's changing arctic: ecological consequences for tundra, streams, and lakes, edited by: Hobbie, J. E. and Kling, G. W., 21–60, Oxford University Press, New York, 2014.
Cobbett, F. D., Steffen, A., Lawson, G., and van Heyst, B. J.: GEM fluxes and atmospheric mercury concentrations (GEM, RGM and Hgp) in the Canadian Arctic at Alert, Nunavut, Canada (February–June 2005), Atmos. Environ., 41, 6527–6543, https://doi.org/10.1016/j.atmosenv.2007.04.033, 2007.
Corbitt, E. S., Jacob, D. J., Holmes, C. D., Streets, D. G., and Sunderland, E. M.: Global source-receptor relationships for mercury deposition under present-day and 2050 emissions scenarios, Environ. Sci. Technol., 45, 10477–10484, https://doi.org/10.1021/es202496y, 2011.
Craig, H.: Isotopic variations in meteoric waters, Science, 133, 1702–1703, https://doi.org/10.1126/science.133.3465.1702, 1961.
Dominé, F. and Shepson, P. B.: Air-snow interactions and atmospheric chemistry, Science, 297, 1506–1510, https://doi.org/10.1126/science.1074610, 2002.
Dommergue, A., Ferrari, C. P., Poissant, L., Gauchard, P.-A., and Boutron, C. F.: Diurnal cycles of gaseous mercury within the snowpack at Kuujjuarapik/Whapmagoostui, Québec, Canada, Environ. Sci. Technol., 37, 3289–3297, https://doi.org/10.1021/es026242b, 2003.
Dommergue, A., Sprovieri, F., Pirrone, N., Ebinghaus, R., Brooks, S., Courteaud, J., and Ferrari, C. P.: Overview of mercury measurements in the Antarctic troposphere, Atmos. Chem. Phys., 10, 3309–3319, https://doi.org/10.5194/acp-10-3309-2010, 2010.
Douglas, T. A. and Sturm, M.: Arctic haze, mercury and the chemical composition of snow across northwestern Alaska, Atmos. Environ., 38, 805–820, https://doi.org/10.1016/j.atmosenv.2003.10.042, 2004.
Douglas, T. A., Sturm, M., Simpson, W. R., Brooks, S., Lindberg, S. E., and Perovich, D. K.: Elevated mercury measured in snow and frost flowers near Arctic sea ice leads, Geophys. Res. Lett., 32, L04502, https://doi.org/10.1029/2004GL022132, 2005.
Douglas, T. A., Sturm, M., Simpson, W. R., Blum, J. D., Alvarez-Aviles, L., Keeler, G. J., Perovich, D. K., Biswas, A., and Johnson, K.: Influence of snow and ice crystal formation and accumulation on mercury deposition to the Arctic, Environ. Sci. Technol., 42, 1542–1551, https://doi.org/10.1021/es070502d, 2008.
Douglas, T. A., Loseto, L. L., Macdonald, R. W., Outridge, P., Dommergue, A., Poulain, A., Amyot, M., Barkay, T., Berg, T., Chételat, J., Constant, P., Evans, M., Ferrari, C., Gantner, N., Johnson, M. S., Kirk, J., Kroer, N., Larose, C., Lean, D., Nielsen, T. G., Poissant, L., Rognerud, S., Skov, H., Sørensen, S., Wang, F., Wilson, S., and Zdanowicz, C. M.: The fate of mercury in arctic terrestrial and aquatic ecosystems, a review, Environ. Chem., 9, 321–355, https://doi.org/10.1071/EN11140, 2012.
Douglas, T. A., Sturm, M., Blum, J. D., Polashenski, C., Stuefer, S., Hiemstra, C., Steffen, A., Filhol, S., and Prevost, R.: A pulse of mercury and major ions in snowmelt runoff from a small arctic Alaska watershed, Environ. Sci. Technol., 51, 11145–11155, https://doi.org/10.1021/acs.est.7b03683, 2017.
Driscoll, C. T., Mason, R. P., Chan, H. M., Jacob, D. J., and Pirrone, N.: Mercury as a global pollutant: sources, pathways, and effects, Environ. Sci. Technol., 47, 4967–4983, https://doi.org/10.1021/es305071v, 2013.
Enrico, M., Le Roux, G., Heimbürger, L.-E., Van Beek, P., Souhaut, M., Chmeleff, J., and Sonke, J. E.: Holocene atmospheric mercury levels reconstructed from peat bog mercury stable isotopes, Environ. Sci. Technol., 51, 5899–5906, https://doi.org/10.1021/acs.est.6b05804, 2017.
Essery, R. and Pomeroy, J.: Vegetation and topographic control of wind-blown snow distributions in distributed and aggregated simulations for an arctic tundra basin, J. Hydrometeorol., 5, 735–744, https://doi.org/10.1175/1525-7541(2004)005<0735:VATCOW>2.0.CO;2, 2004.
Essery, R., Li, L., and Pomeroy, J.: A distributed model of blowing snow over complex terrain, Hydrol. Process., 13, 2423–2438, https://doi.org/10.1002/(SICI)1099-1085(199910)13:14/15<2423::AID-HYP853>3.0.CO;2-U, 1999.
Faïn, X., Grangeon, S., Bahlmann, E., Fritsche, J., Obrist, D., Dommergue, A., Ferrari, C. P., Cairns, W., Ebinghaus, R., Barbante, C., Cescon, P., and Boutron, C.: Diurnal production of gaseous mercury in the alpine snowpack before snowmelt, J. Geophys. Res., 112, D21311, https://doi.org/10.1029/2007JD008520, 2007.
Faïn, X., Ferrari, C. P., Dommergue, A., Albert, M., Battle, M., Arnaud, L., Barnola, J.-M., Cairns, W., Barbante, C., and Boutron, C.: Mercury in the snow and firn at Summit Station, Central Greenland, and implications for the study of past atmospheric mercury levels, Atmos. Chem. Phys., 8, 3441–3457, https://doi.org/10.5194/acp-8-3441-2008, 2008.
Faïn, X., Obrist, D., Pierce, A., Barth, C., Gustin, M. S., and Boyle, D. P.: Whole-watershed mercury balance at Sagehen Creek, Sierra Nevada, CA, Geochim. Cosmochim. Acta, 75, 2379–2392, https://doi.org/10.1016/j.gca.2011.01.041, 2011.
Faïn, X., Helmig, D., Hueber, J., Obrist, D., and Williams, M. W.: Mercury dynamics in the Rocky Mountain, Colorado, snowpack, Biogeosciences, 10, 3793–3807, https://doi.org/10.5194/bg-10-3793-2013, 2013.
Ferrari, C. P., Dommergue, A., Boutron, C. F., Jitaru, P., and Adams, F. C.: Profiles of mercury in the snow pack at Station Nord, Greenland shortly after polar sunrise, Geophys. Res. Lett., 31, L03401, https://doi.org/10.1029/2003GL018961, 2004.
Ferrari, C. P., Gauchard, P.-A., Aspmo, K., Dommergue, A., Magand, O., Bahlmann, E., Nagorski, S., Temme, C., Ebinghaus, R., Steffen, A., Banic, C., Berg, T., Planchon, F., Barbante, C., Cescon, P., and Boutron, C. F.: Snow-to-air exchanges of mercury in an Arctic seasonal snow pack in Ny-Ålesund, Svalbard, Atmos. Environ., 39, 7633–7645, https://doi.org/10.1016/j.atmosenv.2005.06.058, 2005.
Ferrari, C. P., Padova, C., Faïn, X., Gauchard, P.-A., Dommergue, A., Aspmo, K., Berg, T., Cairns, W., Barbante, C., Cescon, P., Kaleschke, L., Richter, A., Wittrock, F., and Boutron, C.: Atmospheric mercury depletion event study in Ny-Ålesund (Svalbard) in spring 2005, Deposition and transformation of Hg in surface snow during springtime, Sci. Total Environ., 397, 167–177, https://doi.org/10.1016/j.scitotenv.2008.01.064, 2008.
Fitzgerald, W. F., Engstrom, D. R., Lamborg, C. H., Tseng, C.-M., Balcom, P. H., and Hammerschmidt, C. R.: Modern and historic atmospheric mercury fluxes in Northern Alaska: global sources and arctic depletion, Environ. Sci. Technol., 39, 557–568, https://doi.org/10.1021/es049128x, 2005.
Fitzgerald, W. F., Hammerschmidt, C. R., Engstrom, D. R., Balcom, P. H., Lamborg, C. H., and Tseng, C.-M.: Mercury in the Alaskan arctic, in Alaska's changing arctic: ecological consequences for tundra, streams, and lakes, edited by: Hobbie, J. E. and Kling, G. W., Oxford University Press, New York, 287–302, 2014.
Garbarino, J. R., Snyder-Conn, E., Leiker, T. J., and Hoffman, G. L.: Contaminants in Arctic snow collected over Northwest Alaskan sea ice, Water. Air. Soil Pollut., 139, 183–214, https://doi.org/10.1023/A:1015808008298, 2002.
Gat, J. R.: Isotope hydrology: a study of the water cycle, World Scientific, London, 2010.
King, M. D. and Simpson, W. R.: Extinction of UV radiation in arctic snow at Alert, Canada (82∘ N), J. Geophys. Res.-Atmos., 106, 12499–12507, https://doi.org/10.1029/2001JD900006, 2001.
Kirk, J. L., St. Louis, V. L., and Sharp, M. J.: Rapid reduction and reemission of mercury deposited into snowpacks during atmospheric mercury depletion events at Churchill, Manitoba, Canada, Environ. Sci. Technol., 40, 7590–7596, https://doi.org/10.1021/es061299+, 2006.
Krnavek, L., Simpson, W. R., Carlson, D., Domine, F., Douglas, T. A., and Sturm, M.: The chemical composition of surface snow in the Arctic: Examining marine, terrestrial, and atmospheric influences, Atmos. Environ., 50, 349–359, https://doi.org/10.1016/j.atmosenv.2011.11.033, 2012.
Lalonde, J. D., Poulain, A. J., and Amyot, M.: The role of mercury redox reactions in snow on snow-to-air mercury transfer, Environ. Sci. Technol., 36, 174–178, https://doi.org/10.1021/es010786g, 2002.
Landers, D. H., Ford, J., Gubala, C., Monetti, M., Lasorsa, B. K., and Martinson, J.: Mercury in vegetation and lake sediments from the U.S. Arctic, Water Air. Soil Pollut., 80, 591–601, https://doi.org/10.1007/BF01189711, 1995.
Lindberg, S. E., Hanson, P. J., Meyers, T. P., and Kim, K.-H.: Air/surface exchange of mercury vapor over forests – the need for a reassessment of continental biogenic emissions, Atmos. Environ., 32, 895–908, https://doi.org/10.1016/S1352-2310(97)00173-8, 1998.
Liptzin, D., Williams, M. W., Helmig, D., Seok, B., Filippa, G., Chowanski, K., and Hueber, J.: Process-level controls on CO2 fluxes from a seasonally snow-covered subalpine meadow soil, Niwot Ridge, Colorado, Biogeochemistry, 95, 151–166, https://doi.org/10.1007/s10533-009-9303-2, 2009.
Mann, E., Meyer, T., Mitchell, C. P. J., and Wania, F.: Mercury fate in ageing and melting snow: development and testing of a controlled laboratory system, J. Environ. Monit., 13, 2695–2702, https://doi.org/10.1039/C1EM10297D, 2011.
Mann, E., Ziegler, S., Mallory, M., and O'Driscoll, N.: Mercury photochemistry in snow and implications for arctic ecosystems, Environ. Rev., 22, 331–345, https://doi.org/10.1139/er-2014-0006, 2014.
Mann, E. A., Mallory, M. L., Ziegler, S. E., Tordon, R., and O'Driscoll, N. J.: Mercury in Arctic snow: quantifying the kinetics of photochemical oxidation and reduction, Sci. Total Environ., 509–510, 115–132, https://doi.org/10.1016/j.scitotenv.2014.07.056, 2015.
Monson, R. K., Burns, S. P., Williams, M. W., Delany, A. C., Weintraub, M., and Lipson, D. A.: The contribution of beneath-snow soil respiration to total ecosystem respiration in a high-elevation, subalpine forest, Global Biogeochem. Cy., 20, GB3030, https://doi.org/10.1029/2005GB002684, 2006.
Moore, C. W., Obrist, D., Steffen, A., Staebler, R. M., Douglas, T. A., Richter, A., and Nghiem, S. V.: Convective forcing of mercury and ozone in the Arctic boundary layer induced by leads in sea ice, Nature, 506, 81–84, https://doi.org/10.1038/nature12924, 2014.
National Atmospheric Deposition Program: NRSP-3, NADP Program Office, Illinois State Water Survey, University of Illinois, Champaign, IL 61820., 2017.
Nerentorp Mastromonaco, M., Gårdfeldt, K., Jourdain, B., Abrahamsson, K., Granfors, A., Ahnoff, M., Dommergue, A., Méjean, G., and Jacobi, H.-W.: Antarctic winter mercury and ozone depletion events over sea ice, Atmos. Environ., 129, 125–132, https://doi.org/10.1016/j.atmosenv.2016.01.023, 2016.
Norman, A. L., Barrie, L. A., Toom-Sauntry, D., Sirois, A., Krouse, H. R., Li, S. M., and Sharma, S.: Sources of aerosol sulphate at Alert: apportionment using stable isotopes, J. Geophys. Res.-Atmos., 104, 11619–11631, https://doi.org/10.1029/1999JD900078, 1999.
Obrist, D., Tas, E., Peleg, M., Matveev, V., Faïn, X., Asaf, D., and Luria, M.: Bromine-induced oxidation of mercury in the mid-latitude atmosphere, Nat. Geosci., 4, 22–26, https://doi.org/10.1038/ngeo1018, 2011.
Obrist, D., Pokharel, A. K., and Moore, C.: Vertical profile measurements of soil air suggest immobilization of gaseous elemental mercury in mineral soil, Environ. Sci. Technol., 48, 2242–2252, https://doi.org/10.1021/es4048297, 2014.
Obrist, D., Agnan, Y., Jiskra, M., Olson, C. L., Colegrove, D. P., Hueber, J., Moore, C. W., Sonke, J. E., and Helmig, D.: Tundra uptake of atmospheric elemental mercury drives Arctic mercury pollution, Nature, 547, 201–204, https://doi.org/10.1038/nature22997, 2017.
Oechel, W. C., Vourlitis, G., and Hastings, S. J.: Cold season CO2 emission from arctic soils, Global Biogeochem. Cy., 11, 163–172, https://doi.org/10.1029/96GB03035, 1997.
Pearson, C., Schumer, R., Trustman, B. D., Rittger, K., Johnson, D. W., and Obrist, D.: Nutrient and mercury deposition and storage in an alpine snowpack of the Sierra Nevada, USA, Biogeosciences, 12, 3665–3680, https://doi.org/10.5194/bg-12-3665-2015, 2015.
Poulain, A. J., Lalonde, J. D., Amyot, M., Shead, J. A., Raofie, F., and Ariya, P. A.: Redox transformations of mercury in an Arctic snowpack at springtime, Atmos. Environ., 38, 6763–6774, https://doi.org/10.1016/j.atmosenv.2004.09.013, 2004.
Schroeder, W. H. and Munthe, J.: Atmospheric mercury – An overview, Atmos. Environ., 32, 809–822, https://doi.org/10.1016/S1352-2310(97)00293-8, 1998.
Schroeder, W. H., Anlauf, K. G., Barrie, L. A., Lu, J. Y., Steffen, A., Schneeberger, D. R., and Berg, T.: Arctic springtime depletion of mercury, Nature, 394, 331–332, https://doi.org/10.1038/28530, 1998.
Selin, N. E.: Global biogeochemical cycling of mercury: a review, Annu. Rev. Environ. Resour., 34, 43–63, https://doi.org/10.1146/annurev.environ.051308.084314, 2009.
Seok, B., Helmig, D., Williams, M. W., Liptzin, D., Chowanski, K., and Hueber, J.: An automated system for continuous measurements of trace gas fluxes through snow: an evaluation of the gas diffusion method at a subalpine forest site, Niwot Ridge, Colorado, Biogeochemistry, 95, 95–113, https://doi.org/10.1007/s10533-009-9302-3, 2009.
Shaver, G. R. and Chapin, F. S.: Production: biomass relationships and element cycling in contrasting arctic vegetation types, Ecol. Monogr., 61, 1–31, https://doi.org/10.2307/1942997, 1991.
Siegenthaler, U. and Oeschger, H.: Correlation of 18O in precipitation with temperature and altitude, Nature, 285, 314–317, https://doi.org/10.1038/285314a0, 1980.
Simpson, W. R., von Glasow, R., Riedel, K., Anderson, P., Ariya, P., Bottenheim, J., Burrows, J., Carpenter, L. J., Frieß, U., Goodsite, M. E., Heard, D., Hutterli, M., Jacobi, H.-W., Kaleschke, L., Neff, B., Plane, J., Platt, U., Richter, A., Roscoe, H., Sander, R., Shepson, P., Sodeau, J., Steffen, A., Wagner, T., and Wolff, E.: Halogens and their role in polar boundary-layer ozone depletion, Atmos. Chem. Phys., 7, 4375–4418, https://doi.org/10.5194/acp-7-4375-2007, 2007.
Snyder-Conn, E., Garbarino, J. R., Hoffman, G. L., and Oelkers, A.: Soluble trace elements and total mercury in arctic alaskan snow, Arctic, 50, 201–215, 1997.
Sprovieri, F., Pirrone, N., Ebinghaus, R., Kock, H., and Dommergue, A.: A review of worldwide atmospheric mercury measurements, Atmos. Chem. Phys., 10, 8245–8265, https://doi.org/10.5194/acp-10-8245-2010, 2010.
St. Louis, V. L., Sharp, M. J., Steffen, A., May, A., Barker, J., Kirk, J. L., Kelly, D. J. A., Arnott, S. E., Keatley, B., and Smol, J. P.: Some sources and sinks of monomethyl and inorganic mercury on Ellesmere Island in the Canadian high Arctic, Environ. Sci. Technol., 39, 2686–2701, https://doi.org/10.1021/es049326o, 2005.
Steffen, A., Schroeder, W., Bottenheim, J., Narayan, J., and Fuentes, J. D.: Atmospheric mercury concentrations: measurements and profiles near snow and ice surfaces in the Canadian Arctic during Alert 2000, Atmos. Environ., 36, 2653–2661, https://doi.org/10.1016/S1352-2310(02)00112-7, 2002.
Steffen, A., Douglas, T., Amyot, M., Ariya, P., Aspmo, K., Berg, T., Bottenheim, J., Brooks, S., Cobbett, F., Dastoor, A., Dommergue, A., Ebinghaus, R., Ferrari, C., Gardfeldt, K., Goodsite, M. E., Lean, D., Poulain, A. J., Scherz, C., Skov, H., Sommar, J., and Temme, C.: A synthesis of atmospheric mercury depletion event chemistry in the atmosphere and snow, Atmos. Chem. Phys., 8, 1445–1482, https://doi.org/10.5194/acp-8-1445-2008, 2008.
Steffen, A., Bottenheim, J., Cole, A., Douglas, T. A., Ebinghaus, R., Friess, U., Netcheva, S., Nghiem, S., Sihler, H., and Staebler, R.: Atmospheric mercury over sea ice during the OASIS-2009 campaign, Atmos. Chem. Phys., 13, 7007–7021, https://doi.org/10.5194/acp-13-7007-2013, 2013.
Steffen, A., Bottenheim, J., Cole, A., Ebinghaus, R., Lawson, G., and Leaitch, W. R.: Atmospheric mercury speciation and mercury in snow over time at Alert, Canada, Atmos. Chem. Phys., 14, 2219–2231, https://doi.org/10.5194/acp-14-2219-2014, 2014.
Sturm, M. and Liston, G. E.: The snow cover on lakes of the Arctic Coastal Plain of Alaska, USA, J. Glaciol., 49, 370–380, https://doi.org/10.3189/172756503781830539, 2003.
Toom-Sauntry, D. and Barrie, L. A.: Chemical composition of snowfall in the high Arctic: 1990–1994, Atmos. Environ., 36, 2683–2693, https://doi.org/10.1016/S1352-2310(02)00115-2, 2002.
Uematsu, M., Kinoshita, K., and Nojiri, Y.: Scavenging of insoluble particles from the marine atmosphere over the sub-arctic north Pacific, J. Atmos. Chem., 35, 151–163, https://doi.org/10.1023/A:1006219028497, 2000.
US EPA: Method 1631: Mercury in water by oxidation, purge and trap, and cold vapor atomic fluorescence spectrometry, United States Environmental Protection Agency, 2002.
Van Dam, B., Helmig, D., Burkhart, J. F., Obrist, D., and Oltmans, S. J.: Springtime boundary layer O3 and GEM depletion at Toolik Lake, Alaska, J. Geophys. Res.-Atmos., 118, 3382–3391, https://doi.org/10.1002/jgrd.50213, 2013.