the Creative Commons Attribution 4.0 License.
the Creative Commons Attribution 4.0 License.
 | 03 May 2024
Frost quakes in wetlands in northern Finland during extreme winter weather conditions and related hazard to urban infrastructure
Elena Kozlovskaya
Kari Moisio
Emma-Riikka Kokko
Jarkko Okkonen
The paper reports the first results of an experiment in northern Finland during winter 2022–2023 that aimed at studying seismic events caused by seasonal freezing in the so-called critical zone (CZ) of the Earth. These events have attracted public attention recently, as multiple reports about them from local inhabitants in Arctic and sub-Arctic areas appeared on social networks. To make an instrumental study of such events, to reveal the relationship between their occurrence and winter weather conditions, and to evaluate the possible hazard, we installed two high-resolution seismic arrays with co-located soil temperature stations at two sites in Finland, one of them being in the city of Oulu in the sub-Arctic area (65.04° N, 25.61° E) and the other one above the polar circle in the municipality of Sodankylä (67.36° N, 26.63° E). The equipment recorded continuous seismic and soil temperature data during November 2022–April 2023. Based on reports from the inhabitants of Talvikangas (Oulu) about the ground shaking and unusual noises on 6 January 2023 and their observations of new fractures on the roads there, we selected the time interval for the identification of frost quakes that originated during that day from continuous seismic records in Talvikangas and in Sodankylä. During the selected time interval, the extremely rapid air temperature drops of about −1.4 °C h−1 in Talvikangas and −0.88 °C h−1 in Sodankylä were observed. We identified and located two types of seismic events – namely, frost quakes with frequencies of about 10–20 Hz, with waveforms like those of tectonic events, and irregularly shaped frost tremors with frequencies of about 120–180 Hz. The sources of frost quakes in Talvikangas are mainly located on irrigated wetland, while in Sodankylä, about 50 % of registered frost quakes were caused by ice fracturing on the Kitinen River. However, several relatively strong events, with their origin in the wetlands, were also recorded. A significant number of sources of frost tremors are confined to wetland areas cut by irrigation channels and to roads cleaned from snow during winter both in Talvikangas and in Sodankylä. We calculated ground accelerations and ground velocities for the strongest events from both groups and compared them to equivalent properties of other seismic signals, like distant local earthquakes in the area, mining production blasts, and cargo train vibration. Our study shows that high-frequency frost tremors corresponding to surface fracture opening in the uppermost frozen surface layer of a thickness of up to 5 cm can directly damage infrastructure objects like roads and basements of buildings. Surface waves, produced by frost quakes and propagating inside the shallow soil layer, have large enough ground accelerations at epicentral distances of hundreds of metres. Therefore, frost quakes should be considered a phenomenon that can potentially damage infrastructures, and they have to be taken into account in seismic hazard assessments.
Our research is the first instrumental study of seismic events originating from wetland areas. These events occur as a result of the interaction between the uppermost layer of the solid Earth's CZ and atmosphere processes that deserves further study.
- Article
(9076 KB) - Full-text XML
- BibTeX
- EndNote


The Arctic and sub-Arctic regions are snow-dominated cold environments. There are numerous consequences of climate change in these regions. The climate change impact analysis already indicates clear changes in wintertime conditions in these areas and predicts that these changes will also be observed in the future (IPCC, 2022). For example, the amount of precipitation and humidity in winter seasons will increase, and the amount of snow on the ground will become more variable in the Arctic regions. The processes initiated by climate change and resulting in extreme and unusual weather conditions are particularly influencing the critical zone (CZ) of the Earth, which includes the biological, chemical, physical, and geological materials and processes that work together in the surface region of the Earth (Brantley et al., 2007). The CZ starts from the upper limit of vegetation and continues all the way through the soils to the bottom of the groundwater. Dynamic processes in the CZ are modulated by climate and weather conditions; hence, these conditions have a direct impact on such natural environment as wetlands and urban infrastructures in direct contact with the CZ (roads, building foundations, etc.) (Brantley et al., 2007; Giardino and Houser, 2015; Parsekian et al., 2015). To understand the effects of climate change and to ensure sustainable and safe living environment, it is essential to study dynamical processes in the CZ under the influence of various weather conditions.
For Arctic and sub-Arctic regions, the predicted changes in the snow cover and the wintertime snow–rainfall relationship (IPCC, 2022) may change the dynamics of the freezing and thawing processes in the CZ. One of the manifestations of these changes are frost quakes that have been encountered recently in urban areas of several countries, such as Finland, Canada, and USA (Battaglia and Changnon, 2016; Leung et al., 2017; Okkonen et al., 2020), where they resulted in the fracturing of roads and building foundations (Battaglia and Changnon, 2016; Okkonen et al., 2020). Although the number of instrumental observations of frost quakes is limited, such events and related damage are repeatedly reported on social networks by local people.
It has been demonstrated (Okkonen et al., 2020) that frost quakes can originate from the uppermost part of frozen soils. The process of fracturing is initiated by a rapid decrease in air temperature. In combination with other factors, such as thin snow coverage and hydrogeological conditions in the uppermost subsurface, the mechanical properties of water-saturated upper soils are changing, resulting in the release of the accumulated thermal stress by fracturing. It can be judged from this model that such events are probably not occurring solely in urban areas but in other parts of the CZ as well. An essential part of the CZ are wetlands that are defined by having a water table near or above the land surface for a sufficient amount of time to cause the development of wetland soils (either mineral soils with redoximorphic features or organic soils with >40 cm of peat) and the presence of plant species with adaptations to wet environments (Canada Committee on Ecological (Biophysical) Land Classification et al., 1997; McKenzie et al., 2021). The mechanical fracturing in the wetlands can cause mechanical damage to vegetation (roots and collars of trees) and vegetated soils and even increase emissions of greenhouse gases. However, the severity of such fracturing and related hazards is not well known due to the lack of instrumental seismic observations.
In this study, we use continuous seismic data to investigate the thermal stress release processes in upper soils and wetlands caused by unusual winter weather conditions in Arctic and sub-Arctic (Boreal) areas of Finland. To detect events, we analysed the seismic data recorded by two high-resolution seismic arrays, each consisting of 45 short-period three-component seismic stations, with co-located soil stations, in two geographically different sites in northern Finland characterized by different weather, geological, and hydrogeological conditions. We analyse the time series of weather parameters (air and soil temperature) to detect specific weather conditions favourable for the origin of frost quakes. We use a specially developed algorithm to detect and locate the seismic events that could originate from the uppermost subsurface associated with the CZ. We report observations of two types of seismic events in the CZ during an extreme winter weather event in January 2023 in these two sites and evaluate the related seismic hazard in terms of ground motion (ground acceleration and ground velocity). We discuss our results in the context of the interaction between atmosphere processes and the solid Earth's CZ that needs to be investigated in order to mitigate the consequences of climate change.
Our experiment was conducted during winter 2022–2023, starting in early November and ending in late April. To record seismic events originating from the CZ, we selected two areas in northern Finland with different weather conditions. The first site (Tähtelä) is located in the municipality of Sodankylä (67.36° N, 26.63° E) and the second one (Talvikangas) in the city of Oulu (65.04° N, 25.61° E) (Fig. 1).
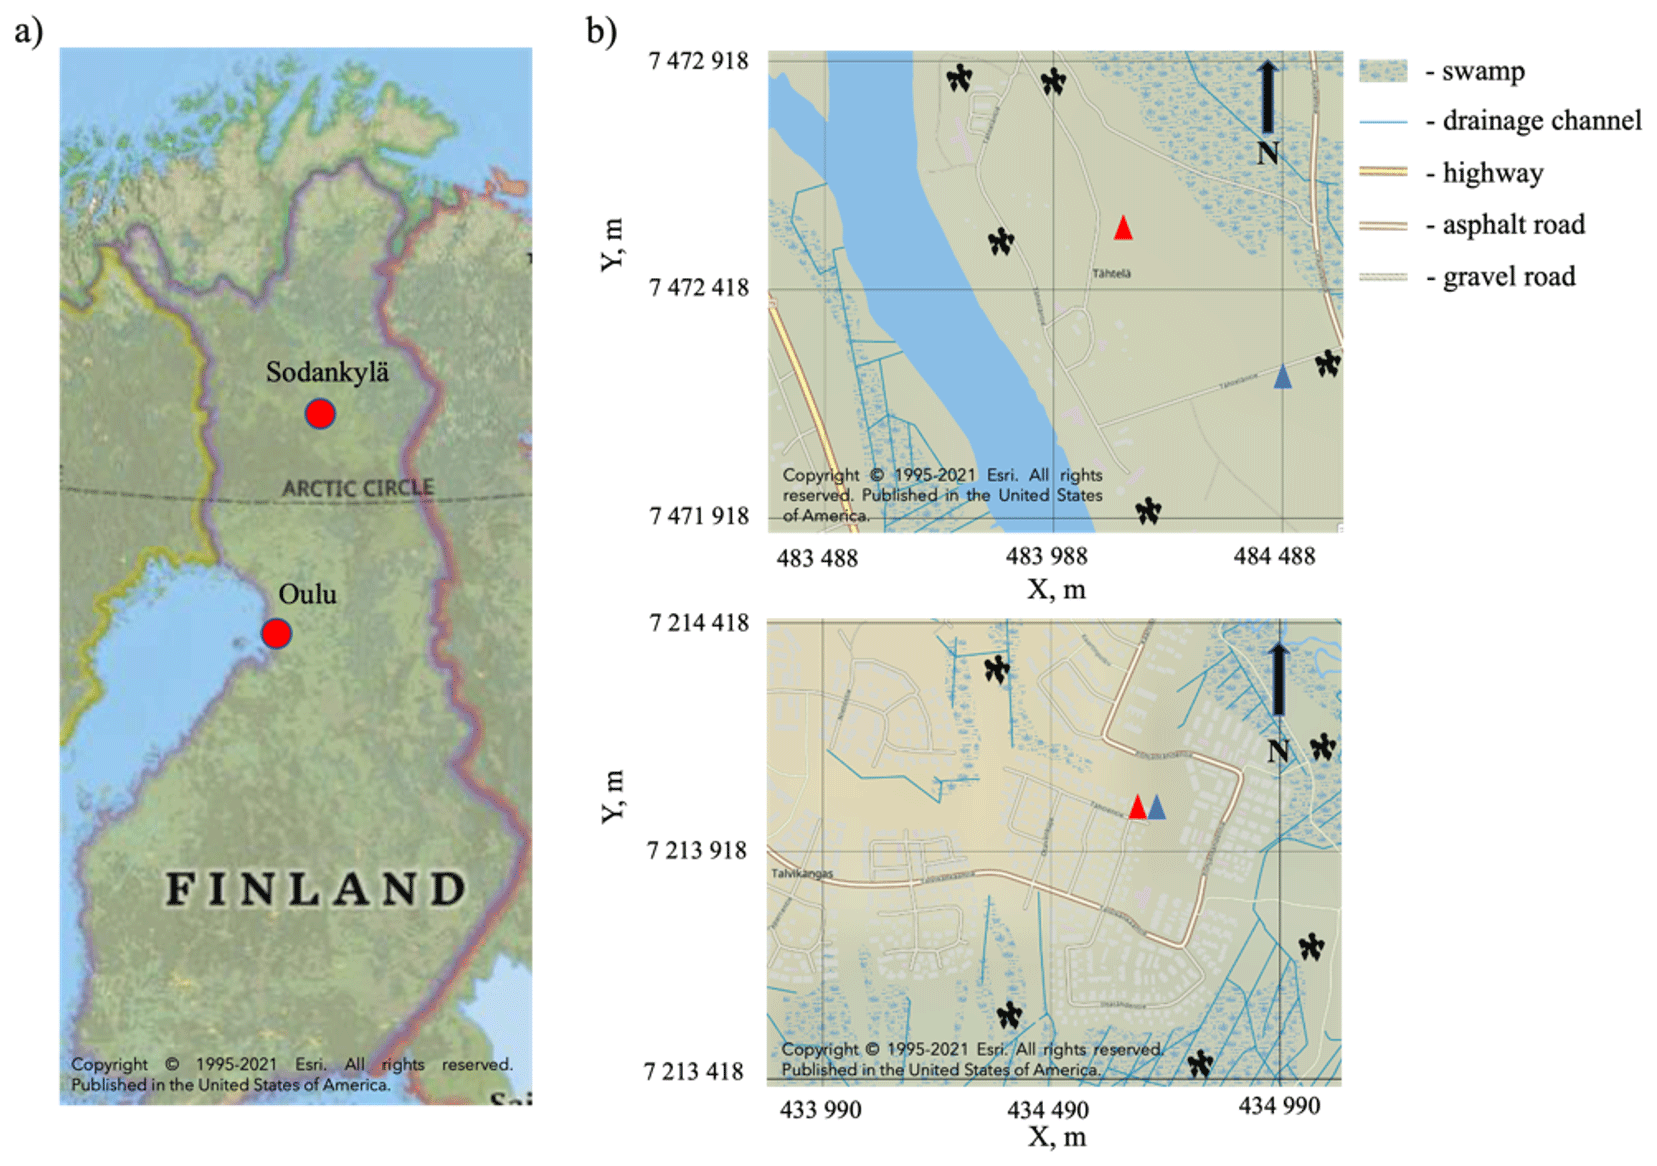
Figure 1(a) Geographical position of the two sites of the experiment in northern Finland during winter 2022–2023. (b) Installations of seismic arrays and soil stations in Tähtelä (upper) and Talvikangas (lower). The blue triangles show soil stations, the red triangles show broadband seismic stations, and the black dots indicate the arrays of short-period seismic stations. The coordinate system is EUREF_FIN_TM35FIN (units are in metres; X is easting and Y is northing).
The Oulu site is characterized by sub-Arctic continental climate with an average winter temperature (from November to March) of about −6.5 °C (Weatherbase.com, 2023) and an average snow depth of about 0.5 m (Rankinen et al., 2004). The second site is located in the territory of the Sodankylä Geophysical Observatory and characterized by Arctic climate conditions, with freezing, long, extremely snowy winters. The average snow depth during wintertime is about 0.9 m (Rankinen et al., 2004). The typical average winter temperature for this area is about −10 °C (https://weatherbase.com, last access: 9 August 2023). A common feature of both sites is that they are in the close vicinity of wetlands cut by drainage channels (Fig. 1b). In our study, we do not distinguish between different types of wetlands (bogs, fens, and marshes), as all of them are present in the selected research areas.
At the Oulu site, the frost quakes were felt by local inhabitants earlier, in January 2016 and January 2021. They reported on social networks about ground shaking, cracks in the roads, and unusual noises. The swarm of frost quakes on 6 January 2016 was investigated in Okkonen et al. (2020). It was demonstrated that the swarm of events occurred during a rapid decrease in air temperature from −15 to −25 °C in 24 h (Fig. 2).
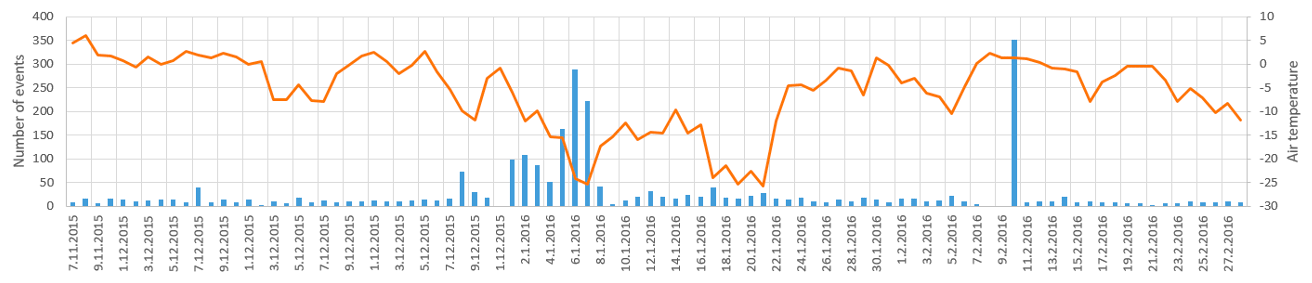
Figure 2Air temperature and number of seismic events recorded by the permanent seismic station Oulu (OUL) during winter 2015–2016 (Afonin and Kozlovskaya, 2019).
However, the proper locating of these events was not possible, as the swarm was recorded only by a single permanent seismic station, OUL. Thus, the main targets of our experiment were to (1) obtain instrumental recordings of frost quakes, (2) locate them properly, and (3) obtain additional evidence of the connection between processes of freezing and fracturing in the uppermost soils and weather conditions.
Because of the latter target, the following equipment was used in both sites. We installed data loggers, CR10X, by Campbell Scientific Inc. (USA), which were continuously recording soil temperatures and soil moisture content at several depths between 10 and 50 cm in Talvikangas and between 10 and 80 cm in Tähtelä. The interval between sensors at each site was typically about 10 cm. These stations were recording data at a sampling interval of 1 h from the end of October 2022 to the end of May 2023.
The seismological equipment included two broadband three-component seismometers, Güralp 3ESPC Compact by Güralp Systems Ltd., UK (1 per study site), and 90 (45 per site) short-period three-component seismic stations installed in 10 arrays (5 per site) equipped with GS-One LF three-component geophones with GSX autonomous data recorders by Geospace Technologies Ltd. (USA). All these instruments were obtained from the FLEX-EPOS pool of seismic instruments.
The configuration of arrays was selected taking into account a frequency band of the target signal and recommendations by Schweitzer et al. (2012). The frequency band of 120–180 Hz was selected based on the results of our earlier pilot experiment in Talvikangas during winter 2019–2020. In that experiment, we recorded three-component continuous seismic data at a single station in Talvikangas equipped with a broadband Trillium Compact seismometer by Nanometrics Inc. (USA). This seismometer was installed at the same location in Talvikangas as in the current research.
Based on the direct observation of cracks in roads, which appeared during an abrupt air temperature drop in Talvikangas in January 2016 and was reported by local citizens, in our earlier study (Okkonen et al., 2020), we assumed that the main fracturing mechanism in that case was vertical fracture opening. At the same time, the seismic signal excited by this fracturing would have mainly horizontal polarization in the far-field zone. This assumption was supported by a polarization analysis of swarms of unusual impulses, recorded by the permanent seismic station Oulu during the same day when cracks in roads and unusual noises were reported by local citizens in Talvikangas. The station is located at 14 km from Talvikangas.
As Talvikangas is an urban area, spectrograms calculated from continuous data are dominated by typical diurnal variations in anthropogenic noise observed at numerous urban sites around the globe, and no distinct correlation with temperature could be noticed there (see, for example, Steinmann et al., 2021). Therefore, considering our earlier observations about polarization features of impulses, to find the frequency band of signals for data analysis and select the sampling rate, we calculated a time series of the horizontal-to-vertical spectral ratio (HVSR) from the seismic data, recorded in our pilot experiment in winter 2019–2020 and compared it to the air temperature variations (Fig. 3b). The HVSR maxima at a frequency of about 150 Hz are present when the air temperature is below zero and disappear when the temperature is above zero. Based on this observation, we suggest that the HVSR maxima at these frequencies may be caused by the appearance of multiple small-scale fractures in the uppermost soil during its freezing in the beginning of winter season. To record the signals caused by fracturing in this specific frequency band, we designed a particular seismic array configuration (Fig. 3a) for short-period instruments.
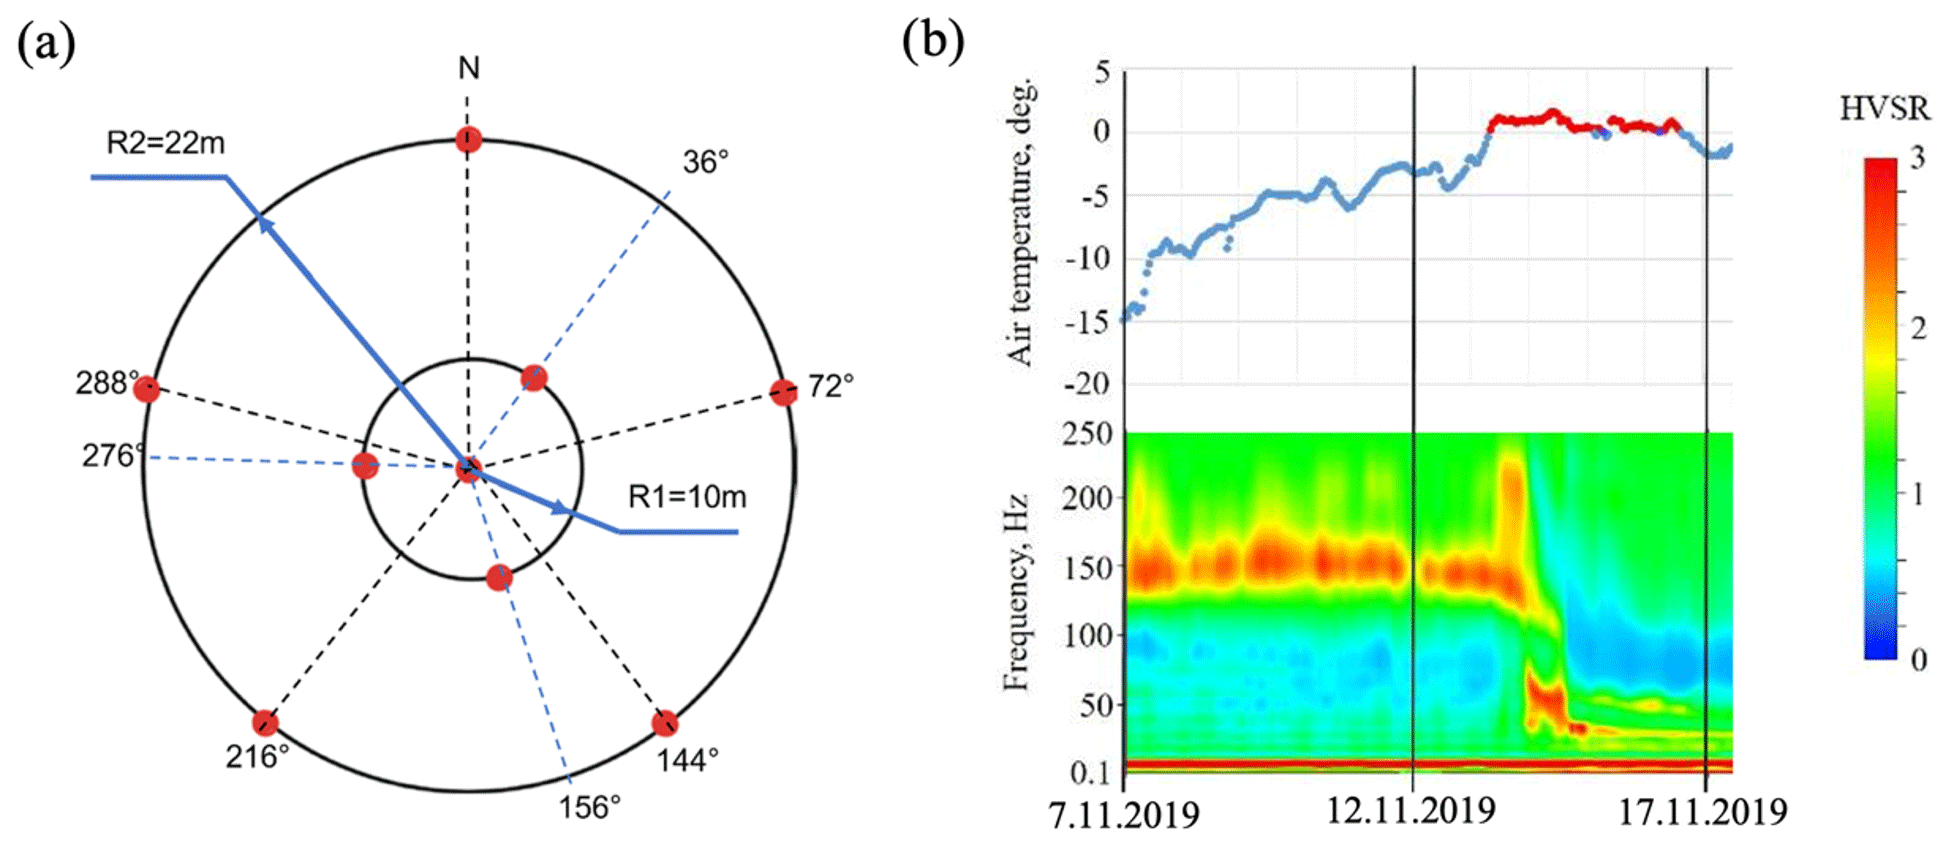
Figure 3Array configuration (according to the recommendation by Schweitzer et al., 2012): (a) configuration of the array; (b) HVSR, calculated from continuous seismic data recorded in Talvikangas in November 2019, compared to air temperature.
The inner ring has a radius of 10 m and consists of three seismometers. The outer ring has a radius of 22 m and consists of five seismometers. All seismic sensors (Fig. 3a) were oriented according to the ZNE coordinate system, with Z pointing down. The radii were chosen based on the assumed wavelengths of the target signal, which were estimated from the frequency band and seismic wave velocities in upper soils. Figure 4a shows the 1-D seismic velocity model for the Talvikangas obtained from the results of controlled-source refraction seismics near the site of a broadband temporary seismic station (Fig. 1) confirmed by results of a co-located GPR survey that shows the approximate thickness of the sedimentary layer there (Fig. 4b). According to the data of soil types from the Geological Survey of Finland (GTK) and visual observations, the seismic equipment at both sites were installed on similar sandy sediments. Thus, the velocity model (Fig. 4a) is appropriate for event location at both sites.
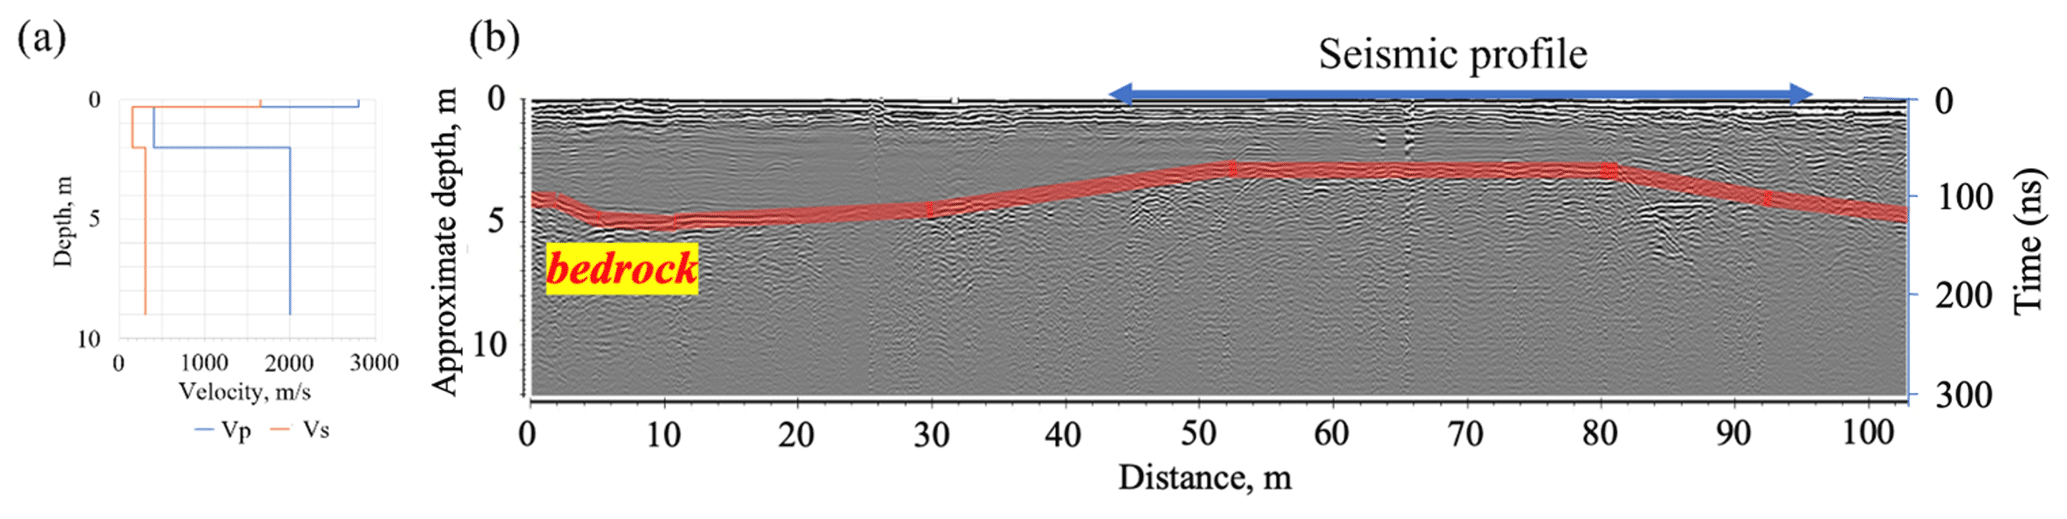
Figure 4(a) Near-surface 1-D velocity model of the Talvikangas district of Oulu with the uppermost frozen layer of 30 cm added. (b) Results of the GPR survey.
As the velocity model was obtained from the refraction profile data recorded on unfrozen soils, we added one additional upper layer of 30 cm in thickness, representing the frozen water-saturated soil. The layer thickness was also constrained by the data of the soil station in Tähtelä that show the largest thickness of the frozen layer. The velocities of this layer correspond to those of frozen sands saturated with water (Dortman, 1992).
The seismic instruments recorded seismic data from October 2022 until April 2023, with a sampling frequency of 500 Hz. Generally, the data acquisition was designed in such a way that seismic sensors were not replaced, but 90 seismic short-period sensors and 90 GSX data loggers were simultaneously in the field, while the other 90 data loggers were under maintenance. The regular maintenance included battery charging and raw data downloading from the data loggers. Such a scheme ensured continuous data recording by the arrays. The battery capacity of GSX loggers is enough for continuous recording lasting for approximately 40 d; hence, they were serviced every month. The maintenance also included the replacement of memory cards of broadband stations and batteries of soil stations.
The air and ground temperature time series during November 2022–January 2023 are shown in Fig. 5a. Air temperatures are taken from Finnish Meteorological Institute's download service and stations Oulu (Pellonpää) and Sodankylä (Tähtelä) (Finnish Meterorological Institute Open Data, Weather Observations, 2023). The air temperatures were quite variable during the observation time; however, negative ground surface temperatures at both sites were reached by the end of November. After that, the average soil temperatures at depths of more than 10 cm in Talvikangas and more than 30 cm in Tähtelä remained above zero, indicating the approximate average thickness of the initially frozen layer. Rapid air temperature drops occurred at both sites on 6 January 2023 (Fig. 5a, b) and, during that episode, the local inhabitants in Talvikangas heard unusual loud noises in the early morning. On the same day, they detected several new cracks in the roads and in the walls of building foundations. In Talvikangas, the air temperature dropped from −9.6 to −21 °C in 8 h, which corresponds to a −1.4 °C h−1 gradient on average. In Tähtelä, the air temperature dropped from −9.1 to −34 °C in 28 h, which corresponds to a −0.88 °C h−1 gradient on average. In Tähtelä, these were the lowest recorded air temperature and one of the highest negative gradients of the air temperature during winter 2022–2023.
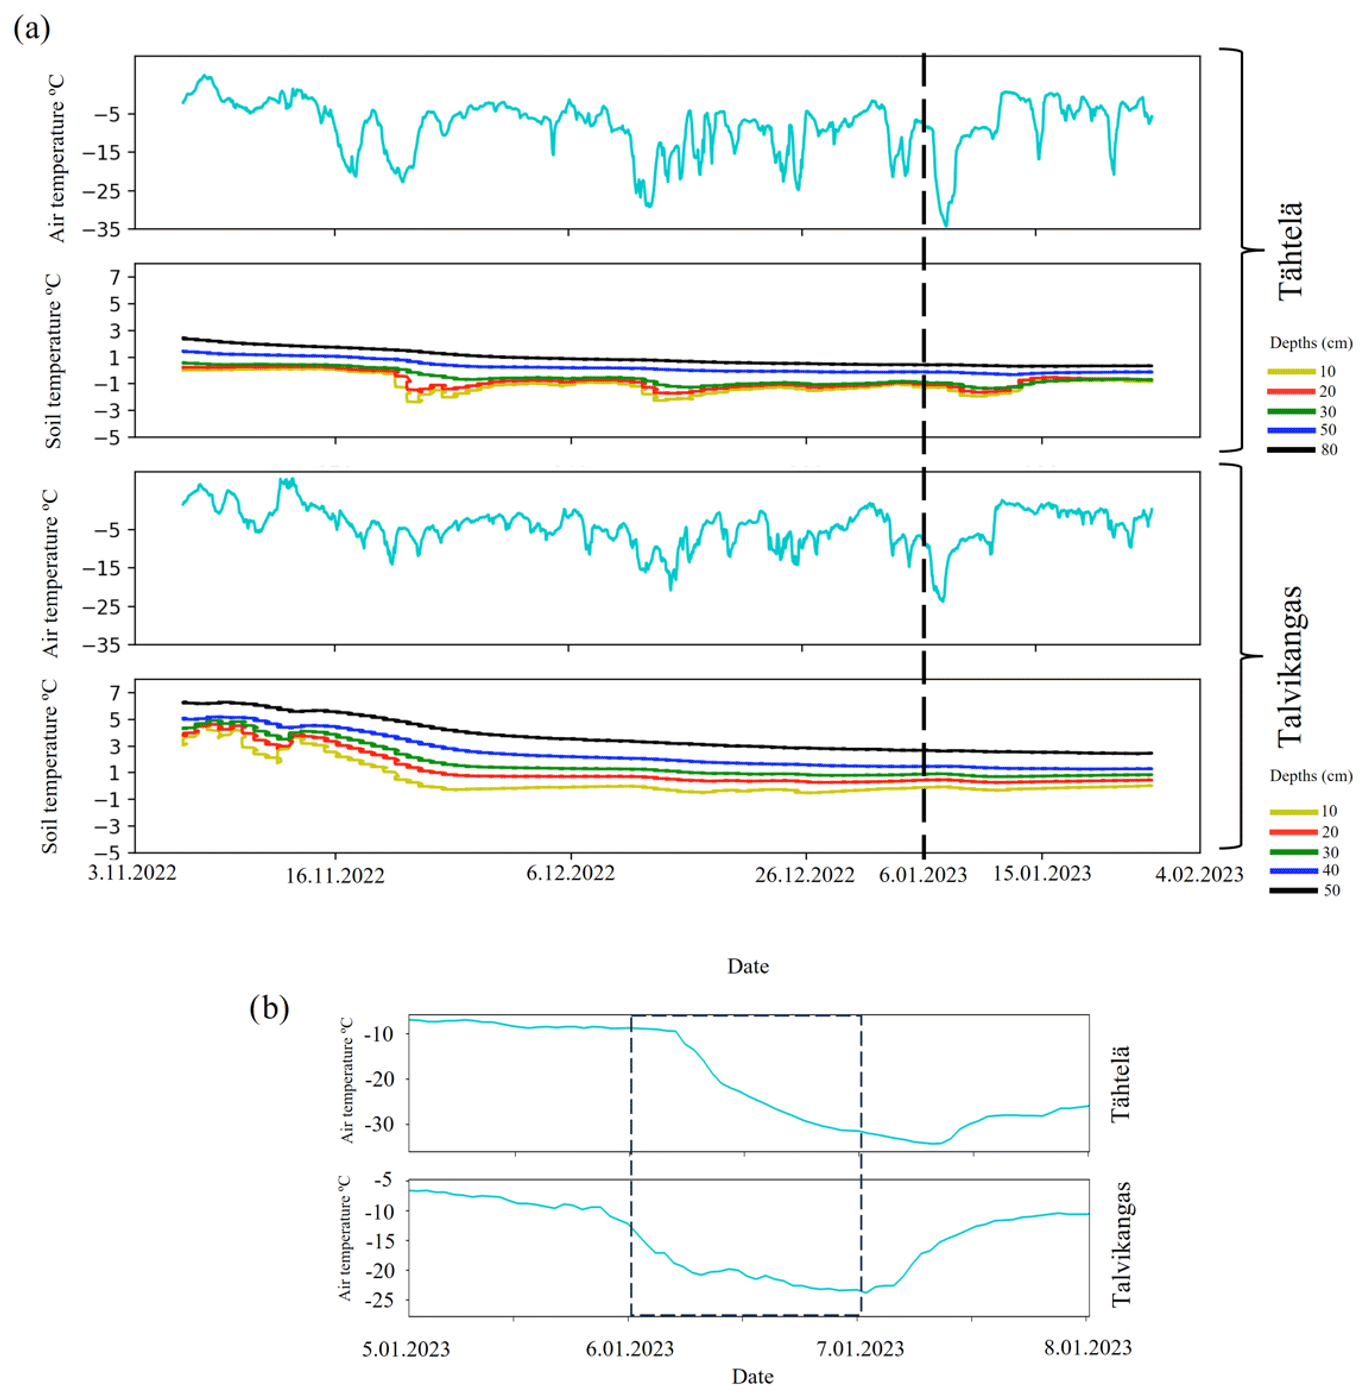
Figure 5Soil and air temperature observations during winter 2022–2023: (a) time series for the whole observation period, (b) time series at the beginning of January.
Nevertheless, the soil temperature did not change so significantly on that day in Talvikangas, while in Tähtelä, an abrupt temperature decrease in the uppermost 30 cm of the soil is seen in the next day data.
Considering this abrupt air temperature change and its similarity with the observations in our previous frost quake study (Okkonen et al., 2020) and recognizing the observations of local inhabitants, it was reasonable to concentrate the seismic data analysis to detect and locate possible frost quakes on that specific day.
The visual analysis of the continuous recordings of both types of instruments showed that two types of waveforms can be recognized. The first type corresponds to the pulse-type events with a clear onset of the signal and visible arrivals of compressional (P), shear (S), and surface waves (hereafter referred to as events or frost quakes), and the second type corresponds to a tremor-type signal with a longer duration and without a clear onset (hereafter referred to as frost tremors) but with characteristics different from waveforms produced by sources of anthropogenic origin (cars, snow cleaners, etc.). As the considered area is aseismic with respect to tectonic earthquakes (Institute of seismology, University of Helsinki: https://www.helsinki.fi/en/institute-seismology, last access: 3 May 2023), we can also exclude the tectonic origin of these waveforms. To our knowledge and based on the online real-time Bulletin of Seismic Events in northern Europe (Institute of Seismology, University of Helsinki, 2023), no blasting activity was going on near our observation areas during that day. Hence, we assumed that the two types of waveforms correspond to frost quakes or frost tremors, respectively. Thus, the seismic data processing consisted of two parts. Depending on the type of target event, we analysed seismic data in two frequency bands: the first one is of 2–20 Hz and corresponds to frost quakes, while the second one is with frequencies of 120–180 Hz and corresponds to tremors. Both frequency bands were selected based on the results of our previous pilot experiment during winter 2019–2020.
4.1 Detecting and locating frost quakes
For event detection, we used seismograms recorded by the arrays that were bandpass-filtered of 2–20 Hz and stacked using a beamforming algorithm (Schweitzer et al., 2012). An example recording of the strongest detected event (Z component) and particle motion diagrams are shown in Fig. 6a and b, respectively. In Fig. 6a, three distinct arrivals corresponding to P, S, and surface waves are seen. The time difference between the arrivals of P and S waves indicates that the event source is located at distances from about 300 to 1100 m from the arrays. Despite some visible similarities with tectonic earthquakes or blasts, the recording of this event has some specific features. The P wave is polarized mainly in the horizontal plane, meaning that its incidence angle is close to 90°. The S wave is polarized in the vertical plane. At the same time, the particle motion diagram of the surface wave is typical of the Rayleigh wave (R). These features suggest that the source is in the very shallow subsurface and that the S waves are propagating inside the shallow subsurface layer with apparent velocities of about 480 m s−1 through the dry land and about 430 m s−1 through the swamp. These velocities are not in contradiction with the average velocity in the velocity model (Fig. 4a).

Figure 6The strongest frost quake, detected on 6 January 2023 in Talvikangas: (a) stacked vertical component seismograms prefiltered by a bandpass filter of 2–20 Hz; (b) particle motion diagrams for P, S, and Rayleigh (R) waves; (c) location of the epicentre is indicated by the red dot.
We selected the high-quality recordings of events at both sites using visual analysis of stacked seismograms and picked both P- and S-wave arrivals. We used these arrival times and the velocity model (Fig. 4a) to calculate the locations of the event sources. The strongest event was in the wetland (Fig. 6c).
The epicentres of detected and located frost quakes on 6 January 2023 at both sites are shown in Fig. 7. This includes 11 frost quakes in Talvikangas and 34 frost quakes in Sodankylä. Typically, the error in the epicentre location is about 50–150 m.
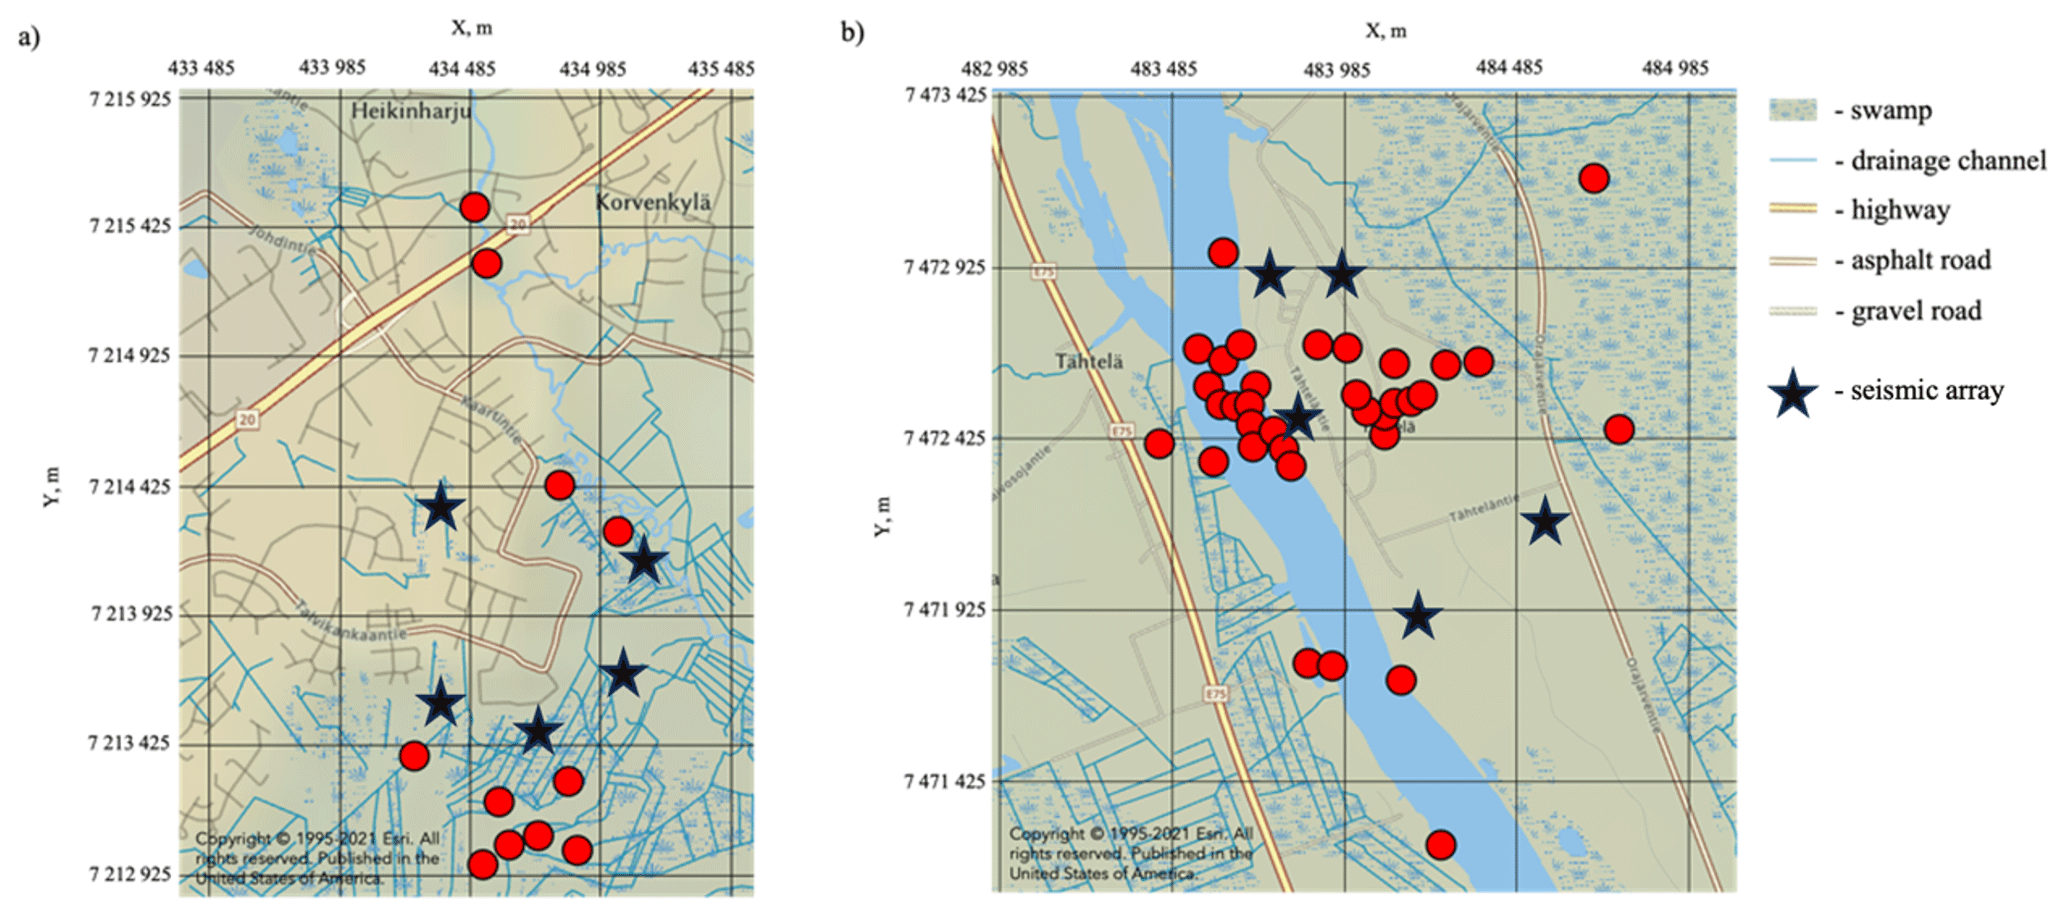
Figure 7Locations of the frost quakes, detected on 6 January 2023: (a) Talvikangas, (b) Tähtelä.
The frost quake sources in Talvikangas are mainly located in the wetlands (swamps) (Fig. 7a). A small number of the frost quakes originated from the vicinity of the nearest highway, located close to a bridge over a small river and are therefore probably caused by ice fracturing. The site in Sodankylä had more frost quakes (Fig. 7b), and about 50 % of the registered frost quakes were caused by ice fracturing on the Kitinen River. A significant part of frost quakes originates from small roads which are kept clear of snow during winter. Several events also originated from wetland areas.
We converted digital seismograms to ground velocities and ground accelerations to evaluate the possible hazard for roads and building foundations in the vicinity of the frost quakes. Seismograms and spectrograms for the abovementioned strongest event in Talvikangas recorded by the seismic array with a minimum epicentral distance of about 300 m are shown in Fig. 8. The Rayleigh wave is characterized by a relatively wide frequency band of approximately 5–30 Hz, and the amplitude maxima are seen at frequencies of 15–20 Hz.

Figure 8Seismic records and corresponding spectrograms of the strongest frost quake in Talvikangas on 6 January 2023, recorded by the closest seismic array to the epicentre (epicentral distance is about 300 m): (a) ground velocities, (b) ground accelerations.
The spectrogram of the vertical component (Fig. 8b) shows that the peak ground acceleration of the Rayleigh wave corresponds to frequencies of about 20–25 Hz and is about 0.9–1 m s−12, while the peak ground velocity is about 0.0065–0.007 m s−1.
4.2 Detecting and locating tremors
In this study, what we call a “tremor” is a small-scale seismic event that has the waveform detectable by the array but without a clear onset and without clear arrivals of body waves. We found such events already in our pilot experiment in 2019–2020, but their origin and locations were not possible to define, as they were recorded only by a single seismic instrument. The frequency band of such events was 120–180 Hz, which corresponds to the seismo-acoustic emission phenomenon – namely, forming microcracks in the ground accompanied by a release of microseismic energy (Goodman and Blake, 1965; Cadman et al., 1967). During massive microcracking, such events appear as swarms, in which signals of individual events often overlap. The individual events in tremors usually look like impulses with a duration of about 0.5–0.8 s. As these events are not strong, only surface waves can be recognized in seismograms (Fig. 9). However, it is not possible to use the same algorithm for tremor detection and locating as with frost quakes because the tremors have no clear signal onset.

Figure 9(a) An example of tremor swarm in the frequency band of 120–180 Hz, recorded by our seismic arrays. Red lines indicate a single tremor signal recorded by a single array station. (b) Particle motion diagrams of a typical tremor showing elliptical polarization.
To detect tremors from continuous seismic recordings and calculate their source locations, we used an algorithm shown in Fig. 10. The detection of tremors in this algorithm is based on cross-correlation of seismograms in time domain (interferometry) (Afonin, 2022). The calculation of source coordinates is done using the direct grid search method (Tarantola, 1987), in which the coordinates of the trial source with minimum misfit between theoretical and measured travel times are considered the true coordinates of the source.
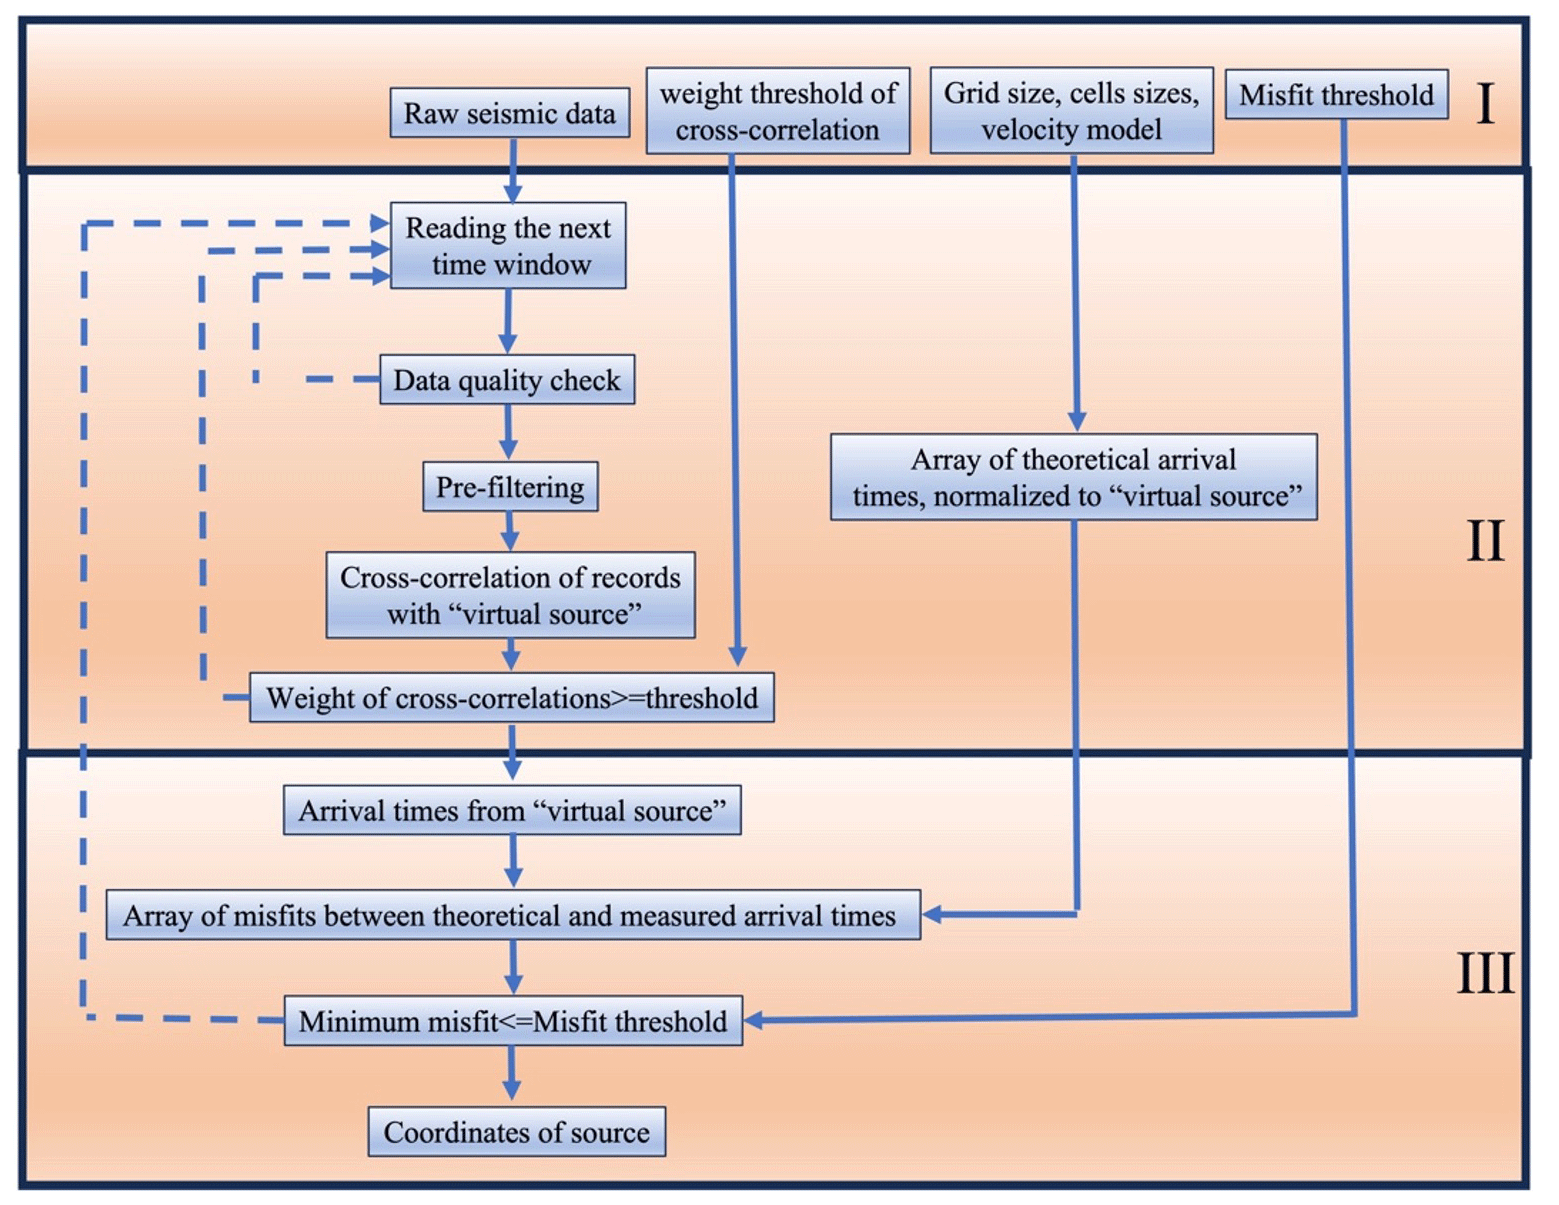
Figure 10Block scheme of the detection and location algorithm: I – setting the processing parameters and loading input data in miniSEED format, II – processing of seismograms, III – source locating.
The algorithm includes three stages:
-
Setting processing parameters and uploading input data. In this stage, the raw data recorded by all stations of the array for the considered time window are uploaded and the input parameters are set. The input parameters are (1) the weight threshold of cross-correlation, the minimum average cross-correlation coefficient of seismic records that initiated the next steps of data processing; (2) the grid size (the number of cells in the grid), where each grid point is considered the potential source location in direct search algorithm; (3) the cell size – a step (in metres) in the direct search algorithm; (4) the velocity model of the ground, for calculating theoretical travel times between the possible source location and seismic receiver; and (5) the misfit threshold (the value of misfit between theoretical and measured travel times).
In the case of low data quality, as well as of low weight of cross-correlations, the algorithm does not initiate the third stage and proceeds to the beginning to read the next time window.
-
Processing of seismograms. This stage includes reading the data for the considered time window, checking the data quality, prefiltering the data with a bandpass filter, and calculation of cross-correlation functions between the seismogram of the selected virtual source (that is, one of the receivers of an array) and the other seismograms, recorded by all other receivers in the array. The weight of cross-correlation is calculated as an average of the maximum values of all cross-correlation functions. If this value is lower than the threshold, then several new virtual sources are tested. This is necessary to exclude the effect of rejection of an event because of the low quality of the virtual-source seismic record. In the case when the obtained weight is larger than the threshold, the algorithm initiates the next stage of processing. At the same time, an array of theoretical travel times from all grid points to the virtual-source position are calculated and normalized as
where Sij is slowness along the radius vector, rij (Fig. 11).
-
Source location.
This stage calculates an array of misfits between theoretical travel times for each grid point and measured arrival times. In our study, we calculate the misfit between observed and calculated travel times as (Fig. 11)
where i is a grid point index; j is the receiver index; dobs is a vector of observed travel times; and is a vector of calculated travel times from source, located at ith grid point.
After this, we find the grid point index that corresponds to the minimum misfit as
The minimum misfit, , is compared with the misfit threshold, σthresh, and if σk≤σthresh, the grid point with index k is considered the true source position and coordinates (xk,yk) as the true source coordinates. Otherwise, the tremor is considered a result of the detection error.
The following inputs were used in the algorithm. Assuming the signals at these frequencies and energies usually attenuate very quickly, we considered an area of 1 × 1 km around the virtual source that was usually the centre sensor of the array. A vector pointing to this sensor from a grid point with coordinates xi and yi is ri0 (Fig. 11). The grid cell size (in our case 25 × 25 m) corresponds to the source size that was estimated from the frequency band of the target signal. Because we only have a 1-D velocity model for both sites, we assumed a homogeneous near-surface structure. As a cross-correlation weight threshold, we used the value of 0.65. The misfit threshold was selected to equal 10 % difference. The length of input time windows was 0.8 s, and the maximum time lag of the cross-correlation function was 0.3 s. We used time windows with an overlap equal to 10 % of their length when the weight was lower than the threshold and 0 % otherwise. This approach avoided the double detection of the same event.
Such parameters of cross-correlation were selected taking into account the possible duration of tremor signals and the near-surface velocity model.
Applying this algorithm to the data recorded on 6 January 2023 at both sites, we detected and located 419 tremors in Talvikangas and 217 in Tähtelä. For these events, we also calculated the density, that is, the number of events per grid cell raster (Fig. 12).
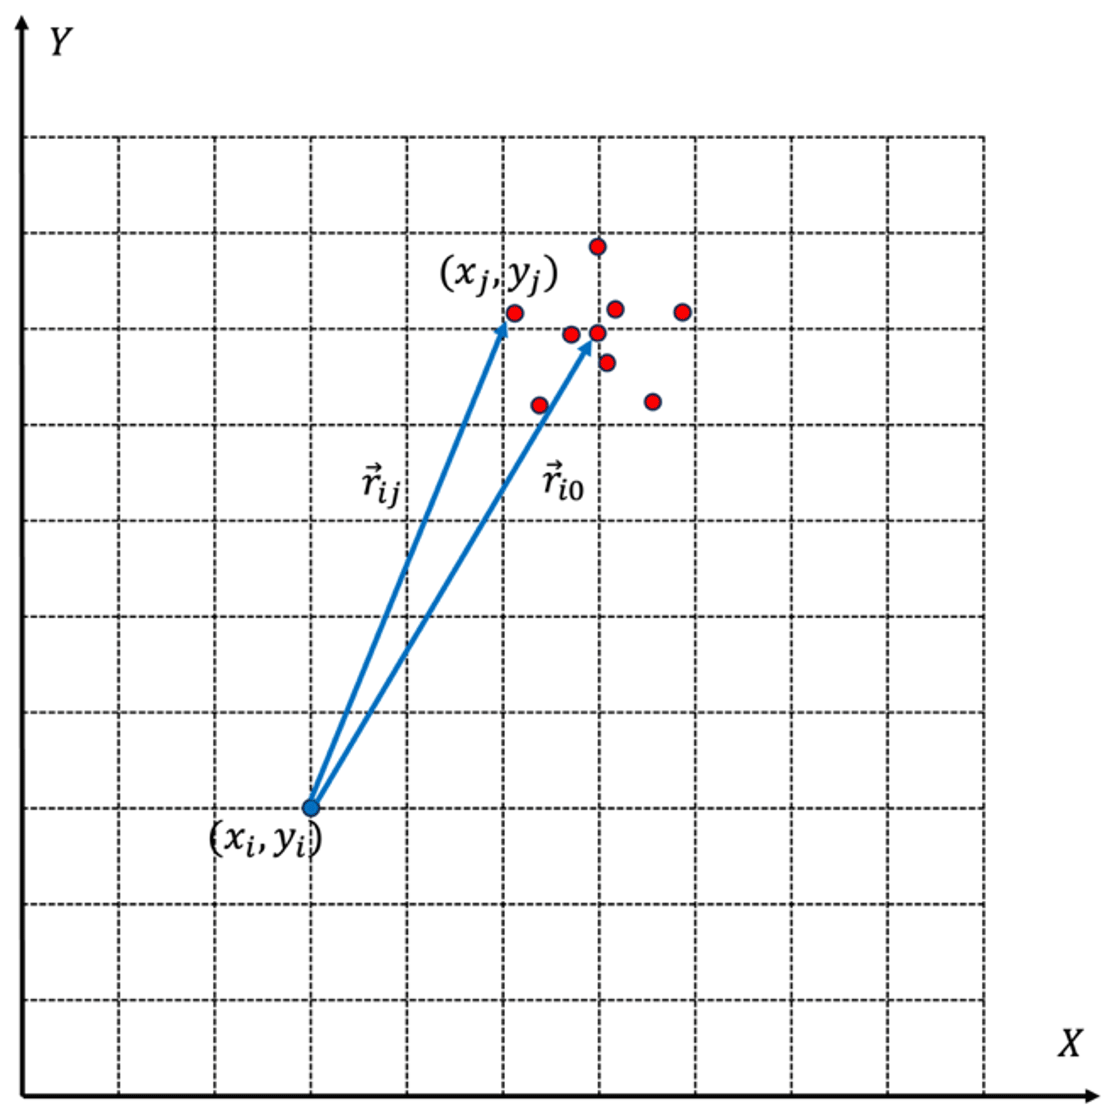
Figure 11Geometry illustrating the direct search location algorithm: the blue dot shows the source position being tested and the red dots show the locations of the seismic sensors.
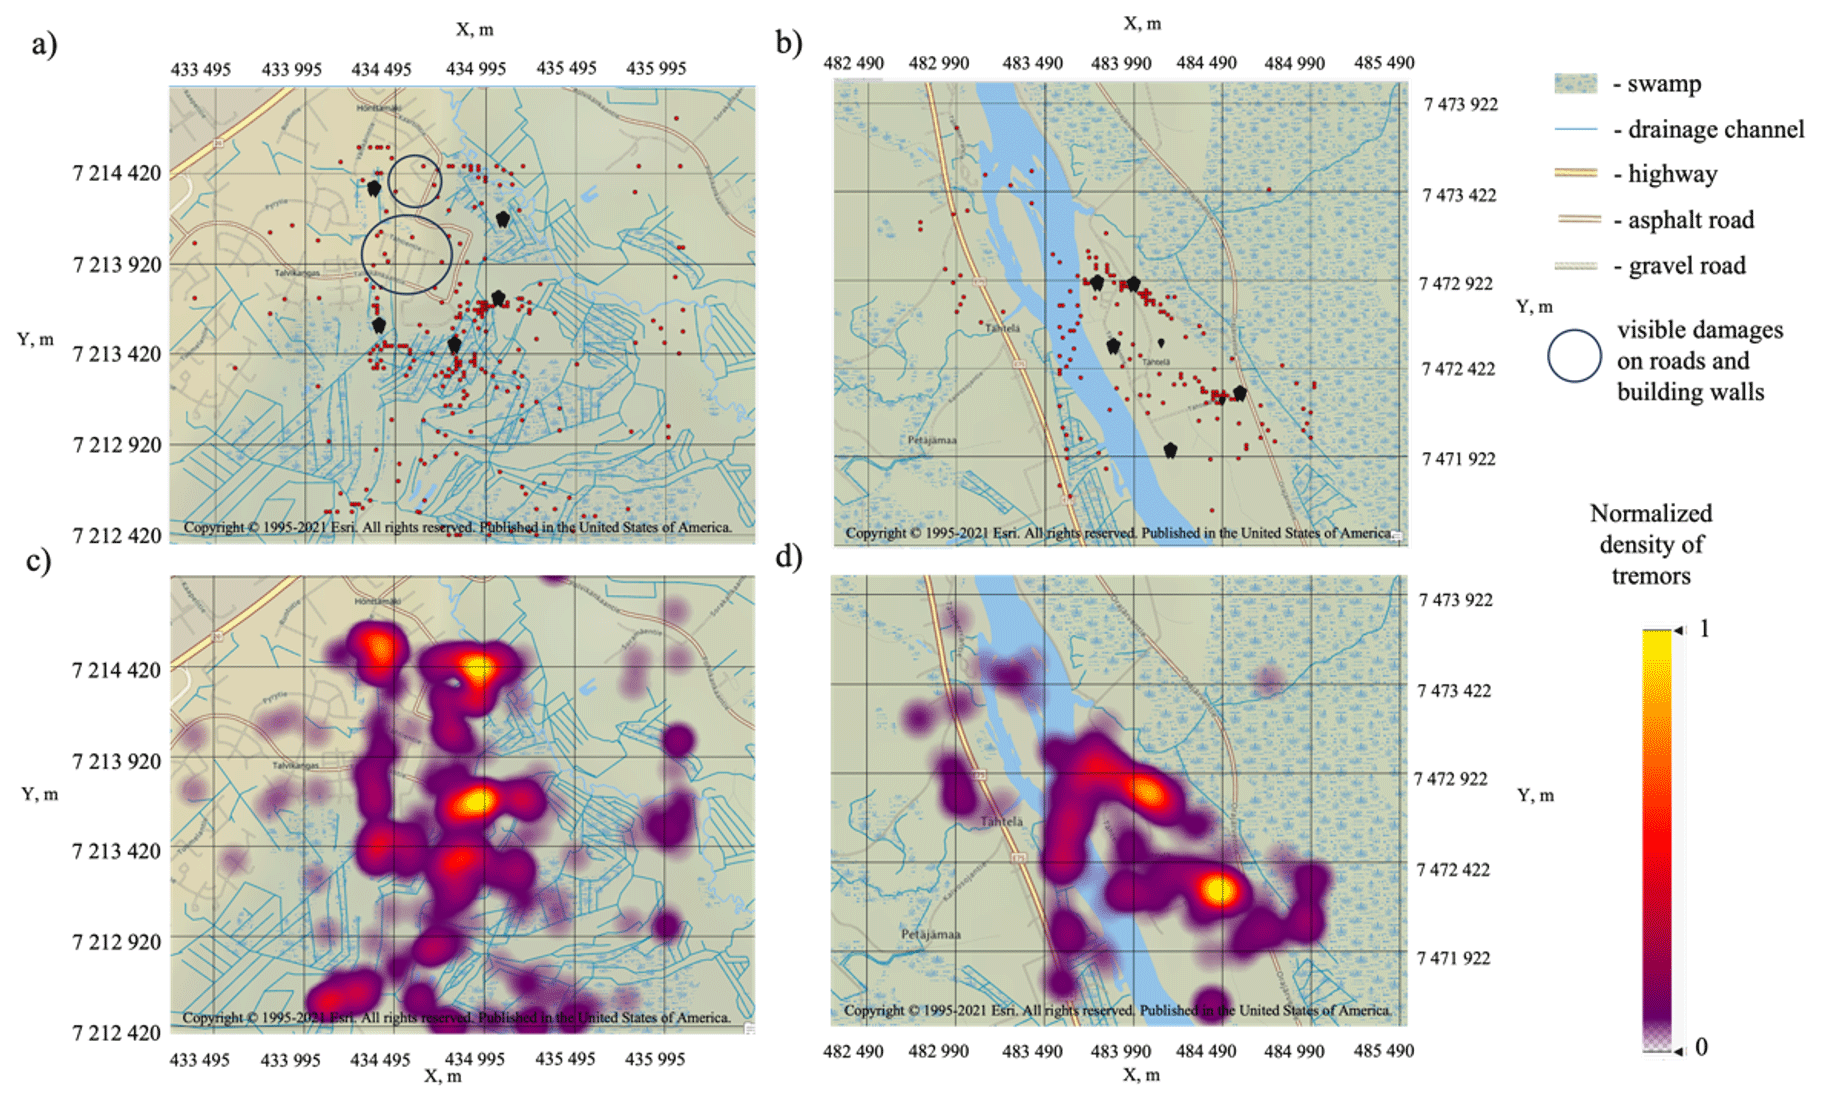
Figure 12Distribution of tremor sources on the map (red dots – sources of tremors, black dots – short-period seismic stations): source positions (a) in Talvikangas and (b) in Tähtelä. Density of sources (number of sources per 25 × 25 m cell), normalized to their maximum for the area considered: (c) Talvikangas, (d) Tähtelä.
In Talvikangas, our results were partially confirmed by reports of local people about fractures on the roads that they noticed after the events on 6 January 2023. The tremors corresponding to these visible fractures coincided with some of the epicentres (Fig. 12). A significant number of tremor sources are located in the wetland areas around Talvikangas. In Tähtelä, a lot of tremor sources are on the river ice. The areas with the highest density of tremor sources do not correspond to the largest wetland in the east, although some tremors were also located there. Some of the sources are located in the wetland near the highway, cut by irrigation channels, and also the roads that are kept clear of snow during winter.
In our study, we report weak seismic events induced by certain winter weather conditions in Arctic and sub-Arctic areas – namely, frost quakes and frost tremors – that are usually not considered in traditional seismology. These events occur as swarms due to massive fracturing in the shallow subsurface layer – that is, inside the CZ. At the Talvikangas site, we detected 11 frost quakes, which mostly originated from irrigated wetland. At the Tähtelä site, we detected and located 34 frost quakes, with about half of them with origins in river ice, but some of them also occurred in the wetland area. We also detected and located sources of high-frequency (120–180 Hz) frost tremors in both study sites. A significant number of tremors originated from wetland areas around Talvikangas, while a lot of sources were on river ice in Tähtelä. Some sources of tremors in Talvikangas are confined to roads or located close to buildings, and some of these locations were confirmed by local inhabitants, who heard cracking noises and noticed new cracks in the roads.
Polarization features of some tremors in the current study do not agree with our previous assumption about dominant horizontal polarization of signals from frost events. In Fig. 9, one can notice a vertical polarization of the signal corresponding to a single tremor event in a swarm. One needs to remember, however, that in Fig. 3, we show a general trend in HVSR during a long time period, while in Fig. 9, we show polarization of a single frost tremor from the swarm composed of overlapping events. In that particular case, the vertical polarization can be explained by the origin of this event being in the near-field zone because the source of this particular event was close to the station (less than 300 m). Such polarization in the near-field zone is in agreement with the evaluation of the radiation pattern from the surface tensile fracture opening in ice (Dudko, 1999).
The observed HVSR maxima at high frequencies in Fig. 3 could be these values because the HVSR was calculated from overlapping signals from multiple sources arriving to the station from different distances. In addition, the explanation proposed in Dal Moro (2020) that the HVSR is increased due to the magnifying effect of a thin, shallow, stiff frozen layer and the appearance of higher-mode Love waves cannot be excluded.
Our results suggest that the events swarms were initiated by regional-scale processes in the atmosphere that resulted in rapid air temperature drop to −20 °C in Talvikangas and to −30 °C in Tähtelä on 6 January 2023. In Talvikangas, the air temperature dropped from −9.6 to −21 °C in 8 h, which corresponds to −1.4 °C h−1 on average. In Sodankylä, the air temperature dropped from −9.1 to −34 °C in 28 h, which corresponds to −0.88 °C h−1 on average. Noticeably, the temperature did not reach extreme cold values for Arctic and sub-Arctic regions. According to observations of the air temperatures in Finland by the Finnish Meteorological Institute (FMI), the coldest temperature of −51.5 °C was recorded in Finland during winter 1999 in Kittilä, which is located approximately at the same latitude as Sodankylä (Finnish Meterorological Institute Open Data, Weather Observations, 2023). In Talvikangas, on 6 January 2016 (Okkonen et al., 2020), a similar rapid air temperature decrease to −20 °C was observed. A similar temperature phenomenon occurred in January 2021, resulting in the fracturing of roads around the city of Oulu (including Talvikangas), which was reported on social networks by local people. A common feature is that all three episodes of massive fracturing in Talvikangas, in January 2016, 2021, and 2023, and the one in Tähtelä in January 2023 occurred when the stable negative ground temperature was reached by the end of the seasonal freezing period. However, the main factor that initiated the fracturing appears to be namely the rapid air temperature decrease but not necessarily to the extremely low values (Fig. 13).
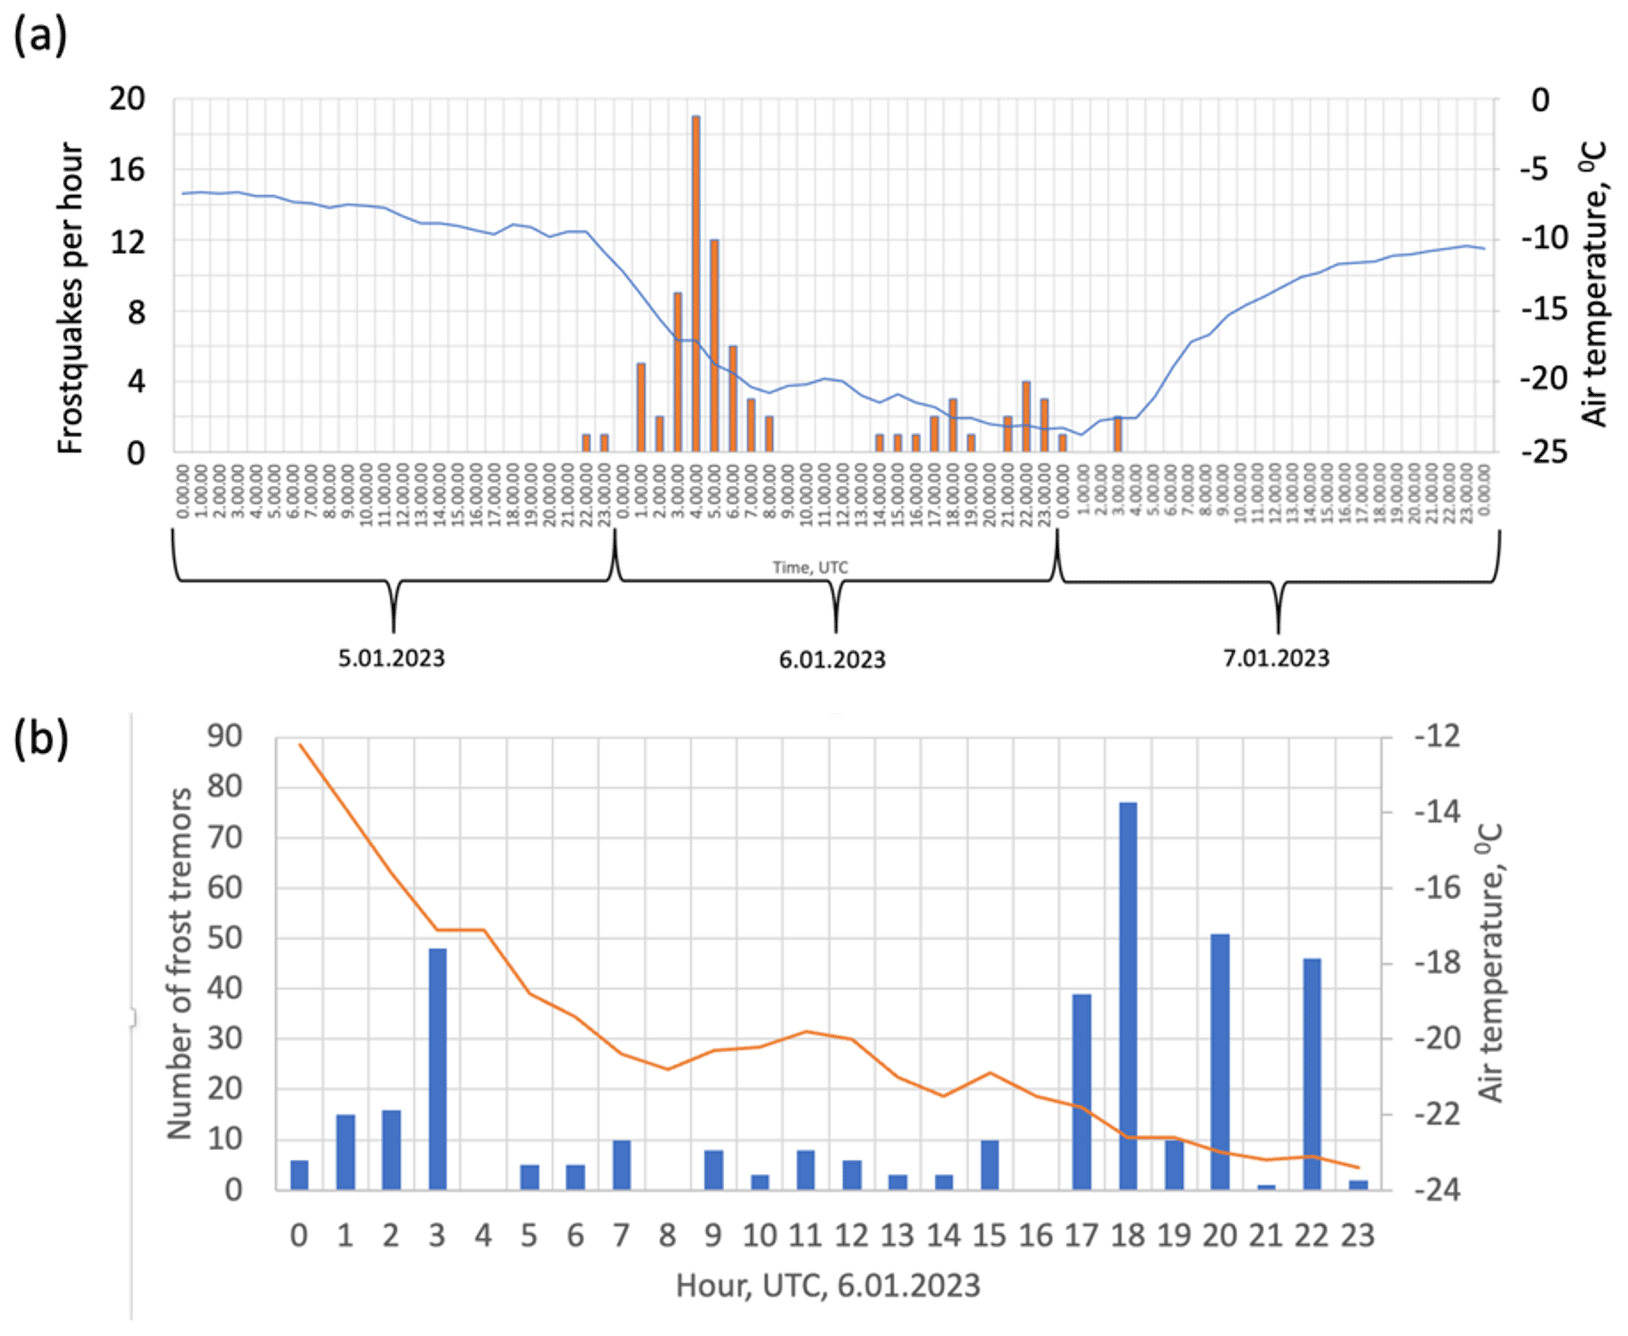
Figure 13Number of seismic events per hour, recorded by the seismic array in Talvikangas on 5–7 January 2023: (a) frost quakes, (b) frost tremors.
This factor can be characterized by the value of the air temperature time derivative (cooling rate). The similar relationship between rapid air temperature decreases and initiation of massive fracturing in ice wedges in permafrost in Spitsbergen was also noticed by O'Neill and Christiansen (2018). They observed that the fracturing in ice wedges occurs when the ground surface cools rapidly due to air cooling, at a rate of about −0.8 °C h−1, which is similar to the cooling rates observed in our study.
Information from local inhabitants in Talvikangas demonstrated that the frost quakes and tremors occurred during the same day when damage to roads and buildings was also noticed. Thus, it is important to qualitatively evaluate the possible hazard due to these events. This problem is not considered in traditional earthquake seismology that deals mainly with tectonic and induced earthquakes and their hazard. One of the main parameters used to access the seismic hazard in seismology is event magnitude that is usually evaluated from far-field seismic recordings. As the frost quakes have sources of smaller size, they could be studied using near-field instrumental recordings only. For the evaluation of the seismic hazard caused by these events, we calculated peak ground accelerations and peak ground velocities of the strongest frost quake recorded in Talvikangas and strongest frost tremors both in Talvikangas and Tähtelä and compared them to the corresponding parameters of local earthquakes in Finland, underground production blasts in Malmberget mine (Sweden), vibrations near the railroad, and some large events recorded at teleseismic distances (Table 1).
Table 1Ground velocities and ground accelerations, produced by different seismic events.

The amplitudes of both vertical and horizontal ground acceleration of the strongest frost quake are quite large, as they are amplified due to propagation inside the sedimentary layer. According to the Modified Mercalli intensity scale by the United States Geological Survey (Wald at el., 1999), the ground velocities of the frost quake in Talvikangas located at a distance of 300 m from buildings and roads correspond to class II–III (weak perceived shaking without potential damage). However, the ground accelerations produced by the considered frost quake correspond to class V (moderate perceived shaking with very light potential damage), which agrees with the evidence of local inhabitants. As seen in Fig. 7, the largest amplitude of ground acceleration produced by the strongest frost quake is at frequencies of about 10 Hz, which is similar to the natural frequency of one-storey buildings defined by the empirical rule of thumb (FEMA, 1998). This, in our opinion, explains appearance of fractures in foundations of some buildings in Talvikangas.
The strongest frost quake in Talvikangas produced vertical and horizontal ground accelerations that are 2 orders larger than the accelerations produced by regional earthquakes and about 10 times larger than amplitude of vibrations from a cargo train moving along the railroad located at the distance of 20 m. An interesting observation is that horizontal and vertical accelerations from high-frequency frost tremors located at distances of 50–250 m are comparable with those produced by a cargo train. However, the frequencies of tremors are significantly higher than the frequencies of vibrations produced by the cargo trains.
The ground velocities produced by the strongest frost quake and registered at the distance of 300 m from the source are comparable with the velocities recorded at a similar distance from a production blast in Malmgerget underground mine in Sweden. Moreover, the frequencies of Rayleigh waves in both cases are similar. As shown in Zhang (2012), such a level of ground shaking was a source of concern for local inhabitants and required taking special measures (change in blasting technology) to decrease it. The ground velocities and ground accelerations produced by frost tremors are small; however, their appearance is the evidence of massive fracturing in the uppermost layer of frozen water-saturated soils and wetlands that are the part of the CZ.
One interesting result of our study is the detection of unusual types of seismic events – namely frost quakes and frost tremors – originating from wetlands (Figs. 7 and 12). To our knowledge, instrumental observations of such events have not been reported previously. These events occurred mainly in irrigated wetlands cut by drainage channels. After autumn seasons, these channels are filled with water that is frozen during winter and hence prone to fracturing. Such frozen channels in wetlands are comparable in size and in depth, with ice wedges in permafrost areas. These wedges may experience massive fracturing related to rapid air temperature cooling (O'Neill and Christiansen, 2018). This similarity may also explain fracturing in irrigated wetland revealed by our study, as it occurred during a time interval with similar weather conditions. The origin of other events from non-irrigated wetland areas could be related to other natural structures capable of accumulating water, like marshes.
Our study shows that seismic events in wetlands in Arctic and sub-Arctic areas are capable of producing ground motions strong enough to damage the infrastructure, like roads and basements of buildings, located at distances of several hundreds of metres from wetlands. In Arctic and sub-Arctic wetlands, fracturing can also cause mechanical damage to vegetation (roots and collars of trees) and create conditions for increasing greenhouse gas emission during wintertime. That is why this phenomenon deserves further studies.
The main results of our study can be formulated as follows:
-
The seismic experiment in northern Finland recorded continuous seismic and soil temperature data during November 2022–April 2023. The equipment was installed at two sites – namely, the urban Talvikangas area in the city of Oulu (65.04° N, 25.61° E) and the rural Tähtelä area in Sodankylä municipality (67.36° N, 26.63° E). The study revealed seismic events (frost quakes) originating from the shallow subsurface that is associated with the critical zone of the Earth.
-
The detailed study of frost quake swarms recorded at two experiment sites on 6 January 2023 showed that these swarms occurred at the end of the period of seasonal freezing, when the stable negative ground temperature was established in the uppermost part of water-saturated soil. On the same day, the inhabitants in Talvikangas felt the ground shaking and observed new fractures in the roads there.
-
The analysis of continuous seismic data recorded on 6 January 2023 at both sites allowed for the identification and locating of two types of seismic events – namely, frost quakes with frequencies of about 10–20 Hz – with waveforms like those of tectonic events and irregularly shaped frost tremors with frequencies of about 120–180 Hz.
-
The frost quake sources in Talvikangas are mainly located on irrigated wetland cut by drainage channels, while in Tähtelä, about 50 % of recorded frost quakes were caused by ice fracturing on Kitinen River. However, several relatively strong events which originated both in irrigated and non-irrigated wetlands were also recorded there.
-
A significant number of sources of frost tremors are also confined to irrigated wetland areas and to roads cleaned from snow during winter, both in Talvikangas and in Tähtelä. In Tähtelä, a lot of tremors originated also from river ice.
-
The ground accelerations and ground velocities calculated for surface waves produced by the strongest frost quakes and recorded at epicentral distances of hundreds of metres from the source are noticeably large. Approximately, they correspond to class V and class II–III of the Modified Mercalli intensity scale, respectively.
-
The high-frequency frost tremors corresponding to surface fracture opening in the uppermost frozen surface layer can directly damage infrastructure objects like roads and basements of buildings, which is confirmed by evidence of local inhabitants in Talvikangas.
-
Our study shows that frost quakes and frost tremors that occur in the CZ during periods of seasonal freezing should be considered phenomena that can potentially damage infrastructures. This has to be taken into account in seismic hazard assessments.
Our research is the first instrumental study of seismic events which originate from wetland areas. It shows that these events can occur as a result of the interaction between the uppermost layer of the solid Earth's CZ and atmosphere processes that deserves further study.
The code and data set are available by request via e-mail at nikita.afonin@oulu.fi.
NA took part in planning experiment, developed the algorithm for detecting tremors from continuous seismic recordings and calculating their source locations, processed seismic data, and took part in the interpretation of results and paper preparation. EK is a PI of the ADAPTINFA project; she proposed the idea of the research and took part in planning the experiments, interpreting the results, and writing the paper text. KM took part in project fieldwork planning, organizing, implementation, data handling and paper writing. JO is a co-PI of the ADAPTINFA project that took part in the planning of the experiment, fieldwork, and discussion of results. ERK took part in planning the experiment and fieldwork.
The contact author has declared that none of the authors has any competing interests.
Publisher’s note: Copernicus Publications remains neutral with regard to jurisdictional claims made in the text, published maps, institutional affiliations, or any other geographical representation in this paper. While Copernicus Publications makes every effort to include appropriate place names, the final responsibility lies with the authors.
This study is a part of the ADAPTINFA (Urban Environment and Climate Change in the Arctic: Data-driven Intelligence Approach to Multihazard Mitigation) project funded by the Research Council of Finland in 2022–2024. Authors are very grateful to the Sodankylä Geophysical Observatory (SGO) for providing the area for the seismic experiment and assistance in conducting the measurements. The assistance of the SGO staff members Jyrki Manninen, Tero Raita, Toivo Iinatti, and Alexander Kozlovsky is highly appreciated. We are also very thankful to people from Talvikangas for sharing information about their observations of the macro effects of frost quakes on 6 January 2023. The equipment of the FLEX-EPOS Finnish national pool of mobile seismic instruments was used in recordings. The staff of the Institute of Seismology of the University of Helsinki assisted greatly with raw data processing and logistics during field campaign.
This research has been supported by the Research Council of Finland (grant no. 348802).
This paper was edited by Adam Booth and reviewed by David Oakley and one anonymous referee.
Afonin, N.: Development of passive seismic interferometry to study shallow subsurface structure, University of Oulu, Oulu, https://urn.fi/URN:ISBN:9789526234632 (last access: 23 May 2023), 2022.
Afonin, N. and Kozlovskaya, E.: Development of events detector for monitoring cryoseisms in upper soils. In: XXIX Geofysiikan päivät: Rovaniemellä, 21–22, Abstract Book, https://urn.fi/URN:NBN:fi-fe202003208608 (last access: 9 August 2023), 2019
Antonovskaya, G. N., Afonin, N. Y., Basakina, I. M., Kapustian, N. K., Basakin, B. G., and Danilov, A. V.: Possibilities of seismic methods for estimation of railway subgrade state in conditions of Far North, Transportation Systems and Technology, 3, 133–161, 2017.
Battaglia S. M. and Changnon D.: Frost quake events and changing wintertime air mass frequencies in Southeastern Canada. Working paper, Northern Illinois University, 12 pp., https://doi.org/10.13140/RG.2.2.22351.48803, 2016.
Brantley S. L., Coldhaber M. B., and Ragnarsdottir K. V.: Crossing disciplines and scales to understand the critical zone, Elements, 3, 307–314, https://doi.org/10.2113/gselements.3.5.307, 2007.
Cadman, J. D. and Goodman, R. E.: Landslide noise, Science, 158, 1182–1184, 1967.
Canada Committee on Ecological (Biophysical) Land Classification, National Wetlands Working Group, Warner, B. G., and Rubec, C. D. A.: The Canadian wetland classification system, Wetlands Research Branch, University of Waterloo, Waterloo, Ont., ISBN: 0-662-25857-6, 1997.
Dal Moro, G.: The magnifying effect of a thin shallow stiff layer on Love waves as revealed by multi-component analysis of surface waves, Scientific Reports, 10, 9071, https://doi.org/10.1038/s41598-020-66070-1, 2020.
Dortman, N. B.: Handbook Petrophysics, Nedra, Moscow, 390 pp., ISBN 5-247-01898-2, 1992.
Dudko Y. V.: Analysis of seismo-acoustic emission from ice fracturing events during SIMI'94, Massachusetts Institute of Technology, Massachusetts, https://dspace.mit.edu (last access: 16 March 2024), 1999.
Federal Emergency Management Agency (FEMA): 310-Handbook for seismic evaluation of buildings – A pre-standard, https://www.asce.org (last access: 10 August 2023), 1998.
Finnish Meterorological Institute Open Data, Weather Observations: Iämpimin ja kylmin paikka vuosittain ilmatieteen laitos, https://www.ilmatieteenlaitos.fi/lampimin-ja-kylmin-paikka-vuosittain, last access: 28 April 2023 (in Finnish).
Giardino, J. and Houser, C.: Introduction to the Critical Zone. In: Developments in Earths Surface Processes, 19, 1–13, https://doi.org/10.1016/B978-0-444-63369-9.00001-X, 2015.
Goodman, R. and Blake, W.: An investigation of rock noise in land-slides and cut slopes, Rock Mechanics and Engineering Geology, 2, 88–93, 1965.
GTK: Hakku – Portti Suomen geologiseen tutkimuskeskus, https://hakku.gtk.fi, last access: 15 February 2023.
Institute of Seismology, University of Helsinki: Seismologian instituutti. Helsingin Yliopisto, http://www.seismo.helsinki.fi, last access: 15 February 2023.
IPCC: IPCC Sixth Assessment Report, https://www.ipcc.ch/report/ar6/wg2/downloads/report/IPCC_AR6_WGII_FullReport.pdf (last access: 10 August 2023), 2022.
Leung A. C. W., Gough W. A., and Shi Y.: Identifying frost quakes in central Canada and neighboring regions in the United States with social media, in: Citizen Empowered Mapping, Springer, 201–222, https://doi.org/10.1007/978-3-319-51629-5_9, 2017.
Kuhn, M. A., Varner, R. K., Bastviken, D., Crill, P., MacIntyre, S., Turetsky, M., Walter Anthony, K., McGuire, A. D., and Olefeldt, D.: BAWLD-CH4: a comprehensive dataset of methane fluxes from boreal and arctic ecosystems, Earth Syst. Sci. Data, 13, 5151–5189, https://doi.org/10.5194/essd-13-5151-2021, 2021.
Kuhn, M. A., Varner, R. K., Bastviken, D., Crill, P., MacIntyre, S., Turetsky, M., Walter Anthony, K., McGuire, A. D., and Olefeldt, D.: BAWLD-CH4: a comprehensive dataset of methane fluxes from boreal and arctic ecosystems, Earth Syst. Sci. Data, 13, 5151–5189, https://doi.org/10.5194/essd-13-5151-2021, 2021.
Okkonen, J., Neupauer, R. M., Kozlovskaya, E., Afonin, N., Moisio, K., Taewook, K., and Muurinen, E.: Frost quakes: Crack formation by thermal stress. J. Geophys. Res.-Earth, 125, e2020JF005616, https://doi.org/10.1029/2020JF005616, 2020.
O'Neill, H. B. and Christiansen, H. H.: Detection of ice wedge cracking in permafrost using miniature accelerometers, J. Geophys. Res.-Earth, 123, 642–657, https://doi.org/10.1002/2017JF004343, 2018.
Parsekian, A. D., Singha, K., Minsley, B. J., Holbrook, W. S., and Slater L.: Multiscale geophysical imaging of the critical zone, Rev. Geophys., 53, 1–26, https://doi.org/10.1002/2014RG000465, 2015
Pavlenko, O. and Kozlovskaya, E.: Characteristics of radiation and propagation of seismic waves in Northern Finland, estimated based on records of local earthquakes, Pure Appl. Geophys., 175, 4197–4223, 2018.
Rankinen, K., Karvonen, T., and Butterfield, D.: A simple model for predicting soil temperature in snow-covered and seasonally frozen soil: model description and testing, Hydrol. Earth Syst. Sci., 8, 706–716, https://doi.org/10.5194/hess-8-706-2004, 2004.
Santulin, M., Sandron, D., Tamaro, A., Rebez, A., Mucciarelli, M., and Slejko, D.: Vertical ground motions in the near field, in: Second European Conference of Earthquake Engineering and Seismology, Istanbul, Turkey, 24–29 August 2014, 2014.
Schweitzer, J., Fyen, J., Mykkeltveit, S., Gibbons, S. J., Pirli, M., Kühn, D., and Kværna, T.: Seismic arrays, in: New manual of seismological observatory practice 2 (NMSOP-2), Deutsches GeoForschungsZentrum GFZ, 1–80, https://doi.org/10.2312/GFZ.NMSOP-2_ch9, 2012.
Steinmann, R., Hadziioannou, C., and Larose, E.: Effect of centimetric freezing of the near subsurface on Rayleigh and Love wave velocity in ambient seismic noise correlations, Geophys. J. Int., 224, 626–636, https://doi.org/10.1093/gji/ggaa406, 2020.
Tarantola, A.: Inverse problem theory and methods for model parameter estimation, Elsevier, Amsterdam-Oxford-New York-Tokyo, ISBN 0-444-42765-1, 1987.
Wald, D. J., Quitoriano, V., Heaton, T. H., and Kanamori, H.: Relationships between Peak Ground Acceleration, Peak Ground Velocity, and Modified Mercalli Intensity in California, Earthq. Spectra, 15, 557–564, https://doi.org/10.1193/1.1586058, 1999.
Weatherbase.com: Travel Weather Averages, http://www.weatherbase.com, last access: 20 June 2023.
Zhang, Z. X.: Controlling vibrations caused by underground blasts in Lkab Malmberget mine, Blasting and Fragmentation, 6, 63–71, 2012.