the Creative Commons Attribution 4.0 License.
the Creative Commons Attribution 4.0 License.
 | 06 Jan 2026
The coupling between hydrology, the development of the active layer and the chemical signature of surface water in a periglacial catchment in West Greenland
Johan Rydberg
Emma Lindborg
Christian Bonde
Benjamin M. C. Fischer
Tobias Lindborg
Ylva Sjöberg
An important factor for controlling the chemical signature of surface water is the interactions with soil particles and groundwater. In permafrost landscapes, ground ice restricts groundwater flow, which implies a limited influence of processes such as weathering on the chemical signature of the runoff. The aim of this study was to examine how freeze-thaw processes, hydrology and water age interact to shape the chemical and stable hydrogen and oxygen isotopic signature of surface water in a catchment in West Greenland. Measuring runoff in remote catchments is challenging, and therefore we used a validated hydrological model to estimate daily runoff over multiple years. We also applied a particle tracking simulation to determine groundwater ages and used data on stable isotopic and chemical composition from various water types – including surface water, groundwater, lake water and precipitation – spanning from early snowmelt to the end of the thawed season. Our results show that groundwater age generally is less than one year and rarely exceeds four years, total runoff is dominated by groundwater, and overland flow is restricted to the snowmelt period and after heavy rain events. Monitoring of thaw rates in the active layer indicates a rapid thawing in connection with running water, and meltwater from ground ice quickly becomes an important fraction of the runoff. Taken together, our data suggest that even in continuous permafrost landscapes with thin active layers and an absence of truly old and mobile groundwater, soil processes exert a strong influence on the chemical and stable isotopic signature of runoff, i.e., similar to what has been observed in other climatic settings.
- Article
(4378 KB) - Full-text XML
-
Supplement
(507 KB) - BibTeX
- EndNote


The water that falls as precipitation carries a signature that reflects the chemical conditions in the atmosphere. This chemical signature – or water quality – is subsequently altered as the water flows through a catchment, where it interacts with water stored in the landscape, vegetation, soil particles and bedrock (Sprenger et al., 2019). The resulting water quality not only determines the ecological and chemical status of local and downstream aquatic systems (EU, 2002), it can also shine light on hydrological pathways and biogeochemical cycling within catchments (Fischer et al., 2015; Lidman et al., 2014; Lyon et al., 2010a; Jutebring Sterte et al., 2022). Knowledge regarding the interplay between soil processes and water also helps us understand how future changes in, e.g., climate, might affect hydrological pathways and the biogeochemical cycling of elements (Frey and McClelland, 2009; Vonk et al., 2015; Winnick et al., 2017).
Water transit time in a catchment depends on several factors, including the thickness of the regolith and the size of the groundwater aquifer, and groundwater transit times range from days in the shallow layers (0–10 cm) to several hundreds of years as depth increases (Condon et al., 2020). In high latitude regions, the long and cold winters restrict the flow of water during a considerable part of the year. Instead, a large proportion of the annual precipitation is released as runoff during the short and intense snowmelt period (Bring et al., 2016; Johansson et al., 2015a). Not only is the runoff during the snowmelt period high, the presence of ground ice can also limit the interaction between the meltwater and deeper soil layers (Bosson et al., 2013; Johansson et al., 2015a). Because of this, the meltwater that reaches a stream can, at least during the initial phase of the snowmelt period, be expected to have a short transit time and mostly reflect the chemical signature of the melting snow (Chiasson-Poirier et al., 2020).
When the upper soil layers thaws, meltwater from snow can infiltrate the ground surface and interact with decomposing plant material in the organic horizon and mineral soil particles (Cai et al., 2008; Quinton and Pomeroy, 2006). The thawing of progressively deeper soil layers also enables recent snowmelt water to interact and mix with older water that was stored in the ground prior to the onset of the snowmelt period (i.e., pre-event water; Tetzlaff et al., 2018). A prerequisite for these interactions is that the ground thaws while the snowmelt period is still ongoing. This is the case in forested catchments without permafrost in the boreal region, where stream-water dissolved organic carbon (DOC) concentrations increase during the snowmelt period (Jutebring Sterte et al., 2018; Laudon et al., 2004). However, in adjacent wetland catchment where the ice-rich peat results in slower thaw rates, the limited infiltration of snowmelt water results in a decrease in DOC during the snowmelt period and shorter transit time of the water (Jutebring Sterte et al., 2018; Laudon et al., 2004; Lyon et al., 2010b).
In permafrost regions the groundwater storage can be expected to be smaller than in areas without permafrost because the upper part of the ground that thaws each summer, i.e., the active layer, constitutes a much thinner groundwater aquifer than what is common in systems without permafrost (Petrone et al., 2016). A consequence of a limited groundwater storage is that the system can become more responsive to changes in the source of the water. This can, e.g., be seen in a study of a polygonal tundra site in Alaska where there are no signs of any snowmelt water in the soil during summer (Throckmorton et al., 2016). A quick response to change is also evident in a catchment-scale study conducted in the Northwest Territories in Canada, where streamflow during the snowmelt period, when water transit times were short, was primarily governed by the input from snowmelt (Tetzlaff et al., 2018). Over the course of the summer period there was a significant increase in the contribution of water from the subsurface system and riparian zones, and water transit times progressively increased to longer than 1.5 years at the end of the summer. This suggests that, during the snowmelt period, the presence of impermeable ground ice that thaw slowly results in most of the meltwater leaving the system as overland flow or evaporation. In time, however, the thaw in the active layer activates deeper flow paths and lead to the release of older pre-event water.
Thaw rates in the active layer are therefore important for both water transit times and the chemical signature of the water, but because the thaw rates are controlled by more than air temperatures, they can be difficult to predict. On the one hand, the high latent heat of ground ice implies that more ice-rich (wetter) soils can be expected to thaw slower (Clayton et al., 2021). On the other hand, ice-rich (wet) soils have a higher thermal conductivity than dry soils and could thereby thaw quicker (Clayton et al., 2021). In addition, running water can contain considerable amounts of heat energy that could influence the thaw process (Sjöberg et al., 2016). This advective heat transfer suggests that areas in close connection to running water, could thaw faster than the typically drier areas further away from running water. The microtopography could also influence the distribution of snow, and because snow insulates the ground during winter, it can be expected that low-lying areas will have higher ground temperatures in spring (O'Connor et al., 2019). Taken together this means that it can be difficult to predict thaw rates, but that we can expect significant differences between lower lying wet areas and more elevated dry areas.
The snowmelt period is followed by a warmer summer period with less water moving through the catchment and a progressively thicker thawed layer that allows for deeper and longer groundwater flow paths. In boreal systems without permafrost, deeper flow paths and increased water age lead to a chemical signature more influenced by soil processes (e.g., weathering and decomposition of organic matter (OM); Jutebring Sterte et al., 2021a). Higher temperatures also lead to increased evaporation, which concentrates both elements supplied via atmospheric deposition and elements supplied through weathering and decomposition (Alvarez et al., 2015). Taken together we could expect that surface water collected during the summer, when transit times are longer, should have a very different chemical signature compared to water from the snowmelt period. However, in areas with continuous permafrost the active layer can be less than a meter even when fully developed in late summer (Petrone et al., 2016). That is, even the deepest flow paths are very shallow compared to boreal systems without permafrost (Jutebring Sterte et al., 2021b). This implies that the average age of the runoff in an area with continuous permafrost should be younger, that the flow paths should be shorter and that most of the water leaving the system should have had a more limited time to interact with the soil particles compared to boreal areas without permafrost (Tetzlaff et al., 2018). Hence, the question remains to what extent the water chemistry in areas with continuous permafrost is affected by – and reflects – processes in the catchment, or if the water leaves the system too rapidly to pick up any discernible signature from the catchment.
Knowledge regarding how the chemical signature is altered as the water moves through the catchment is essential to make reliable predictions regarding how future changes in the climate will affect biogeochemical cycling especially in Arctic areas with continuous permafrost. However, despite being located in a global climate hotspot (Rantanen et al., 2022) the processes influencing the water quantity and quality in the Arctic remain poorly understood, partly because of a declining research infrastructure (Laudon et al., 2017) and a limited availability of spatiotemporal data due to the region's remote location and extreme climatic conditions (Tetzlaff et al., 2018; Throckmorton et al., 2016). In order to better understand how flow paths, water age and chemical signatures covary over different time scales in a periglacial landscape with continuous permafrost we have used a well-studied catchment in West Greenland, i.e., the Two-Boat Lake catchment (Johansson et al., 2015b; Lindborg et al., 2016; Lindborg et al., 2020; Petrone et al., 2016; Rydberg et al., 2023; Rydberg et al., 2016). A key novelty of the present study is the coupling of field observations of water chemistry and thaw rates in the active layer with a well-constrained, distributed, hydrological model (Johansson et al., 2015a). This approach allows us to address the following specific research questions: (i) can we observe any relationship between soil wetness and the thaw rate in the active layer during the snowmelt period, (ii) does the chemical signature and stable isotopic composition of the runoff suggest that the thaw in the active layer is fast enough to allow the meltwater from snow to interact with soil particles and pre-event water during the snowmelt period, (iii) considering the dry conditions and the thin aquifer, is the interaction with soil particles large enough to alter the chemical signature of the runoff, or do our data suggest that other factors (e.g., atmospheric deposition and evapotranspiration) are more important for controlling the water quality of surface waters.
2.1 Study area
Two-Boat Lake (also referred to as SS903, lake area: 0.37 km2) and its terrestrial catchment (1.7 km2) are situated in West Greenland (Lat 67.126° Long −50.180°), about 25 km east of the settlement of Kangerlussuaq (Fig. 1). Even though the Greenland ice sheet is only about 500 m from the lake, it receives no direct input of glacial meltwater from the ice sheet (Johansson et al., 2015a). Permafrost in the Two-Boat Lake catchment is continuous and reaches down to about 400 m, except under the lake itself where a through talik has formed (Claesson Liljedahl et al., 2016). Bedrock consists mostly of tonalitic and granodioritic gneisses (van Gool et al., 1996) and is covered by till or glaciofluvial deposits that are, in turn, overlain by a layer of eolian material in the valleys (Petrone et al., 2016). The climate of this region is cold and dry, with a mean annual air temperature for the Two-Boat Lake catchment of −4.4 °C (Johansson et al., 2015b). The mean annual precipitation for the period 2011–2013 was 270 mm yr−1 (163–366 mm yr−1) with about 40 % falling as snow. The high evapotranspiration in the terrestrial part of the catchment (138–199 mm yr−1) results in a relatively low runoff to the lake (25–159 mm yr−1), of which about half is associated with the snowmelt period (Johansson et al., 2015a). There are no permanent streams or confined stream channels in the catchment. Instead, surface runoff occurs in small (typically < 0.5 m wide), temporary surface streams that are active only during high runoff situations, particularly the snowmelt period (Johansson et al., 2015a). The vegetation zone in the area can be characterised as polar tundra or steppe (Bush et al., 2017; Böcher, 1949), and the vegetation in the Two-Boat Lake catchment has been described in detail by Clarhäll (2011). Between 2010 and 2019 the catchment was the study site of the Greenland Analogue Surface Project (GRASP), which was funded by the Swedish Nuclear Fuel and Waste Management Company (SKB). During GRASP, data regarding meteorology, hydrology, Quaternary deposits, vegetation cover and active layer thickness were collected together with samples from soils, groundwater, surface- and lake water for chemical analysis. All data collected during GRASP have been thoroughly described in three publications (Johansson et al., 2015b; Lindborg et al., 2016; Petrone et al., 2016), and the data are available at https://www.pangaea.de (last access: 10 December 2025) (Table S1). For this study we have focused on a sub-catchment (0.6 km2) in the northern part of the Two-Boat Lake catchment (Fig. 1).
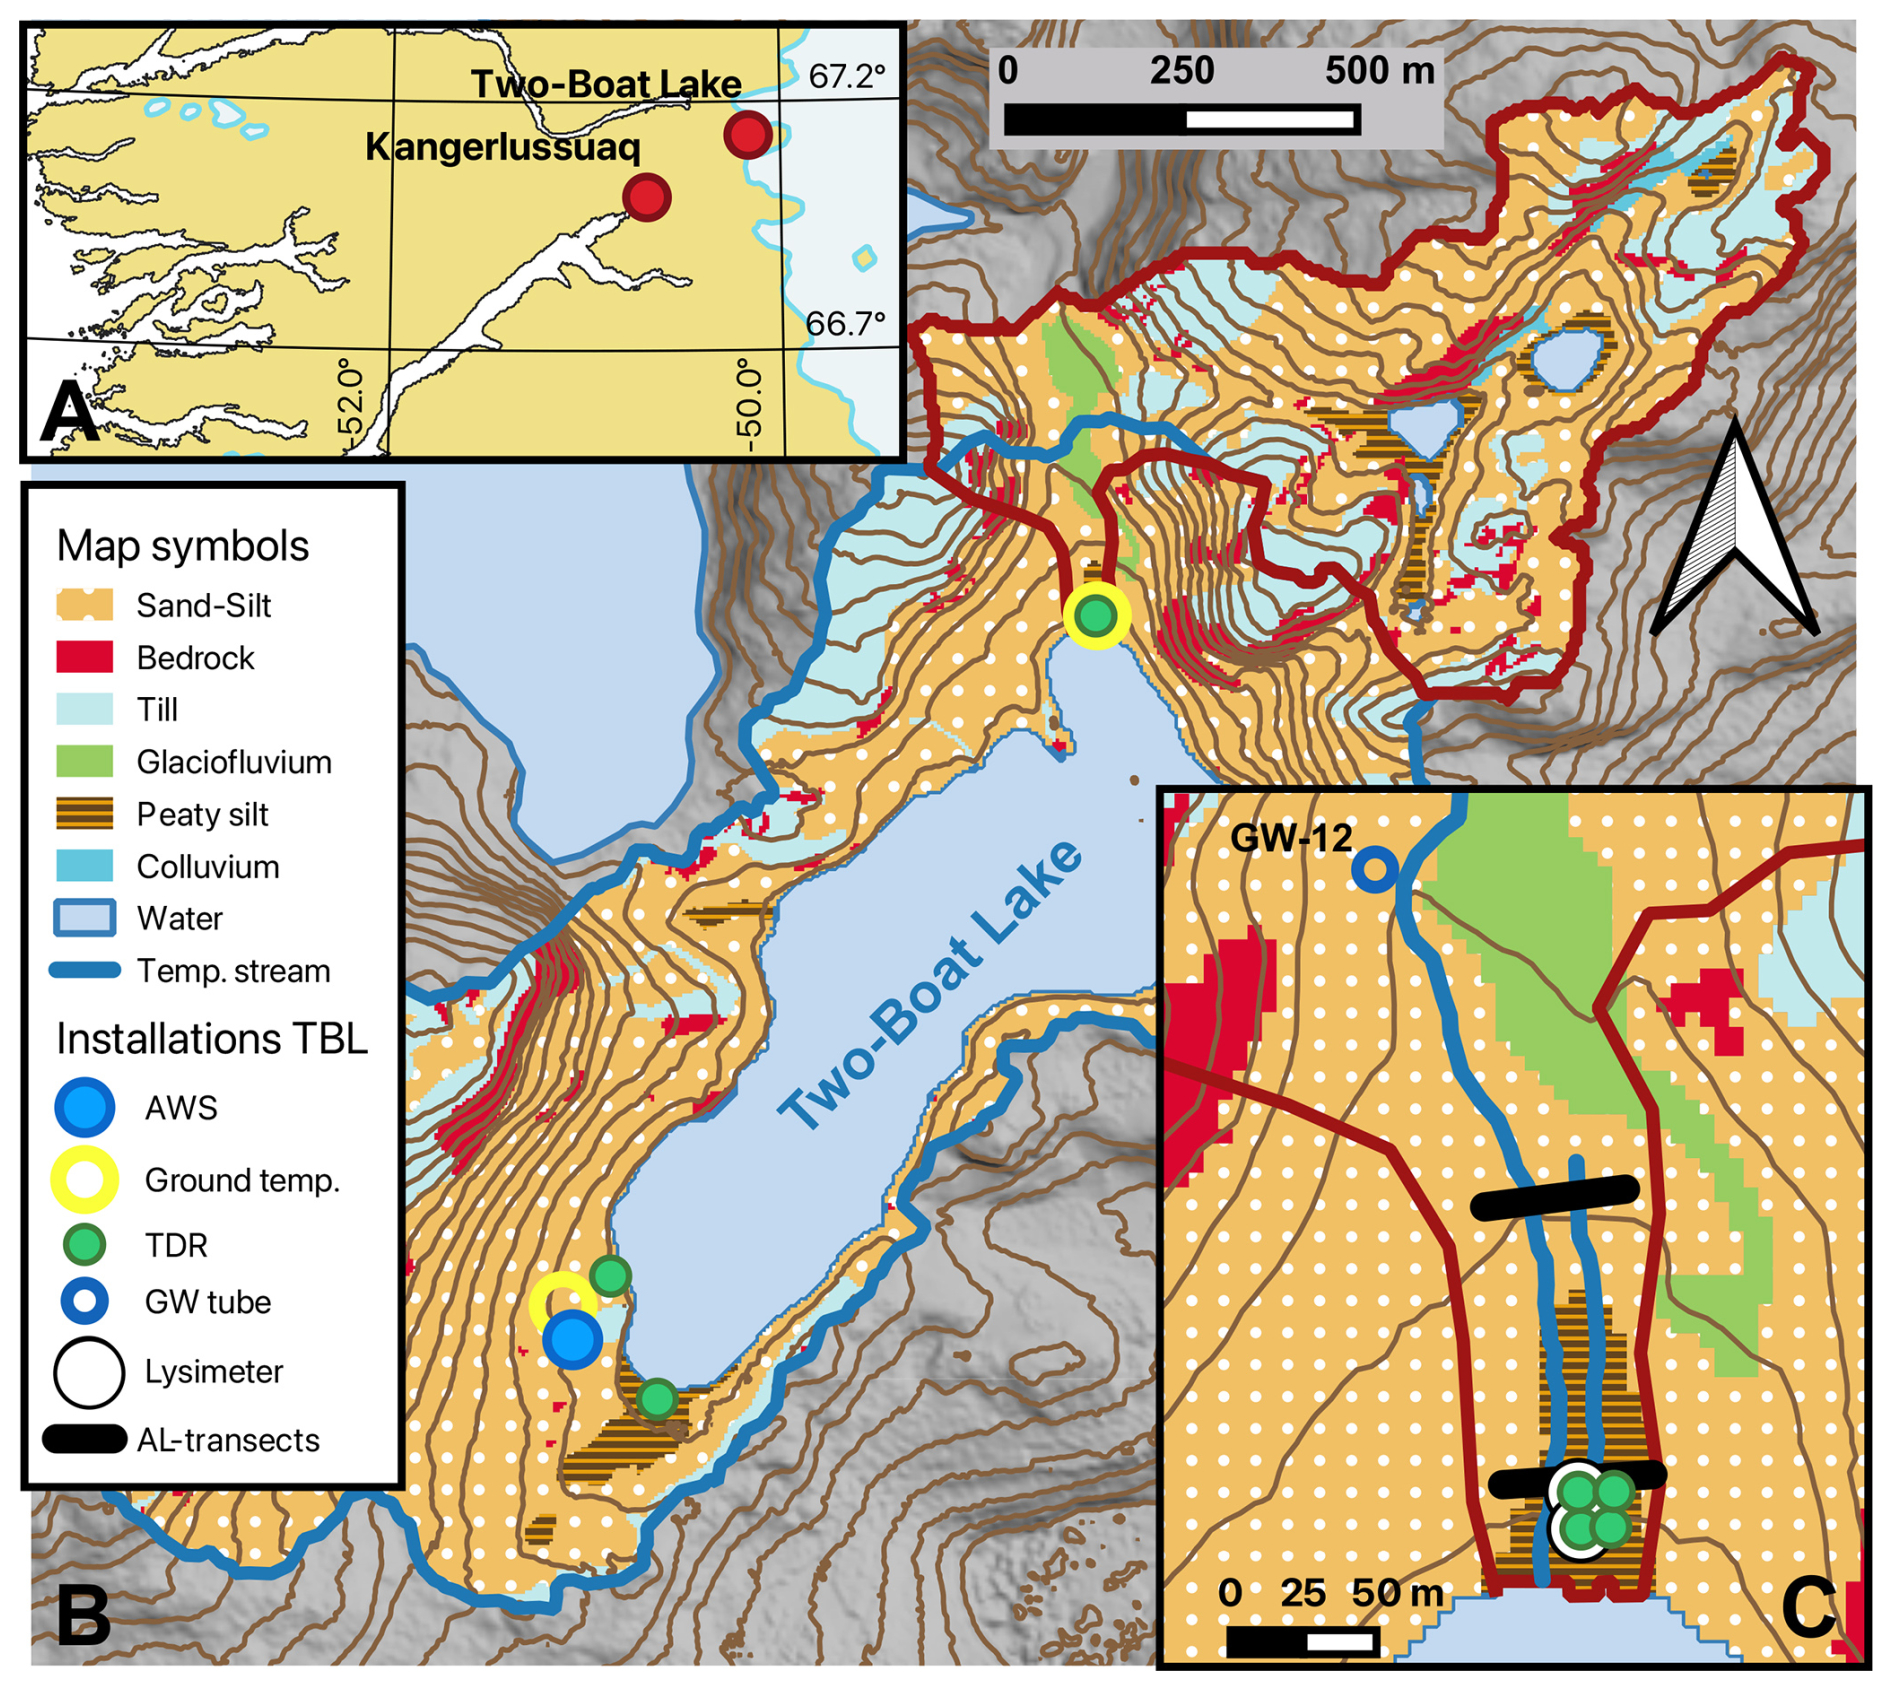
Figure 1Map showing the location of the Two-Boat Lake catchment within West Greenland (panel A). Panel (B) shows a map over the Quaternary deposits (QD) for the entire Two-Boat Lake catchment (peaty silt corresponds to wetter areas), including the location of the automated weather station (AWS), ground temperature loggers, and TDR-installations. The red outline corresponds to the sub-catchment used for this study, while the blue outline marks the original catchment area used by Johansson et al. (2015a). Panel (C) shows a close-up of the lower part of the studied sub-catchment, including the two transects that were used to monitor the thaw in the active layer (AL) during spring 2017 and the two temporary streams that were active during this period. It also shows the location of the groundwater well (GW-12) and the two lysimeter installations that were used as observation points in the particle tracking simulation, as well as the four TDR depth profiles in the sub-catchment. The digital elevation model used to create the contour lines (10 m contour intervals) and the QD-map were developed within the GRASP-project and are described in detail in Petrone et al. (2016).
2.2 Modelling
2.2.1 Hydrological modelling
During GRASP, Johansson et al. (2015a) used the modelling system MIKE SHE (Refsgaard et al., 2010) to develop a distributed numerical hydrological model for the Two-Boat Lake catchment for the period 2011–2013 (i.e., original modelling period). Here we have extended the modelling period to also cover 2013–2019 (i.e., extended modelling period). The model uses meteorological data collected by an automated weather station (AWS) in the Two-Boat Lake catchment (Fig. 1) and has been thoroughly validated using on-site measurements of several hydrologic variables. The model domain has a horizontal resolution of 10×10 m, and covers the entire catchment, as well as the area directly downstream of the lake outlet (to avoid boundary effects). Vertically, the model is composed of four 25 cm thick layers in the seasonally thawed active layer (top 100 cm), where water flow occurs seasonally, and four layers in the underlying permafrost (1–200 m depth), where water mobility is extremely low due to the frozen conditions (see Johansson et al., 2015a for details on model setup and validation).
Observed daily precipitation and potential evapotranspiration (PET, calculated based on temperature, wind speed, air humidity and radiation from the AWS) are applied as the upper boundary condition. The actual total evapotranspiration (as sublimation, interception, evaporation from open water and soil, and transpiration) is calculated during the simulation as a result of the relation between the PET and the water availability. For the remainder of the article, we will refer to the joint effect of sublimation, interception, evaporation and transpiration as evapotranspiration. If the air temperature is below zero, the precipitation accumulates in the catchment as snow (which is subsequently released during spring). When the air temperature is above zero the water from precipitation can either leave as surface run-off or infiltrate the ground (the same applies for water from melting snow and ice). The subsurface is composed of an unsaturated zone from which water can evaporate via the soil matrix, transpire through plant roots, percolate to the saturated zone or remain in storage. This unsaturated zone varies in thickness depending on the depth of the simulated groundwater table. In the saturated zone, below the groundwater table, water can move vertically and horizontally as simulated by Darcy's law. The water flow in and between each model compartment (river/streams, overland, unsaturated zone, saturated zone) is quantified during the simulation and constitutes the basis for the calculation of the catchment water balance (Johansson et al., 2015a).
Because MIKE SHE does not itself simulate freeze-thaw processes (i.e., permafrost), the impact of freeze-thaw processes on the hydrological flow in the active layer and permafrost was parameterized by spatially and temporally varying the hydraulic properties (hydraulic conductivity, surface roughness and infiltration capacity) of the ground substrates based on the observed ground temperatures at different depths and locations in the catchment. By using this approach, MIKE SHE handles permafrost by simulating the hydrological consequences of frozen and thawed conditions rather than simulating ground temperatures (Bosson et al., 2013). That is, water mobility in the subsurface zones is effectively restricted when the ground is frozen. For more details regarding the model setup and validation, please refer to Johansson et al. (2015a).
Code developments in MIKE SHE between the original and the extended modelling period resulted in two model versions and associated evaluation periods. For the original 2010–2013 period, we used the output from the original modelling run made by Johansson et al. (2015a). For the extended, 2013–2019, period the same model was used, but with the inclusion of an additional catchment area (Fig. 1). This additional area only contributes runoff to the lake during high flow situations, e.g., during the snowmelt period or after periods with intense rain, and it is not connected to the rest of the catchment via a predefined stream network in the model (and was therefore excluded for the original modelling period). When ponded water accumulates in this area, it is routed downhill as overland flow or infiltrated to reach downstream areas of the catchment as shallow groundwater flow.
2.2.2 Particle tracking simulation to estimate groundwater age
In order to estimate the age of the water in the saturated zone of the studied sub-catchment we used the particle tracking module in MIKE SHE together with the numerical hydrological model described above (Fig. 1). This module adds virtual “particles” to the water that enters the saturated zone. These particles then move (conservatively) with the water through the saturated zone until they leave the saturated zone and enter either the lake, a temporary surface stream, standing surface water, the unsaturated zone or reach a model boundary. Based on the time when the particle entered the saturated zone and when it reached one of the three observation points it is possible to get an estimate of the age of the groundwater (Fig. 1).
The MIKE SHE particle-tracking module releases particles along the established 3D flow field in the saturated zone only. The number of particles released was flow-weighted, i.e., one particle was released for each millimetre of added water. Once a particle leaves the saturated zone, the particle is removed from the simulation. To ensure enough time for most particles to leave the saturated zone or reach the observation points, particles were only released during the first year of the 100-year simulation and the hydrological model (i.e., the MIKE SHE hydrological model described above) was cycled to create a 100-year simulation using the meteorological conditions for 2016–2019. Groundwater age, i.e., the transit time in the saturated zone, was then estimated by noting the date the particle entered the saturated zone and the date when the particle reached an observation point (i.e., one of the groundwater wells (GW-12) and the two lysimeter installations located within the sub-catchment; Fig. 1). Each observation point was subdivided into three vertical layers in accordance with the hydrological model (i.e., 0–25, 25–50, 50–75 cm).
2.3 Sample collections and field measurements
2.3.1 Monitoring of thaw rates in the active layer
Between 18 and 31 May 2017, the progress of thaw in the active layer was monitored along two 50 m long transects (AL-transects; Fig. 1). Every second day (7 times in total) we measured the thickness of the thawed layer in 0.5 m intervals along the transects using a steel rod. Each measurement spot was also classified as wet (water table at or above the ground surface) or dry (water table more than 5 cm below the ground surface), and we measured the depth of any surface water. Thaw rates were then calculated by dividing the change in thaw depth between two consecutive monitoring dates by the time between the two dates. When measuring the thaw depth care was taken not to walk on the measured transect and we avoided walking along the same path twice. No visible signs of tracks or rilling were observed either during the intense monitoring period or during the entire GRASP study period. Thaw rates for the whole monitoring period and for each spot along the transects were calculated as the average thaw rate for the entire period.
2.3.2 Meteorology and ground temperatures
Air temperature and precipitation (as both rain and snow) were recorded using an automated weather station (AWS) placed in the Two-Boat Lake catchment, and ground temperatures were measured at two locations in the catchment using HOBO U12-008 sensors (Fig. 1; see Johansson et al., 2015b for further details). Based on time-laps photos from the catchment, snow ablation and formation of snow drifts can be extensive. On a catchment scale, we have assumed that these two processes cancel each other out, and that they result in no net gain or loss of water to the catchment. Time Domain Reflectometry (TDR) sensors (Campbell Scientific, CS615 sensors connected to a CR1000 data logger) were placed in three clusters, each consisting of either three or four depth profiles with four sensors evenly distributed from 5–10 cm below the ground surface down to 40–50 cm (Fig. 1; see Johansson et al., 2015b for further details).
2.3.3 Estimate of the amount of ground ice
To estimate the amount of water released from melting ground ice during the intense monitoring period of 2017, we used the soil moisture content recorded by the TDR sensors in the sub-catchment at the time of freeze-up in the fall of 2016. These data allowed us to estimate the ground ice content at different depths, and thus, estimate the release of meltwater as the thaw progresses. This estimate should be considered as a minimum, because moisture migration during winter could give a higher ice content in spring compared to the fall conditions. The amount of water released from melting ground ice between 18 and 31 May 2017, was estimated based on the water content linearly interpolated between observation depths (TDR sensors) and the maximum thaw depth for each point along the transects at the end of the intense monitoring period.
2.3.4 Collection of water samples and chemical analysis
Precipitation (rain and snow; n = 8 and n = 13, respectively), surface water (n = 31), soil water (groundwater wells and zero-tension lysimeters, n = 23 and n = 22, respectively) and lake water (n = 28) samples have been collected at an irregular, low, frequency between 2010 and 2019 (Lindborg et al., 2016). Groundwater wells are fully screened, and collect water from the entire thawed layer, while lysimeters collect water at discrete depths (i.e., either 15, 30 or 35 cm depth). The ceramic body of the lysimeters has a pore size of ∼ 1 µm and no additional filtering was done. For other sample types, the majority were filtered in the field using 0.45 µm polycarbonate membrane filters (two lake water and two surface water samples were analysed unfiltered). All samples were frozen after sampling and were kept frozen until analysis. Water samples have been analysed for their elemental composition (n = 129) using Inductively-Coupled Plasma Sector-Field Mass Spectrometry (ICP-SFMS) at ALS in Luleå, and/or dissolved organic carbon (DOC; n = 62) using the NPOC-method at either Stockholm University (Dept. of Ecology, Environment and Plant Science), ALS in Luleå or Umeå University (Dept. of Ecology and Environmental Science). Please refer to Lindborg et al. (2016) for further details.
In addition to this low-frequency sampling, a number of samples were collected during the intense monitoring period (i.e., between 18 and 31 May 2017). One set of samples was used for ICP-SFMS and DOC measurements. This sample set consists of samples from where one of the temporary surface streams enters Two-Boat Lake, the uppermost groundwater well (GW-12), one lysimeter (15 cm depth) and from melted snow (Fig. 1). A second set of samples was used for analysing stable water isotopic signatures (δD and δ18O). Surface water was sampled every second day from two locations along a small temporary surface stream that crossed the AL-transects used to monitor the thaw depth. Snow was sampled from three locations in the sub-catchment, and water from ground ice in the active layer was sampled in three locations along the temporary surface streams by thawing pieces of frozen ground in plastic bags and sampling the meltwater. All samples were taken as duplicate samples (field replicates), and the stable isotopic composition in each sample was analysed in triplicate (laboratory replicates). Stable water isotopes in all water samples from the 2017 sampling were analysed at Stockholm University using a Cavity Ring-Down Spectrometer (Picarro L2130-I, manufacturer's precision of δD < 0.1 ‰ and δ18O < 0.02 ‰). The analysis scheme of Penna et al. (2010) was adopted, and results were reported as δ-values in per mille (‰) relative to Vienna Standard Mean Ocean Water (VSMOW). All calculations and statistical treatments were made using the average stable isotopic composition of the laboratory replicates.
2.4 Data analysis
2.4.1 Principal component analysis
To evaluate and visualize similarities and differences between different types of water samples the chemical data from rain, snow, temporary surface streams, groundwater wells, lysimeters and the lake itself were subjected to a principal component analysis (PCA). For temporary surface streams, groundwater wells and lysimeters only samples from the studied sub-catchment were included. Prior to the PCA, elements for which the majority of observations were below the reporting limit in all water types were removed. For the remaining elements all values below the reporting limit were replaced with half the reporting limit, and the data were then converted to z-scores (average = 0; variance = 1) to remove any effects of scaling. After an initial PCA, we also removed elements with communalities < 0.7, as well as two snow samples collected on the lake that had elemental concentrations similar to lake water indicating that they had been contaminated by lake water (collected 11 April 2014). We also removed a single sample from a groundwater well (GW-11, 13 September 2011) that had a disproportionally strong influence on the outcome of the PCA. This resulted in a total of 35 elements and 65 observations (rain = 8, snow = 6, surface water = 7, groundwater = 23, lake water = 11). All principal components (PCs) with eigenvalues above one were extracted, and a Varimax rotated solution was used.
2.4.2 Correlation analysis
All statistical calculations for the comparisons between hydrological variables and the chemical signature were performed using SPSS v.29 (https://www.IBM.com, last access: 15 December 2025). Correlation coefficients were calculated as Pearson correlations (denoted r) if both variables were normally distributed (according to a Shapiro-Wilk test) or Spearman rank correlations (denoted rs) if at least one variable was non-normally distributed. For all tests, a significance level of 0.05 was used. The majority of the runoff in the Two-Boat Lake catchment occurs as groundwater, and several of the hydrological parameters reported from the model are highly correlated. Therefore, only the total runoff to the lake and the proportion of deep groundwater were used for the correlation analysis (these two parameters show no correlation to each other).
3.1 Hydrological modelling, 2013–2019
The observed mean annual precipitation for the extended modelling period (i.e., 2013–2019) was 308 mm yr−1, and it varied from a minimum of 247 mm yr−1 in 2014 to a maximum of 407 mm yr−1 in 2017. Based on the local meteorological observations, the hydrological model estimates that, on average, two thirds (65 %) of the precipitation left the system as evapotranspiration (including sublimation), and the period from late April through October was characterized by a precipitation deficit (i.e., precipitation minus evapotranspiration was less than zero), whereas the winter period had a precipitation surplus. On an annual basis the modelled average net input of water to the catchment (i.e., precipitation minus evapotranspiration) was 109 mm yr−1, with a variation from 64 mm yr−1 (2018) to 170 mm yr−1 (2017). Viewed over the entire 2011–2019 period most of this excess water left the terrestrial system as runoff (on average 98 mm yr−1) and entered the lake.
The snowmelt period was the dominant runoff event in all modelled years and most commonly the total runoff peaked in early June (Fig. 2). During the early snowmelt period a substantial part of the runoff occurred as overland flow directly to the lake (i.e., water that had been in limited contact with the subsurface), but for the latter part of the snowmelt period and the summer season the runoff was dominated by groundwater discharging directly to the lake or via temporary surface streams (Fig. 2). The exception to this pattern was 2018, when overland flow also occurred late in the snowmelt period and during summer. On an annual basis, overland flow made up 7 %–52 % of the annual runoff (average 28 %), with 2016 and 2018 standing out from the other years with about half the water leaving the catchment as overland flow.
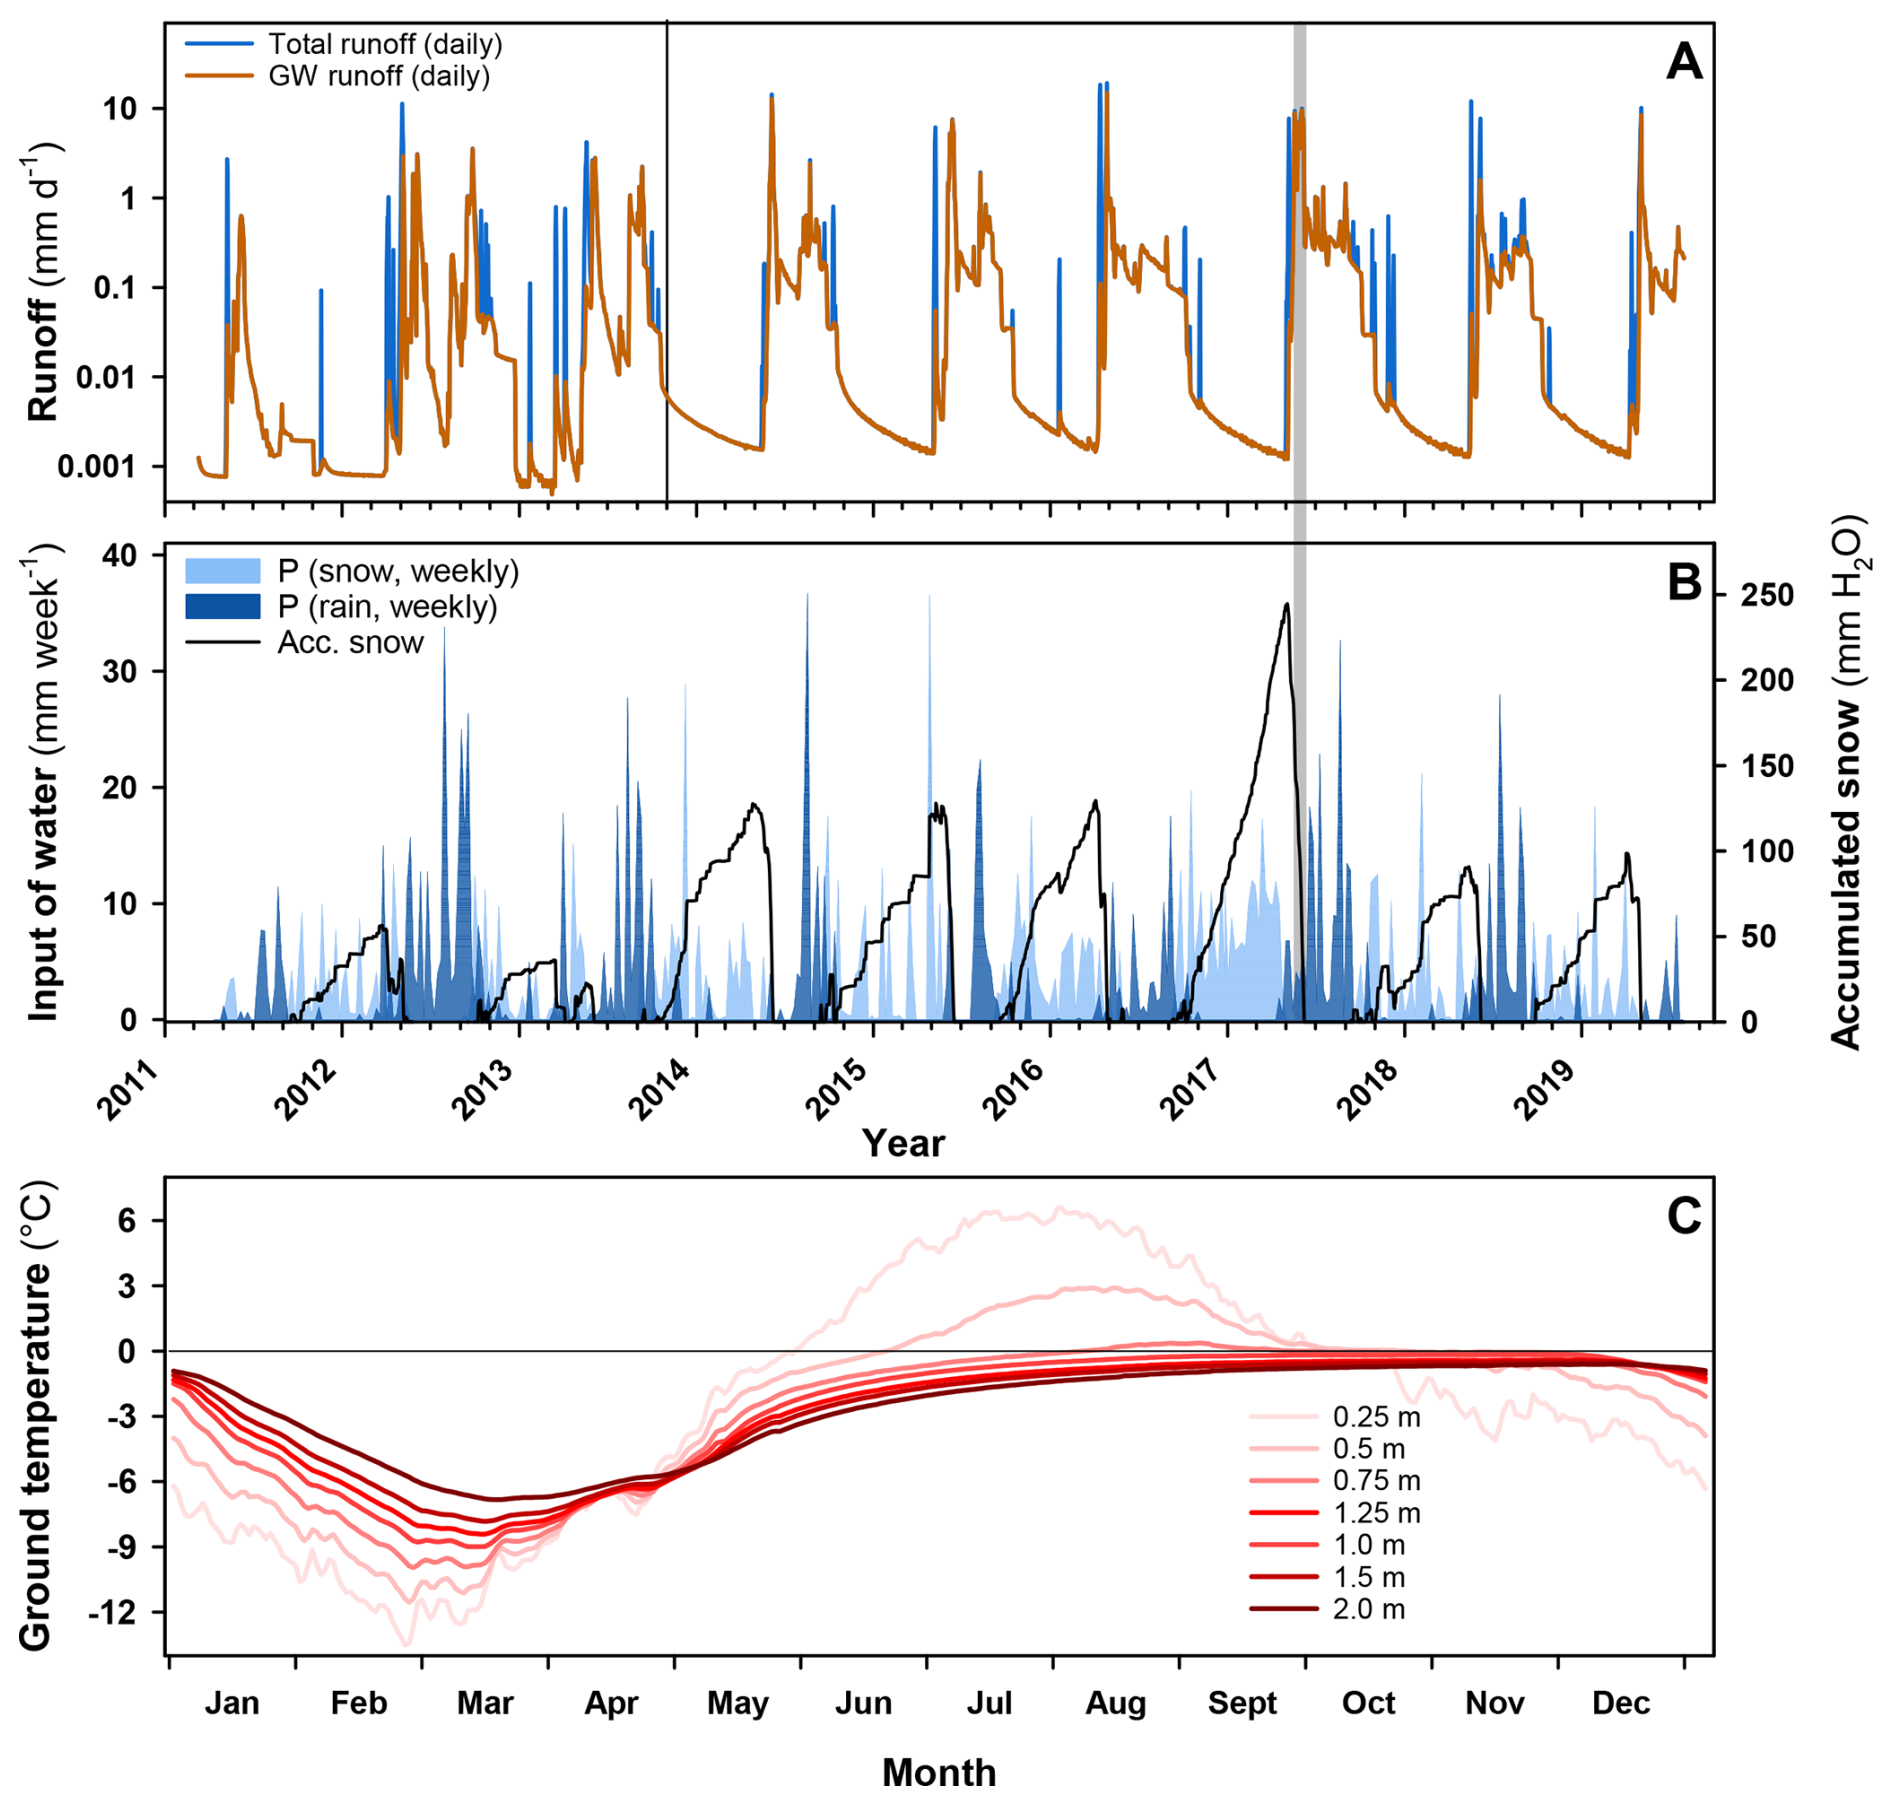
Figure 2Panel (A) shows the modelled daily runoff (total runoff and as groundwater) to Two-Boat Lake for the entire modelling period (March 2011 to July 2019). The black vertical line denotes the division between the original modelling period presented in Johansson et al. (2015a), and the extended period (2013–2019). The grey vertical line indicates the intense monitoring period in 2017. Panel (B) presents the observed weekly precipitation as snow (air temperature was below zero) or rain for the Two-Boat Lake catchment. The black line represents the accumulation of water in the form of snow in the catchment. The lower panel (C) shows the observed ground temperature (daily average for 2011–2018) measured down to 2 m depth (cf. Fig. 1 for location).
Observed ground temperatures down to two meters depth show a clear seasonal pattern that become muted with depth (Fig. 2). On average for the 2011–2018 period the maximum thaw depth, which occurred in August, reached the temperature sensor at 75 cm. The thawed period at 25 cm started in late May (29 May) and reached 50 cm by mid-June (20 June). The ground then stayed unfrozen for about four months and froze at 25 cm in late September and at 50 cm in mid-October. That the deeper parts of the active layer (at 50 cm) stayed unfrozen for almost a month after air temperatures dropped below zero degrees and the surface layers froze means that groundwater flow could continue also after the ground surface had frozen.
3.2 Particle tracking simulation and groundwater age
The particle tracking simulation suggests that most of the tracked particles moved through the uppermost layer of the model (i.e., 0–25 cm; Fig. 3). From the start of the snowmelt period until the end of June – when most particles are registered at the observation points – the 0–25 cm layer was dominated by very young water that generally entered the saturated zone within the previous 3 months. As the unfrozen season progressed the average age of the tracked particles increased in all three layers, and the flow also shifted to deeper flow paths when progressively deeper layers thawed. In deeper layers the peak in the number of registered particles occurred later in the season (May-June and September for 25–50 and 50–75 cm, respectively), and the particles registered in the deeper soil layers also tended to have higher ages (Fig. 3). Almost all the particles that moved through the deepest part of the active layer had spent more than a year in the saturated zone, and about two-thirds were older than two years. It should be noted that particles only are released as water enters the saturated zone, hence, it is not possible to track the age of water that was present in the saturated zone at the start of the particle tracking simulation, e.g., in permafrost. However, because the 100-year simulation does not include any warming trend (it repeatedly cycles the 2016–2019 meteorological conditions), there is minimal release of water from thawing permafrost.
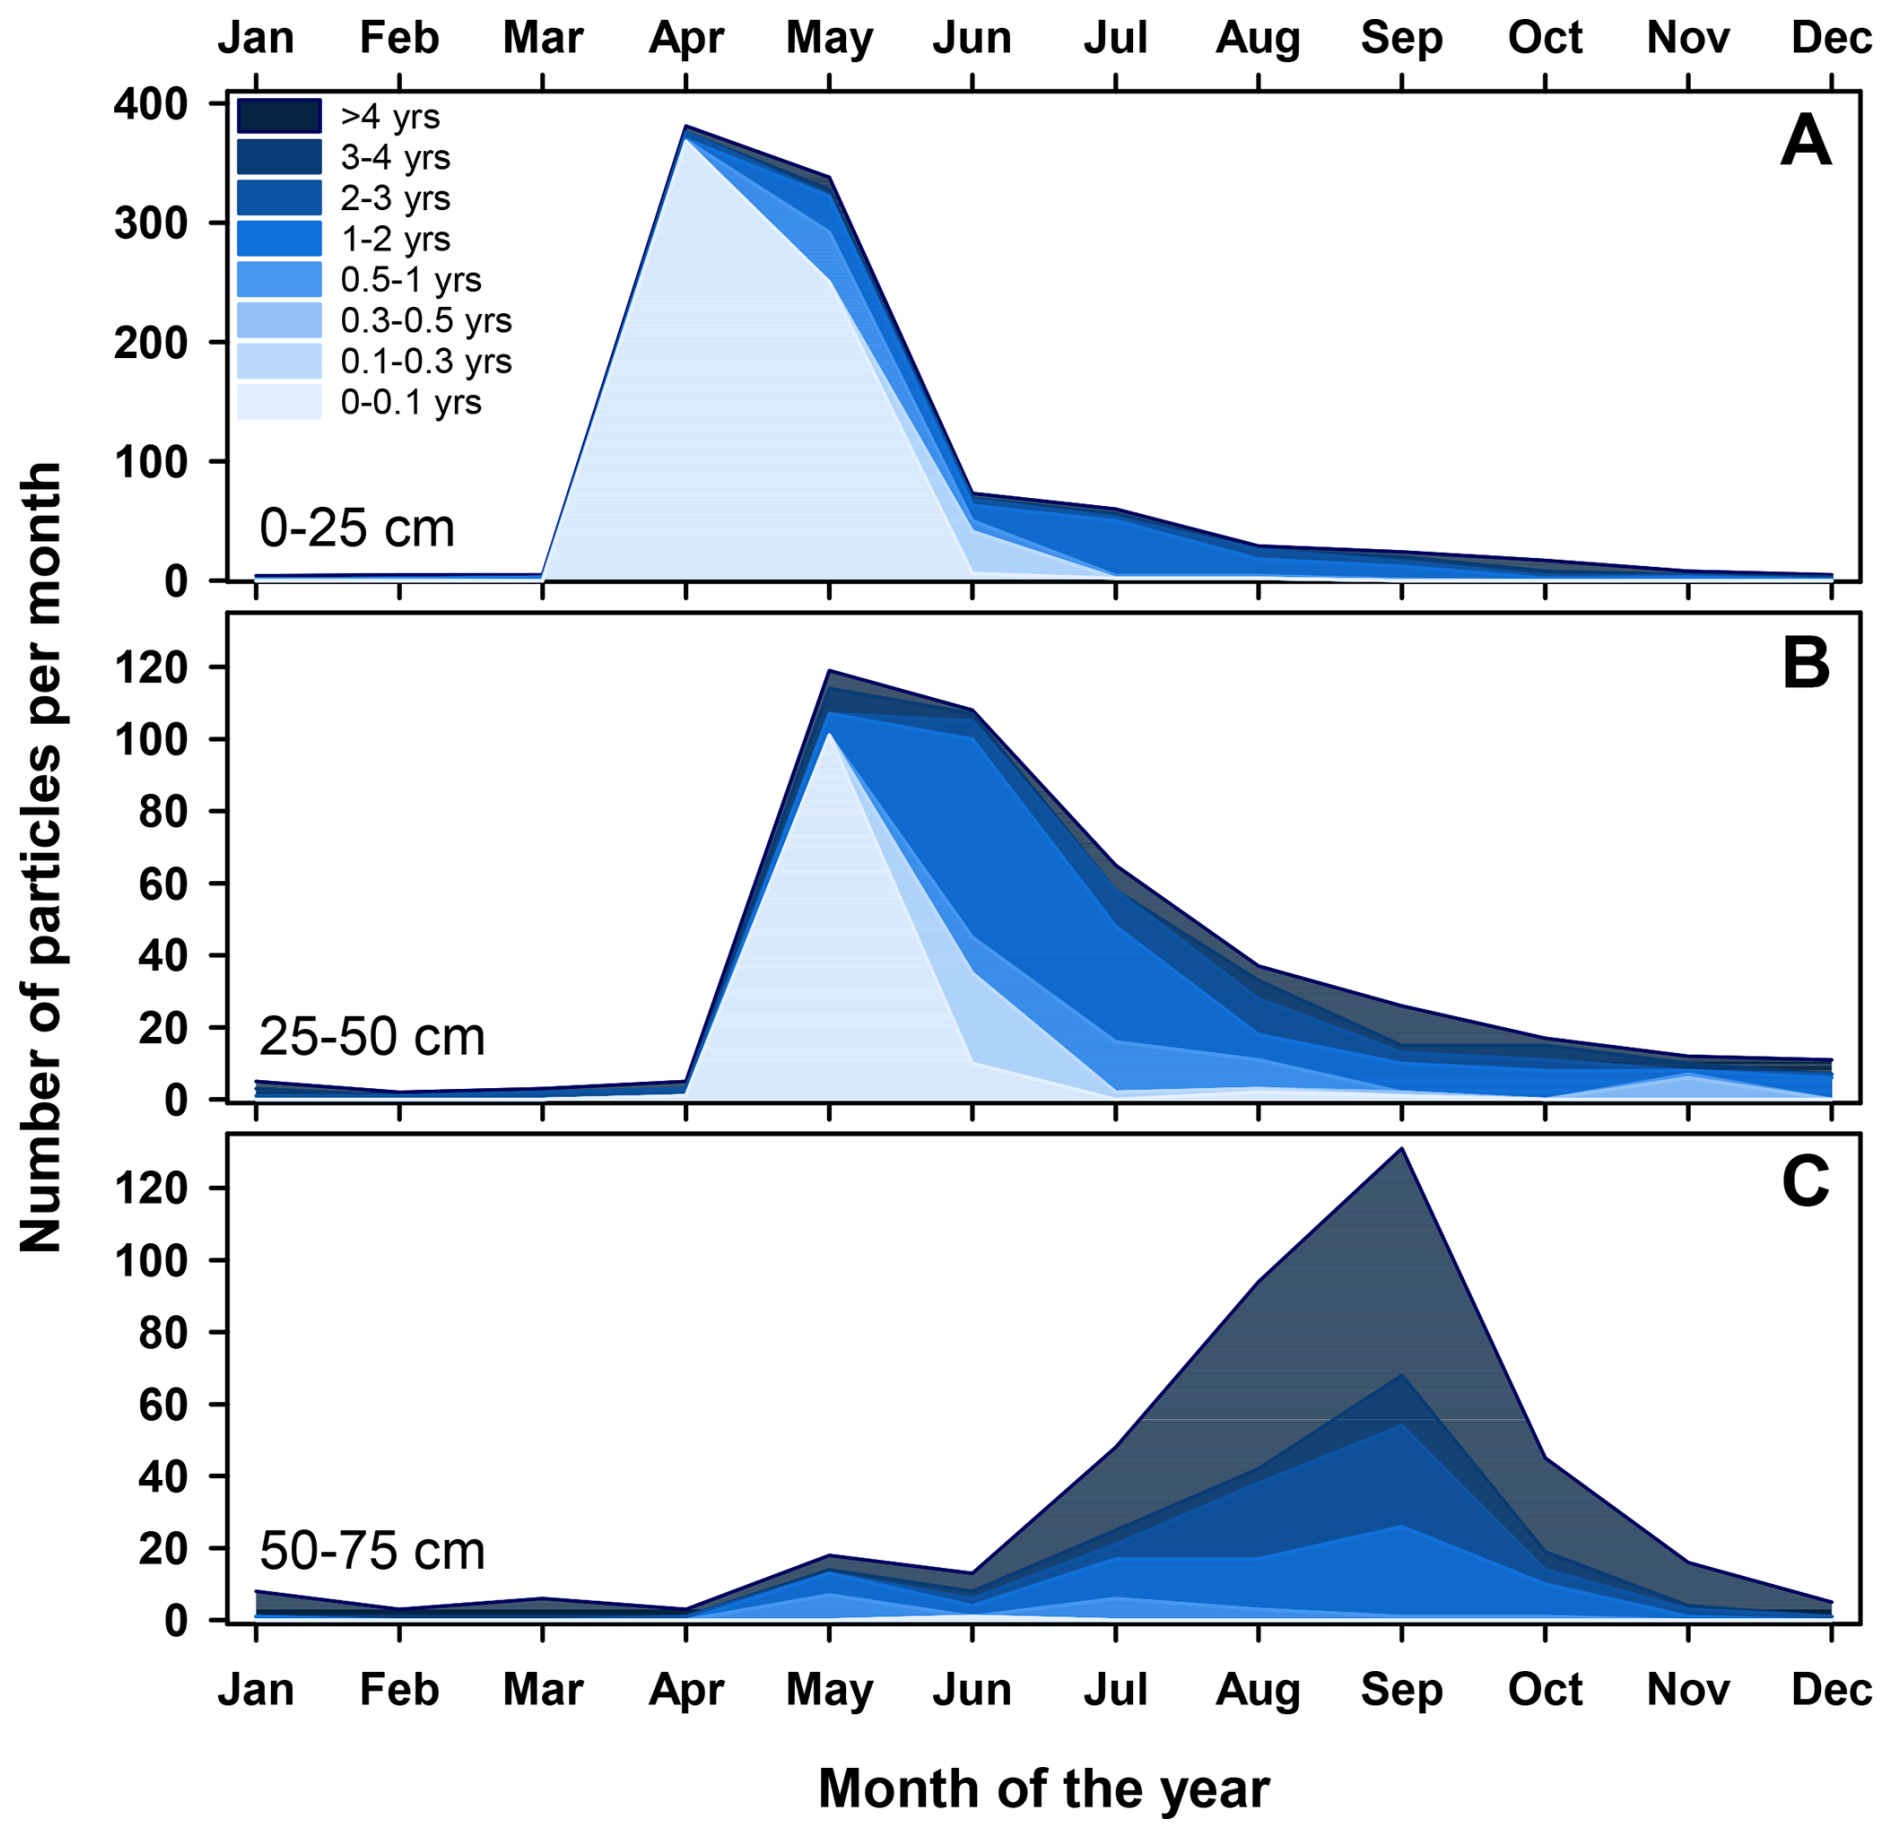
Figure 3Age distribution for water particles reaching the three observation points used in the particle tracking simulaton for three depth layers (A: 0–25 cm, B: 25–50 cm and C: 50–75 cm). Note that the scale differs between panel (A) and panels (B) and (C).
3.3 Intense monitoring period in spring 2017
During the winter 2016/2017, which preceded the intense monitoring period in late May 2017, the AWS in the Two-Boat Lake catchment indicates that 260 mm of snow-water equivalents accumulated in the catchment. According to the hydrological model 26.5 mm of this water was lost before the snowmelt period due to sublimation and evaporation (Fig. 4). Based on the measured air temperature the hydrological model indicates that the snowmelt started on 30 April, with about 8 % of the snowmelt-associated runoff occurring before 13 May, mainly as overland flow directly to the lake (Fig. 4). This means that a substantial part of the accumulated snowpack had already melted (or sublimated) at the beginning of the intense monitoring period (18 to 31 May), and snow patches were mainly confined to higher elevations in the catchment. Even so, multiple small temporary surface streams were still observed across the catchment, and according to the hydrological model the runoff remained high until 10 June. In contrast to during the early part of the snowmelt period, most water leaving the terrestrial system during the latter part of the intense monitoring period had spent some time as groundwater before entering a temporary surface stream or reaching the lake.
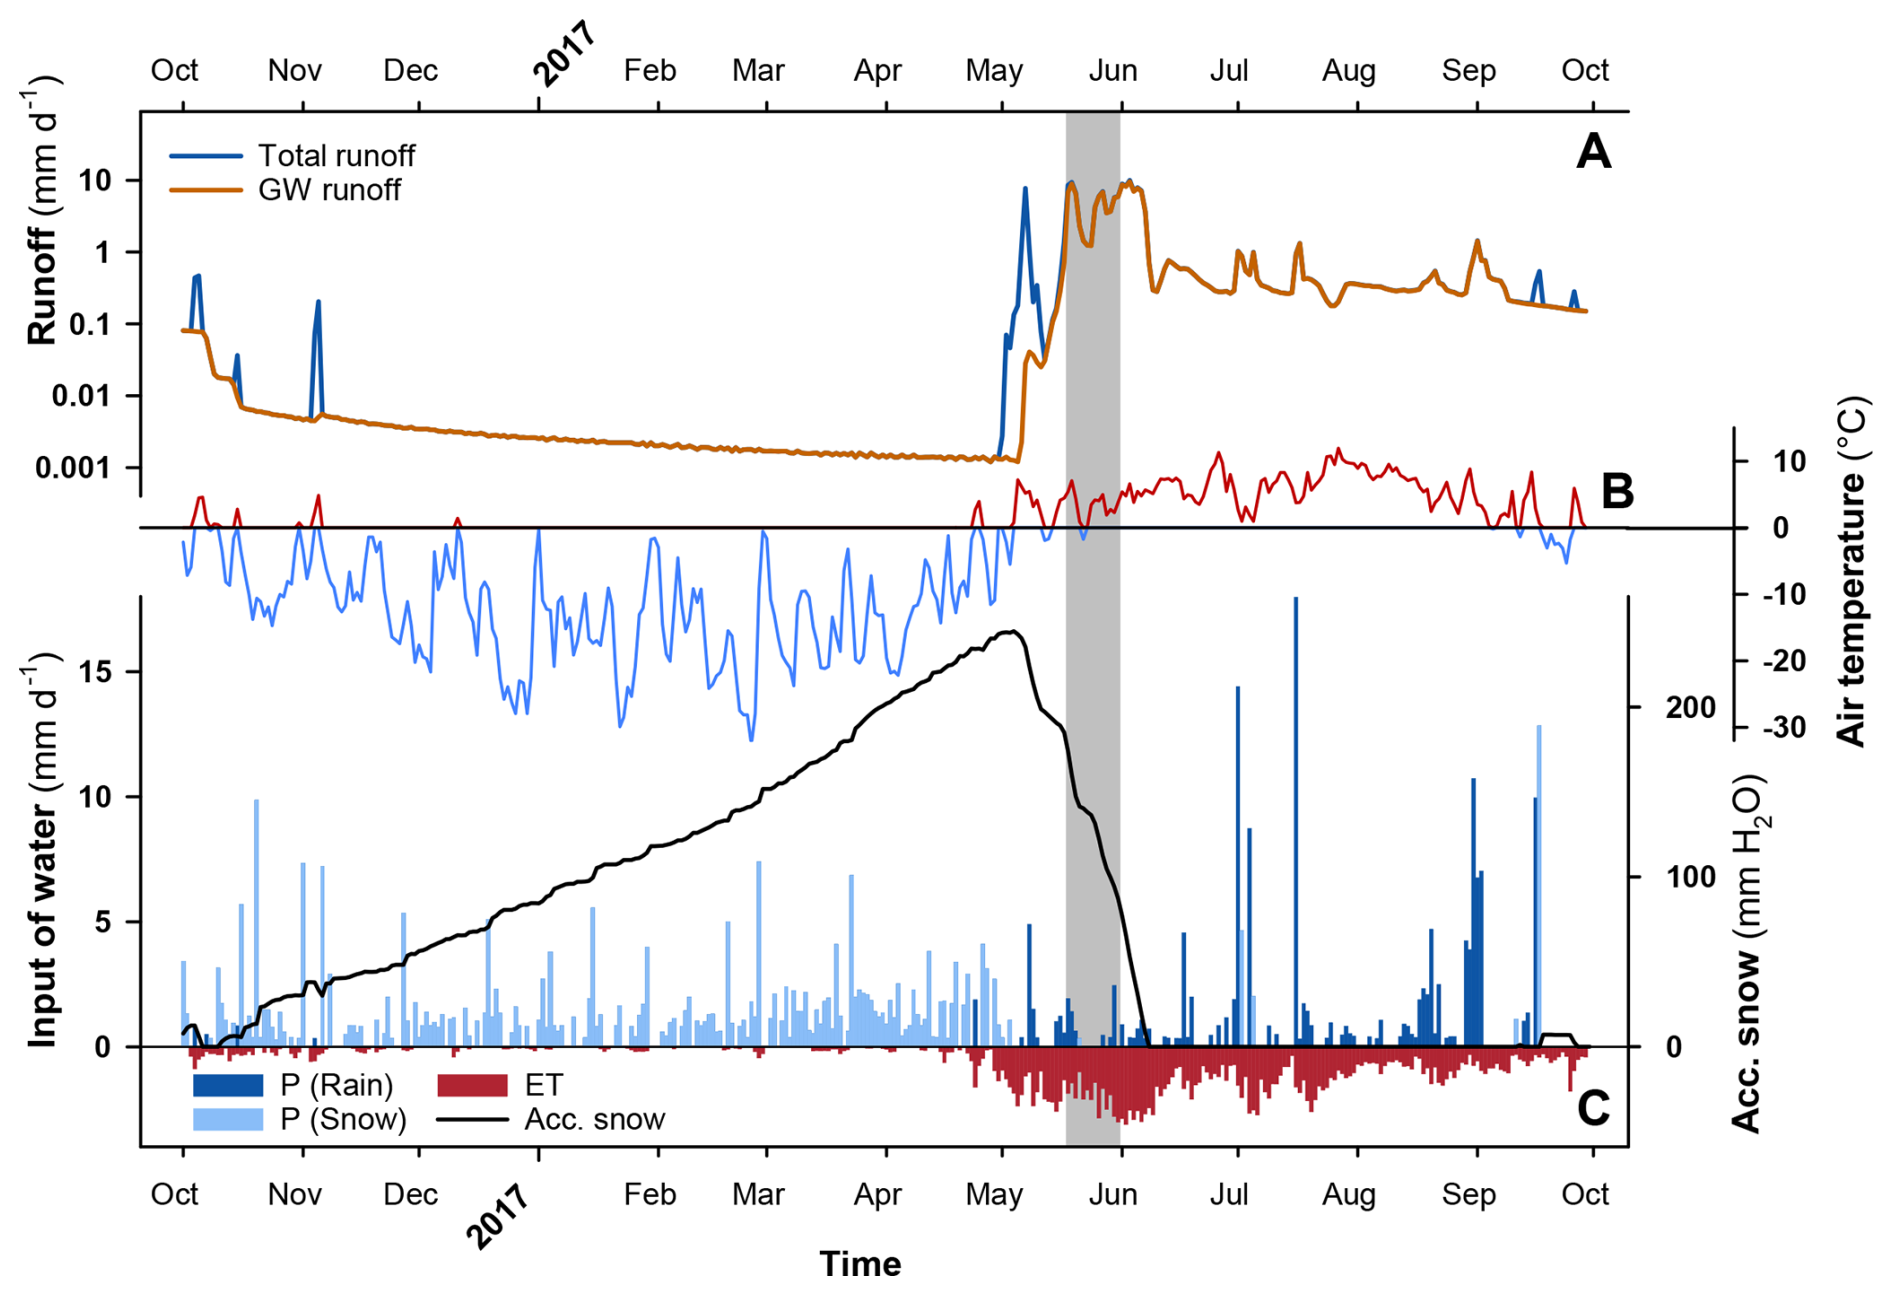
Figure 4Modelled daily runoff from the hydrological model (A), observed daily air temperature (mean) for the Two-Boat Lake catchment (B), and precipitation as snow or rain together with the loss of water through evapotranspiration (including sublimation) for the period 1 October 2016 to 30 September 2017 (C). Water accumulated in the form of snow is represented by the black line in panel C. The intense monitoring period (18 to 31 May) is indicated by the shaded area.
Time Domain Reflectometry (TDR) sensors installed in the sub-catchment showed a soil moisture content of approximately 30 % during soil freeze-up in the fall of 2016. Furthermore, the ground temperature sensors in the sub-catchment showed that thawing of the ground at 5 cm depth started on 10 May, and that the thaw front reached 15 cm depth on 20 May. The melting of ground ice in the active layer corresponds to a total water release of at least 18 mm of water during the intense monitoring period, assuming that the recorded soil temperatures and water content at the TDR sensors are representative for the entire sub-catchment. During the intense monitoring period (18 to 31 May) there was also an input of a total of 7 mm of rain, with the largest rainfall event of 0.8 mm occurring on 30 May.
3.4 Thaw rates in the active layer
At the start of the intense monitoring period (18 May) the average thaw depth along the two AL-transects was 10.4 cm, and by the end of the period (31 May) it had increased to 15.3 cm, but there was also considerable variability along the two transects. The progression in the average thaw depth along the two AL-transects closely resembled the thaw depth observed using the ground temperature sensors in the sub-catchment. On the first day of sampling, 18 May, 30 % of the measurement points had a water level at or above the ground surface, and 7 % of the points were covered by surface water. The surface water formed several puddles, and two temporary surface streams that crossed at least one of the AL-transects (Fig. 1). During the monitored period wet locations (with water table at or above the ground surface) exhibited a higher thaw rate (0.8 cm d−1) than dry locations (0.6 cm d−1, p-value < 0.0001). The maximum observed thaw depth developed under one of the temporary surface streams, where the thawed layer reached down to 48 cm below the ground surface on the last day of the monitoring period (31 May).
3.5 Stable water isotopes
The stable water isotopic composition in temporary surface streams sampled in May 2017, as well as the average for precipitation and lake water taken in 2011, 2014, 2017, and 2019, are shown in Figs. 5 and S1. For the precipitation there was a clear seasonality in the composition with more negative values in the snow samples (average δD = −159.7 ‰, standard deviation 12.5 ‰) compared to rain samples (average δD = −115.8 ‰, standard deviation 9.3 ‰). The compositions in samples from surface water (average δD = −140.6 ‰, standard deviation 2.0 ‰) and ground ice (average δD = −137.5 ‰, standard deviation 0.8 ‰) showed a much smaller variability, and the stable water isotopic values fell between the values for snow and rain (Fig. 5).
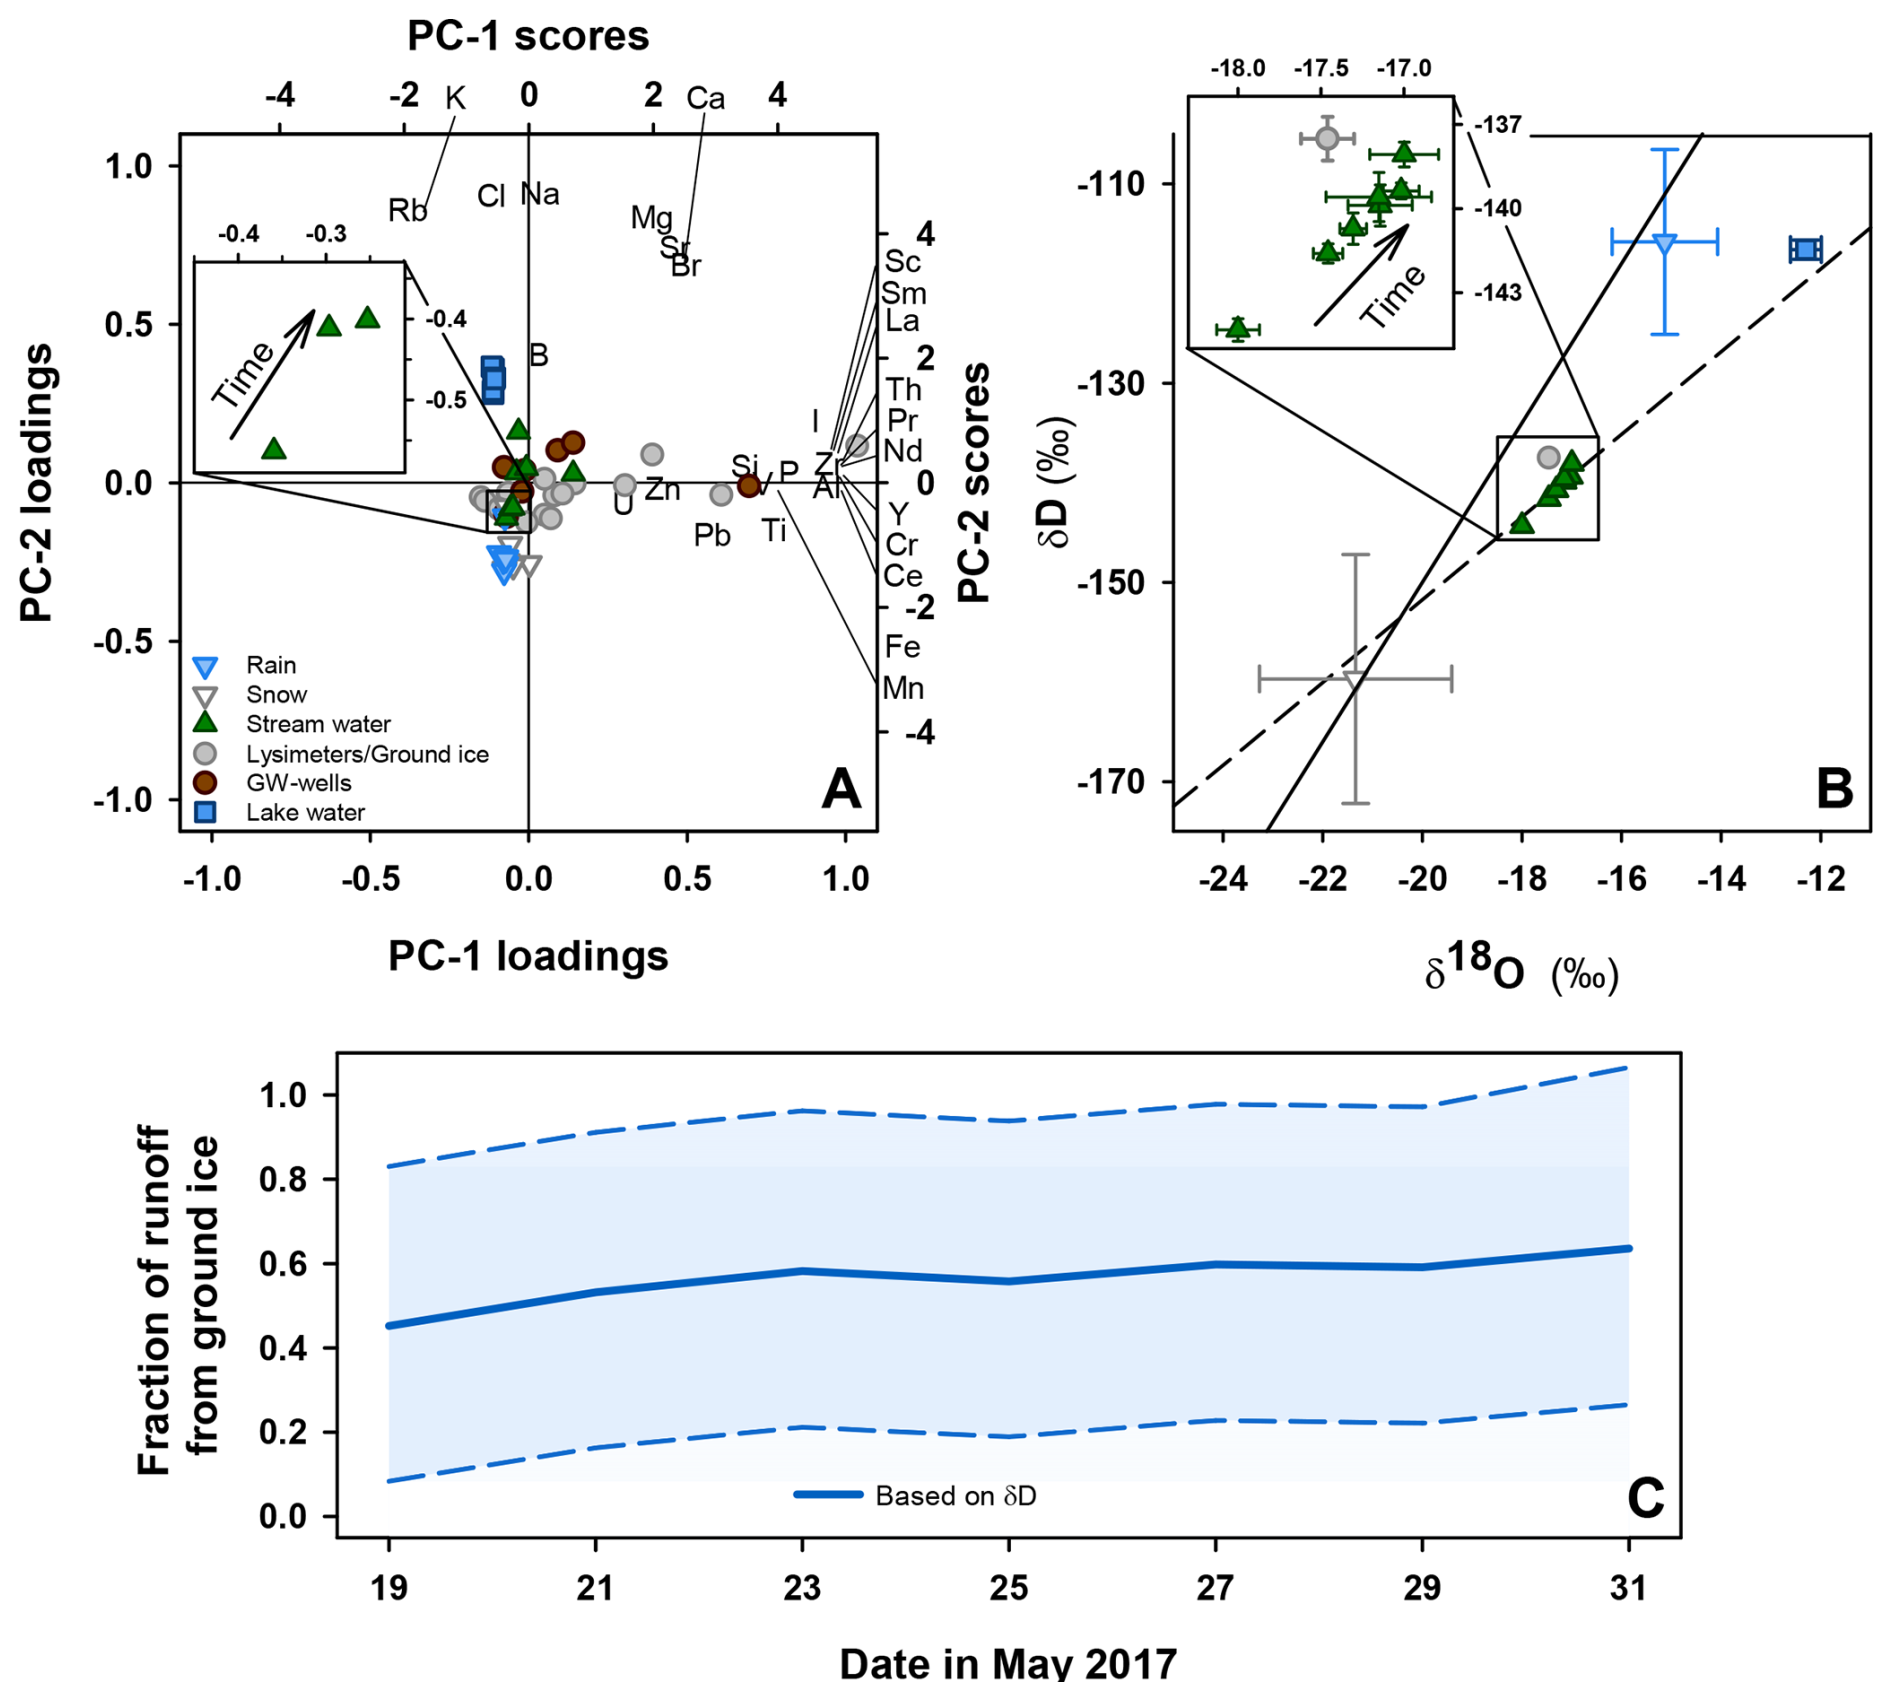
Figure 5Panel (A) consists of a combined loadings and score plot for the first two PCs (PC-1 and PC-2) that gives an overview of how the chemical signature varies between water types. Precipitation samples are found in the lower left-hand corner, while lake water samples are found in the upper left-hand corner. Surface water and soil water samples (lysimeter and groundwater wells) generally have similar or higher PC-1 scores compared to precipitation and lake water, with the highest scores found in soil water samples. For PC-2 surface and soil water are intermediate to precipitation and lake water samples. The insert shows the three water chemistry samples from the intense monitoring period, with the arrow indicating the trend with time. Panel (B) shows the average stable water isotopic composition (δD and δ18O) in snow, rain, ground ice samples, surface water and lake water samples. The symbols indicate the average, while the error bars indicate the standard deviation of all samples collected over the entire study period. The solid line represents the GMWL and the dashed line represents an evaporation line to indicate the trajectory of evaporating water. The insert shows the stable isotopic composition in the six surface water samples and the melted ground ice sampled in May 2017. The arrow indicates the trend with time, and error bars represent the variability between field replicates. For access to the full datasets for both water chemistry and stable isotopic composition we refer to Lindborg et al. (2016) and its associated Pangaea datasets (Table S1 in the Supplement). Panel (C) shows how the fraction of runoff from melting ground ice and/or rain increases in the surface water over the intense monitoring period. The mixing model is based on the change in δD in the temporary surface stream and using the average of rain (including ground ice) and snow as endmembers.
During the two-week intense monitoring period the stable isotopic composition in samples from the temporary surface streams changed considerably (Fig. 5). At the end of the monitoring period the δD signature of the surface water was heavier and more closely resembled ground ice and rain than snow. The mixing model – which was based on the δD in samples from temporary surface streams, rain (including ground ice), and snow – showed that on the first day of sampling 39 % of the surface water originated from rain, while 49 % came from rain on the last day of sampling (Fig. 5). The uncertainty range is high due to the high variability of values in samples of snow and rain. Only 7 mm of rain fell during the intense monitoring period (and 3 mm the week before), while the estimated release of water from melting of ground ice in the thawed part of the active layer was 18 mm. Most of the released water therefore likely originated from rain that fell during the previous year and that had been stored as ground ice during winter.
3.6 Surface water chemistry
The PCA identified five principal components (PCs) with eigenvalues above one, and together they explain 90 % of the variability in the data (Fig. 5). The first PC (PC-1) is driven by differences in elements related to silicate minerals that can be assumed to be released through weathering (e.g., Al, Ce, Nd, La, Pr, Sc, Th, Y, Zr, P; Deer et al., 1992). A part of the variability in Mg, Sr and Ca (i.e., elements also supplied via atmospheric deposition) is also associated with PC-1 (the elements plot in the upper right-hand quadrant). Samples with high PC-1 scores come from lysimeters and groundwater wells, i.e., water that has had more contact with soil particles, and samples from precipitation and lake water have negative scores. DOC, which could not be included in the PCA because it was not analysed in all of the samples used for ICP-MS analyses, showed a high positive correlation with PC-1 scores (rs=0.95, p-value < 0.001). The second PC (PC-2) is driven by elements that originate from the ocean (e.g., Cl and Na), and that are delivered to the catchment with precipitation. In addition, a part of the variability in elements like Ca, Mg, Sr and K – which are all present in the precipitation but that could also be released during interaction with soil particles – is associated with PC-2. For PC-2 there is a split between samples from the lake on the positive side and precipitation on the negative side (with soil water samples in the middle). That the surface and lake water have considerably higher concentrations of elements not released by weathering (e.g., Cl) as compared to the precipitation indicates an enrichment caused by evapotranspiration (cf. Rydberg et al., 2023). The remaining three PCs are driven primarily by a small number of samples without any obvious trends, and they are therefore difficult to interpret in terms of processes. For the remainder of this paper, we will focus on PC-1 and PC-2, which both reflect processes that vary over the course of the year, e.g., depending on the source of the water, the air temperature and the intensity in the runoff.
3.7 Correlations between hydrology and chemical signature of surface and soil water
During the intense monitoring period samples for geochemical analyses were collected on three occasions (19, 25 and 31 May). During this period the hydrological modelling suggests that the total runoff as both groundwater and overland flow decreased (from 9.4 to 4.2 mm between 19 and 25 May), and that it then increased slightly to 6.0 mm on 31 May. During the same period the proportion of deep groundwater increased from 2.5 to 4.1 and finally 4.4 % of the total runoff. Looking at the PC-scores, both PC-1 and PC-2 scores increased over the intense monitoring period. The PC-1 scores went from −0.36 on 19 May, to −0.30 and then −0.25 on 31 May. For PC-2 the main shift occurred between 19 and 25 May when the score increased from −0.56 to −0.41. On 31 May the PC-2 score was essentially the same as on 25 May (−0.40). During this period DOC decreased from 20.8 to 13.5 mg L−1 and then increased to 14.7 mg L−1.
If we look at surface-water samples collected in the studied sub-catchment during the entire 2011–2019 period (n=7) the chemical signature in the surface water varies considerably. When the proportion of deep groundwater is high, there is an increase in the concentration of weathering products released from soil particles (i.e., PC-1 scores). This results in a positive correlation between PC-1 and the proportion of deep groundwater (rs=0.79, p=0.036). For elements where the source is mainly precipitation and that are enriched through evapotranspiration (i.e., PC-2), there is an increase in the concentrations as the total runoff decreases over the course of the unfrozen season. For example, PC-2 scores are positively correlated with day-of-year (DOY; rs=0.89, p=0.007), and there is a negative correlation between PC-2 scores and total runoff (, p=0.029). For the surface-water samples neither PC-1 nor PC-2 scores are correlated with DOC, but similar to PC-2 scores, DOC is negatively correlated with the total runoff (, p=0.017).
When looking at the lysimeters and groundwater wells – i.e., the soil water – a different pattern emerges. First, the chemical signature in the soil water is even more variable compared to the surface water. Second, PC-1 and PC-2 are correlated (rs=0.47; p= 0.021), and both are correlated with DOC (r=0.92, p=0.001 and r=0.86, p=0.001, respectively). This indicates that even if the processes driving PC-1 (weathering), PC-2 (evapotranspiration) and DOC (organic matter decomposition) are not related, there is a tendency that soil water is enriched in all three in a similar way. In the soil water, DOC shows a negative correlation with total runoff (, p<0.001), while neither PC-1 nor PC-2 scores for the soil water are correlated with any of the hydrological variables, and neither PC-1, PC-2 nor DOC are correlated with sampling depth.
4.1 Young water and shallow flow paths dominate runoff
The output from the extended hydrological modelling period (2013–2019) largely corroborates the findings from the original modelling period (2011–2013; Johansson et al., 2015a). In brief, Two-Boat Lake is situated in a dry periglacial landscape, where a considerable fraction of the precipitation (55 %–80 %) is lost through evapotranspiration in the terrestrial system (including sublimation), and where surface water runoff is almost exclusively confined to high flow situations, primarily the snowmelt period. That there are no major differences in the hydrological situation between the two periods is consistent with findings that the study area has not experienced any significant change in climate over the period from 2001 to 2019, even though a long-term (1981–2019) warming trend has been suggested for the region (Hanna et al., 2021). All years except 2017, which was slightly wetter (405 mm yr−1) compared to the previously wettest year (i.e., 2012, 366 mm yr−1), fall within the range of 2011–2013 for precipitation, evapotranspiration and total runoff from the catchment to the lake (Fig. 2). The annual pattern in runoff is also very similar. Runoff is highest during the snowmelt period, which accounts for about half of the annual runoff to the lake (Johansson et al., 2015a). During summer the total runoff decreases as a response to increased evapotranspiration, which generally exceeds the input of water during this period. When evapotranspiration decreases in the fall (August-September) there is generally a slight increase in the total runoff before the active layer freezes (Fig. 2).
According to our particle tracking simulation most of the groundwater that moves through the sub-catchment is young, especially during the snowmelt period when almost all water in the saturated zone is less than 1-year old. This is consistent with studies of water transit times in other permafrost areas using tracer methods (e.g. Cochand et al., 2020; Tetzlaff et al., 2018; Throckmorton et al., 2016). Another interesting result of the particle tracking simulation is that there is virtually no groundwater in the active layer that is more than ten years old. Again, this is consistent with other studies in areas with continuous permafrost (Walvoord and Kurylyk, 2016). That a high proportion of the water reaching a stream is young is common for all climate zones (Jasechko et al., 2016). For example, in a similar particle tracking simulation, but made for a boreal forested catchment without permafrost, most of the groundwater also was between 0.8- and 3.7-years old (Jutebring Sterte et al., 2021b). However, unlike for the Two-Boat Lake catchment, where the maximum age of groundwater was a few years, a considerable fraction (∼ 25 %) of the groundwater in the boreal system had an age of between 10 and 1000 years. This old groundwater increases the average groundwater age substantially and can explain why areas without permafrost generally have an older average groundwater age compared to areas with continuous permafrost (Hiyama et al., 2013; Wang et al., 2022). Older mobile groundwater can make an important contribution to surface waters also in areas with continuous permafrost, but it requires the presence of through taliks that connect the deep groundwater system below the permafrost with the surface system (Koch et al., 2024). Two-Boat Lake has such a through talik, but the flow is directed downwards, and hence, there is no discharge of sub-permafrost groundwater in the surface system (Johansson et al., 2015a). It should be noted that our model only simulates the age of groundwater in the saturated zone, and that during the snowmelt period runoff occurs also as overland flow in the temporary stream network. Therefore, our simulated water ages cannot be directly compared to results from tracer-based methods.
Even if the groundwater in Two-Boat Lake generally is young, there is a clear seasonal trend with increasing water age as the unfrozen season progresses. This pattern can be seen in the 0–25 cm layer, but it is especially pronounced in the 25–50 cm layer (Fig. 3). At the deepest layer, i.e., 50–75 cm, there is no clear seasonal trend, but most of the water that moves in this layer is older than two years. These patterns imply several things. First, the movement of water in the uppermost layer (i.e., 0–25 cm) is mostly restricted to the snowmelt period, and as the thaw depth increases, the groundwater takes deeper flow paths. Similar patterns have been documented from other permafrost regions (Juhls et al., 2020; Lebedeva, 2019; Zastruzny et al., 2024). Second, the turnover time of the water in the uppermost layer is short, but the time that the water has spent in contact with the soil particles increases as the unfrozen season progresses. Third, for the deepest analysed layer (i.e., 50–75 cm) the turnover time is longer, and most of the water has spent several seasons in contact with the soil particles and undergone at least one freeze-thaw cycle.
4.2 The effects of fast and shallow flow paths on the water chemistry
Most of the variability in water chemistry can be explained by either the amount of weathering products (PC-1) that have been released from soil particles or the degree of evaporative loss the water has experienced (PC-2; Fig. 5). Because the PC-1 and PC-2 scores for the surface-water samples are correlated to different hydrological variables from the hydrological modelling it seems as if these two components are influenced by separate processes. For surface water, PC-2 scores – which represent elements supplied with precipitation and that are concentrated through evapotranspiration – show a negative correlation with total runoff. In spring, when large volumes of snowmelt water move through the system, the chemical signature is more diluted and closer to that of precipitation. The PC-2 scores then progressively increase over the unfrozen season, and the chemical signature of the surface water shifts towards a signature that is more characteristic of the lake water. This implies that as the water from precipitation moves through the catchment and is exposed to evapotranspiration, it becomes more concentrated in elements that were present in the precipitation when it was deposited (e.g., chlorine, Cl). This interpretation is also consistent with the PC-2 scores being positively correlated with DOY, and with water ages increasing as the unfrozen season progresses (Fig. 3). That evapotranspiration is an important process in this dry landscape can also be seen in the hydrological model, where two-thirds to four-fifths of the annual precipitation leaves the terrestrial system as sublimation or evapotranspiration. This loss of water translates to a concentration factor of 3–5, which is consistent with the 3.3 times increase in Cl concentration between precipitation and surface water (Table S2). Chlorine is almost exclusively supplied via precipitation and is often used as a conservative tracer for the input of solutes via precipitation (Johnson et al., 2000; Lockwood et al., 1995).
For elements supplied through weathering it is not the amount of runoff that is of importance for the concentration in surface waters. Instead, it is the proportion of runoff classified as deep groundwater (i.e., 50–75 cm depth in our model) that is correlated to the PC-1 scores. In July and August, when the proportion of deep groundwater in the runoff is high, the particle tracking suggests that the majority of the groundwater has spent more than two years in the saturated zone (Fig. 3). From the soil-water samples we can see that this water is rich in weathering products (i.e., higher PC-1 scores, Fig. 5), something that has also been shown in studies in other systems and other regions (Jutebring Sterte et al., 2021b; Williams et al., 2015). When looking at the concentrations of calcium (Ca, supplied both via precipitation and weathering), lanthanum (La; supplied primarily via weathering) and Cl in samples from precipitation and surface water they show different enrichment patterns (Deer et al., 1992; Johnson et al., 2000). As mentioned above, Cl increases about 3.3 times between precipitation and surface water, and the enrichment can therefore be explained by evapotranspiration alone. For La and Ca the difference is higher, 7.8 and 10 times, respectively (Table S2), which indicates that these elements must also be supplied by an internal process in the catchment (e.g., weathering). This interpretation is also in line with the mass-balance budget that Rydberg et al. (2023) developed for Two-Boat Lake, which suggests that La is exclusively supplied by weathering, Cl almost exclusively via precipitation and Ca is supplied by both processes.
Even if DOC was not measured on all sampling occasions, and could not be included in the PCA, the correlation between PC-1, PC-2 and DOC helped us to assess if organic carbon behaves like weathering products or elements supplied with precipitation. For the surface-water samples there is no correlation between PC-1, PC-2 and DOC, but similarly to PC-2, DOC is negatively correlated with the total runoff. The different behaviours of weathering products (PC-1) and DOC could be related to where in the soil profile these products originate. DOC production is highest in the uppermost soil layer, where the decomposition of relatively fresh OM is highest (Clark et al., 2008). These surficial layers thaw relatively rapidly, and hence, the DOC source is activated already during the snowmelt period. This means that, like the elements represented by PC-2, DOC is diluted when the runoff is high. However, unlike the elements that are constantly resupplied with the precipitation, DOC in the upper soil layers can become depleted with time, and PC-2 and DOC are therefore not correlated (Stewart et al., 2022). Weathering products on the other hand are primarily produced deeper in the soil profile (Cai et al., 2008; Fouché et al., 2021), and it is not until later in the season when these deeper layers thaw that the proportion of deep groundwater in the runoff increases. A similar shift in the chemical composition when the thaw in the active layer reaches below the upper organic-rich soil layer, has been observed in other areas with continuous permafrost (Cai et al., 2008; Chiasson-Poirier et al., 2020).
Looking at the soil water from lysimeters and groundwater wells, PC-1, PC-2 and DOC are all correlated, which would indicate that the soil water is enriched in both weathering products, elements supplied with precipitation and DOC. One explanation for this is that a high DOC concentration can also lead to a higher solubility of many elements, particularly weathering products that otherwise can have a low solubility in water (Broder and Biester, 2015; Lidman et al., 2017). That soil and groundwater is enriched in many elements is also consistent with previous studies that have shown that deeper and older groundwater often has elevated concentrations for a large selection of elements (Clark et al., 2008; Fouché et al., 2021; Stewart et al., 2022). Unlike previous studies in Greenland (Jessen et al., 2014), neither PC-1, PC-2 or DOC showed any correlation with sampling depth. This likely has several reasons. First, the depths where the lysimeters are installed (15, 30 and 35 cm) correspond to the two upper layers used in the particle tracking simulation (i.e., 0–25 and 25–50 cm). In these two layers the age of the water is relatively similar, and it is possible that a clearer pattern would have emerged if the deepest lysimeter had been placed in the 50–75 cm layer used in the particle tracking simulation where the water is considerably older. Second, because they are frozen longer the deeper lysimeters could only be sampled late in the season when the total runoff was low. The lack of trend with depth could therefore also be a result of this bias in the data. Third, the generally similar age for the two upper layers in the particle tracking simulation suggests that there is a considerable vertical movement of water in the upper part of the thin unfrozen layer. This results in mixing of the water and would prevent the development of a consistent vertical trend in the chemical signature of the water.
4.3 Variability in thaw rates during snowmelt on different timescales
Similar to the original modelling period (Johansson et al., 2015a), the runoff during the entire 2011–2019 period was dominated by groundwater, either directly to the lake or via temporary surface streams. The addition of the extended modelling period did, however, reveal much more between-year variability. Even though the annual precipitation was relatively similar between 2014, 2015, 2016 and 2018 (247, 284, 286 and 261 mm yr−1, respectively) the amount of overland flow varied considerably. 2014 and 2015 had a very low contribution of overland flow (less than 15 % of total runoff), whereas in 2016 and 2018 around 50 % of the annual runoff occurred as overland flow either directly to the lake or via temporary surface streams. These differences in the partitioning between groundwater and overland flow from one year to the other can likely be linked to a combination of the amount of accumulated snow in the catchment, the timing of the snowmelt period and the hydrological conditions during the preceding year.
During the winters preceding the snowmelt periods of 2014 and 2015 the amount of winter precipitation (October to March) was relatively close to the average (105 and 155 mm, respectively) and the snowmelt period started relatively late (mid to late May), indicating a rapid thaw in the active layer due to higher temperatures and longer days. This resulted in a low proportion of the runoff leaving as overland flow during these years. In 2016, considerably more snow fell during the preceding winter (220 mm) and the snowmelt started already in early April. Together this resulted in a higher proportion of the annual runoff leaving the catchment as overland flow. For 2018, the amount of accumulated snow was low (91 mm) and the snowmelt period started in mid-May, i.e., similarly to 2014 and 2015. Still, during 2018 a much larger percentage of the annual runoff left the terrestrial catchment as overland flow (52 %) compared to during 2014 and 2015. This can most likely be attributed to the preceding year, 2017, which was considerably wetter compared to all other years (407 mm yr−1 of annual precipitation). This resulted in a high soil moisture content and high groundwater levels when the active layer froze in the autumn of 2017. A high content of ground ice in the active layer implies that the capacity for infiltration during the snowmelt period was limited, and the latent heat content in the ice likely contributed to a slower thaw rate in the active layer in 2018 compared to other years (Clayton et al., 2021). As the ground surface thawed, the high soil moisture content may also have contributed to saturation-excess overland flow occurring during the late snowmelt and summer periods. For all other years, overland flow did not occur during summer, presumably because the generally dry conditions normally result in most water infiltrating the ground surface during summer. For example, observations in the field confirm that temporary surface streams normally only appear during limited periods during the snowmelt period and wet periods during fall.
While the long-term hydrological modelling indicated that interannual variability in thaw in the active layer can have an influence on runoff patterns, our field observations during the intense monitoring period revealed that – on a finer spatial scale – the hydrology also controls thaw rates. The thaw-depth monitoring during May 2017 showed that wet locations thawed significantly faster than drier locations. This would support earlier findings from areas with continuous permafrost, where variability in the active layer thickness has been attributed to the development of a hillslope groundwater drainage system (Chiasson-Poirier et al., 2020). The fastest thaw rates and largest thaw depths in the Two-Boat Lake catchment were measured in wet locations and directly under the temporary surface streams. This would suggest that advective heat transport with surface water and near-surface groundwater plays an important role in determining the thaw rate, as has been observed elsewhere in the Arctic (Dagenais et al., 2020; de Grandpré et al., 2012; Sjöberg et al., 2016). When compared to earlier investigations in the Two-Boat Lake catchment, it is noticeable that the maximum measured thaw depth during the intense monitoring period (48 cm on 31 May), was almost the same as the average active layer thickness observed for the same vegetation type (i.e., wetland) in August 2011 (Petrone et al., 2016). This indicates that the ground in connection to temporary surface streams thaws rapidly during the snowmelt period, but that the rate of thaw is much slower during the remainder of the summer season. At the drier location where the ground temperatures are monitored down to 2 m depth the thaw developed slower. In 2017 the 50 and 75 cm sensors reached temperatures above zero on 9 June and 27 July, respectively (i.e., considerably later than under the temporary stream). Taken together with the drier locations having deeper maximum thaw depths compared to wetlands (70–80 cm; Petrone et al., 2016), this indicates that even if wetter locations thaw more rapidly in spring due to advective heat transfer, the effect of the latent heat in wet soils becomes more important in determining the maximum thaw depth later in the season.
This fine-scale variability in thaw rates in the active layer was not included in our hydrological modelling and subsequent particle tracking simulation. The finding that the thaw rate is faster under the temporary stream network means that deeper soil layers are activated earlier than expected from the ground temperature loggers used by the model simulation. This suggests that water that reaches the lake during the snowmelt period may be more affected by the interaction with soil particles and pre-event water than our modelling indicates. It also suggests that our simulated groundwater ages may be an underestimate of water age early in the season.
4.4 The influence of melting ground ice on the chemical composition during the snowmelt period
Looking at the isotopic composition of the surface water samples from the Two-Boat Lake catchment, they are heavier for both the hydrogen (δD) and oxygen (δ18O) than surface waters from Pituffik in northern Greenland (Akers et al., 2024), the Scotty Creek drainage system in Canada (Hayashi et al., 2004), and surface waters from the Yukon region of Canada and Alaska (Lachniet et al., 2016; Fig. S1 in the Supplement). This heavier signal is likely related to dominant wind patterns and relatively warm sea surface temperatures in the source area for the water that falls as rain and snow on the Two-Boat Lake catchment (Sodemann et al., 2008; Fig. S1). For the stable isotopic composition in stream samples collected during the intense monitoring period there is a temporal trend that roughly follows the evaporation line (Fig. 5B). On the one hand, this could suggest fractionation during evapotranspiration, sublimation, condensation, and freezing–thawing processes. On the other hand, there is a deviation away from the evaporation line toward the composition of rain and ground ice during the end of the intense monitoring period (Fig. 5B). This suggest that the deviation is driven by an increased influence of water from melting ground ice as the thaw depth increases over the monitoring period. This would be consistent with the mixing model, which suggests a larger contribution of water from rain and ground ice at the end of the monitoring period (Fig. 5C).
Ground ice that fills the pore spaces in the active layer (i.e., non-segregated ground ice) most likely formed from the water present in the active layer the previous fall when the ground froze (although some infiltration and migration of meltwater during warm periods in winter cannot be completely excluded). According to the particle tracking simulation, most water that was present in the active layer during the fall freeze-up is at least one year old, and a substantial fraction is older than four years. This implies that the ground ice consists of a mixture of water from summer and winter precipitation, which can explain that the stable isotopic composition of ground ice falls between snow and rain (Fig. 5B). That the groundwater carries an isotopic signal from summer and winter precipitation is consistent with observations in the continuous permafrost zone in northern Canada (Tetzlaff et al., 2018, Wilcox et al., 2022), whereas findings in lowland polygonal tundra in the continuous permafrost zone in Alaska indicate that winter precipitation did not contribute to the stable isotopic signature of active layer pore waters (Throckmorton et al., 2016).
Similar to the stable isotopic signature, there was a shift in the chemical signature during the intense monitoring period. PC-1 increased, PC-2 first increased and then remained stable, while DOC first decreased and then increased slightly. The increase in PC-1 is consistent with patterns observed over the entire unfrozen period, i.e., PC-1 increase when the proportion of deep groundwater in the runoff increase. For PC-2 there is an increase from 19 to 25 May when the total runoff decreases, which is consistent with the entire unfrozen period (Fig. 5A). However, when the total runoff then increases again to 31 May, the PC-2 scores remain virtually unchanged. The DOC decreases when the total runoff decreases from 19 to 25 May, and it then increases slightly until 31 May. This suggests that the chemical signature is not merely a question of more or less water, we also need to consider where the water comes from. From the stable isotopic signature of the ground ice, we can see that there is a considerable influence of melting ground ice over the intense monitoring period. The water from this melting ground ice will not only be isotopically heavier (δD and δ18O) compared to the meltwater from snow, it will also be enriched in elements related to both PC-1, PC-2 and have a higher DOC concentration. That thaw of ground ice and permafrost has a profound effect on the chemical signature of soil water in permafrost regions has also been reported from sites in Alaska (Fouché et al., 2021), and the importance of pre-event water have been shown for a wide variety of environmental settings (Fischer et al., 2017; Juhls et al., 2020; Ross et al., 2017). Furthermore, presumably most of the water from melted ground ice comes from the near stream zone, where the thaw rate is highest. This suggests that these temporary “riparian” zones are important for the evolution of the stable isotopic and chemical signature of the surface water, which is analogous to the importance of the riparian zone in other systems (Jutebring Sterte et al., 2022; Lidman et al., 2017).
Our field measurements of thaw rates in the active layer during the 2017 snowmelt period shows that, even if drier areas tend to have a thicker active layer in August (Petrone et al., 2016), areas in connection with temporary surface streams thaw more rapidly early in the unfrozen season. The rapid formation of an unfrozen zone beneath these temporary streams allows meltwater to interact with soil particles and pre-event water already early in the snowmelt period. This is reflected in, e.g., the stable isotopic signature of stream water, which initially resembles that of snow but quickly shifts toward a signature more similar to melting ground ice that consists of a mixture of rain and snow from previous seasons.
Based on the hydrological modelling, we can also conclude that although interannual differences in the hydrological conditions can result in up to half of the runoff occurring as overland flow in some years, runoff to Two-Boat Lake is generally dominated by groundwater. Even if most of this groundwater is less than one year, the particle tracking simulation shows that a considerable fraction of the water in deeper soil layers (i.e., 50–75 cm) is older than three years. The proportion of this old and “deep” groundwater is an important factor for controlling the chemical signature of the water entering Two-Boat Lake, especially for elements released through weathering. However, although the interaction between the runoff and soil particles is important, it is not the only process influencing the chemical signature of the runoff. For elements supplied via precipitation, our data suggest that in this dry landscape, evapotranspiration also has a strong influence on the concentrations of elements in the runoff.
Taken together, this indicates that even if runoff is dominated by the snowmelt period, groundwater generally is young, and continuous permafrost restricts water movement to the thin active layer, there is a strong connection between terrestrial processes and the chemical signature of the runoff. This connection is especially important when considering the substantial variability in both hydrological conditions and thaw rates – both spatially and temporally – and it highlights the importance of considering the effect of soil processes and mixing with pre-event water when assessing water quality and element transport in Arctic landscapes with continuous permafrost.
The data used in this study is available mainly through three publications, Johansson et al. (2015b), Lindborg et al. (2016) and Petrone et al. (2016), each with an adjoined Pangaea dataset. For Johansson et al. (2015b) and Lindborg et al. (2016) data covering the period up to August 2019 are available through two additional Pangaea datasets that are linked to the original publications. Meteorological data from the automated weather station (labelled KAN_B) is available via https://www.promice.org (last access: 8 December 2025). A summary of the different datasets used in this publication can be found in Table S1.
The supplement related to this article is available online at https://doi.org/10.5194/tc-20-47-2026-supplement.
JR: Conceptualization, Formal analysis, Investigation, Writing – Original draft, EL: Conceptualization, Methodology, Formal analysis, Writing – Review & Editing, CB: Formal analysis, Writing – Review & Editing, BMCF: Writing – Review & Editing, TL: Conceptualization, Investigation, Writing – Review & Editing, YS: Conceptualization, Formal analysis, Investigation, Writing – Original draft.
At least one of the (co-)authors is a member of the editorial board of The Cryosphere. The peer-review process was guided by an independent editor, and the authors also have no other competing interests to declare.
Publisher's note: Copernicus Publications remains neutral with regard to jurisdictional claims made in the text, published maps, institutional affiliations, or any other geographical representation in this paper. The authors bear the ultimate responsibility for providing appropriate place names. Views expressed in the text are those of the authors and do not necessarily reflect the views of the publisher.
This article is part of the special issue “Northern hydrology in transition – impacts of a changing cryosphere on water resources, ecosystems, and humans (TC/HESS inter-journal SI)”. It is not associated with a conference.
We thank all people that has helped out with fieldwork during the GRASP and CatchNet-projects. We also thank the editor and two anonymous reviewers for valuable input during the review process.
This study was funded by Swedish nuclear fuel and waste management company (SKB) within the Greenland Analogue Surface Project (GRASP) and CatchNet project.
The publication of this article was funded by the Swedish Research Council, Forte, Formas, and Vinnova.
This paper was edited by Svetlana Stuefer and reviewed by two anonymous referees.
Akers, P. D., Kopec, B. G., Klein, E. S., Bailey, H., and Welker, J. M.: The Pivotal Role of Evaporation in Lake Water Isotopic Variability Across Space and Time in a High Arctic Periglacial Landscape, Water Resour. Res., 60, e2023WR036121, https://doi.org/10.1029/2023WR036121, 2024.
Alvarez, M. D., Carol, E., and Dapeña, C.: The role of evapotranspiration in the groundwater hydrochemistry of an arid coastal wetland (Peninsula Valdes, Argentina), Sci. Total Environ., 506, 299–307, https://doi.org/10.1016/j.scitotenv.2014.11.028, 2015.
Böcher, T. W.: Climate, soil, and lakes in continental West Greenland in relation to plant life, C.A. Reitzel, København, 1949.
Bosson, E., Selroos, J. O., Stigsson, M., Gustafsson, L. G., and Destouni, G.: Exchange and pathways of deep and shallow groundwater in different climate and permafrost conditions using the Forsmark site, Sweden, as an example catchment, Hydrogeol. J., 21, 225–237, https://doi.org/10.1007/s10040-012-0906-7, 2013.
Bring, A., Fedorova, I., Dibike, Y., Hinzman, L., Mård, J., Mernild, S. H., Prowse, T., Semenova, O., Stuefer, S. L., and Woo, M. K.: Arctic terrestrial hydrology: A synthesis of processes, regional effects, and research challenges, J. Geophys. Res.-Biogeo., 121, 621–649, https://doi.org/10.1002/2015jg003131, 2016.
Broder, T. and Biester, H.: Hydrologic controls on DOC, As and Pb export from a polluted peatland – the importance of heavy rain events, antecedent moisture conditions and hydrological connectivity, Biogeosciences, 12, 4651–4664, https://doi.org/10.5194/bg-12-4651-2015, 2015.
Bush, R. T., Berke, M. A., and Jacobson, A. D.: Plant Water δD and δ18O of Tundra Species from West Greenland, Arct. Antarct. Alp. Res., 49, 341–358, https://doi.org/10.1657/AAAR0016-025, 2017.
Cai, Y. H., Guo, L. D., and Douglas, T. A.: Temporal variations in organic carbon species and fluxes from the Chena River, Alaska, Limnol. Oceanogr., 53, 1408–1419, https://doi.org/10.4319/lo.2008.53.4.1408, 2008.
Chiasson-Poirier, G., Franssen, J., Lafrenière, M. J., Fortier, D., and Lamoureux, S. F.: Seasona evolution of active layer thaw depth and hillslope-stream connectivity in a permafrost watershed, Water Resour. Res., 56, https://doi.org/10.1029/2019wr025828, 2020.
Claesson Liljedahl, L., Kontula, A., Harper, J., Näslund, J. O., Selroos, J.-O., Pitkänen, P., Puigdomenech, I., Hobbs, M., Follin, S., Hirschorn, S., Jansson, P., Kennell, L., Marcos, N., Rskeeniemi, T., Tullborg, E.-L., and Vidstrand, P.: The Greenland Analouge Project: Final Report, SKB, Stockholm, TR-14-13, ISSN 1404-0344, https://skb.se/publikation/2484498 (last access: 15 December 2025), 2016.
Clarhäll, A.: SKB studies of the periglacial environment – report from field studies in Kangerlussuaq, Greenland 2008 and 2010, Swedish Nuclear Fuel and Waste Management Co., P-11-05, https://skb.se/publikation/2213132 (last access: 15 December 2025), 2011.
Clark, J. M., Lane, S. N., Chapman, P. J., and Adamson, J. K.: Link between DOC in near surface peat and stream water in an upland catchment, Sci. Total Environ., 404, 308–315, https://doi.org/10.1016/j.scitotenv.2007.11.002, 2008.
Clayton, L. K., Schaefer, K., Battaglia, M. J., Bourgeau-Chavez, L., Chen, J., Chen, R. H., Chen, A., Bakian-Dogaheh, K., Grelik, S., Jafarov, E., Liu, L., Michaelides, R. J., Moghaddam, M., Parsekian, A. D., Rocha, A. V., Schaefer, S. R., Sullivan, T., Tabatabaeenejad, A., Wang, K., Wilson, C. J., Zebker, H. A., Zhang, T., and Zhao, Y.: Active layer thickness as a function of soil water content, Environ. Res. Lett., 16, 055028, https://doi.org/10.1088/1748-9326/abfa4c, 2021.
Cochand, M., Molson, J., Barth, J. A. C., van Geldern, R., Lemieux, J. M., Fortier, R., and Therrien, R.: Rapid groundwater recharge dynamics determined from hydrogeochemical and isotope data in a small permafrost watershed near Umiujaq (Nunavik, Canada), Hydrogeol. J., 28, 853–868, https://doi.org/10.1007/s10040-020-02109-x, 2020.
Condon, L. E., Markovich, K. H., Kelleher, C. A., McDonnell, J. J., Ferguson, G., and McIntosh, J. C.: Where Is the Bottom of a Watershed?, Water Resour. Res., 56, https://doi.org/10.1029/2019wr026010, 2020.
Dagenais, S., Molson, J., Lemieux, J. M., Fortier, R., and Therrien, R.: Coupled cryo-hydrogeological modelling of permafrost dynamics near Umiujaq (Nunavik, Canada), Hydrogeol. J., 28, 887–904, https://doi.org/10.1007/s10040-020-02111-3, 2020.
Deer, W. A., Howie, R. A., and Zussman, J.: An introduction to the rock-forming minerals, 2nd edn., Longman Scientific & Technical, Harlow, ISBN 0-582-30094-0, 1992.
de Grandpré, I., Fortier, D., and Stephani, E.: Degradation of permafrost beneath a road embankment enhanced by heat advected in groundwater, Can. J. Earth Sci., 49, 953–962, https://doi.org/10.1139/e2012-018, 2012.
EU: Guidance on Monitoring for the Water Framework Directive, https://environment.ec.europa.eu/topics/water/water-frame work-directive_en (last access: 15 December 2025), 2002.
Fischer, B. M. C., Rinderer, M., Schneider, P., Ewen, T., and Seibert, J.: Contributing sources to baseflow in pre-alpine headwaters using spatial snapshot sampling, Hydrol. Process., 29, 5321–5336, https://doi.org/10.1002/hyp.10529, 2015.
Fischer, B. M. C., Stähli, M., and Seibert, J.: Pre-event water contributions to runoff events of different magnitude in pre-alpine headwaters, Hydrol. Res., 48, 28–47, https://doi.org/10.2166/nh.2016.176, 2017.
Fouché, J., Bouchez, C., Keller, C., Allard, M., and Ambrosi, J. P.: Seasonal cryogenic processes control supra-permafrost pore water chemistry in two contrasting Cryosols, Geoderma, 401, https://doi.org/10.1016/j.geoderma.2021.115302, 2021.
Frey, K. E. and McClelland, J. W.: Impacts of permafrost degradation on arctic river biogeochemistry, Hydrol. Process., 23, 169–182, 2009.
Hanna, E., Cappelen, J., Fettweis, X., Mernild, S. H., Mote, T. L., Mottram, R., Steffen, K., Ballinger, T. J., and Hall, R.: Greenland surface air temperature changes from 1981 to 2019 and implications for ice-sheet melt and mass-balance change, Int. J. Climatol., 41, E1336–E1352, https://doi.org/10.1002/joc.6771, 2021.
Hayashi, M., Quinton, W. L., Pietroniro, A., and Gibson, J. J.: Hydrologic functions of wetlands in a discontinuous permafrost basin indicated by isotopic and chemical signatures, J. Hydrol., 296, 81–97, https://doi.org/10.1016/j.jhydrol.2004.03.020, 2004.
Hiyama, T., Asai, K., Kolesnikov, A. B., Gagarin, L. A., and Shepelev, V. V.: Estimation of the residence time of permafrost groundwater in the middle of the Lena River basin, eastern Siberia, Environ. Res. Lett., 8, https://doi.org/10.1088/1748-9326/8/3/035040, 2013.
Jasechko, S., Kirchner, J. W., Welker, J. M., and McDonnell, J. J.: Substantial proportion of global streamflow less than three months old, Nat. Geosci., 9, 126–129, https://doi.org/10.1038/ngeo2636, 2016.
Jessen, S., Holmslykke, H. D., Rasmussen, K., Richardt, N., and Holm, P. E.: Hydrology and pore water chemistry in a permafrost wetland, Ilulissat, Greenland, Water Resour. Res., 50, 4760–4774, https://doi.org/10.1002/2013WR014376, 2014.
Johansson, E., Gustafsson, L.-G., Berglund, S., Lindborg, T., Selroos, J.-O., Claesson Liljedahl, L., and Destouni, G.: Data evaluation and numerical modeling of hydrological interactions between active layer, lake and talik in a permafrost catchment, Western Greenland, J. Hydrol., 527, 688–703, 2015a.
Johansson, E., Berglund, S., Lindborg, T., Petrone, J., van As, D., Gustafsson, L.-G., Näslund, J.-O., and Laudon, H.: Hydrological and meteorological investigations in a periglacial lake catchment near Kangerlussuaq, west Greenland – presentation of a new multi-parameter data set, Earth Syst. Sci. Data, 7, 93–108, https://doi.org/10.5194/essd-7-93-2015, 2015b.
Johnson, C. E., Driscoll, C. T., Siccama, T. G., and Likens, G. E.: Element fluxes and landscape position in a northern hardwood forest watershed ecosystem, Ecosystems, 3, 159–184, 2000.
Juhls, B., Stedmon, C. A., Morgenstern, A., Meyer, H., Hölemann, J., Heim, B., Povazhnyi, V., and Overduin, P. P.: Identifying Drivers of Seasonality in Lena River Biogeochemistry and Dissolved Organic Matter Fluxes, Frontiers in Environmental Science, 8, https://doi.org/10.3389/fenvs.2020.00053, 2020.
Jutebring Sterte, E., Johansson, E., Sjöberg, Y., Karlsen, R. H., and Laudon, H.: Groundwater-surface water interactions across scales in a boreal landscape investigated using a numerical modelling approach, J. Hydrol., 560, 184–201, https://doi.org/10.1016/j.jhydrol.2018.03.011, 2018.
Jutebring Sterte, E., Lidman, F., Lindborg, E., Sjöberg, Y., and Laudon, H.: How catchment characteristics influence hydrological pathways and travel times in a boreal landscape, Hydrol. Earth Syst. Sci., 25, 2133–2158, https://doi.org/10.5194/hess-25-2133-2021, 2021a.
Jutebring Sterte, E., Lidman, F., Balbarini, N., Lindborg, E., Sjöberg, Y., Selroos, J.-O., and Laudon, H.: Hydrological control of water quality – Modelling base cation weathering and dynamics across heterogeneous boreal catchments, Sci. Total Environ., 799, 149101, https://doi.org/10.1016/j.scitotenv.2021.149101, 2021b.
Jutebring Sterte, E., Lidman, F., Sjöberg, Y., Ploum, S. W., and Laudon, H.: Groundwater travel times predict DOC in streams and riparian soils across a heterogeneous boreal landscape, Sci. Total Environ., 849, https://doi.org/10.1016/j.scitotenv.2022.157398, 2022.
Koch, J. C., Connolly, C. T., Baughman, C., Repasch, M., Best, H., and Hunt, A.: The dominance and growth of shallow groundwater resources in continuous permafrost environments, P. Natl. Acad. Sci. USA, 121, https://doi.org/10.1073/pnas.2317873121, 2024.
Lachniet, M. S., Lawson, D. E., Stephen, H., Sloat, A. R., and Patterson, W. P.: Isoscapes of δ18O and δ2H reveal climatic forcings on Alaska and Yukon precipitation, Water Resour. Res., 52, 6575–6586, https://doi.org/10.1002/2016WR019436, 2016.
Laudon, H., Köhler, S., and Buffam, I.: Seasonal TOC export from seven boreal catchments in northern Sweden, Aquat. Sci., 66, 223–230, 2004.
Laudon, H., Spence, C., Buttle, J., Carey, S. K., McDonnell, J. J., McNamara, J. P., Soulsby, C., and Tetzlaff, D.: Save northern high-latitude catchments, Nat. Geosci., 10, 324–325, https://doi.org/10.1038/ngeo2947, 2017.
Lebedeva, L.: Tracing surface and ground water with stable isotopes in a small permafrost research catchment, E3S Web Conf., 98, 12011, https://doi.org/10.1051/e3sconf/20199812011, 2019.
Lidman, F., Köhler, S. J., Mörth, C.-M., and Laudon, H.: Metal Transport in the Boreal Landscape – The Role of Wetlands and the Affinity for Organic Matter, Environ. Sci. Technol., 48, 3783–3790, https://doi.org/10.1021/es4045506, 2014.
Lidman, F., Boily, Å., Laudon, H., and Köhler, S. J.: From soil water to surface water – how the riparian zone controls element transport from a boreal forest to a stream, Biogeosciences, 14, 3001–3014, https://doi.org/10.5194/bg-14-3001-2017, 2017.
Lindborg, T., Rydberg, J., Tröjbom, M., Berglund, S., Johansson, E., Löfgren, A., Saetre, P., Nordén, S., Sohlenius, G., Andersson, E., Petrone, J., Borgiel, M., Kautsky, U., and Laudon, H.: Biogeochemical data from terrestrial and aquatic ecosystems in a periglacial catchment, West Greenland, Earth Syst. Sci. Data, 8, 439–459, https://doi.org/10.5194/essd-8-439-2016, 2016.
Lindborg, T., Rydberg, J., Andersson, E., Löfgren, A., Lindborg, E., Saetre, P., Sohlenius, G., Berglund, S., Kautsky, U., and Laudon, H.: A carbon mass-balance budget for a periglacial catchment in West Greenland – Linking the terrestrial and aquatic systems, Sci. Total Environ., 711, 134561, https://doi.org/10.1016/j.scitotenv.2019.134561, 2020.
Lockwood, P. V., McGarity, J. W., and Charley, J. L.: Measurement of chemical weathering rates using natural chloride as a tracer, Geoderma, 64, 215–232, https://doi.org/10.1016/0016-7061(94)00010-8, 1995.
Lyon, S. W., Mörth, M., Humborg, C., Giesler, R., and Destouni, G.: The relationship between subsurface hydrology and dissolved carbon fluxes for a sub-arctic catchment, Hydrol. Earth Syst. Sci., 14, 941–950, https://doi.org/10.5194/hess-14-941-2010, 2010a.
Lyon, S. W., Laudon, H., Seibert, J., Mörth, M., Tetzlaff, D., and Bishop, K. H.: Controls on snowmelt water mean transit times in northern boreal catchments, Hydrol. Process., 24, 1672–1684, https://doi.org/10.1002/hyp.7577, 2010b.
O'Connor, M. T., Cardenas, M. B., Neilson, B. T., Nicholaides, K. D., and Kling, G. W.: Active Layer Groundwater Flow: The Interrelated Effects of Stratigraphy, Thaw, and Topography, Water Resour. Res., 55, 6555–6576, https://doi.org/10.1029/2018WR024636, 2019.
Penna, D., Stenni, B., Šanda, M., Wrede, S., Bogaard, T. A., Gobbi, A., Borga, M., Fischer, B. M. C., Bonazza, M., and Chárová, Z.: On the reproducibility and repeatability of laser absorption spectroscopy measurements for δ2H and δ18O isotopic analysis, Hydrol. Earth Syst. Sci., 14, 1551–1566, https://doi.org/10.5194/hess-14-1551-2010, 2010.
Petrone, J., Sohlenius, G., Johansson, E., Lindborg, T., Näslund, J.-O., Strömgren, M., and Brydsten, L.: Using ground-penetrating radar, topography and classification of vegetation to model the sediment and active layer thickness in a periglacial lake catchment, western Greenland, Earth Syst. Sci. Data, 8, 663–677, https://doi.org/10.5194/essd-8-663-2016, 2016.
Refsgaard, J. C., Storm, B., and Clausen, T.: Système Hydrologique Europeén (SHE): review and perspectives after 30 years development in distributed physically-based hydrological modelling, Hydrol. Res., 41, 355–377, https://doi.org/10.2166/nh.2010.009, 2010.
Quinton, W. L. and Pomeroy, J. W.: Transformations of runoff chemistry in the Arctic tundra, Northwest Territories, Canada, Hydrol. Process., 20, 2901–2919, 2006.
Rantanen, M., Karpechko, A. Y., Lipponen, A., Nordling, K., Hyvärinen, O., Ruosteenoja, K., Vihma, T., and Laaksonen, A.: The Arctic has warmed nearly four times faster than the globe since 1979, Communications Earth & Environment, 3, https://doi.org/10.1038/s43247-022-00498-3, 2022.
Ross, C. A., Ali, G., Bansah, S., and Laing, J. R.: Evaluating the Relative Importance of Shallow Subsurface Flow in a Prairie Landscape, Vadose Zone J., 16, https://doi.org/10.2136/vzj2016.10.0096, 2017.
Rydberg, J., Lindborg, T., Solenius, G., Reuss, N., Olsen, J., and Laudon, H.: The importance of eolian input on lake-sediment geochemical-composition in the dry proglacial landscape of western Greenland, Arct. Antarct. Alp. Res., 48, 93–109, https://doi.org/10.1657/AAAR0015-009, 2016.
Rydberg, J., Lindborg, T., Lidman, F., Tröjbom, M., Berglund, S., Lindborg, E., Kautsky, U., and Laudon, H.: Biogeochemical cycling in a periglacial environment – A multi-element mass-balance budget for a catchment in West Greenland, CATENA, 231, 107311, https://doi.org/10.1016/j.catena.2023.107311, 2023.
Sjöberg, Y., Coon, E., Sannel, A. B. K., Pannetier, R., Harp, D., Frampton, A., Painter, S. L., and Lyon, S. W.: Thermal effects of groundwater flow through subarctic fens: A case study based on field observations and numerical modeling, Water Resour. Res., 52, 1591–1606, https://doi.org/10.1002/2015wr017571, 2016.
Sodemann, H., Masson-Delmotte, V., Schwierz, C., Vinther, B. M., and Wernli, H.: Interannual variability of Greenland winter precipitation sources: 2. Effects of North Atlantic Oscillation variability on stable isotopes in precipitation, J. Geophys. Res.-Atmos., 113, https://doi.org/10.1029/2007JD009416, 2008.
Sprenger, M., Stumpp, C., Weiler, M., Aeschbach, W., Allen, S. T., Benettin, P., Dubbert, M., Hartmann, A., Hrachowitz, M., Kirchner, J. W., McDonnell, J. J., Orlowski, N., Penna, D., Pfahl, S., Rinderer, M., Rodriguez, N., Schmidt, M., and Werner, C.: The Demographics of Water: A Review of Water Ages in the Critical Zone, Rev. Geophys., 57, 800–834, https://doi.org/10.1029/2018rg000633, 2019.
Stewart, B., Shanley, J. B., Kirchner, J. W., Norris, D., Adler, T., Bristol, C., Harpold, A. A., Perdrial, J. N., Rizzo, D. M., Sterle, G., Underwood, K. L., Wen, H., and Li, L.: Streams as Mirrors: Reading Subsurface Water Chemistry From Stream Chemistry, Water Resour. Res., 58, e2021WR029931, https://doi.org/10.1029/2021WR029931, 2022.
Tetzlaff, D., Piovano, T., Ala-Aho, P., Smith, A., Carey, S. K., Marsh, P., Wookey, P. A., Street, L. E., and Soulsby, C.: Using stable isotopes to estimate travel times in a data-sparse Arctic catchment: Challenges and possible solutions, Hydrol. Process., 32, 1936–1952, https://doi.org/10.1002/hyp.13146, 2018.
Throckmorton, H. M., Newman, B. D., Heikoop, J. M., Perkins, G. B., Feng, X. H., Graham, D. E., O'Malley, D., Vesselinov, V. V., Young, J., Wullschleger, S. D., and Wilson, C. J.: Active layer hydrology in an arctic tundra ecosystem: quantifying water sources and cycling using water stable isotopes, Hydrol. Process., 30, 4972–4986, https://doi.org/10.1002/hyp.10883, 2016.
van Gool, J., Marker, M., and Mengel, F.: The palaeoproterozoic Nagssugtoqidian orogen in West Greenland: current status of work by the Danish lithosphere centre, Bulletin Grønlands Geologiske Undersøgelse, 172, 88–94, 1996.
Vonk, J. E., Tank, S. E., Bowden, W. B., Laurion, I., Vincent, W. F., Alekseychik, P., Amyot, M., Billet, M. F., Canário, J., Cory, R. M., Deshpande, B. N., Helbig, M., Jammet, M., Karlsson, J., Larouche, J., MacMillan, G., Rautio, M., Walter Anthony, K. M., and Wickland, K. P.: Reviews and syntheses: Effects of permafrost thaw on Arctic aquatic ecosystems, Biogeosciences, 12, 7129–7167, https://doi.org/10.5194/bg-12-7129-2015, 2015.
Walvoord, M. A. and Kurylyk, B. L.: Hydrologic Impacts of Thawing Permafrost – A Review, Vadose Zone J., 15, https://doi.org/10.2136/vzj2016.01.0010, 2016.
Wang, S., He, X., Kang, S., Fu, H., and Hong, X.: Estimation of stream water components and residence time in a permafrost catchment in the central Tibetan Plateau using long-term water stable isotopic data, The Cryosphere, 16, 5023–5040, https://doi.org/10.5194/tc-16-5023-2022, 2022.
Wilcox, E. J., Wolfe, B. B., and Marsh, P.: Assessing the influence of lake and watershed attributes on snowmelt bypass at thermokarst lakes, Hydrol. Earth Syst. Sci., 26, 6185–6205, https://doi.org/10.5194/hess-26-6185-2022, 2022.
Williams, M. W., Hood, E., Molotch, N. P., Caine, N., Cowie, R., and Liu, F. J.: The 'teflon basin' myth: hydrology and hydrochemistry of a seasonally snow-covered catchment, Plant Ecol. Divers., 8, 639–661, https://doi.org/10.1080/17550874.2015.1123318, 2015.
Winnick, M. J., Carroll, R., Williams, K., Maxwell, R., Dong, W., and Maher, K.: Snowmelt controls on concentration-discharge relationships and the balance of oxidative and acid-base weathering fluxes in an alpine catchment, East River, Colorado, Water Resour. Res., 53, https://doi.org/10.1002/2016WR019724, 2017.
Zastruzny, S. F., Sjöberg, Y., Jensen, K. H., Liu, Y. J., and Elberling, B.: Impact of Summer Air Temperature on Water and Solute Transport on a Permafrost-Affected Slope in West Greenland, Water Resour. Res., 60, https://doi.org/10.1029/2023wr036147, 2024.