the Creative Commons Attribution 4.0 License.
the Creative Commons Attribution 4.0 License.
 | 15 Jan 2026
Ephemeral grounding on the Pine Island Ice Shelf, West Antarctica, from 2014–2023
Yite Chien
Chunxia Zhou
Sainan Sun
Yiming Chen
Tao Wang
Baojun Zhang
Ephemeral grounding refers to the intermittent contact between an ice shelf and elevated seafloor features. The evolution of ephemeral grounding of an ice shelf can affect buttressing, alter ice flow dynamics, and influence ice shelf stability. Long-term observations of ephemeral grounding sites are crucial for understanding how thickness, basal conditions, and tidal interactions evolve over time. Vertical displacement data derived from Sentinel-1A/B imagery reveals the history of ephemeral grounding events at PIIS from 2014–2023. Our results suggest that ephemeral grounding at an ice rumple is modulated by the interaction between tidal forcing, ice shelf thickness, and evolving sub-ice-shelf geometry. A prominent central keel, shaped by inherited bed topography, promotes repeated contact with a submarine ridge. Landsat-8 images reveal that the rifts that cause the 2020 calving event may have formed due to the ice shelf grounding at the study site. These findings provide new insights into the mechanisms driving ephemeral grounding behaviour and highlight its potential role in modulating ice shelf stability.
- Article
(10560 KB) - Full-text XML
-
Supplement
(319 KB) - BibTeX
- EndNote


Ice discharge from the Antarctic Ice Sheet is a major contributor to global sea-level rise (Shepherd et al., 2012; Bamber et al., 2018; Smith et al., 2020). This discharge is regulated in part by ice shelves, which exert a buttressing that resists upstream ice flow. However, in many regions, the buttressing capacity of ice shelves has been reduced by processes such as ice shelf thinning, calving events, grounding line retreat, unpinning from topographic highs, and the disintegration of shear margins (Fürst et al., 2016; Gudmundsson et al., 2019; Lhermitte et al., 2020; Miles and Bingham, 2024; Walker et al., 2024; Fricker et al., 2025).
A prominent example of these dynamics can be seen in the Amundsen Sea sector of West Antarctica, which accounts for over 31 % of the continent's total ice loss (Smith et al., 2020). Within this sector, the Pine Island Glacier (PIG) basin alone contributed approximately 3.0 mm to global sea-level rise between 1979 and 2017 (Rignot et al., 2019). The PIG ice front has retreated approximately 26 km since 2015, with calving frequency increasing from intervals of about six years to every one to two years (Depoorter et al., 2013; Mouginot et al., 2014; Paolo et al., 2015; Arndt et al., 2018; Shepherd et al., 2018; Qi et al., 2021; Joughin et al., 2021). Following three major calving events in 2017, 2018, and 2020, the ice shelf experienced a >12 % speedup relative to 2017, coinciding with a 19 km retreat of the ice front (Joughin et al., 2021).
The recent dynamic changes at PIG have been driven mostly by enhanced basal melting, caused by the intrusion of warm modified Circumpolar Deep Water (mCDW) beneath the ice shelf (Jenkins et al., 2010; Jacobs et al., 2011; Pritchard et al., 2012; Hillenbrand et al., 2017; Smith et al., 2017; Davies et al., 2017; Shean et al., 2019). This oceanic forcing initially caused transient grounding of the central ice shelf on a submarine ridge from the 1940s through the 1970s, followed by complete ungrounding between 1973 and 1989 (Jenkins et al., 2010; Smith et al., 2017; Miles and Bingham, 2024). Continued ice shelf thinning subsequently drove an ∼8.7 km retreat of the grounding line along the main trunk between 1992 and 2009, resulting in further ungrounding from an ice plain (Corr et al., 2001; Joughin et al., 2010; Dutrieux et al., 2014; Rignot et al., 2014). Despite the grounding line retreat, the Pine Island Ice Shelf (PIIS) was observed to maintain intermittent contact with the bathymetric high when a thick ice column being advected from the upstream deep trough (Joughin et al., 2016; Lowery et al., 2025). This region is referred to as ice rumple L (Fig. 1) in the study by Rignot et al. (2014). This ephemeral grounding is now attributed to interactions between sub-ice keels and a submarine ridge (Graham et al., 2013; Joughin et al., 2016; Shean, 2016; Davies et al., 2017).
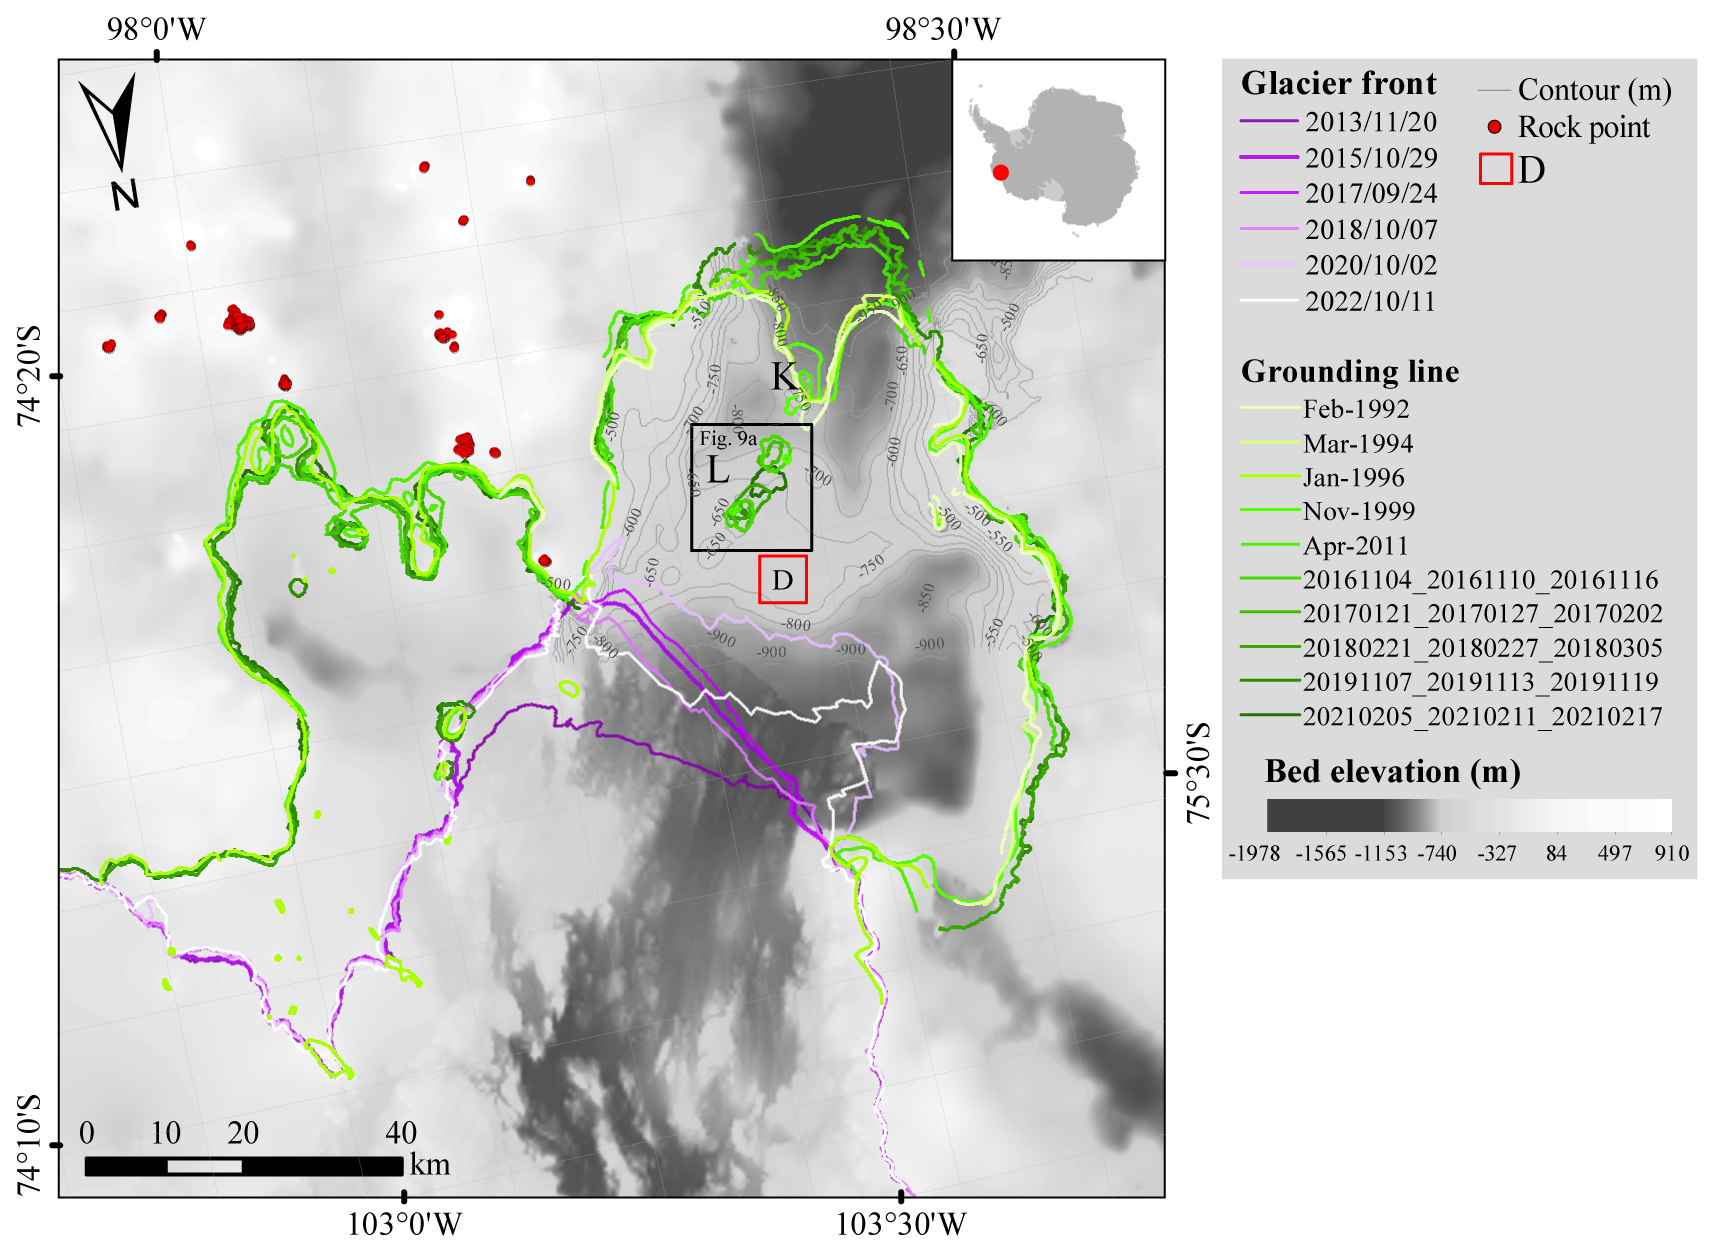
Figure 1Location and geometry of the PIIS. Ice front positions, grounding line locations, and 458 non-glaciated ground control points (red points). Bed elevation (50 m contour interval, labelled between −750 and −500 m) is from BedMachine v3 (Morlighem et al., 2020; Morlighem, 2022), showing the submarine ridge. Grounding lines are from MEaSUREs (Rignot et al., 2016) (from 1992–2011) and from DROT results (from 2016–2021). L and K mark ice rumples (Rignot et al., 2014). Ice front positions (2013–2022) are from Landsat imagery (Landsat-8/9) and Sentinel-1 SAR imagery via Google Earth Engine. Red block D denote the region for calculating mean double-differential vertical displacement. The black frame denotes the zoomed-in region in Fig. 9a.
Ephemeral grounding could be driven by tidal cycles, ice shelf thinning or thickening, sea-level rise, sea-level fall, and the downstream advection of thicker ice column – depending on prior grounding conditions (Schmeltz et al., 2001; Rignot, 2002; Matsuoka et al., 2015). The grounding of an ice shelf on high bathymetry features could impact ice dynamics by: (1) enhance the buttressing effect by providing back stress against upstream ice; (2) facilitate fracturing and ice shelf weakening in response to stress associated with grounding (Rignot, 2002; Christianson et al., 2016; Jeong et al., 2016; Shean, 2016; Benn et al., 2022; Wang et al., 2025).
Satellite remote sensing can effectively detect transient vertical motion of ice shelves, especially tidal fluctuations that cause ephemeral grounding. Key methods include differential range offset tracking (DROT) (Marsh et al., 2013; Joughin et al., 2016; Christianson et al., 2016; Wallis et al., 2024; Lowery et al., 2025; Zhu et al., 2025), interferometric synthetic aperture radar (InSAR) (Schmeltz et al., 2001; Rignot, 2002; Rignot et al., 2014), and satellite altimetry (Fricker and Padman, 2006). Both DROT and InSAR methods in theory indicate the landward limit of tidal flexure. While InSAR is widely used to map grounding line migration, its effectiveness is limited in fast-flowing areas due to phase aliasing unless very short repeat intervals are available. For instance, Milillo et al. (2017) used 1 d repeat COSMO-SkyMed data to track grounding line changes at PIIS.
In contrast, DROT provides a complementary approach that does not rely on phase information, making it useful for observing vertical tidal displacements on fast-moving ice shelves, despite being less precise than InSAR in some contexts (Marsh et al., 2013; Hogg, 2015; Joughin et al., 2016; Christianson et al., 2016; Friedl et al., 2020; Wallis et al., 2024; Lowery et al., 2025; Zhu et al., 2025). Using TerraSAR-X data, Joughin et al. (2016) identified a vertical displacement anomaly near ice rumple L from November 2013–November 2015. At Petermann Glacier, Friedl et al. (2020) found DROT-derived flexure limits ∼2 km seaward of DInSAR results. More recently, DROT applied to Sentinel-1 IW data has proven effective for studying grounding line and pinning point dynamics on the Antarctic Peninsula (Wallis et al., 2024), Amery Ice Shelf (Zhu et al., 2025), and PIIS (Lowery et al., 2025). However, Lowery et al. (2025) focused only on the year 2017, leaving later changes unresolved. Thus, the evolution of grounding behaviour at ice rumple L following four subsequent calving events – in 2015, 2017, 2018, and 2020 – remains poorly understood.
To address this gap, we reconstruct the grounding history of PIIS from 2014–2023 using DROT applied to Sentinel-1A/B SAR data. We combine these observations with a 2010–2021 time series of ice thickness change derived from Reference Elevation Model of Antarctica (REMA) DEM (Howat et al., 2022a) and ICESat-2 ATL06 data (Smith et al., 2019, 2023) to examine the link between ephemeral grounding at ice rumple L and recent changes in ice shelf dynamics. This dataset provides spatially and temporally consistent coverage across the PIIS.
2.1 Double-differential vertical displacement calculation
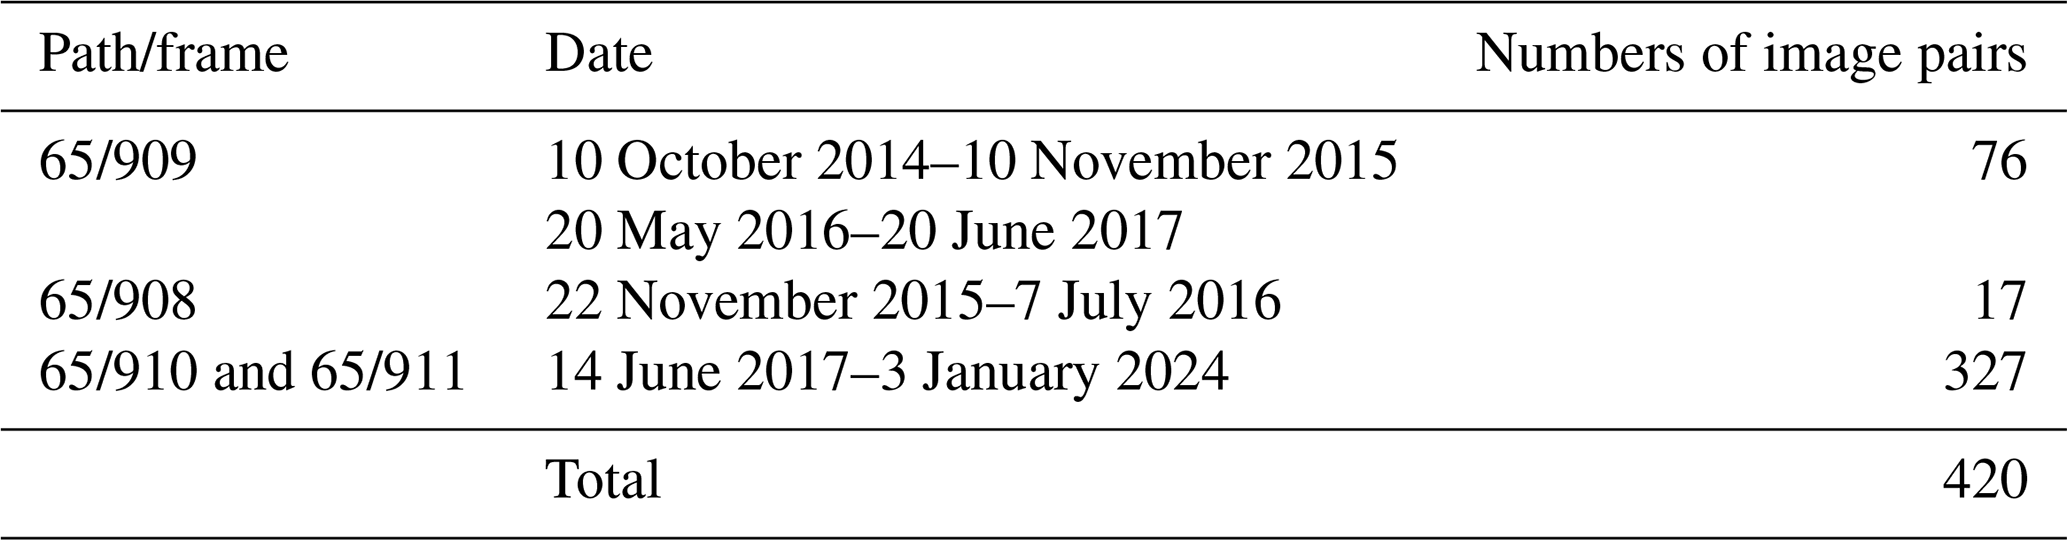
Vertical displacement maps were generated for the PIG basin using the intensity offset tracking algorithm. This involved applying the algorithm to 420 scenes of Sentinel-1A/B ascending imagery, covering periods of 6 or 12 d from October 2014–December 2023. Details of the imagery used are provided in Table 1. Processing steps are outlined in Fig. 2. We applied fine co-registration and de-ramping procedures prior to offset tracking (Wegmüller et al., 2016; Sánchez-Gámez and Navarro, 2017; Chen et al., 2020). We used the REMA 200 m mosaic DEM (Howat et al., 2019, 2022b), which is posted on a 200 m grid, as the reference DEM for geocoding and co-registering the Sentinel-1 imagery. To compute the displacement fields from the co-registered and de-ramped imagery, we propose a 2D cross-correlation window of 480×96 (range×azimuth) pixels with step sizes of 100 and 20 pixels in the azimuth and range directions, respectively. We used the REMA 200 m mosaic DEM to geocode the displacement maps based on bicubic-log spline interpolation. The final vertical displacement maps and velocity maps were generated on 100 m×100 m grids and geocoded to the Antarctic Polar Stereographic Projection (EPSG:3031).
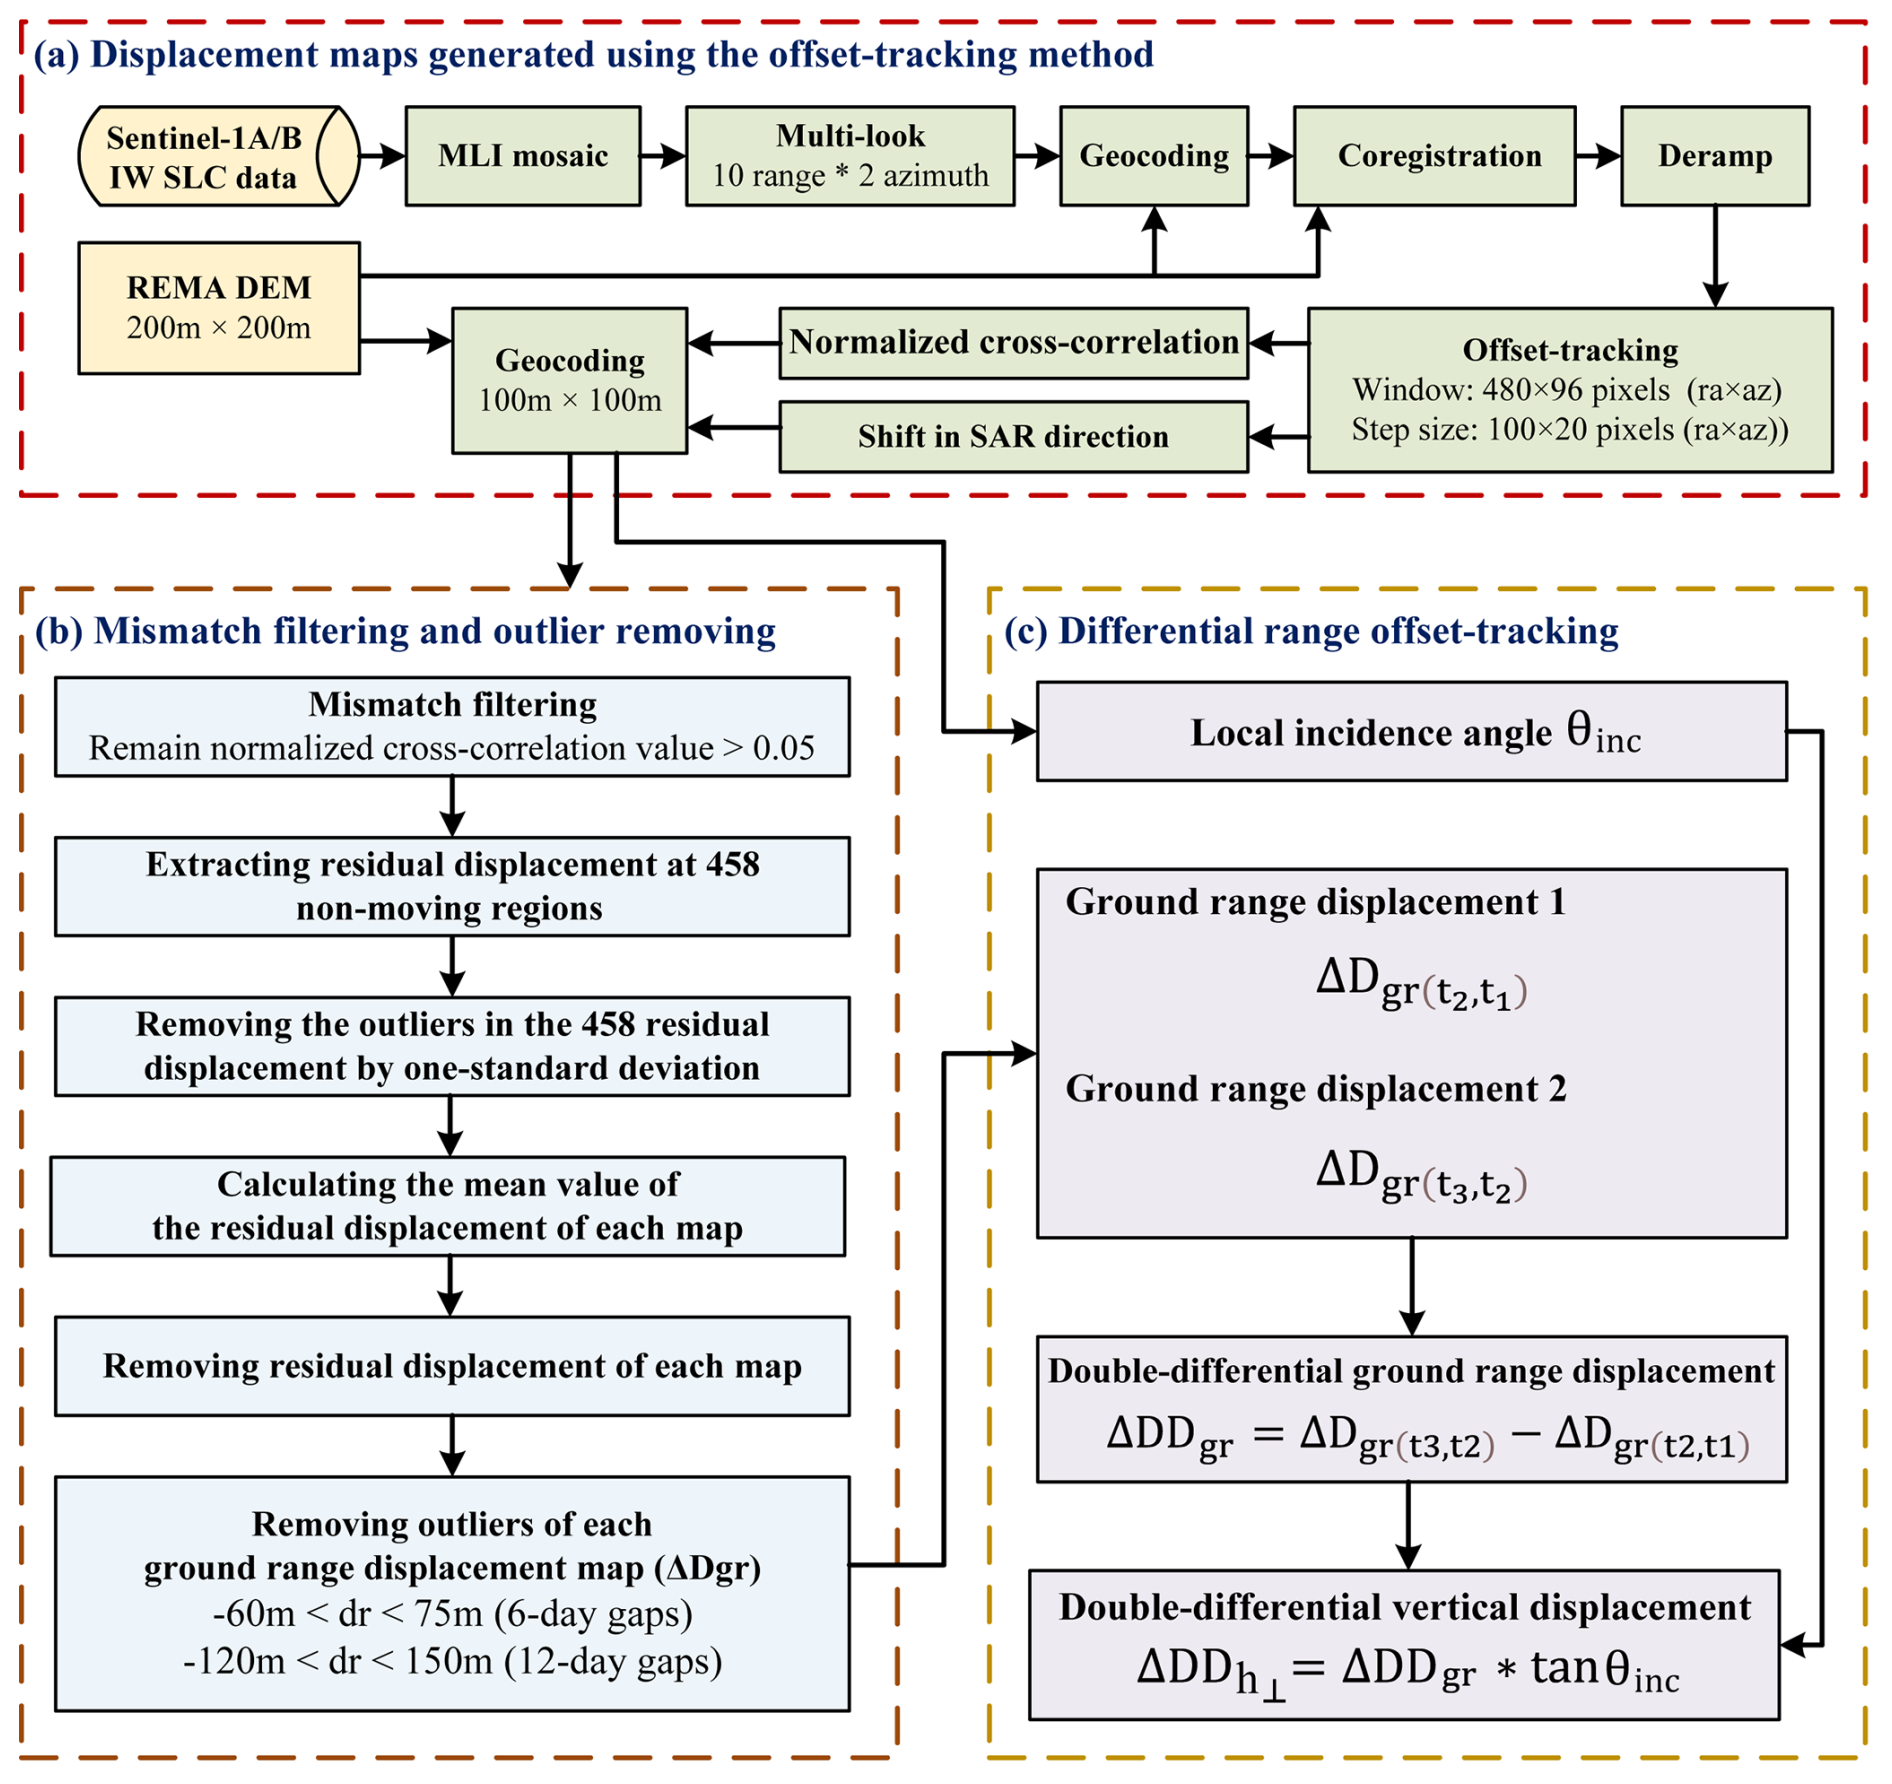
To reduce noise and remove outliers in the Sentinel-1 offset tracking data, we employed a multi-step filtering and calibration approach. First, we retained only pixels with a normalized cross-correlation value greater than 0.05, which also used by Solgaard et al. (2021) to ensure reliable displacement measurements. Second, we extracted the residual displacement at 458 widely distributed, non-moving points over the exposed bedrock (Fig. 1). Outliers beyond one standard deviation were removed, following the same criteria that used in Chen et al. (2020), and the mean residual displacement for each time interval was calculated and used to calibrate the displacement maps by subtracting this mean value. To further remove noise and erroneous measurements, we examined the distribution of azimuth and range displacements across the entire time series and established empirical thresholds based on reasonable minimum and maximum velocities of ice movement at PIIS. We invalidated pixels with slant range displacements less than −60 m or greater than 75 m for 6 d gaps, and less than −120 m or greater than 150 m for 12 d gaps, which can exclude a small portion of pixels and improved the consistency and quality of the final displacement fields.
The slant range displacement fields generated over floating ice contain both horizontal displacement and bias due to vertical ocean motion. When the SAR sensor observes an object P(x,y) from the same location in orbit, the SAR sensor can detect vertical displacement in the slant range direction ( in Fig. 3):
where Dsr is the distance between the object P(x,y) and the SAR sensor; t1 and t2 reflect the acquisition time of the master image and the acquisition time of the slave image, respectively. The magnitude of the observed slant range displacement depends on the local incidence angle (θinc), which is defined as the angle between the incident radar signal and the local surface normal, expressed in radians When the slant range displacement is converted to ground range displacement, the additional displacement in the ground range () equals the vertical change () divided by tan θinc:
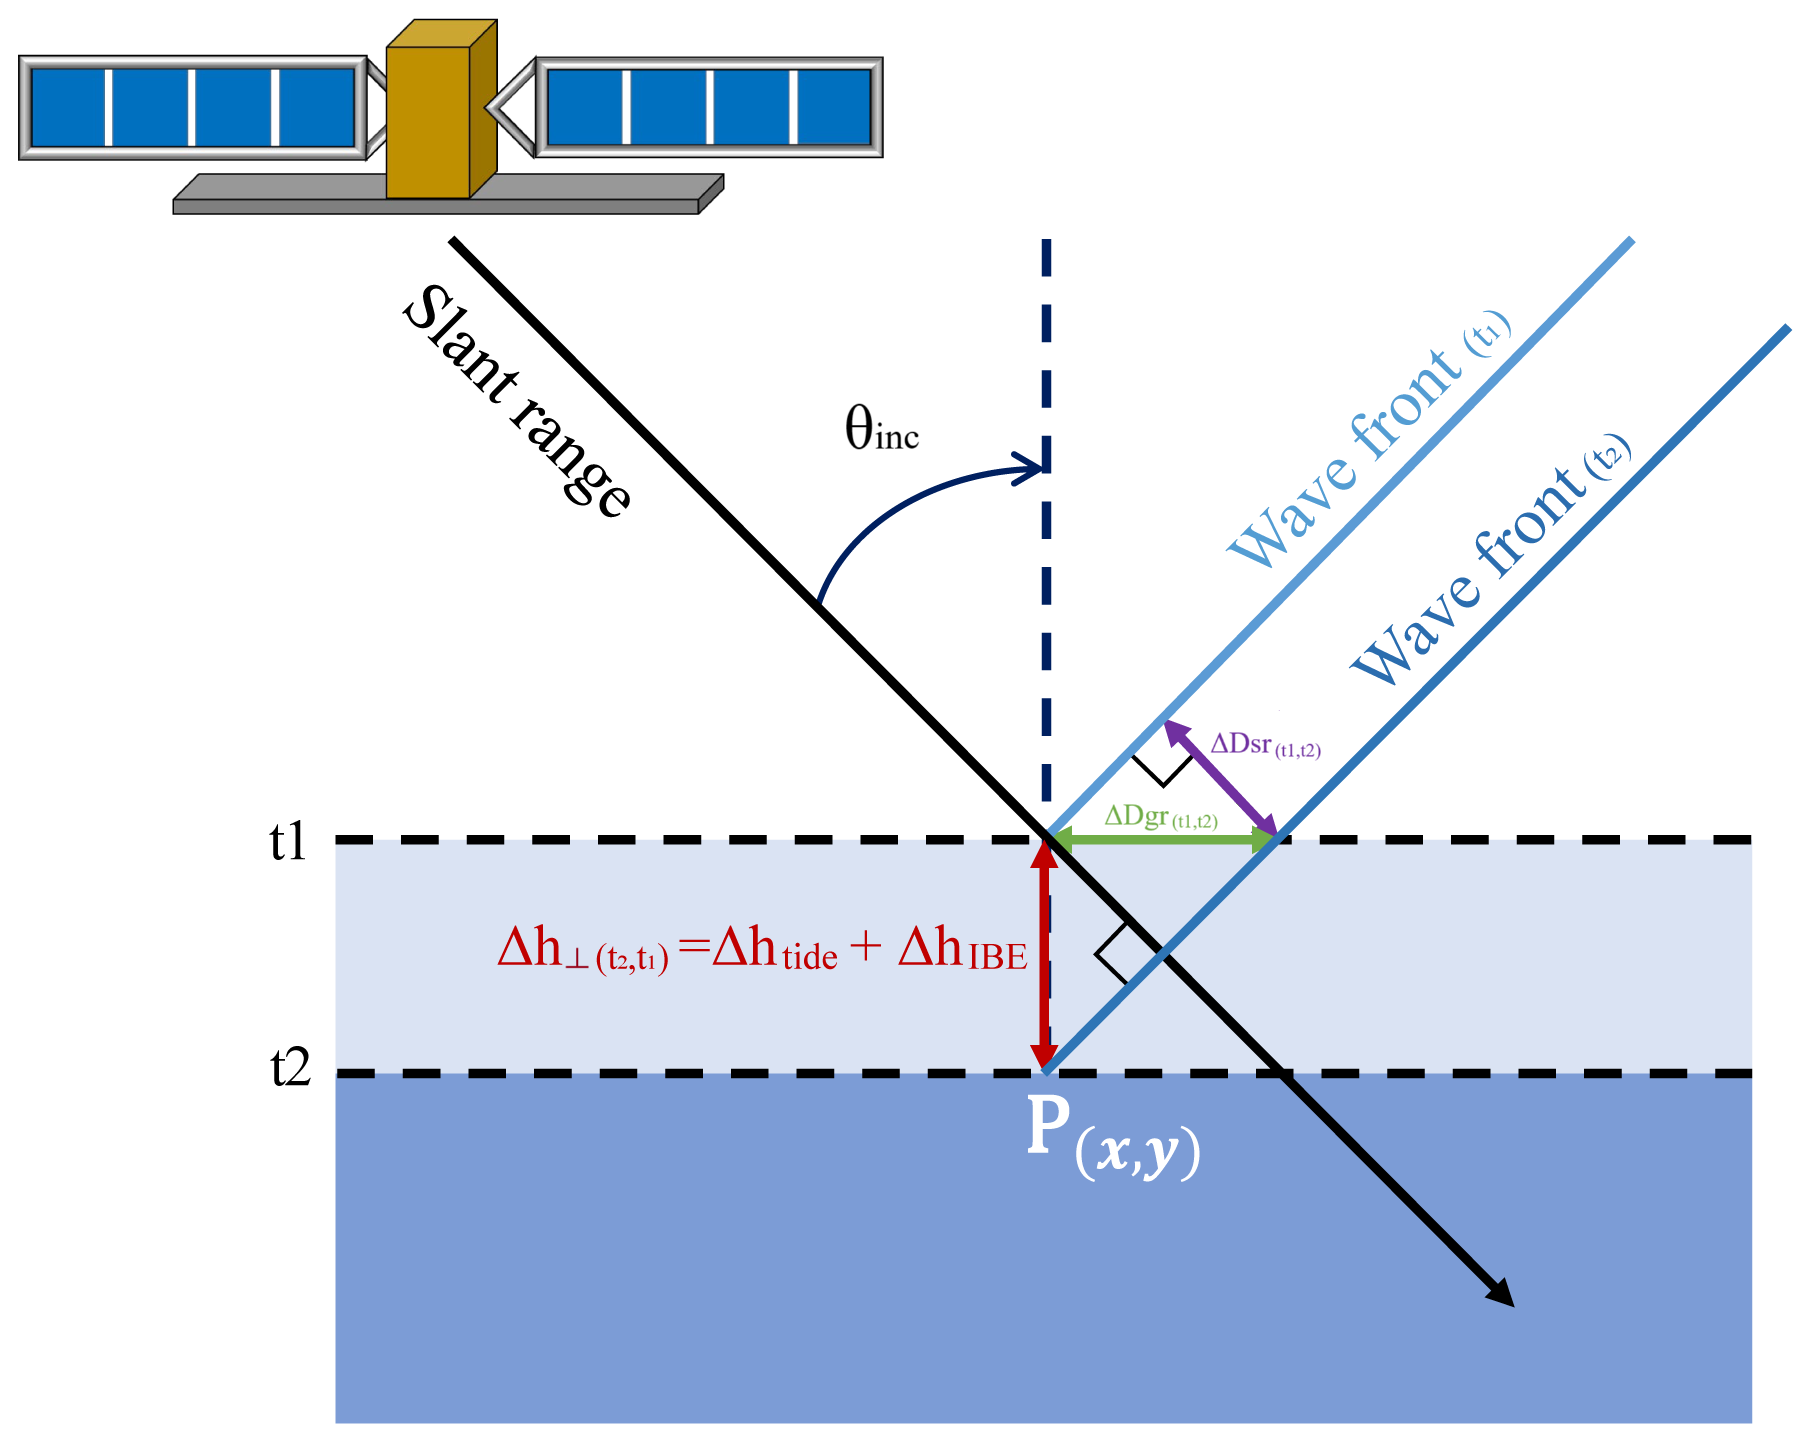
Figure 3Side-looking spaceborne SAR imaging geometry. A vertical displacement of a Point P(x,y) from t1 to t2 is imaged at different slant range positions () depending on its elevation.
Assuming the horizontal displacement between two SAR image pairs that are closely spaced in time is very small, we can cancel the horizontal displacement and obtain the differential vertical bias in the ground range (ΔDDgr) by differencing two ground range displacement fields (Rignot, 1998; Joughin et al., 2010, 2016; Marsh et al., 2013; Christianson et al., 2016; Friedl et al., 2020):
where and are the vertical displacement differences in the ground range direction from the displacement map generated from the acquisition dates t1 and t2, and the acquisition dates t2 and t3, respectively. Therefore, the double differential vertical displacement () can be calculated as the double differential vertical bias in the ground range (ΔDDgr) from both image pairs multiplied by tan θinc:
The REMA DEM was used consistently for both θinc (in radians) estimation and as the external DEM for co-registration in the offset tracking process, ensuring uniform referencing across displacement fields. The θinc was calculated for the first acquisition of each image pair. The local surface normal was derived from the REMA 200 m mosaic DEM. The vertical displacement caused by tidal forcing has minimal impact on the ice shelf's overall surface slope. While slope-induced errors are most significant in areas with localized topographic variability, ephemeral grounding events produce range-direction displacement anomalies that exceed those caused by background slope variations, making these events clearly distinguishable. Consequently, we are confident that using a time-invariant DEM does not compromise the accuracy of our results, as the impact of slope variability on θinc and the resulting displacement estimates remains minimal.
Double-differential vertical displacement maps of PIIS were produced using differential range offset tracking, applied to slant range displacement fields. Ephemeral grounding events, indicated by near-zero displacement in the maps (Fig. 4a–c) and flattened interferometric fringes in DInSAR (Fig. 4d), resulted in visible “spots”. We analysed each displacement map, noting dates with clear “spots” at central PIIS, where the area around ice rumple L exhibited near-zero displacement (Fig. 4a and c). Red block D in Fig. 1 denote the region for extracting mean double-differential vertical displacement time series. The double-differential vertical displacement time series was compared with double-differential tidal height time series, derived from the CATS2008_v2023 ocean tide model (Howard et al., 2024) using Tide Model Driver 3.0 (Greene et al., 2023) at (−75.186576° S, −100.617021° W).
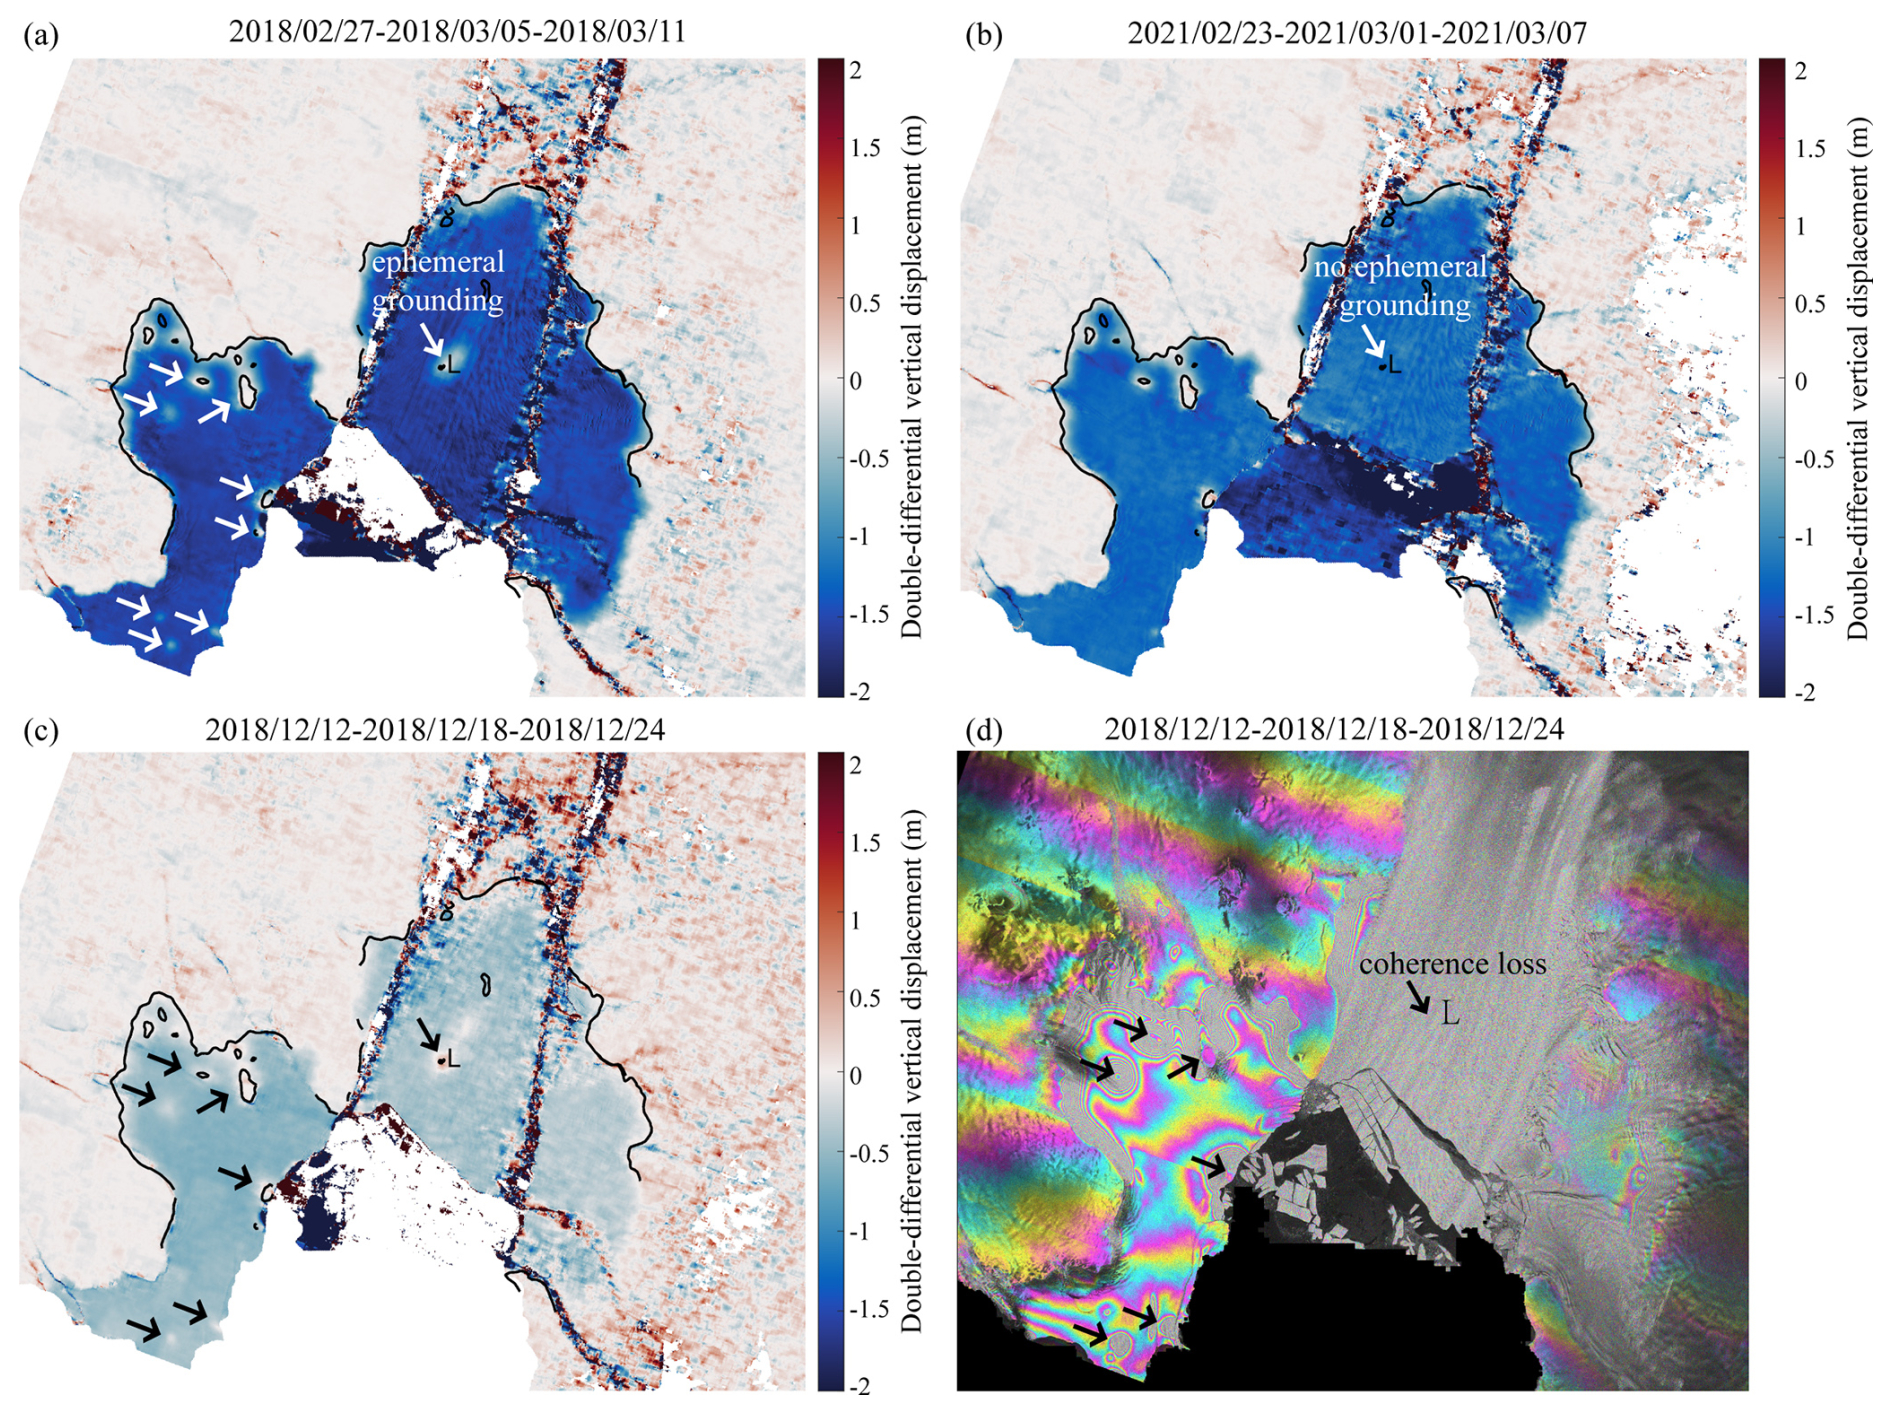
Figure 4Double-differential vertical displacement compared with DInSAR interferogram, showing ephemeral grounding. (a) Double-differential displacement between 27 February 2018–5 March 2018 and 5 March 2018–11 March 2018. (b) Displacement between 23 February 2021–1 March 2021 and 1 march 2021–7 March 2021. (c) Displacement between 12 December 2018–18 December 2018 and 18 December 2018–24 December 2018. White arrows in (a, b), and black arrows in (c), indicate the location of ephemeral grounding, marked by near-zero displacement. (d) DInSAR interferogram for 12 December 2018–18 December 2018 and 18 December 2018–24 December 2018. Black arrows highlight ephemeral grounding sites at the northern PIIS. The DInSAR interferogram fails to capture this signal at ice rumple L due to coherence loss.
We extracted grounding line positions using Otsu's method (Otsu, 1979), which determines an optimal global threshold to convert each grayscale image into binary format. Following thresholding, morphological operations were applied to fill holes and close gaps. Grounding line positions were then extracted from the processed binary images.
2.2 REMA strips data correction
Elevation data from the CryoSat-2 Baseline-D Level 2 SARIn product (Meloni et al., 2020), spanning from July 2010–June 2022, were used to correct and co-register the REMA 2 m spatial resolution time-stamped DEM stripes version 4.1 product, acquired between October 2010 and December 2022 (Howat et al., 2022b). These REMA strips are referenced to the WGS84 ellipsoid but are not co-registered to satellite altimetry by default. The correction and co-registration procedures were implemented using the “Basal melt rates Using REMA and Google Earth Engine (BURGEE)” processing framework developed by Zinck et al. (2023) and Zinck (2023). Processing steps are outlined in Fig. 5.
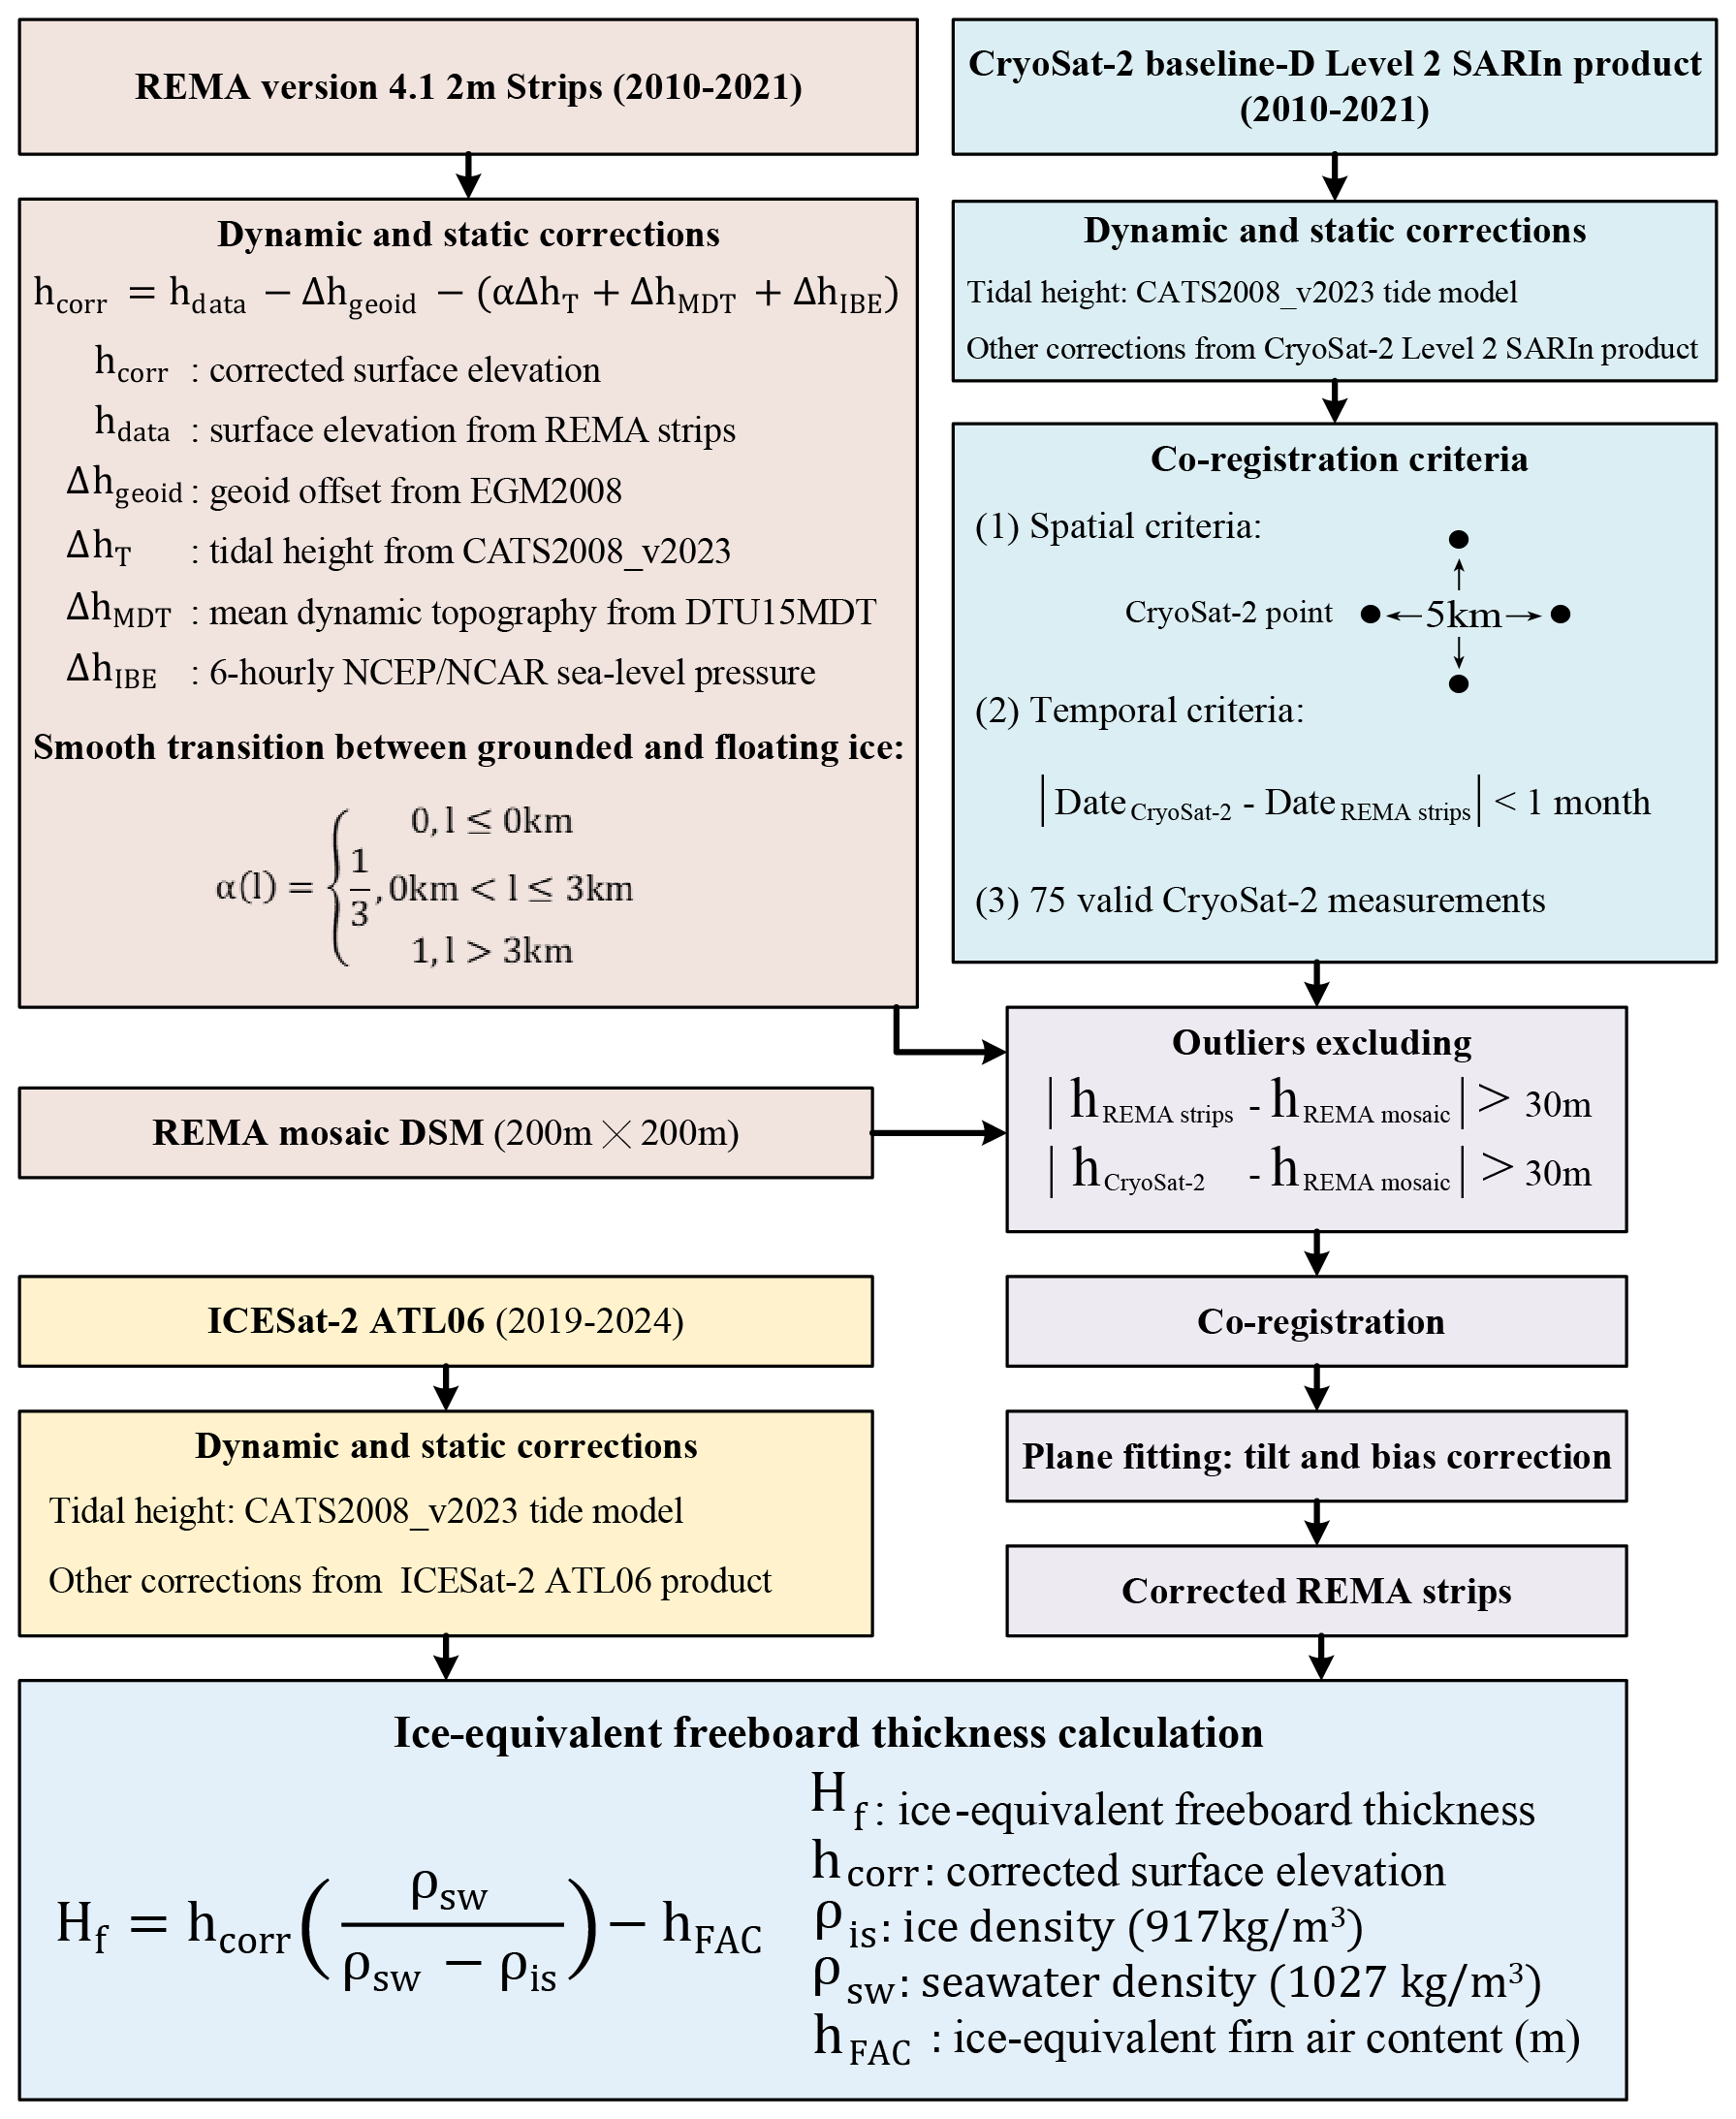
Dynamic and static corrections were applied to both the REMA strips and the CryoSat-2 dataset to bring all elevations into a consistent reference frame, following the methodology described by Zinck et al. (2023). For REMA, the corrected surface elevation (hcorr) was calculated as:
where hdata is the uncorrected surface elevation, ΔhGeoid is the geoid offset from EGM2008 (Pavlis et al., 2012), ΔhT is the tidal height from the CATS2008_v2023 ocean tide model (6 h intervals, ∼3 km resolution), ΔhMDT is the mean dynamic topography from the DTU15MDT dataset (Andersen et al., 2015; Knudsen et al., 2017), and ΔhIBE is the inverse barometer effect based on 6 hourly NCEP/NCAR sea-level pressure residuals (Kalnay et al., 1996), referenced to a mean sea level pressure of 1013 hPa. Tidal and barometric corrections were applied based on the acquisition time of the first stereo image in each DEM strip. The stereo image pairs used to generate the DEMs are typically acquired within a short time interval – usually within minutes to a few hours. Therefore, applying tidal and inverse barometric effect (IBE) corrections based on the acquisition time of the first image introduces only minimal temporal bias. The coefficient α ensures a smooth transition between grounded and floating ice, varying from 0–1 with distance from the floating ice edge to the grounding line (Shean et al., 2019), as defined by the ASAID product (Bindschadler et al., 2011):
The ASAID grounding line product serves as an input to the BURGEE framework and is the same dataset used in Zinck et al. (2023).
CryoSat-2 data were similarly corrected using the same tide model and additional fields from the Level 2 SARIn product (Howard et al., 2024; Zhang et al., 2020). Erroneous elevation measurements resulting from failed interferometric cross-track positioning were excluded based on quality flags provided by European Space Agency.
To identify and remove elevation outliers, we used the REMA 200 m mosaic DEM (Howat et al., 2019, 2022b) as a reference surface for both the REMA 2 m strips and the CryoSat-2 data. In regions of the PIIS where uncorrected REMA strips exhibited unrealistic elevation changes exceeding 30 m, we applied a more conservative threshold of 100 m elevation difference to exclude outliers.
Co-registration of REMA strips to CryoSat-2 followed a modified procedure from Zinck et al. (2023), with the following criteria: (1) The longitudinal and latitudinal spacing between CryoSat-2 footprints must be at least 5 km to ensure uniform distribution within the REMA 2 m strip data coverage; (2) The acquisition time interval between CryoSat-2 data and REMA strip data must not exceed one month to minimize elevation change impacts over time; and (3) A minimum of 75 valid CryoSat-2 data points must be distributed within the REMA strip coverage area to enable sufficient data for plane fitting and co-registration, thereby eliminating tilt and vertical bias in the REMA 2 m strip DEM.
Residuals between each REMA strip and the CryoSat-2 data were used to apply tilt and vertical shift corrections through plane fitting. The final REMA strips are referenced to the EGM2008 geoid, ensuring both high internal consistency and improved absolute accuracy.
To assess the accuracy of the corrected REMA strips, we compared three strips from 2019–2021 with nearly contemporaneous ICESat-2 ATL06 data (Smith et al., 2019, 2023). The ICESat-2 elevations were converted to heights relative to the instantaneous sea surface by referencing them to the EGM2008 geoid and applying corrections for ocean tides, mean dynamic topography, and the inverse barometer effect. Processing steps see Fig. 5. At overlapping locations, we excluded measurements with ICESat-2 elevation errors exceeding 5 m and calculated the mean elevation difference (REMA minus ICESat-2) and the standard deviation of this bias. As shown in Table 2, the corrected REMA strips exhibited lower standard deviations compared to the uncorrected data, indicating reduced uncertainty. However, a consistent negative mean bias remained, with the corrected REMA elevations appearing systematically lower than those from ICESat-2.
Table 2The means and standard deviations of uncorrected and corrected REMA strip elevations minus the ICESat-2 elevation.
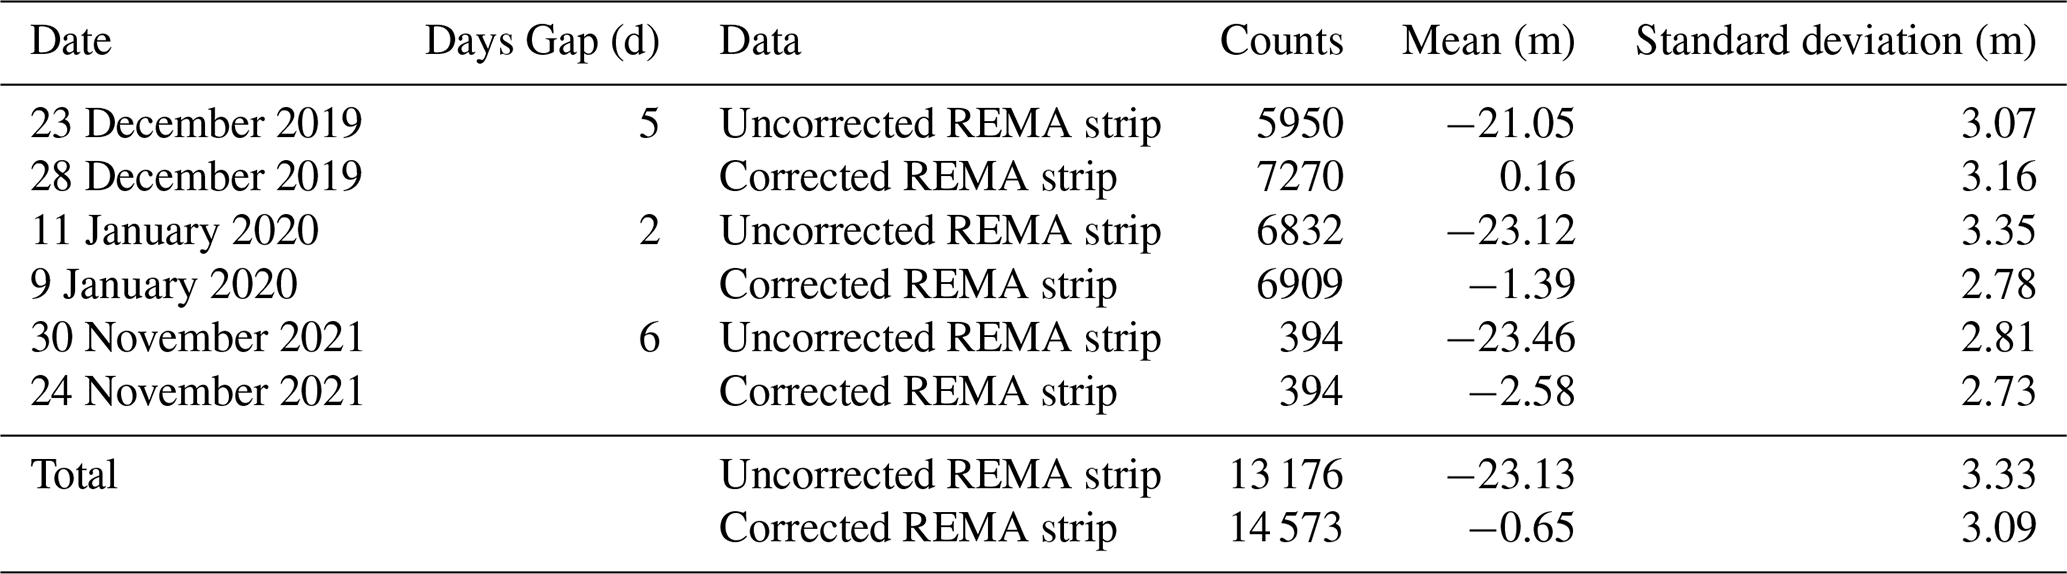
This bias likely results from the differing measurement principles of the two satellite systems: CryoSat-2 (used for REMA correction) operates in the Ku-band and can penetrate the upper snowpack, whereas ICESat-2 uses green laser altimetry, which reflects off the snow surface. As a result, CryoSat-2 – and by extension, the corrected REMA strips – tend to report slightly lower surface elevations than ICESat-2, especially over snow-covered areas. Additional factors such as residual temporal offsets, snow accumulation variability, and surface roughness may also contribute. Based on this comparison, we estimate the uncertainty of the corrected REMA strips as , equivalent to in floating ice thickness.
Surface elevation changes over the PIIS were derived from the corrected REMA strips. Additionally, MODIS optical imagery from the Images of the Antarctic Ice Shelves Version 2 dataset (Scambos et al., 2022), with a spatial resolution of 250 m and spanning from 1 January 2001–23 October 2022, was used to identify changes in surface ridges.
2.3 Ice-equivalent freeboard thickness calculation
To estimate changes in ice-equivalent freeboard thickness near ice rumple L, we used both the corrected REMA strips and ICESat-2 data. Specifically, ICESat-2 tracks 965 and 1094, which pass through ice rumple L, were analysed. Ice-equivalent freeboard thickness (Hf) was calculated using Eq. (7), following the methods of Griggs and Bamber (2011) and Shean et al. (2019):
where hcorr is the corrected surface elevation, ρis is the ice density (917 kg m−3), ρsw is the seawater density (1027 kg m−3), hFAC is the firn air content of ice equivalent (in meters) derived from the NASA GSFC-FDM v1.2.1 dataset (Medley et al., 2022a, b), with a 5 d temporal resolution spanning from 1 January 1980–30 June 2022.
2.4 Rift propagation observation
Previous studies have suggested that such grounding may be linked to the formation of transverse rifts south of ice rumple L (Joughin et al., 2021), potentially contributing to calving events between 2015 and 2020. However, Joughin et al. (2021) also point out that due to the limitations in the clarity of Sentinel-1 IW SAR imagery hinder a definitive assessment of the connection between ephemeral grounding and rift formation. We used Landsat-8 optical images, specifically the panchromatic band with a 15 m spatial resolution, to track the rift propagation history. We then compared these results with our grounding line data to better understand the interaction between ephemeral grounding and rift propagation.
3.1 Changes in the double-differential vertical displacement
Figures 6 and 7 and Movie S1 in the Supplement show the two-dimensional double-differential vertical displacement changes and time series of double-differential tidal height differences. The tidal height difference was calculated from data extracted at a point near the ice rumple L (longitude 100.6149° W, latitude 75.1867° S), corresponding to the exact acquisition times of each Sentinel-1 image, which were at 04:35 AM on each date (Table S1 in the Supplement). One or two near-zero vertical displacement signals were detected at ice rumple L from at least November 2016 through April 2020, followed by a reappearance in December 2020. These signals are highlighted by yellow arrows in Fig. 6a and marked by red vertical lines in Fig. 6b. The reduced number of signals before August 2016 and after December 2021 likely reflects data limitations during periods when Sentinel-1B was not operational. Near-zero vertical displacement signals also occurred in 2016, 2017, and after the 2018 calving event. In December 2020, a similar signal appeared upstream of ice rumple L and progressively migrated toward the rumple, indicating that ephemeral grounding occurred as a thicker section of the ice shelf moved across the southern side of the sea ridge.
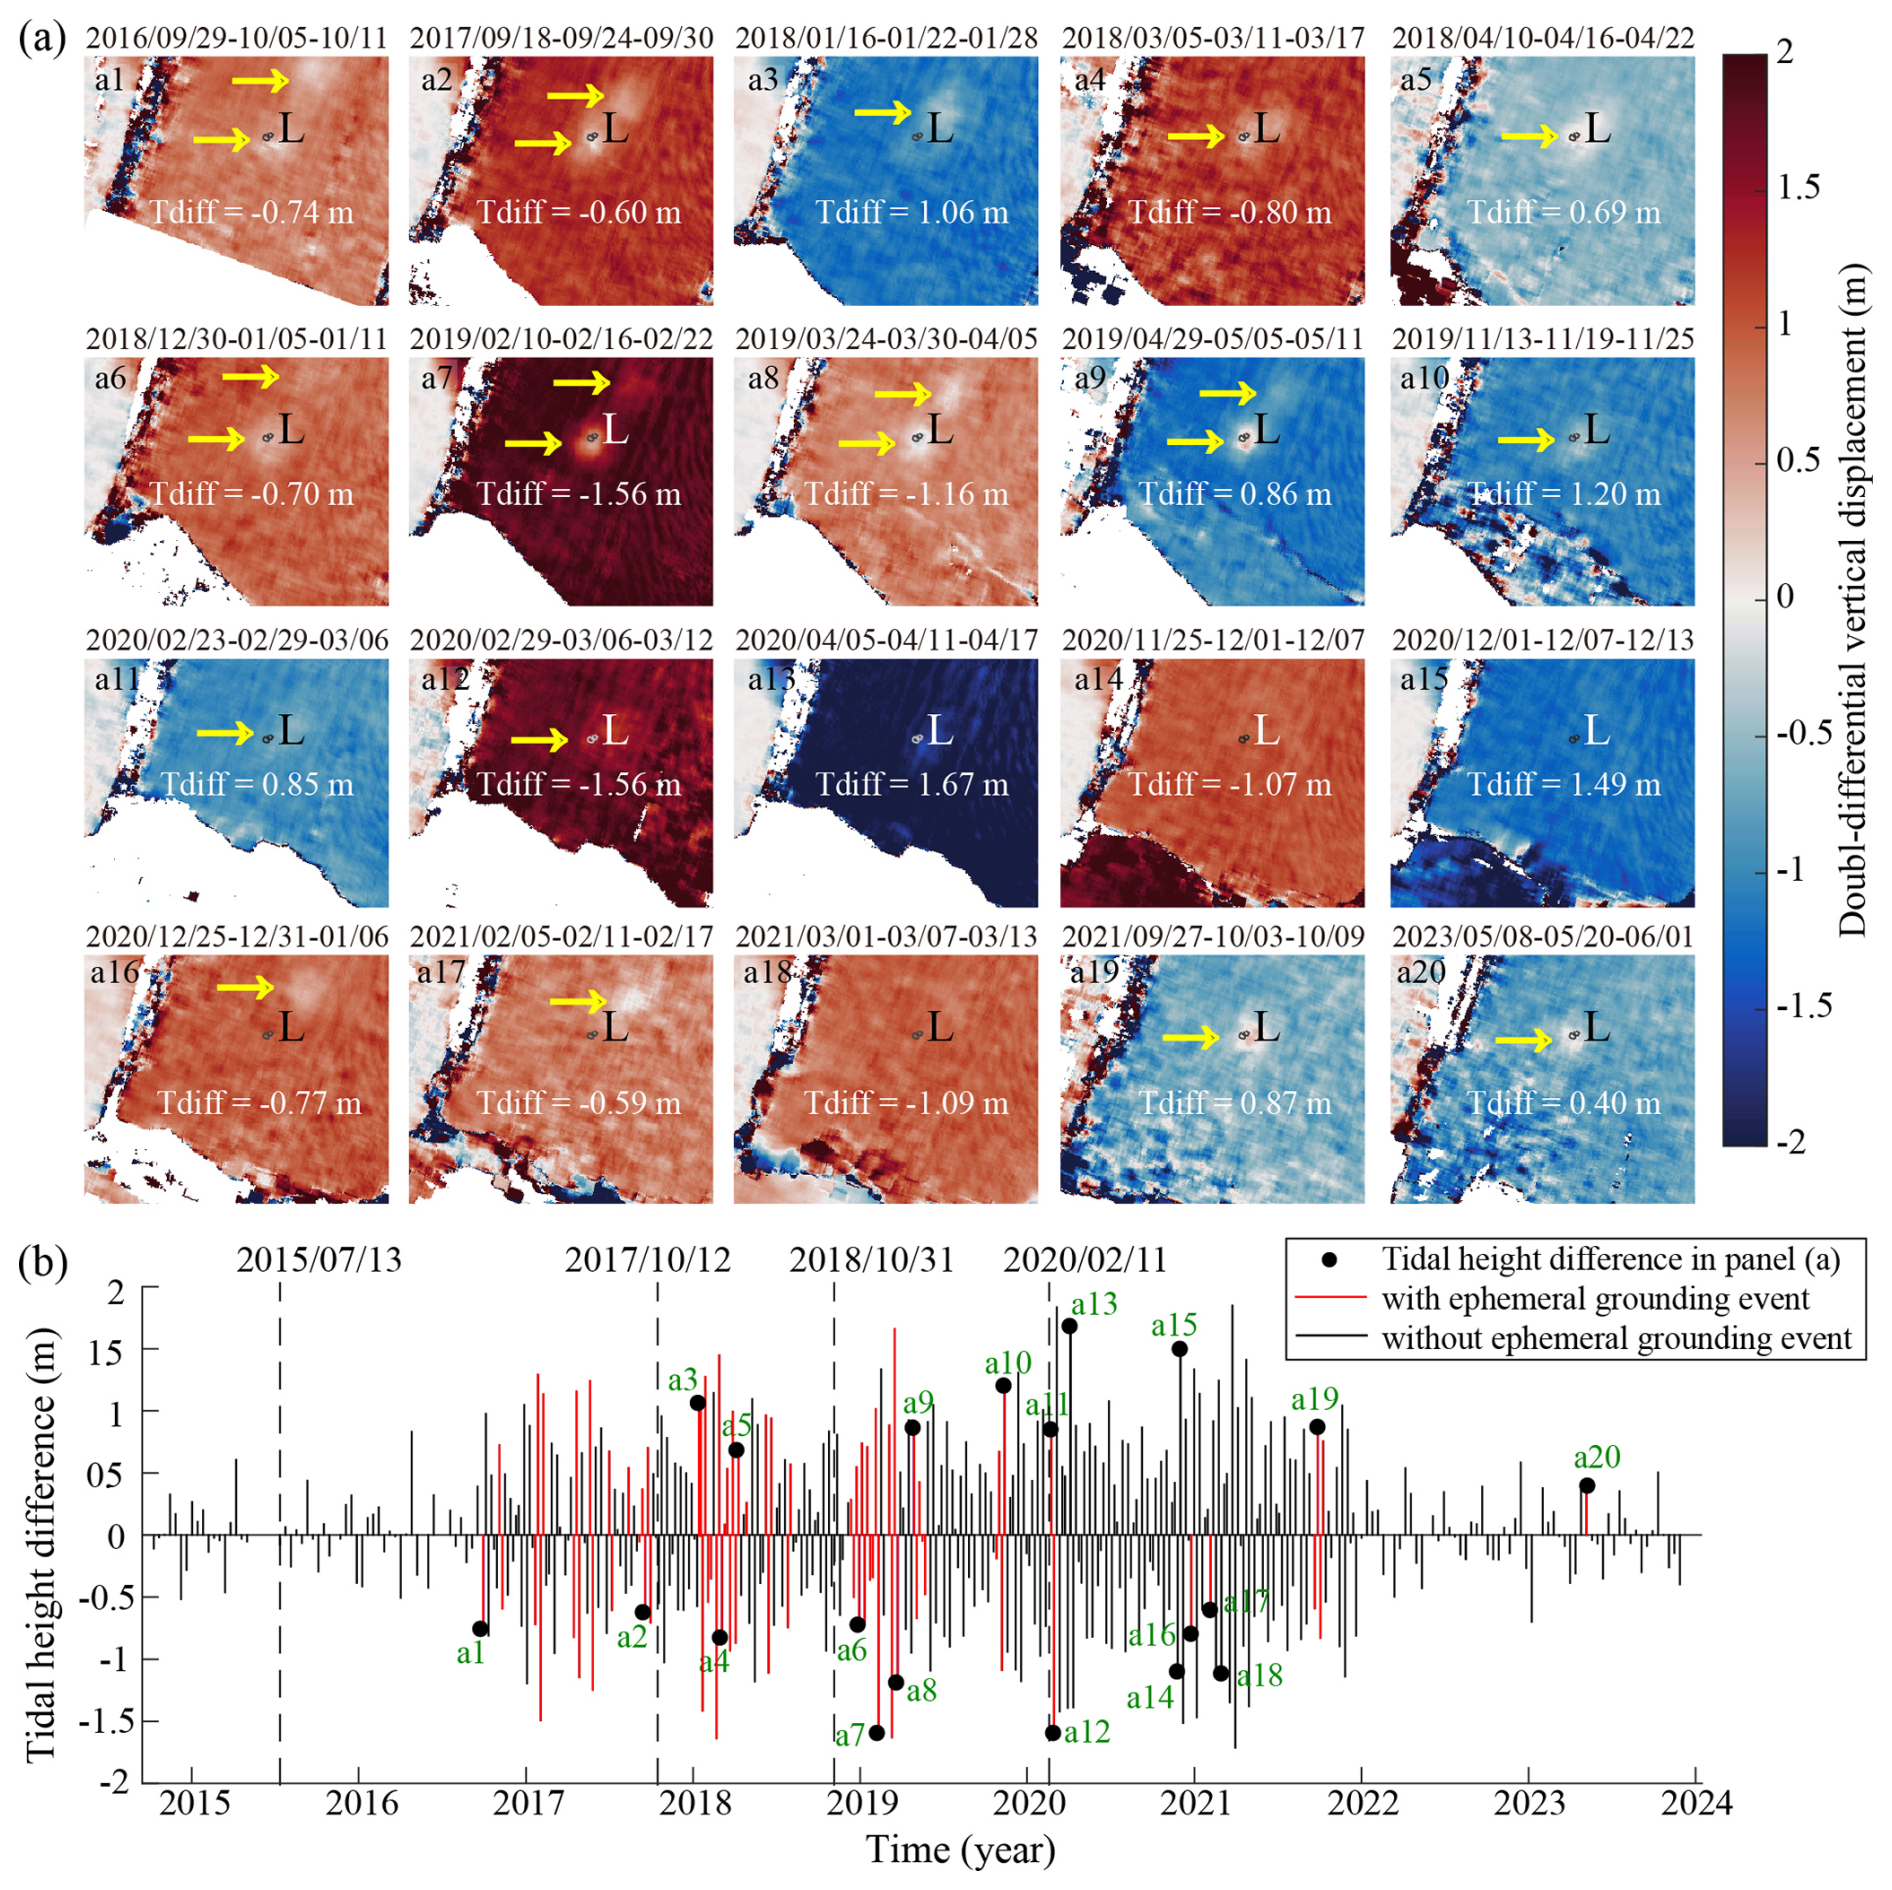
Figure 6Two-dimensional double-differential vertical displacement changes and time series of double-differential tidal height differences. (a) Spatial distribution of double-differential vertical displacement changes between November 2016 and May 2023. Yellow arrows highlight inferred ephemeral grounding signals in each displacement map. The tidal height difference (Tdiff) is labelled in each frame. (b) Time series of double-differential tidal height differences (black vertical lines) and inferred ephemeral grounding events (red vertical lines). Dashed lines indicate the timing of four major calving events: 13 July 2015, 12 October 2017, 31 October 2018, and 11 February 2020.
Figure 7 and Table S2 in the Supplement identifies 80 ephemeral grounding events between September 2016 and October 2021, including 43 during spring tides (red points) and 37 during neap tides (blue points). As shown in Figs. 6a and 7a, positive vertical-displacement anomalies generally coincide with negative tidal-height differences, and vice versa, indicating a strong inverse linear relationship between these variables (, , R2=0.65). In contrast, Fig. 7b shows no significant relationship between tidal-height difference and grounding-region area (, , R2=0.00026). During spring tides, only three grounding events exceeded an area of 100 km2, while all other events remained below this threshold. No significant linear relationship is observed between tidal-height difference and grounding-region area during spring tides (, , R2=0.012). Similarly, during neap tides, grounding areas range from 0–90 km2 and show no significant dependence on tidal-height difference (r=0.07, , R2=0.004).
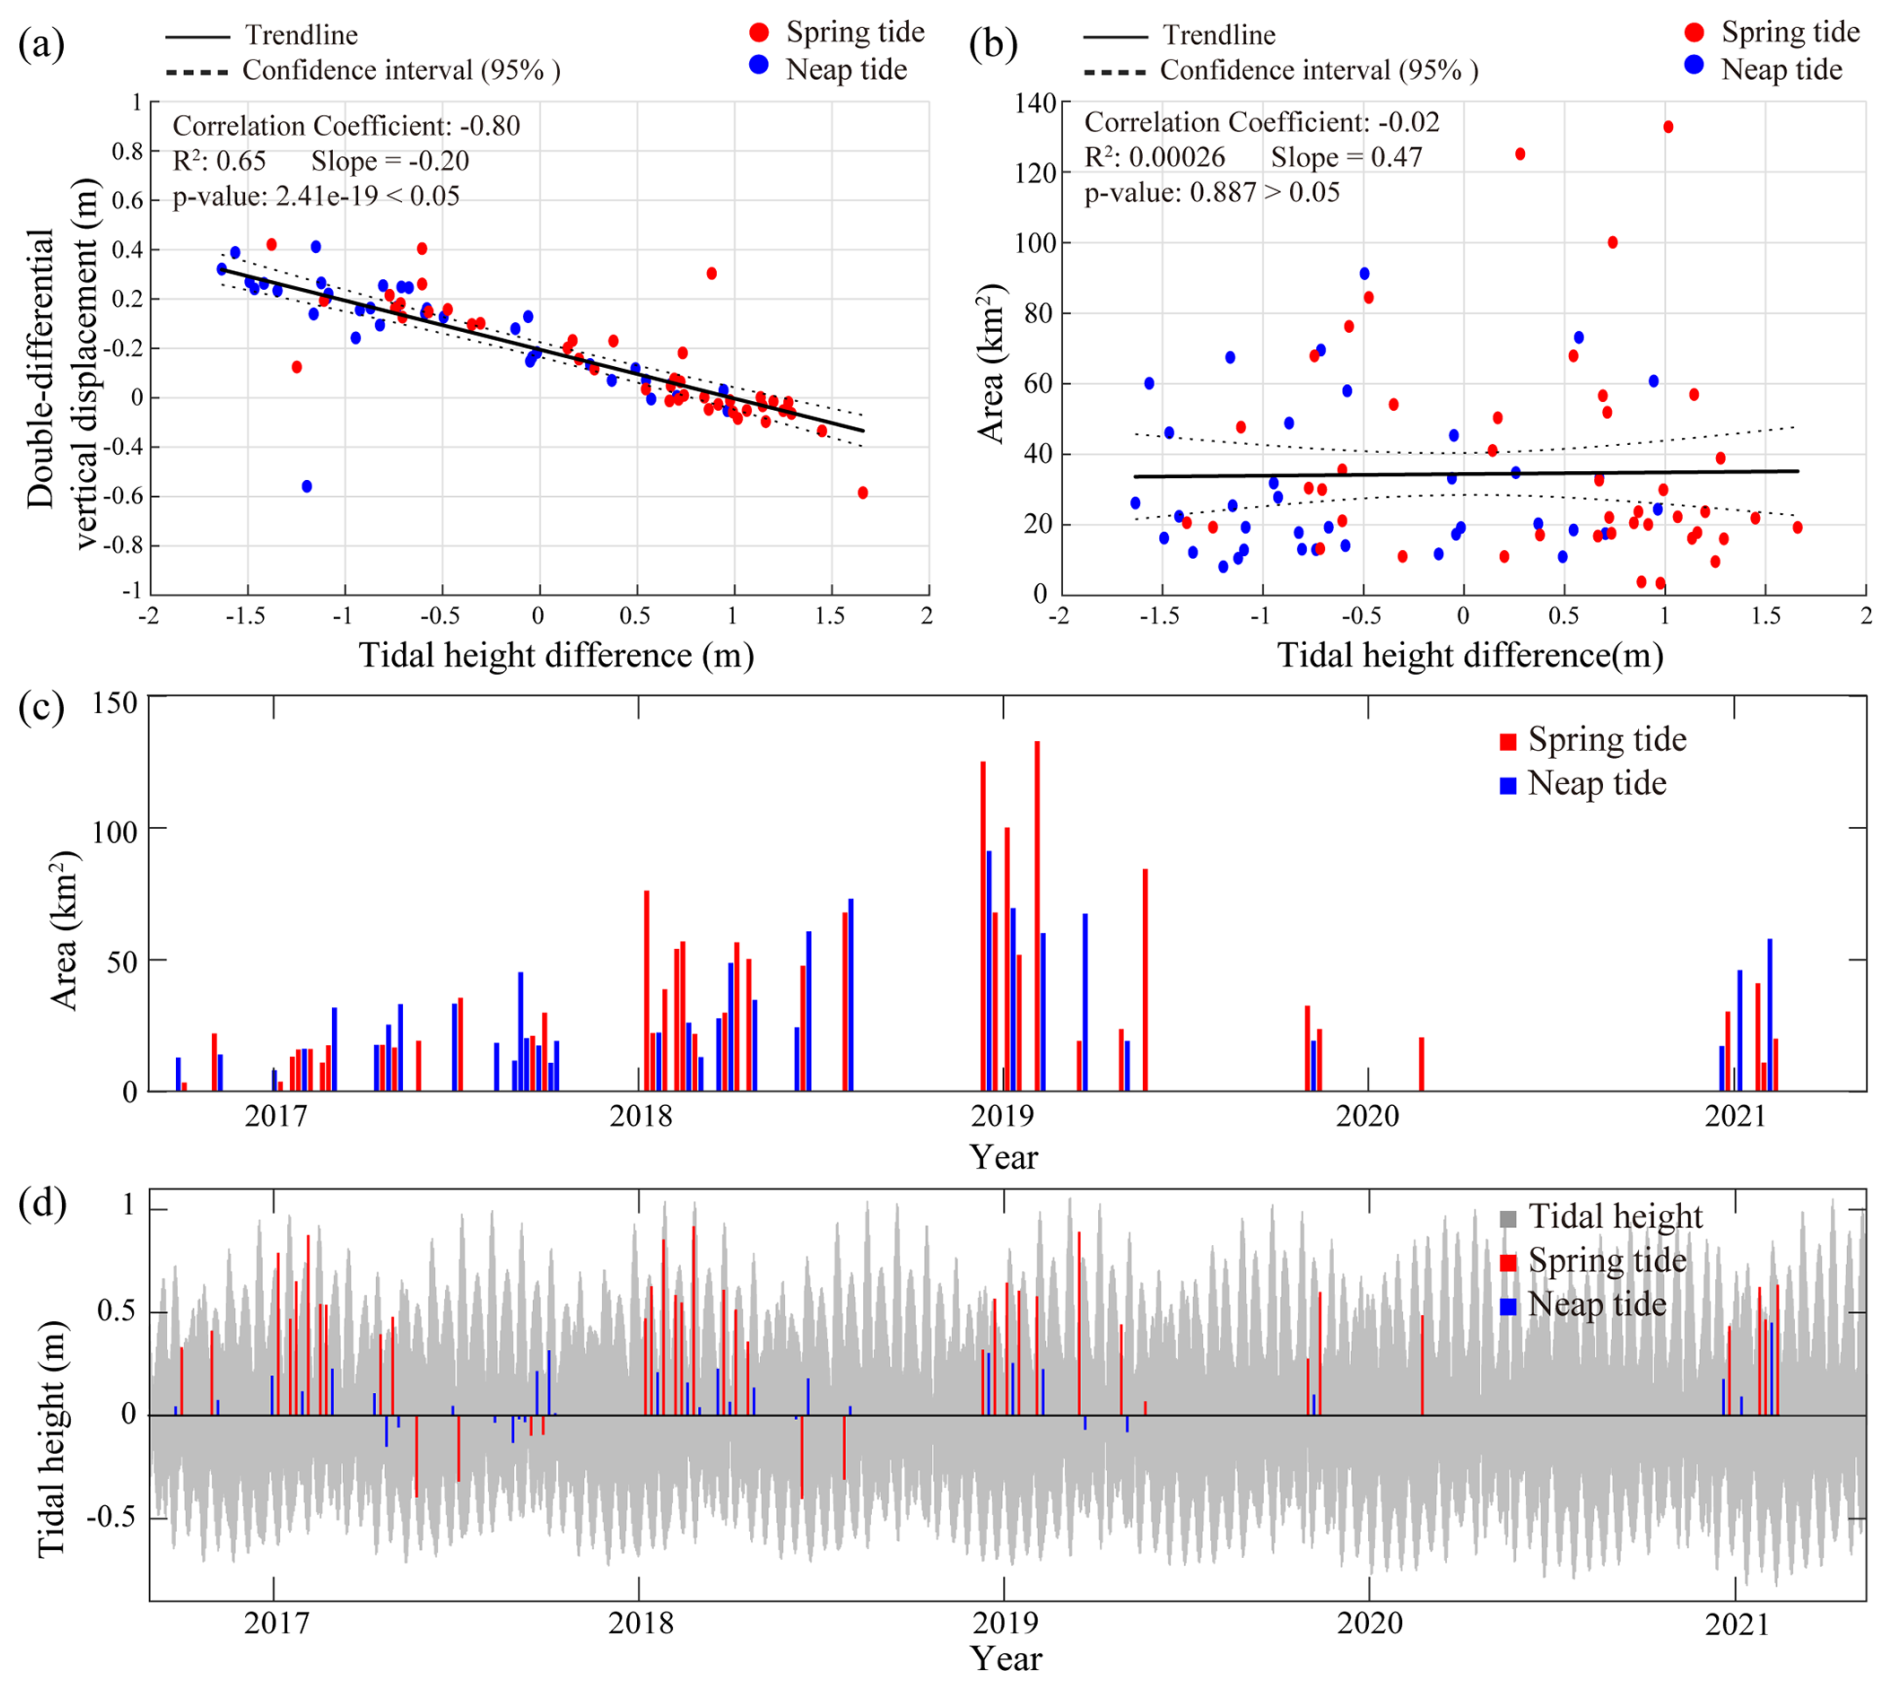
Figure 7Comparison of tidal height differences with double-differential vertical displacement, comparison of tidal height differences and area of grounding region, including time series of area and tidal height variations. (a) Scatter plot of tidal height difference versus double-differential vertical displacement, showing a strong negative linear correlation between the two variables (, , R2=0.65). (b) Scatter plot of tidal height versus area of zero vertical displacement region, indicating weak relationship between the two datasets (, , R2=0.00026). (c) Time series of changes in ice rumple area. (d) Time series of tidal height changes, where 0 represents mean sea level. In all panels, blue vertical lines or points indicate ephemeral grounding events during the neap tide period, while red vertical lines or points represent those during the spring tide period.
Figure 7c and d further show no significant relationship between tidal height and area of grounding, indicating that area variability is not solely governed by tidal forcing. Notably, area of grounding region increased from December 2016–February 2019 and decreased thereafter. When combined with Fig. 6a, where near-zero double-differential vertical-displacement signals suggest the upstream advection of thicker ice, these observations indicate that ice-dynamical processes likely play a substantial role in driving ephemeral grounding.
3.2 Changes in surface features and ice thickness
Figure 8 shows the evolution of the surface ridges elevation and grounding areas using double-differential vertical displacement calculation (Sect. 2.1) from December 2010–January 2021. Some ridges higher than 75 m were advected from upstream and passed through the area near the ice rumple L (Fig. 8b–l).
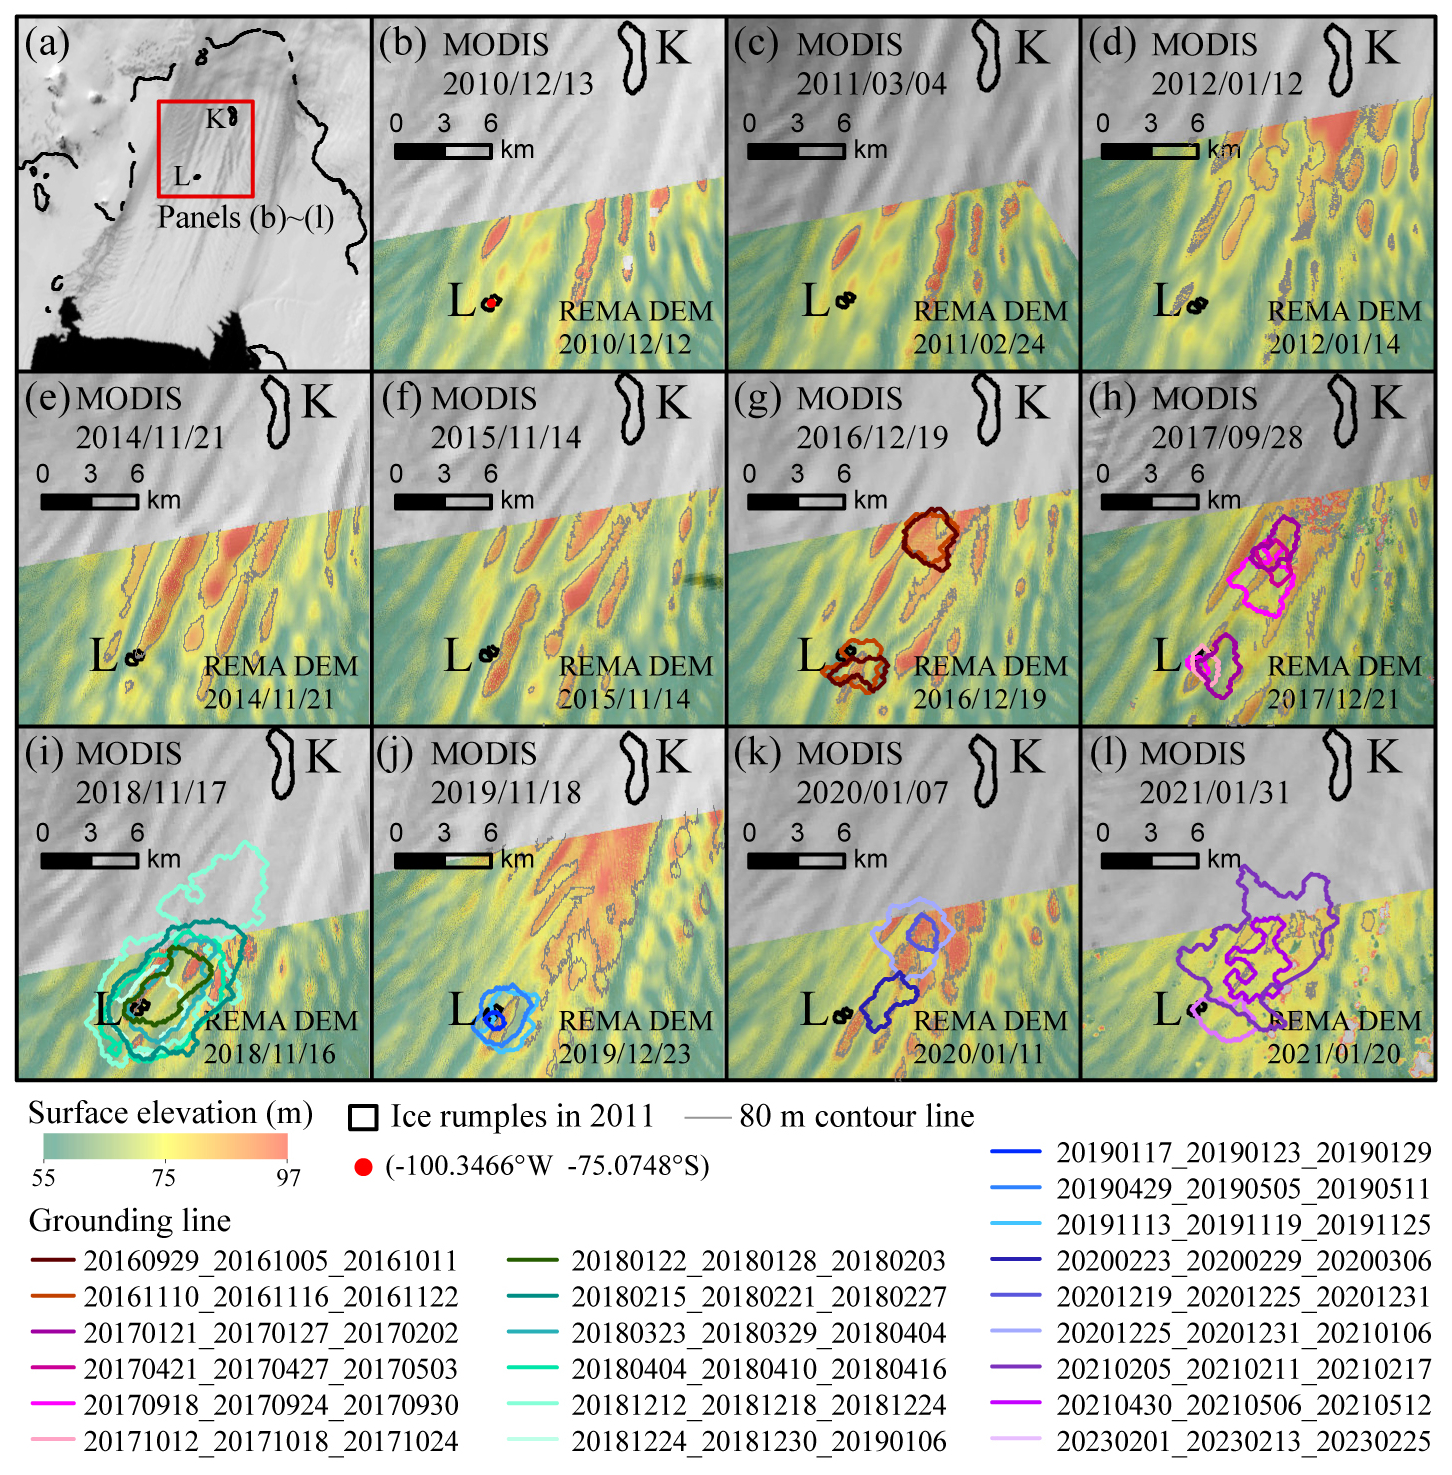
Figure 8Changes in surface ridges at PIIS near ice rumple L. (a) Overview map showing the subregion outlined by the red frame, corresponding to panels (b–l). (b–l) Surface ridges and their elevation changes from 2010–2021, derived from corrected REMA strips. The two black circles indicate the positions of ice rumples. Grounding lines are delineated based on the zero-contour of the double-differential vertical displacement. Grey lines are the 80 m contour line. The red point in panel (b) marks the location where the thickness time series near Rumple L was extracted in Fig. 9b.
Profiles of ice-equivalent freeboard thickness derived from ICESat-2 link surface-elevation changes to variations in grounding-zone extent (Fig. 9). ICESat-2 carries three beam pairs, each consisting of a strong and a weak beam; the strong beams transmit with higher energy, and the weak beams are positioned to the left of their corresponding strong beams. For our analysis of ice-thickness changes, we used gt2l (weak beam) and gt2r (strong beam) from track 965, and gt3l (weak beam) and gt3r (strong beam) from track 1094, all of which cross the ephemeral grounding region. Figure 9a shows the locations of tracks 1094 and 965. Figure 9b presents mean thickness trends along the two tracks between 75.15° S and 75.05° S. Track 965 exhibits a steady increase in ice thickness from 2016–2021, whereas track 1094 shows a decrease from 2015–2017, followed by a rebound in 2018 and another decline after 2020. Near ice rumple L (red point in Fig. 8), ice thickness remained approximately ∼580 m from 2012–2017 (Fig. 9b). Thickness peaked at ∼770 m in 2018 and then dropped to ∼470 m by 2021, including a ∼300 m decreased between 2020 and 2021. The grounding-line-enclosed area was larger in 2019 (Fig. 9a), corresponding to the area time series (Fig. 7c).
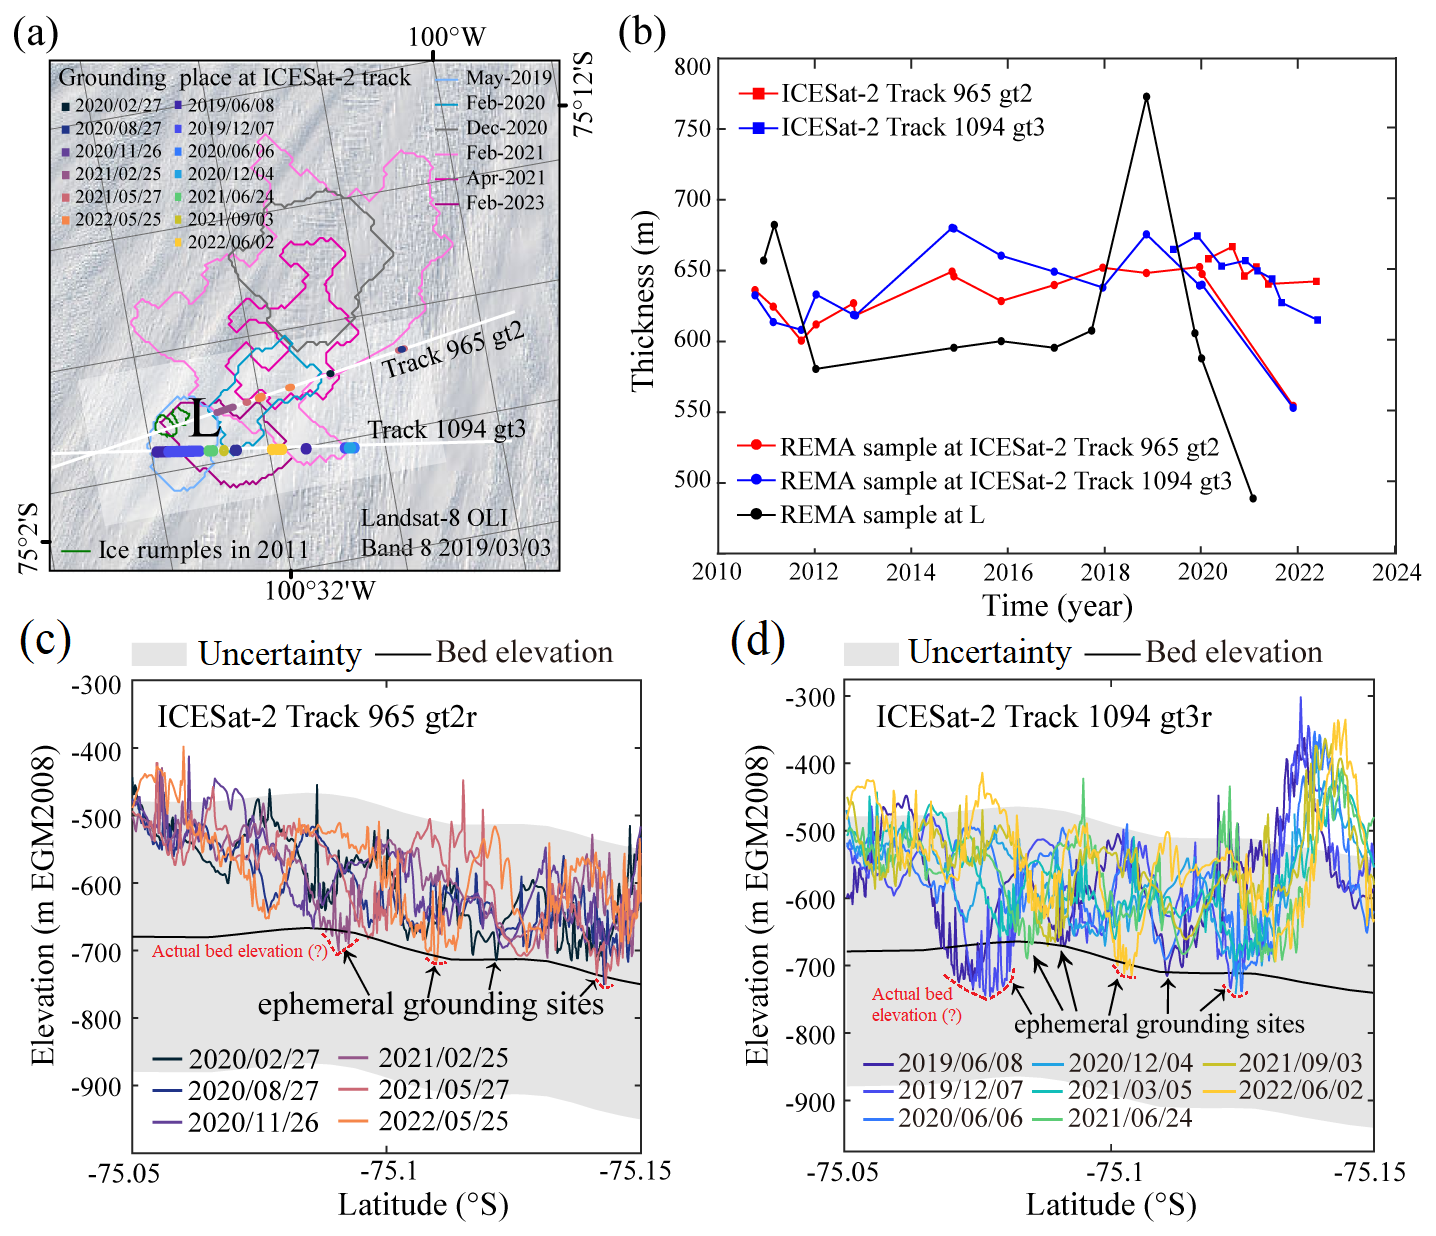
Figure 9Time series of mean ice-equivalent freeboard thickness and ice shelf bottom elevation profiles along ICESat-2 tracks 965 and 1094. (a) ICESat-2 tracks 965 and 1094 that were used for ice-equivalent freeboard thickness change analysis and grounding lines near the ice rumple L from April 2011–February 2021. Background is from Landsat-8 OLI optical image on 3 March 2019. (b) Time series of mean ice-equivalent freeboard thickness (2010–2022). Mean ice-equivalent freeboard thickness from ICESat-2 was calculated along tracks 965 and 1094 between 75.15 and 75.05° S, representing the mean of measurements from both the strong and weak ICESat-2 beams. REMA thickness values were sampled at the same locations as the ICESat-2 tracks. (c) Ice shelf bottom elevation profiles along ICESat-2 track 965 gt2r between February 2020 and May 2022. (d) Ice shelf bottom elevation profiles along ICESat-2 track 1094 gt3r between June 2019 and June 2022. Bed elevations are from the BedMachine v3 dataset (Morlighem et al., 2020; Morlighem, 2022), converted from EIGEN-6C4 to the EGM2008 geoid to match the vertical datum of REMA strips. The estimated vertical uncertainty is ±200 m (shown as a grey transparent box). The potential actual bed elevation is marked by a red dashed line.
Bottom elevation profiles derived from ICESat-2 strong beam further reveal changes in grounding status (Fig. 9c and d). The ice shelf was ungrounded on 27 August 2020 and 5 March 2021, but showed weak grounding on 6 June 2020 (Fig. 9c-d). Figures 9c and 9d suggest that the bed elevation beneath the rumple is likely too high in the BedMachine v3 dataset (red dashed line). Therefore, our results could help correct this potential error in the BedMachine v3 dataset. By integrating double-differential vertical displacement data with bottom elevation profiles, we find that ephemeral grounding signatures disappeared after March 2020 and reappeared in December 2020.
3.3 Rift propagation history from 2013–2019
Using Landsat imagery, we manually tracked rift propagation from 2013–2019 (Fig. 10). Rift R1 first appeared in the 15 December 2017 image (Fig. 10d), shortly after the region passed through the ephemeral grounding region (Fig. 10c). Similarly, Rift R2 emerged in the 11 December 2018 image (Fig. 10i) following its passage through the same grounding region (Fig. 10h). Rift R3 appeared on 8 January 2020 after also crossing this grounding region. These three rifts ultimately contributed to the 2020 calving event (Fig. 10k). Together, these observations support Joughin et al. (2021) in suggesting that ephemeral grounding events facilitate rift propagation and thereby indirectly influence the calving process of the ice shelf.
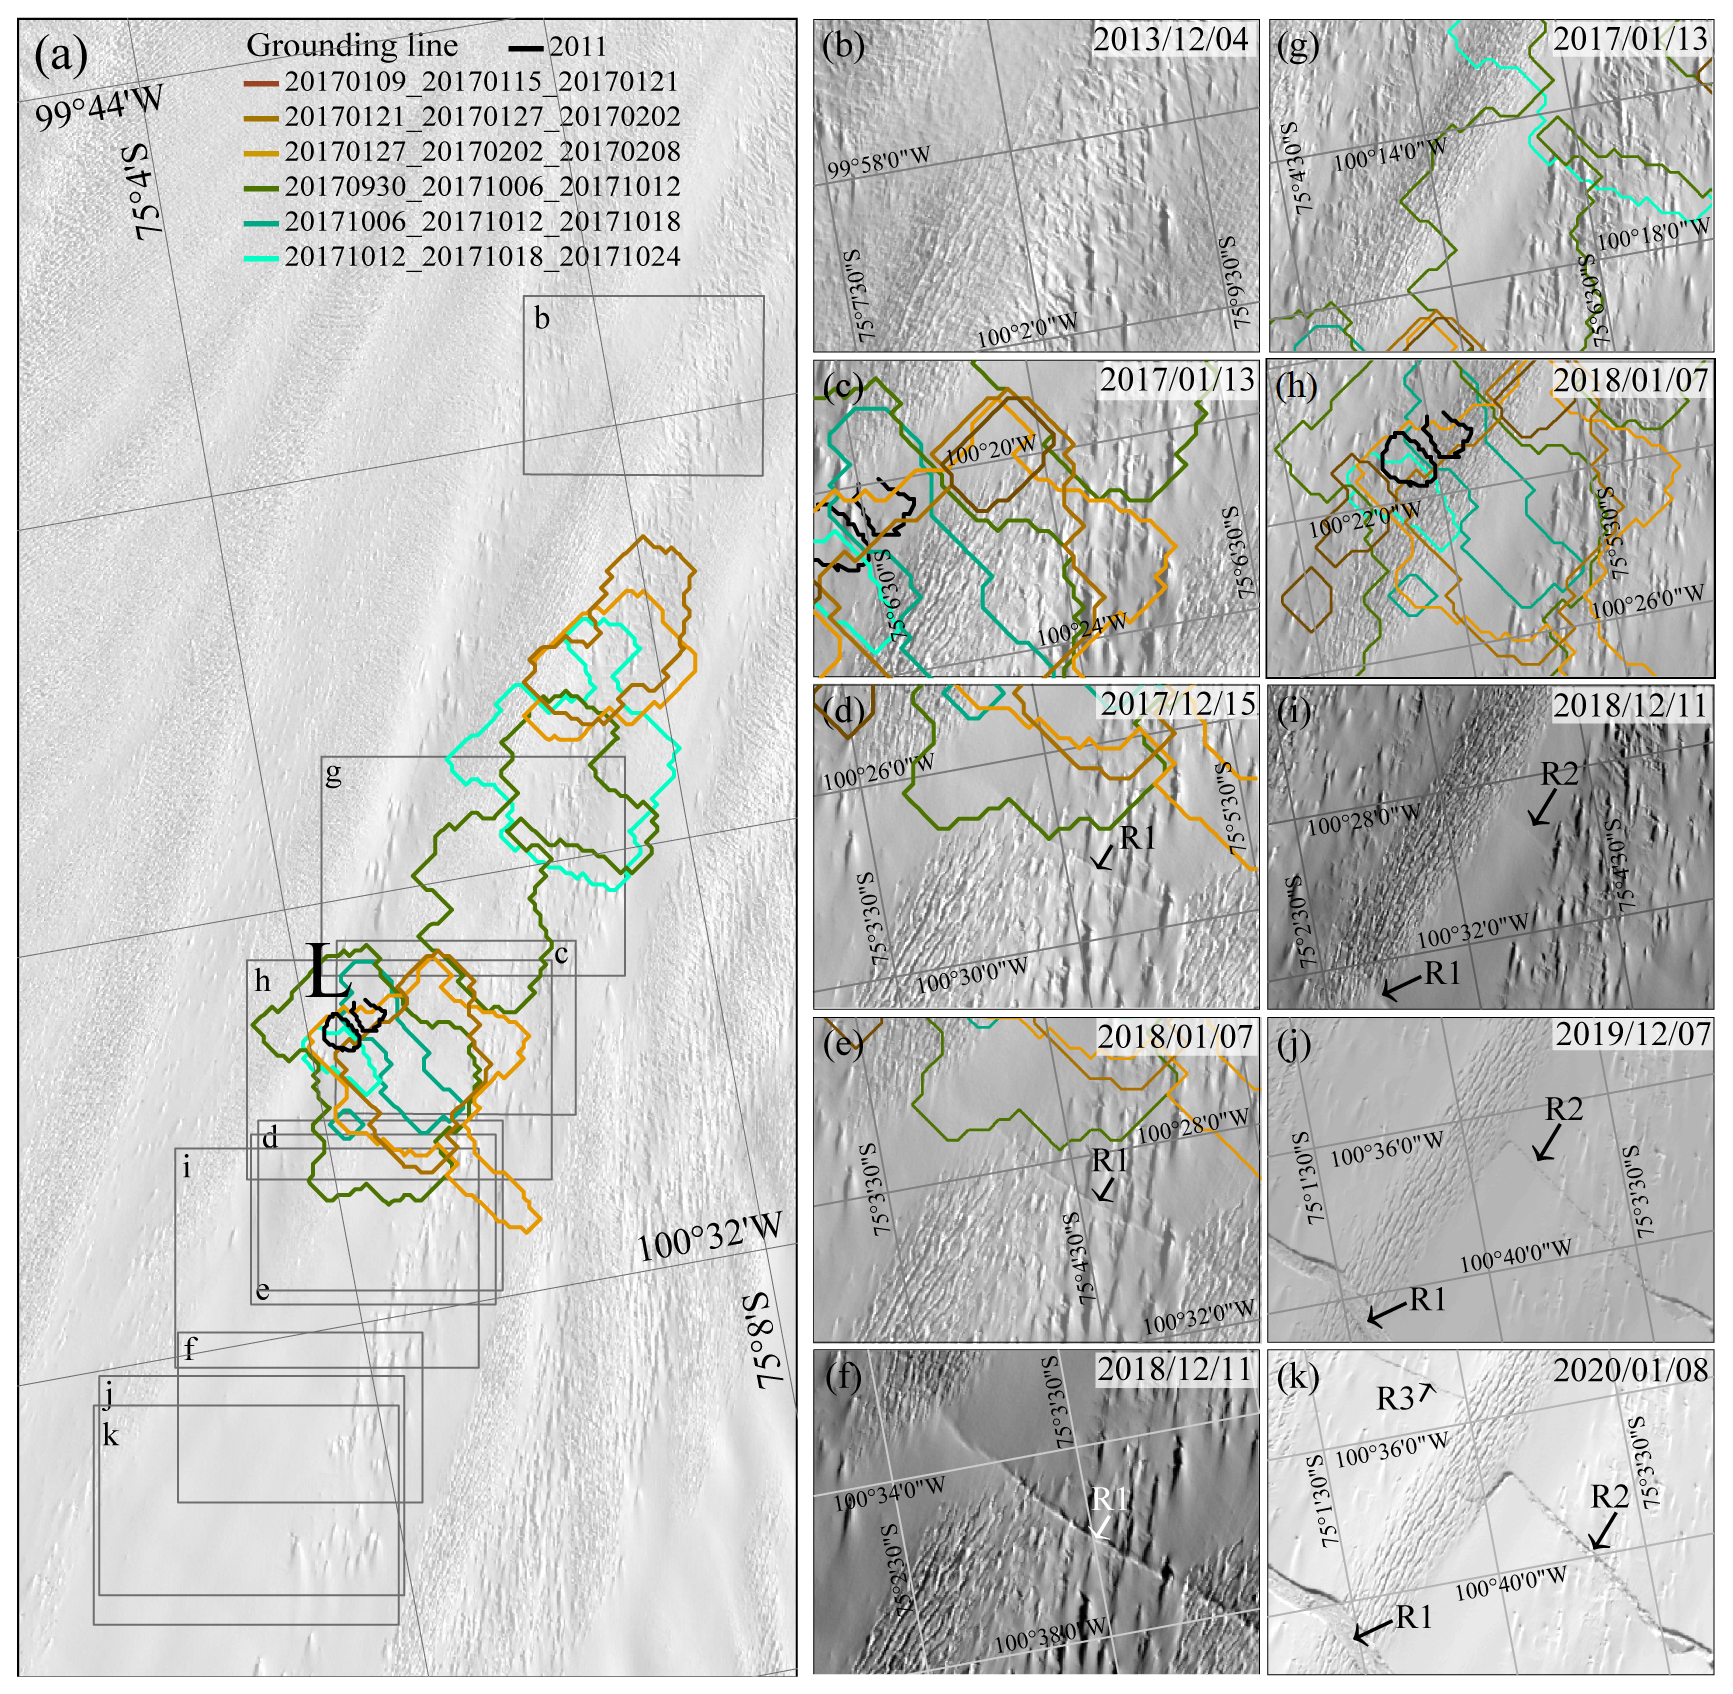
Figure 10Rift propagation history from 2013–2019. (a) Overview map showing the positions of panels (b–k). The background image is a Landsat-8 panchromatic image from 4 December 2013. (b–k) show the propagation history of the rifts R1, R2 and R3 (black or white arrow), which led to the 2020 calving event. The black circles indicate the positions of ice rumple L. Grounding lines are delineated based on the near-zero value of the double-differential vertical displacement.
By integrating vertical displacement patterns, tidal height differences, and ICESat-2-derived ice thickness profiles, we captured ephemeral grounding of PIIS between 2014 and 2023. These findings emphasize the importance of combined geodetic and altimetric observations in resolving ephemeral grounding behaviour.
Our results reveal recurring ephemeral grounding at ice rumple L from at least November 2016 through April 2020, followed by a reappearance in December 2020. This signal is modulated by tidal dynamics and variations in ice shelf thickness. Near-zero vertical displacement signals were observed during multiple years and were most prominent during spring tide periods when tidal amplitudes were highest. This finding supports the idea that tidal variations can modulate the vertical position of the ice shelf base, causing it to intermittently contact the seafloor and resulting in ephemeral grounding (Minchew et al., 2017). The dual-satellite configuration significantly enhanced detection capabilities for ephemeral grounding events. When both Sentinel-1A and Sentinel-1B were operational, their combined 6 d repeat cycle increased the probability of capturing imagery during periods of large tidal variation, when ephemeral grounding is most readily observable. However, during single-satellite periods – before Sentinel-1B's launch in April 2016 and after its failure in January 2022 – the extended 12 d repeat cycle of Sentinel-1A alone substantially reduced opportunities to coincide with optimal tidal conditions, hampering detection of these transient phenomena. This temporal sampling limitation underscores how the deployment of higher-resolution SAR satellites with improved revisit frequencies will enhance our ability to observe ephemeral grounding events, ultimately enabling the construction of denser, more temporally continuous records of grounding line dynamics. Our grounding line results also highlight that the DROT method can derive more detailed information than DInSAR at the fast-moving ice shelf, providing a valuable dataset for modelling input.
Thickness of ice advected from upstream has also observed to modulate the grounding of the rumple. Notably, the surface elevation peaked in 2018 and declined significantly between 2020 and 2021, coinciding with changes in grounding behaviour. Near-zero vertical displacement signals, indicative of ephemeral grounding, were detected at ice rumple L from November 2016 through April 2020. These signals disappeared between March and December 2020, during the ice shelf thinning period from 2020–2021. In that instance, a similar signal emerged upstream of the rumple and gradually migrated toward it, suggesting that a thicker section of the ice shelf had moved over the sea ridge, re-establishing ephemeral contact with the bed. With time series of ephemeral grounding activities, the accurately derived ice draft elevations could be used to correct the bed elevation under the ephemeral grounding area, which could be important to ice dynamics modelling study of PIG.
In summary, our study demonstrates that ephemeral grounding at ice rumple L is modulated by the interaction between tidal forcing, ice shelf thickness, and evolving sub-ice geometry. These results provide new insights into the mechanisms driving ephemeral grounding behaviour. Notably, we find the rift that caused the 2020 calving event appeared after pass through the ephemeral grounding region. Our findings support Joughin et al. (2021) in suggesting that ephemeral grounding is linked to ice-shelf rift propagation. Arndt et al. (2018) emphasized the importance of final pinning points in controlling calving line orientation, raising the possibility that ice rumple L may have acted as a final pinning point after the 2015 calving event, thereby influencing rift propagation and subsequent calving. Previous studies (Sun and Gudmundsson, 2023; Joughin et al., 2021) have suggested that calving is the key process causing the speedup of PIG after 2017. These findings underscore the need for high-resolution ice shelf modelling to evaluate how ephemeral grounding affects stress redistribution and overall ice shelf stability.
This study presents the time series of ephemeral grounding events between 2014 and 2023 at the central PIIS, based on DROT applied to Sentinel-1 SAR data. By integrating double-differential vertical displacement maps, tidal height differences, and thickness data calculated from surface elevation data from REMA strips and ICESat-2, we show that ephemeral grounding is modulated by the combined effects of tidal forcing, evolving sub-ice geometry, and changes in ice shelf thickness. Near-zero vertical displacement signals – indicative of intermittent grounding – were repeatedly observed throughout the study period, particularly as the grounded area expanded during spring tides with large tidal amplitudes. Changes in ice thickness also play an important role in driving ephemeral grounding at the PIIS.
We show that ice shelf thickening preceded grounding events, while thinning contributed to ungrounding. The presence and migration of near-zero displacement signals suggest that thicker ice flowing over topographic highs can cause ephemeral grounding. We also show that the rifts responsible for the 2020 calving event appeared after the region passed through the ephemeral grounded area, suggesting that these ephemeral grounding events may have changed the stress distribution of the ice front and contributed to the formation of the rifts.
Our findings demonstrate the highly accurate remote-sensing techniques for monitoring grounding processes. The grounding lines derived from our DROT results can be scaled up to regional applications and provide critical boundary conditions for ice flow modelling efforts. We also reveal that ephemeral grounding influences stress redistribution, calving dynamics, and the long-term stability of vulnerable ice shelves of PIG. These observations could be used to validate the relevant processes in numerical modelling, which is currently poorly represented. In the future, improved satellite coverage, denser SAR time series, and in situ ocean measurements will provide comprehensive database to apply our method in deriving grounding line behaviours of much larger scale.
All software (except GAMMA, which is commercial software and was used to generate displacement in slant-range direction), codes, and satellite and climate datasets used in this study are publicly available and can be obtained from the following sources: The MATLAB plotting codes on which this article is based are available in Greene et al. (2017) and Greene (2021). The BURGEE codes for corrected REMA strips are available in Zinck et al. (2023). The tidal model driver based on MATLAB code is available in Greene et al. (2023). Sentinel-1 images are available for free download from the Alaska Satellite Facility website at https://asf.alaska.edu/ (last access: December 2025). Processed MODIS images are available in Scambos et al. (2022). BedMachine version 3 dataset is from Morlighem (2022). REMA 200 m DEM mosaic and REMA 2 m DEM strips are available from Howat et al. (2022a, b), respectively. CryoSat Baseline-D SARIn Level 2 data are available on the ESA CryoSat Science Server at https://science-pds.cryosat.esa.int/#Cry0Sat2_data%2FIce_Baseline_D%2FSIR_SIN_L2 (last access: December 2025). ICEsat-2 Level 2 ATL06 product is available from Smith et al. (2023). ASAID grounding line products are available from Bindschadler et al. (2011), Rignot et al. (2016), and this study (Chien et al., 2025a). Firn air content is available from Medley et al. (2022b). 6 hourly NCEP/NCAR sea-level pressure is tagged in Google Earth Engine (NCEP_RE_sea_level_pressure). Mean Dynamic Topographies is provided by DTU (Knudsen et al., 2017).
All codes and processed time series data used for analysis and plotting in this study are available from Chien et al. (2025a), including ice front positions delineated from Landsat panchromatic imagery and Sentinel-1 SAR imagery based on Google Earth Engine, double-differential vertical displacement, corrected REMA strips, and MODIs images for Fig. 8. The grounding lines extracted from the double-differential vertical displacement map are available in the supplementary material of this study. The Sentinel-1 image IDs and ephemeral area can be accessed in Tables S1 and S2 in the Supplement.
Movie S1 “Double-differential vertical displacement changes from November 2014–November 2023 at the PIIS” can be accessed at the zenodo link provided by Chien et al. (2025b).
The supplement related to this article is available online at https://doi.org/10.5194/tc-20-245-2026-supplement.
YitC, CZ, and SS designed the experiments and YitC carried them out. YitC developed the MATLAB code and performed all the experiments. BZ provided the corrected CryoSat-2 dataset. YitC prepared the manuscript with contributions from all co-authors.
At least one of the (co-)authors is a member of the editorial board of The Cryosphere. The peer-review process was guided by an independent editor, and the authors also have no other competing interests to declare.
Publisher's note: Copernicus Publications remains neutral with regard to jurisdictional claims made in the text, published maps, institutional affiliations, or any other geographical representation in this paper. The authors bear the ultimate responsibility for providing appropriate place names. Views expressed in the text are those of the authors and do not necessarily reflect the views of the publisher.
We thank all the organizations or projects listed in Open Research. We thank the anonymous reviewers and editors for their insightful comments to improve the manuscript. We sincerely thank Anne Solgaard and Anders Kusk for providing helpful suggestions related to SAR image post-processing. We sincerely thank Jan Wuite for providing helpful suggestions related to tidal correction. We sincerely thank Hilmar Gudmundsson for providing helpful suggestions related to the ephemeral grounding change analysis.
This research has been supported by the National Natural Science Foundation of China (grant nos. 42171133 and 41941010) and the Fundamental Research Funds for the Central Universities (grant no. 2042024kf0016).
This paper was edited by Bert Wouters and reviewed by three anonymous referees.
Andersen, O., Knudsen, P., and Stenseng, L.: The DTU13 MSS (Mean Sea Surface) and MDT (Mean Dynamic Topography) from 20 Years of Satellite Altimetry, in: IGFS 2014, edited by: Jin, S. and Barzaghi, R., 111–121, Springer International Publishing, Cham, https://doi.org/10.1007/1345_2015_182, 2015.
Arndt, J. E., Larter, R. D., Friedl, P., Gohl, K., Höppner, K., and the Science Team of Expedition PS104: Bathymetric controls on calving processes at Pine Island Glacier, The Cryosphere, 12, 2039–2050, https://doi.org/10.5194/tc-12-2039-2018, 2018.
Bamber, J. L., Westaway, R. M., Marzeion, B., and Wouters, B.: The land ice contribution to sea level during the satellite era, Environ. Res. Lett., 13, 063008, https://doi.org/10.1088/1748-9326/aac2f0, 2018.
Benn, D. I., Luckman, A., Åström, J. A., Crawford, A. J., Cornford, S. L., Bevan, S. L., Zwinger, T., Gladstone, R., Alley, K., Pettit, E., and Bassis, J.: Rapid fragmentation of Thwaites Eastern Ice Shelf, The Cryosphere, 16, 2545–2564, https://doi.org/10.5194/tc-16-2545-2022, 2022.
Bindschadler, R., Choi, H., Wichlacz, A., Bingham, R., Bohlander, J., Brunt, K., Corr, H., Drews, R., Fricker, H., Hall, M., Hindmarsh, R., Kohler, J., Padman, L., Rack, W., Rotschky, G., Urbini, S., Vornberger, P., and Young, N.: Getting around Antarctica: new high-resolution mappings of the grounded and freely-floating boundaries of the Antarctic ice sheet created for the International Polar Year, The Cryosphere, 5, 569–588, https://doi.org/10.5194/tc-5-569-2011, 2011.
Chen, Y., Zhou, C., Ai, S., Liang, Q., Zheng, L., Liu, R., and Lei, H.: Dynamics of Dålk glacier in east Antarctica derived from multisource satellite observations since 2000, Remote Sens., 12, 1809, https://doi.org/10.3390/rs12111809, 2020.
Chien, Y.: Dataset for the paper “Ephemeral grounding on the Pine Island Ice Shelf, West Antarctica, from 2014 to 2023”, Zenodo [data set], https://doi.org/10.5281/zenodo.17937377, 2025a.
Chien, Y.: Double-differential vertical displacement changes from November 2014 to November 2023 at the Pine Island Ice Shelf, Zenodo [video supplement], https://zenodo.org/records/14843806, 2025b.
Christianson, K., Bushuk, M., Dutrieux, P., Parizek, B. R., Joughin, I. R., Alley, R. B., Shean, D. E., Abrahamsen, E. P., Anandakrishnan, S., Heywood, K. J., Kim, T. W., Lee, S. H., Nicholls, K., Stanton, T., Truffer, M., Webber, B. G. M., Jenkins, A., Jacobs, S., Bindschadler, R., and Holland, D. M.: Sensitivity of Pine Island Glacier to observed ocean forcing, Geophys. Res. Lett., 43, 10817–10825, https://doi.org/10.1002/2016GL070500, 2016.
Corr, H. F. J., Doake, C. S. M., Jenkins, A., and Vaughan, D. G.: Investigations of an “ice plain” in the mouth of Pine Island Glacier, Antarctica, J. Glaciol., 47, 51–57, https://doi.org/10.3189/172756501781832395, 2001.
Davies, D., Bingham, R. G., Graham, A. G. C., Spagnolo, M., Dutrieux, P., Vaughan, D. G., Jenkins, A., and Nitsche, F. O.: High-resolution subb-ice-shelf seafloor records of twentieth century ungrounding and retreat of Pine Island Glacier, West Antarctica, J. Geophys. Res. Earth Surf., 122, 1698–1714, https://doi.org/10.1002/2017JF004311, 2017.
Depoorter, M., Bamber, J., Griggs, J., Lenaerts, J. T. M., Ligtenberg, S. R. M., van den Broeke, M. R., and Moholdt, G.: Calving fluxes and basal melt rates of Antarctic ice shelves, Nature, 502, 89–92, https://doi.org/10.1038/nature12567, 2013.
Dutrieux, P., Rydt, J. D., Jenkins, A., Holland, P. R., Ha, H. K., Lee, S. H., Steig, E. J., Ding, Q., Abrahamsen, E. P., and Schröder M.: Strong sensitivity of pine island ice-shelf melting to climatic variability, Science, 343, 174–178, https://doi.org/10.1126/science.1244341, 2014.
Fricker, H. A. and Padman, L.: Ice shelf grounding zone structure from ICESat laser altimetry, Geophys. Res. Lett., 33, L15502, https://doi.org/10.1029/2006GL026907, 2006.
Fricker, H. A., Galton-Fenzi, B. K., Walker, C. C., Freer, B. I. D., Padman, L., and DeConto, R.: Antarctica in 2025: Drivers of deep uncertainty in projected ice loss, Science, 387, 601–609, https://doi.org/10.1126/science.adt9619, 2025.
Friedl, P., Weiser, F., Fluhrer, A., and Braun, M. H.: Remote sensing of glacier and ice sheet grounding lines: A review, Earth-Sci. Rev., 201, 102948, https://doi.org/10.1016/j.earscirev.2019.102948, 2020.
Fürst, J., Durand, G., Gillet-Chaulet, F., Tavard, L., Rankl, M., Braun, M., and Gagliardini, O.: The safety band of Antarctic ice shelves, Nat. Clim. Change, 6, 479–482, https://doi.org/10.1038/nclimate2912, 2016.
Graham, A. G. C., Dutrieux, P., Vaughan, D. G., Nitsche, F. O., Gyllencreutz, R., Greenwood, S. L., Larter, R. D., and Jenkins, A.: Seabed corrugations beneath an Antarctic ice shelf revealed by autonomous underwater vehicle survey: Origin and implications for the history of Pine Island Glacier, J. Geophys. Res. Earth Surf., 118, 1356–1366, https://doi.org/10.1002/jgrf.20087, 2013.
Greene, C. A., Gwyther, D. E., and Blankenship, D. D.: Antarctic mapping tools for MATLAB, Comput. Geosci., 104, 151–157, https://doi.org/10.1016/j.cageo.2016.08.003, 2017.
Greene, C. A.: Antarctic Mapping Tools, Version 6, [Software], GitHub, https://github.com/chadagreene/Antarctic-Mapping-Tools (last access: 19 December 2026), 2021.
Greene, C. A., Erofeeva, S., Padman, L., Howard, S., Sutterley, T., and Egbert, G.: The Tide Model Driver for MATLAB, Version 3.0, [Software], https://github.com/chadagreene/Tide-Model-Driver (last access: 19 December 2026), 2023.
Griggs, J. A. and Bamber, J. L.: Antarctic ice-shelf thickness from satellite radar altimetry, J. Glaciol., 57, 485–498, https://doi.org/10.3189/002214311796905659, 2011.
Gudmundsson, G. H., Paolo, F. S., and Adusumilli, S., Fricker, H. A.: Instantaneous Antarctic ice sheet mass loss driven by thinning ice shelves, Geophys. Res. Lett., 46, 13903–13909, https://doi.org/10.1029/2019GL085027, 2019.
Hillenbrand, C. D., Smith, J. A., Hodell, D. A., Greaves, M., Poole, C. R., Kender, S., Williams, M., Andersen, T. J., Jernas, P. E., Elderfield, H., Klages, J. P., Roberts, S. J., Gohl, K., Larter, R. D., and Kuhn, G.: West Antarctic ice sheet retreat driven by Holocene warm water incursions, Nature, 547, 43–48, https://doi.org/10.1038/nature22995, 2017.
Hogg, A. E.: Locating Ice Sheet Grounding Lines Using Satellite Radar Interferometry and Altimetry, PhD Thesis, University of Leeds, 152 pp., https://etheses.whiterose.ac.uk/11356/, 2015.
Howard, S. L., Greene, C. A., Padman, L., Erofeeva, S., and Sutterley, T.: CATS2008_v2023 Circum-Antarctic Tidal Simulation 2008, Version 2023, [data set], U. S. Antarctic Program (USAP) Data Center, https://doi.org/10.15784/601772, 2024.
Howat, I., Porter, C., Noh, M., Husby, E., Khuvis, S., Danish, E., Tomko, K., Gardiner, J., Negrete, A., Yadav, B., Klassen, J., Kelleher, C., Cloutier, M., Bakker, J., Enos, J., Arnold, G., Bauer, G., and Morin, P.: The Reference Elevation Model of Antarctica – Strips, Version 4.1, [data set], Harvard Dataverse, https://data.pgc.umn.edu/elev/dem/setsm/REMA/strips/s2s041/2m/s76w101/ (last access: 19 December 2026), 2022a.
Howat, I., Porter, C., Noh, M., Husby, E., Khuvis, S., Danish, E., Tomko, K., Gardiner, J., Negrete, A., Yadav, B., Klassen, J., Kelleher, C., Cloutier, M., Bakker, J., Enos, J., Arnold, G., Bauer, G., and Morin, P.: The Reference Elevation Model of Antarctica – Mosaics, Version 1.1, [data set], Harvard Dataverse, https://data.pgc.umn.edu/elev/dem/setsm/REMA/mosaic/v1.1/200m/ (last access: 19 December 2026), 2022b.
Howat, I. M., Porter, C., Smith, B. E., Noh, M.-J., and Morin, P.: The Reference Elevation Model of Antarctica, The Cryosphere, 13, 665–674, https://doi.org/10.5194/tc-13-665-2019, 2019.
Jacobs, S. S., Jenkins, A., Giulivi, C. F., and Dutrieux, P.: Stronger ocean circulation and increased melting under pine island glacier ice shelf, Nat. Geosci., 4, 519–523, https://doi.org/10.1038/ngeo1188, 2011.
Jenkins, A., Dutrieux, P., Jacobs, S. S., McPhail, S. D., Perrett, J. R., Webb, A. T., and David, W.: Observations beneath pine island glacier in west Antarctica and implications for its retreat, Nat. Geosci., 3, 468–472, https://doi.org/10.1038/ngeo890, 2010.
Jeong, S., Howat, I. M., and Bassis, J. N.: Accelerated ice shelf rifting and retreat at pine island glacier, west Antarctica, Geophys. Res. Lett., 43, 11720–11725, https://doi.org/10.1002/2016GL071360, 2016.
Joughin, I., Smith, B. E., and Abdalati, W.: Glaciological advances made with interferometric synthetic aperture radar, J. Glaciol., 56, 1026–1042, https://doi.org/10.3189/002214311796406158, 2010.
Joughin, I., Shean, D. E., Smith, B. E., and Dutrieux, P.: Grounding line variability and subglacial lake drainage on pine island glacier, Antarctica, Geophys. Res. Lett., 43, 9093–9102, https://doi.org/10.1002/2016GL070259, 2016.
Joughin, I., Shapero, D., Smith, B., Dutrieux, P., and Barham, M.: Ice-shelf retreat drives recent pine island glacier speedup, Sci. Adv., 7, eabg3080, https://doi.org/10.1126/sciadv.abg3080, 2021.
Kalnay, E., Kanamitsu, M., Kistler, R., Collins, W., Deaven, D., Gandin, L., Iredell, M., Saha, S., White, G., Woollen, J., Zhu, Y., Chelliah, M., Ebisuzaki, W.,Higgins, W., Janowiak, J., Mo, K. C., Ropelewski, C., Wang, J., Leetmaa, A., Reynolds, R., Jenne, R., and Joseph, D.: The NCEP/NCAR 40-Year Reanalysis Project, B. Am. Meteorol. Soc., 77, 437–472, https://doi.org/10.1175/1520-0477(1996)077<0437:TNYRP>2.0.CO;2, 1996.
Knudsen, P., Andersen, O., and Maximenko, N.: Mean dynamic topography dtumdt15, DTU [data set], https://ftp.space.dtu.dk/pub/DTU15/2_MIN/ (last access: 19 December 2025), 2017.
Lhermitte, S., Sun, S., Shuman, C., Wouters, B., Pattyn, F., Wuite, J., Berthierf, E., and Nagler, T.: Damage accelerates ice shelf instability and mass loss in Amundsen Sea Embayment, P. Natl. Acad. Sci. USA, 117, 24735–24741, 2020.
Lowery, K., Dutrieux, P., Holland, P. R., Hogg, A. E., Gourmelen, N., and Wallis, B. J.: Spatio-temporal melt and basal channel evolution on Pine Island Glacier ice shelf from CryoSat-2, EGUsphere [preprint], https://doi.org/10.5194/egusphere-2025-267, 2025.
Marsh, O. J., Rack, W., Floricioiu, D., Golledge, N. R., and Lawson, W.: Tidally induced velocity variations of the Beardmore Glacier, Antarctica, and their representation in satellite measurements of ice velocity, The Cryosphere, 7, 1375–1384, https://doi.org/10.5194/tc-7-1375-2013, 2013.
Matsuoka, K., Hindmarsh, R., Moholdt, G., Bentley, M., Pritchard, H., Brown, J., Conway, H., Drews, R., Durand, G., Goldberg, D., T., Hattermann, Kingslake, J., Lenaerts, J. T. M., Martín, C., Mulvaney, R., Nicholls, K. W., Pattyn, F., Ross, N., Scambos, T., and Whitehouse, P. L.: Antarctic ice rises and rumples: Their properties and significance for ice-sheet dynamics and evolution, Earth-Sci. Rev., 150, 724–745, https://doi.org/10.1016/j.earscirev.2015.09.004, 2015.
Medley, B., Neumann, T. A., Zwally, H. J., Smith, B. E., and Stevens, C. M.: Simulations of firn processes over the Greenland and Antarctic ice sheets: 1980–2021, The Cryosphere, 16, 3971–4011, https://doi.org/10.5194/tc-16-3971-2022, 2022a.
Medley, B., Neumann, T. A., Zwally, H. J., Smith, B. E., and Stevens, C. M.: NASA GSFC Firn Densification Model version 1.2.1 (GSFC-FDMv1.2.1) for the Greenland and Antarctic Ice Sheets: 1980–2022, Version 1.2.1, [data set], Zenodo, https://zenodo.org/records/7221954, 2022b.
Meloni, M., Bouffard, J., Parrinello, T., Dawson, G., Garnier, F., Helm, V., Di Bella, A., Hendricks, S., Ricker, R., Webb, E., Wright, B., Nielsen, K., Lee, S., Passaro, M., Scagliola, M., Simonsen, S. B., Sandberg Sørensen, L., Brockley, D., Baker, S., Fleury, S., Bamber, J., Maestri, L., Skourup, H., Forsberg, R., and Mizzi, L.: CryoSat Ice Baseline-D validation and evolutions, The Cryosphere, 14, 1889–1907, https://doi.org/10.5194/tc-14-1889-2020, 2020.
Miles, B. W. J. and Bingham, R. G.: Progressive unanchoring of Antarctic ice shelves since 1973, Nature, 626, 785–791, https://doi.org/10.1038/s41586-024-07049-0, 2024.
Milillo, P., Rignot, E., Mouginot, J., Scheuchl, B., Morlighem, M., Li, X., and Salzer, J. T.: On the short-term grounding zone dynamics of Pine Island Glacier, West Antarctica, observed with COSMO-SkyMed interferometric data, Geophys. Res. Lett., 44, 10436, https://doi.org/10.1002/2017GL074811, 2017.
Minchew, B. M., Simons, M., Riel, B., and Milillo, P.: Tidally induced variations in vertical and horizontal motion on Rutford ice stream, west Antarctica, inferred from remotely sensed observations, J. Geophys. Res. Earth Surf., 122, 167–190, https://doi.org/10.1002/2016JF003971, 2017.
Morlighem, M., Rignot, E., Binder, T., Blankenship, D., Drews, R., Eagles, G., Eisen, O., Ferraccioli, F., Forsberg, R., Fretwell, P., Goel, V., Greenbaum, J. S., Gudmundsson, H., Guo, J., Helm, V., Hofstede, C., Howat, I., Humbert, A., Jokat, W., Karlsson, N. B., Lee, W. S., Matsuoka, K., Millan, R., Mouginot, J., Paden, J., Pattyn, F., Roberts, J., Rosier, S., Ruppel, A., Seroussi, H., Smith, E. C., Steinhage, D., Sun, B., van den Broeke, M. R., van Ommen, T. D., van Wessem, M., and Young, D. A.: Deep glacial troughs and stabilizing ridges unveiled beneath the margins of the Antarctic ice sheet, Nat. Geosci., 13, 132–137, https://doi.org/10.1038/s41561-019-0510-8, 2020.
Morlighem, M.: MEaSUREs BedMachine Antarctica, Version 3, [data set], NASA National Snow and Ice Data Center Distributed Active Archive Center, https://nsidc.org/data/nsidc-0756/versions/3 (last access: 19 December 2026), 2022.
Mouginot, J., Rignot, E., and Scheuchl, B.: Sustained increase in ice discharge from the Amundsen Sea Embayment, West Antarctica, from 1973 to 2013, Geophys. Res. Lett., 41, 1576–1584, https://doi.org/10.1002/2013GL059069, 2014.
Otsu, N.: A threshold selection method from gray-level histograms, IEEE Transactions on Systems, Man, and Cybernetics, 9, 62–66, https://doi.org/10.1109/TSMC.1979.4310076, 1979.
Paolo, F. S., Fricker, H. A., and Padman, L.: Volume loss from Antarctic ice shelves is accelerating, Science, 348, 327–331, https://doi.org/10.1126/science.aaa0940, 2015.
Pavlis, N. K., Holmes, S. A., Kenyon, S. C., and Factor, J. K.: The development and evaluation of the Earth Gravitational Model 2008, J. Geophys. Res., 117, B04406, https://doi.org/10.1029/2011JB008916, 2012.
Pritchard, H. D., Ligtenberg, S. R. M., Fricker, H. A., Vaughan, D. G., van den Broeke, M. R., and Padman, L.: Antarctic ice-sheet loss driven by basal melting of ice shelves, Nature, 484, 502–505, https://doi.org/10.1038/nature10968, 2012.
Qi, M., Liu, Y., Liu, J., Cheng, X., Lin, Y., Feng, Q., Shen, Q., and Yu, Z.: A 15-year circum-Antarctic iceberg calving dataset derived from continuous satellite observations, Earth Syst. Sci. Data, 13, 4583–4601, https://doi.org/10.5194/essd-13-4583-2021, 2021.
Rignot, E.: Fast Recession of a West Antarctic Glacier, Science, 281, 549–551, https://doi.org/10.1126/science.281.5376.549, 1998.
Rignot, E.: Ice-shelf changes in pine island bay, Antarctica, 1947–2000, J. Glaciol., 48, 247–256, https://doi.org/10.3189/172756502781831386, 2002.
Rignot, E., Mouginot, J., Morlighem, M., Seroussi, H., and Scheuchl, B.: Widespread, rapid grounding line retreat of Pine Island, Thwaites, Smith, and Kohler Glaciers, West Antarctica, from 1992 to 2011, Geophys. Res. Lett., 41, 3502–3509, https://doi.org/10.1002/2014GL060140, 2014.
Rignot, E., Mouginot, J., and Scheuchl, B.: Measures Antarctic grounding line from differential satellite radar interferometry, Version 2, [data set], NASA National Snow and Ice Data Center Distributed Active Archive Center, https://nsidc.org/data/NSIDC-0498/versions/2 (last access: 19 December 2026), 2016.
Rignot, E., Mouginot, J., Scheuchl, B., Van Den Broeke, M., Van Wessem, M. J., and Morlighem, M.: Four decades of Antarctic Ice Sheet mass balance from 1979–2017, P. Natl. Acad. Sci. USA, 116, 1095–1103, https://doi.org/10.1073/pnas.1812883116, 2019.
Sánchez-Gámez, P. and Navarro, F. J.: Glacier surface velocity retrieval using D-InSAR and offset tracking techniques applied to ascending and descending passes of sentinel-1 data for southern Ellesmere ice caps, Canadian Arctic, Remote Sens., 9, 442, https://doi.org/10.3390/rs9050442, 2017.
Scambos, T., Wallin, B., and Bohlander, J.: Images of Antarctic Ice Shelves, Version 2, [data set], NASA National Snow and Ice Data Center Distributed Active Archive Center, https://nsidc.org/data/nsidc-0102/versions/2 (last access: 19 December 2026), 2022.
Schmeltz, M., Rignot, E., and MacAyeal, D. R.: Ephemeral grounding as a signal of ice-shelf change, J. Glaciol., 47, 71–77, https://doi.org/10.3189/172756501781832502, 2001.
Shean, D. E.: Quantifying ice-shelf basal melt and ice-stream dynamics using high-resolution DEM and GPS time series, PhD Thesis, University of Washington, http://hdl.handle.net/1773/36365 (last access: 19 December 2026), 2016.
Shean, D. E., Joughin, I. R., Dutrieux, P., Smith, B. E., and Berthier, E.: Ice shelf basal melt rates from a high-resolution digital elevation model (DEM) record for Pine Island Glacier, Antarctica, The Cryosphere, 13, 2633–2656, https://doi.org/10.5194/tc-13-2633-2019, 2019.
Shepherd, A., Ivins, E. R., Geruo, A., Barletta, V. R., Bentley, M. J., Bettadpur, S., Briggs, K. H., Bromwich, D. H., Forsberg, R., Galin, N., Horwath, M., Jacobs, S., Joughin, I., King, M. A., Lenaerts, J. T. M., Li, J., Ligtenberg, S. R. M., Luckman, A., Luthcke, S. B., McMillan, M., Meister, R., Milne, G., Mouginot, J., Muir, A., Nicolas, J. P., Paden, J., Payne, A. J., Pritchard, H., Rignot, E., Rott, H., Sørensen, L. S., Scambos, T. A., Scheuchl, B., Schrama, E. J. O., Smith, B., Sundal, A. V., Van Angelen, J. H., Van De Berg, W. J., Van Den Broeke, M. R., Vaughan, D. G., Velicogna, I., Wahr, J., Whitehouse, P. L., Wingham, D. J., Yi, D., Young, D., and Zwally, H. J.: A reconciled estimate of ice-sheet mass balance, Science, 338, 1183–1189, https://doi.org/10.1126/science.1228102, 2012.
Shepherd, A., Fricker, H. A., and Farrell, S. L.: Trends and connections across the Antarctic cryosphere, Nature, 558, 223–232, https://doi.org/10.1038/s41586-018-0171-6, 2018.
Smith, J. A., Andersen, T. J., Shortt, M., Gaffney, A. M., Truffer, M., Stanton, T. P., Bindschadler, R., Dutrieux, P., Jenkins, A., Hillenbrand, C.-D., Ehrmann, W., Corr, H. F. J., Farley, N., Crowhurst, S., and Vaughan, D. G.: Subb-ice-shelf sediments record history of twentieth-century retreat of pine island glacier, Nature, 541, 77–80, https://doi.org/10.1038/nature20136, 2017.
Smith, B., Fricker, H. A., Holschuh, N., Gardner, A. S., Adusumilli, S., Brunt, K. M., Csatho, B., Harbeck, K., Huth, A., Neumann, T., Nilsson, J., and Siegfried, M. R.: Land ice height-retrieval algorithm for NASA's ICESat-2 photon-counting laser altimeter, Remote Sens. Environ., 233, 111352, https://doi.org/10.1016/j.rse.2019.111352, 2019.
Smith, B., Fricker, H. A., Gardner, A. S., Medley, B., Nilsson, J., Paolo, F. S., Holschuh, N., Adusumilli, S., Brunt, K., Csatho, B., Harbeck, K., Markus, T., Neumann, T., Siegfried, M. R., and Zwally, H. J.: Pervasive ice sheet mass loss reflects competing ocean and atmosphere processes, Science, 368, 1239–1242, https://doi.org/10.1126/science.aaz5845, 2020.
Smith, B., Adusumilli, S., Csathó, B. M., Felikson, D., Fricker, H. A., Gardner, A., Holschuh, N., Lee, J., Nilsson, J., Paolo, F. S., Siegfried, M. R., Sutterley, T., and the ICESat-2 Science Team: ATLAS/ICESat-2 L3 A Land Ice Height, Version 6, [data set], NASA National Snow and Ice Data Center Distributed Active Archive Center, https://doi.org/10.5067/ATLAS/ATL06.006, 2023.
Solgaard, A., Kusk, A., Merryman Boncori, J. P., Dall, J., Mankoff, K. D., Ahlstrøm, A. P., Andersen, S. B., Citterio, M., Karlsson, N. B., Kjeldsen, K. K., Korsgaard, N. J., Larsen, S. H., and Fausto, R. S.: Greenland ice velocity maps from the PROMICE project, Earth Syst. Sci. Data, 13, 3491–3512, https://doi.org/10.5194/essd-13-3491-2021, 2021.
Sun, S. and Gudmundsson, G. H.: The speedup of Pine Island Ice Shelf between 2017 and 2020: revaluating the importance of ice damage, J. Glaciol., 69, 1983–1991, https://doi.org/10.1017/jog.2023.76, 2023.
Walker, C. C., Millstein, J. D., Miles, B. W. J., Cook, S., Fraser, A. D., Colliander, A., Misra, S., Trusel, L. D., Adusumilli, S., Roberts, C., and Fricker, H. A.: Multi-decadal collapse of East Antarctica's Conger–Glenzer Ice Shelf, Nat. Geosci. 17, 1240–1248, https://doi.org/10.1038/s41561-024-01582-3, 2024.
Wallis, B. J., Hogg, A. E., Zhu, Y., and Hooper, A.: Change in grounding line location on the Antarctic Peninsula measured using a tidal motion offset correlation method, The Cryosphere, 18, 4723–4742, https://doi.org/10.5194/tc-18-4723-2024, 2024.
Wang, S., Alexander, P. M., Alley, R. B., Huang, Z., Parizek, B. R., Willet, A. G., and Anandakrishnan, S.: Recent variability in fracture characteristics and ice flow of Thwaites Ice Shelf, West Antarctica, Journal of Geophysical Research: Earth Surface, 130, e2024JF008118, https://doi.org/10.1029/2024JF008118, 2025.
Wegmüller, U., Werner, C., Strozzi, T., Wiesmann, A., Frey, O., and Santoro, M.: Sentinel-1 support in the gamma software, Procedia Comput. Sci., 100, 1305–1312, https://doi.org/10.1016/j.procs.2016.09.246, 2016.
Zhang, B., Liu, J., Wang, Z., Liu, T., and Yang, Q.: Antarctic ice-shelf thickness changes from CryoSat-2 SARIn mode measurements: Assessment and comparison with IceBridge and ICESat, J. Earth Syst. Sci., 129, 127, https://doi.org/10.1007/s12040-020-01392-2, 2020.
Zhu, Y., Hogg, A. E., Hooper, A., and Wallis, B. J.: Short and Long-term Grounding Zone Dynamics of Amery Ice Shelf, East Antarctica, EGUsphere [preprint], https://doi.org/10.5194/egusphere-2025-849, 2025.
Zinck, A.-S. P.: BURGEE, [Software], GitHub, https://github.com/aszinck/BURGEE, 2023.
Zinck, A.-S. P., Wouters, B., Lambert, E., and Lhermitte, S.: Unveiling spatial variability within the Dotson Melt Channel through high-resolution basal melt rates from the Reference Elevation Model of Antarctica, The Cryosphere, 17, 3785–3801, https://doi.org/10.5194/tc-17-3785-2023, 2023.