the Creative Commons Attribution 4.0 License.
the Creative Commons Attribution 4.0 License.
 | 16 Mar 2026
A decade of winter supraglacial lake drainage across Northeast Greenland using C-band SAR
Connor Wolfgang Dean
Randall Scharien
Ian Willis
Kali Ann McDougall
This study presents a comprehensive, multi-year assessment of winter supraglacial lake drainages on the Northeast Greenland Ice Sheet, detailing cascading drainage events, in which drainage of one lake triggers a chain of subsequent drainages that often occur within days, examining links to melt-season conditions, and evaluating their potential impact on ice dynamics. Supraglacial lakes can drain rapidly, delivering meltwater to the ice-sheet bed, increasing basal water pressure, reducing friction, and accelerating ice flow. Such drainage events are well-documented across Greenland during the melt season using optical satellite imagery. Recent studies using satellite and airborne radar data reveal that many supraglacial lakes persist beyond summer and may also drain during winter, potentially affecting ice dynamics in a manner similar to melt-season drainages. Here, we use C-band synthetic aperture radar imagery from Sentinel-1 and RADARSAT Constellation Mission spanning ten consecutive winters (2014/2015–2023/2024), to detect winter lake drainages. We develop a normalisation method to integrate images from varying acquisition geometries, enabling high-temporal-resolution monitoring. Our analysis identifies 90 winter drainage events from 55 unique lakes, exhibiting substantial interannual variability, ranging from a maximum of 18 events in winter 2018/2019 to a minimum of four events in both 2020/2021 and 2021/2022. Drainages occurred most frequently in early winter, with decreasing frequency as winter progressed. Approximately half of the observed drainages were part of 13 cascading events, each involving two to seven lakes over distances up to ∼33 km. Comparisons with preceding melt-season conditions reveal negative correlations between winter drainage frequency and both melt-season intensity and melt-season drainage frequency. Ice velocity analyses over the ten-year period show no sustained seasonal or annual increases attributable to winter drainages, although isolated short-term increases (6–12 d) were observed.
- Article
(13121 KB) - Full-text XML
- BibTeX
- EndNote


In recent decades, contributions from the Greenland Ice Sheet (GrIS) to global-mean sea level rise have accelerated due to losses from both surface mass balance (SMB) and glacier dynamics (Mouginot et al., 2019; Shepherd et al., 2020; Box et al., 2022). Supraglacial lakes – hereafter often referred to as lakes – are anticipated to expand further inland under continued climate warming (Leeson et al., 2015; Ignéczi et al., 2016; Fan et al., 2025) and contribute to SMB losses by lowering ice sheet surface albedo (Tedesco et al., 2012). In the GrIS ablation zone, lakes form during the melt season and typically drain either slowly, by overtopping their banks and incising outlet channels, or rapidly – within 24 h – via hydrofracture (Sundal et al., 2009; Selmes et al., 2011; Tedesco et al., 2013). Hydrofracture-driven drainage delivers meltwater to the subglacial system via cracks formed by surface stresses, which can enhance basal lubrication and influence ice velocity. These effects are most pronounced in the summer but can persist over annual timescales, particularly in inland regions away from glacier margins (Das et al., 2008; Doyle et al., 2014; Stevens et al., 2015; Christoffersen et al., 2018; Hoffman et al., 2018). At the end of the melt season, lakes may either freeze completely (Selmes et al., 2011; Koenig et al., 2015; Miles et al., 2017) or, as recent studies have shown, drain during winter, when they may trigger ice dynamical responses similar to those observed during the melt season (Schröder et al., 2020; Benedek and Willis, 2021; Maier et al., 2023).
Due to the remoteness and spatiotemporal variability of supraglacial lakes, Earth observation satellites have become crucial tools for monitoring their evolution and investigating associated processes. Early studies used optical remote sensing for phenological analyses of lake areas and volumes (McMillan et al., 2007; Sneed and Hamilton, 2007; Georgiou et al., 2009; Sundal et al., 2009; Selmes et al., 2011; Johansson et al., 2013; Morriss et al., 2013), a method still widely used due to extensive historical archives. For example, the LANDSAT program dates back to 1972, and the Moderate Resolution Imaging Spectroradiometer (MODIS) sensors, aboard NASA's Terra and Aqua satellites, have provided continuous observations since 2000 and 2002, respectively, enabling multi-year to decadal-scale analyses (Liang et al., 2012; Fitzpatrick et al., 2014; Pope et al., 2016; Williamson et al., 2018a; Gledhill and Williamson, 2018; Poinar and Andrews, 2021; Otto et al., 2022).
Most recent supraglacial lake evolution research, relies on Sentinel-2A and 2B and Landsat satellites, because of their frequent, multi-year coverage of most of the GrIS at a medium spatial resolution (10 and 30 m respectively) (Legleiter et al., 2014; Williamson et al., 2018b; Dirscherl et al., 2020; Hochreuther et al., 2021), but commercial very high resolution sensors still play an important role in validation, depth calibration, or very high-resolution case studies (Yang and Smith, 2013; Legleiter et al., 2014; Pope et al., 2016).
While optical imagery has been instrumental in advancing our understanding of lakes during the melt season, the winter period remains understudied since the presence of snow and ice lids, and lack of solar illumination, render optical sensors largely ineffective. Even in summer, optical datasets are prone to temporal aliasing of drainage events, which can bias interpretations of lake drainage mechanisms and timing (Cooley and Christoffersen, 2017; Stevens et al., 2024). Addressing these gaps is crucial for developing a more complete, year-round understanding of lake impacts on ice-sheet dynamics.
Synthetic aperture radar (SAR) sensors transmit electromagnetic radiation in the microwave region of the spectrum, enabling imaging without sunlight and allowing penetration through clouds, as well as through surface snow and upper ice layers of the ice sheet. Incident radar pulses interact with both surface and shallow subsurface (volume) features, producing backscattered signals influenced by surface geometry, roughness, dielectric properties, and SAR system parameters such as frequency, polarization, and incidence angle (Ulaby et al., 1984; Hallikainen et al., 1986; König et al., 2001).
Since the launch of the Copernicus Sentinel-1 mission in 2014 – the use of SAR for supraglacial lake studies has grown significantly, facilitated in part by the open-access policy of the Copernicus programme. The C-band frequency employed by Sentinel-1, along with past and current missions such as European Space Agency's Envisat-ASAR and the Canadian RADARSAT program, remains the most widely used frequency for observing winter supraglacial lakes (Johansson and Brown, 2012; Miles et al., 2017; Benedek and Willis, 2021; Zheng et al., 2023).
Initial SAR-focused studies relied on manual delineation and interpretation of winter scenes (Johansson and Brown, 2012; Poinar et al., 2015). Subsequent efforts introduced semi-automated techniques, such as histogram thresholding to delineate lake extents – first using a fixed threshold within a single scene (Miles et al., 2017) and later improved via adaptive thresholding in a pan-Greenland application (Zheng et al., 2023). More recent advances include the use of convolutional neural networks (CNNs) trained on dual-polarization (HH-HV) Sentinel-1 imagery (where HH is horizontal transmit/receive and HV horizontal transmit/vertical receive). These CNN-based approaches have enabled regional and ice-sheet-scale mapping of lake distributions during both winter and summer seasons (Dirscherl et al., 2021; Dunmire et al., 2021; Jiang et al., 2022; Zheng et al., 2023).
Several studies have used time series of Sentinel-1 HH and HV backscatter to analyse lake behaviour. Approaches for detecting lake drainage differ from those mapping lake extent, as they rely on identifying anomalies in backscatter between successive images. Schröder et al. (2020) mapped lake extent over part of the northeastern sector of the Greenland Ice Sheet using a Bayesian classification applied to time-series of Sentinel-1 HH and HH-HV images and detected winter drainage by tracking backscatter anomalies. Dunmire et al. (2020) combined in-situ ground penetrating radar with Sentinel-1 HH backscatter to identify the winter drainage of a buried lake on the Antarctic Ice Sheet. In southwest Greenland, Benedek and Willis (2021) used a statistical thresholding method on Sentinel-1 HV backscatter series to detect multi-year winter drainage events. More recently, Hossain et al. (2024) developed a Gaussian Mixture Model-based time series classification to characterise different lake evolution behaviours, including drainage, across the entire GrIS. However, their method classifies lakes by behaviour types rather than pinpointing the timing of specific drainage events.
Except for Hossain et al. (2024), who included imagery from multiple orbits and applied temporal smoothing to reduce variability, most studies accounted for the influence of SAR incidence angle on backscatter intensity by using data from a single orbit. This approach ensures consistent backscatter values but limits temporal resolution. With the full Sentinel-1 constellation (Sentinel-1A and Sentinel-1B), the revisit interval is 6 d; with a single satellite, it increases to twelve. While drainage events are detectable within this range (e.g., Schröder et al., 2020; Benedek and Willis, 2021), accurately resolving the timing of individual events, distinguishing rapid from slow drainage processes, and identifying cascading events, requires finer temporal resolution. Cascading events, where drainage of one lake triggers a chain of subsequent drainages, often occur within days. These chain reactions are driven by the rapid injection of meltwater into subglacial pathways, which generates transient stresses capable of forming crevasses (Christoffersen et al., 2018; Hoffman et al., 2018). Documented across multiple regions of the Greenland Ice Sheet (Liang et al., 2012; Fitzpatrick et al., 2014; Otto et al., 2022; Maier et al., 2023), cascading drainage likely represents a common mechanism of lake drainage.
In this study, we investigate winter drainage events in Northeast Greenland at sub-daily temporal resolution by combining Sentinel 1 images with data from the RADARSAT Constellation Mission (RCM), a three-satellite C-band SAR system launched in 2019. We enhance temporal resolution by applying a novel incidence angle normalization technique that enables the integration of SAR images from multiple overlapping orbits. This method minimizes backscatter variability associated with incidence angle differences – both between orbits and within individual images – allowing for consistent analysis across a wider range of acquisitions.
Using this approach, we identify winter lake drainage events spanning the 2014/2015 to 2023/2024 winter seasons. These include individual lakes that drained as many as six times over the ten-year period, as well as cascading drainage sequences involving up to seven interconnected lakes. We examine interannual variability in the frequency of winter drainage events and assess whether preceding summer melt conditions, such as melt intensity and the number of rapid summer drainages, influence the likelihood of winter drainage. For cascading events, we analyse their sequence, spatiotemporal dynamics, prevalence, and evaluate their proximity to modelled subglacial drainage pathways. Finally, we investigate whether winter drainage events influence ice flow dynamics, assessing both short-term (<6 to 12 d) velocity changes and longer-term impacts on seasonal and annual ice motion.
The study area is in Northeast Greenland and includes regions below 1500 m elevation on the marine-terminating outlet glaciers Nioghalvfjerdsbræ (79NG) and Zachariæ Isstrøm (ZI), as defined by basin boundaries from Mouginot and Rignot (2019; Fig. 1). ZI has largely lost its floating tongue following rapid retreat in recent decades, whereas 79NG retains one of Greenland's most extensive floating tongues. In this study, supraglacial lakes located on the floating tongue are not analysed. The total basin areas of 79NG and ZI are 112,677 and 92 576 km2, of which 16 306 and 8704 km2, respectively, lie below 1500 m elevation. Near grounding line elevations of 79NG and ZI are each approximately 100 m. During the melt season, typically from early June to late August, extensive networks of supraglacial rivers and lakes form across elevations ranging from ∼400 to 1500 m (Sundal et al., 2009; Lu et al., 2021; Hochreuther et al., 2021; Turton et al., 2021; Kanzow et al., 2025).
Northeast Greenland currently accounts for ∼18 % of the total lake volume on the ice sheet, with projections indicating this could increase to 30 %–35 % by the end of the century (Ignéczi et al., 2016). Observations from the Center for Remote Sensing of Ice Sheets (CReSIS) ultra-wideband Snow Radar, flown during NASA's Operation Ice Bridge campaigns, have revealed numerous lakes in the 79NG and ZI basins that persist into late winter – some remaining buried for multiple years (Koenig et al., 2015; Lampkin et al., 2020). Sentinel-1 data have also been used to document widespread lake persistence into the winter months and several suspected drainage events in the region (Schröder et al., 2020). In studies using optical sensors, drainage events have been observed during the summer melt season (Neckel et al., 2020; Hochreuther et al., 2021; Humbert et al., 2025; Lutz et al., 2025). The region is characterised by widespread ice slabs but lacks documented firn aquifers (Miège et al., 2016; Miller et al., 2022; Culberg et al., 2024), which may influence meltwater storage and routing.
79NG and ZI are two primary outlets of the Northeast Greenland Ice Stream, which originates from the interior of the GrIS and has shown recent trends of acceleration and thinning (Grinsted et al., 2022; Khan et al., 2022). Since 2000, both glaciers have experienced year-to-year acceleration. 79NG increased from 1500±100 to 2100±41 m yr−1 by 2020, while ZI increased from ∼1200 to ∼2900 m yr−1 by 2019 (Millan et al., 2023). Both glaciers exhibit seasonal summer speedups, with increases of 10 % at 79NG and 18 % at ZI (Lemos et al., 2018).
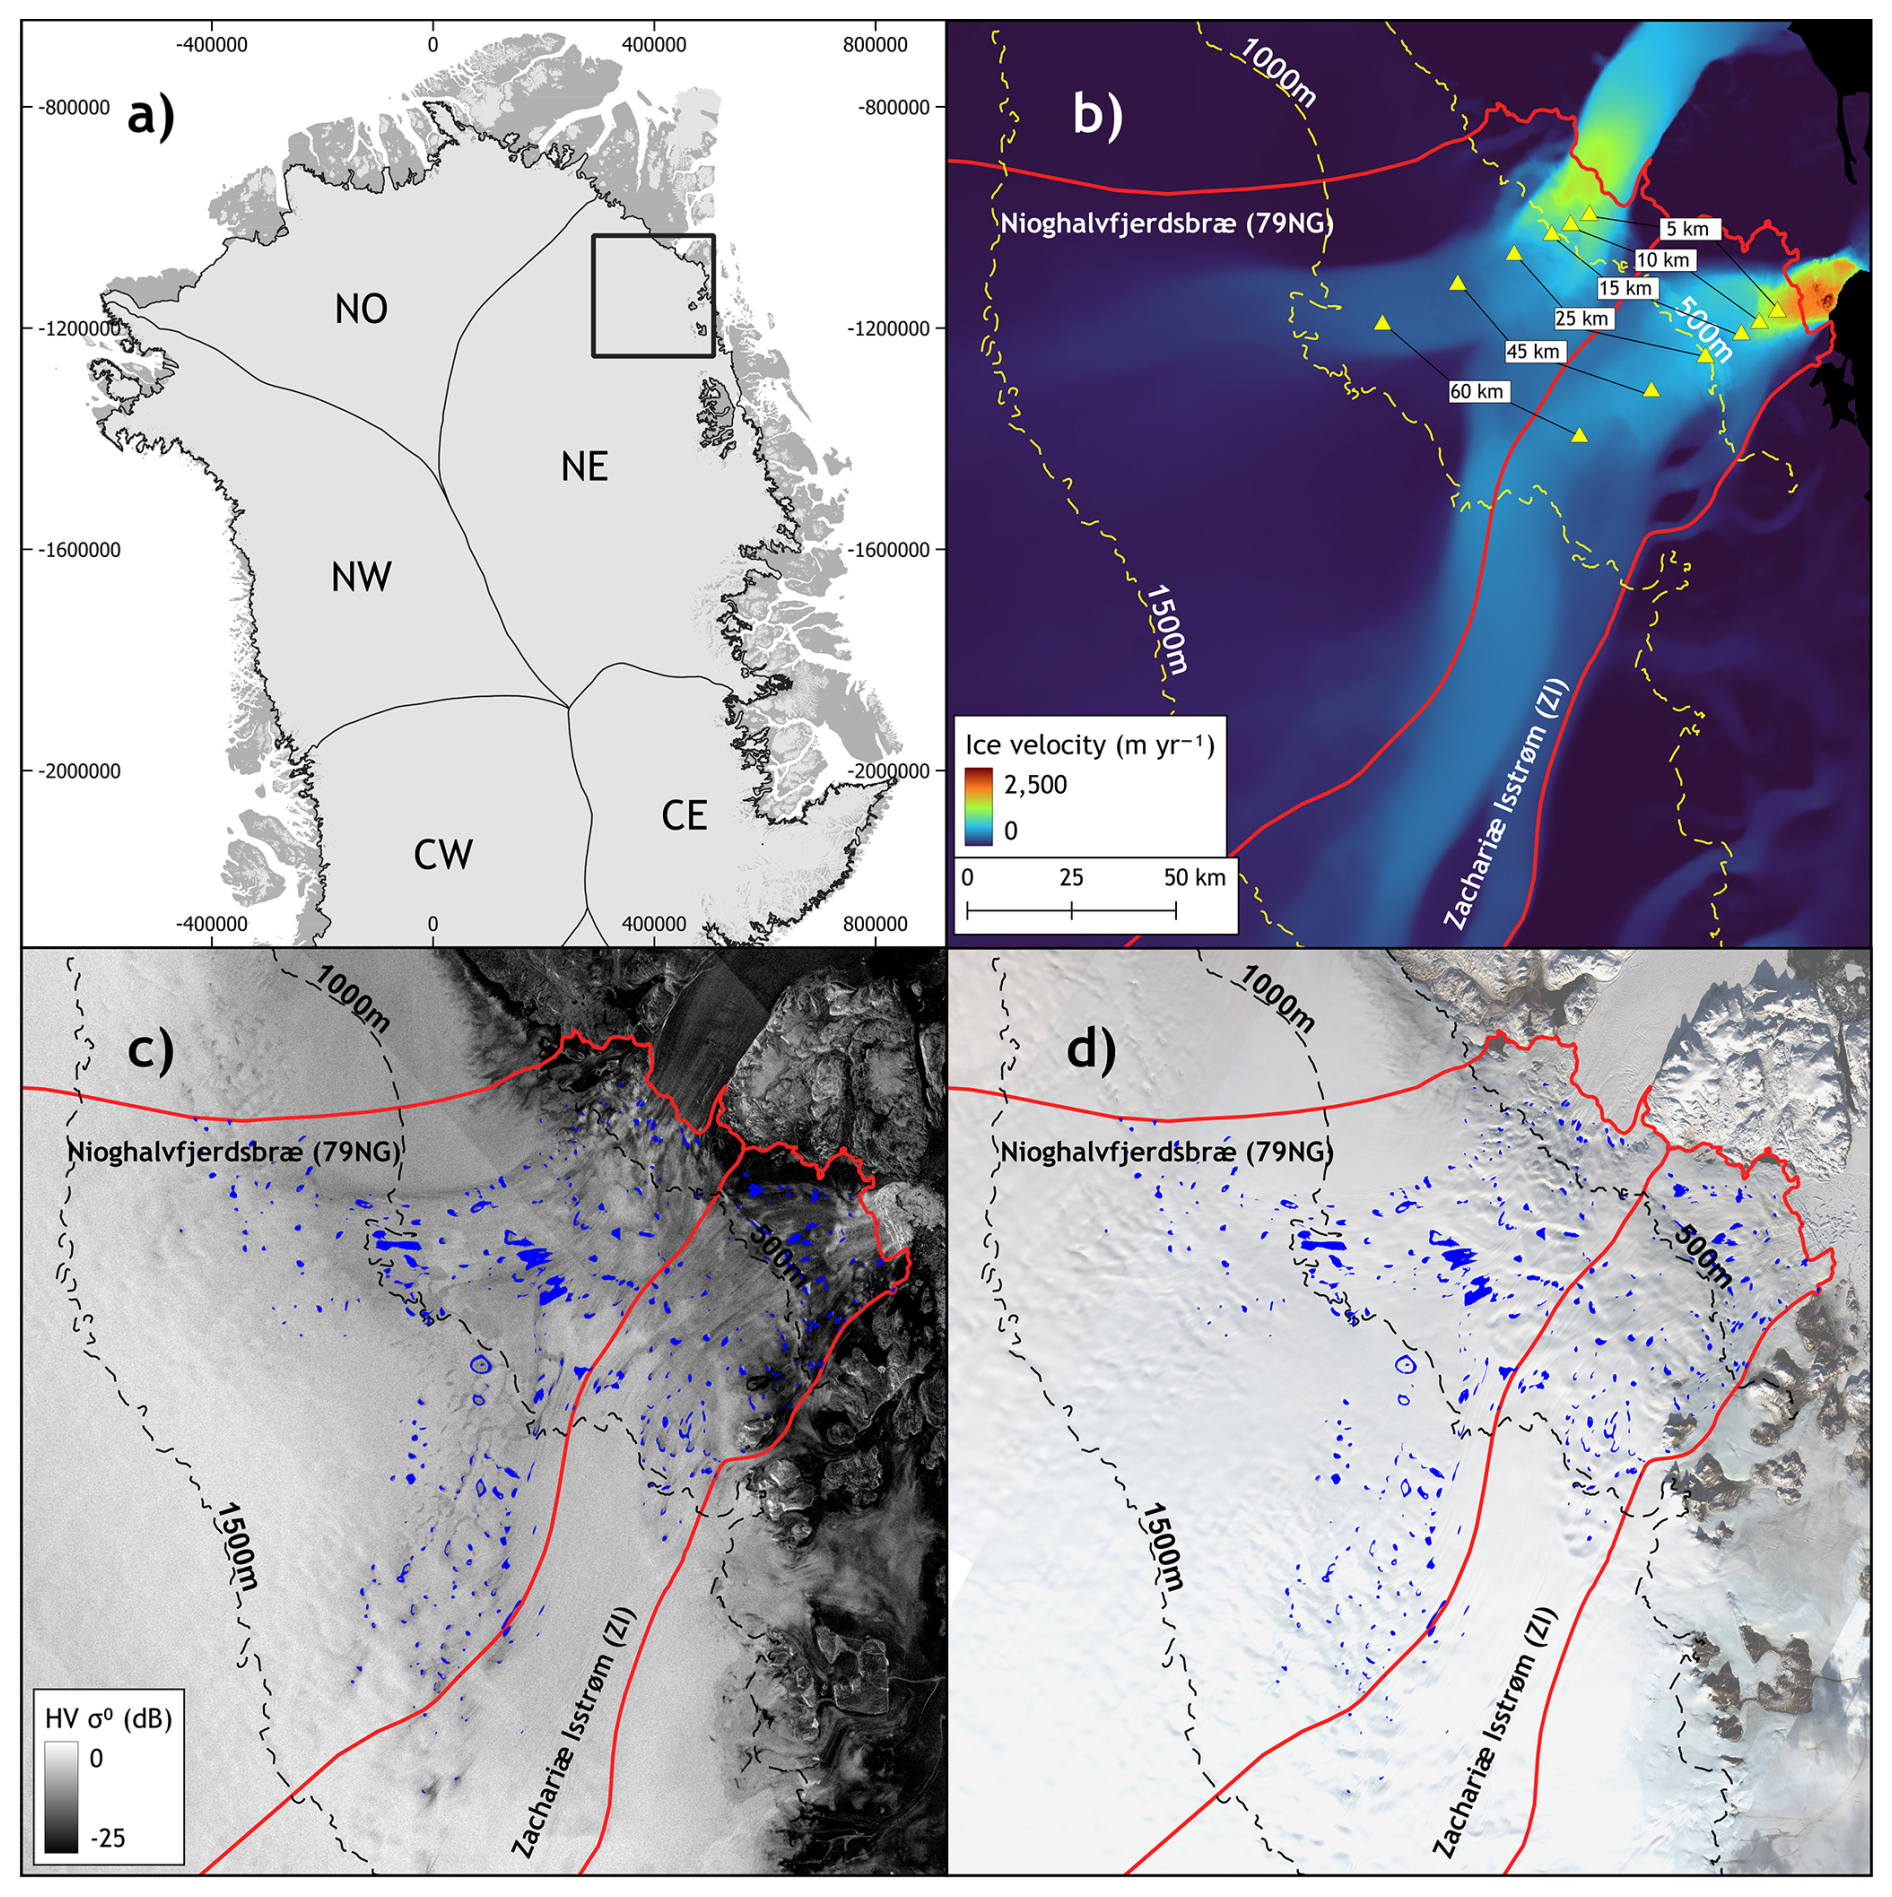
Figure 1Study area in Northeast Greenland. (a) Regional overview map. (b) MEaSUREs multi-year ice sheet velocity mosaic (1995–2015) with sampling locations (yellow triangles) used to extract monthly velocity data from 2015 to 2024 (see Fig. 11; Joughin et al., 2016b). (c) Sentinel-1 Extra Wide mode HV-polarized SAR image from 10 October 2016. (d) Landsat RGB mosaic from 25 September 2016. Blue polygons indicate the 10-year melt season lake mask using Landsat; red outlines show the boundaries of Nioghalvfjerdsbræ (79NG) and Zachariæ Isstrøm (ZI) glaciers (Mouginot and Rignot, 2019).
3.1 Optical imagery
Lake locations were identified using Landsat 8 and 9 Operational Land Imager (OLI) imagery acquired annually between late July and the end of August from 2014 to 2023. We used Tier 1 Level 1 Precision Terrain (L1TP) corrected images and filtered for scenes with less than 50 % cloud cover. Final image selections were made manually following visual inspection to ensure minimal atmospheric interference. Lake masks were generated using a Normalised Water Difference Index modified for ice sheet environments (NDWIice; Yang and Smith, 2013):
where BLUE and RED correspond to OLI bands 2 and 4, respectively. NDWIice values between 0.25 and 0.4 have been shown to effectively detect deep water bodies while minimizing the inclusion of slush (Yang and Smith., 2013; Miles et al., 2017; Williamson et al., 2018b). We empirically selected a threshold of 0.4, which was found to exclude most slush while reliably identifying deep lakes based on manual inspection of RGB (true-colour) images.
False positives caused by clouds and shadows near the ice margin were manually masked out. In addition, supraglacial rivers, characterised by rectilinear or curvilinear shapes, were identified and removed (Lampkin and VanderBerg, 2011; Gledhill and Williamson, 2018). To constrain the study area, we excluded elevations above 1500 m using the ArcticDEM (Porter et al., 2023) and removed land areas using the MEaSUREs Greenland Ice Mapping Project (GIMP) grounded ice mask (Howat et al., 2014; Howat, 2017).
3.2 Synthetic aperture radar imagery
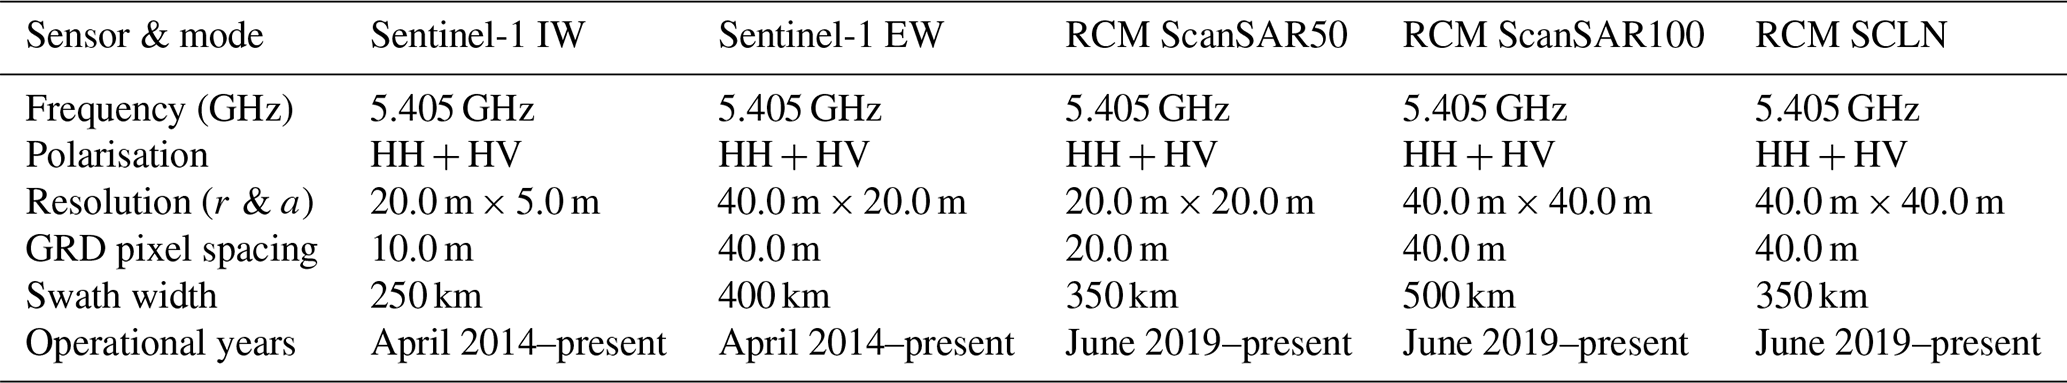
We used C-band SAR imagery from both Sentinel-1 and RCM, which operate in near-polar, sun-synchronous orbits with a shared center frequency of 5.405 GHz (Table 1). Sentinel-1A was launched in 2014, followed by Sentinel-1B in 2016. When operating together, the two satellites were spaced 180° apart on the same orbit, providing a 6 d revisit interval. Prior to the launch of Sentinel-1B and after its failure in December 2021, Sentinel-1A alone provided a 12 d revisit time. RCM, consisting of three identical satellites spaced 120° apart on a shared orbit, was launched in 2019 as a successor to RADARSAT-2, primarily to serve the operational needs of the Canadian Government (Kroupnik et al., 2021). Following the Sentinel-1B failure, the RCM acquisition strategy was modified to compensate, significantly increasing coverage over the GrIS. In this study, Sentinel-1 imagery is used between 2014 and 2021, and RCM imagery is used thereafter. An overview of sensor specifications is provided in Table 1.
To characterise winter lake drainage activity, we analysed imagery spanning each September to May from 2014/15 through 2023/24. This time frame captures the onset of freeze-up, when lakes may be obscured by ice lids and fresh snow, and extends until the onset of surface meltwater production. While this period is slightly longer than that used in a comparable study in southwest Greenland (Benedek and Willis, 2021), it is appropriate given the shorter melt season in Northeast Greenland and prior evidence from optical imagery indicating typical lake burial timing (Sundal et al., 2009; Turton et al., 2021; Lutz et al., 2023).
All available Sentinel-1 Ground Range Detected (GRD) images in Interferometric Wide (IW) and Extra Wide (EW) swath modes were acquired from the Alaska Satellite Facility, while RCM GRD imagery in ScanSAR medium-, high-resolution modes and low-noise modes was obtained from the Earth Observation Data Management System (EODMS) operated by Natural Resources Canada (Table 1). To reduce redundancy, images acquired within 2 h of an earlier one (e.g., consecutive ascending or descending passes) were excluded. After this filtering, the mean interval between lake observations across all winters ranged from 2.7 d in 2014/2015 to 0.7 d in 2017/2018.
Image pre-processing was performed using ESA's Sentinel Application Platform (SNAP). The HV polarisation band (see Sect. 3.3 for justification) was calibrated to normalised radar cross-section sigma naught (), then terrain-corrected using the ArcticDEM v4.1 (Porter et al., 2023), and reprojected to the NSIDC Sea Ice Polar Stereographic North (EPSG:3413) projection using a 40 m pixel spacing and nearest neighbour resampling. The resulting calibrated and georeferenced data are referred to as hereafter.
Table 1Overview of C-band SAR sensors and modes used. For RCM, ScanSAR50 is the medium-resolution mode, ScanSAR100 is the low-resolution mode, and SCLN is the low-noise mode. Resolution is reported as (r & a), where r: range and a: azimuth.
3.3 Detecting drainage events
C-band SAR, with a typical penetration depth of ∼1 to 3 m in glacial materials (Rignot et al., 2001), is well-suited for detecting water in surface lakes but also shallow subsurface water in buried lakes. In this study, lake drainage events were detected using the HV polarisation channel, which is more sensitive to volume scattering and offers deeper penetration than the HH channel (Fischer et al., 2020). This enhanced sensitivity has made it a preferred choice in prior supraglacial lake studies (Miles et al., 2017; Benedek and Willis, 2021; Zheng et al., 2023; Hossain et al., 2024). When a lake drains, the underlying lakebed – composed of firn and glacial ice – is revealed. These materials have a lower dielectric constant than liquid water, and the collapse of an overlying ice lid increases surface roughness. Together, these changes lead to a significant increase in radar backscatter following drainage. In contrast, winter lakes that remain buried beneath snow and ice lids exhibit low backscatter values due to the high dielectric constant of liquid water and the smooth surface interface, which promote specular scattering and suppress radar return (Hallikainen et al., 1986).
3.3.1 Melt season supraglacial lake mask
To detect winter drainage events, we merged all summer lake boundaries into a single 10-year composite representing maximum lake extents. Examples of individual lake extents are shown in Fig. 2. For each lake in this mosaic, we tracked throughout the winter seasons. By using a composite rather than separate yearly maps, we accounted for lakes that remain partially or fully buried over multiple years (Koenig et al., 2015; Lampkin et al., 2020), thereby reducing the likelihood of missing winter drainage events due to incomplete seasonal visibility (Benedek and Willis, 2021). Lakes smaller than 0.1 km2 were excluded from the analysis due to low signal-to-noise ratios, which make backscatter trends less reliable. Additionally, these smaller lakes are more susceptible to freeze-through during winter, owing to their limited volumes and shallow depth, making winter drainage less likely (Lampkin et al., 2020; Law et al., 2020).
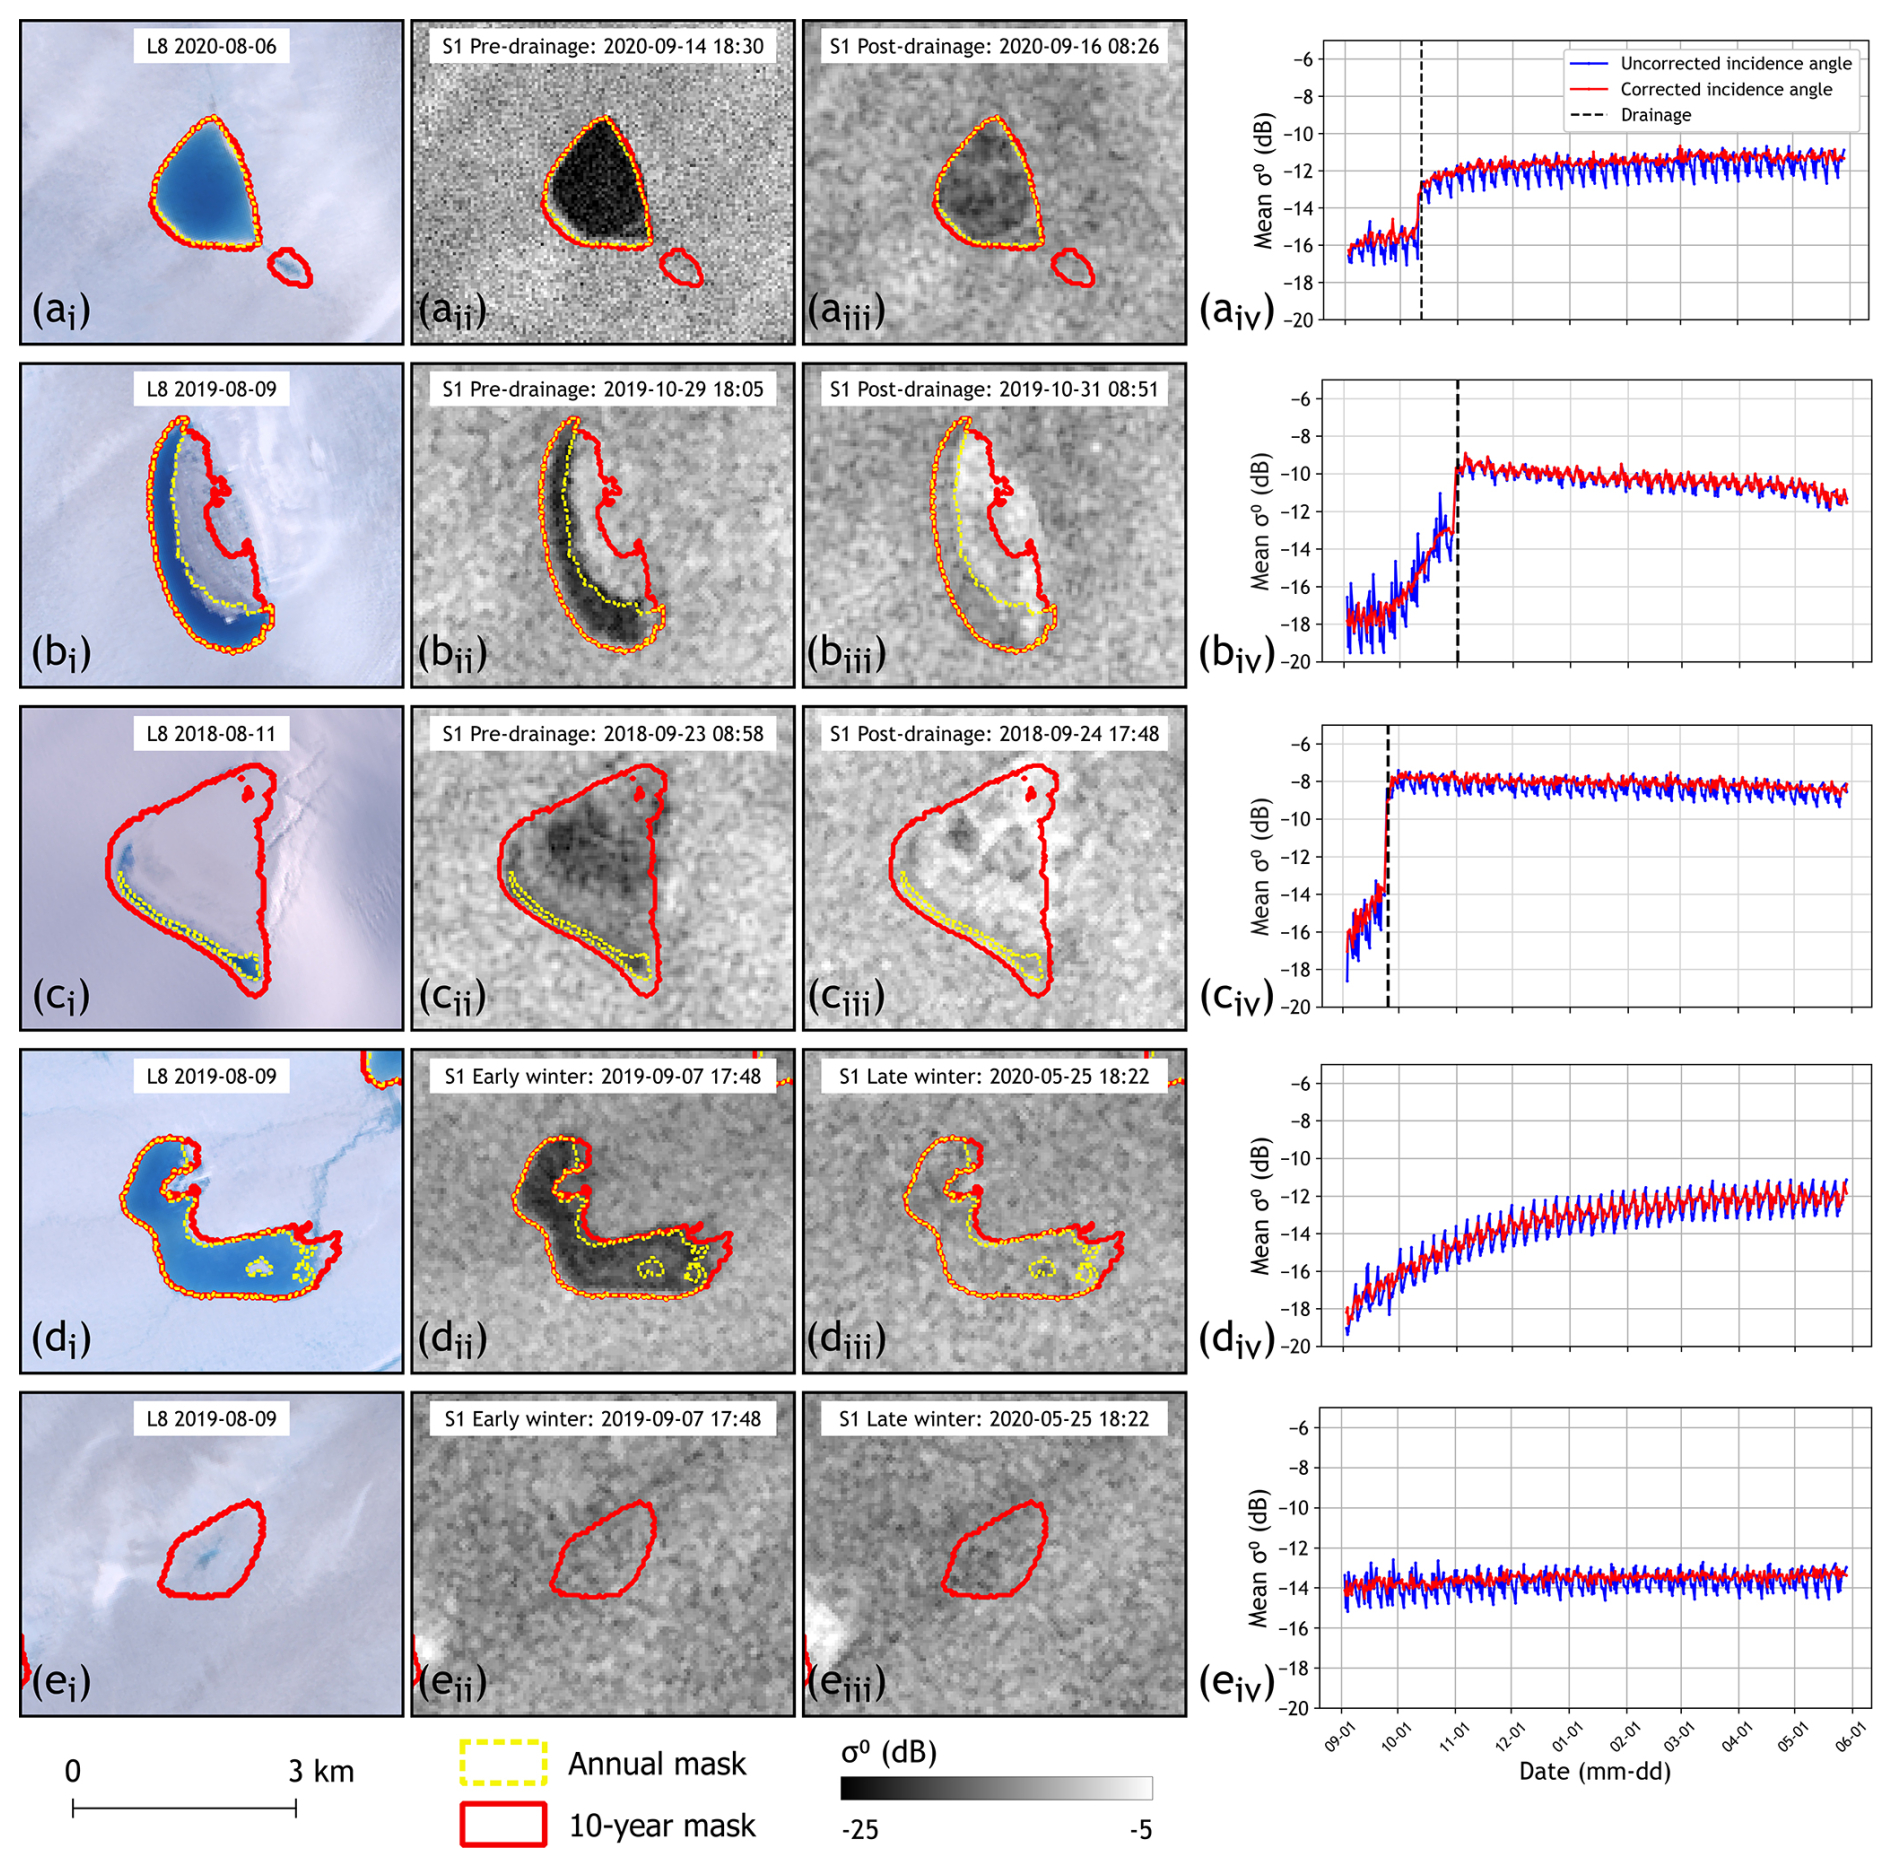
Figure 2Examples of winter lake behaviour and corresponding Sentinel-1 (S1) backscatter time series. Panels show five supraglacial lake types: (a) a subaerial lake that drains; (b) a lake partially covered by a perennial ice lid that drains; (c) a lake with minimal surface expression that drains; (d) a subaerial supraglacial lake that freezes through; and (e) a lake basin that remains dry throughout the melt season and subsequent winter. Column (i) shows Landsat RGB imagery. Columns (ii) and (iii) display C-band SAR images. Red polygons indicate the 10-year Landsat-derived melt season lake masks; yellow dotted polygons show the annual melt season lake masks. Column (iv) shows the time series of mean uncorrected and corrected backscatter extracted within the 10-year Landsat-derived lake mask from the start (1 September) to the end (31 May) of winter.
3.3.2 Incidence angle correction
The Sentinel-1 and RCM image dataset includes acquisitions from multiple orbital tracks, leading to incidence-angle-dependent variations in from the same surface target. This angular dependence has been documented in both sea ice and ice sheet studies across various frequencies, polarisations, and also including second-order texture metrics, and is typically addressed by normalizing backscatter or texture to a common incidence angle using linear models (Mahmud et al., 2018; Scharien and Nasonova, 2022; Culberg et al., 2024).
To correct for this effect, we used a least-squares linear regression relationship between and incidence angle. This was generated from data sampled at monthly intervals within the boundaries of 10 non-draining and 10 empty reference lakes per winter season, totaling 200 lakes over the 10-year study period. These reference lakes ranged in size from 95 to 14 678 pixels, with a mean area of 1290 pixels. Reference lakes were selected based on manual interpretation of winter SAR imagery, optical melt season imagery showing evidence of lake lid collapse (e.g., Schröder et al., 2020; Benedek and Willis, 2021; Maier et al., 2023), and analysis of uncorrected winter backscatter time series.
We applied a multi-slope normalisation method to account for the influence of surface geophysical changes on regression-modelled incidence angle–backscatter relationships before and after drainage events. This technique identifies the optimal slope for normalisation by evaluating the variance of corrected backscatter values across a sliding window of seven observations. Slope values ranging from 0 to −0.20 dB per ° (in −0.005 increments) were tested, and the slope that minimized the variance was selected and applied to correct the center observation in the window to a reference incidence angle of 35°, following:
Where is the backscatter normalised to 35°, is the uncorrected backscatter, Slopeopt is the optimal slope derived from the variance minimisation, θref is the reference incidence angle of 35°, and θmeas is the incidence angle of the observation. Examples of and time series are shown in Fig. 2.
3.3.3 Dynamic threshold and drainage event detection
Despite the incidence angle normalisation, residual noise remains in time series. This noise is primarily attributed to differences in SAR acquisition modes (e.g., Sentinel-1 IW vs. EW), variability across and between ScanSAR sub-swaths, and positional uncertainties. To quantify this residual variability, we used the same set of reference lakes described in Sect. 3.3.2. For each month across all 10 winters, we calculated all one-, two-, and three-observation cumulative increases in within the 20 reference lakes. These multi-step increments reflect scenarios in which up to three observations were made over a given lake within a ∼36 h period. The distribution of these short-term increases provides a statistical estimate of the remaining noise in the backscatter time series after normalisation.
From this distribution, we derived a dynamic detection threshold defined as four times the monthly median absolute deviation (MAD), selected through iterative testing of thresholds between 1 and 5 MAD to balance sensitivity and false detections from time-series noise, which we then applied to all lakes within the 10-year composite mask. An increase in exceeding this threshold was flagged as a potential drainage event. To reduce false positives, an additional filter was applied in which the maximum value within the 14 d preceding the potential drainage must be lower than the minimum value with the 14 d following it. This pre-post criterion excludes transient backscatter increases that result from noise, keeping only sustained step-like increases in . When the detection criteria were met over more than one candidate window length, we evaluated net increases in over one-, two-, and three-acquisition windows. We then selected the window that produced the largest net increase and set the start of the drainage window to the first acquisition in that window. The end of the drainage window was defined as the acquisition at which reached its maximum within the next three acquisitions following the start date.
Each candidate time series was manually reviewed to remove false positives, most of which were associated with increases during the freeze-up period (typically September to early October), with inspection of SAR and Landsat imagery used to support the removal. To facilitate analyses of annual and seasonal patterns, we assigned a single representative drainage date to each confirmed event, defined as the midpoint of the automatically-detected drainage window. In cases of suspected cascading drainage, where adjacent lakes appeared to drain in close temporal proximity, we further inspected the time series to refine the drainage timing. For these events, we selected the first observation at which exceeded the dynamic threshold. The drainage window was defined by this observation and the one immediately preceding it, providing a more precise estimate of the drainage onset.
3.4 Lake depth and volume estimates
We used ArcticDEM strips (Porter et al., 2022) to estimate the depth and volume of lakes prior to winter drainage. These DEM strips are derived from high-resolution optical image pairs using the Surface Extraction with Triangulated Irregular Network-based Search-space Minimization (SETSM), with a vertical uncertainty of 2.0 m, reduced to ∼0.2 m after co-registration (Noh and Howat, 2015).
When ArcticDEM strips were available both before and after a drainage within the same winter, we co-registered and differenced them, resulting in a vertical error of 0.28 m. However, such paired DEMs were rare due to sparse temporal coverage – most strips are acquired in late winter or early spring, after most lake drainages occur. For lakes with only post-drainage DEMs, we manually digitised shorelines using the latest available cloud-free Landsat imagery prior to polar night, where visible. We then extracted the mean elevation of the shoreline from the earliest post-drainage DEM as a proxy for the lake lid surface. Subtracting this from the DEM surface yielded lake depth, with an assumed vertical error of 0.2 m. Similar approaches have been used previously for estimating lake volume from high resolution DEMs (Pope et al., 2016; Yang et al., 2019; Maier et al., 2023). If no post-drainage DEM was available for a given winter, we used the next available strip from a subsequent year.
To isolate drainage-related subsidence, we differenced the ArcticDEM strips within the 10-year lake mask and retained only pixels with negative elevation changes. Airborne radar observations across the GrIS suggest typical ice lid thicknesses of ∼1.4 m and snow depths of ∼0.65 m (Koenig et al., 2015), while modelling studies estimate total ice lid and snow thicknesses of 0.8 to 2.5 m under normal winter conditions (Law et al., 2020). To account for this, we subtracted a uniform 1.4 m from all DEM-derived depths before calculating lake volumes and mean depths. For four lakes that drained during winter 2023/2024, no post-drainage DEMs were available for that or subsequent seasons, and thus we were unable to calculate volumes and mean depths for these lakes.
3.5 Modelling subglacial water pathways
Subglacial hydraulic potential gradients and associated flow routing were calculated to situate winter lake drainage observations within the framework of potential subglacial water pathways. (Shreve, 1972; Livingstone et al., 2013). Assuming subglacial water pressure equals the ice-overburden pressure (i.e., effective pressure N=0), the hydraulic potential (Φ) is defined as:
where ρw is water density, ρi is ice density, g is gravitational acceleration, zb is the bed elevation from BedMachine Version 5 (Morlighem et al., 2017; Morlighem, 2022), and z is the ice thickness. Because we are interested in routing pathways rather than the identification of subglacial lakes, all local sinks in the hydraulic potential surface are filled prior to flow modelling (Livingstone et al., 2013; Smith et al., 2017). Flow directions are then derived using the D8 algorithm (O'Callaghan and Mark, 1984), which routes flow downslope to one of eight neighbouring cells. The resulting flow direction grid is used to generate an upstream water accumulation map, indicating potential subglacial water pathways beneath the ice sheet.
3.6 Auxiliary data
Daily C-band normalised radar backscatter (σ0) data from the Advanced Scatterometer (ASCAT) aboard the European Space Agency's MetOp-B satellite were used to characterise the intensity and spatial extent of surface melt during each melt season across the 79NG and ZI basins. Here, surface melt refers to the presence of near-surface liquid water expressed as wet snow or a wetted ice surface across the broader glacier surface, rather than meltwater ponding within supraglacial lakes. We used a threshold of −3.0 dB below/above the previous winter mean backscatter to define the presence/absence of melt, consistent with methods developed for C-band radar operating at 5.3 GHz (Ashcraft and Long, 2005). Grid cells were classified as experiencing melt on days when σ0 dropped below this threshold, which indicates the presence of wet snow relative to dry snow conditions.
This analysis was conducted for the 2014 to 2022 melt seasons; 2023 data were unavailable at the time of analysis. Winter backscatter means were calculated from data spanning 1 January to 31 March, while melt seasons were defined as 1 June to 31 August. The resulting daily binary melt/no melt maps were used to compute two metrics for each summer: (1) melt intensity for each grid cell, defined as the number of melt days; and (2) melt extent, defined as the total area experiencing melt on a given date. A time series of melt extent across the entire study area was created each summer. To enable comparison of melt intensity and extent between the years, we also calculated an annual melt index, defined as the sum of melt intensity of each grid cell in the study area.
To investigate possible dynamic effects of winter lake drainages on ice flow, we analysed monthly ice velocity data (MEaSUREs Version 5; Joughin, 2023) from June 2015 to May 2024 along transects extending from near the termini to the upstream regions of both 79NG and ZI (Fig. 1b). For higher temporal resolution around suspected cascading lake drainage events, we selected the 6 and 12 d velocity ice velocity field (MEaSUREs Version 2; Joughin, 2022) that temporally overlaps with each cascade and calculated velocity anomalies relative to a baseline defined as the mean monthly MEaSUREs velocity over the preceding 12 months, beginning with the month immediately prior to the cascade. We note that vertical surface displacement associated with lake drainage may influence these velocity estimates. Because SAR offset tracking does not independently resolve vertical and horizontal motion, such vertical signals can appear as apparent changes in the reported horizontal velocities (Joughin et al., 2016a).
4.1 Winter supraglacial lake drainage at Nioghalvfjerdsbræ and Zachariæ Isstrøm
Between the 2014/2015 and 2023/2024 winter seasons, a total of 90 winter lake drainage events were detected across 55 individual lakes in the 79NG (48 events) and ZI (42 events) basins (Fig. 3). Drained lakes ranged in elevation from a minimum of 88 m to a maximum of 1046 m, with a mean of 485 m. Notably, only one drainage event was observed above 1000 m, despite 140 of the 404 lakes identified in the 10-year optical melt-season lake mask occurring above this elevation, and prior reports documenting lakes up to 1500 m in this region (Schröder et al., 2020; Hochreuther et al., 2021; Lu et al., 2021) (Fig. 3).
Among the 55 draining lakes, 34 drained once over the ten winters, 12 drained twice, six drained three times, two drained four times, and one lake drained six times. The highest number of drainage events in a single winter was 18, recorded during 2018/2019. In contrast, the fewest events – only four – occurred during both the 2020/2021 and 2021/2022 seasons (Fig. 4a). An increasing trend in drainage frequency is evident leading up to the 2018/2019 season, followed by a marked decline thereafter (Fig. 4a).
Drainage events were most frequent in September, accounting for approximately one-third of the total () (Fig. 4b). October and November had the second- and third-highest counts, respectively. While drainage frequency generally declined between September and February, a notable resurgence occurred in March and April, with eight and nine events respectively. Seven of the nine April events were linked to a single cascading drainage episode during the 2018/2019 season (see Sect. 4.4). Overall, drainage activity tended to decrease as each winter progressed, with drainages picking up again in late winter.
The three winters with the highest number of drainages – 2016/2017 through 2018/2019 – exhibit distinct temporal patterns in drainage timing (Fig. 4c). In 2016/2017, all drainages occurred by mid-January, the approximate midpoint of winter. In that year, there was a cluster of drainages in September followed by longer intervals between subsequent drainages. In contrast, drainages during the 2017/2018 season were more evenly distributed throughout the winter months. The 2018/2019 season featured drainages in both early and late winter, but these were more temporally clustered compared to 2017/2018. In the three winters that followed – 2019/2020 through 2021/2022 – drainage activity was markedly reduced. In both the 2020/2021 and 2021/2022 seasons, all drainages occurred prior to mid-December, indicating a shift toward earlier and fewer winter drainages during these years (Fig. 4c).
Although most draining lakes drained just once per winter, there were three cases where individual lakes drained twice within the same season – one each during 2014/2015, 2017/2018, and 2019/2020. All three lakes were located at low elevations (<150 m), with two situated near the grounding line of 79NG and one near the grounding line of ZI. In each case, the second drainage occurred at least three months after the first, with initial events taking place before December and subsequent drainages occurring after the start of February.
Using timestamped ArcticDEM strips, we estimated the volumes and mean depths of 87 of the 90 observed winter lake drainages (Fig. 5). Data were unavailable for the three events that occurred during the 2023/2024 season. Across the 87 lakes, the mean depth was 4.10 m. The vast majority (85 of 87) had estimated volumes below ∼0.02 km3. Two outliers, with drainage volumes of 0.052±0.0096 and 0.038±0.0008 km3, were attributed to two separate drainages of the same lake, located at an elevation of 259 m near the ZI grounding line (highlighted in Fig. 3). Excluding these two outliers, the mean lake drainage volume was km3.
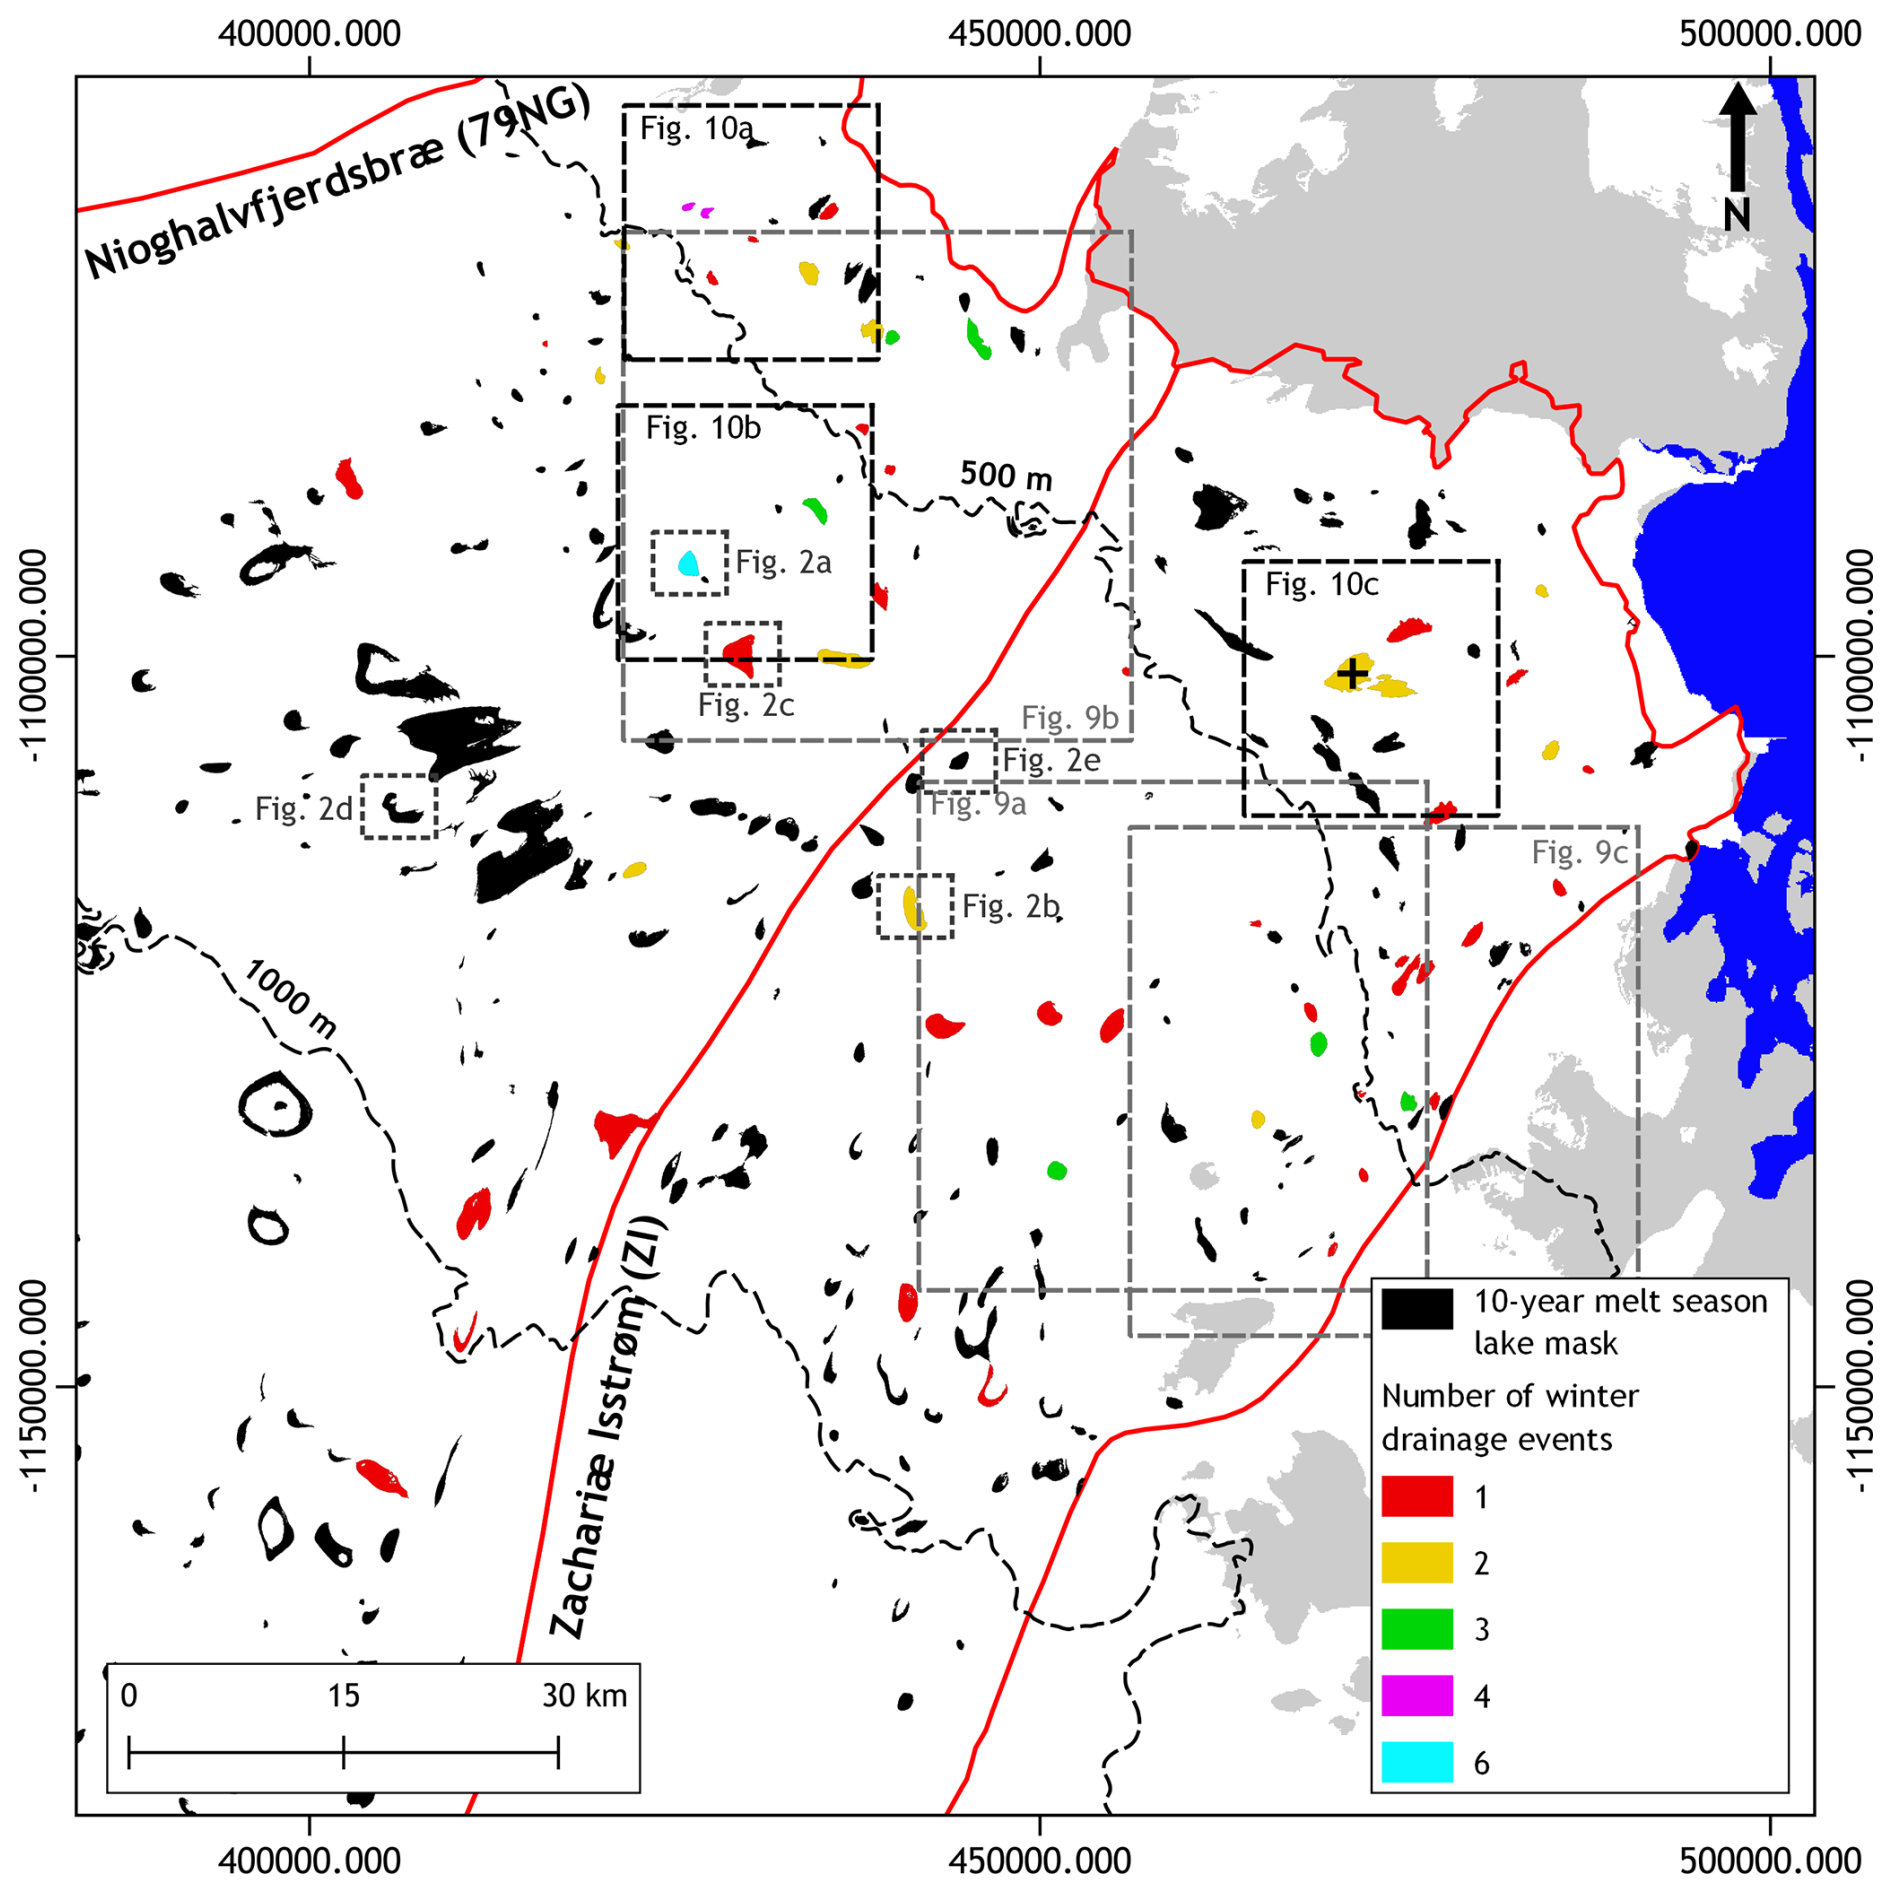
Figure 3Supraglacial lake locations from the 10-year melt season lake mask, alongside the locations and frequencies of winter drainage events observed between the 2014/2015 and 2023/2024 winter seasons. A black “+” marks a lake near the Zachariæ Isstrøm grounding line that produced two exceptionally large drainage volumes (0.052 and 0.038 km3). Dashed rectangles indicate the subregions shown in detail in Figs. 2, 9 and 10. Grey shading indicates land areas, and blue represents the ocean, based on the GIMP land-ice-ocean classification dataset (Howat, 2017).
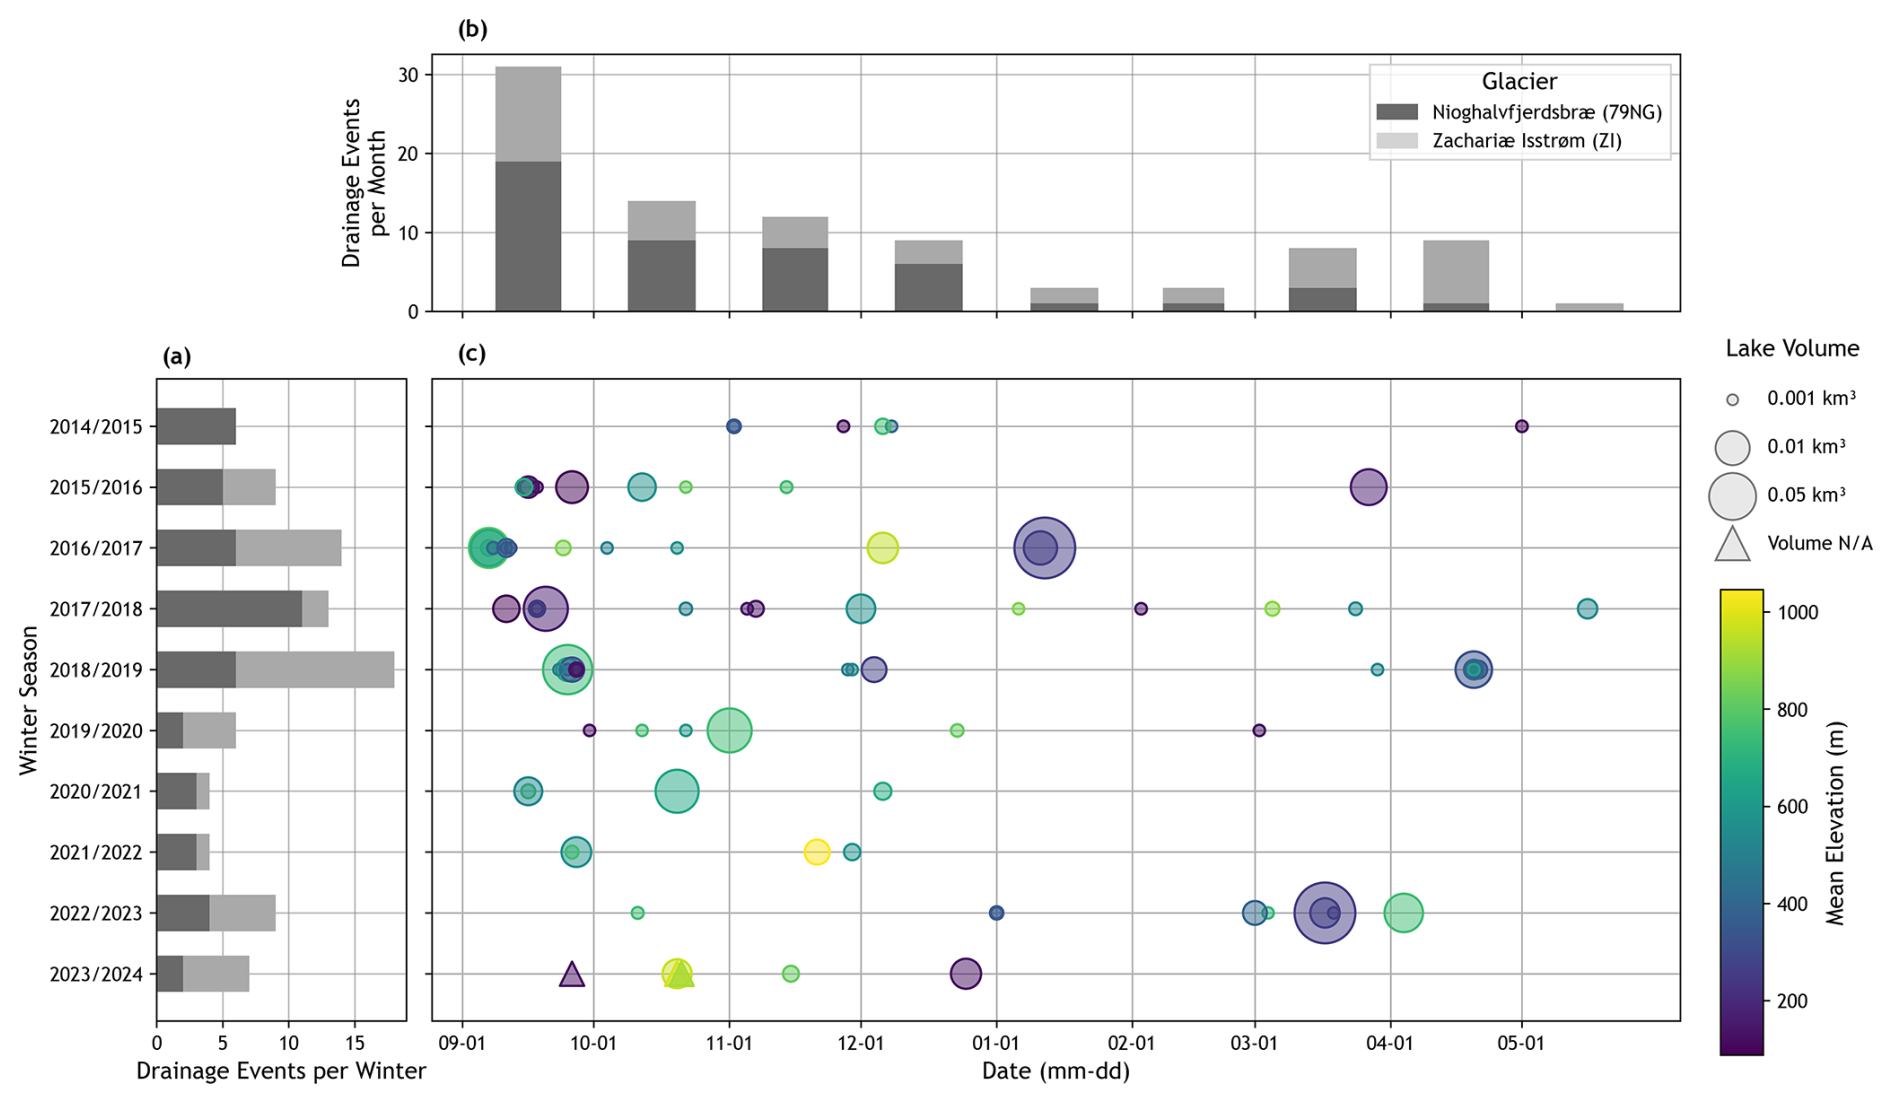
Figure 4Temporal patterns of winter lake drainage events over ten seasons (2014/15–2023/24). (a) Total number of drainages per winter. (b) Monthly distribution of drainage events from September to May, aggregated across all winters. (c) Timing, mean elevation and estimated volume of each drainage event, shown for each winter season. In (a) and (b), drainages from Nioghalvfjerdsbræ (79NG) and Zachariæ Isstrøm (ZI) are distinguished using dark grey and light grey bars respectively.
4.2 ASCAT melt season variability
The nine melt seasons preceding the 2014/2015 to 2022/2023 winters exhibited considerable variability in melt intensity (Fig. A1), melt extent (Figs. 6a, A2), and melt index (Fig. 6b). From 2015 to 2018, the melt index declined markedly from 1.88×10⁶ to 4.61×10⁵ km2 d (Fig. 6b), driven by concurrent decreases in both average melt intensity and melt extent (Figs. A1 and A2). This trend reversed in 2019 and 2020, with melt indices rising to 1.33×10⁶ and 1.41×10⁶ km2 d respectively. Notably, the winters of 2017/2018 and 2018/2019, which were among those with the highest number of lake drainages – 13 and 18 respectively (Fig. 4a) – were preceded by melt seasons with the two lowest melt indices (Fig. 6b). Conversely, the 2019/2020 and 2020/2021 winters, during which just six and four drainages occurred respectively (Fig. 4a), were preceded by summers with high melt intensities and extents (Fig. 6a). A closer comparison of the 2017 to 2020 melt extent time series shows that melt extent was typically lower in 2017 and 2018 than in 2019 and 2020 (Fig. 6a). The 2019 and 2020 time series also show both greater peak melt extents and more prolonged periods with melt extents exceeding 20 000 km2.
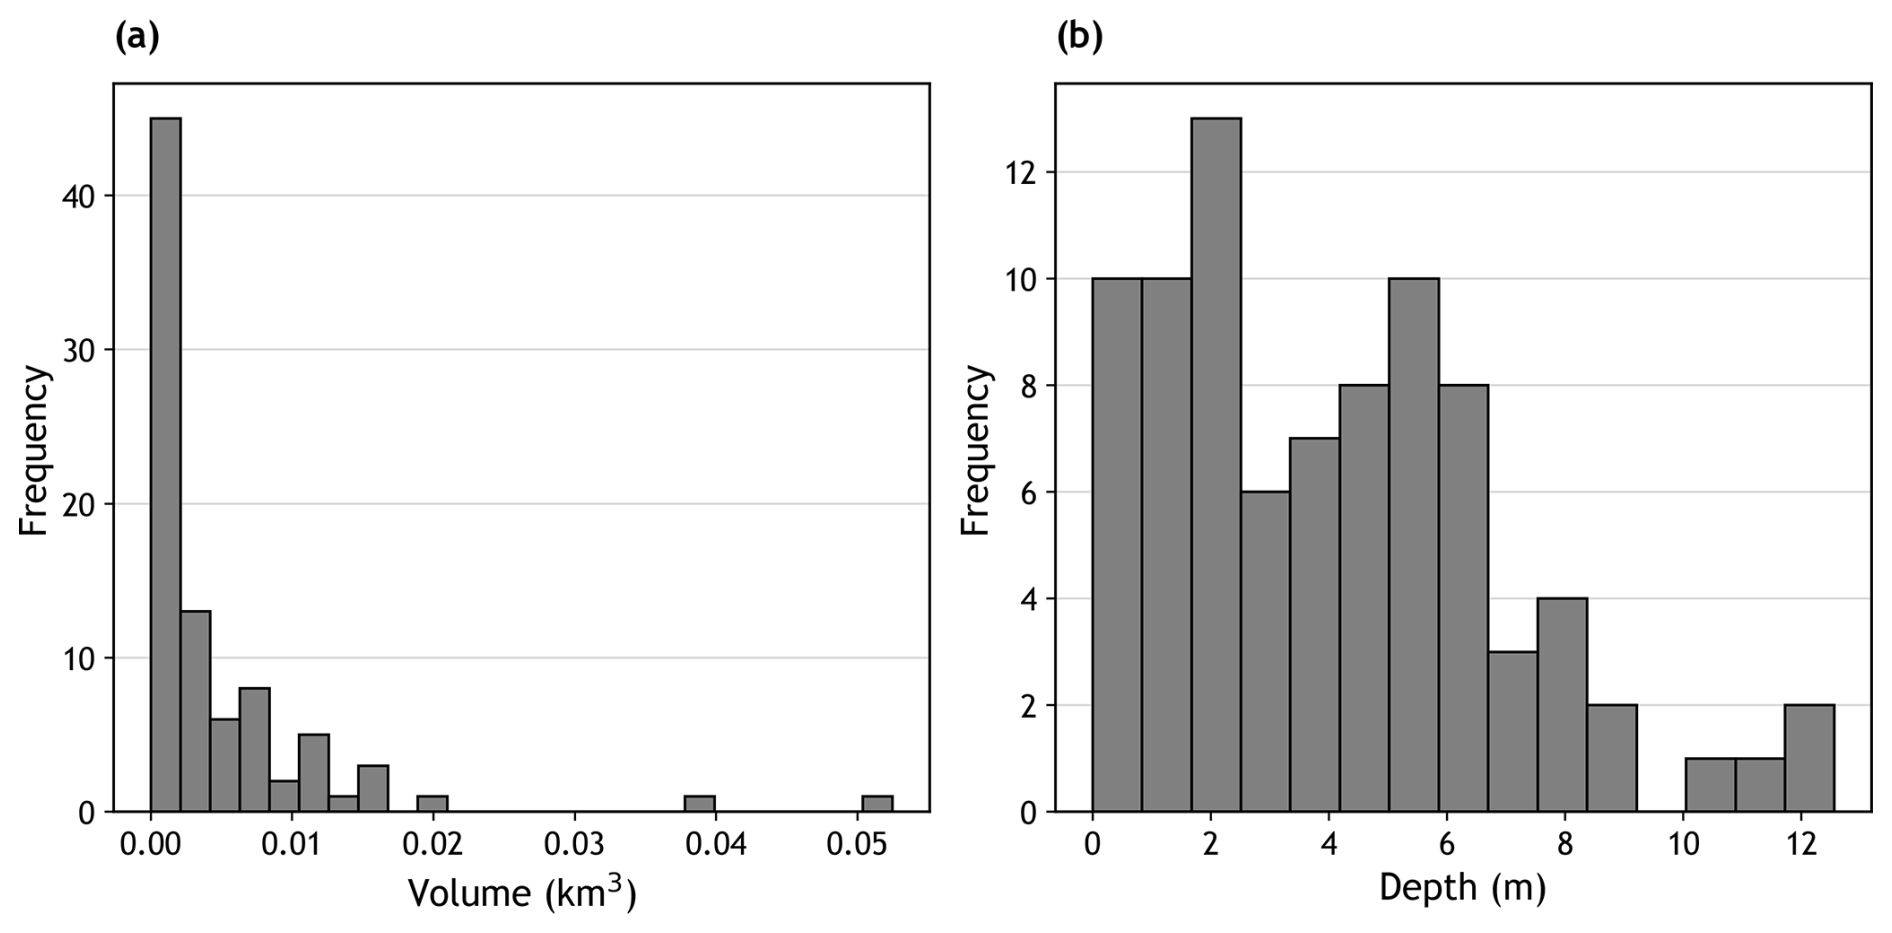
Figure 5Histograms showing geometric characteristics of winter-draining lakes. (a) Distribution of estimated lake volumes. (b) Distribution of mean lake depths. Both metrics are derived from ArcticDEM timestamped strips for 87 winter-draining lakes.
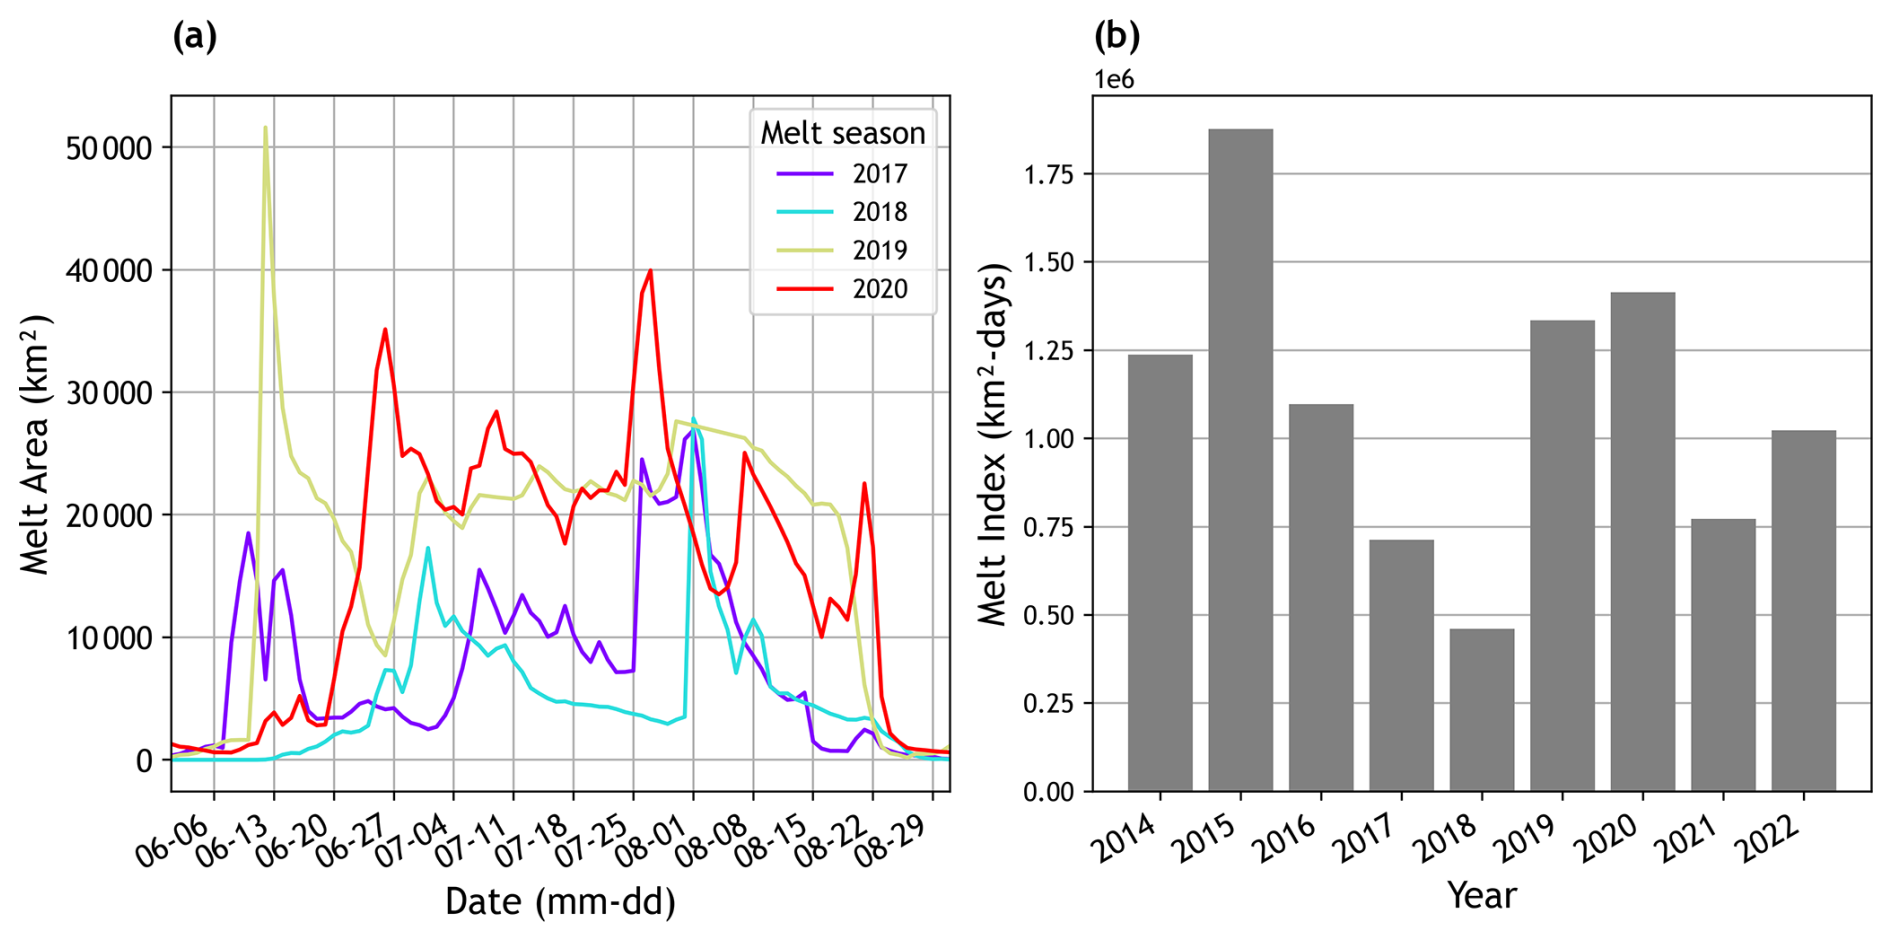
Figure 6(a) Daily melt extent time series from 1 June to 31 August for the 2017–2020 melt seasons, derived from ASCAT data. (b) Seasonal melt index from 2014 to 2022, calculated as the cumulative daily melt area during each summer melt season (June–August) based on ASCAT-derived surface melt extents.
4.3 Comparison of winter and summer supraglacial lake drainage occurrence
To compare rapid lake drainages between winter and summer, we subset our dataset to include just the seven winter seasons from 2016/2017 to 2022/2023 and their preceding melt seasons (June to August 2016 to 2022), for which summer drainage data over Northeast Greenland are available from Lutz et al. (2024) (Fig. 7, Appendix A3). During this period, 306 summer and 68 winter drainage events were recorded, yielding a summer-to-winter drainage ratio of approximately 4.5:1. These involved 129 unique lakes in summer and 42 in winter, corresponding to a summer-to-winter lake ratio of just over 3:1. On average, summer-draining lakes occurred at slightly lower elevations (458 m) than winter draining lakes (515 m) (Fig. 7).
The ratio of summer to winter drainages varied significantly across the years from in 2018/2019 to ∼ 11.5:1 in 2019/2020. The 2018 melt season was notably cool, with a low melt index (Fig. 6b) and the fewest drainages (25) of any melt season. The subsequent 2018/2019 winter had the greatest number of drainages (18) of any winter. In contrast, the 2019 melt season was unusually warm, with a relatively high melt index (Fig. 6b), high melt intensities extending to higher elevations (∼1500 m) than in other years (Fig. A2), and the greatest number of summer drainages (71). The subsequent 2019/2020 winter had just six drainages. From 2016 to 2018, the number of summer drainage events declined, while winter drainage counts remained relatively stable (Fig. 7a). After 2018, this pattern reversed: summer drainages increased, while winter drainages became less frequent.
Although many lakes exhibited repeated rapid drainage across multiple melt seasons (Lutz et al., 2025), and several showed recurring winter drainages in our study, drainage of the same lake in both a melt season and the subsequent winter was exceptionally rare. Only two such cases were identified: one during the 2016/2017 winter and another in 2018/2019. Similarly, most lakes that drained in winter did not drain again in the subsequent summer, with only 13 such instances observed: once in 2016/2017, 2018/2019, and 2020/2021; twice in 2019/2020 and 2021/2022; and six times in 2018/2019.
Several lakes exhibited drainage across multiple summer and winter seasons, displaying a range of behaviours. The most common pattern, observed in 39 lakes, involved a single drainage during one melt season with no winter drainage (Fig. 7b). Another 21 lakes drained once during winter and between zero and three times during separate melt seasons across the seven-year period. Only six lakes drained repeatedly across multiple summer and winter seasons (two or three drainage events in each). Two lakes drained a total of six times – across four winters and two summers (Fig. 7b).
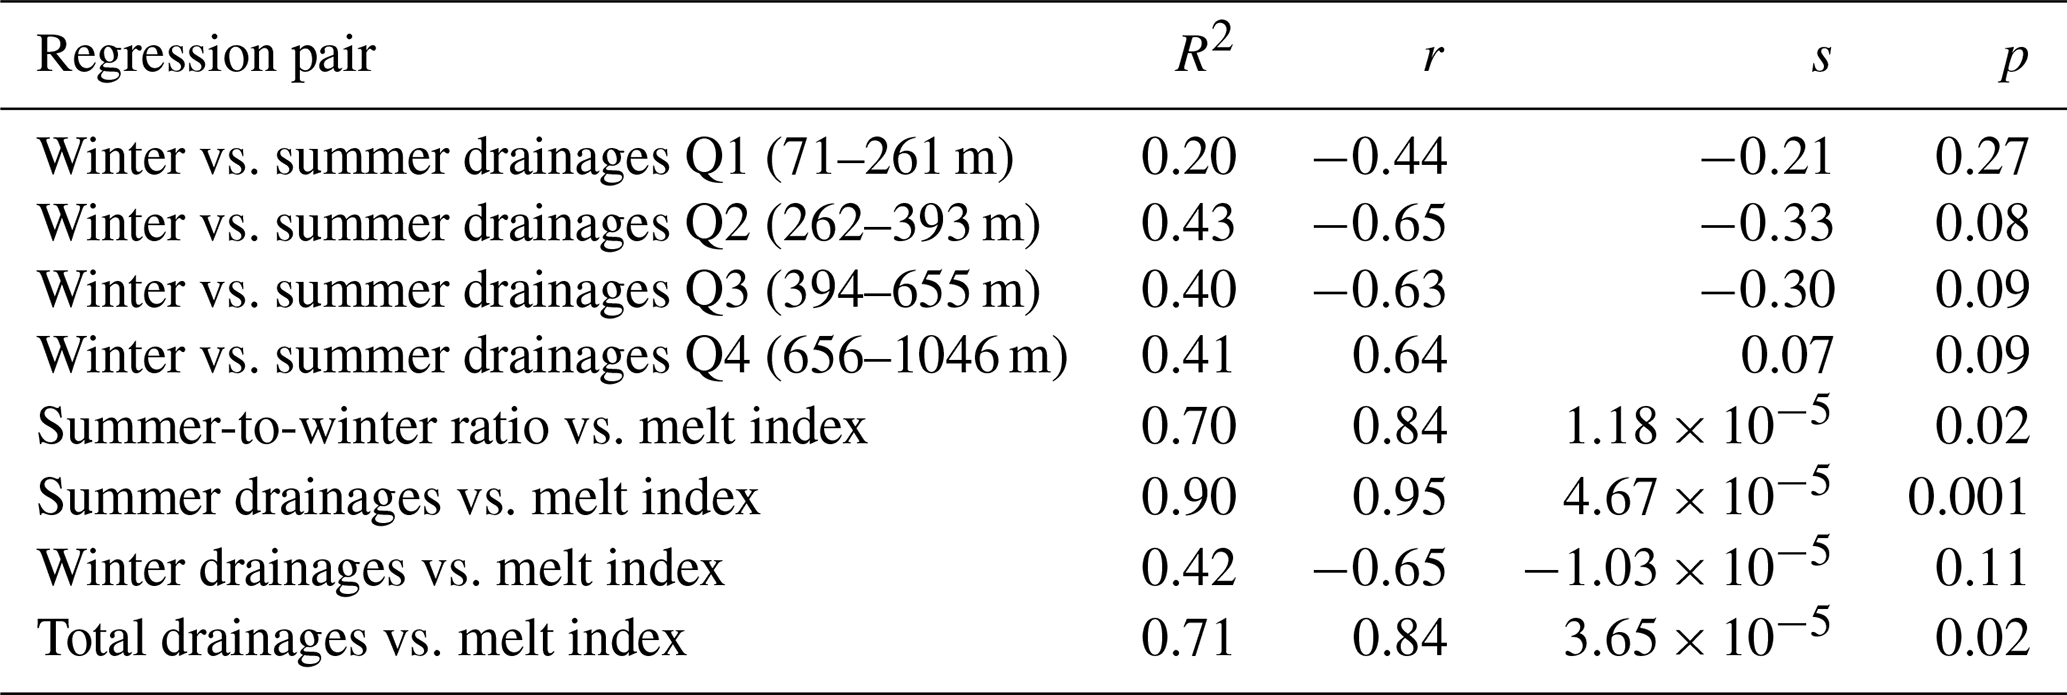
To investigate relationships between winter drainage frequency, summer drainage frequency, and surface melt intensity/extent (as represented by the ASCAT melt index), we conducted a least-squares regression analysis (Fig. 8). The analysis spans seven summer–winter season pairs (df = 6), with each winter paired to the preceding summer. We report the correlation coefficient (r), coefficient of determination (R2), and slope (s), and consider p≤0.1 as the threshold for statistical significance due to the small sample size. Results are summarised in Table 2. Across the 25th, 50th, and 75th elevation quartiles, the number of winter drainages was negatively correlated with the number of preceding summer drainages (Fig. 8a), although this correlation was not statistically significant for the lowest quartile (p=0.27). In contrast, high-elevation lakes in the fourth quartile exhibited a significant positive correlation (p=0.085).
The summer-to-winter drainage ratio was significantly negatively correlated with the melt index (, p=0.02) (Fig. 8b), indicating that as summer melt intensity and/or extent increases, the proportion of lake drainages occurring in winter decreases. Both the number of summer drainages and the total number of annual drainages were significantly positively correlated with the melt index (p=0.001 and p=0.02, respectively) (Fig. 8c). In contrast, the number of winter drainages was negatively correlated with the melt index, although this trend was not statistically significant (p=0.11) (Fig. 8c).
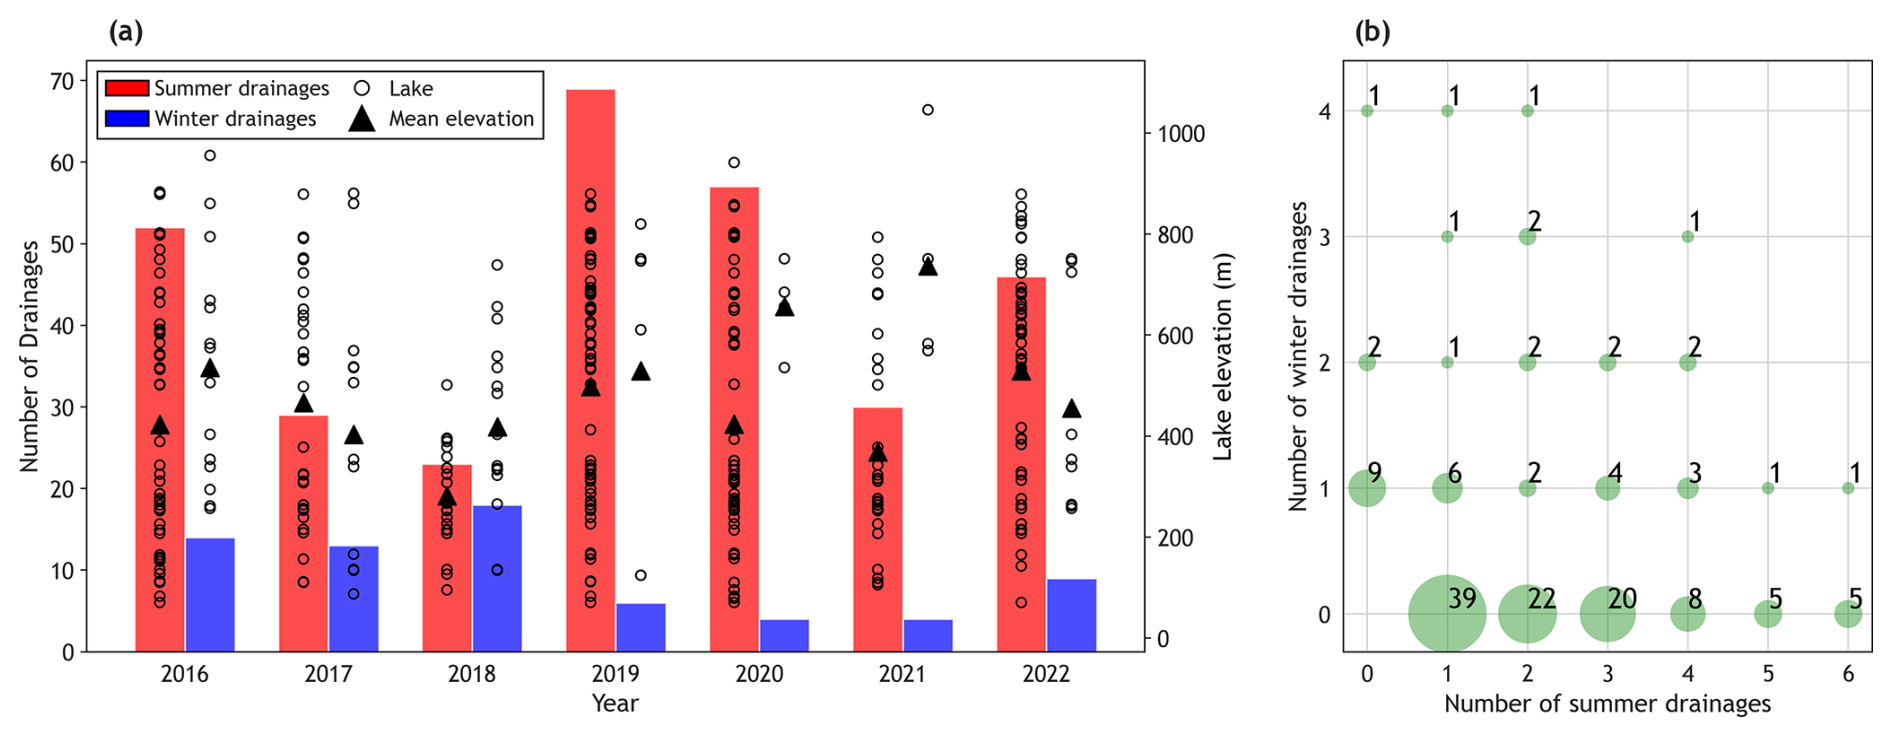
Figure 7(a) Number of rapid lake drainages during the melt season (June–August; red bars) and subsequent winter (September–May; blue bars) from 2016/17 to 2022/23. Melt season drainage data are from Lutz et al. (2025). Hollow circles indicate the elevation of individual draining lakes each season of each year, while triangles represent the mean elevation. (b) Relationship between melt season and winter drainage frequencies for individual lakes over all seven years. Green circle size represents the number of lakes sharing a specific combination of summer and winter drainage counts; numbers within circles indicate lake count.
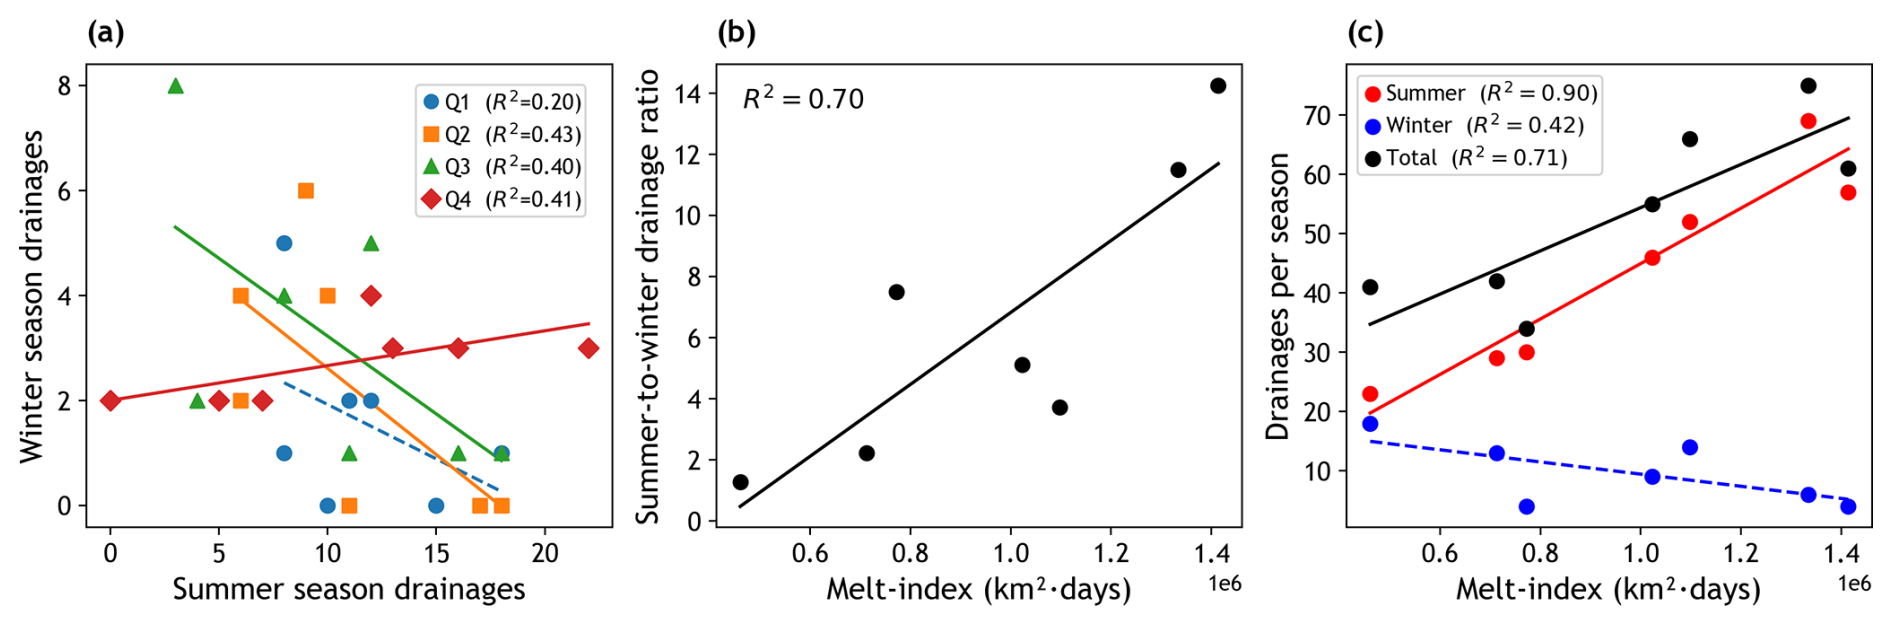
Figure 8Linear regression plots showing relationships between lake drainage metrics and the summer melt index for years 2016/2017 to 2022/2023. Solid lines indicate statistically significant correlations (p≤0.1); dashed lines denote non-significant trends. (a) Number of winter drainages (September–May) versus number of drainages in the preceding summer (June–August), grouped by lake elevation quartiles. (b) Ratio of summer to winter drainages versus melt index. (c) Number of winter, summer, and total annual drainages (combined winter and preceding summer) versus melt index.
Table 2Linear regression results corresponding to drainage frequency and melt index relationships shown in Fig. 8. Regressions are based on seven paired seasons (df = 6), where each winter season (September–May) is paired with the preceding summer (June–August). Reporting statistics include the coefficient of determination (R2), Pearson's correlation coefficient (r), slope (s), and p value. Rows 1–4 show statistics for winter versus summer drainages by elevation quartile (Q1–Q4). Subsequent rows show statistics for the summer to winter drainage ratio versus melt index, summer drainages versus melt index, winter drainages versus melt index, and total annual drainages (winter plus preceding summer) versus melt index.
4.4 Cascading winter drainage events
We analysed the timing and proximity of neighbouring lake drainages alongside the maps of subglacial hydraulic potential and water pathways to identify lakes that may have been triggered by neighbouring events via either stress coupling through the ice or hydrologic coupling along the subglacial drainage pathway. Following Christoffersen et al. (2018), we refer to these as cascading drainage events. Our analysis reveals that 46 of the 90 lake drainages observed over the ten winter seasons may have been part of such cascades. Of these, 18 drainages occurred across three major events involving five to seven lakes each, with the furthest lakes separated by ∼25–33 km. The remaining 28 drainages were part of 12 smaller clusters, each involving two to three lakes in close proximity (<10 km). Thus, large cluster cascade events were less common than events involving small clusters. Below we describe the three large cluster events followed by three examples of smaller-scale clusters.
4.4.1 Large cluster cascade events
Event 1: ZI, Winter 2015/2016. Between 5 September 08:43 and 6 September 17:32, five lakes drained on ZI (Fig. 9a). The total separation between L1A and L1E was ∼33 km. All five lakes were connected via a modelled subglacial water pathway. All lakes except L1C were located along the main subglacial pathway, whereas L1C was positioned above a branching tributary upstream from the main pathway. Nearby lakes at similar distances but lacking hydrologic connections did not drain. Lake elevations ranged from ∼795 m (L1A) to ∼400 m (L1E). Inter-lake distances were:
-
L1A–L1B: 8 km
-
L1B–L1C: 4.8 km
-
L1C–L1D: 12 km
-
L1D–L1E: 10.5 km
Event 2: 79NG, Winter 2018/2019. All lakes were connected along a modelled main subglacial water pathway, except for L2D, which was located between two main pathways. Between 23 September, 08:58 and 27 September, 08:26, six lakes drained on 79NG (Fig. 9b):
-
L2A and L2B (∼740–660 m a.s.l.) drained within ∼36 h and were 4.5 km apart.
-
L2C and L2D (∼410–330 m a.s.l.) drained ∼14 km downstream within the next 15 h.
-
L2E and L2F (∼130 m a.s.l.) drained ∼6 km further downstream over the following 48 h.
Event 3: ZI, Winter 2018/2019. Between 17 and 20 April, seven lakes connected via a modelled main subglacial pathway drained on ZI (Fig. 9c):
-
L3A and L3B (∼400 m a.s.l., ∼1 km apart) drained between 17 April, 18:29 and 19 April, 08:26.
-
L3C–L3F (∼330 m a.s.l., ∼7 km downstream) drained within a 10 h window.
-
L3G (∼630 m a.s.l.), located ∼12 km upstream of L3A/B and ∼19 km upstream of L3C–F, drained between 19 April, 18:12 and 20 April, 08:18.
4.4.2 Small cluster cascade events
Event 4: 79NG, Winter 2017/2018. Between 16 and 18 September, lakes L4A and L4B (∼350 m a.s.l., ∼1 km apart) drained within ∼48 h (Fig. 10a). On 19 September, L4C (∼166 m a.s.l.), ∼8 km downstream, drained within ∼24 h. L4B and L4A lie along a modelled main subglacial pathway that is separate from, but connected downstream to, the pathway underlying L4C.
Event 5: 79NG, Winter 2021/2022. Between 24 and 26 September, lakes L5A (∼751 m a.s.l.) and L5B (∼569 m a.s.l.), ∼10 km apart, drained within ∼48 h (Fig. 10b). This represents the largest separation observed among small-cluster cascade events. Both lakes are connected via a modelled subglacial pathway.
Event 6: ZI, Winter 2022/2023. Between 15 and 17 March, three lakes (L6A–L6C) at ∼260 m elevation drained within a ∼24 h period (Fig. 10c). The three lakes are located in close proximity to a tributary subglacial water pathway.
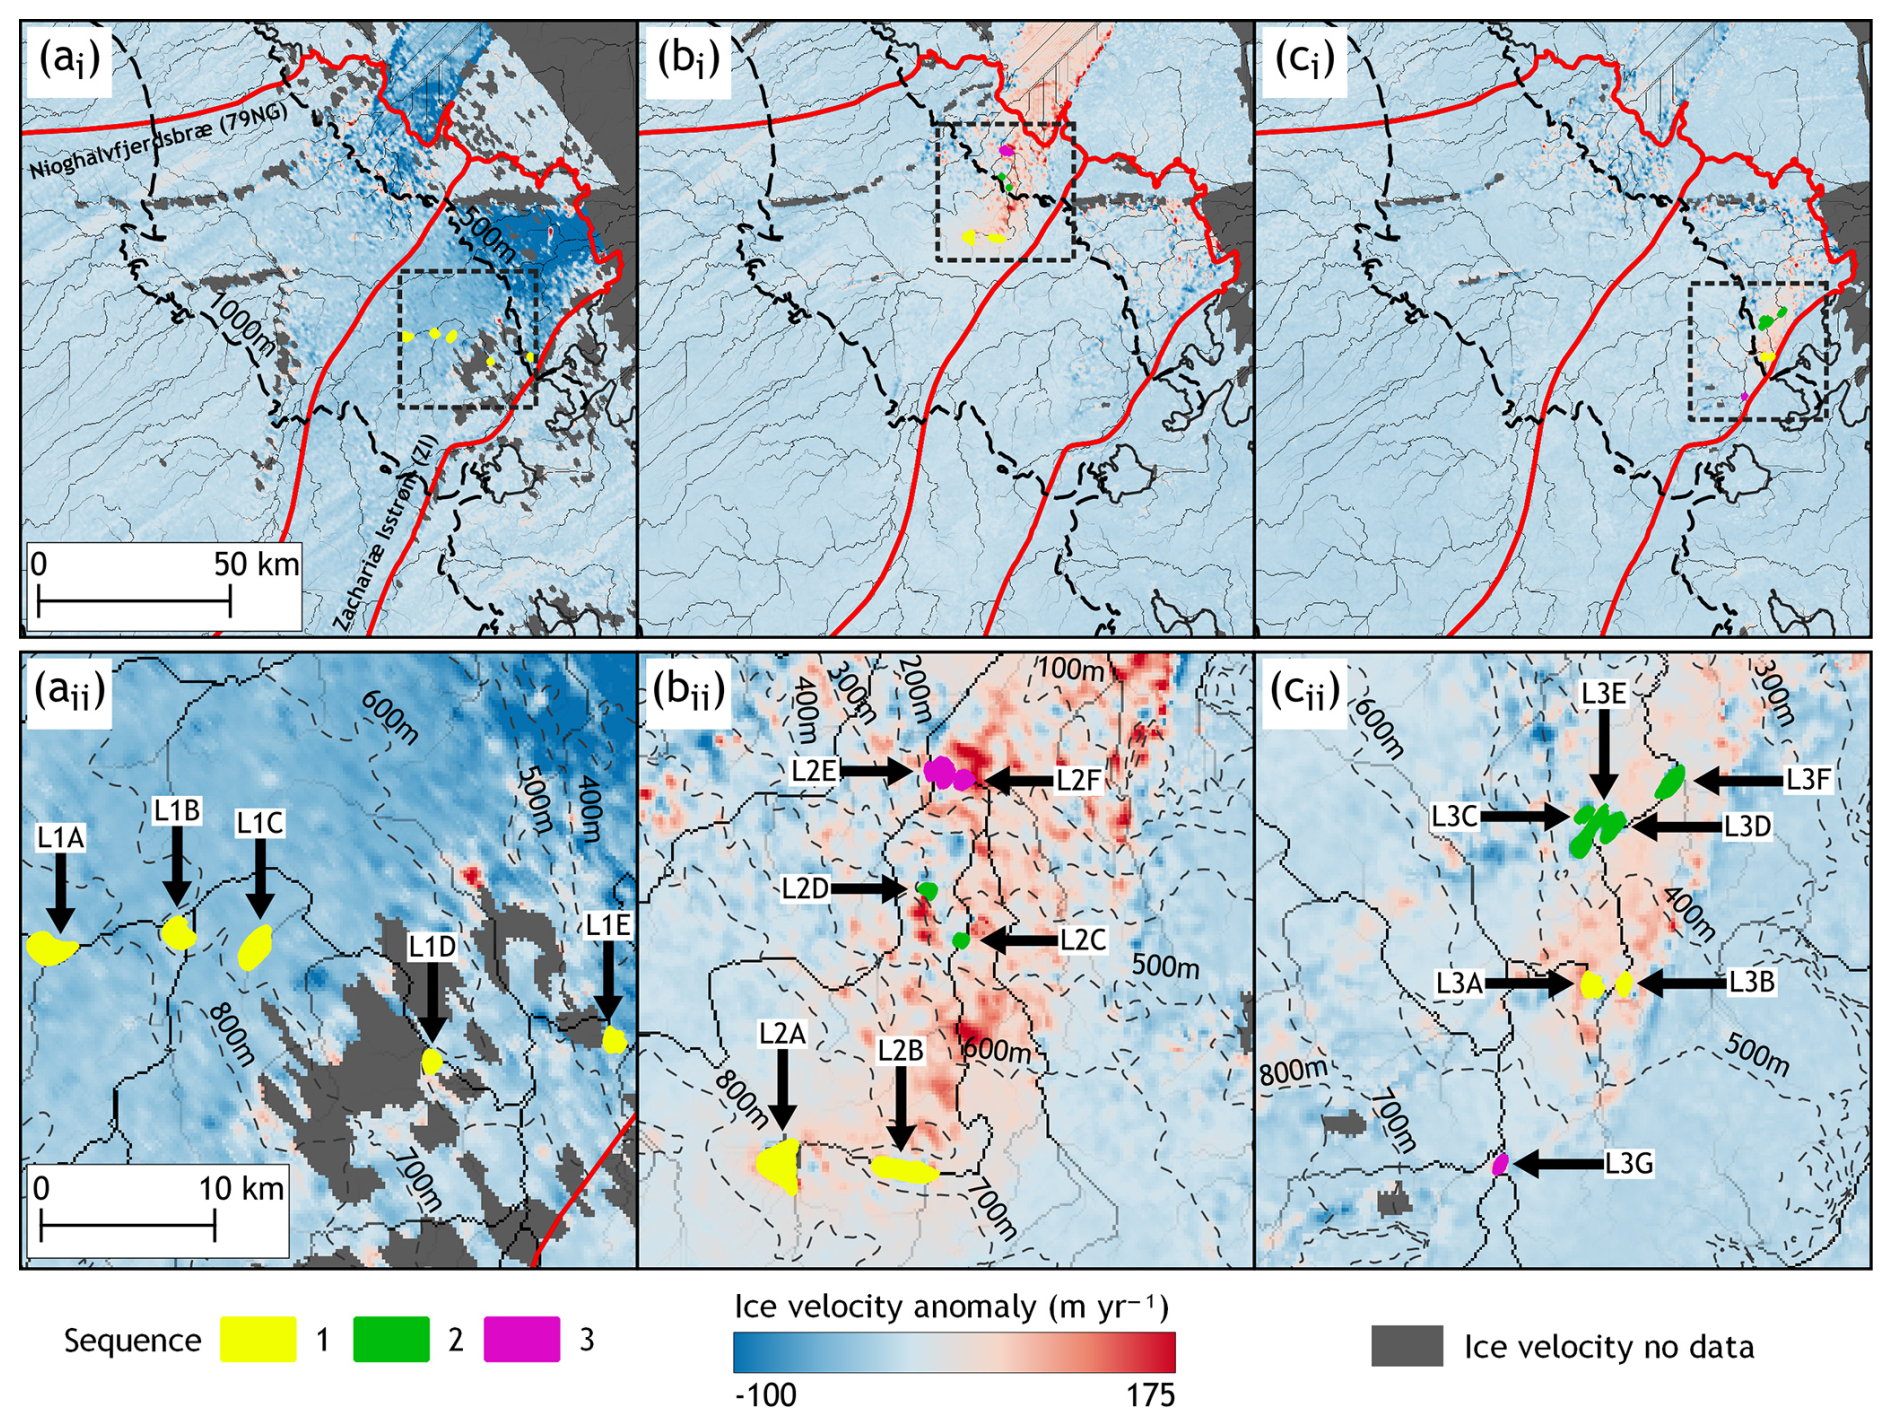
Figure 9Surface ice velocity anomaly maps for the three “large-cluster” cascading drainage events involving five to seven lakes. For each event, panels (i) show the study-area context, and panels (ii) show an enlarged view of the lake cluster. Panels (a)–(c) show the spatial distribution and drainage sequence of the cascades: (a) L1A–L1E, occurring between 5 September 2015 (08:43) and 6 September 2015 (17:32); (b) L2A–L2F, occurring between 23 September 2018 (08:58) and 27 September 2018; and (c) L3A–L3G, occurring between 17 April 2019 (18:29) and 20 April 2019 (08:18). Drainage order is colour-coded from yellow (first), green (second), and purple (last). Drained lake polygons are overlaid on ice velocity anomaly fields, with modelled subglacial water pathways shown as lines shaded from grey to black, indicating increasing upstream area accumulation of hydraulic potential. Velocity anomalies were calculated by subtracting the mean monthly MEaSUREs velocity over the preceding 12 months (beginning with the month immediately prior to the cascade) from the 6 or 12 d MEaSUREs velocity field corresponding to the event. The 6 or 12 d MEaSUREs velocity fields used to compute the anomalies span 29 August–9 September 2015 (Fig. 9a), 18–23 September 2018 (Fig. 9b), and 16–21 April 2019 (Fig. 9c).
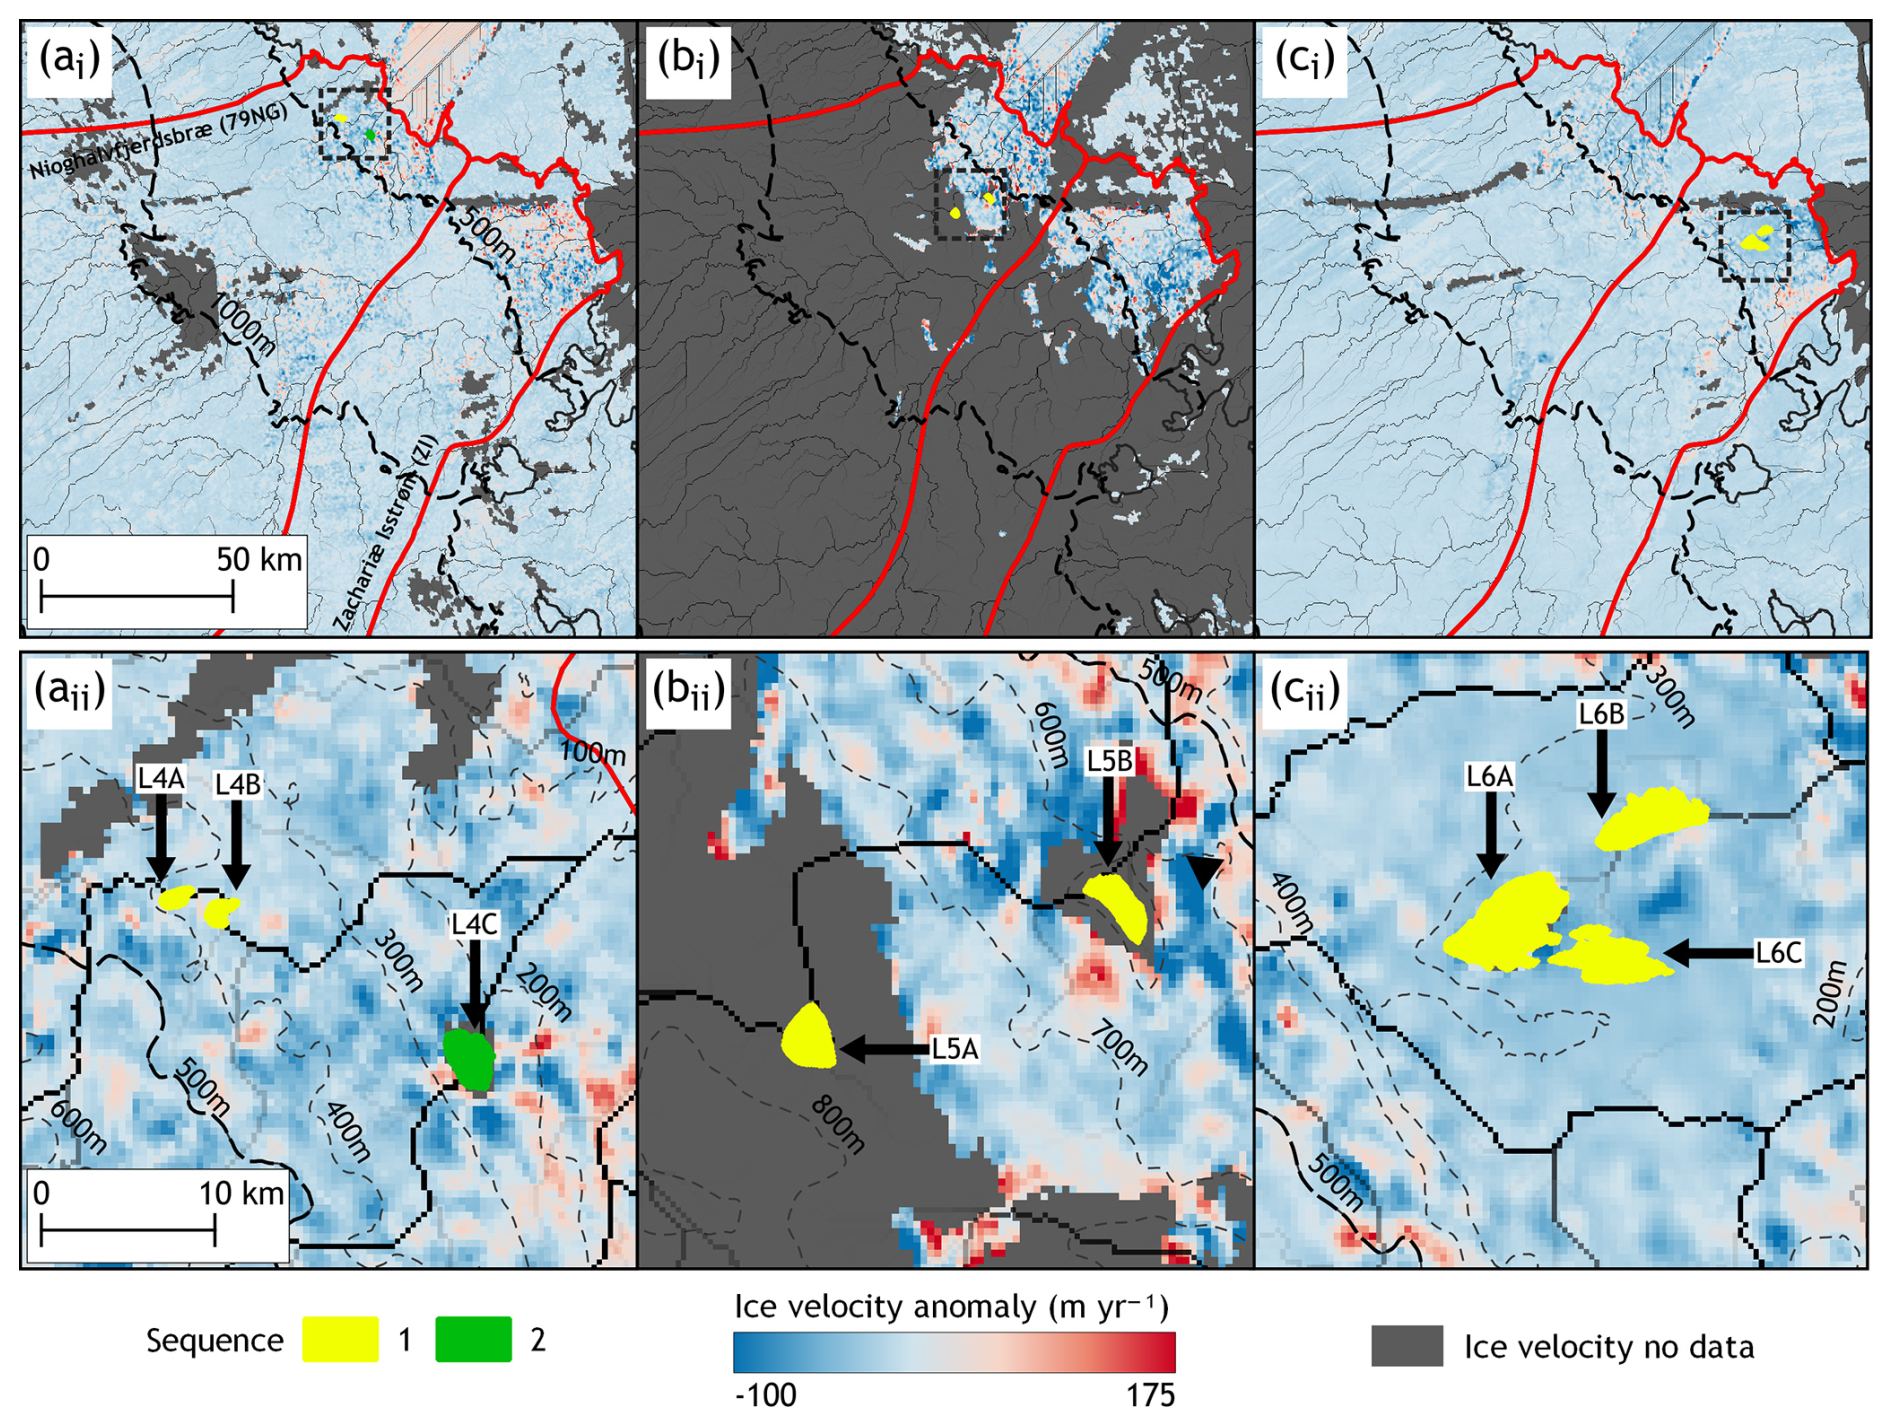
Figure 10Surface ice velocity anomaly maps for the three cascading drainage events involving two to three lakes. For each event, panels (i) show the study-area context, and panels (ii) show an enlarged view of the lake cluster. Panels (a)–(c) show the spatial distribution and drainage sequence of the cascades: (a) L4A–L4C, occurring between 16 September 2017 (08:58) and 18 September 2017 (08:42); (b) L5A–L5B, occurring between 24 September 2021 (18:05) and 26 September 2021 (17:49); and (c) L6A–L6C, occurring between 15 March 2023 (17:41) and 17 March 2023 (17:31). Drainage order is colour-coded from yellow (first) to green (last). Drained lake polygons are overlaid on ice velocity anomaly fields, with modelled subglacial water pathways derived from hydraulic potential shown as lines shaded from grey to black, indicating increasing upstream area accumulation of hydraulic potential. Velocity anomalies were calculated by subtracting the mean monthly MEaSUREs velocity over the preceding 12 months (beginning with the month immediately prior to the cascade) from the 6 or 12 d MEaSUREs velocity field corresponding to the event. The 6 or 12 d MEaSUREs velocity fields used to compute the anomalies span 17–22 September 2017 (Fig. 10a), 20–25 September 2021 (Fig. 10b), and 14–25 March 2023 (Fig. 10c).
4.5 Ice velocities
Monthly ice velocity time series from 2015 to 2024 for transects along 79NG and ZI are shown in Fig. 11. Near-grounding line velocities are higher at ZI, ranging from ∼1600 to 2200 m yr−1 at ∼5 km inland, and from ∼1200 to 1600 m yr−1 at ∼10 km. In contrast, velocities at 79NG are slower, ranging from ∼1000 to 1250 m yr−1 at both 5 and 10 km from the grounding line. At ZI, seasonal velocity variations are pronounced. Velocities typically peak in July, then decrease sharply through to September or October, often dropping to pre-melt season values to reach the annual minimum. Velocities then increase gradually throughout the winter. An exception to this pattern occurred during the anomalously cool 2018 melt season, when the late-summer slowdown was minimal and winter velocities remained relatively constant. At 79NG, seasonal velocity cycles are more subdued compared to ZI, showing weaker summer peaks and less pronounced winter acceleration.
Throughout the study period, 79NG and ZI exhibited distinct interannual velocity trends. ZI showed a general increase in velocities, particularly towards the grounding line, while velocities at 79NG remained relatively stable. At the monthly scale, no obvious increases in ice velocity were observed that could be attributed to winter drainage events. For both glaciers, winters with the highest number of drainages (2016/2017 and 2018/2019) showed velocity patterns comparable to other winters, including those with few drainage events (2019/2020 to 2021/2022) (Figs. 4a and 11).
The 6 and 12 d SAR-derived MEaSUREs velocities were used to calculate ice velocity anomalies relative to a 12-month baseline for both large cluster cascades (involving five to seven lakes; Events 1–3; Fig. 9a to c) and smaller cluster events (of two or three lakes; Events 4–6; Fig. 10a to c), as outlined in Sect. 4.4. During Event 1 (5 September, 08:43 to 6 September, 17:32, 2015), no velocity changes associated with the event were detected, although this may be due to the large data gaps (Fig. 9a). Event 2 (23 September, 08:58 to 27 September, 08:26, 2018) had good velocity coverage (Fig. 9b). Positive ice velocity anomalies were confined primarily to the area where the cluster of L2A to L2F was located (Fig. 9bi), extending from L2A and L2B downstream to L2E and L2F, with magnitudes broadly ranging from 50 to 175 m yr−1. Event 3 (17 April, 18:29 to 20 April, 08:18, 2019) appears to be associated with a velocity increase, captured by the 16–21 April image pair (Fig. 9c). Similar to Event 2, positive ice velocity anomalies were confined to the area of the cluster of lakes (Fig. 9ci). Positive anomalies were located primarily around L3A to L3G, ranging in magnitude from approximately 50 to 125 m yr−1. No positive anomaly was observed in the areas surrounding L3G (9cii).
For Events 4–6 (Fig. 10a to c), there are no clear or consistent ice velocity responses observed, although there are widespread data gaps for these events. For Event 4, there are no obvious positive velocity anomalies observed around L4A and L4B, although localized anomalies are present near L4C (Fig. 10ai and aii). Limited spatial coverage during Event 5 makes it difficult to identify definitive positive velocity anomalies (Fig. 10bi and 10bii). For Event 6, despite good data coverage, no positive velocity anomalies are observed in the areas directly surrounding the lakes (Fig. 10ci and cii).
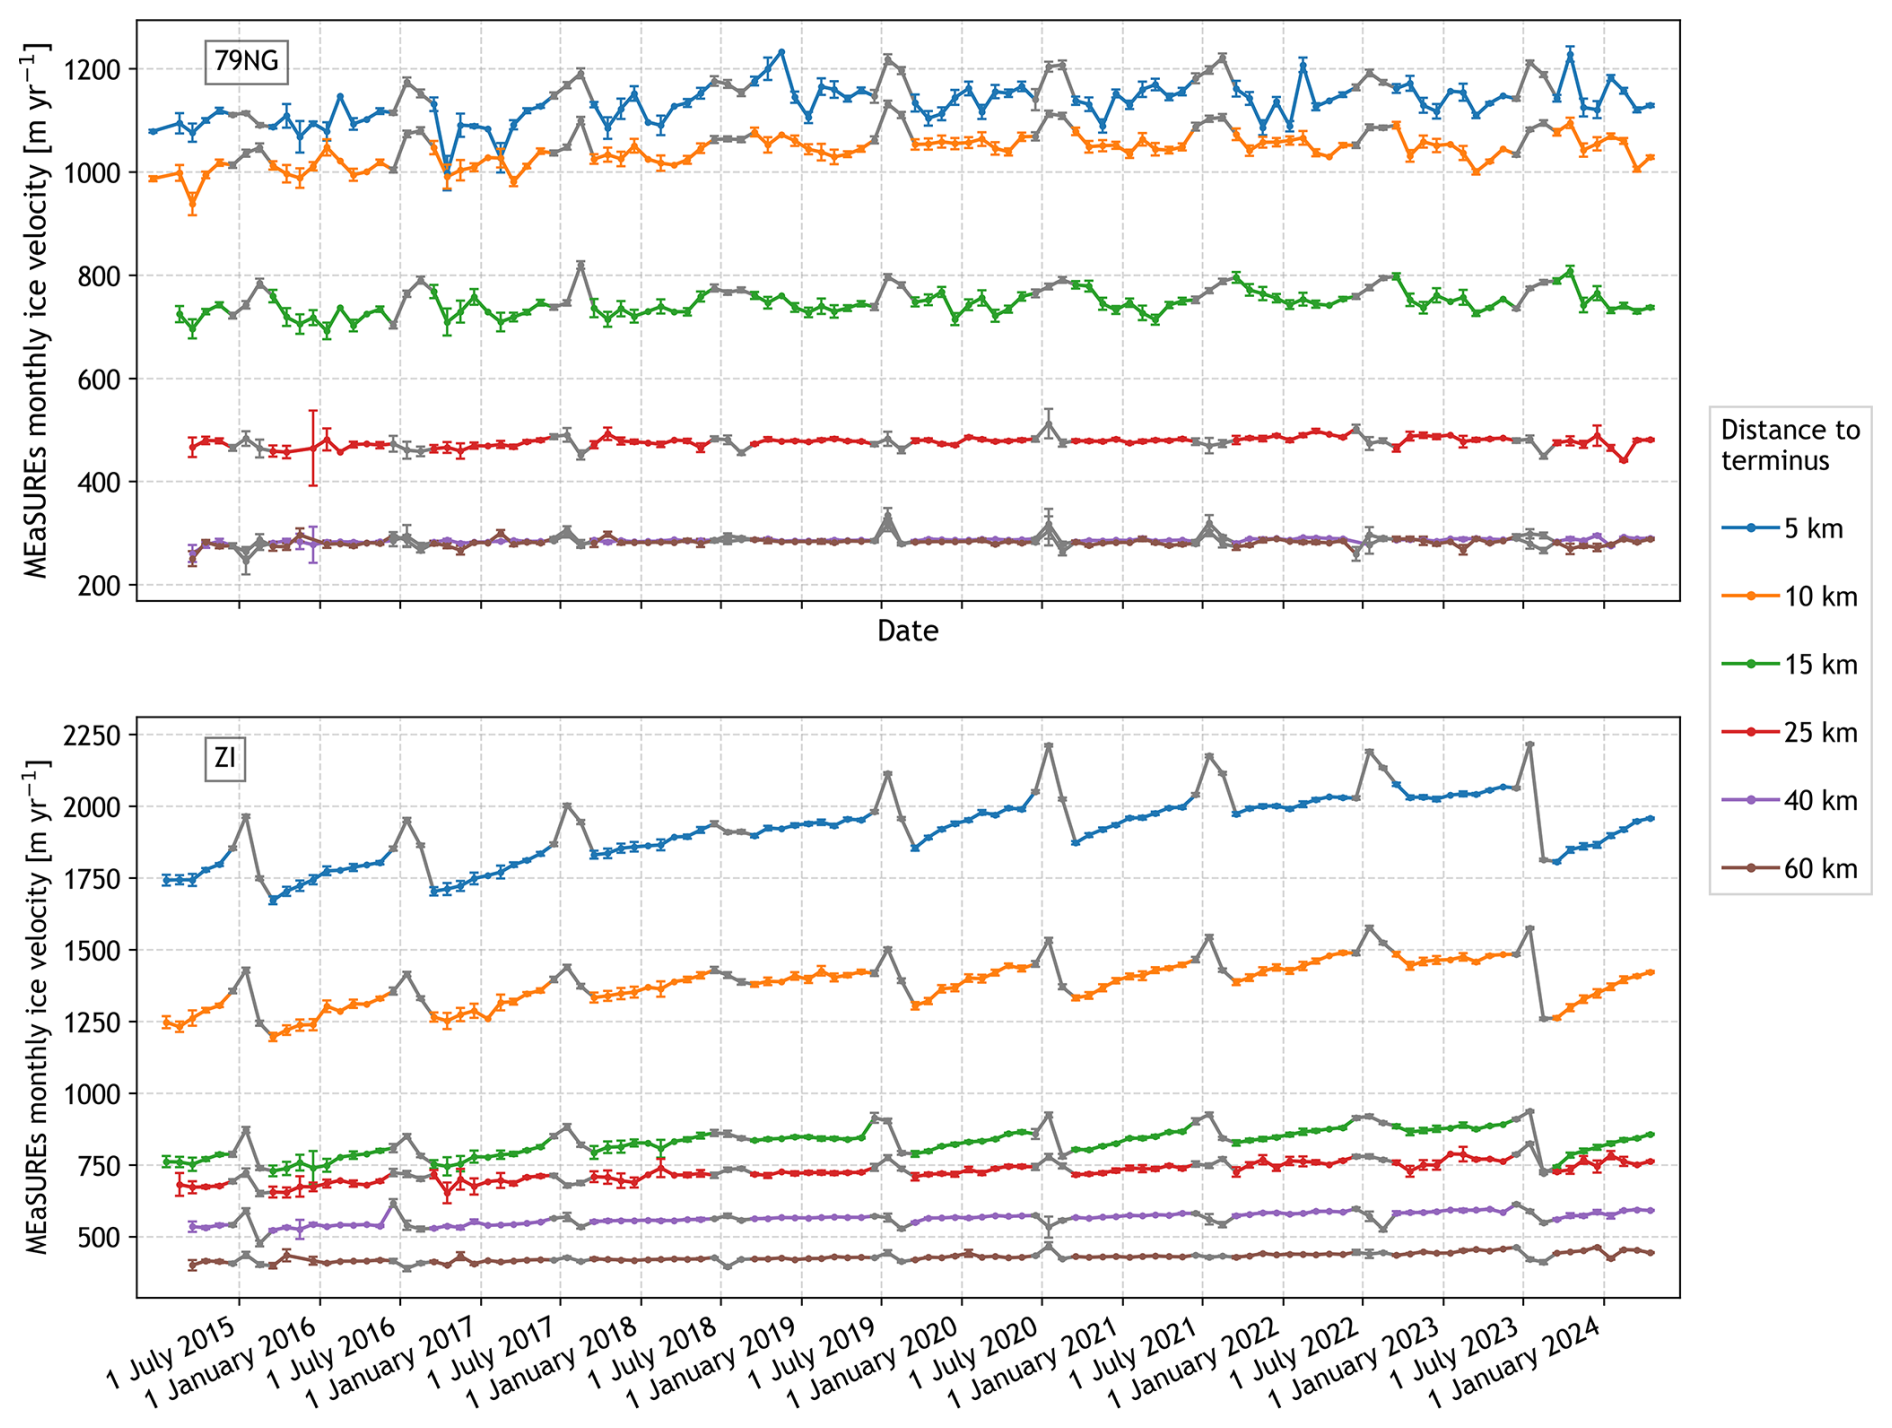
Figure 11Monthly ice surface velocity time series from June 2015 to January 2024 for Nioghalvfjerdsbræ (79NG) and Zachariæ Isstrøm (ZI), derived from monthly MEaSUREs data. Velocity measurements correspond to points along the transects shown in Fig. 1b.
5.1 Implications of winter supraglacial lake drainage at Nioghalvfjerdsbræ and Zachariæ
To date, relatively few studies have documented winter lake drainages on the GrIS (Schröder et al., 2020; Benedek and Willis, 2021; Maier et al., 2023). Our study, which spans 10 consecutive winters and uses SAR imagery with temporal resolutions ranging from twice daily to 12 d, provides the first evidence that winter drainage events are not only occurring but are quite common. These findings highlight winter drainage as an important and previously underrecognised fate for supraglacial lakes – alongside summer drainage (Das et al., 2008; Selmes et al., 2011; Tedesco et al., 2013), freeze-over, burial by snow with overwinter survival (Koenig et al., 2015; Lampkin et al., 2020; Law et al., 2020), and complete winter freeze-through (Miles et al., 2017; Hossain et al., 2024).
Over the last 40 years, supraglacial lakes have been forming (Howat et al., 2013) and draining (Otto et al., 2022) at progressively higher elevations during the summer, a trend projected to continue under future climate scenarios, with some of the greatest rates of expansion in NE Greenland (Leeson et al., 2015; Ignéczi et al., 2016, Fan et al., 2025). This inland expansion of lakes could increase the likelihood of surface-to-bed meltwater transfer in regions that are currently considered relatively stable (Doyle et al., 2014). This would have implications for both subglacial hydrology and ice dynamics (Mayaud et al., 2014), although the likelihood of this has been questioned (Poinar et al., 2015). Our 10-year record indicates that winter drainage events are confined largely to lower elevations (<600 m), with no clear trend toward higher elevations – despite evidence of summer lake expansion up glacier at both 79NG and ZI since 1985 (Fan et al., 2025).
Our analysis of melt season conditions, using ASCAT-derived melt products and the summer lake drainage dataset from of Lutz et al. (2024), described in Lutz et al. (2025), suggests that summer conditions influence the likelihood of winter lake drainage. Specifically, winters following summers with a high melt index and more frequent summer drainage events tend to exhibit fewer winter drainages (Fig. 8; Table 2). Conversely, winters following summers with a low melt index are associated with a greater number of winter drainage, at all but the highest elevations (Fig. 8 and Table 2).
Two interrelated mechanisms may explain this pattern. First, during high-intensity melt seasons, enhanced surface-to-bed meltwater inputs can elevate basal water pressures, increase ice flow velocities, and induce greater stress perturbations – conditions that promote widespread summer lake drainage. This likely results in fewer lakes persisting into winter, thereby reducing the probability of winter drainage events. This explanation is supported by the observed positive correlation between the melt index and summer drainages, and the corresponding negative correlation with winter drainages (Fig. 8; Table 2). Second, in low intensity melt seasons, the subglacial drainage system is less likely to evolve into an efficient, channelised network (Banwell et al., 2016; Andrews et al., 2018). As a result, the bed remains more hydraulically inefficient and sensitive to any additional meltwater inputs. Following the relatively cool summer of 2018 and into the early winter of 2018/19, the subglacial hydrological system was therefore likely poorly developed, creating conditions in which small or localized meltwater inputs could generate pronounced basal pressure perturbations, potentially facilitating winter lake drainage activity (Gjerde et al., 2025).
Two of the three large cluster cascade events (Events 2 and 3) identified in our ten-year record occurred during the 2018/2019 winter. Notably, Event 3 was the only late-winter cascade observed in the dataset – a seven-lake drainage event between 17 and 20 April 2019 (Fig. 9ci). No other winter exhibited large cluster cascades during the late winter. In contrast, the 2017/2018 winter, which also followed a low-intensity melt season, did not feature any large cascade events. Instead, lake drainages during this winter were more evenly distributed throughout the season. However, 2017/2018 experienced three of the 12 small cluster cascades observed in this study – the highest number recorded in a single winter.
This difference may suggest the influence of cumulative subglacial hydrological memory. While both winters followed low-intensity melt seasons, the 2018/2019 winter was preceded by two consecutive low-melt summers, potentially leaving the subglacial drainage system in a more hydraulically inefficient and sensitive state. In contrast, 2017/2018 followed only a single low-melt summer, which may have resulted in less widespread system inefficiency. This highlights the potential importance of multi-year melt history in conditioning subglacial responses and the likelihood of cascading winter lake drainages.
Surface-to-bed water transfer from winter lake drainages may also influence ice sheet stability near the grounding lines of Greenland's marine-terminating glaciers, similar to the effects of melt-season surface inputs that enter subglacial pathways and discharge at calving fronts (Rignot et al., 2010; How et al., 2017). Zeising et al. (2024) have shown that submarine meltwater inputs driven by summer lake drainages play a role in controlling basal channel growth beneath the floating ice tongue of 79NG – the largest in Greenland. The occurrence of winter lake drainages introduces a potentially important, but previously overlooked, mechanism that could similarly influence the stability of ice tongues. This influence is likely to be most significant at low elevations and early in the winter, when subglacial channels are more likely to remain open, increasing the probability that meltwater reaches the grounding line and drives basal melting at and beyond the grounding line.
Although our study does not quantify winter lake areas directly, the findings of Dunmire et al. (2021) and Zheng et al. (2023) provide useful context. In Northeast Greenland, Dunmire et al. (2021) reported that the extent of buried lakes during the 2018/19 winter was just 17 % of that observed in 2019/20 and Zheng et al. (2023) similarly found that winter lake area in 2018/19 was only ∼9 % of the 2019/20 extent. When compared with our results, these findings suggest that a greater winter lake extent does not necessarily correspond to a higher number of winter drainages. In fact, the winter with the most observed drainages (2018/19) coincided with the smaller of the two lake extents, indicating that lake presence and area alone are not reliable predictors of winter drainage frequency.
5.2 Hypothesised mechanisms of cascading winter supraglacial lake drainages
Over the ten winters studied, cascading lake drainages account for approximately half of all events – comparable to summer drainage patterns, where lake drainage clusters are also common (Morriss et al., 2013; Fitzpatrick et al., 2014; Christoffersen et al., 2018; Hoffman et al., 2018). We identify two distinct modes of winter cascading behaviour: (1) small cluster cascades involving two or three lakes separated by <10 km); and (2) large cluster cascades involving five to seven lakes extending ∼25–33 km. Below, we examine each in detail, emphasizing the likely triggering mechanisms.
5.2.1 Small cluster cascades
We propose that small cascades are initiated by rapid basal cavity opening or slip during the drainage of an initial lake, which generates horizontal tensile stresses sufficient to trigger subsequent nearby lake drainages. Similar mechanisms have been reported for summer cascades by Stevens et al. (2024). These stress perturbations, often lasting only a few hours (Das et al., 2008; Tedesco et al., 2012; Doyle et al., 2013; Stevens et al., 2015; Chudley et al., 2019; Lai et al., 2021), typically influence lakes within a few kilometres (Stevens et al., 2024).
Event 4 in September 2017/18 supports this interpretation (Fig. 10a). Within ∼48 h (16 September, 08:58 to 18 September, 08:42), lakes L4A and L4B – ∼1 km apart – both drained. This pairing occurred in four out of ten winters, mirroring Stevens at al. (2024), who found synchronous drainage of neighbouring lakes in ∼50 % of summers from 2000–2023. Stevens et al. (2024) suggest that, depending on where drainage-induced surface uplift occurs, lakes in neighbouring basins may be repeatedly placed under tensile stress, increasing the likelihood of hydrofracture and promoting recurrent clustered drainage from year to year.
Lake L4C, ∼8 km down glacier, did not drain concurrently. Instead, its drainage occurred ∼24 h later. Because the modelled subglacial drainage pathway beneath L4C follows a different branch than that beneath L4A and L4B, L4C likely drained indirectly – via stress gradients transmitted through the ice, as water flows downstream from L4A and L4B, rather than directly through the transmission of a high-pressure wave beneath L4C. Supporting this interpretation is a coincident velocity spike near L4C between 17 and 22 September (Fig. 10a).
Event 6, between 15 and 17 March – involving lakes L6A to L6C, each <3 km apart – is also consistent with rapid tensile-stress transmission from basal cavity opening (Fig. 10ci). Conversely, in Event 5, the 24–26 September drainage of lakes L5A and L5B, separated by ∼10 km, likely involved a different mechanism (Fig. 10b). These near-synchronous drainages (within ∼48 h) may reflect: (1) subglacial water transfer from L5A to L5B causing basal uplift and/or slip if L5A drained first; or (2) downstream ice acceleration affecting upstream stress fields if L5B drained first.
5.2.2 Large cluster cascades
Smaller drainage cascades involving two or three lakes are most likely driven by a single triggering mechanism. Less frequent large clusters, involved five to seven lakes over distances of ∼25–33 km. We hypothesize that large clusters involve a combination of mechanisms: Mechanism 1, tensile stress from basal cavity opening during rapid drainage of a nearby lake; Mechanism 2, basal uplift and/or slip caused by subglacial meltwater passage from the drainage of an upstream lake; and Mechanism 3, horizontal tension induced by downstream lake drainage and ice acceleration. While these mechanisms can explain lake-to-lake triggering during a cascade, they do not account for the initial drainage trigger or isolated winter events. These may be initiated by transient strain rate anomalies within the ice (Poinar and Andrews, 2021) or episodic subglacial drainage that induces vertical uplift and basal acceleration (Andersen et al., 2023).
During Event 2 (Fig. 9b), drainage began with lakes L2A and L2B (∼5 km apart), which emptied within a 36 h period. Approximately 15 h later L2C and L2D (∼14 km downstream) drained, followed by L2E and L2F (∼6 km farther downstream) within the next ∼16 h. Because L2A and L2B lie along the same subglacial pathway and are too far apart for Mechanism 1 alone to explain the sequence (Stevens et al., 2024), we suggest that subglacial water movement and associated basal uplift/slip propagated drainage downstream. Similar processes likely triggered the drainage of L2C to L2F. Elastic stresses from rapid drainage persist for only a few hours (Doyle et al., 2013; Chudley et al., 2019; Lai et al., 2021; Stevens et al., 2024), making rapid sequential triggering plausible. If L2C and L2D did not drain through the same fracture, drainage of either lake could have increased the tensile stress near the other via Mechanism 1, thereby promoting its drainage. The same may be true of lakes L2E and L2F.
Event 3, the April 2019 cascade, also likely involved multiple lake drainage mechanisms. L3A and L3B drained between 17 April, 18:29 and 19 April, 08:26, with L3C to L3F, located ∼8 km downstream along the modelled subglacial pathway, draining within the following 10 h (Fig. 9c). The proximity of L3A or L3B (<1 km) suggests that drainage may have been triggered by Mechanism 1. The later drainage of L3C to L3F, located farther along the subglacial pathway, was likely triggered by Mechanism 2 from the subglacial transit of meltwater from L3A and L3B. As in the September 2018 cascade, the proximity of L3C to L3E suggests that tensile stresses associated with Mechanism 1 could have contributed to triggering adjacent lakes. L3G drained within ∼24 h of the L3C-L3F sequence (Fig. 9c). Although L3G is hydrologically connected via the subglacial pathway, it lies ∼11 km upstream, making it unlikely that a pressure wave travelled that distance to induce uplift or slip beneath it (Mechanism 1 and 2). Instead, the rapid drainage of L3A-F likely triggered Mechanism 3, in which drainage-induced, localised ice acceleration, placed the L3G basin under horizontal tension, enabling hydrofracture-driven drainage (Christoffersen et al., 2018).
Event 1, between 5 September, 08:43 and 6 September, 17:32, 2015, involved the drainage of lakes L1A to L1E (Fig. 9a). This cascade involved lakes more evenly spaced than those in the 2018/2019 cascades, with greater separations ranging from ∼3.5 to ∼32 km. Although the exact sequence is unknown, it is likely that drainage was driven primarily by Mechanism 2. L1B and L1C were close enough for Mechanism 1 to have been involved, while the wider spacing of the remaining lakes makes this less likely. If L1A drained first, subglacial meltwater would travel along the subglacial pathway, triggering downstream lakes to drain via uplift and/or slip. Alternatively, drainage of a downstream lake could have triggered Mechanism 3 by transmitting stress gradients upstream through the ice, triggering the upstream lakes through horizontal tension.
5.3 Ice velocity responses
The two large cluster cascades that occurred during the winter of 2018/2019 (Event 2 and 3) exhibited positive ice velocity anomalies in close proximity to the cluster of lakes (Fig. 9b and c). Events 2 and 3 were preceded by the cool summer of 2018 that had a low number of drainages. This would have made it less likely for an efficient subglacial drainage system to develop in the summer, increasing the potential for winter lake drainages to generate high basal water pressures and reduce basal friction (Tedstone et al., 2013; Andrews et al., 2014; Andrews et al., 2018). In contrast, Event 1 exhibited no clear positive ice velocity anomaly. Event 1 followed a relatively warm melt season with a number of drainages, limiting the potential for winter lake drainages to generate high basal water pressures and reduce basal friction.
Similarly, small cluster cascades (involving two or three lakes) that occurred in early winter also had minimal or no discernible impact on ice velocity anomalies (Fig. 10). Although the 6 and 12 d ice velocity products provide relatively high temporal resolution, short-lived velocity perturbations associated with lake drainage clusters may go undetected (Poinar and Andrews, 2021; Stevens et al., 2024). The proximity of the small clusters to the grounding line may also help explain their limited response. This is particularly the case for Event 6, which consisted of three lakes – including one of the lakes with anomalously high lake volume – that were very close to the ZI grounding line. In-situ measurements corroborate our findings: at Helheim Glacier, GPS-derived velocities remained largely unaffected by a near-grounding line lake drainage event in the late melt season, likely due to the presence of an efficient subglacial drainage system (Stevens et al., 2022). Similarly, a September drainage event near the grounding line of 79NG produced only a minor and short-lived velocity increase (Neckel et al., 2020).
Overall, we find no evidence that the number of winter lake drainages correlates with changes in monthly winter ice velocities at 79NG and ZI (Fig. 11). This suggests that the volume and rate of meltwater reaching the bed during these events are insufficient to sustain elevated subglacial water pressure or reduce basal friction over extended periods. The ongoing year-to-year winter acceleration observed at ZI is instead attributed to other factors, most notably its rapid retreat beginning in 2012 (Mouginot et al., 2015; Grinsted et al., 2022; Khan et al., 2022).
It is well established that during the melt season, increasing surface meltwater inputs – including lake drainages – initially enhance basal cavity expansion and glacier acceleration, followed by subglacial channel development and a transition to lower velocities (Bartholomew et al., 2010; Tedstone et al., 2013; Andrews et al., 2014; Banwell et al., 2016; Andrews et al., 2018). Maier et al. (2023) documented a late-winter 15-lake cascade in a land-terminating region of southwest Greenland, using optical imagery. Using Differential Interferometry Synthetic Aperture Radar (DInSAR), they tracked the down-glacier propagation of a velocity wave associated with subglacial water movement, which lasted approximately a month. Together with our findings from the 2018/2019 winter season cascades (Fig. 9b and c), this suggests that winter cascades can influence ice dynamics and potentially affect the evolution of subglacial drainage systems. However, whether winter lake drainages can trigger similar subglacial system development remains an open question. Further investigation is needed to assess whether winter drainage events can precondition the subglacial drainage system in ways that influence ice dynamics at the onset of the subsequent melt season.
5.4 Use of a composite summer lake mask
We tracked mean of lakes during winter using a 10-year Landsat-derived composite summer lake mask, following the approach of Benedek and Willis (2021). This enabled the detection of drainage from lakes that remained buried for one or more years – events previously documented across Greenland, including at 79NG and ZI (Koenig et al., 2015; Lampkin et al., 2020). The use of this long-term mask also allowed for the inclusion of partially snow- or ice-covered lakes, many of which would have been missed using only single-year masks, e.g., those following the low-melt summer of 2018, which showed no visible surface expression (Dunmire et al., 2021; Zheng et al., 2023).
Employing a 10-year composite mask also introduced large variability in the magnitude of increases during drainage events. The degree to which a lake fills within its long-term extent depends on melt season intensity and basin morphology. Lakes that fill up only partially may exhibit higher pre-drainage due to a lower meltwater-to-ice facies ratio, resulting in smaller relative backscatter increases during drainage events. Consequently, drainage of small lakes within the larger composite extent may go undetected. We consider this to be a rare occurrence, as smaller are less likely to persist into winter (Lampkin et al., 2020), and their shallower depths make them more prone to freeze through (Law et al., 2020). Lake elevation also influences the magnitude of changes. Lower-elevation lakes typically overlay more crevassed or rough glacier surfaces, resulting in higher post-drainage backscatter than those at higher elevations, where ice slabs or firn dominate.
We investigated ten years of winter supraglacial lake drainages on the Greenland Ice Sheet using a semi-automated method to detect drainage events at high temporal resolution that incorporates a new incidence angle normalisation applied to C-band SAR. This enabled observations of winter lake behaviour that had not previously been possible. Incorporating imagery from multiple sensor geometries allowed us to detect drainages with sub-daily temporal resolution – substantially improving the precision of drainage timing compared to the standard 6 and 12 d repeat cycles of Sentinel-1 or the 4 d cycle of RCM. This was particularly advantageous for capturing cascading drainage events involving multiple lakes over several days, where higher temporal resolution helped distinguish individual drainage sequences. In contrast, coarser revisit intervals can result in temporal aliasing, causing such cascades to appear as a synchronous event (Cooley and Christoffersen, 2017; Stevens et al., 2024). Focusing on the winter season – when surface meltwater production and lake filling are minimal – reduced the influence of slow drainage mechanisms such as overtopping and channel incision. This allowed us to isolate rapid drainage events, which are more likely to result from hydrofracture. Our analysis revealed that winter lake drainages are a common occurrence at Zachariæ Isstrøm (ZI) and Nioghalvfjerdsbræ (79NG) in northeast Greenland. Over the study period, we identified 90 drainage events across 55 lakes, with some lakes draining up to six times in ten winters. Drainage frequency generally declined as winter progressed, though timing and location varied considerably.
Approximately half of all winter drainages occurred as part of cascading events involving two to seven lakes. We identified two distinct cascade types: (1) small-scale cascades involving two or three lakes over short distances (< 10 km), and (2) large-scale cascades involving five to seven lakes over longer distances (∼25–33 km). Based on timing, spatial relationships, and subglacial hydrological context, we propose different triggering mechanisms for each type. Larger cascades likely result from a combination of processes, including tensile stress generation from basal cavity opening, stress changes associated with evolving subglacial hydrological connectivity, as meltwater passes beneath adjacent lakes, and transient horizontal strain increases due to downstream ice acceleration.
Winter drainage frequency was influenced by the characteristics of the preceding melt season, particularly melt intensity and the frequency of summer drainages. Winters with higher drainage activity typically followed cooler summers with fewer drainages, while winters with fewer events followed warmer summers with more drainages. We found a negative correlation between winter and preceding summer drainage frequency at low- and mid-elevation lakes, but a positive correlation at high elevations. Furthermore, as melt intensity increased, winter drainages contributed proportionally less to annual drainage frequency. Lakes that drained in winter rarely drained again in the following summer, and vice versa.
We found limited evidence of widespread or sustained ice velocity changes directly linked to winter drainage events. Most cascades were associated with only localised or short-lived velocity responses. A notable exception was a seven-lake cascade in April 2019, which triggered a clear short-term velocity increase.
Future work should include extending winter lake drainage investigations to other regions of the Greenland Ice Sheet to evaluate their broader prevalence. Winter monitoring is especially critical as surface lakes are expected to migrate further inland with ongoing climate change. Future studies should also build on the continuous, year-round drainage record approach presented here, by combining optical and SAR-based methods to support comprehensive monitoring of lake life cycles and their impacts on ice sheet dynamics. Extending SAR observations with high frequency (<1 h) in-situ GPS measurements into winter would help determine whether winter drainage processes are fundamentally different from those in summer and provide essential ground truth for interpreting satellite-based observations across the ice sheet. Greater understanding is also needed regarding how winter lake drainages affect ice dynamics, which can also play a key role in shaping the spatial and temporal distribution of surface meltwater at the onset of the melt season. The influence of winter drainage on subglacial channel development and ice flow during the subsequent melt season remains largely unresolved.
Despite the strengths of our approach, fully-automating winter lake drainage detection remains challenging. Manual screening is still needed to filter false positives, particularly during early winter freeze-up, when widespread increases in backscatter occur across all glacier surface facies. Additionally, while our method effectively identifies rapid winter drainages and cascading events at high temporal resolution, it does not resolve the areal extent of buried lakes during the winter or freeze through, as in previous studies (Miles et al., 2017; Schröder et al., 2020; Dunmire et al., 2021, Zheng et al., 2023). Thus, we are unable to quantify seasonal variations in stored meltwater or assess the completeness of individual drainage events.
Supraglacial lakes play a key role in regulating both surface and subglacial hydrologic systems, with important implications for ice sheet dynamics. While their melt-season behaviour is well documented through optical remote sensing, winter lake drainages are only recently recognised as a regular and significant component of their lifecycle. These findings offer valuable insight into the year-round hydrological activity of supraglacial lakes and their evolving role in a warming climate. The long-term C-band SAR record from Sentinel-1, now bolstered by the launch of Sentinel-1C and Sentinel-1D, provides a solid foundation for advancing winter hydrological studies on the Greenland Ice Sheet and beyond.
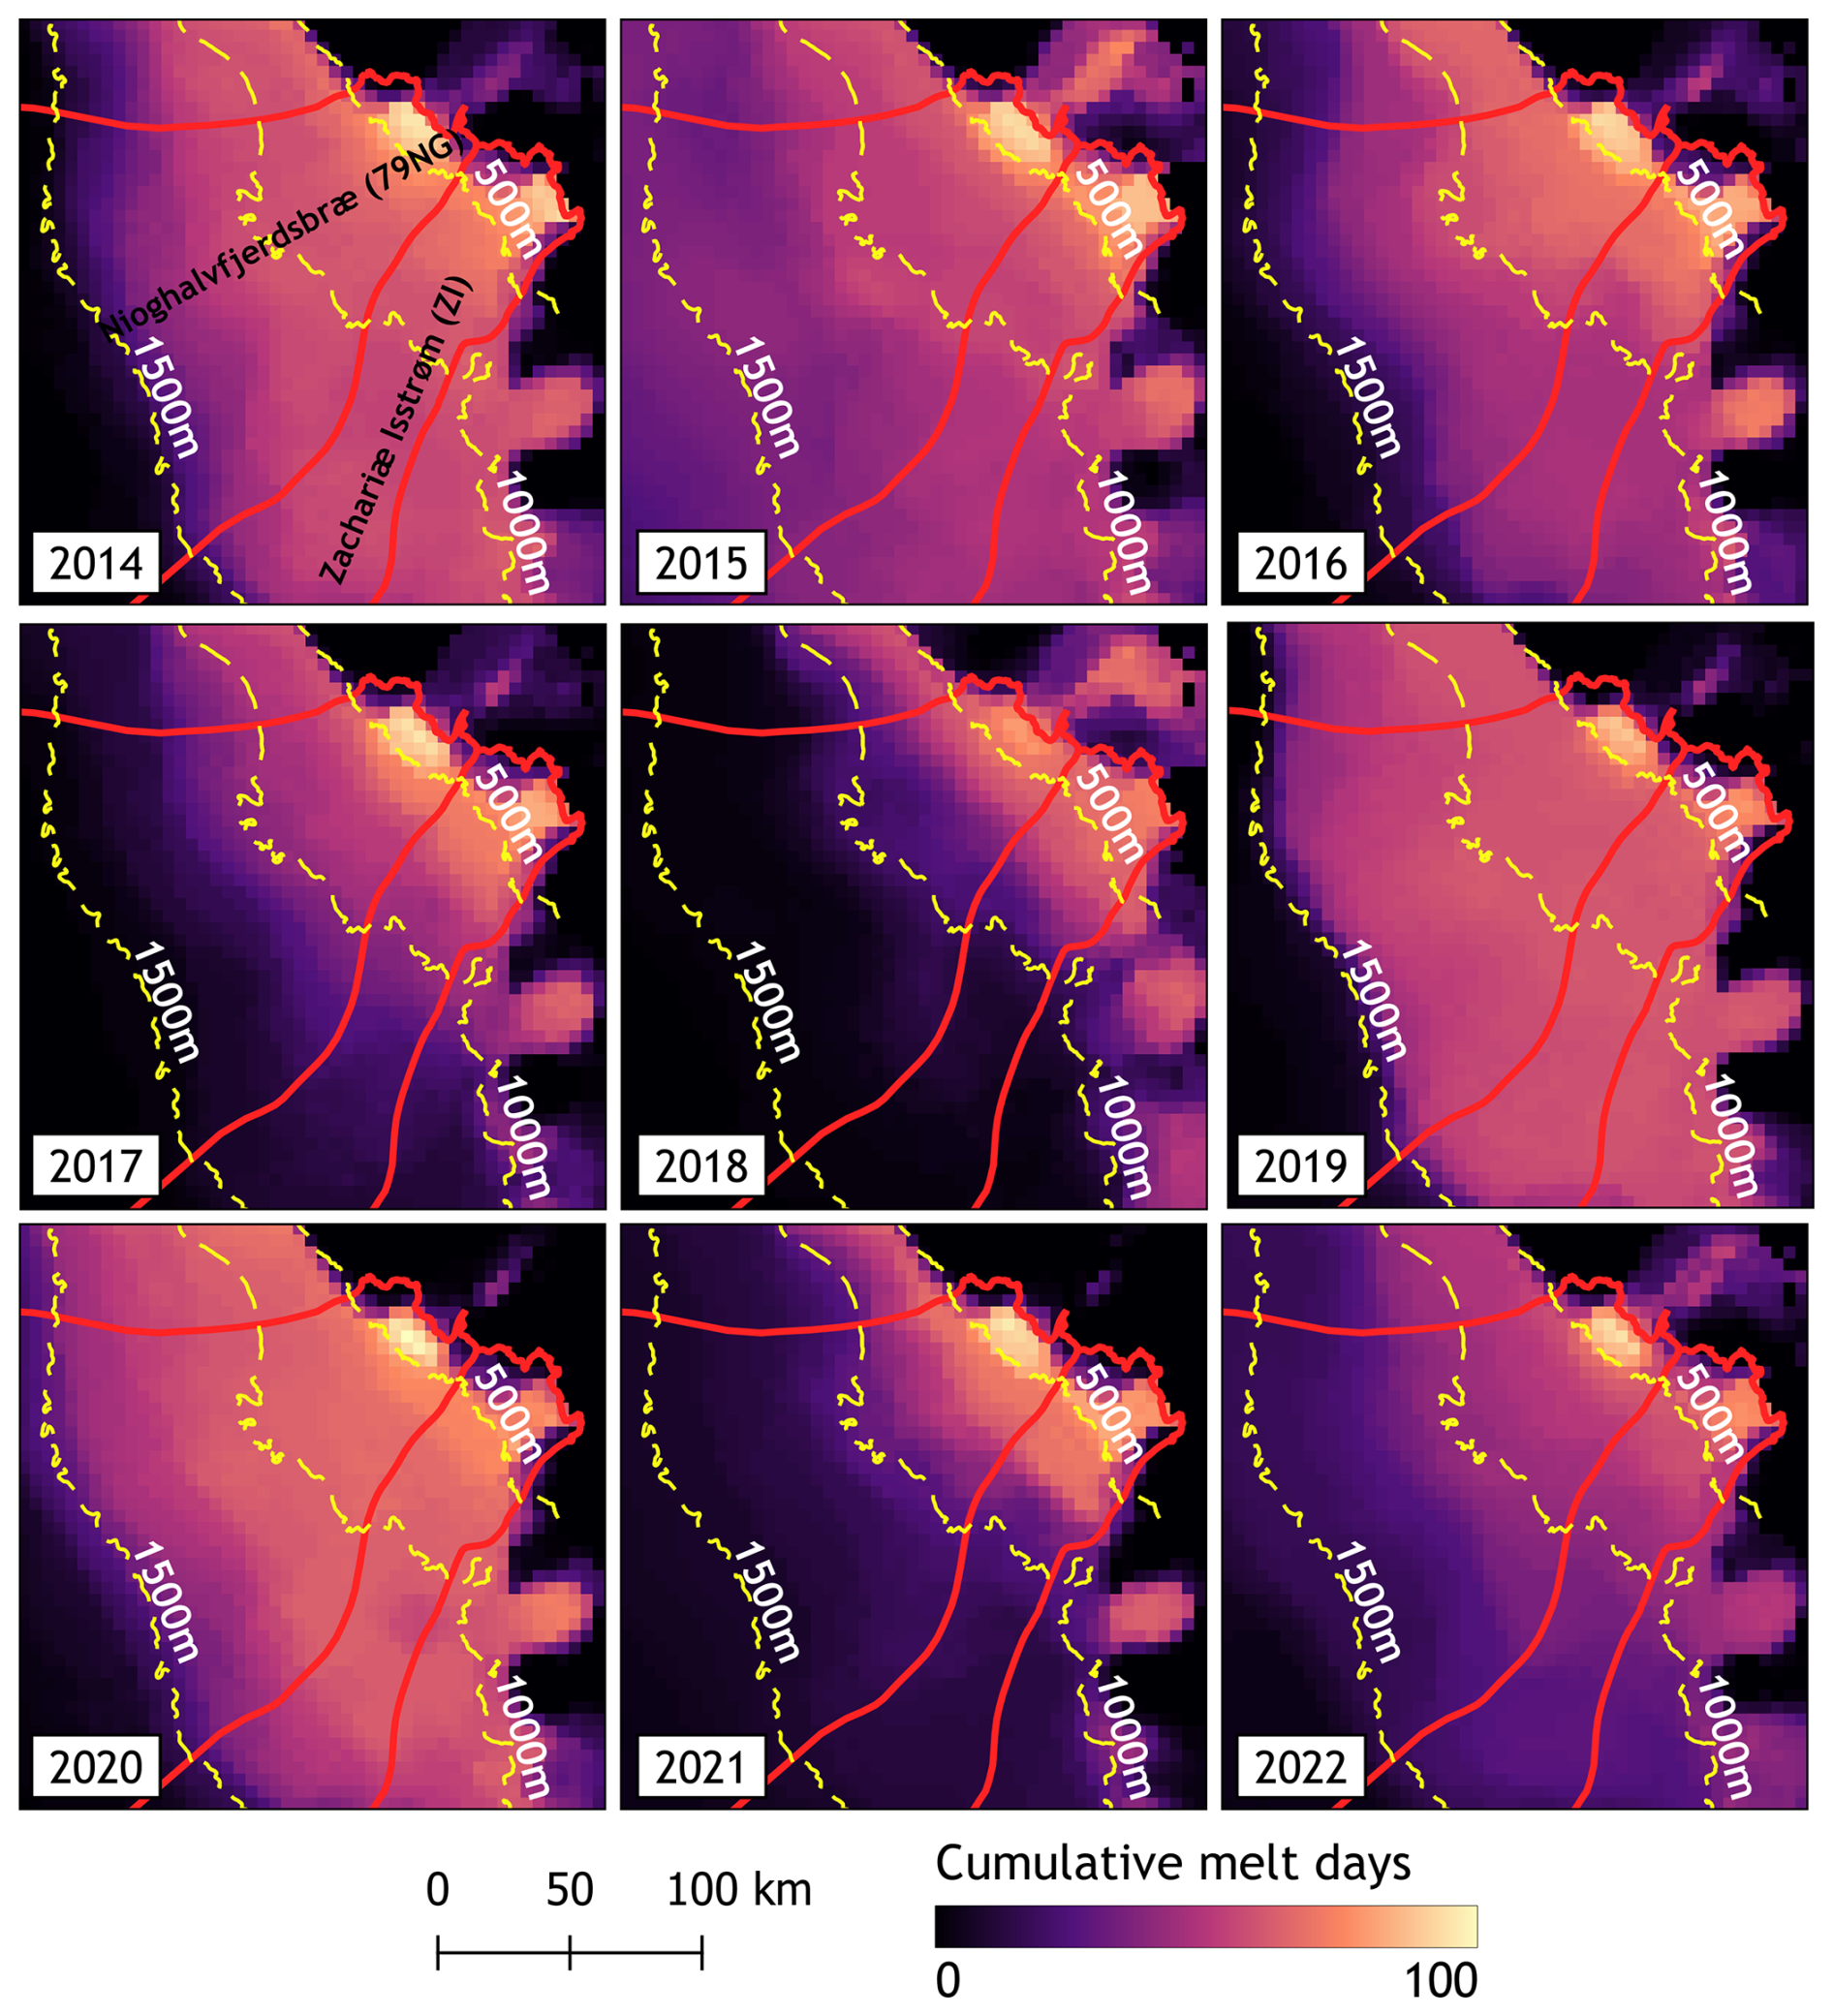
Figure A1Maps of melt intensity (cumulative melt days between 1 June and 31 August) for Nioghalvfjerdsbræ (79NG) and Zachariæ Isstrøm (ZI) derived from ASCAT data.
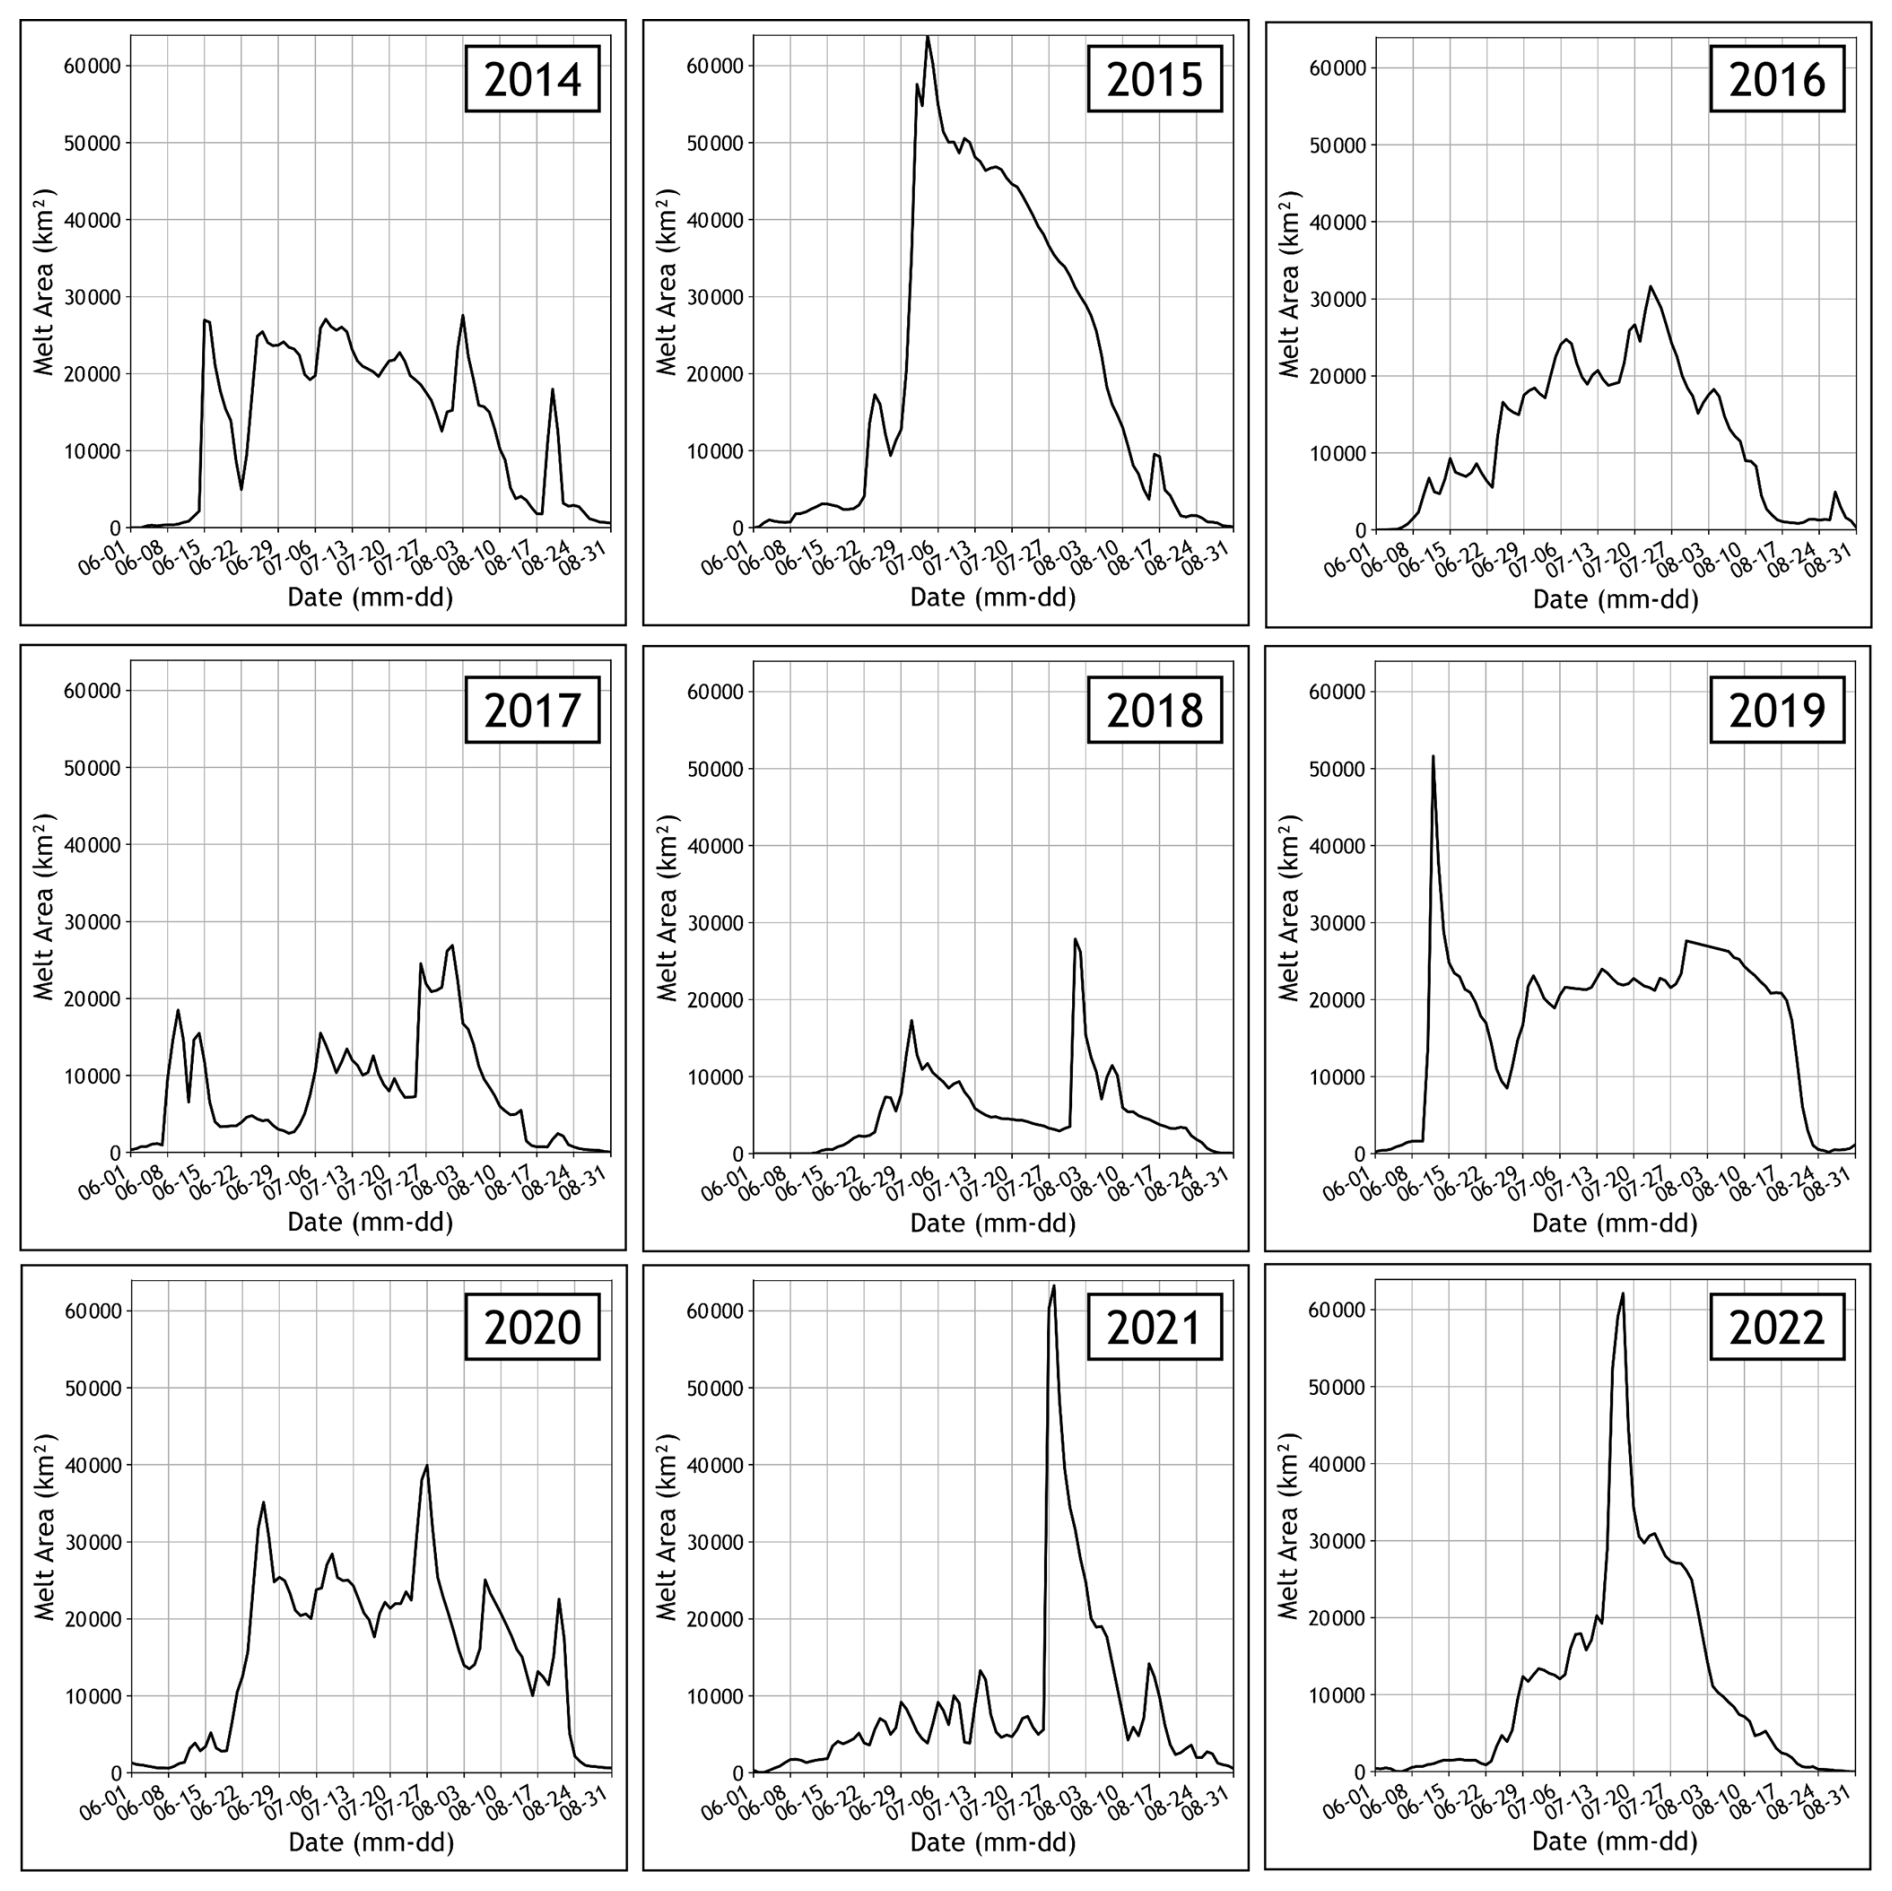
Figure A2Time series of ASCAT-derived melt area across the entire domain from 1 June to 31 August of the 2014 to 2022 melt seasons. Four of these time series (2017–2020) are also shown in Fig. 6.
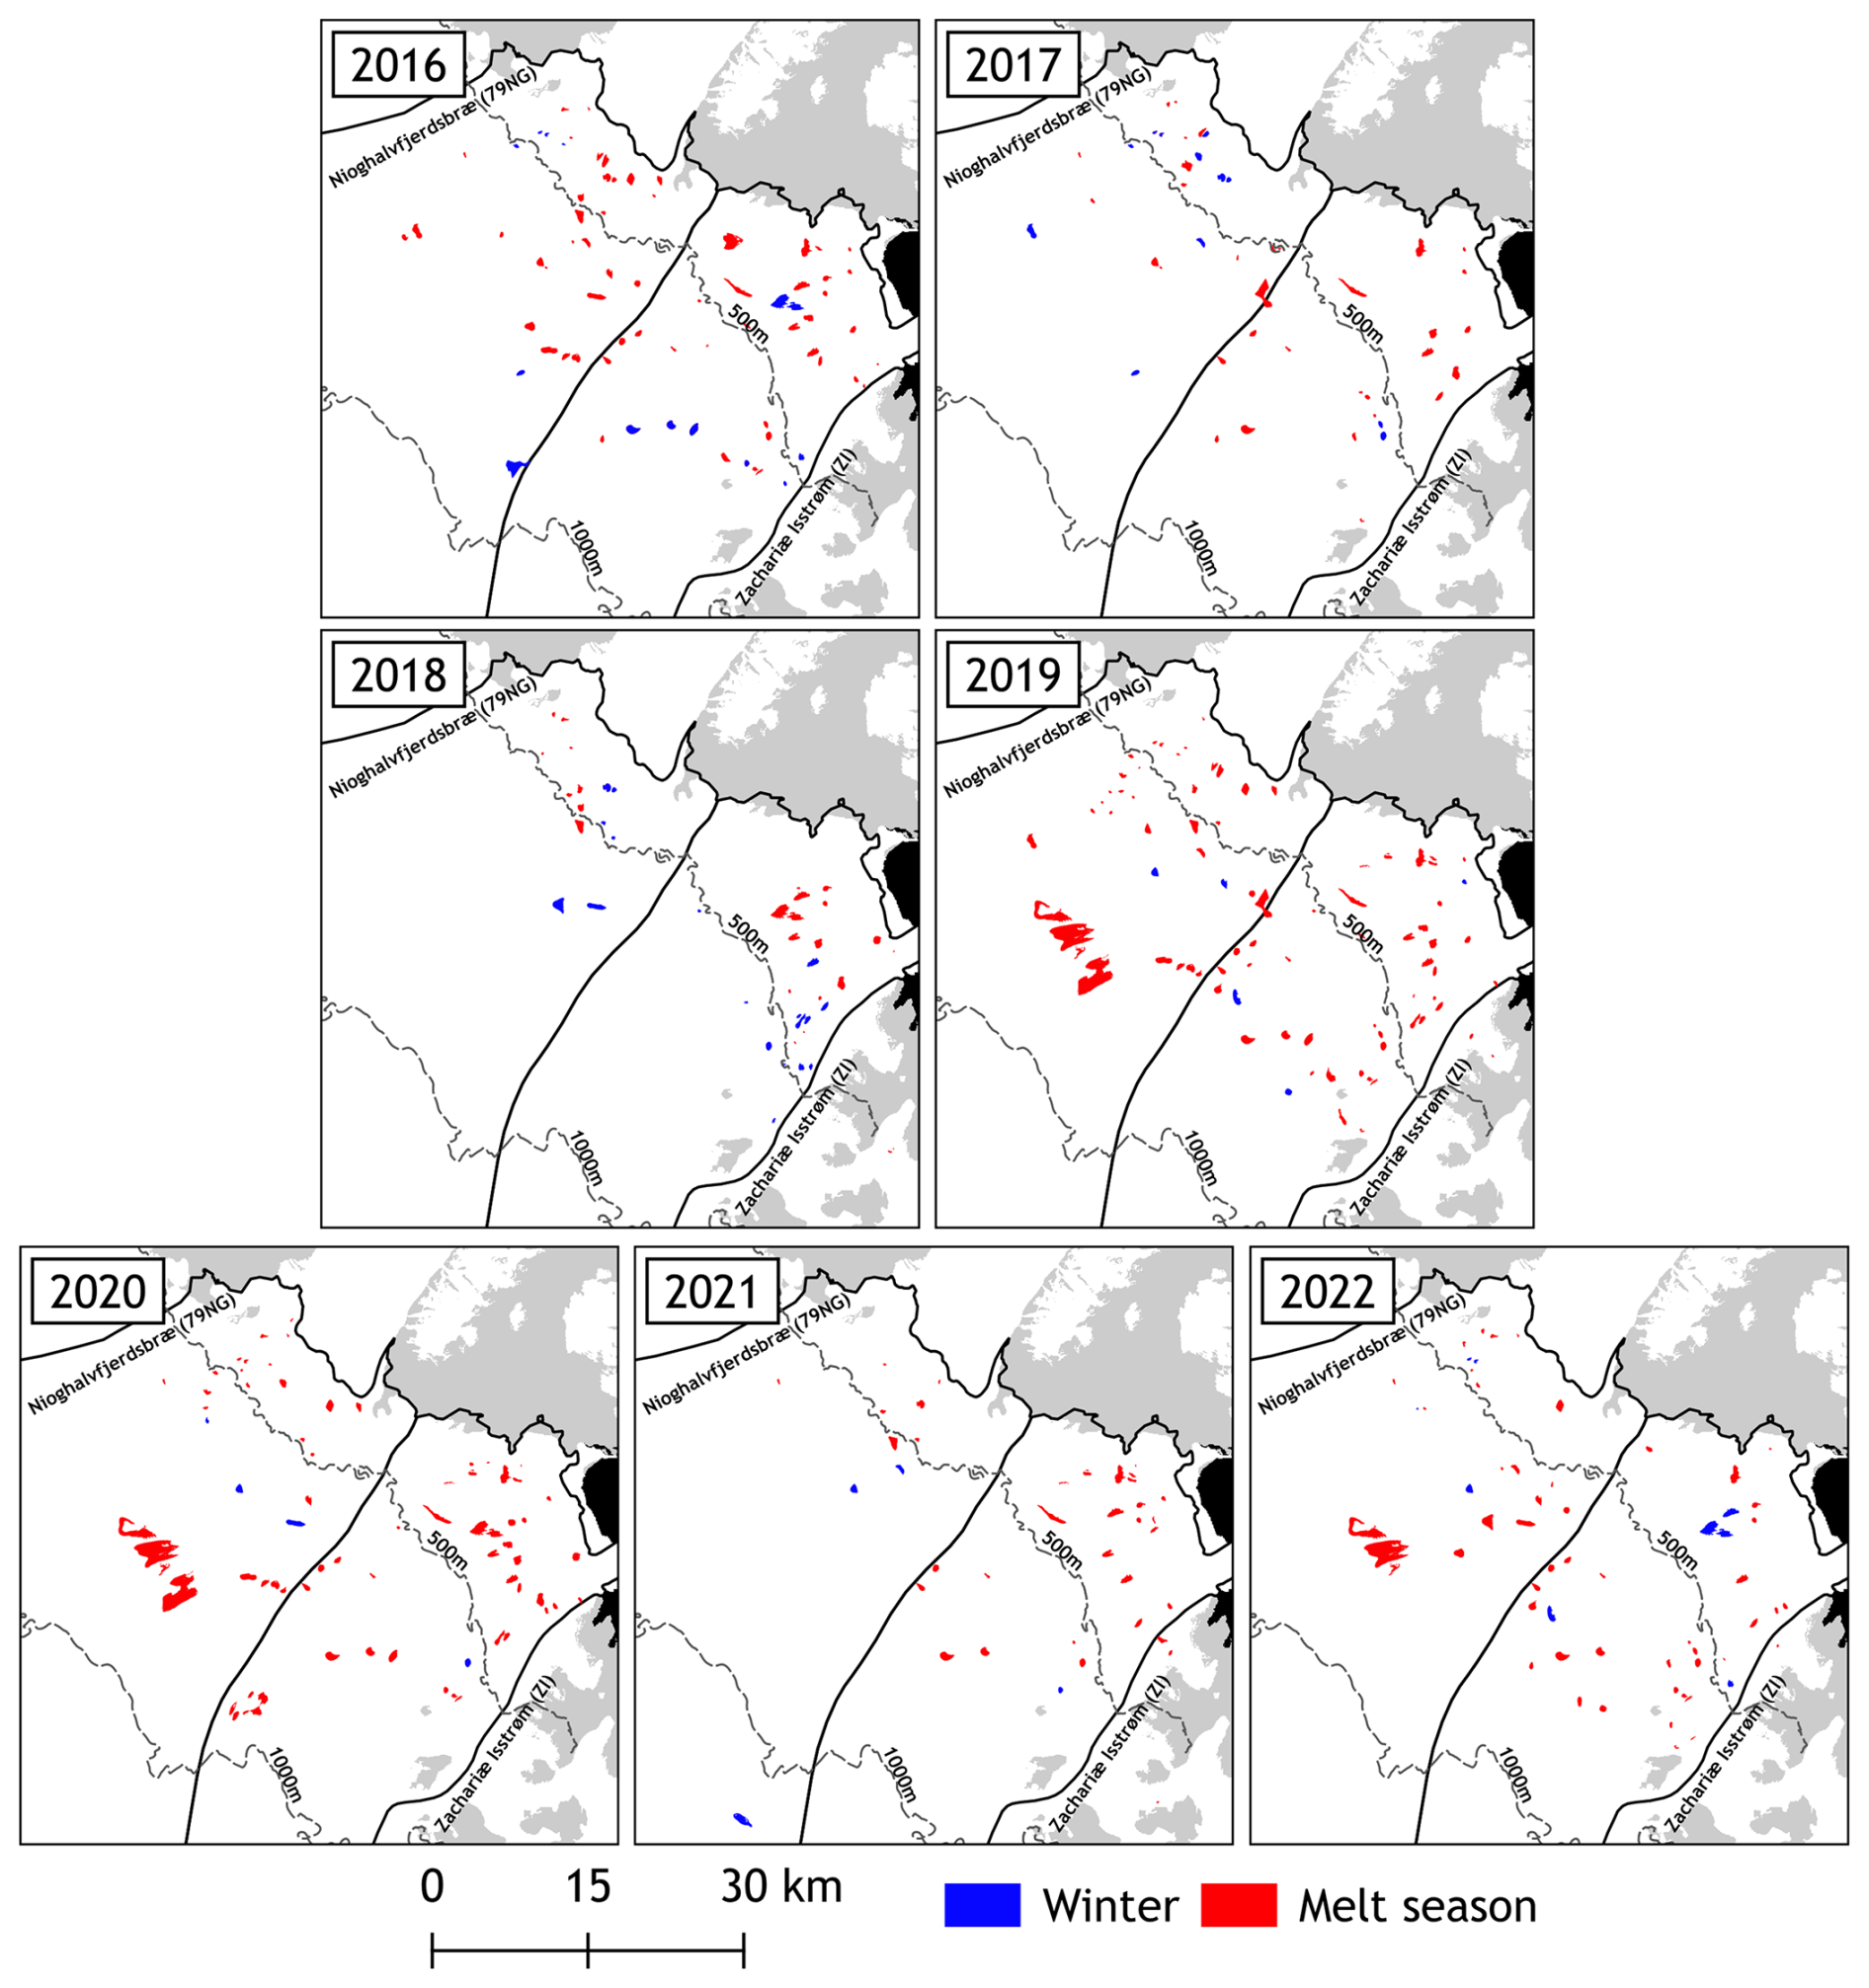
Figure A3Locations of melt season (red polygon) and winter (blue polygon) rapid drainages from 2016 to 2022. Melt season rapid lake drainages are available from Lutz et al. (2024). Grey shading indicates land areas, and black represents an ocean mask, both derived from the GIMP lake, ice, and ocean classification dataset (Howat, 2017).
Sentinel-1 C-band SAR GRD scenes are available from the Alaska Satellite Facility (ASF DAAC) (https://search.asf.alaska.edu/, last access: 8 January 2025). RADARSAT Constellation Mission (RCM) C-band SAR GRD scenes (2019–2024) were obtained from the Natural Resources Canada Earth Observation Data Management System (EODMS) (https://www.eodms-sgdot.nrcan-rncan.gc.ca/, last access: 13 January 2025) and are accessible upon registration; redistribution of the raw scenes is restricted by the provider's licence.
Landsat 8/9 OLI Tier-1 L1TP images (2014–2023) were obtained from the USGS EarthExplorer (https://earthexplorer.usgs.gov/, last access: 19 December 2024). ArcticDEM v4.1 mosaics and strips used for terrain correction and lake-volume estimates are available from Harvard Dataverse (mosaics & strips: https://www.pgc.umn.edu/data/arcticdem/, last access: 5 February 2025). BedMachine Greenland v5 is distributed by NSIDC (https://doi.org/10.5067/GMEVBWFLWA7X; Morlighem et al., 2022). The MEaSUREs Greenland Ice Mapping Project (GIMP) land/ice–ocean classification mask is available from NSIDC (https://doi.org/10.5067/B8X58MQBFUPA; Howat, 2017). Glacier basin outlines used to delineate 79NG and ZI are available from Dryad (https://doi.org/10.7280/D1WT11; Mouginot and Rignot, 2019). ASCAT C-band from (https://www.scp.byu.edu/, last access: 17 January 2025). Ice-velocity data are the MEaSUREs velocity mosaics (multi-year, 6/12 d, and monthly products) from NSIDC (multi-year mosaic https://doi.org/10.5067/QUA5Q9SVMSJG, Joughin et al., 2016b; 6/12 d https://doi.org/10.5067/1AMEDB6VJ1NZ, Joughin, 2022; monthly mosaic https://doi.org/10.5067/EGKZX6FXXM4P, Joughin, 2023).
Derived data products generated in this work (winter-drainage event lake polygons) are available at https://doi.org/10.5281/zenodo.18765554 (Dean et al., 2026).
CD led the conceptualisation of the study, carried out the methodology, performed the formal analysis, and prepared the original draft. RS supported study conceptualisation, methodology design, and manuscript editing. IW supported study conceptualisation, methodology design and contributed to reviewing and editing. KM assisted with data processing and analysis of ASCAT datasets. RS acquired funding and provided supervision. All co-authors contributed to editing the manuscript.
The contact author has declared that none of the authors has any competing interests.
Publisher's note: Copernicus Publications remains neutral with regard to jurisdictional claims made in the text, published maps, institutional affiliations, or any other geographical representation in this paper. The authors bear the ultimate responsibility for providing appropriate place names. Views expressed in the text are those of the authors and do not necessarily reflect the views of the publisher.
We thank the handling editor, Stephen Livingstone, reviewer Katrina Lutz, and the anonymous reviewer for their constructive comments and thoughtful guidance, which helped improve the clarity and quality of the manuscript.
This research has been supported by the Natural Sciences and Engineering Research Council of Canada (grant no. 110_2022_2023_Q1_2082 to R. Scharien).
This paper was edited by Stephen Livingstone and reviewed by Katrina Lutz and one anonymous referee.
Andersen, J. K., Rathmann, N., Hvidberg, C. S., Grinsted, A., Kusk, A., Merryman Boncori, J. P., and Mouginot, J.: Episodic Subglacial Drainage Cascades Below the Northeast Greenland Ice Stream, Geophys. Res. Lett., 50, e2023GL103240, https://doi.org/10.1029/2023GL103240, 2023.
Andrews, L. C., Catania, G. A., Hoffman, M. J., Gulley, J. D., Lüthi, M. P., Ryser, C., Hawley, R. L., and Neumann, T. A.: Direct observations of evolving subglacial drainage beneath the Greenland Ice Sheet, Nature, 514, 80–83, https://doi.org/10.1038/nature13796, 2014.
Andrews, L. C., Hoffman, M. J., Neumann, T. A., Catania, G. A., Lüthi, M. P., Hawley, R. L., Schild, K. M., Ryser, C., and Morriss, B. F.: Seasonal Evolution of the Subglacial Hydrologic System Modified by Supraglacial Lake Drainage in Western Greenland, J. Geophys. Res.-Earth Surf., 123, 1479–1496, https://doi.org/10.1029/2017JF004585, 2018.
Ashcraft, I. S. and Long, D. G.: Observation and characterization of radar backscatter over Greenland, IEEE Transactions on Geoscience and Remote Sensing, 43, 225–237, https://doi.org/10.1109/TGRS.2004.841484, 2005.
Banwell, A., Hewitt, I., Willis, I., and Arnold, N.: Moulin density controls drainage development beneath the Greenland ice sheet, J. Geophys. Res.-Earth Surf., 121, 2248–2269, https://doi.org/10.1002/2015JF003801, 2016.
Bartholomew, I., Nienow, P., Mair, D., Hubbard, A., King, M. A., and Sole, A.: Seasonal evolution of subglacial drainage and acceleration in a Greenland outlet glacier, Nat. Geosci., 3, 408–411, https://doi.org/10.1038/ngeo863, 2010.
Benedek, C. L. and Willis, I. C.: Winter drainage of surface lakes on the Greenland Ice Sheet from Sentinel-1 SAR imagery, The Cryosphere, 15, 1587–1606, https://doi.org/10.5194/tc-15-1587-2021, 2021.
Box, J. E., Hubbard, A., Bahr, D. B., Colgan, W. T., Fettweis, X., Mankoff, K. D., Wehrlé, A., Noël, B., van den Broeke, M. R., Wouters, B., Bjørk, A. A., and Fausto, R. S.: Greenland ice sheet climate disequilibrium and committed sea-level rise, Nat. Clim. Chang., 12, 808–813, https://doi.org/10.1038/s41558-022-01441-2, 2022.
Christoffersen, P., Bougamont, M., Hubbard, A., Doyle, S. H., Grigsby, S., and Pettersson, R.: Cascading lake drainage on the Greenland Ice Sheet triggered by tensile shock and fracture, Nat. Commun., 9, 1064, https://doi.org/10.1038/s41467-018-03420-8, 2018.
Chudley, T. R., Christoffersen, P., Doyle, S. H., Bougamont, M., Schoonman, C. M., Hubbard, B., and James, M. R.: Supraglacial lake drainage at a fast-flowing Greenlandic outlet glacier, P. Natl. Acad. Sci. USA, 116, 25468–25477, https://doi.org/10.1073/pnas.1913685116, 2019.
Cooley, S. W. and Christoffersen, P.: Observation Bias Correction Reveals More Rapidly Draining Lakes on the Greenland Ice Sheet, J. Geophys. Res.-Earth Surf., 122, 1867–1881, https://doi.org/10.1002/2017JF004255, 2017.
Culberg, R., Michaelides, R. J., and Miller, J. Z.: Sentinel-1 detection of ice slabs on the Greenland Ice Sheet, The Cryosphere, 18, 2531–2555, https://doi.org/10.5194/tc-18-2531-2024, 2024.
Das, S. B., Joughin, I., Behn, M. D., Howat, I. M., King, M. A., Lizarralde, D., and Bhatia, M. P.: Fracture Propagation to the Base of the Greenland Ice Sheet During Supraglacial Lake Drainage, Science, 320, 778–781, https://doi.org/10.1126/science.1153360, 2008.
Dean, C., Scharien, R., Willis, I., and McDougall, K.: Supraglacial lake winter drainages in Northeast Greenland (2014/15–2023/24) from C-band SAR (v1.0), Zenodo [data set], https://doi.org/10.5281/zenodo.18765554, 2026.
Dirscherl, M., Dietz, A. J., Kneisel, C., and Kuenzer, C.: Automated Mapping of Antarctic Supraglacial Lakes Using a Machine Learning Approach, Remote Sens., 12, 1203, https://doi.org/10.3390/rs12071203, 2020.
Dirscherl, M., Dietz, A. J., Kneisel, C., and Kuenzer, C.: A Novel Method for Automated Supraglacial Lake Mapping in Antarctica Using Sentinel-1 SAR Imagery and Deep Learning, Remote Sens., 13, 197, https://doi.org/10.3390/rs13020197, 2021.
Doyle, S. H., Hubbard, A. L., Dow, C. F., Jones, G. A., Fitzpatrick, A., Gusmeroli, A., Kulessa, B., Lindback, K., Pettersson, R., and Box, J. E.: Ice tectonic deformation during the rapid in situ drainage of a supraglacial lake on the Greenland Ice Sheet, The Cryosphere, 7, 129–140, https://doi.org/10.5194/tc-7-129-2013, 2013.
Doyle, S. H., Hubbard, A., Fitzpatrick, A. A. W., van As, D., Mikkelsen, A. B., Pettersson, R., and Hubbard, B.: Persistent flow acceleration within the interior of the Greenland ice sheet, Geophys. Res. Lett., 41, 899–905, https://doi.org/10.1002/2013GL058933, 2014.
Dunmire, D., Lenaerts, J. T. M., Banwell, A. F., Wever, N., Shragge, J., Lhermitte, S., Drews, R., Pattyn, F., Hansen, J. S. S., Willis, I. C., Miller, J., and Keenan, E.: Observations of Buried Lake Drainage on the Antarctic Ice Sheet, Geophys. Res. Lett., 47, e2020GL087970, https://doi.org/10.1029/2020GL087970, 2020.
Dunmire, D., Banwell, A. F., Wever, N., Lenaerts, J. T. M., and Datta, R. T.: Contrasting regional variability of buried meltwater extent over 2 years across the Greenland Ice Sheet, The Cryosphere, 15, 2983–3005, https://doi.org/10.5194/tc-15-2983-2021, 2021.
Fan, Y., Ke, C.-Q., Luo, L., Shen, X., Livingstone, S. J., and Lea, J. M.: Expansion of supraglacial lake area, volume and extent on the Greenland ice sheet from 1985 to 2023, J. Glaciol., 71, e4, https://doi.org/10.1017/jog.2024.87, 2025.
Fischer, G., Papathanassiou, K. P., and Hajnsek, I.: Modeling and Compensation of the Penetration Bias in InSAR DEMs of Ice Sheets at Different Frequencies, IEEE J. Sel. Top. Appl. Earth Obs., 13, 2698–2707, https://doi.org/10.1109/JSTARS.2020.2992530, 2020.
Fitzpatrick, A. A. W., Hubbard, A. L., Box, J. E., Quincey, D. J., van As, D., Mikkelsen, A. P. B., Doyle, S. H., Dow, C. F., Hasholt, B., and Jones, G. A.: A decade (2002–2012) of supraglacial lake volume estimates across Russell Glacier, West Greenland, The Cryosphere, 8, 107–121, https://doi.org/10.5194/tc-8-107-2014, 2014.
Georgiou, S., Shepherd, A., McMillan, M., and Nienow, P.: Seasonal evolution of supraglacial lake volume from ASTER imagery, Ann. Glaciol., 50, 95–100, https://doi.org/10.3189/172756409789624328, 2009.
Gjerde, G., Behn, M. D., Stevens, L. A., Das, S. B., and Joughin, I.: Seasonal drainage-system evolution beneath the Greenland Ice Sheet inferred from transient speed-up events, The Cryosphere, 19, 6149–6169, https://doi.org/10.5194/tc-19-6149-2025, 2025.
Gledhill, L. A. and Williamson, A. G.: Inland advance of supraglacial lakes in north-west Greenland under recent climatic warming, Ann. Glaciol., 59, 66–82, https://doi.org/10.1017/aog.2017.31, 2018.
Grinsted, A., Hvidberg, C. S., Lilien, D. A., Rathmann, N. M., Karlsson, N. B., Gerber, T., Kjær, H. A., Vallelonga, P., and Dahl-Jensen, D.: Accelerating ice flow at the onset of the Northeast Greenland Ice Stream, Nat. Commun., 13, 5589, https://doi.org/10.1038/s41467-022-32999-2, 2022.
Hallikainen, M., Ulaby, F., and Abdelrazik, M.: Dielectric properties of snow in the 3 to 37 GHz range, IEEE T. Antenn. Propag., 34, 1329–1340, https://doi.org/10.1109/TAP.1986.1143757, 1986.
Hochreuther, P., Neckel, N., Reimann, N., Humbert, A., and Braun, M.: Fully Automated Detection of Supraglacial Lake Area for Northeast Greenland Using Sentinel-2 Time-Series, Remote Sens., 13, 205, https://doi.org/10.3390/rs13020205, 2021.
Hoffman, M. J., Perego, M., Andrews, L. C., Price, S. F., Neumann, T. A., Johnson, J. V., Catania, G., and Lüthi, M. P.: Widespread Moulin Formation During Supraglacial Lake Drainages in Greenland, Geophys. Res. Lett., 45, 778–788, https://doi.org/10.1002/2017GL075659, 2018.
Hossain, E., Gani, M. O., Dunmire, D., Subramanian, A. C., and Younas, H.: Time Series Classification of Supraglacial Lakes Evolution over Greenland Ice Sheet, in: 2024 International Conference on Machine Learning and Applications (ICMLA), 2024 International Conference on Machine Learning and Applications (ICMLA), 490–497, https://doi.org/10.1109/ICMLA61862.2024.00072, 2024.
How, P., Benn, D. I., Hulton, N. R. J., Hubbard, B., Luckman, A., Sevestre, H., van Pelt, W. J. J., Lindbäck, K., Kohler, J., and Boot, W.: Rapidly changing subglacial hydrological pathways at a tidewater glacier revealed through simultaneous observations of water pressure, supraglacial lakes, meltwater plumes and surface velocities, The Cryosphere, 11, 2691–2710, https://doi.org/10.5194/tc-11-2691-2017, 2017.
Howat, I.: MEaSUREs Greenland Ice Mapping Project (GIMP) Land Ice and Ocean Classification Mask (NSIDC-0714, Version 1), Boulder, Colorado USA, NASA National Snow and Ice Data Center Distributed Active Archive Center [data set], https://doi.org/10.5067/B8X58MQBFUPA, 2017.
Howat, I. M., de la Peña, S., van Angelen, J. H., Lenaerts, J. T. M., and van den Broeke, M. R.: Brief Communication “Expansion of meltwater lakes on the Greenland Ice Sheet”, The Cryosphere, 7, 201–204, https://doi.org/10.5194/tc-7-201-2013, 2013.
Howat, I. M., Negrete, A., and Smith, B. E.: The Greenland Ice Mapping Project (GIMP) land classification and surface elevation data sets, The Cryosphere, 8, 1509–1518, https://doi.org/10.5194/tc-8-1509-2014, 2014.
Humbert, A., Helm, V., Zeising, O., Neckel, N., Braun, M. H., Khan, S. A., Rückamp, M., Steeb, H., Sohn, J., Bohnen, M., and Müller, R.: Insights into supraglacial lake drainage dynamics: triangular fracture formation, reactivation and long-lasting englacial features, The Cryosphere, 19, 3009–3032, https://doi.org/10.5194/tc-19-3009-2025, 2025.
Ignéczi, Á., Sole, A. J., Livingstone, S. J., Leeson, A. A., Fettweis, X., Selmes, N., Gourmelen, N., and Briggs, K.: Northeast sector of the Greenland Ice Sheet to undergo the greatest inland expansion of supraglacial lakes during the 21st century, Geophys. Res. Lett., 43, 9729–9738, https://doi.org/10.1002/2016GL070338, 2016.
Jiang, D., Li, X., Zhang, K., Marinsek, S., Hong, W., and Wu, Y.: Automatic Supraglacial Lake Extraction in Greenland Using Sentinel-1 SAR Images and Attention-Based U-Net, Remote Sens., 14, 4998, https://doi.org/10.3390/rs14194998, 2022.
Johansson, A. M. and Brown, I. A.: Observations of supra-glacial lakes in west Greenland using winter wide swath Synthetic Aperture Radar, Remote Sens. Lett., 3, 531–539, https://doi.org/10.1080/01431161.2011.637527, 2012.
Johansson, A. M., Jansson, P., and Brown, I. A.: Spatial and temporal variations in lakes on the Greenland Ice Sheet, J. Hydrol., 476, 314–320, https://doi.org/10.1016/j.jhydrol.2012.10.045, 2013.
Joughin, I.: MEaSUREs Greenland 6 and 12 day Ice Sheet Velocity Mosaics from SAR. (NSIDC-0766, Version 2), Boulder, Colorado USA, NASA National Snow and Ice Data Center Distributed Active Archive Center [data set], https://doi.org/10.5067/1AMEDB6VJ1NZ, 2022.
Joughin, I.: MEaSUREs Greenland Monthly Ice Sheet Velocity Mosaics from SAR and Landsat (NSIDC-0731, Version 5), Boulder, Colorado USA, NASA National Snow and Ice Data Center Distributed Active Archive Center [data set], https://doi.org/10.5067/EGKZX6FXXM4P, 2023.
Joughin, I., Shean, D. E., Smith, B. E., and Dutrieux, P.: Grounding line variability and subglacial lake drainage on Pine Island Glacier, Antarctica, Geophys. Res. Lett., 43, 9093–9102, https://doi.org/10.1002/2016GL070259, 2016a.
Joughin, I., Smith, B., Howat, I., and Scambos, T.: MEaSUREs Multi-year Greenland Ice Sheet Velocity Mosaic (NSIDC-0670, Version 1), Boulder, Colorado USA, NASA National Snow and Ice Data Center Distributed Active Archive Center [data set], https://doi.org/10.5067/QUA5Q9SVMSJG, 2016b.
Kanzow, T., Humbert, A., Mölg, T., Scheinert, M., Braun, M., Burchard, H., Doglioni, F., Hochreuther, P., Horwath, M., Huhn, O., Kappelsberger, M., Kusche, J., Loebel, E., Lutz, K., Marzeion, B., McPherson, R., Mohammadi-Aragh, M., Möller, M., Pickler, C., Reinert, M., Rhein, M., Rückamp, M., Schaffer, J., Shafeeque, M., Stolzenberger, S., Timmermann, R., Turton, J., Wekerle, C., and Zeising, O.: The system of atmosphere, land, ice and ocean in the region near the 79N Glacier in northeast Greenland: synthesis and key findings from the Greenland Ice Sheet–Ocean Interaction (GROCE) experiment, The Cryosphere, 19, 1789–1824, https://doi.org/10.5194/tc-19-1789-2025, 2025.
Khan, S. A., Choi, Y., Morlighem, M., Rignot, E., Helm, V., Humbert, A., Mouginot, J., Millan, R., Kjær, K. H., and Bjørk, A. A.: Extensive inland thinning and speed-up of Northeast Greenland Ice Stream, Nature, 611, 727–732, https://doi.org/10.1038/s41586-022-05301-z, 2022.
Koenig, L. S., Lampkin, D. J., Montgomery, L. N., Hamilton, S. L., Turrin, J. B., Joseph, C. A., Moutsafa, S. E., Panzer, B., Casey, K. A., Paden, J. D., Leuschen, C., and Gogineni, P.: Wintertime storage of water in buried supraglacial lakes across the Greenland Ice Sheet, The Cryosphere, 9, 1333–1342, https://doi.org/10.5194/tc-9-1333-2015, 2015.
König, M., Winther, J.-G., and Isaksson, E.: Measuring snow and glacier ice properties from satellite, Rev. Geophys., 39, 1–27, https://doi.org/10.1029/1999RG000076, 2001.
Kroupnik, G., De Lisle, D., Côté, S., Lapointe, M., Casgrain, C., and Fortier, R.: RADARSAT Constellation Mission Overview and Status, in: 2021 IEEE Radar Conference (RadarConf21), 2021 IEEE Radar Conference (RadarConf21), 1–5, https://doi.org/10.1109/RadarConf2147009.2021.9455298, 2021.
Lai, C.-Y., Stevens, L. A., Chase, D. L., Creyts, T. T., Behn, M. D., Das, S. B., and Stone, H. A.: Hydraulic transmissivity inferred from ice-sheet relaxation following Greenland supraglacial lake drainages, Nat. Commun., 12, 3955, https://doi.org/10.1038/s41467-021-24186-6, 2021.
Lampkin, D. J. and VanderBerg, J.: A preliminary investigation of the influence of basal and surface topography on supraglacial lake distribution near Jakobshavn Isbrae, western Greenland, Hydrol. Process., 25, 3347–3355, https://doi.org/10.1002/hyp.8170, 2011.
Lampkin, D. J., Koenig, L., Joseph, C., and Box, J. E.: Investigating Controls on the Formation and Distribution of Wintertime Storage of Water in Supraglacial Lakes, Front. Earth Sci., 8, https://doi.org/10.3389/feart.2020.00370, 2020.
Law, R., Arnold, N., Benedek, C., Tedesco, M., Banwell, A., and Willis, I.: Over-winter persistence of supraglacial lakes on the Greenland Ice Sheet: results and insights from a new model, J. Glaciol., 66, 362–372, https://doi.org/10.1017/jog.2020.7, 2020.
Leeson, A. A., Shepherd, A., Briggs, K., Howat, I., Fettweis, X., Morlighem, M., and Rignot, E.: Supraglacial lakes on the Greenland ice sheet advance inland under warming climate, Nat. Clim. Change, 5, 51–55, https://doi.org/10.1038/nclimate2463, 2015.
Legleiter, C. J., Tedesco, M., Smith, L. C., Behar, A. E., and Overstreet, B. T.: Mapping the bathymetry of supraglacial lakes and streams on the Greenland ice sheet using field measurements and high-resolution satellite images, The Cryosphere, 8, 215–228, https://doi.org/10.5194/tc-8-215-2014, 2014.
Lemos, A., Shepherd, A., McMillan, M., Hogg, A. E., Hatton, E., and Joughin, I.: Ice velocity of Jakobshavn Isbræ, Petermann Glacier, Nioghalvfjerdsfjorden, and Zachariæ Isstrøm, 2015–2017, from Sentinel 1-a/b SAR imagery, The Cryosphere, 12, 2087–2097, https://doi.org/10.5194/tc-12-2087-2018, 2018.
Liang, Y.-L., Colgan, W., Lv, Q., Steffen, K., Abdalati, W., Stroeve, J., Gallaher, D., and Bayou, N.: A decadal investigation of supraglacial lakes in West Greenland using a fully automatic detection and tracking algorithm, Remote Sens. Environ., 123, 127–138, https://doi.org/10.1016/j.rse.2012.03.020, 2012.
Livingstone, S. J., Clark, C. D., Woodward, J., and Kingslake, J.: Potential subglacial lake locations and meltwater drainage pathways beneath the Antarctic and Greenland ice sheets, The Cryosphere, 7, 1721–1740, https://doi.org/10.5194/tc-7-1721-2013, 2013.
Lu, Y., Yang, K., Lu, X., Li, Y., Gao, S., Mao, W., and Li, M.: Response of supraglacial rivers and lakes to ice flow and surface melt on the northeast Greenland ice sheet during the 2017 melt season, J. Hydrol., 602, 126750, https://doi.org/10.1016/j.jhydrol.2021.126750, 2021.
Lutz, K., Bahrami, Z., and Braun, M.: Supraglacial Lake Evolution over Northeast Greenland Using Deep Learning Methods, Remote Sens., 15, 4360, https://doi.org/10.3390/rs15174360, 2023.
Lutz, K., Tabone, I., Humbert, A., and Braun, M. H.: Rapid drainages of supraglacial lakes in Northeast Greenland from 2016–2022 observed through Sentinel-2 imagery, PANGAEA [data set], https://doi.org/10.1594/PANGAEA.973446, 2024.
Lutz, K., Tabone, I., Humbert, A., and Braun, M.: Multi-annual patterns of rapidly draining supraglacial lakes in Northeast Greenland, The Cryosphere, 19, 2601–2614, https://doi.org/10.5194/tc-19-2601-2025, 2025.
Mahmud, M. S., Geldsetzer, T., Howell, S. E. L., Yackel, J. J., Nandan, V., and Scharien, R. K.: Incidence Angle Dependence of HH-Polarized C- and L-Band Wintertime Backscatter Over Arctic Sea Ice, IEEE T. Geosci. Remote, 56, 6686–6698, https://doi.org/10.1109/TGRS.2018.2841343, 2018.
Maier, N., Andersen, J. K., Mouginot, J., Gimbert, F., and Gagliardini, O.: Wintertime Supraglacial Lake Drainage Cascade Triggers Large-Scale Ice Flow Response in Greenland, Geophys. Res. Lett., 50, e2022GL102251, https://doi.org/10.1029/2022GL102251, 2023.
Mayaud, J. R., Banwell, A. F., Arnold, N. S., and Willis, I. C.: Modeling the response of subglacial drainage at Paakitsoq, west Greenland, to 21st century climate change, J. Geophys. Res.-Earth Surf., 119, 2619–2634, https://doi.org/10.1002/2014JF003271, 2014.
McMillan, M., Nienow, P., Shepherd, A., Benham, T., and Sole, A.: Seasonal evolution of supra-glacial lakes on the Greenland Ice Sheet, Earth Planet. Sc. Lett., 262, 484–492, https://doi.org/10.1016/j.epsl.2007.08.002, 2007.
Miège, C., Forster, R. R., Brucker, L., Koenig, L. S., Solomon, D. K., Paden, J. D., Box, J. E., Burgess, E. W., Miller, J. Z., McNerney, L., Brautigam, N., Fausto, R. S., and Gogineni, S.: Spatial extent and temporal variability of Greenland firn aquifers detected by ground and airborne radars, J. Geophys. Res.-Earth Surf., 121, 2381–2398, https://doi.org/10.1002/2016JF003869, 2016.
Miles, K. E., Willis, I. C., Benedek, C. L., Williamson, A. G., and Tedesco, M.: Toward Monitoring Surface and Subsurface Lakes on the Greenland Ice Sheet Using Sentinel-1 SAR and Landsat-8 OLI Imagery, Front. Earth Sci., 5, 58, https://doi.org/10.3389/feart.2017.00058, 2017.
Millan, R., Jager, E., Mouginot, J., Wood, M. H., Larsen, S. H., Mathiot, P., Jourdain, N. C., and Bjørk, A.: Rapid disintegration and weakening of ice shelves in North Greenland, Nat. Commun., 14, 6914, https://doi.org/10.1038/s41467-023-42198-2, 2023.
Miller, J. Z., Culberg, R., Long, D. G., Shuman, C. A., Schroeder, D. M., and Brodzik, M. J.: An empirical algorithm to map perennial firn aquifers and ice slabs within the Greenland Ice Sheet using satellite L-band microwave radiometry, The Cryosphere, 16, 103–125, https://doi.org/10.5194/tc-16-103-2022, 2022.
Morlighem, M., Williams, C. N., Rignot, E., An, L., Arndt, J. E., Bamber, J. L., Catania, G., Chauché, N., Dowdeswell, J. A., Dorschel, B., Fenty, I., Hogan, K., Howat, I., Hubbard, A., Jakobsson, M., Jordan, T. M., Kjeldsen, K. K., Millan, R., Mayer, L., Mouginot, J., Noël, B. P. Y., O'Cofaigh, C., Palmer, S., Rysgaard, S., Seroussi, H., Siegert, M. J., Slabon, P., Straneo, F., van den Broeke, M. R., Weinrebe, W., Wood, M., and Zinglersen, K. B.: BedMachine v3: Complete Bed Topography and Ocean Bathymetry Mapping of Greenland From Multibeam Echo Sounding Combined With Mass Conservation, Geophys. Res. Lett., 44, 11051–11061, https://doi.org/10.1002/2017GL074954, 2017.
Morlighem, M., Williams, C., Rignot, E., An, L., Arndt, J. E., Bamber, J., Catania, G., Chauché, N., Dowdeswell, J. A., Dorschel, B., Fenty, I., Hogan, K., Howat, I., Hubbard, A., Jakobsson, M., Jordan, T. M., Kjeldsen, K. K., Millan, R., Mayer, L., Mouginot, J., Noël, B., O'Cofaigh, C., Palmer, S. J., Rysgaard, S., Seroussi, H., Siegert, M. J., Slabon, P., Straneo, F., van den Broeke, M. R., Weinrebe, W., Wood, M., and Zinglersen, K.: IceBridge BedMachine Greenland (IDBMG4, Version 5), Boulder, Colorado USA, NASA National Snow and Ice Data Center Distributed Active Archive Center [data set], https://doi.org/10.5067/GMEVBWFLWA7X, 2022.
Morriss, B. F., Hawley, R. L., Chipman, J. W., Andrews, L. C., Catania, G. A., Hoffman, M. J., Lüthi, M. P., and Neumann, T. A.: A ten-year record of supraglacial lake evolution and rapid drainage in West Greenland using an automated processing algorithm for multispectral imagery, The Cryosphere, 7, 1869–1877, https://doi.org/10.5194/tc-7-1869-2013, 2013.
Mouginot, J. and Rignot, E.: Glacier catchments/basins for the Greenland Ice Sheet, Dryad [data set], https://doi.org/10.7280/D1WT11, 2019.
Mouginot, J., Rignot, E., Scheuchl, B., Fenty, I., Khazendar, A., Morlighem, M., Buzzi, A., and Paden, J.: Fast retreat of Zachariæ Isstrøm, northeast Greenland, Science, 350, 1357–1361, https://doi.org/10.1126/science.aac7111, 2015.
Mouginot, J., Rignot, E., Bjørk, A. A., van den Broeke, M., Millan, R., Morlighem, M., Noël, B., Scheuchl, B., and Wood, M.: Forty-six years of Greenland Ice Sheet mass balance from 1972 to 2018, P. Natl. Acad. Sci. USA, 116, 9239–9244, https://doi.org/10.1073/pnas.1904242116, 2019.
Neckel, N., Zeising, O., Steinhage, D., Helm, V., and Humbert, A.: Seasonal Observations at 79° N Glacier (Greenland) From Remote Sensing and in situ Measurements, Front. Earth Sci., 8, https://doi.org/10.3389/feart.2020.00142, 2020.
Noh, M.-J. and Howat, I. M.: Automated stereo-photogrammetric DEM generation at high latitudes: Surface Extraction with TIN-based Search-space Minimization (SETSM) validation and demonstration over glaciated regions, Geosci. Remote Sens., 52, 198–217, https://doi.org/10.1080/15481603.2015.1008621, 2015.
O'Callaghan, J. F. and Mark, D. M.: The extraction of drainage networks from digital elevation data, Comput. Vision Graph., 28, 323–344, https://doi.org/10.1016/S0734-189X(84)80011-0, 1984.
Otto, J., Holmes, F. A., and Kirchner, N.: Supraglacial lake expansion, intensified lake drainage frequency, and first observation of coupled lake drainage, during 1985–2020 at Ryder Glacier, Northern Greenland, Front. Earth Sci., 10, https://doi.org/10.3389/feart.2022.978137, 2022.
Poinar, K. and Andrews, L. C.: Challenges in predicting Greenland supraglacial lake drainages at the regional scale, The Cryosphere, 15, 1455–1483, https://doi.org/10.5194/tc-15-1455-2021, 2021.
Poinar, K., Joughin, I., Das, S. B., Behn, M. D., Lenaerts, J. T. M., and van den Broeke, M. R.: Limits to future expansion of surface-melt-enhanced ice flow into the interior of western Greenland, Geophys. Res. Lett., 42, 1800–1807, https://doi.org/10.1002/2015GL063192, 2015.
Pope, A., Scambos, T. A., Moussavi, M., Tedesco, M., Willis, M., Shean, D., and Grigsby, S.: Estimating supraglacial lake depth in West Greenland using Landsat 8 and comparison with other multispectral methods, The Cryosphere, 10, 15–27, https://doi.org/10.5194/tc-10-15-2016, 2016.
Porter, C., Howat, I., Noh, M.-J., Husby, E., Khuvis, S., Danish, E., Tomko, K., Gardiner, J., Negrete, A., Yadav, B., Klassen, J., Kelleher, C., Cloutier, M., Bakker, J., Enos, J., Arnold, G., Bauer, G., and Morin, P.: ArcticDEM – Strips, Version 4.1, Harvard Dataverse, V1 [data set], https://doi.org/10.7910/DVN/C98DVS, 2022.
Porter, C., Howat, I., Noh, M.-J., Husby, E., Khuvis, S., Danish, E., Tomko, K., Gardiner, J., Negrete, A., Yadav, B., Klassen, J., Kelleher, C., Cloutier, M., Bakker, J., Enos, J., Arnold, G., Bauer, G., and Morin, P.: ArcticDEM – Mosaics, Version 4.1, Harvard Dataverse, V1 [data set], https://doi.org/10.7910/DVN/3VDC4W, 2023.
Rignot, E., Echelmeyer, K., and Krabill, W.: Penetration depth of interferometric synthetic-aperture radar signals in snow and ice, Geophys. Res. Lett., 28, 3501–3504, https://doi.org/10.1029/2000GL012484, 2001.
Rignot, E., Koppes, M., and Velicogna, I.: Rapid submarine melting of the calving faces of West Greenland glaciers, Nat. Geosci., 3, 187–191, https://doi.org/10.1038/ngeo765, 2010.
Scharien, R. K. and Nasonova, S.: Incidence Angle Dependence of Texture Statistics From Sentinel-1 HH-Polarization Images of Winter Arctic Sea Ice, IEEE Geosci. Remote Sens. Lett., 19, 1–5, https://doi.org/10.1109/LGRS.2020.3039739, 2022.
Schröder, L., Neckel, N., Zindler, R., and Humbert, A.: Perennial Supraglacial Lakes in Northeast Greenland Observed by Polarimetric SAR, Remote Sens., 12, 2798, https://doi.org/10.3390/rs12172798, 2020.
Selmes, N., Murray, T., and James, T. D.: Fast draining lakes on the Greenland Ice Sheet, Geophys. Res. Lett., 38, https://doi.org/10.1029/2011GL047872, 2011.
Shepherd, A., Ivins, E., Rignot, E., Smith, B., van den Broeke, M., Velicogna, I., Whitehouse, P., Briggs, K., Joughin, I., Krinner, G., Nowicki, S., Payne, T., Scambos, T., Schlegel, N., A, G., Agosta, C., Ahlstrøm, A., Babonis, G., Barletta, V. R., Bjørk, A. A., Blazquez, A., Bonin, J., Colgan, W., Csatho, B., Cullather, R., Engdahl, M. E., Felikson, D., Fettweis, X., Forsberg, R., Hogg, A. E., Gallee, H., Gardner, A., Gilbert, L., Gourmelen, N., Groh, A., Gunter, B., Hanna, E., Harig, C., Helm, V., Horvath, A., Horwath, M., Khan, S., Kjeldsen, K. K., Konrad, H., Langen, P. L., Lecavalier, B., Loomis, B., Luthcke, S., McMillan, M., Melini, D., Mernild, S., Mohajerani, Y., Moore, P., Mottram, R., Mouginot, J., Moyano, G., Muir, A., Nagler, T., Nield, G., Nilsson, J., Noël, B., Otosaka, I., Pattle, M. E., Peltier, W. R., Pie, N., Rietbroek, R., Rott, H., Sandberg Sørensen, L., Sasgen, I., Save, H., Scheuchl, B., Schrama, E., Schröder, L., Seo, K.-W., Simonsen, S. B., Slater, T., Spada, G., Sutterley, T., Talpe, M., Tarasov, L., van de Berg, W. J., van der Wal, W., van Wessem, M., Vishwakarma, B. D., Wiese, D., Wilton, D., Wagner, T., Wouters, B., Wuite, J., and The IMBIE Team: Mass balance of the Greenland Ice Sheet from 1992 to 2018, Nature, 579, 233–239, https://doi.org/10.1038/s41586-019-1855-2, 2020.
Shreve, R. L.: Movement of Water in Glaciers, J. Glaciol., 11, 205–214, https://doi.org/10.3189/S002214300002219X, 1972.
Smith, B. E., Gourmelen, N., Huth, A., and Joughin, I.: Connected subglacial lake drainage beneath Thwaites Glacier, West Antarctica, The Cryosphere, 11, 451–467, https://doi.org/10.5194/tc-11-451-2017, 2017.
Sneed, W. A. and Hamilton, G. S.: Evolution of melt pond volume on the surface of the Greenland Ice Sheet, Geophys. Res. Lett., 34, https://doi.org/10.1029/2006GL028697, 2007.
Stevens, L. A., Behn, M. D., McGuire, J. J., Das, S. B., Joughin, I., Herring, T., Shean, D. E., and King, M. A.: Greenland supraglacial lake drainages triggered by hydrologically induced basal slip, Nature, 522, 73–76, https://doi.org/10.1038/nature14480, 2015.
Stevens, L. A., Nettles, M., Davis, J. L., Creyts, T. T., Kingslake, J., Hewitt, I. J., and Stubblefield, A.: Tidewater-glacier response to supraglacial lake drainage, Nat. Commun., 13, 6065, https://doi.org/10.1038/s41467-022-33763-2, 2022.
Stevens, L. A., Das, S. B., Behn, M. D., McGuire, J. J., Lai, C.-Y., Joughin, I., Larochelle, S., and Nettles, M.: Elastic Stress Coupling Between Supraglacial Lakes, J. Geophys. Res.-Earth Surf., 129, e2023JF007481, https://doi.org/10.1029/2023JF007481, 2024.
Sundal, A. V., Shepherd, A., Nienow, P., Hanna, E., Palmer, S., and Huybrechts, P.: Evolution of supra-glacial lakes across the Greenland Ice Sheet, Remote Sens. Environ., 113, 2164–2171, https://doi.org/10.1016/j.rse.2009.05.018, 2009.
Tedesco, M., Lüthje, M., Steffen, K., Steiner, N., Fettweis, X., Willis, I., Bayou, N., and Banwell, A.: Measurement and modeling of ablation of the bottom of supraglacial lakes in western Greenland, Geophys. Res. Lett., 39, https://doi.org/10.1029/2011GL049882, 2012.
Tedesco, M., Willis, I. C., Hoffman, M. J., Banwell, A. F., Alexander, P., and Arnold, N. S.: Ice dynamic response to two modes of surface lake drainage on the Greenland ice sheet, Environ. Res. Lett., 8, 034007, https://doi.org/10.1088/1748-9326/8/3/034007, 2013.
Tedstone, A. J., Nienow, P. W., Sole, A. J., Mair, D. W. F., Cowton, T. R., Bartholomew, I. D., and King, M. A.: Greenland ice sheet motion insensitive to exceptional meltwater forcing, P. Natl. Acad. Sci. USA, 110, 19719–19724, https://doi.org/10.1073/pnas.1315843110, 2013.
Turton, J. V., Hochreuther, P., Reimann, N., and Blau, M. T.: The distribution and evolution of supraglacial lakes on 79° N Glacier (north-eastern Greenland) and interannual climatic controls, The Cryosphere, 15, 3877–3896, https://doi.org/10.5194/tc-15-3877-2021, 2021.
Ulaby, F. T., Stiles, W. H., and Abdelrazik, M.: Snowcover Influence on Backscattering from Terrain, IEEE T. Geosci. Remote, GE-22, 126–133, https://doi.org/10.1109/TGRS.1984.350604, 1984.
Williamson, A. G., Banwell, A. F., Willis, I. C., and Arnold, N. S.: Dual-satellite (Sentinel-2 and Landsat 8) remote sensing of supraglacial lakes in Greenland, The Cryosphere, 12, 3045–3065, https://doi.org/10.5194/tc-12-3045-2018, 2018a.
Williamson, A. G., Willis, I. C., Arnold, N. S., and Banwell, A. F.: Controls on rapid supraglacial lake drainage in West Greenland: an Exploratory Data Analysis approach, J. Glaciol., 64, 208–226, https://doi.org/10.1017/jog.2018.8, 2018b.
Yang, K. and Smith, L. C.: Supraglacial Streams on the Greenland Ice Sheet Delineated From Combined Spectral–Shape Information in High-Resolution Satellite Imagery, IEEE Geosci. Remote Sens. Lett., 10, 801–805, https://doi.org/10.1109/LGRS.2012.2224316, 2013.
Yang, K., Smith, L. C., Fettweis, X., Gleason, C. J., Lu, Y., and Li, M.: Surface meltwater runoff on the Greenland ice sheet estimated from remotely sensed supraglacial lake infilling rate, Remote Sens. Environ., 234, 111459, https://doi.org/10.1016/j.rse.2019.111459, 2019.
Zeising, O., Neckel, N., Dörr, N., Helm, V., Steinhage, D., Timmermann, R., and Humbert, A.: Extreme melting at Greenland's largest floating ice tongue, The Cryosphere, 18, 1333–1357, https://doi.org/10.5194/tc-18-1333-2024, 2024.
Zheng, L., Li, L., Chen, Z., He, Y., Mo, L., Chen, D., Hu, Q., Wang, L., Liang, Q., and Cheng, X.: Multi-sensor imaging of winter buried lakes in the Greenland Ice Sheet, Remote Sens. Environ., 295, 113688, https://doi.org/10.1016/j.rse.2023.113688, 2023.