the Creative Commons Attribution 4.0 License.
the Creative Commons Attribution 4.0 License.
 | 03 Dec 2025
Greenland supraglacial catchment consolidation by streams breaching drainage divides
Jason Gulley
Celia Trunz
Charles Breithaupt
Matthew Covington
Internally drained catchments define the ice surface area draining into a moulin. Supraglacial catchment areas are thought to be controlled by the influence of basal topography on the ice surface, which produce static, topographically defined catchment areas draining into a single moulin. Our observations of lakes overtopping drainage divides, fluvial incision through those drainage divides and connection of previously isolated adjacent lake basins suggests that supraglacial drainage basins are more complicated. Here, we document interannual variability in the size, shape, and density of catchments in a 31.7 km2 area by mapping supraglacial streams within three mid-elevation catchments on the Paakitsoq Region of the Greenland Ice Sheet in 2017–2019. In two of the three catchments, snow-infill of the previous year's incised streams diverted meltwater flow away from relic moulins, which rerouted flow over topographic divides and created new incised channels that flowed downstream against the surface topographic gradient and drained in to different moulins than in the previous year. Catchment consolidation resulted the growth of our central catchment from 8.2 km2 in 2017, to 27.8 km2 in 2018, and 31.7 km2 in 2019, an area increase of 387 % that was coincident with a decrease in the number of catchments, and moulins. Our results highlight that wintertime snowplug formation in deeply incised relic supraglacial channels can change catchment-scale supraglacial hydrology and potentially impact hydrodynamic coupling across large areas of the ice sheet by turning moulins on and off.
- Article
(22429 KB) - Full-text XML
- BibTeX
- EndNote


Mass loss from the Greenland Ice Sheet (GrIS) has been accelerating since the 1990's in response to climatic warming, and the GrIS has become one of the largest contributors to global sea level rise. The GrIS loses mass through meltwater runoff and dynamically through iceberg calving. While often treated separately, melting and ice dynamics are linked because moulins allow meltwater to reach the base of the ice sheet where it can alter subglacial water pressures and modulate sliding (Sundal et al., 2011). Although the supraglacial hydrological system regulates the timing and magnitude of meltwater inputs to the bed (McGrath et al., 2011; Mejia et al., 2022; Smith et al., 2015; Willis et al., 2002; Yang et al., 2018), relatively little attention has been directed towards understanding the processes that govern the supraglacial drainage system.
Most of the meltwater produced on the GrIS surface collects within complex networks of supraglacial streams and rivers that transport meltwater downslope before terminating in moulins (Smith et al., 2015; Yang et al., 2016). Each stream network terminating into a single moulin is termed an internally drained catchment (IDC) (Yang and Smith, 2016), the area and shapes of which control the timing and volume of meltwater delivered to moulins (Banwell et al., 2013, 2016; McGrath et al., 2011; Mejia et al., 2022; Smith et al., 2015; Willis et al., 2002; Yang et al., 2018). Catchment geometry is largely dependent upon ice surface topography (Crozier et al., 2018; Karlstrom and Yang, 2016; Leeson et al., 2012), which, over large length-scales (∼ 1–10 km), is controlled by the transfer of bed topography to the ice surface (Gudmundsson, 2003; Ignéczi et al., 2018; Lampkin, 2011; Raymond et al., 1995). Depressions at the bed roughly correspond to surficial depressions that form individual drainage basins that maintain their positions rather than advecting downglacier with ice flow (Echelmeyer et al., 1991; Morriss et al., 2013). In the absence of crevasses or moulins, meltwater will collect in surface depressions to form supraglacial lakes. These lakes can drain either quickly through new crevasses that intersect the lake (Mejía et al., 2021; Morriss et al., 2013) or slowly by flowing into neighboring catchments. Slow supraglacial lake drainage occurs when the lake water level surpasses the lowest elevation point of the drainage divide surrounding the lake and initiates a spillover event wherein lake water will thermally incise a channel through the drainage divide (Tedesco et al., 2013). Notably, thermally incised channels have been documented cutting through topographic divides separating individual drainage basins in Greenland (Smith et al., 2015; Yang et al., 2015) and on alpine glaciers (Gulley et al., 2009). Ultimately, channels incised through drainage divides allow water to enter into neighboring drainage basins where it will continue to flow downslope until reaching a crevasse or a moulin.
Moulin locations are typically regarded as static, either reactivating annually as ice advects downglacier (Andrews, 2015; Catania and Neumann, 2010) or forming within new crevasses that open in the same areas of high extensional strain. The pronounced influence of static basal topography on moulin locations, ice surface topography, and drainage network architecture underlies the widely held assumption that IDCs are spatially fixed from year to year (Yang et al., 2016). While the fluvial incision of meltwater channels can alter ice surface topography over short distances on the order of a few hundred meters, fluvial incision is not thought to impact catchment-scale flow routing because of the overwhelming adherence of stream flow to larger-scale ice surface topography (Crozier et al., 2018; Karlstrom and Yang, 2016).
Here we report on the coalescence of three neighboring catchments located in the Paakitsoq region of west Greenland between 2017 and 2019. We document interannual variability in the flow of the largest supraglacial streams and in terminal moulin location within each catchment by conducting roving differential-GPS (dGPS) surveys complemented with satellite remote sensing products. We find that snowplug formation within relic incised channels can divert flow away from previously active moulins, causing meltwater to collect within lakes or local depressions until it overflowed a drainage divide and connected the two previously isolated drainage basins through fluvial incision. Despite the short distances over which thermally incised channels directed flow in opposition to the slope of large-scale ice topography as they cut through drainage divides, overflow and incision was responsible for the coalescence of three previously isolated catchments over three years.
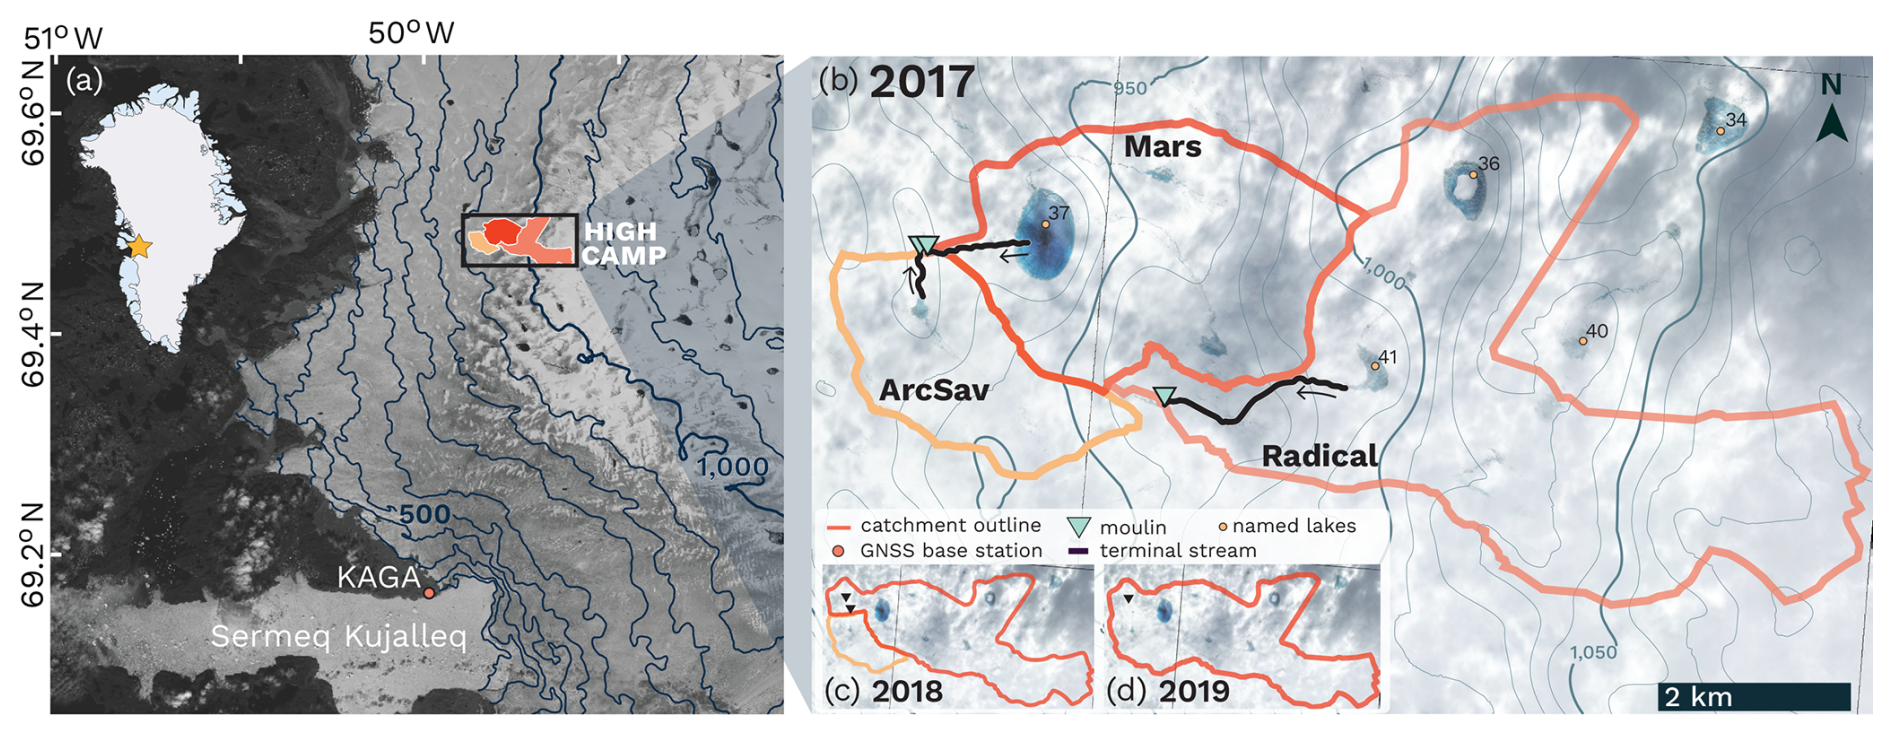
Figure 1High Camp field site, Paakitsoq region of the western Greenland Ice Sheet. (a) Landsat-8 imagery courtesy of the US Geological Survey, acquired 21 July 2018, showing the location of our field site High Camp within Sermeq Avannarleq. Surface elevation contours derived from ArcticDEM in m above the WGS84 ellipsoid. (b–d) WorldView imagery 3 July 2017 (© 2017 Maxar) overlaid with 2017 catchment boundaries. The highest-order stream for each catchment are traced in purple, flow direction indicated with arrows, and terminal moulins are marked with triangles. Morriss et al. (2013) named lakes (dots). Catchment outlines for (c) 2018 and (d) 2019 with terminal moulin locations (triangles).
During the 2017 and 2018 melt seasons, we established a field camp adjacent to three mid-elevation (920–1090 m) catchments in the ablation area of Sermeq Avannarleq in western Greenland, ∼ 11 km from the ice margin (Fig. 1). The three catchments were selected because they balanced team safety and operational ease with the scientific goals: they were the highest elevation catchments below the snowline at the time of camp installation on 29 July 2017. The three catchments occupied a total area of 32 km2 (see Sect. 2.2 for a description of catchment delineation). Each catchment contained a supraglacial lake known to drain slowly into moulins located outside of the lake basin (Banwell et al., 2012; Covington et al., 2020; Mejia et al., 2022; Morriss et al., 2013).
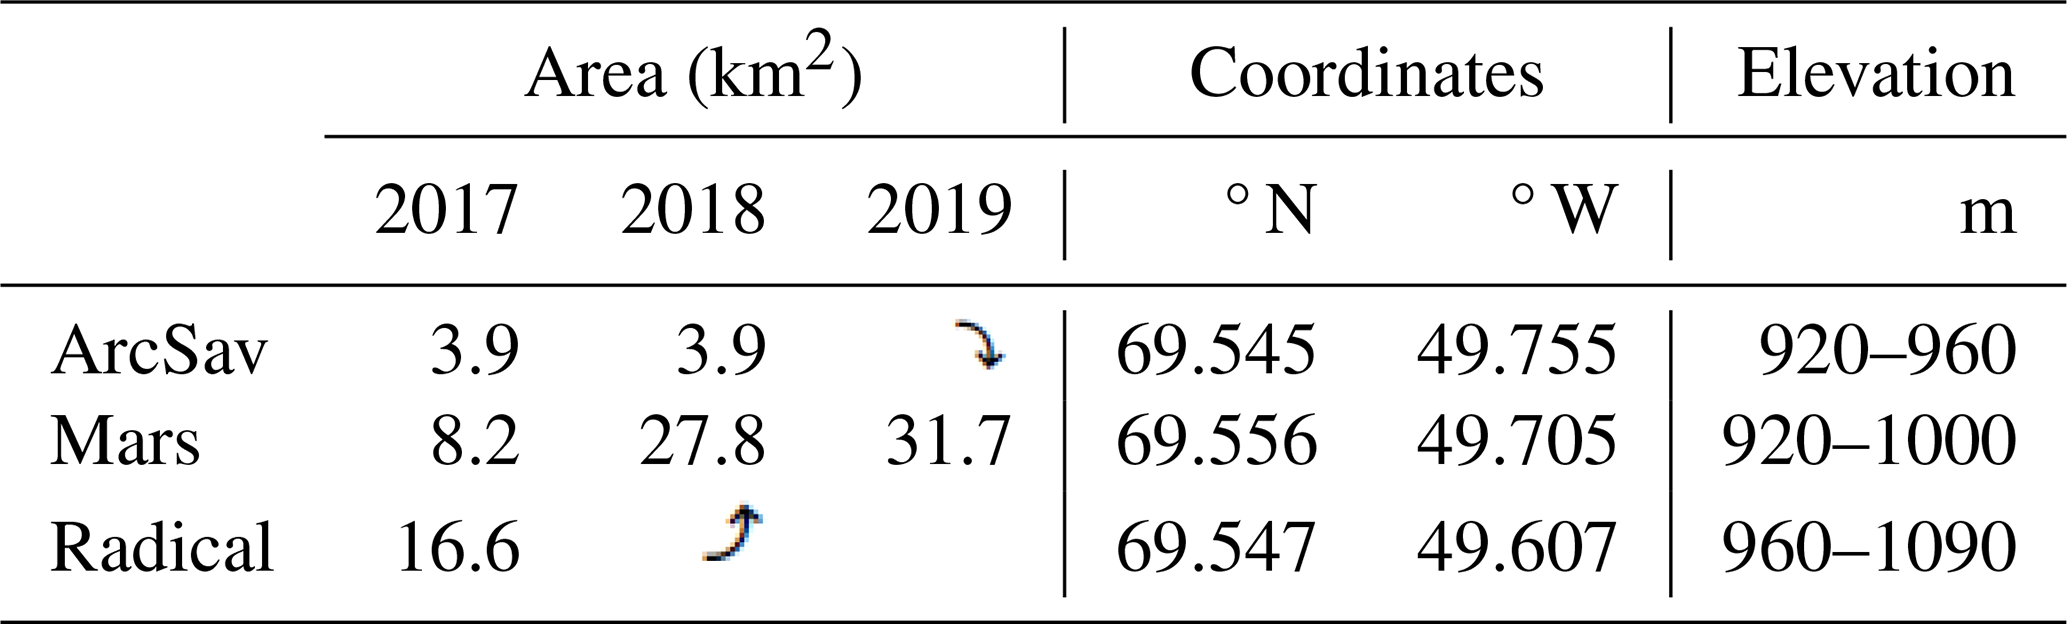
The smallest catchment, named ArcSav, drained an area of 3.9 km2 in 2017 and 2018 (Fig. 1, Table 1). ArcSav Catchment contained a single supraglacial lake, ArcSav Lake, located on the northern edge of the catchment at an elevation of ∼ 900 m above the WGS84 ellipsoid (69.5498° N, −49.7682° E). ArcSav Lake drained and refilled annually between 2017–2019 filling to a maximum area of 0.41 km2 in 2018 and draining into moulins to the north. The larger Mars Catchment was located on the eastern edge of ArcSav and drained an area of 8.2 km2 in 2017 (Fig. 1). Mars Catchment contained a perennial supraglacial lake, Mars Lake, at an elevation of 914–921 m which has reoccupied the same location since at least 2002 (Lake 37 in Morriss et al., 2013). In 2017–2019, Mars Lake drained through canyonized supraglacial streams originating at the western lake shoreline and terminating in moulins located outside of the basin containing Mars Lake. The largest catchment in this study, named Radical Catchment, bounded Mars Catchment to the southeast and drained an area of 16.6 km2 in 2017, spanning elevations of 960 to 1090 m (Table 1). In 2017–2019 Radical Catchment contained two perennial supraglacial lakes (36 and 41 in Morriss et al., 2013) at elevations greater than 20 m from the terminal moulin, Radical Moulin.
Table 1Catchment area, center coordinates, and elevation range. Curved arrows indicate the growth of Mars catchment at the expense of others, explaining the increase in catchment area.
2.1 Supraglacial stream mapping
We mapped the highest-order supraglacial streams in each catchment within our study area to resolve elevation change along stream flow path using various field and/or remote sensing techniques. We employed three methods, (1) a ground-based roving differential GPS survey (high-precision), (2) ground-based stream mapping with a hand-held GPS (no vertical component) with elevations extracted from ArcticDEM, and (3) stream delineation from WorldView Imagery with elevations extracted from ArcticDEM. The methodology applied to each catchment was based on equipment availability and ability to safely access each stream. In 2019, only remote sensing tools were applied.
In 2017 we mapped the streams draining Mars Lake and ArcSav Lake from the lake shoreline to their respective terminal moulin (Fig. 1, Tables 1–2) by conducting a roving dGPS survey using a Trimble R7 receiver and a TRM41249.00 antenna mounted to a backpack. The receiver recorded measurements every five seconds as we traversed the edge of the supraglacial streams draining each lake. We paused every 50–100 meters along the transect to collect five or more position measurements to better constrain the vertical coordinate along the stream flow path. Positions were determined with TRACK software (Herring et al., 2010) that uses carrier-phase differential processing relative to base station KAGA which has a baseline length of 28 km (Fig. 1a). After post-processing, we corrected the vertical component of our position timeseries to account for the antenna elevation above the ice surface (2.019 m). The resulting timeseries have a relative vertical error of approximately 0.04 m, which is well below the measured elevation change, which exceeded 3 m during the transects (Mejia and Gulley, 2023).
In 2018, we mapped supraglacial streams in all three catchments using a Garmin In-Reach handheld GPS unit. We recorded positions at 40 to 50 m intervals along each stream traverse. Because Garmin inReach cannot accurately resolve the elevation associated with each position, we use the recorded positions to extract the elevation from the ArcticDEM strip digital elevation model (DEM). ArcticDEM utilizes submeter (0.32–0.5 m) resolution data from the Maxar constellation of optical imaging satellites (i.e., WorldView 1–3, and GeoEye-1 satellites) acquired in this case between 2008–2020. The resulting DEM produces elevations referenced to the WGS84 ellipsoid with a spatial resolution of 2 m, an internal vertical accuracy of 0.2 m, and an absolute accuracy of 4 m. We find good agreement between ArcticDEM elevations and those measured by three on-ice GNSS stations in August 2018, however, ArcticDEM under-predicted elevations by 1.02 m averaged over the three stations. Throughout this manuscript we report all elevations in meters above the WGS84 ellipsoid. We also utilize this methodology for ArcSav and Mars Lake drainage paths in 2017 to compare ArcticDEM elevations with those directly measured in the field.
In 2019, and for Radical River in 2017 due to the difficulty of stream access, we utilized a fully remote method of stream mapping and elevation determination, leveraging the high-resolution of available WorldView imagery. We mapped supraglacial streams in QGIS from WorldView-1 imagery acquired on 3 July 2017 (0.5 m resolution), for Radical River in 2017, an WorldView-3 Imagery acquired on 8 June 2019 (0.3 m resolution). The highest order (largest) supraglacial streams in our study area had widths that exceeded 3 m, well above the imagery resolution. We therefore were able to manually delineate each stream in QGIS at a 1:1000 scale. The QGIS plug-in Q-chainage was used to extract point positions along the stream flowpath every 50 m. These positions were then used along with the QGIS Point Sampling Tool to extract ArcticDEM elevations along the stream flowpaths following the procedure described above.
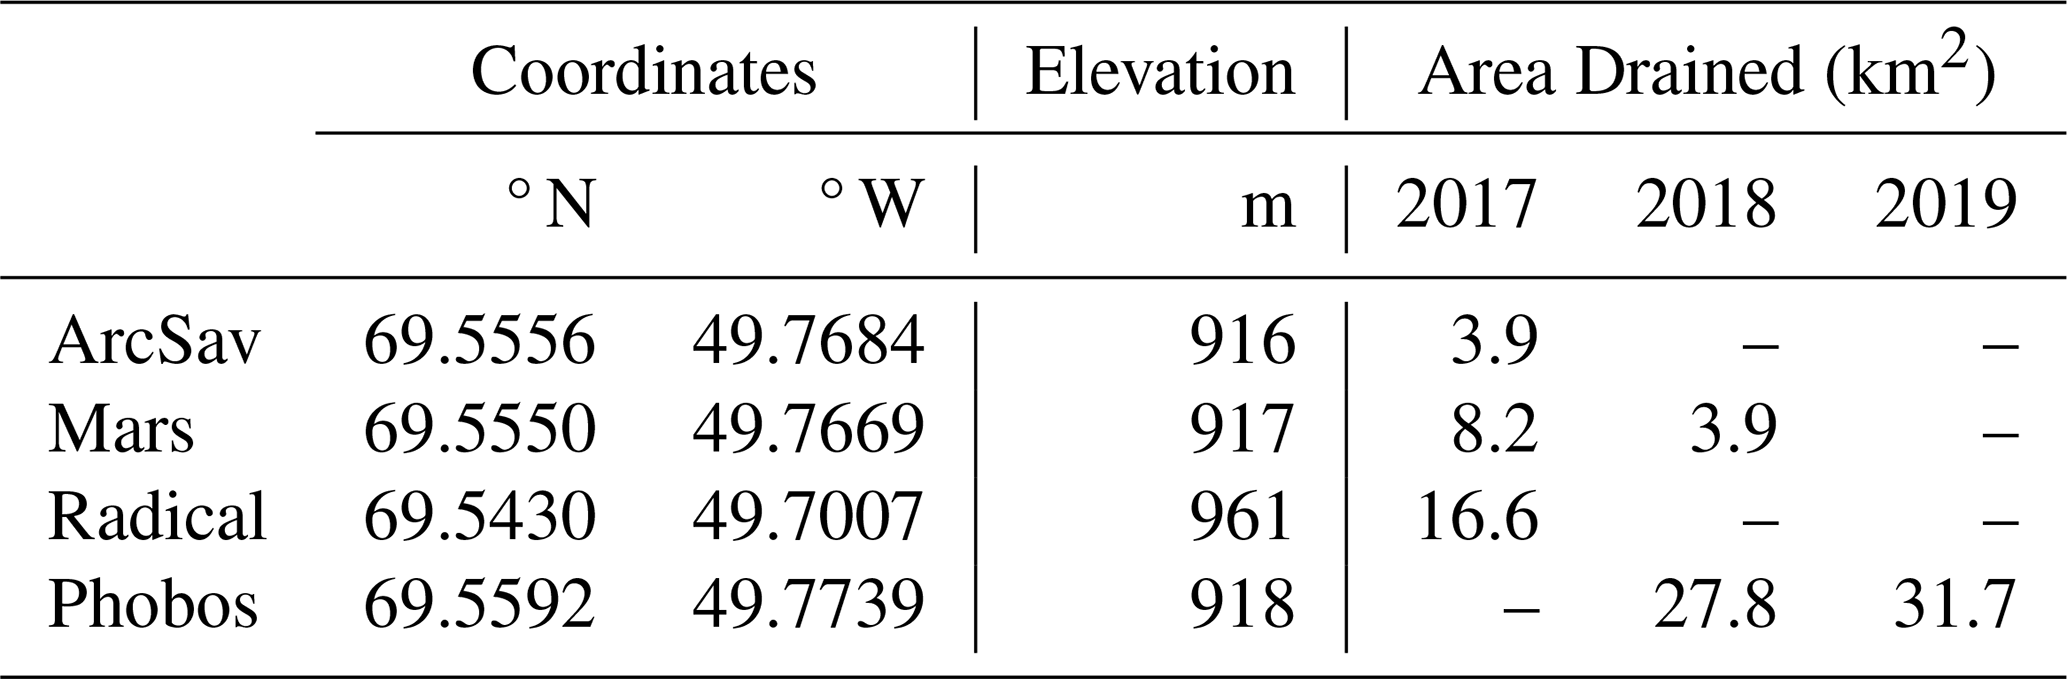
Table 2Terminal moulin coordinates, elevation in meters above WGS84 ellipsoid.
2.2 Catchment delineation
We delineated each catchment in our study area by calculating supraglacial stream flow over the ice surface, as defined by ArcticDEM. The ArcticDEM mosaic is derived from the panchromatic bands of WorldView satellites in the DigitalGlobe optical imaging constellation which produces a DEM with a ground sample distance of 2 m (Porter et al., 2018). We imported the ArcticDEM mosaic into QGIS for analysis, where we project the DEM into the WGS84/NSIDC Sea Ice Polar Stereographic North coordinate reference system (EPSG:3413) with produces elevations as height above the WGS84 ellipsoid. Before catchments were delineated, we used an algorithm to identify and fill topographic sinks (Conrad et al., 2015; Wang and Liu, 2006) while preserving the downward slope of the flow path (i.e., the minimum slope gradient between cells). The resulting depression-free DEM was then used to calculate supraglacial flow accumulation by calculating the steepest descent between touching cells across across our domain (Wang and Liu, 2006). Water is routed across our study area between grid points with the steepest slope to produce a predicted channel network of supraglacial stream locations and intersections. The calculated surface routing network is used to define DEM-predicted drainage basins with catchment outlets (sinks) along the periphery of the DEM domain (Fig. 2). We divided the large drainage basins according to moulin locations identified and recorded during summer field campaigns.
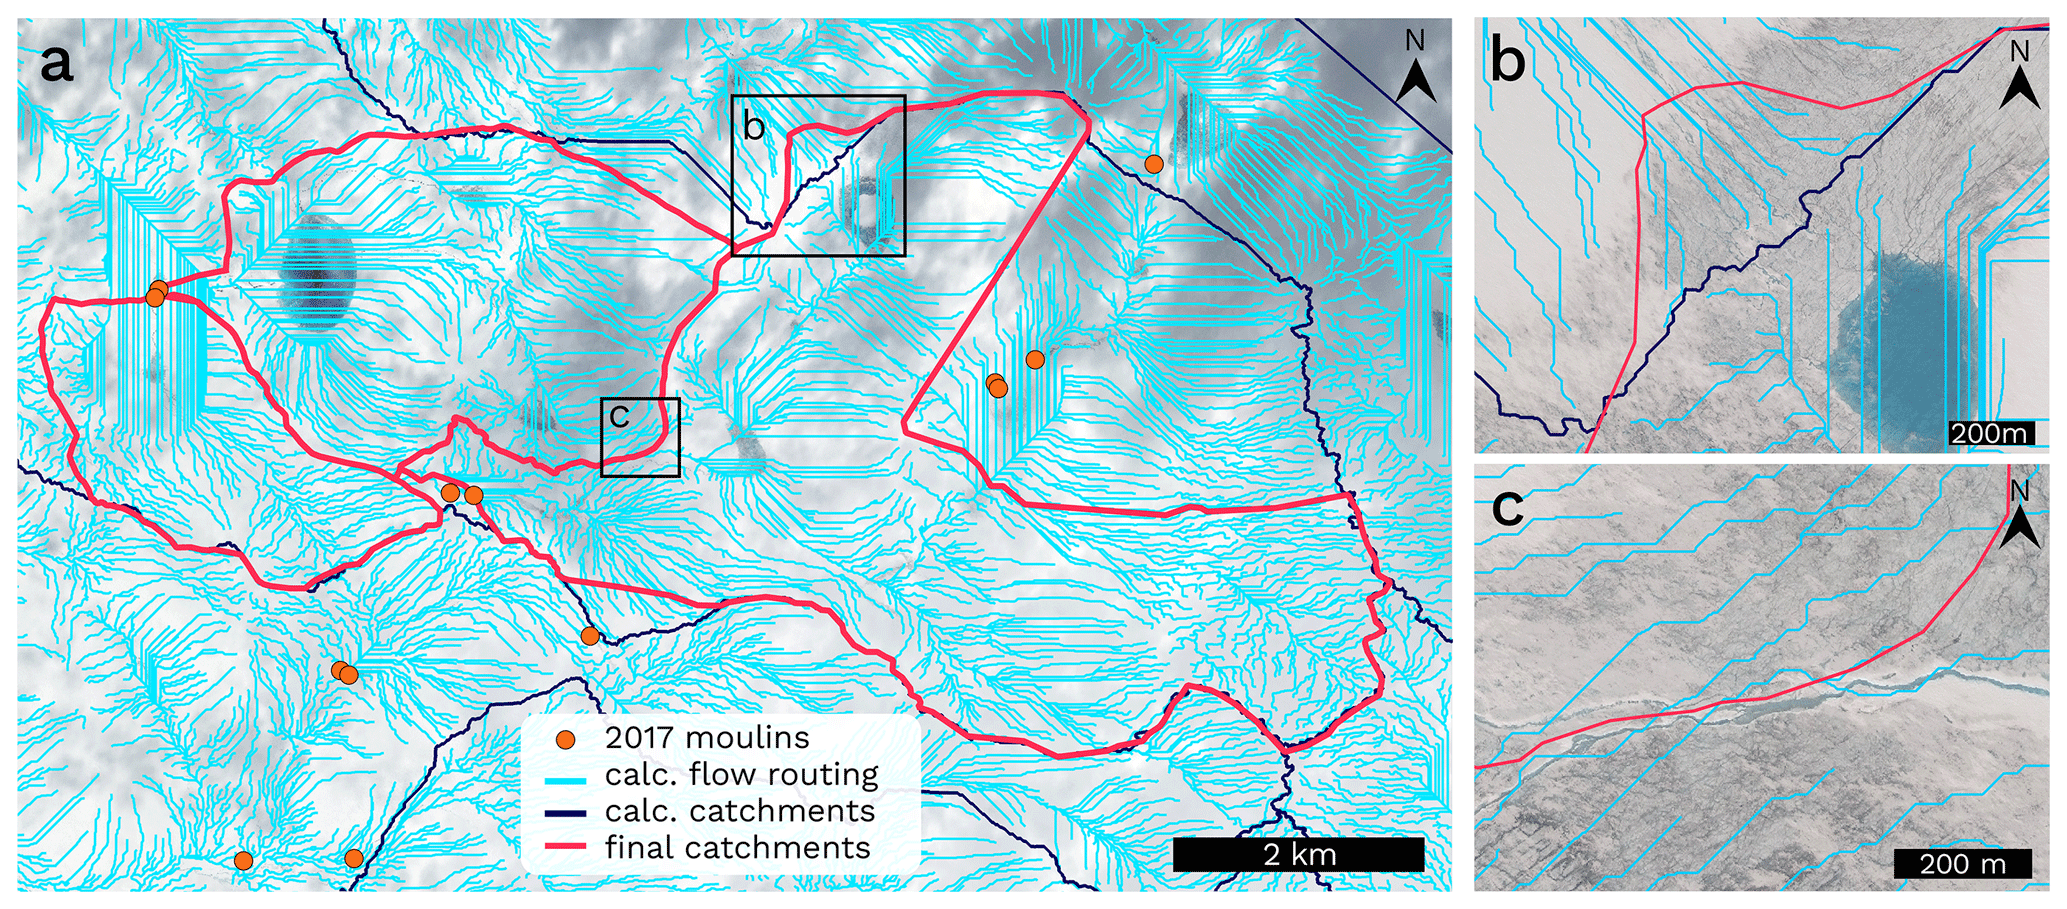
Figure 2Catchment delineation and adjustments. (a) Calculated flow routing across our study area (cyan) with automatically generated catchment bounds (blue) and finalized adjusted 2017 catchment bounds (red). Moulins identified in the field and by visual identification of satellite imagery are marked by orange circles. Background imagery same as in Fig. 1. Black boxes mark the locations subplots where the generated catchments were (b) modified or (c) subdivided according to the flow of supraglacial streams into each moulin, WorldView background imagery acquired 9 June 2019 (© 2019 Maxar).
The catchment boundaries calculated from the preceding analysis were then corrected to align with supraglacial streams visually identifiable in WorldView imagery with a spatial resolution of 0.3–0.5 m acquired on 3 July 2017, 27 June 2018, and 8 June 2019 (e.g., Fig. 2b–c). Maxar (2021) reports a geolocation accuracy of approximately 5.0 m of circular error in the 90th percentile, for areas without ground control points such as on the ice sheet. WorldView scenes from each year were acquired after the melt season had begun and supraglacial streams are clearly identifiable across our study area. We compared the calculated catchment boundaries to supraglacial streams visible in WorldView imagery by inspecting the perimeter of each catchment in QGIS using a screen scale of 1:5000. We adjusted catchment boundaries by manually relocating individual points comprising the catchment polygon at a screen scale of 1:500 to ensure our catchment bounds contained identified supraglacial streams. Adjustments made to catchment boundaries were located in areas where surface slopes are shallow and are generally less than 1°, with individual adjustments resulting in a change of ± 0.1 km2 to the catchment area, an example of such an adjustment is shown in Fig. 2b. We estimate an associated uncertainty of ± 0.2 km2 in our reported catchment area based on the geolocation accuracy of Maxar imagery and internal vertical accuracy of 0.2 m for ArcticDEM, the latter of which could offset the precise location of the topographic highs separating drainage basins whereas the former would influence the location of supraglacial streams used to correct calculated catchment bounds.
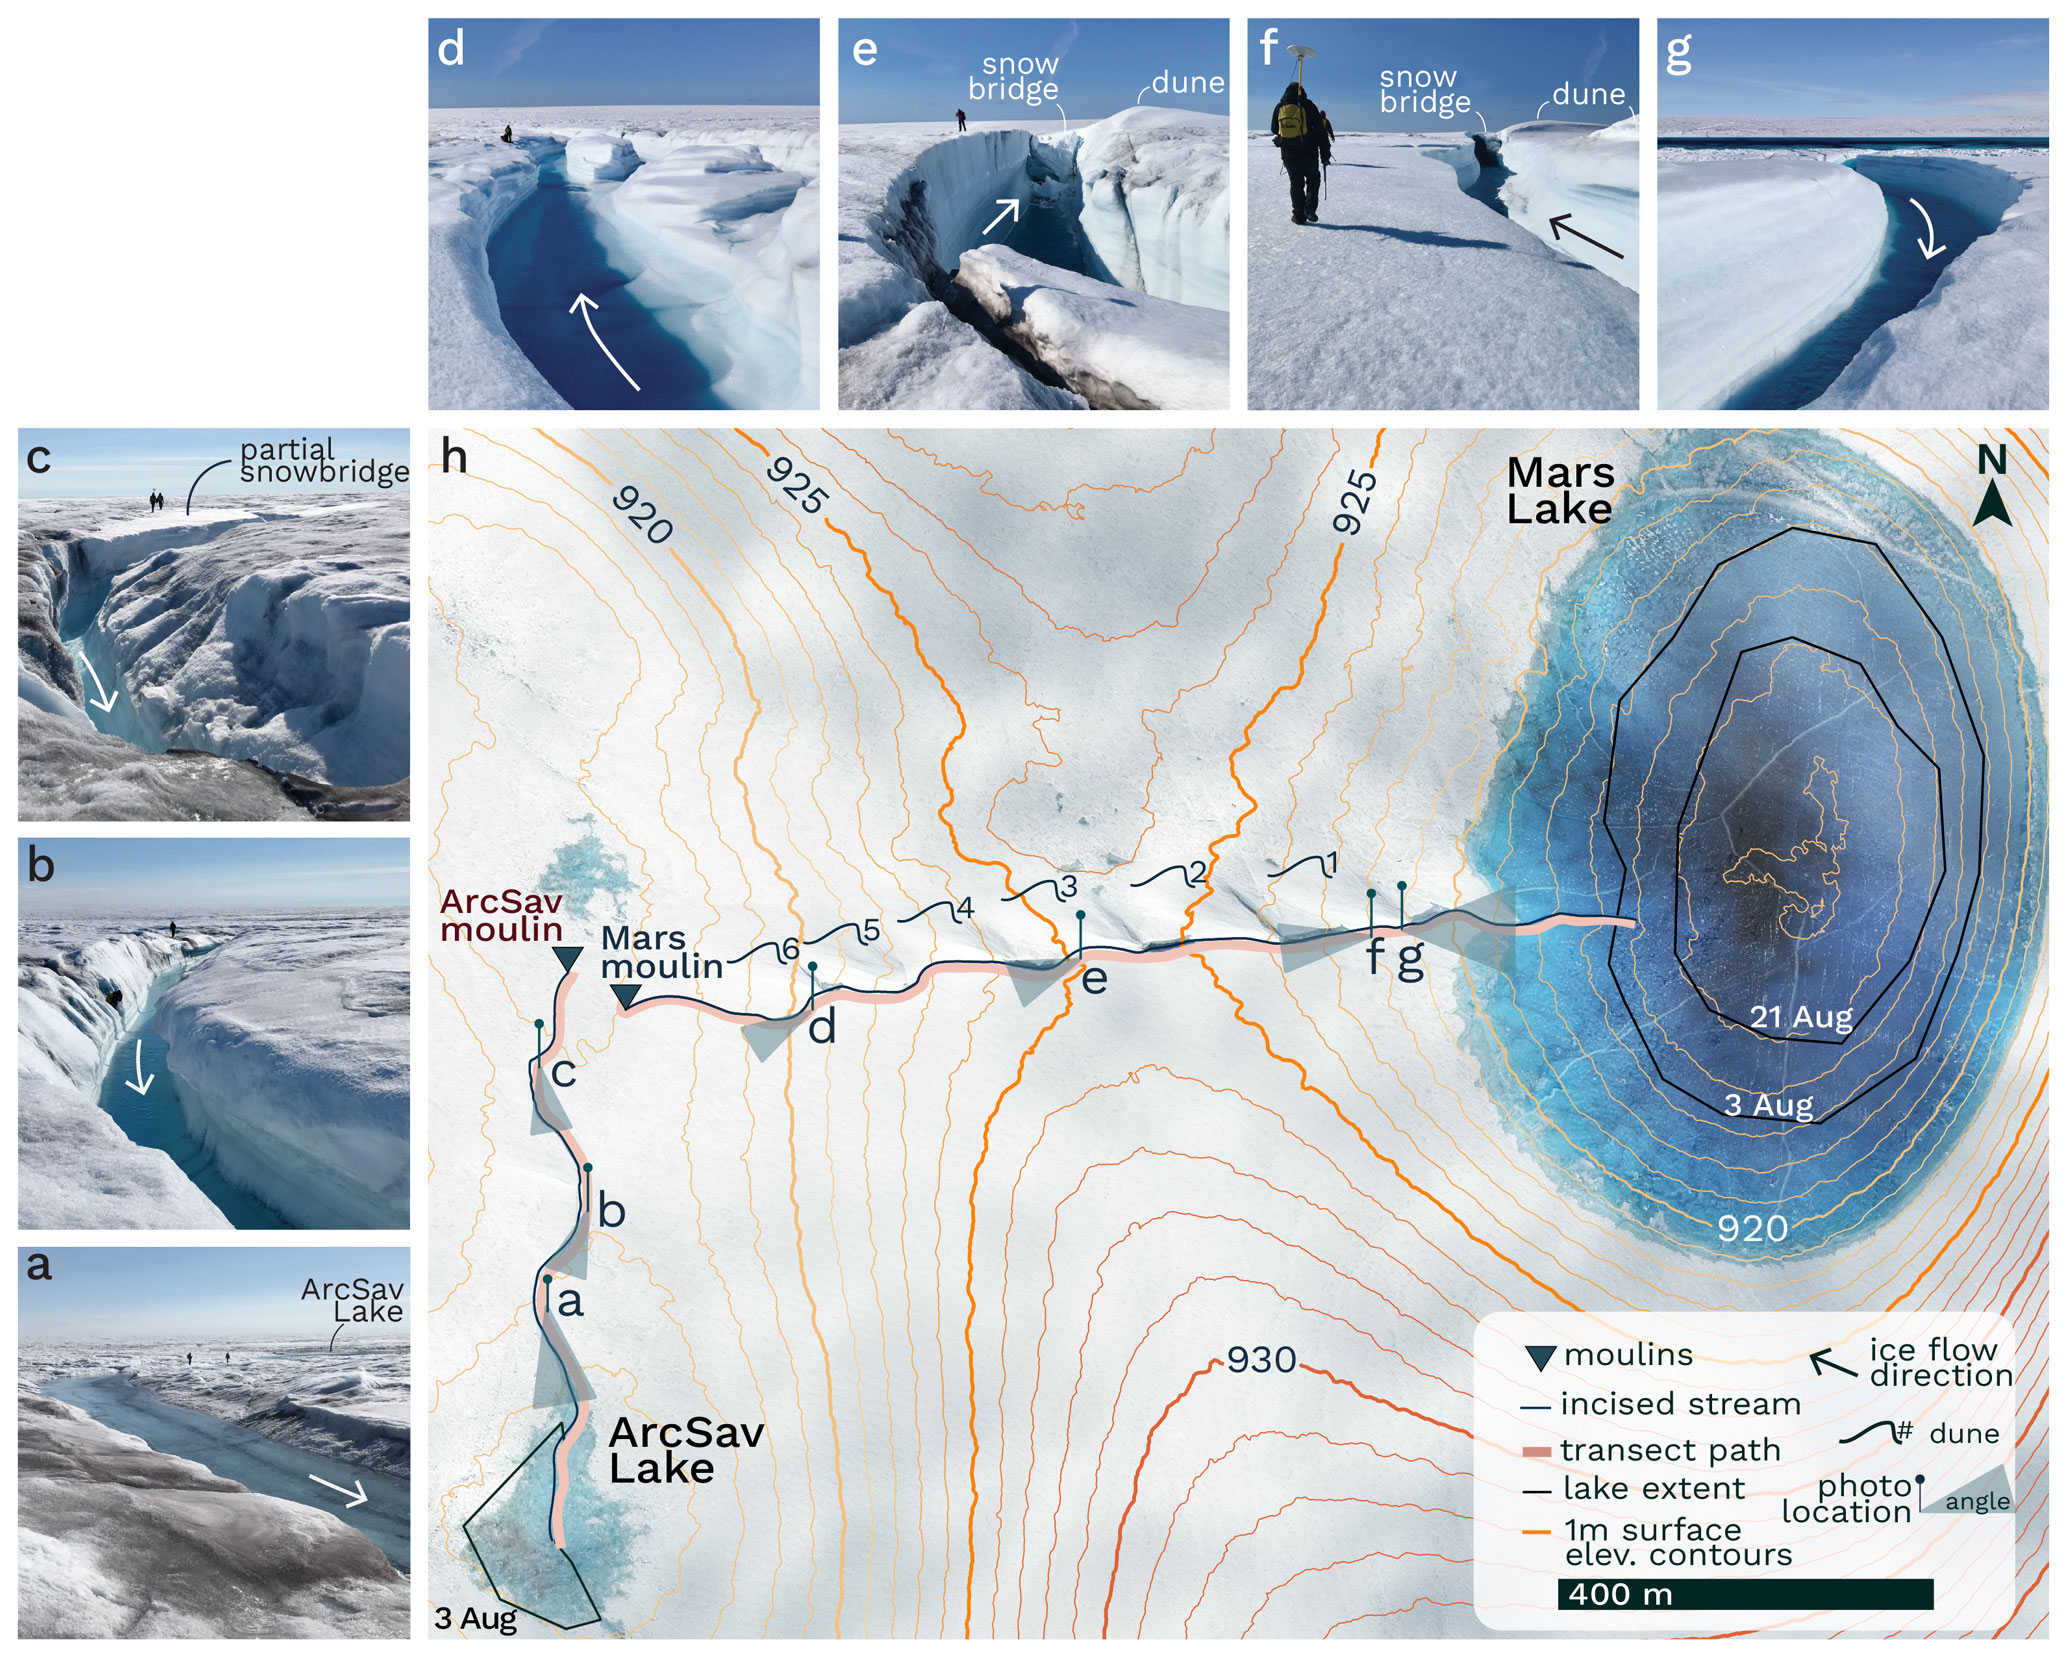
Figure 32017 Mars and ArcSav lake drainage flow paths and mapping traverse overlaid on Worldview Imagery (© 2017 Maxar) acquired on 3 July 2017. Pins and shaded areas mark the location and look-angle of photos shown in subplots (a–c) for ArcSav Lake drainage and (d–g) for Mars Lakes drainage path. 2017 supraglacial lake extents are outlined in black. 1 m ArcticDEM surface elevation contours are colored corresponding to elevation. Photographs in (a)–(g) were taken during the 2017 roving survey on 11 August between 13:00–16:00 LT. Arrows indicate water flow direction. (f–g) Water flow at the base of an incised channel which allowed flow in the direction opposite to the slope of large-scale topography. (e) Topographic high-point breached by the stream draining Mars Lake, a partially intact snow bridge is present. (d) Stream flow after breaching the topographic high-point, incised stream depth decreases towards Mars Moulin with overflow features apparent on the northern channel bank.
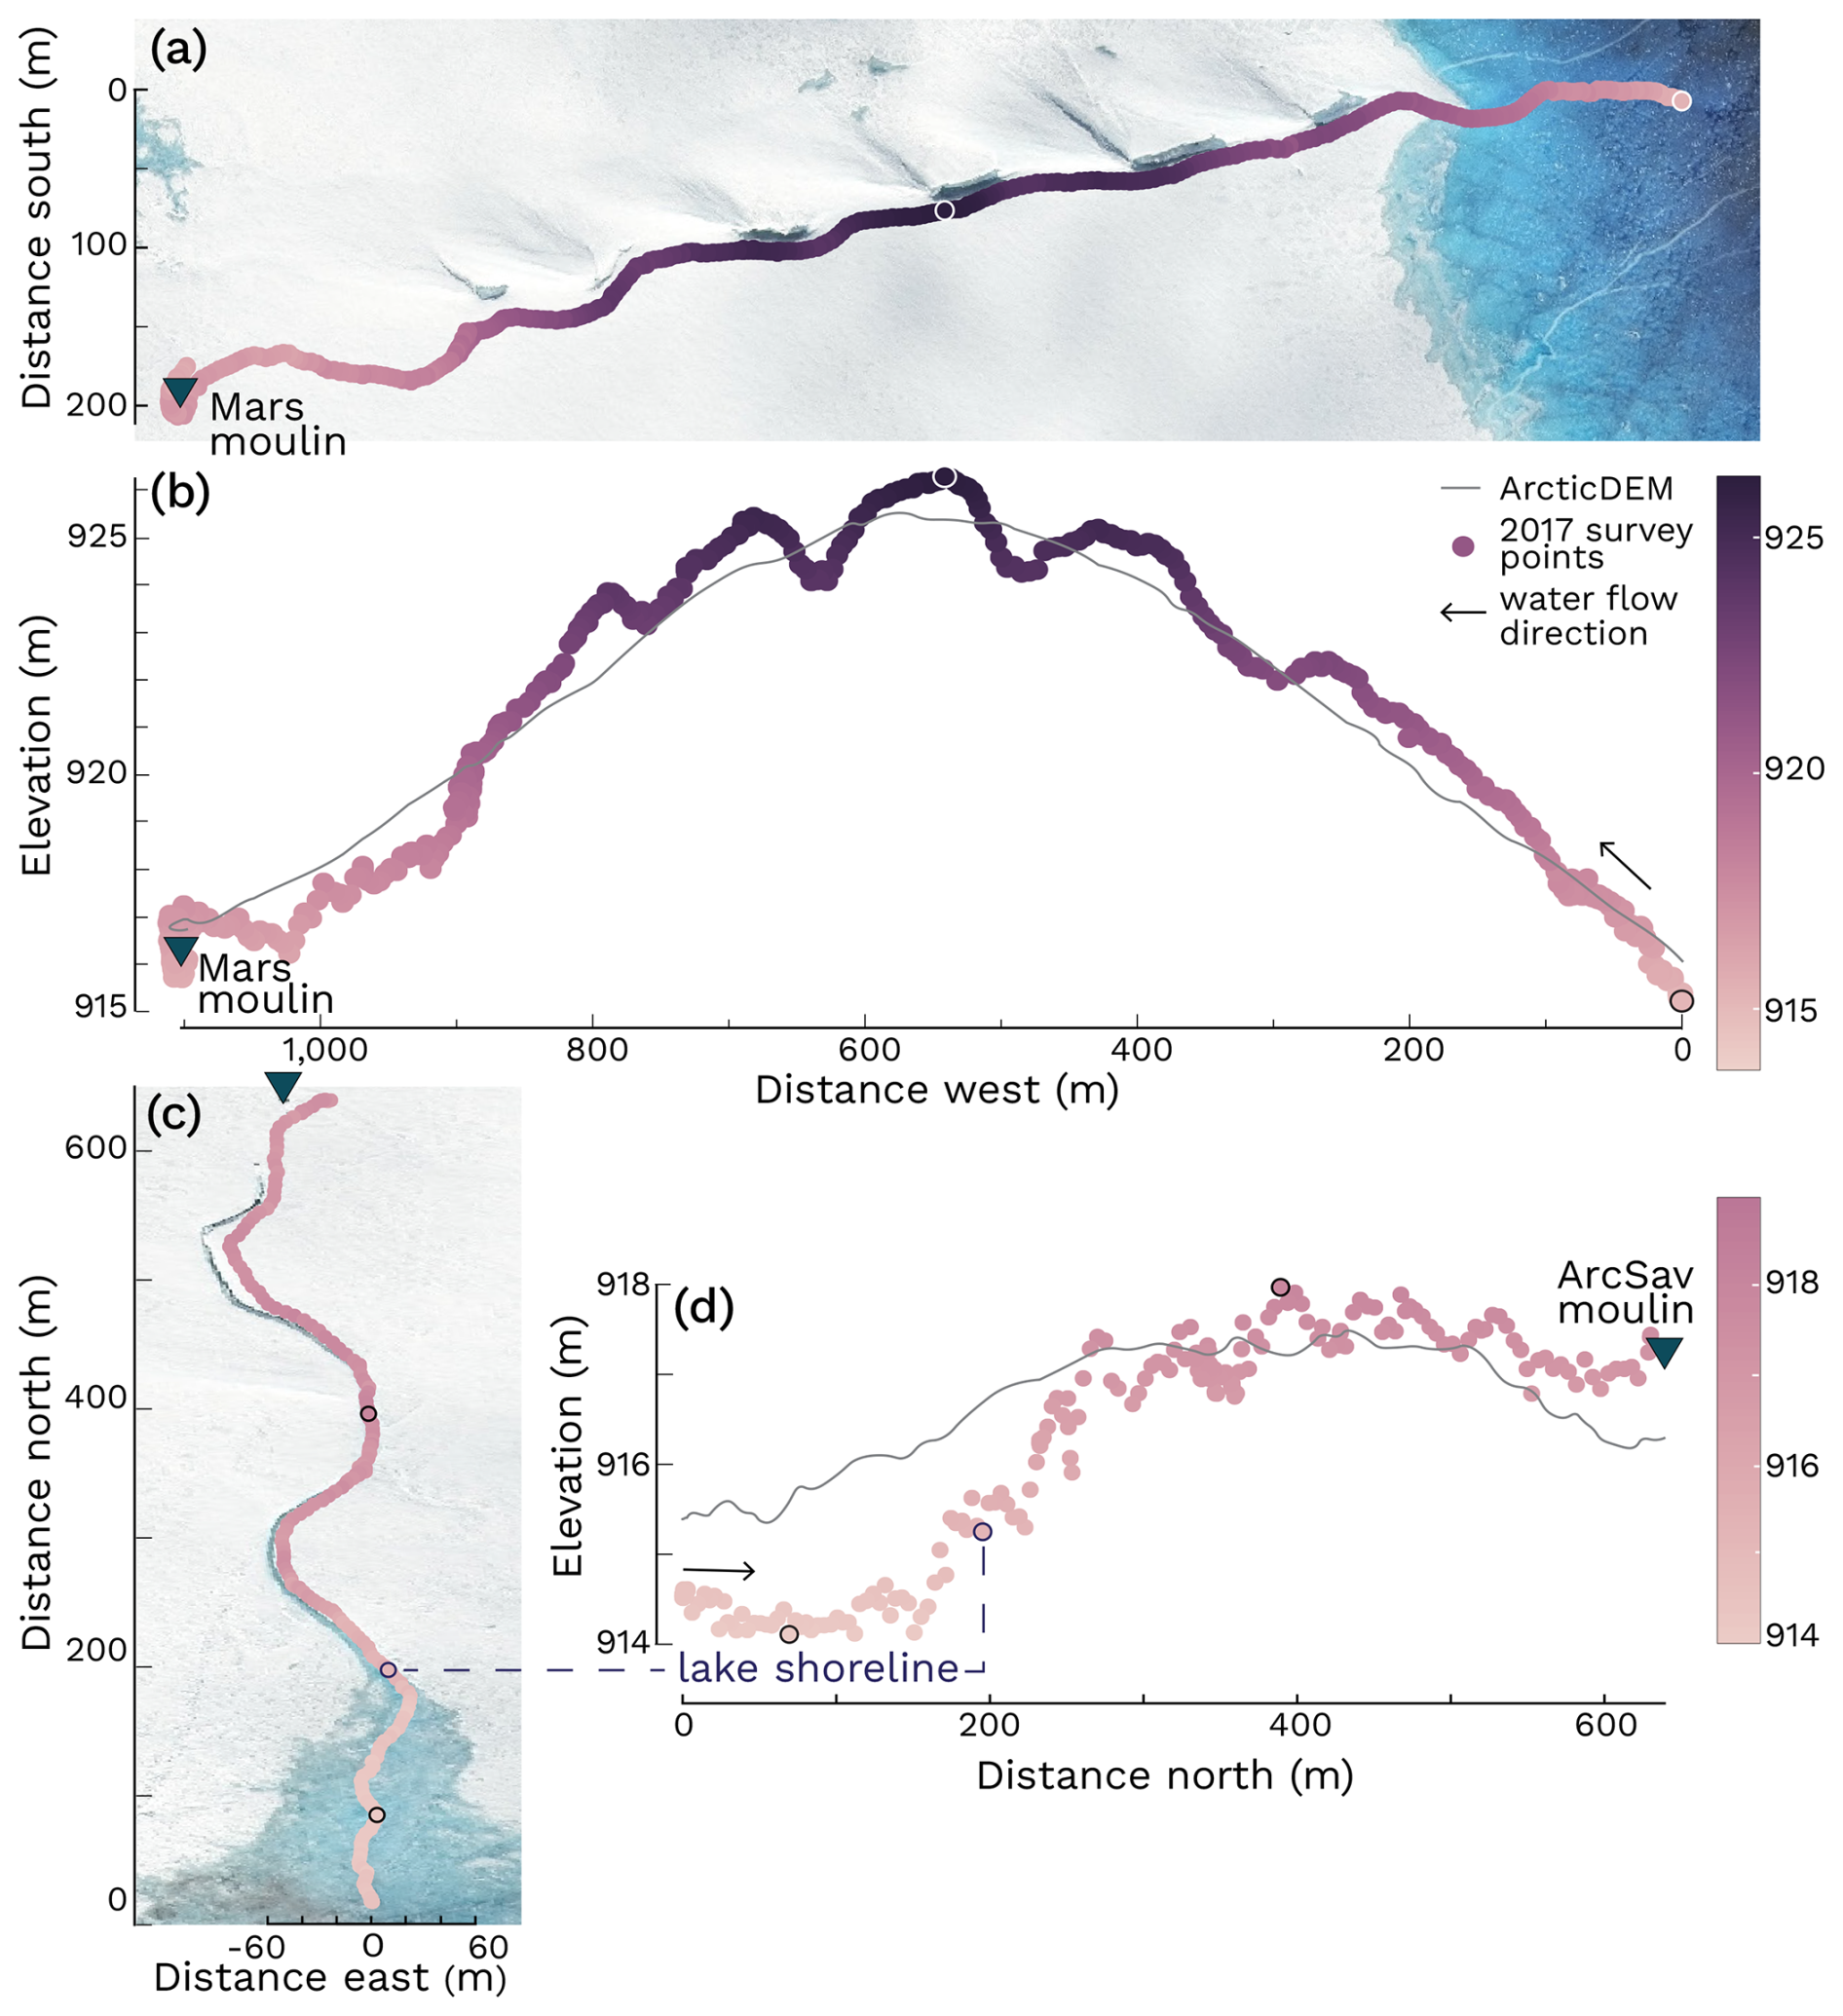
Figure 4Elevations along supraglacial stream bank on 11 August 2017. Plan-view of transect for (a) Mars Lake and (c) ArcSav Lake. Elevation along stream bank in meters above the WGS84 ellipsoid reported as distance (b) west of Mars shoreline and (d) north of the ArcSav shoreline. ArcticDEM elevations along transects (gray) are included for reference. Maximum and minimum elevations along transects are outlined in a contrasting color. The color bar in (b) correspond to all subplots.
3.1 Supraglacial stream routing, 2017
In August 2017, Mars Lake drained through a 1.16 km long, deeply incised stream that flowed out of the lake in the opposite direction indicated by the slope of the surrounding ice topography (Fig. 3). On 11 August 2017 we used a roving GPS to constrain elevations along the southern edge of the stream, starting at the lake shoreline and ending the traverse at the terminal moulin, Mars Moulin (Fig. 4a–b). The stream flowed west from the lake shoreline as it cut through the ridge defining the lake drainage basin. Stream incised depth increased for 500 m as it approached a topographic high at an elevation of 926.3 ± 0.04 m, in agreement with a topographic high of 925.6 ± 4.0 m reported by ArcticDEM. This drainage divide was 11.09 ± 0.04 m above the shoreline of Mars Lake at the time of mapping (Figs. 3e–h, 4b). Thermal incision at the stream base created a downhill slope that allowed water to flow perpendicular to the larger-scale ice surface elevation contours containing Mars Lake. The stream curved around six snow dunes that defined the northern edge of the canyon. Snow bridges connecting to these large dunes were observed along the most canyonized reaches of the stream (Fig. 3e–f). While we did not measure the stream's incised depth explicitly, we can infer that the stream's surface was at least 11.1 ± 0.4 m deeper than the drainage divide and the stream base would therefore be deeper than the stream surface. After breaching the topographic divide, stream incised depth decreased as it approached Mars Moulin. Fresh overflow features marked the final 100 m of the stream before water flowed into the ice-rimmed Mars Moulin (Figs. 3d, 5a), located at an elevation of 917 m.
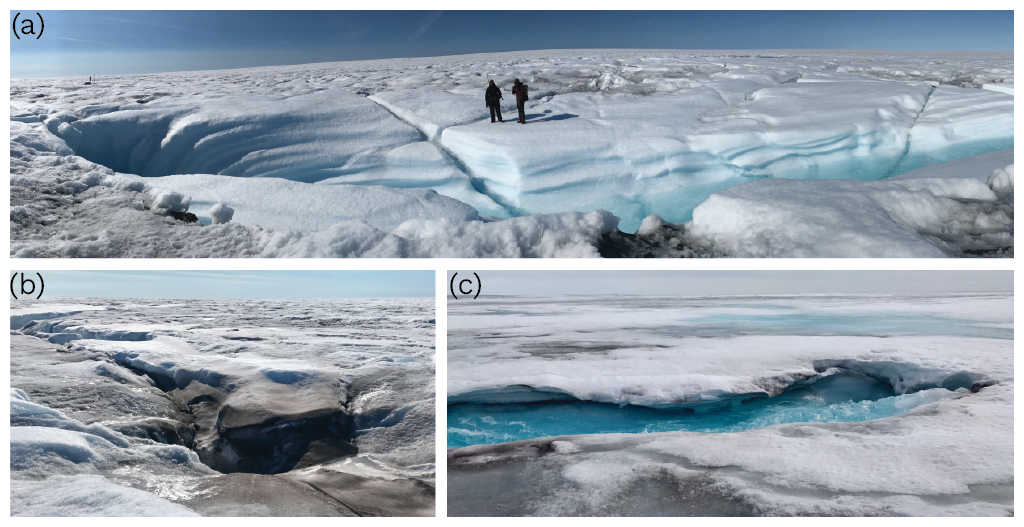
Figure 52017 terminal moulins. Photos of (a) Mars Moulin and (b) ArcSav Moulin (11 August 2017). (c) Radical Moulin (14 August 2017).
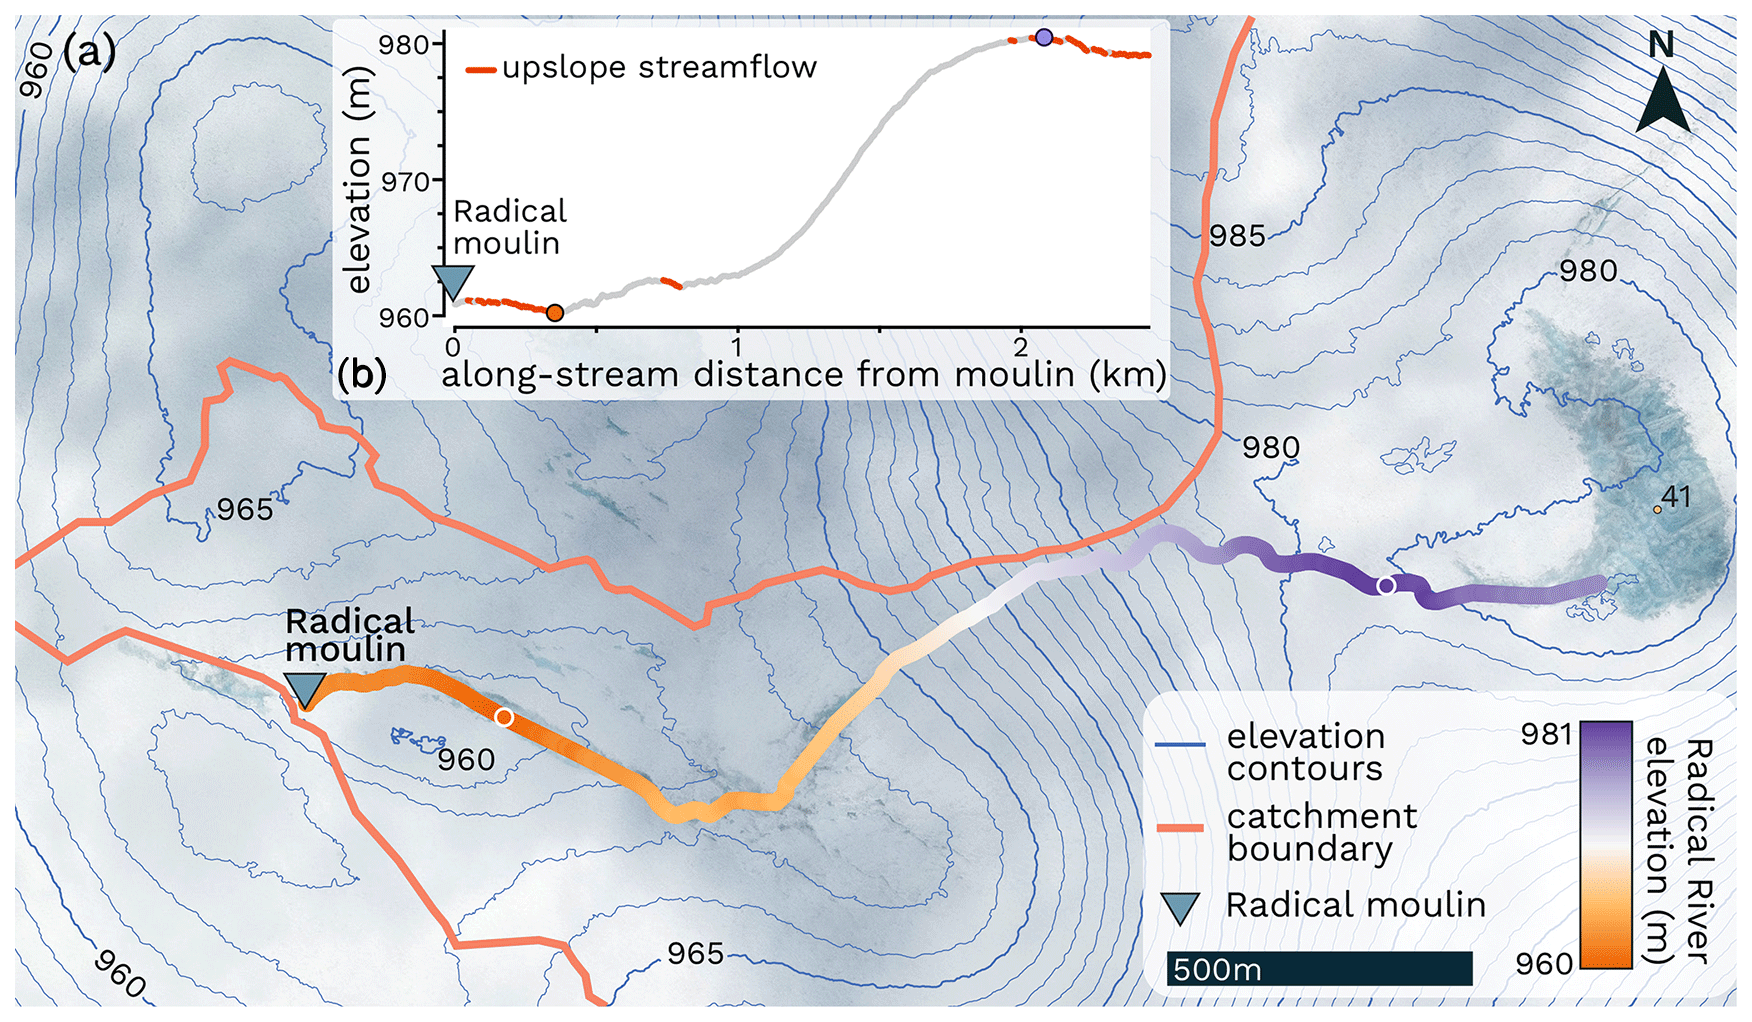
Figure 6Radical River 2017 flow path. Worldview Imagery (© 2017 Maxar) with ArcticDEM surface elevation contours. (b) Radical River elevation profile with uphill flow in red.
The neighboring ArcSav Lake drained through a 700 m long incised stream that flowed in the opposite direction of the downward gradient of ice surface topography (Figs. 3, 4c–d). On 11 August 2017 we conducted a roving dGPS survey along the eastern edge of the stream draining ArcSav Lake, from lake shoreline to terminal moulin, ArcSav Moulin. The stream flowed north from the lake shoreline over for 180 m at which point the streams incised depth deepened while the surrounding ice surface elevation increased by 3.86 ± 0.06 m over the subsequent 250 m before stabilizing at this higher elevation (Fig. 4c–d). The final 150 m of the stream was characterized by the presence of snow bridges (Fig. 3c) near where the stream incised steeply before being obscured by a thicker snow bridge that plugged the final 50 m of the stream and ArcSav moulin (Fig. 5b).
Radical Catchment, the largest catchment in this study (16.6 km2), drained through a 2.4 km long supraglacial stream, Radical River, into the snow-covered Radical Moulin (Figs. 1b, 5c, 6). Radical River began on the western shoreline of Lake 41 (Fig. 1b; Morriss et al., 2013), where it flowed in a direction counter to the surrounding ice surface slope for 370 m which allowed the river to breach a topographic high of 980.5 m, which was approximately 0.5 m above the lake shoreline (Fig. 6b). After breaching the topographic divide, stream flow adhered to the slope of surrounding topography for 1.37 km, widening as it approached a topographic low at 960 m. Radical River continued northwest until reaching the 961 m elevation contour (Fig. 6), at which point it followed the contour west, narrowing to ∼ 1.5 m before draining into Radical Moulin.
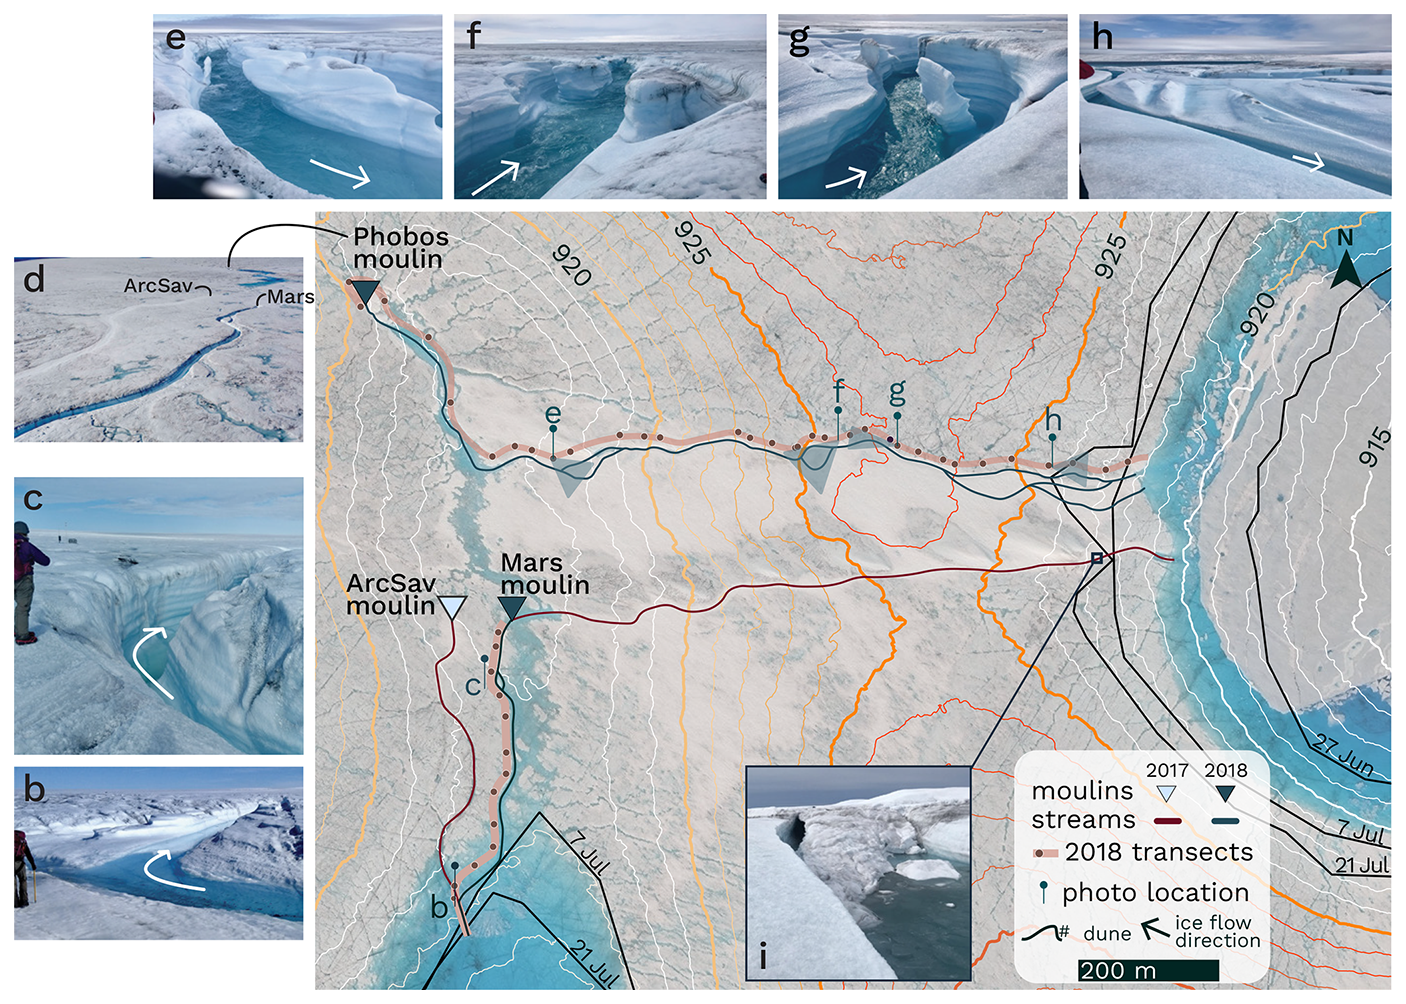
Figure 72018 Mars and ArcSav Lake drainage flow paths. WorldView Imagery acquired 8 June 2019 (© 2019 Maxar). Lake drainage paths for 2017 (red) and 2018 (blue). Symbols as in Fig. 3. (b–d) ArcSav Lake's 2018 drainage path, arrows indicate flow direction. (d) Aerial photo of moulin locations. (e–h) 2018 Mars Lake drainage photos taken on 8 August 2018 15:00 LT. Photos show (h) fresh overflow features and an abandoned meandering channel, (g) channel flow as it breaches the topographic highpoint, note the horizontal demarcations on canyon walls which indicate relic lateral incision on the cut banks in stream meander bends. (e–f) Fluvial terraces formed during earlier phases of the lake drainage. (i) The abandoned snow-filled channel that drained Mars Lake in 2017, photo taken on 6 August 2018.
3.2 Interannual supraglacial stream routing
In 2018, Mars Lake drained through a new 1.3 km long, deeply incised stream that cut through the ridge which defined the western boundary of the lake basin, abandoning the snow-plugged channel Mars Lake drained though in 2017 (Fig. 7i). Lake extent delineation from satellite imagery suggest Mars Lake began to drain in late July (Fig. 7). The new channel draining Mars Lake formed 120 m north of the snow-plugged 2017 channel. On 8 August 2018 we mapped the stream draining Mars Lake and extracted elevations from ArcticDEM for positions along the northern edge of the stream from lake shoreline to Phobos Moulin, the new moulin that drained Mars Lake in 2018. The stream incised depth increased for 370 m as it approached the topographic high at an elevation of 926.3 ± 4 m, which was 4.7 ± 0.2 m above the lake shoreline at the time of mapping (Fig. 8a–b). A comparison of ArcticDEM reported maximum elevations along the streams draining Mars Lake indicates the topographic high the lake drained through in 2018 is 0.7 ± 0.2 m higher in elevation than the 2017 drainage path. Stream incised depth increased with ice surface elevation, with the deepest and most canyonized part of the stream coinciding with the top of the ridge (Fig. 7g). After cutting through the topographic divide, the stream continued downslope for 1.4 km (Fig. 7e–f) until emptying into Phobos Moulin, located 500 m northwest of Mars Moulin that drained the lake in 2017.
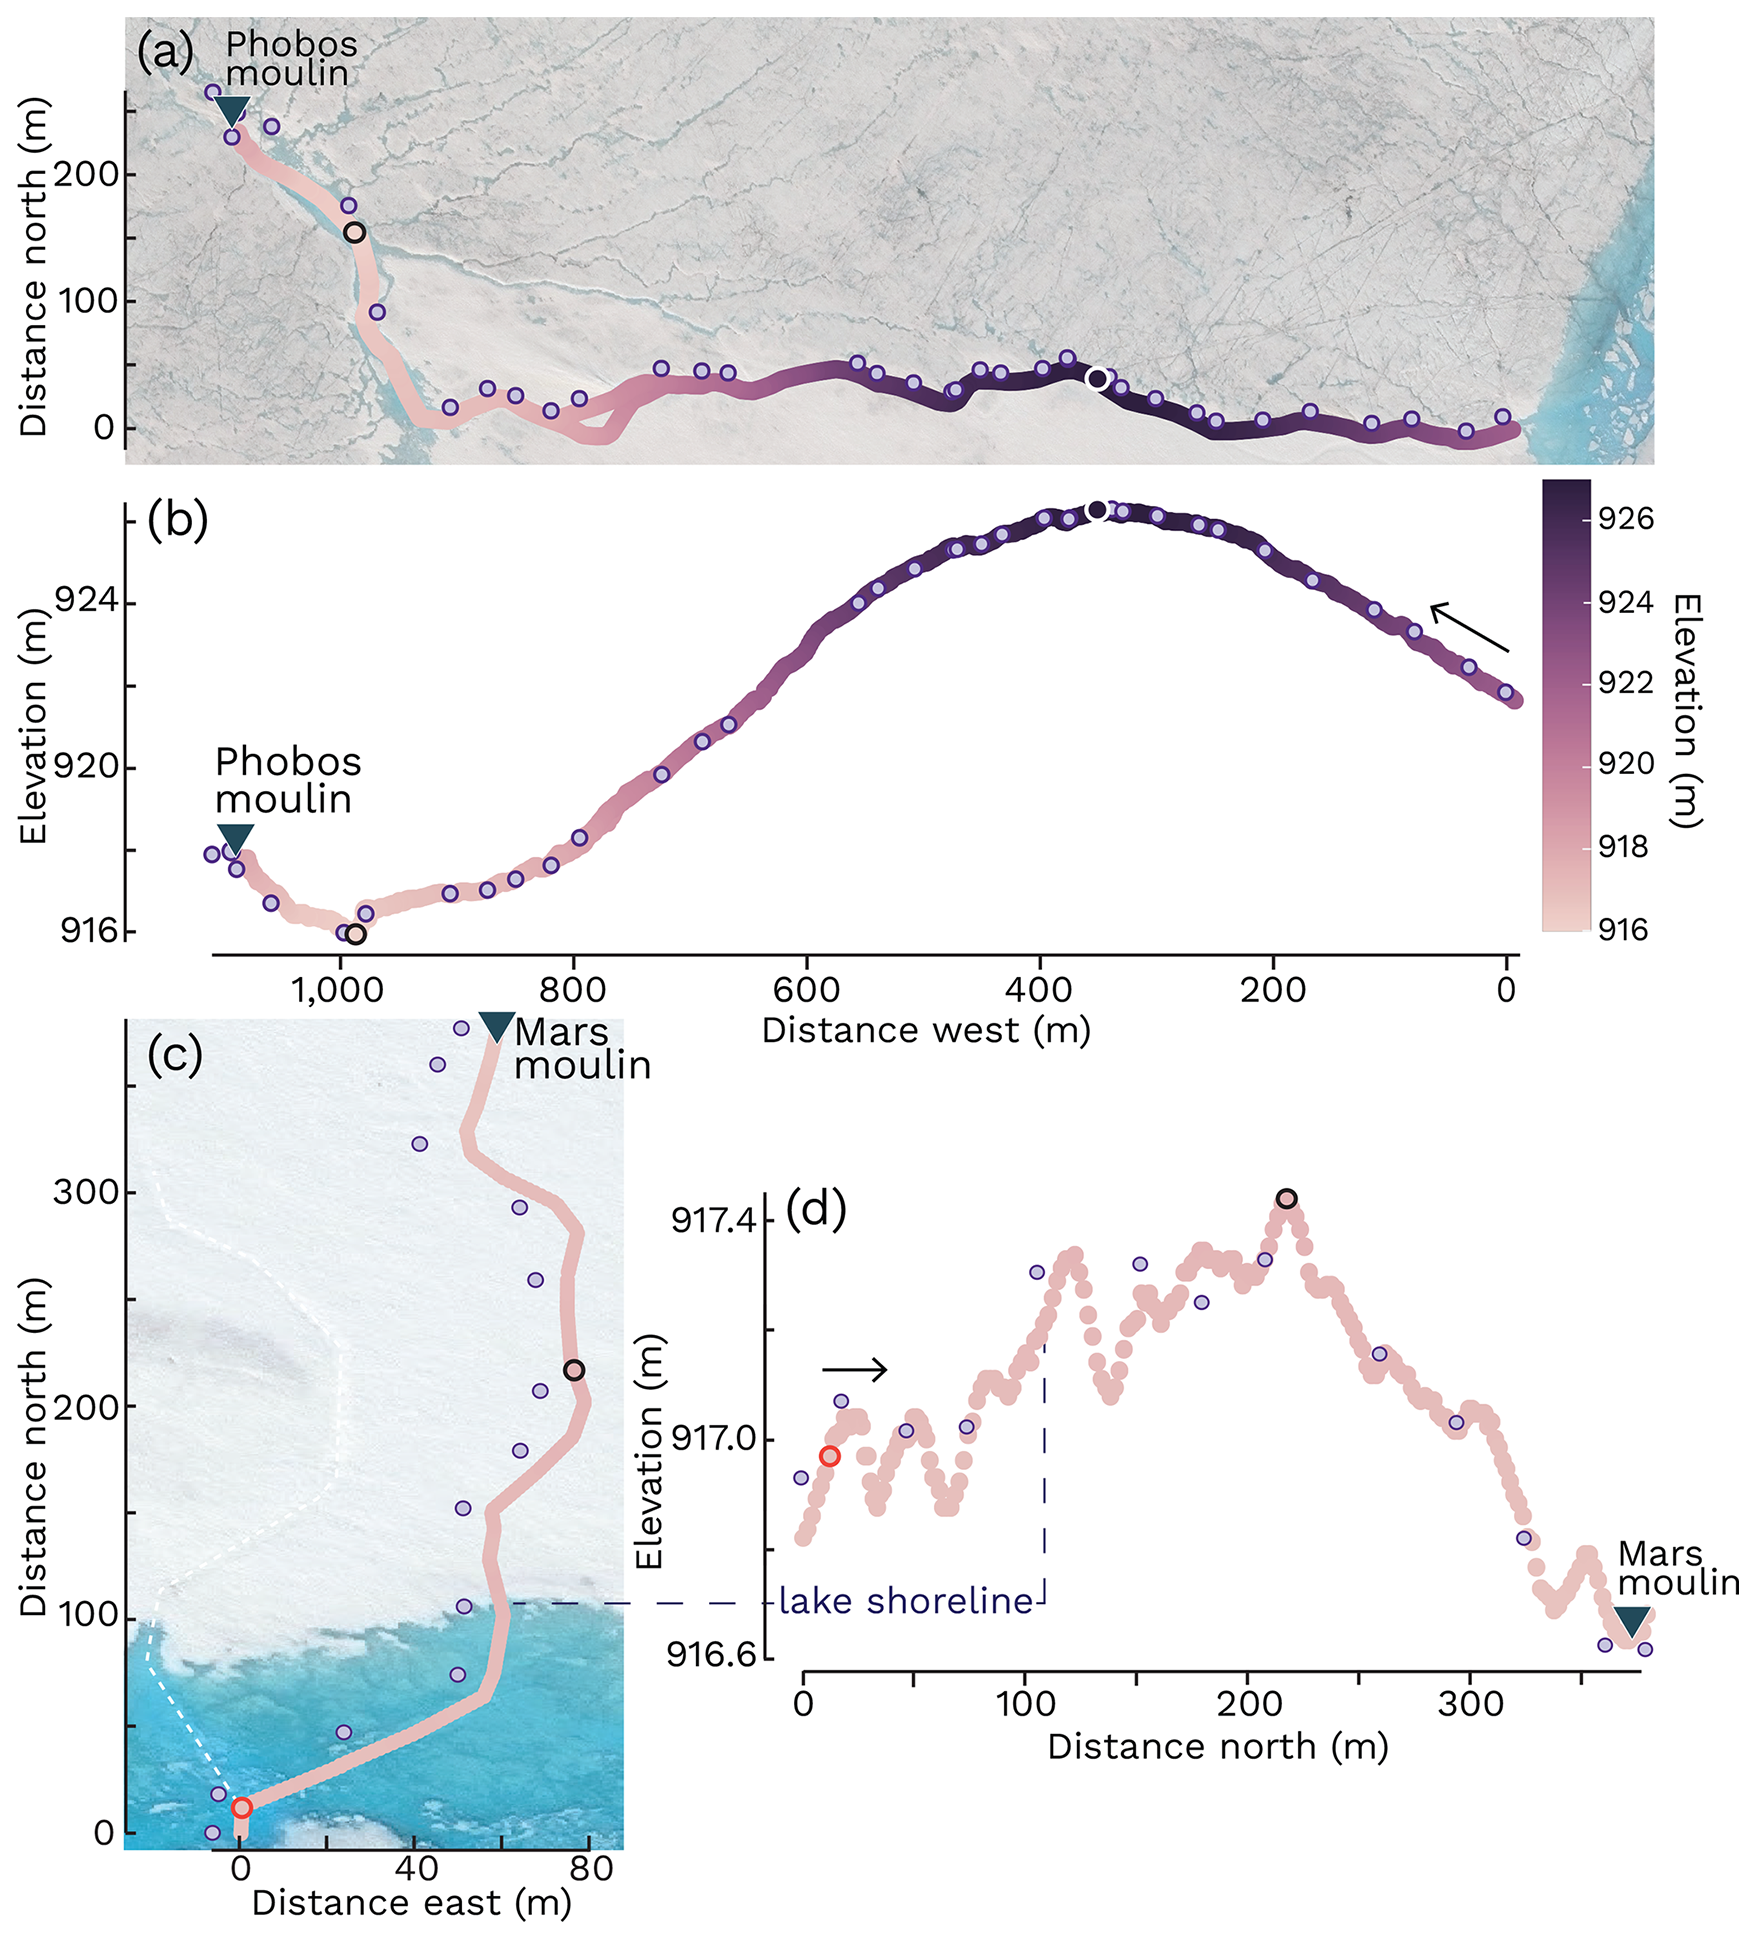
Figure 8ArcticDEM extracted elevations along 2018 lake to moulin drainage paths for (a–b) Mars and (c–d) ArcSav catchments. Plan-view of transect for (a) Mars and (c) ArcSav from lake shoreline to terminal moulin overlaid on WorldView Imagery acquired on 9 June 2019 and 27 June 2018 respectively (© 2019 Maxar). Stream transect elevations for (b) Mars and (d) ArcSav catchments for point measurements (purple dots) and traced supraglacial streams (pink with colors corresponding to color bar in b). (c–d) The orange outline marks intersection with 2017 abandoned drainage path (white dashed line).
In 2018 ArcSav Lake drained by incising a new, 0.5 km long channel, abandoning the snow-filled channel it drained through in 2017 (Fig. 7a–d). The new channel followed the 2017 drainage route for less than 100 m before diverging at nearly a right angle from the snow-filled canyon formed the previous year (Figs. 7b, 8c–d). The stream continued north as it incised a meandering canyon parallel to the 2017 flow path. ArcticDEM extracted elevations along the 2018 drainage path show a modest 0.4 m elevation increase over the 217 m between the point where it diverged from the 2017 drainage path and where the stream breached the small topographic high of 917.3 ± 4 m (Fig. 8d). According to these observations of ice surface elevation along the stream edge increasing along the path of stream flow, it would appear the stream is flowing “upslope” however, thermal incision at the stream base allows water to maintain a downward slope that dictates streamflow and produces this effect. Ultimately, the new channel draining ArcSav Lake reactivated and drained into Mars Moulin which was 40 m southeast of the 2017 location of ArcSav Moulin (i.e., prior to advecting downglacier). The close proximity of ArcSav Moulin and Mars Moulin resulted in ArcSav Catchment maintaining the same area of 3.9 km2 in 2017 and 2018.
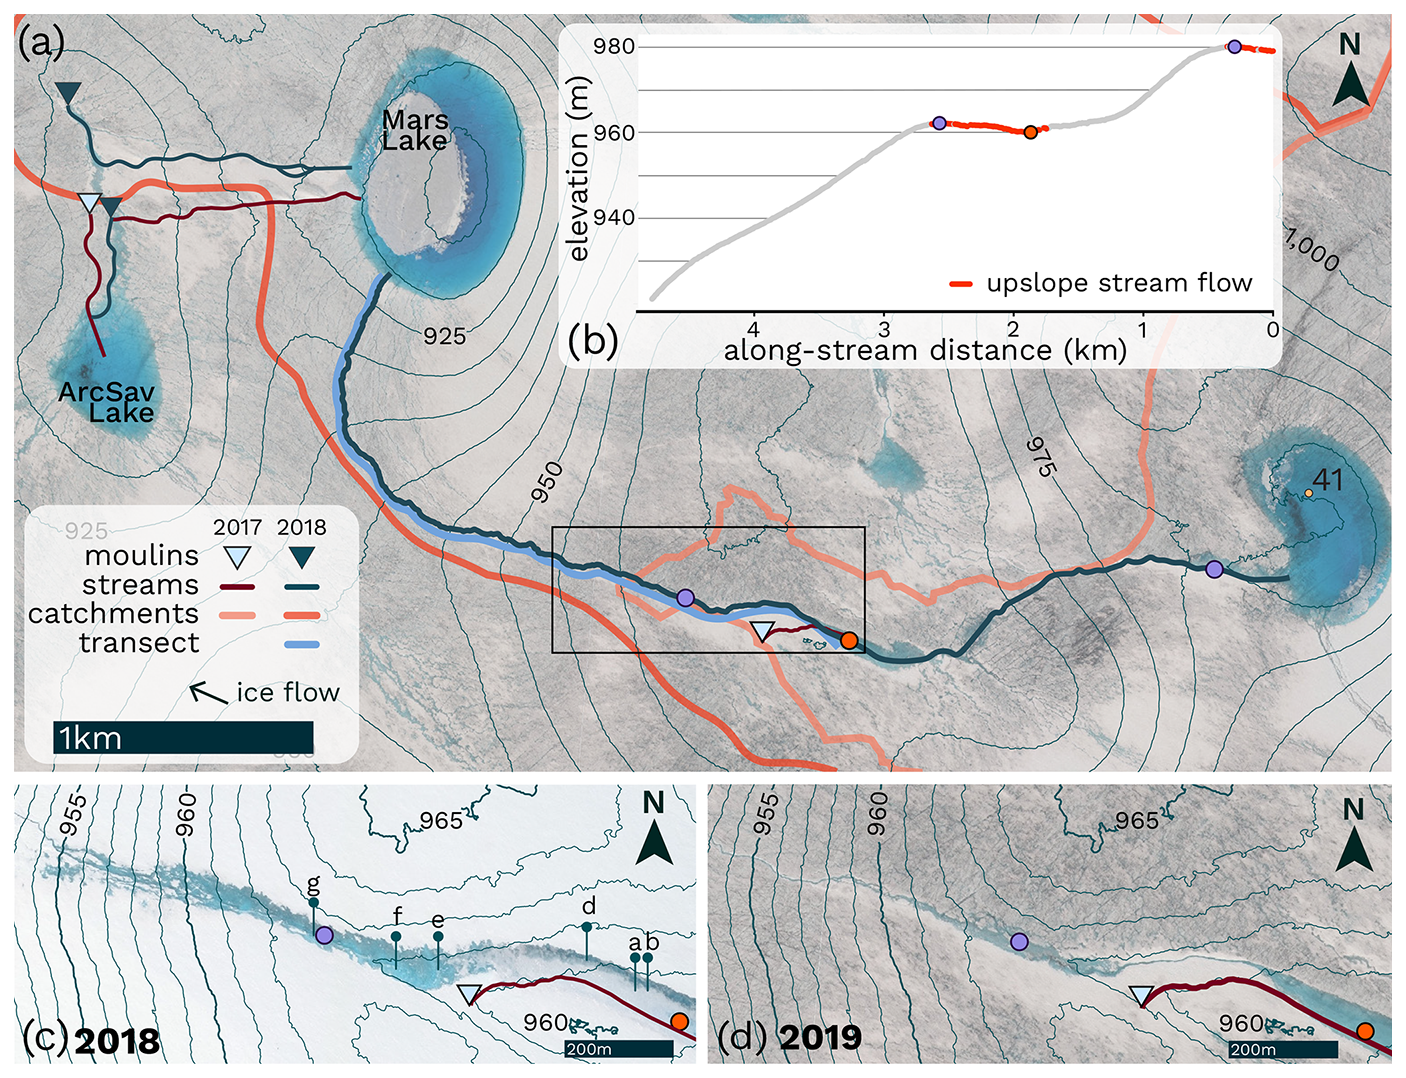
Figure 9Radical River breaching topographic divide, 2018 and 2019. WorldView imagery acquired on (a, d) 8 June 2019 and (c) 27 June 2018 (© 2019 Maxar). (a) Overview of 2017 and 2018 stream flow routing, terminal moulins, and catchment boundaries. (b) Elevation profile with stream flow against large-scale surface gradient (red) with circles marking the topographic high (purple) and low (orange). Radical River breaching topographic divide in (c) 2018 and (d) 2019. Pins mark photo locations shown in Fig. 10.
In 2018, Radical Catchment drained through the 4.8 km long Radical River that cut through the topographic high defining the western edge of the catchment and drained into Mars Lake (Fig. 9a). Radical River reformed along the same path as in 2017, except for the final 260 m of the river which had become snow-filled and prevented the river from reactivating Radical Moulin (Fig. 10a–c). The River-snowplug interface was characterized by slush that extended several meters into the snowplug from the river edge (Fig. 10b–c). Instead of flowing towards Radical Moulin, the river widened as it flowed upslope for 630 m until it cut through the lowest point in the drainage divide separating Radical and Mars catchments (Figs. 9b–c, 10d–g). After breaching the topographic divide, Radical River flowed downslope for 2.1 km until emptying into Mars Lake which drained into Phobos Moulin which therefore drains Radical Catchment in 2018. This flow reorganization resulted int he merger of Mars and Radical Catchments into a single 27.8 km2. This merged catchment drained into Phobos Moulin which was located 3.5 km northwest of the abandoned Radical Moulin which had drained the catchment the year before in 2017. Overall, Radical River flowed against the slope of large-scale ice surface topography along 21 % of the river length extending between Lake 41 and Mars Lake (delineated in Fig. 9a–b) and excluding all tributaries. Considering tributary streams which total more than 27 km in length according to DEM-predicted flow routing calculations, streamflow against the slope of large-scale ice surface topography amounts to less than 4 % of total stream length in Radical Catchment.
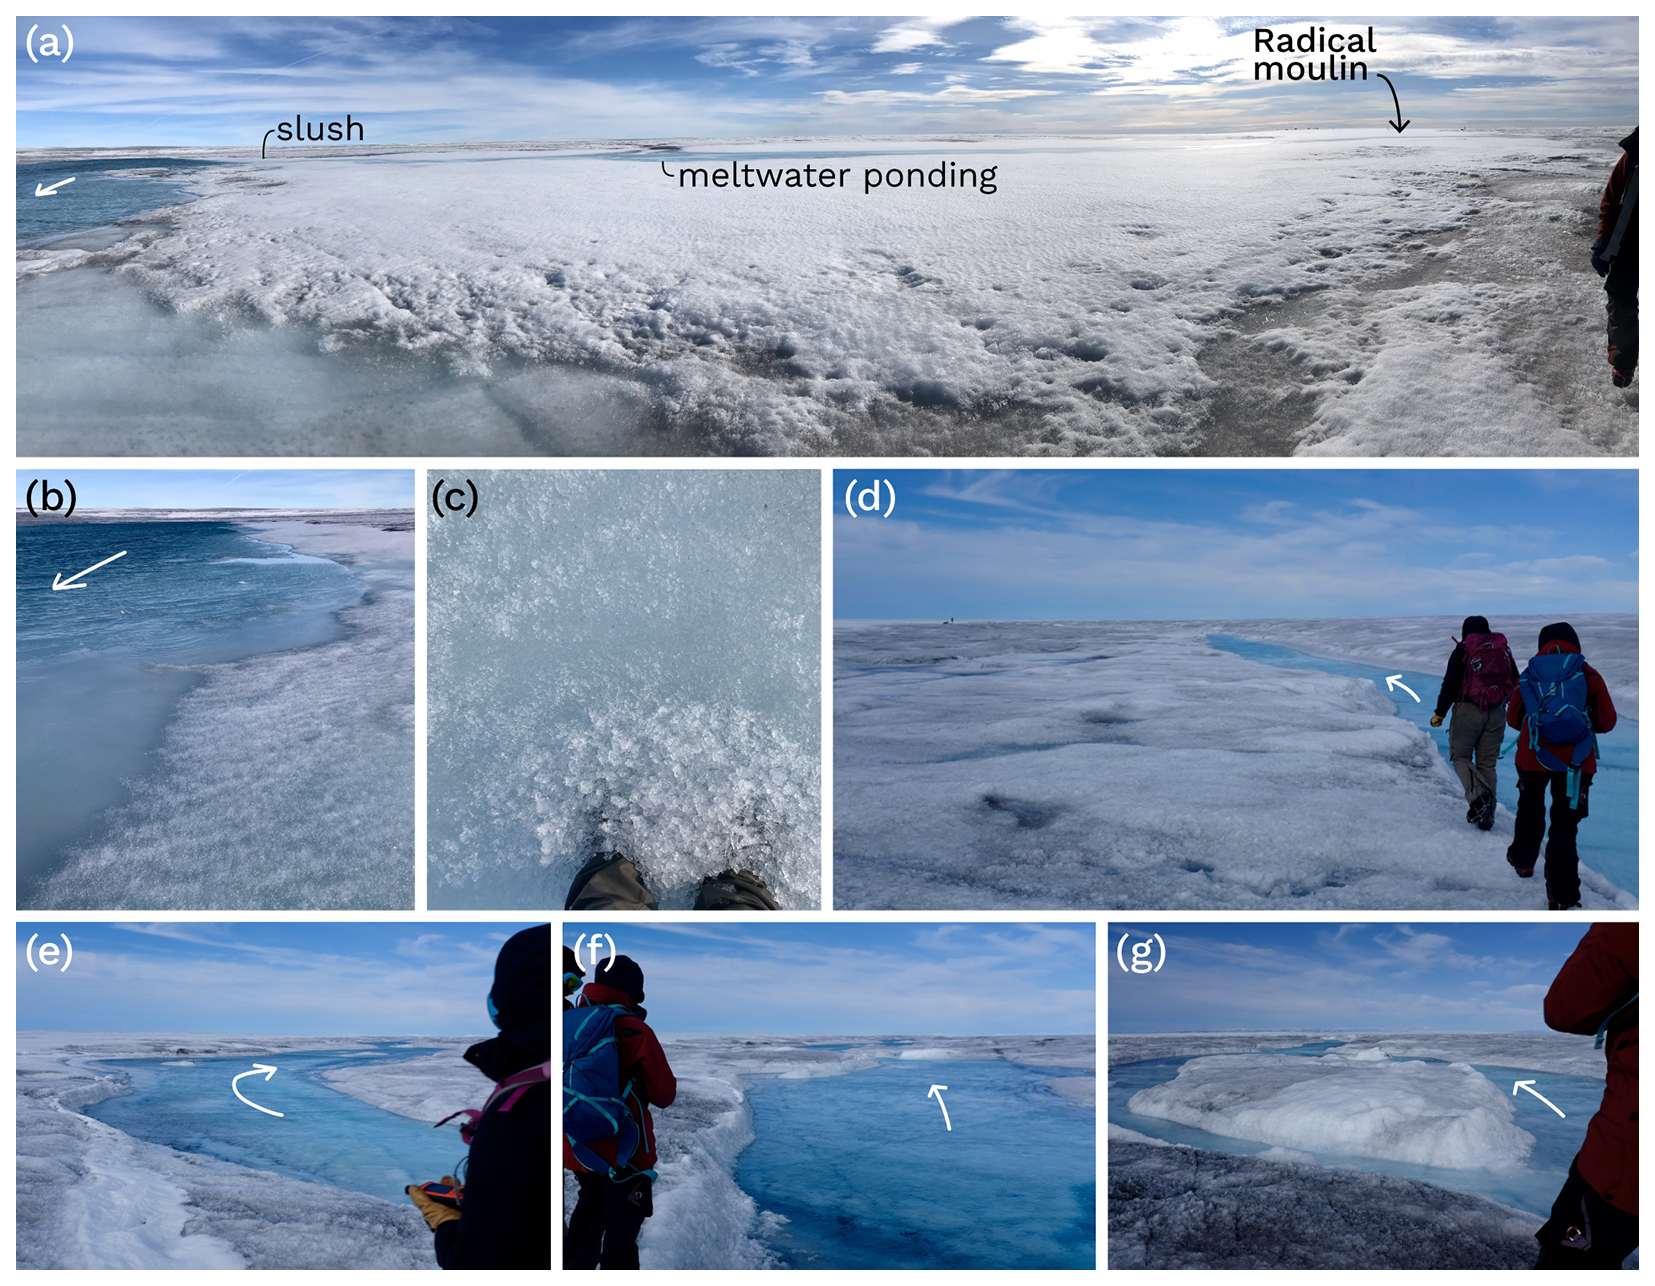
Figure 10Radical River mapping photos, 2018. (a) Snow-plugged incised channel occupied during the 2017 melt season, which led to Radical Moulin approximately 200 m away (right). (b–c) Slushy transition at the stream/snowplug interface. (d–e) Radical River flowing perpendicular to ice surface elevation contours. (f) Approaching and (g) at the topographic high separating Radical and Mars drainage basins.
3.2.1 Flow routing in 2019
During the 2019 melt season, both Radical River and the channel that drained Mars Lake reformed along the same flow paths as in 2018, reactivating Phobos Moulin (Figs. 7a, 9a, d). ArcSav Lake, however, drained through a new 0.9 km channel extending north of the lake shoreline, parallel to the channels draining the lake in 2017 and 2018. Instead of reactivating an existing moulin in the same area as ArcSav Moulin or Mars Moulin as in previous years, the channel continued north for an additional 500 m before it emptied into Phobos Moulin. This 500 m extension of the channel draining ArcSav Lake therefore resulted in the merging of ArcSav and Mars catchments in 2019, the later which had already merged with Radical catchment the previous year. In 2019 Phobos Moulin drained an additional 3.9 km2 of the ice surface (Fig. 1d). As a result, all three catchments in this study merged into one large 31.7 km2 catchment containing five supraglacial lakes and more than 33 km of supraglacial streams routing water into Phobos Moulin by the 2019 melt season.
IDCs are thought to be spatially fixed (Karlstrom and Yang, 2016) due to the pronounced influence of basal topography on moulin location and drainage network architecture (Crozier et al., 2018) however, our observations of the coalescence of three neighboring IDCs over three consecutive melt seasons demonstrate IDCs can vary on interannual timescales. While the slope of large-scale ice surface topography is the primary control on the flow of supraglacial streams, lakes overflowing drainage divides and subsequent thermal-fluvial erosion enables upslope stream flow relative to the slope of surrounding topography, which, even over short distances, can dramatically alter catchment-scale hydrology. Indeed, supraglacial meltwater routing generally adhered to large-scale ice surface slope with streams following the strongest downslope gradient (Crozier et al., 2018; Karlstrom and Yang, 2016). Our observations demonstrate that stream flow deviation from predicted paths over length scales on the order of a few hundred meters, even if accounting for a small fraction (< 10 %) of the overall stream network length within any individual catchment, can alter catchment-scale hydrology by rerouting streamflow away from the terminal moulin of each catchment. Below we identify local controls on flow routing responsible for observed IDC interannual variability in our study area.
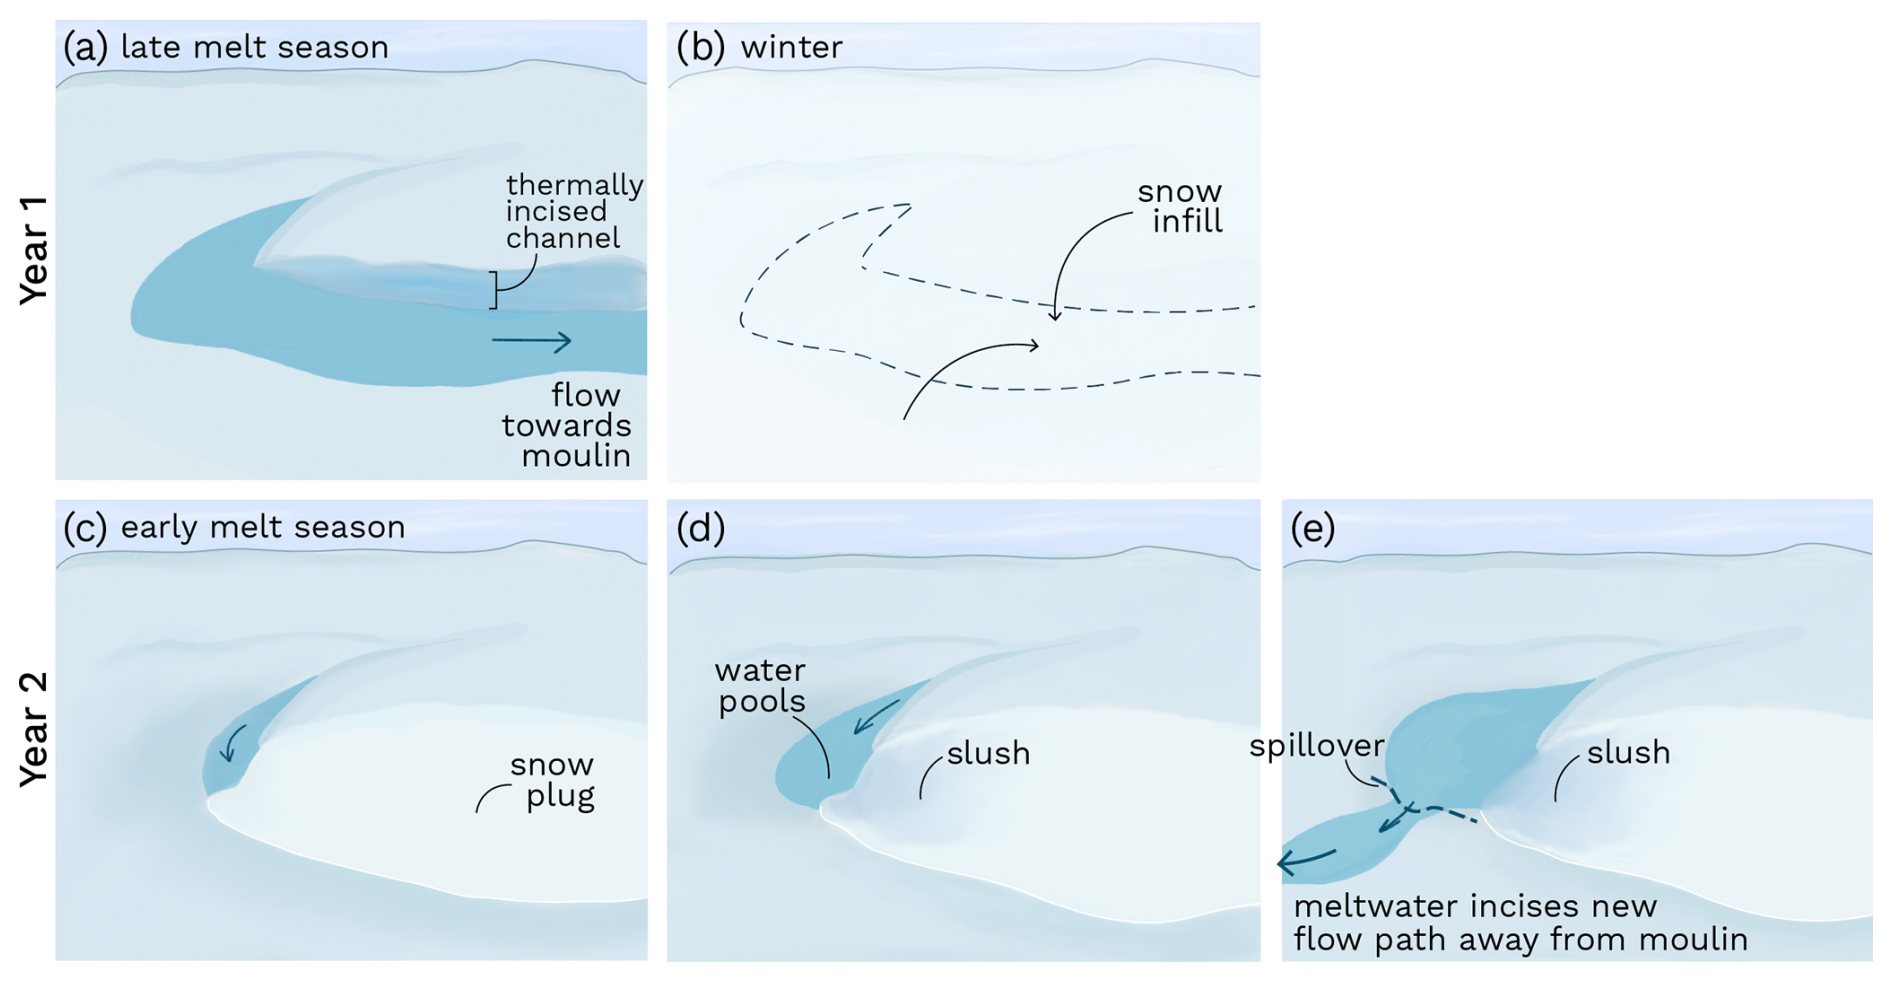
Figure 11Conceptual model of snow-plugged channel diverting meltwater flow. Year 1, (a) a thermally incised supraglacial stream flows towards a moulin. (b) Snow-infill of incised stream over winter. Year 2, (c) During the following summer, supraglacial streams route meltwater to the snow-plugged incised stream formed the previous year. (d) Meltwater pools behind the snowplug while water penetrates and begins to melt the snow, creating a slushy boundary. (e) Meltwater delivery outpaces snowplug melt and pooled meltwater begins to spillover a local high-point and is rerouted away from snowplug.
4.1 Local controls on flow routing
The slow drainage of supraglacial lakes by overtopping a spillway and draining into moulins outside of the lake basin explains the 2017–2019 drainage of ArcSav Lake. The larger area occupied by ArcSav Lake in July of each year (Figs. 3h, 7a) encompassed the region where the incised depth of supraglacial streams increased along the flow direction. We interpret these observations as indicating that the drainage of ArcSav Lake began when lake water level reached the lowest point on the drainage divide (on the northern shoreline) and initiated a spillover event which formed ArcSav stream. Each year water from ArcSav Lake incised a new stream in the same location and abandoned the uplifted and snow-filled relic channel which drained the lake the previous year. The drainage of ArcSav Lake is consistent with drainage patterns identified by Karlstrom and Yang (2016) where supraglacial streams form parallel to abandoned streams that have advected out of topographic lows. The drainage location of ArcSav Catchment is therefore dependent upon the presence of a crevasse or moulin intersecting the lake drainage path, the absence of which explains the drainage of ArcSav Lake into Phobos Moulin in 2019.
The drainage of Mars Lake was more variable, accomplished by either the reactivation of relic channels or the overtopping and spillover of another point on the drainage divide. The presence of snow bridges over the most canyonized reaches of the stream draining Mars Lake (Fig. 3e–f) and gaps in snow-cover over identified in satellite imagery acquired prior to the 2017 melt season (Fig. 3h), indicate Mars Lake drained by melting through the base of a preexisting snow-plugged channel that cut through the drainage divide west of the lake shoreline. After breaching the drainage divide, the stream flowed downslope until intersecting a new crevasse that hydrofractured to the bed and formed Mars Moulin. Over the subsequent winter, snow-infill of the incised channel would have reformed a snowplug meanwhile additional snow deposition overtop existing snow bridges would have further increased their height.
In 2018, instead of lake water melting through the base of the snow-plugged channel to reactive this drainage path, Mars Lake drained when lake water over-topped the second lowest point on the drainage divide and initiated a spillover event. Drainage through the second lowest point occurred because wintertime snow deposition overtop the snow-filled channel would have melted more slowly than the surrounding ice due to the higher albedo of snow, thereby increasing the height of the topographic low which originally drained the lake. The spillover of lake water through this new area of the drainage divide created a new channel that thermally incised through the topographic high and directed water away from Mars Moulin and into Phobos Moulin. Ultimately, our observations from Mars Lake demonstrate lake water can melt through snow-plugged channels, however, when lake infill outpaces melt through the snowplug (Fig. 7i), the lake will overtop and spillover a new, higher-elevation region on the drainage divide to form a new drainage path.
The rerouting of Radical River, which drained Radical Catchment, can be explained by the same hydraulic processes observed within Mars Catchment, albeit at a smaller scale. In 2018, Radical River reformed over much of the same area it had occupied in the previous year, following local surface gradients until reaching a snowplug formed by the overwinter snow-infill of the most deeply incised part of the 2017 channel (Fig. 11c). Liquid water delivered to the river-snowplug intersection would have begun to saturate and melt the snowplug, initiating some amount of porous media flow at the snowplug base (Fig. 11d). At this point, the time required to melt through and reactive the snow-plugged channel will compete against the time required to fill the surface depression to level of the next spillover point. If meltwater delivery to this depression outpaces snowplug melt, water will begin to pool behind the snowplug (Fig. 11d). Once enough water pools, it will eventually overtop and spillover the next lowest point of the surface depression (Fig. 11e), incising a new channel that could redirect streamflow away from the snowplug. While a spillover event could occur over the snowplug itself, snow deposition overtop snowplugs, coupled with the lower ablation rates resulting from the higher albedo of snow, creates conditions that promote the tendency of snowplugs to become local high points. Where the slope of large-scale topography is shallow, as in the case of Radical River, pooling and spillover of meltwater within multiple sub-meter surface depressions could divert flow away from a snow-plugged terminal moulin and instead through a drainage divide. In this way, the slope of small scale ice surface topography can alter catchment geometry over large scales of tens of kilometers.
Snow infill of relic incised channels can alter IDC geometry if supraglacial streams are diverted away from the area of high extensional strain that contain new crevasses or relic moulins that previously drained the catchment. Whether water will melt through and reactivate a snow-plugged channel or be diverted away from a snowplug will be determined by the outcome of the competition between snowplug thaw and the overtopping of the local depression formed at the stream-snowplug intersection. The rate at which pooling meltwater can melt through the snowplug will depend upon snowplug geometry, snow-water contact area, snow temperature and porosity, local surface slope at the base of the snow-plugged channel, and water temperature. The rate of depression infill will depend upon the geometry of the surface depression, the magnitude and timing of meltwater production and discharge into the surface depression. This logic could also extend to the drainage or absence of drainage of supraglacial lakes. We would ultimately expect flow diversion away from snowplugs to be favored in areas with large snow-plugs and shallow surface slopes.
When changes in flow routing affect lake infilling rates they can have a cascading effect wherein changes in one catchment can induce subsequent changes in flow routing within neighboring catchments. This cascading influence is illustrated by the redirection of Radical River which effectively tripled the catchment area draining into Mars Lake. This larger area draining into Mars Lake would have increased lake filling rates which likely contributed to the over-topping of Mars Lake and redirection of flow through a new channel into Phobos Moulin in 2018. Catchment consolidation may increase lake filling rates in a way similar to high-intensity melt seasons. Although warmer years may also increase the temperature of lake water (Tedesco et al., 2012) which could hasten the ability of water to melt through snow-plugged channels. An increase in catchment area or high intensity melting could increase lake filling rates enough to outpace snowplug melt and encourage drainage over the next lowest point on the drainage divide, potentially changing the geometry, number, and distribution of IDCs.
4.2 Implications
Lakes overflowing drainage divides, thermal-fluvial incision and snowplug formation should have the greatest influence on catchment-scale hydrology in high-elevation areas of the GrIS where surface slopes are shallow and moulin density is low. With increasing distance from the GrIS margin, the slope of ice surface topography shallows, the number of supraglacial lakes increases (Morriss et al., 2013), and moulin density decreases (Clason et al., 2015; Mejia et al., 2022; Yang et al., 2018). In areas where surface slopes are high, streams diverted away from snow-plugged channels will likely be directed back towards the area of high-extensional strain containing new crevasses or relic moulins (St Germain and Moorman, 2019). In areas with shallow surface slopes, flow diversion away from moulins should be more likely because channels would require a lesser degree of thermal incision to cut through drainage divides separating IDCs. Similar to Yang et al. (2016) who found that multi-channel supraglacial rivers are more abundant in low slope areas of the GrIS, we observed stream widening and the development of multi-channel systems as Radical River navigated over the drainage divide separating Radical and Mars Catchments (Figs. 9c–d, 10e–g). The formation of thermally eroded anastomosing streams should assist supraglacial streams in breaching drainage divides where surface slopes are shallow.
The number of crevasses and moulins decreases with distance from the ice sheet margin, resulting in larger and fewer IDCs (Clason et al., 2015; Yang et al., 2018). In areas with high moulin density, such as on alpine glaciers or in lower-elevation parts of the GrIS ablation area (Lampkin and Vanderberg, 2014; Yang et al., 2016), supraglacial streams will only need to flow a short distance, on the order of a few hundred meters, before reaching another crevasse or moulin in which they can drain. The proximity of other drainage locations will minimize the impact of a change in flow routing on catchment geometry or the distribution of meltwater inputs to the bed. Areas with low moulin density, such as in mid-to-higher elevation regions of the GrIS ablation area, (e.g., for elevations greater than 900 m a.s.l. in Paakitsoq), supraglacial streams will have to carry water over long distances, on the order of several kilometers, before encountering another crevasse or moulin in which they can drain. In both cases catchments may exhibit interannual variability however, the magnitude of change in the number and geometry of IDCs and location of surface-to-bed hydraulic connections will be magnified in higher elevation areas where moulin density is low.
IDCs are important for modulating the timing and volume of meltwater delivery to moulins, with longer meltwater routing delays for larger catchments. Heterogeneity in IDC area is reflected in the timing of meltwater delivery to GrIS moulins, where lags between the timing of peak meltwater production and peak meltwater delivery to moulins can range from 0.4 to more than 9 hours according to models (Smith et al., 2017) and in situ observations (McGrath et al., 2011; Mejia et al., 2022). The increase in IDC area with distance inland from the margin affects the timing of meltwater inputs to the bed such that peak meltwater delivery to moulins occurs earlier in the day at lower elevations, and progressively later in the day further inland (Mejia et al., 2022), a pattern repeated in the timing of daily peak sliding speeds (Hoffman et al., 2011). Spatial and temporal differences in peak subglacial pressurization increase the area of the bed that is resisting flow (Ryser et al., 2014), and can dampen the effect of meltwater inputs on sliding (Crozier et al., 2018; Mejia et al., 2022). As such, changes in IDCs that reduce moulin density will further delay the timing of peak discharge into moulins while also increasing the area of the bed resisting flow. While the proportion of the bed actively connected to meltwater input drainage should scale with meltwater flux and the seasonal evolution of the subglacial drainage system (Andrews et al., 2014; Hoffman et al., 2016; Mejía et al., 2021), the removal of point sources of meltwater accessing the bed should result in a larger area of the bed resisting flow. Given the influence of the supraglacial drainage system on inputs to the subglacial drainage system, future work should evaluate the influence of spatiotemporal IDC variability on ice dynamics and subglacial drainage system evolution within higher-elevation regions of the GrIS ablation area.
The use of static drainage basin areas and moulin locations by surface hydrology models limits their ability to assess the impact of IDC variability on hydrodynamic coupling. Modeled moulin locations are either based on surface topography (e.g., positioned in topographic lows Banwell et al., 2013; Banwell et al., 2016), or identified from satellite imagery (Koziol et al., 2017). Moulin location detection from satellite imagery is time-intensive due to the lack of automated approaches currently available, hindering the feasibility of surface hydrology models using a timeseries of moulin location to assess IDC interannual variability. We suggest an alternative approach that leverages the criteria for flow rerouting presented here with preexisting moulin locations. This approach would entail flagging moulins vulnerable to flow diversion such as those located in high-elevation areas with shallow surface slopes and where supraglacial stream incision rates are high enough to encourage snowplug formation. Flagged moulins can then be activated or deactivated in any given melt season to reflect the IDC consolidation observed in this study. With these changes preexisting models can be used to explore changes to model parameters such as lake filling rates, supraglacial meltwater routing delays, the timing of supraglacial lake drainages, and the meltwater flux into moulins. We encourage future work to explore the ice dynamic implications to IDC variability as we expect high-elevation supraglacial hydrology to become more important as the GrIS ablation area continues to expand inland in response to climatic warming (Noël et al., 2021).
Our observations of the coalescence of three internally drained catchments over three consecutive melt seasons from 2017–2019 demonstrates that not all catchments are spatially fixed but can exhibit interannual variability in their geometry and area. Specifically, we showed that localized ice surface topography, namely snowplug formation in relic streams impounded meltwater which subsequently overflowed and incised through drainage divides, can redirect the largest supraglacial streams within a catchment away from terminal moulins and instead over drainage divides. When a catchment's largest streams are redirected, they may flow against the surface slope of large-scale topography for short (100 s of meters) distances, which can impact catchment scale hydrology by preventing water from accessing the regions of extensional strain that drained the catchments in previous years. We find the importance of thermal-fluvial erosion on catchment-scale flow reorganization can be important at higher elevations distal from the GrIS margin where surface slopes are shallow and moulin density is low. Our work shows that interannual variability of supraglacial catchment number and geometry is possible and we argue that it is more likely to occur at these higher elevations. Due to the low moulin densities in areas further from the ice sheet margin, catchment consolidation could have a greater impact on GrIS hydrodynamic coupling by further decreasing moulin density, modifying catchment areas, and altering the locations of discrete meltwater inputs to the bed. Spatiotemporal variability in catchment geometry and moulin locations should therefore be considered in surface meltwater routing models used to explore the ice dynamic response to future melt increases.
The processed data from the roving GNSS survey are archived via the Arctic Data Center and can be accessed via https://doi.org/10.18739/A2DR2P99W (Mejia and Gulley, 2023). Satellite imagery provided by the Polar Geospatial Center, WorldView imagery © Maxar Inc. ArcticDEM provided by the Polar Geospatial Center and can be accessed at https://doi.org/10.7910/DVN/OHHUKH (Porter et al., 2018).
JM and JG planned the campaign; JG and MC acquired funding; JM, JG, CB, and CT performed the measurements; JM analyzed the data; JM wrote the manuscript; JG, CB, CT, and MC reviewed and edited the manuscript.
The contact author has declared that none of the authors has any competing interests.
Publisher’s note: Copernicus Publications remains neutral with regard to jurisdictional claims made in the text, published maps, institutional affiliations, or any other geographical representation in this paper. While Copernicus Publications makes every effort to include appropriate place names, the final responsibility lies with the authors. Views expressed in the text are those of the authors and do not necessarily reflect the views of the publisher.
We would like to thank V. Siegel and R. Knoll for their contributions to fieldwork with logistical support provided by Polar Field Services Inc. Geospatial support for this work was provided by the Polar Geospatial Center under NSF-OPP awards 1043681 and 1559691. DEMs provided by the Polar Geospatial Center under NSF-OPP awards 1043681, 1559691, and 1542736. The Global GNSS Network (GGN) is operated by UNAVCO, Inc. at the direction of the Jet Propulsion Laboratory (JPL) for the National Aeronautics and Space Administration (NASA) with support from NASA under NSF Cooperative Agreement no. EAR-1261833.
This research has been supported by the Office of Polar Programs (grant no. 1604022).
This paper was edited by Elizabeth Bagshaw and reviewed by two anonymous referees.
Andrews, L. C.: Spatial and temporal evolution of the glacial hydrologic system of the western Greenland ice sheet: observational and remote sensing results, Ph.D. thesis, University at Texas Austin, https://doi.org/10.15781/T2WM4V, 2015. a
Andrews, L. C., Catania, G. A., Hoffman, M. J., Gulley, J. D., Lüthi, M. P., Ryser, C., Hawley, R. L., and Neumann, T. A.: Direct observations of evolving subglacial drainage beneath the Greenland Ice Sheet, Nature, 514, 80–83, https://doi.org/10.1038/nature13796, 2014. a
Banwell, A. F., Arnold, N. S., Willis, I. C., Tedesco, M., and Ahlstrøm, A. P.: Modeling supraglacial water routing and lake filling on the Greenland Ice Sheet, Journal of Geophysical Research F: Earth Surface, 117, 1–11, https://doi.org/10.1029/2012JF002393, 2012. a
Banwell, A. F., Willis, I. C., and Arnold, N. S.: Modeling subglacial water routing at Paakitsoq, W Greenland, Journal of Geophysical Research: Earth Surface, 118, 1282–1295, https://doi.org/10.1002/jgrf.20093, 2013. a, b
Banwell, A. F., Hewitt, I. J., Willis, I. C., and Arnold, N. S.: Moulin density controls drainage development beneath the Greenland ice sheet, Journal of Geophysical Research: Earth Surface, 121, 2248–2269, https://doi.org/10.1002/2015JF003801, 2016. a, b
Catania, G. A. and Neumann, T. A.: Persistent englacial drainage features in the Greenland Ice Sheet, Geophysical Research Letters, 37, 1–5, https://doi.org/10.1029/2009GL041108, 2010. a
Clason, C. C., Mair, D. W., Nienow, P. W., Bartholomew, I. D., Sole, A. J., Palmer, S., and Schwanghart, W.: Modelling the transfer of supraglacial meltwater to the bed of Leverett Glacier, Southwest Greenland, The Cryosphere, 9, 123–138, https://doi.org/10.5194/tc-9-123-2015, 2015. a, b
Conrad, O., Bechtel, B., Bock, M., Dietrich, H., Fischer, E., Gerlitz, L., Wehberg, J., Wichmann, V., and Böhner, J.: System for Automated Geoscientific Analyses (SAGA) v. 2.1.4, Geosci. Model Dev., 8, 1991–2007, https://doi.org/10.5194/gmd-8-1991-2015, 2015. a
Covington, M. D., Gulley, J., Trunz, C., Mejia, J., and Gadd, W.: Moulin Volumes Regulate Subglacial Water Pressure on the Greenland Ice Sheet, Geophysical Research Letters, 47, 1–9, https://doi.org/10.1029/2020GL088901, 2020. a
Crozier, J., Karlstrom, L., and Yang, K.: Basal control of supraglacial meltwater catchments on the Greenland Ice Sheet, The Cryosphere, 12, 3383–3407, https://doi.org/10.5194/tc-12-3383-2018, 2018. a, b, c, d, e
Echelmeyer, K., Clarke, T. S., and Harrison, W. D.: Surficial glaciology of Jakobshavns Isbrae, West Greenland: part I. Surface morphology, Journal of Glaciology, 37, 368–382, https://doi.org/10.1017/S0022143000005803, 1991. a
Gudmundsson, G. H.: Transmission of basal variability to a glacier surface, Journal of Geophysical Research: Solid Earth, 108, 1–19, https://doi.org/10.1029/2002jb002107, 2003. a
Gulley, J., Benn, D. I., Müller, D., and Luckman, A. J.: A cut-and-closure origin for englacial conduits in uncrevassed regions of polythermal glaciers, Journal of Glaciology, 55, 66–80, https://doi.org/10.3189/002214309788608930, 2009. a
Herring, T., King, R. W., and McClusky, S. C.: Introduction to GAMIT/GLOBK, Mass. Inst. of Technol., Cambridge, Mass [code], https://geoweb.mit.edu/gg/Intro_GG.pdf (last access: 5 January 2023), 2010. a
Hoffman, M. J., Catania, G. A., Neumann, T. A., Andrews, L. C., and Rumrill, J. A.: Links between acceleration, melting, and supraglacial lake drainage of the western Greenland Ice Sheet, Journal of Geophysical Research: Earth Surface, 116, 1–16, https://doi.org/10.1029/2010JF001934, 2011. a
Hoffman, M. J., Andrews, L. C., Price, S. F., Catania, G. A., Neumann, T. A., Lüthi, M. P., Gulley, J. D., Ryser, C., Hawley, R. L., and Morriss, B.: Greenland subglacial drainage evolution regulated by weakly connected regions of the bed, Nature Communications, 7, 13903, https://doi.org/10.1038/ncomms13903, 2016. a
Ignéczi, Á., Sole, A. J., Livingstone, S. J., Ng, F. S., and Yang, K.: Greenland Ice Sheet Surface Topography and Drainage Structure Controlled by the Transfer of Basal Variability, Frontiers in Earth Science, 6, https://doi.org/10.3389/feart.2018.00101, 2018. a
Karlstrom, L. and Yang, K.: Fluvial supraglacial landscape evolution on the Greenland Ice Sheet, Geophysical Research Letters, 43, 1–10, https://doi.org/10.1002/2016GL067697, 2016. a, b, c, d, e
Koziol, C. P., Arnold, N. S., Pope, A., and Colgan, W. T.: Quantifying supraglacial meltwater pathways in the Paakitsoq region, West Greenland, Journal of Glaciology, 63, 464–476, https://doi.org/10.1017/jog.2017.5, 2017. a
Lampkin, D. J.: Supraglacial lake spatial structure in western Greenland during the 2007 ablation season, Journal of Geophysical Research: Earth Surface, 116, 1–13, https://doi.org/10.1029/2010JF001725, 2011. a
Lampkin, D. J. and Vanderberg, J.: Supraglacial melt channel networks in the Jakobshavn Isbræ region during the 2007 melt season, Hydrological Processes, 28, 6038–6053, https://doi.org/10.1002/hyp.10085, 2014. a
Leeson, A. A., Shepherd, A., Palmer, S., Sundal, A., and Fettweis, X.: Simulating the growth of supraglacial lakes at the western margin of the Greenland ice sheet, The Cryosphere, 6, 1077–1086, https://doi.org/10.5194/tc-6-1077-2012, 2012. a
Maxar: Accuracy of WorldView Products, Vantor [data set], https://resources.maxar.com/white-papers/accuracy-of-worldview-products (last access: 24 March 2024), 2021. a
McGrath, D., Colgan, W. T., Steffen, K., Lauffenburger, P., and Balog, J.: Assessing the summer water budget of a moulin basin in the sermeq avannarleq ablation region, Greenland ice sheet, Journal of Glaciology, 57, 954–964, https://doi.org/10.3189/002214311798043735, 2011. a, b, c
Mejia, J. and Gulley, J.: Supraglacial stream mapping and elevation determination for two mid-elevation catchments in the Paakitsoq region of the western Greenland Ice Sheet, 2017, Arctic Data Center [data set], https://doi.org/10.18739/A2DR2P99W, 2023. a, b
Mejía, J. Z., Gulley, J. D., Trunz, C., Covington, M. D., Bartholomaus, T. C., Xie, S., and Dixon, T.: Isolated cavities dominate Greenland Ice Sheet dynamic response to lake drainage, Geophysical Research Letters, 48, 1–11, https://doi.org/10.1029/2021gl094762, 2021. a, b
Mejia, J. Z., Gulley, J., Trunz, C., Covington, M. D., Bartholomaus, T. C., Breithaupt, C. I., Xie, S., and Dixon, T. H.: Moulin density controls the timing of peak pressurization within the Greenland Ice Sheet's subglacial drainage system, Geophysical Research Letters, 1–13, https://doi.org/10.1002/essoar.10511864.1, 2022. a, b, c, d, e, f, g
Morriss, B. F., Hawley, R. L., Chipman, J. W., Andrews, L. C., Catania, G. A., Hoffman, M. J., Lüthi, M. P., and Neumann, T. A.: A ten-year record of supraglacial lake evolution and rapid drainage in West Greenland using an automated processing algorithm for multispectral imagery, The Cryosphere, 7, 1869–1877, https://doi.org/10.5194/tc-7-1869-2013, 2013. a, b, c, d, e, f, g, h
Noël, B., van Kampenhout, L., Lenaerts, J. T. M., van de Berg, W. J., and van den Broeke, M. R.: A 21 st Century Warming Threshold for Sustained Greenland Ice Sheet Mass Loss , Geophysical Research Letters, 1–9, https://doi.org/10.1029/2020gl090471, 2021. a
Porter, C., Morin, P., Howat, I. M., Noh, M.-J., Bates, B., Peterman, K., Keesey, S., Schlenk, M., Gardiner, J., Tomko, K., Willis, M. J., Kelleher, C., Cloutier, M., Husby, E., Foga, S., and Nakamura, H.: ArcticDEM, Version 3, Harvard Dataverse [data set], https://doi.org/10.7910/DVN/OHHUKH, 2018. a, b
Raymond, C. F., Benedict, R. J., Harrison, W. D., Echelmeyer, K. A., and Sturm, M.: Hydrological discharges and motion of Fels and Black Rapids Glaciers, Alaska, USA: implications for the structure of their drainage systems, Journal of Glaciology, 41, 290–304, 1995. a
Ryser, C., Lüthi, M. P., Andrews, L. C., Hoffman, M. J., Catania, G. A., Hawley, R. L., Neumann, T. A., and Kristensen, S. S.: Sustained high basal motion of the Greenland ice sheet revealed by borehole deformation, Journal of Glaciology, 60, 647–660, https://doi.org/10.3189/2014JoG13J196, 2014. a
Smith, L. C., Chu, V. W., Yang, K., Gleason, C. J., Pitcher, L. H., Rennermalm, Å. K., Legleiter, C. J., Behar, A. E., Overstreet, B. T., Moustafa, S. E., Tedesco, M., Forster, R. R., Lewinter, A. L., Finnegan, D. C., Sheng, Y., Balog, J., and England, J. H.: Efficient meltwater drainage through supraglacial streams and rivers on the southwest Greenland ice sheet, Proceedings of the National Academy of Sciences, 112, 1001–1006, https://doi.org/10.1073/pnas.1413024112, 2015. a, b, c, d
Smith, L. C., Yang, K., Pitcher, L. H., Overstreet, B. T., Chu, V. W., and Rennermalm, Å. K.: Direct measurements of meltwater runoff on the Greenland ice sheet surface, Proceedings of the National Academy of Sciences, 114, 1–10, https://doi.org/10.1073/pnas.1707743114, 2017. a
St Germain, S. L. and Moorman, B. J.: Long-Term observations of supraglacial streams on an arctic glacier, Journal of Glaciology, 65, 900–911, https://doi.org/10.1017/jog.2019.60, 2019. a
Sundal, A. V., Shepherd, A., Nienow, P. W., Hanna, E., Palmer, S., and Huybrechts, P.: Melt-induced speed-up of Greenland ice sheet offset by efficient subglacial drainage, Nature, 469, 521–524, https://doi.org/10.1038/nature09740, 2011. a
Tedesco, M., Lthje, M., Steffen, K., Steiner, N., Fettweis, X., Willis, I. C., Bayou, N., and Banwell, A. F.: Measurement and modeling of ablation of the bottom of supraglacial lakes in western Greenland, Geophysical Research Letters, 39, 1–5, https://doi.org/10.1029/2011GL049882, 2012. a
Tedesco, M., Willis, I. C., Hoffman, M. J., Banwell, A. F., Alexander, P., and Arnold, N. S.: Ice dynamic response to two modes of surface lake drainage on the Greenland ice sheet, Environmental Research Letters, 8, https://doi.org/10.1088/1748-9326/8/3/034007, 2013. a
Wang, L. and Liu, H.: An efficient method for identifying and filling surface depressions in digital elevation models for hydrologic analysis and modelling, International Journal of Geographical Information Science, 20, 193–213, https://doi.org/10.1080/13658810500433453, 2006. a, b
Willis, I. C., Arnold, N. S., and Brock, B. W.: Effect of snowpack removal on energy balance, melt and runoff in a small supraglacial catchment, Hydrological Processes, 16, 2721–2749, https://doi.org/10.1002/hyp.1067, 2002. a, b
Yang, K. and Smith, L. C.: Internally drained catchments dominate supraglacial hydrology of the southwest Greenland Ice Sheet, Journal of Geophysical Research: Earth Surface, 121, 1891–1910, https://doi.org/10.1002/2016JF003927, 2016. a
Yang, K., Smith, L. C., Chu, V. W., Gleason, C. J., and Li, M.: A caution on the use of surface digital elevation models to simulate supraglacial hydrology of the Greenland ice sheet, IEEE Journal of Selected Topics in Applied Earth Observations and Remote Sensing, 8, 5212–5224, https://doi.org/10.1109/JSTARS.2015.2483483, 2015. a
Yang, K., Smith, L. C., Chu, V. W., Pitcher, L. H., Gleason, C. J., Rennermalm, Å. K., and Li, M.: Fluvial morphometry of supraglacial river networks on the southwest Greenland Ice Sheet, GIScience & Remote Sensing, 1603, https://doi.org/10.1080/15481603.2016.1162345, 2016. a, b, c, d
Yang, K., Smith, L. C., Karlstrom, L., Cooper, M. G., Tedesco, M., van As, D., Cheng, X., Chen, Z., and Li, M.: A new surface meltwater routing model for use on the Greenland Ice Sheet surface, The Cryosphere, 12, 3791–3811, https://doi.org/10.5194/tc-12-3791-2018, 2018. a, b, c, d