the Creative Commons Attribution 4.0 License.
the Creative Commons Attribution 4.0 License.
 | 25 Nov 2025
Seasonal drainage-system evolution beneath the Greenland Ice Sheet inferred from transient speed-up events
Grace Gjerde
Mark D. Behn
Laura A. Stevens
Sarah B. Das
Ian Joughin
The transport of meltwater from the surface to the bed of the Greenland Ice Sheet is well understood to result in elevated surface velocities, although this relationship remains poorly resolved on a seasonal scale. Transient speed-ups associated with supraglacial lake drainages, which generally occur in the early-to-mid summer melt season, have been studied in detail. However, the connection between basal hydrology and ice dynamics is less well understood in the late melt season, after most lakes have ceased draining and meltwater input to the bed is through widely distributed moulins. Here, we use a Global Positioning System (GPS) array to investigate transient speed-up events in response to runoff across the 2011 and 2012 melt seasons and use these data to infer the evolution of subglacial conditions beneath the ice sheet in western Greenland. We find no relationship between the magnitude of runoff and the amplitude of speed-up events; we do observe a general trend of increasing velocity responses and decreasing variability in the velocity response across the GPS array as the melt season progresses. Early-season transient speed-ups (frequently associated with lake drainages) produce highly variable speed-up and pronounced uplift across the array. The variability across the array during a lake drainage corresponds with the bedrock topography and persists on annual timescales. By contrast, late-season melt events produce longer, higher amplitude, and more uniform velocity responses, but do not produce large or coherent uplift patterns. We interpret our results to imply that by the late melt season, most subglacial channels and/or connective flow pathways between cavities are closing or have closed, sharply lowering basal transmissivity. At the same time, moulins formed throughout the melt season remain open, producing pervasive and widely distributed surface-to-bed pathways. The result is that small magnitude, late-season melt events can rapidly supply meltwater to the bed and overwhelm the subglacial system, decreasing frictional coupling. This late-season response contrasts with early-season lake drainage events when surface-to-bed pathways are not yet open, and therefore, similarly small magnitude melt events do not have the same impact. Finally, we show that due to their extended duration and amplitude, late-season melt events accommodate a larger fraction of the annual ice motion than early-season lake drainages but their net influence on ice-sheet motion remains small (2 %–3 % of annual displacement).
- Article
(9097 KB) - Full-text XML
-
Supplement
(982 KB) - BibTeX
- EndNote


The rate of mass loss from the Greenland Ice Sheet is accelerating (Hanna et al., 2024) due to a combination of increased surface melting (van den Broeke et al., 2009; Hanna et al., 2013) and changes in ice-sheet flow dynamics (Pritchard et al., 2009; Schoof, 2010; Hewitt, 2013; Flowers, 2015). Global positioning system (GPS) observations of ice motion show that ice velocities and surface melt increase in tandem on both seasonal (Zwally et al., 2002) and daily-to-weekly timescales (van de Wal et al., 2008; Bartholomew et al., 2011; Andrews et al., 2014; van de Wal et al., 2015). However, the relationship between ice velocity and the input of surface-melt to the bed is often non-linear and varies throughout the melt season (Zwally et al., 2002; Bartholomew et al., 2010; Hoffman et al., 2011; Stevens et al., 2016; Schmid et al., 2023), as subglacial-drainage efficiency evolves and modulates basal sliding (Schoof, 2010; Hewitt, 2013). Untangling these feedbacks has led to challenges in predicting whether, and by how much, ice velocities will change in a warming climate.
One avenue for improving our understanding of the subglacial drainage system is to study how the ice velocities respond to sudden meltwater-input events that produce transient increases in basal sliding. These transient speed-ups can provide insights into basal conditions that cannot be inferred from the background velocity curve alone. The most well-studied of these transient sliding events are associated with rapid supraglacial lake drainages, which occur in the early-to-middle portion of the melt season (Das et al., 2008; Doyle et al., 2013; Stevens et al., 2015; Chudley et al., 2019). In the ablation zone of the Greenland Ice Sheet, summer melting results in the formation of supraglacial lakes, filling topographic closed basins on the ice-sheet surface (Pitcher and Smith, 2019). These lakes, which range from 10s to 1000s of meters in diameter, are observed to drain rapidly (< 1–2 h) via hydro-fractures that form beneath the lake basin (Das et al., 2008; Doyle et al., 2013; Stevens et al., 2015; Chudley et al., 2019). Transient increases in ice-sheet surface velocity coincide with these drainages, as the input of meltwater to the bed reduces friction between the ice and bedrock (Das et al., 2008; Hoffman et al., 2011; Andrews et al., 2014; Andrews et al., 2018). During lake drainage events, transient speed-ups coincide with surface uplift driven by high water pressures in the subglacial drainage system (Das et al., 2008; Hoffman et al., 2011; Andrews et al., 2018). Early-season lake drainages tend to generate sustained sliding anomalies, with the ice remaining uplifted on timescales of days-to-weeks; mid-season lake drainage events have shorter sliding anomalies with uplift confined to timescales of hours-to-days (Lai et al., 2021). These observations suggest that the basal hydrologic transmissivity becomes more efficient beneath the lake as the melt season progresses (Lai et al., 2021). Here, the hydrologic transmissivity is defined as the hydrologic conductivity multiplied by the saturated layer thickness at the ice-bed interface and provides a measure of the ability of meltwater to move through the basal hydrologic system. These findings are consistent with model predictions (Schoof, 2010) and observations (Chandler et al., 2013; Hoffman et al., 2011; Andrews et al., 2014; Andrews et al., 2018; Schmid et al., 2023) premised on a seasonal evolution towards a more channelized subglacial meltwater system with increasing meltwater input (e.g., Schoof, 2010).
However, conflicting observations, such as increased surface uplift during periods of decreasing ice velocity (Andrews et al., 2018), decreasing velocities while average moulin hydraulic head remains constant (Andrews et al., 2014), and, on decadal timescales, declining annual velocities while annual melt increases (Tedstone et al., 2015), have led to multiple interpretations of the mechanisms responsible for observed increases in subglacial drainage efficiency. For example, changes in subglacial cavity connectivity and their subsequent dewatering (Andrews et al., 2014; Tedstone et al., 2015; Hoffman et al., 2016; Andrews et al., 2018) and/or sediment consolidation (Andrews et al., 2014; Clarke, 2005) have both been proposed as potential mechanisms for decreasing velocities. Moreover, the exact timing of the transition from one state to another (e.g., cavities to channels or dilation to consolidation of sediments) is difficult to determine. Ice thickness also plays a role, with subglacial channels under thick ice (≥ 1000 m) closing within hours through viscous creep (Bartholomaus et al., 2011; Chandler et al., 2013; Doyle et al., 2014; Dow et al., 2015; Andrews et al., 2018), and greater overburden pressures promoting sediment compaction (Clarke, 2005).
By the late melt season, infrequent supraglacial lake drainages prevent using lake drainage events to quantify subglacial drainage conditions. However, transient speed-up events associated with melt and/or precipitation are observed late in the melt season and, in some cases, occur after surface velocities have decreased below the average winter velocity (Joughin et al., 2013; Andrews et al. 2018; Ing et al., 2024). Velocity increases driven by regional melt and precipitation events, contrast with those driven by localized lake drainage or “flood” events because these velocity increases are produced by smaller surface-to-bed meltwater fluxes. Studies investigating the transient ice-velocity response to meltwater inputs in the late melt season report contrasting findings on the importance of these melt events for annual ice motion. Doyle et al. (2015) argued that late-season melt events could have a widespread influence on ice velocities in western Greenland, and Schmid et al. (2023) found enhanced short-term melt to be the primary cause of speed-up events rather than lake drainages or precipitation. By contrast, more recent observations by Ing et al. (2024) suggest late-season melt events have a limited impact on annual ice velocities due to their relatively short durations. Thus, the relationship between late-season melt events and basal transmissivity during this period is not well understood, and the lack of direct observations of these melt events limits our ability to make inferences about system behavior. Moreover, it remains uncertain whether late-season melt or precipitation events contribute to ice-sheet acceleration at a magnitude comparable to that of lake drainages.
Here we analyze a series of late-season speed-up events recorded by a GPS array (Fig. 1) deployed near North Lake (68.66° N, 49.52° W; Das et al., 2008) located in the mid-ablation zone of the western margin of the Greenland Ice Sheet, roughly 50 km south of the Sermeq Kujalleq (Jakobshavn-Isbrae) catchment and 25 km up-ice-flow from the terminus of Saqqarliup sermia (Joughin et al., 2013). Using GPS observations of ice-motion surface position in two melt seasons from 2011 and 2012, we use a Network Inversion Filter (NIF) (Stevens et al., 2015) to infer basal slip and basal uplift of a late-season, transient speed-up event and compare it to an early-season lake drainages at the same location. We then extend this analysis to examine the change in subglacial conditions throughout the entire melt season. To do so, we characterize the absolute and relative speed-up magnitude and variability across the GPS array for transient speed-ups associated with both “local” lake drainages and “regional” melt events and compare these values with an estimate of the runoff during the speed-up event. Finally, we interpret our results in the context of physical models for the evolution of the subglacial drainage system.
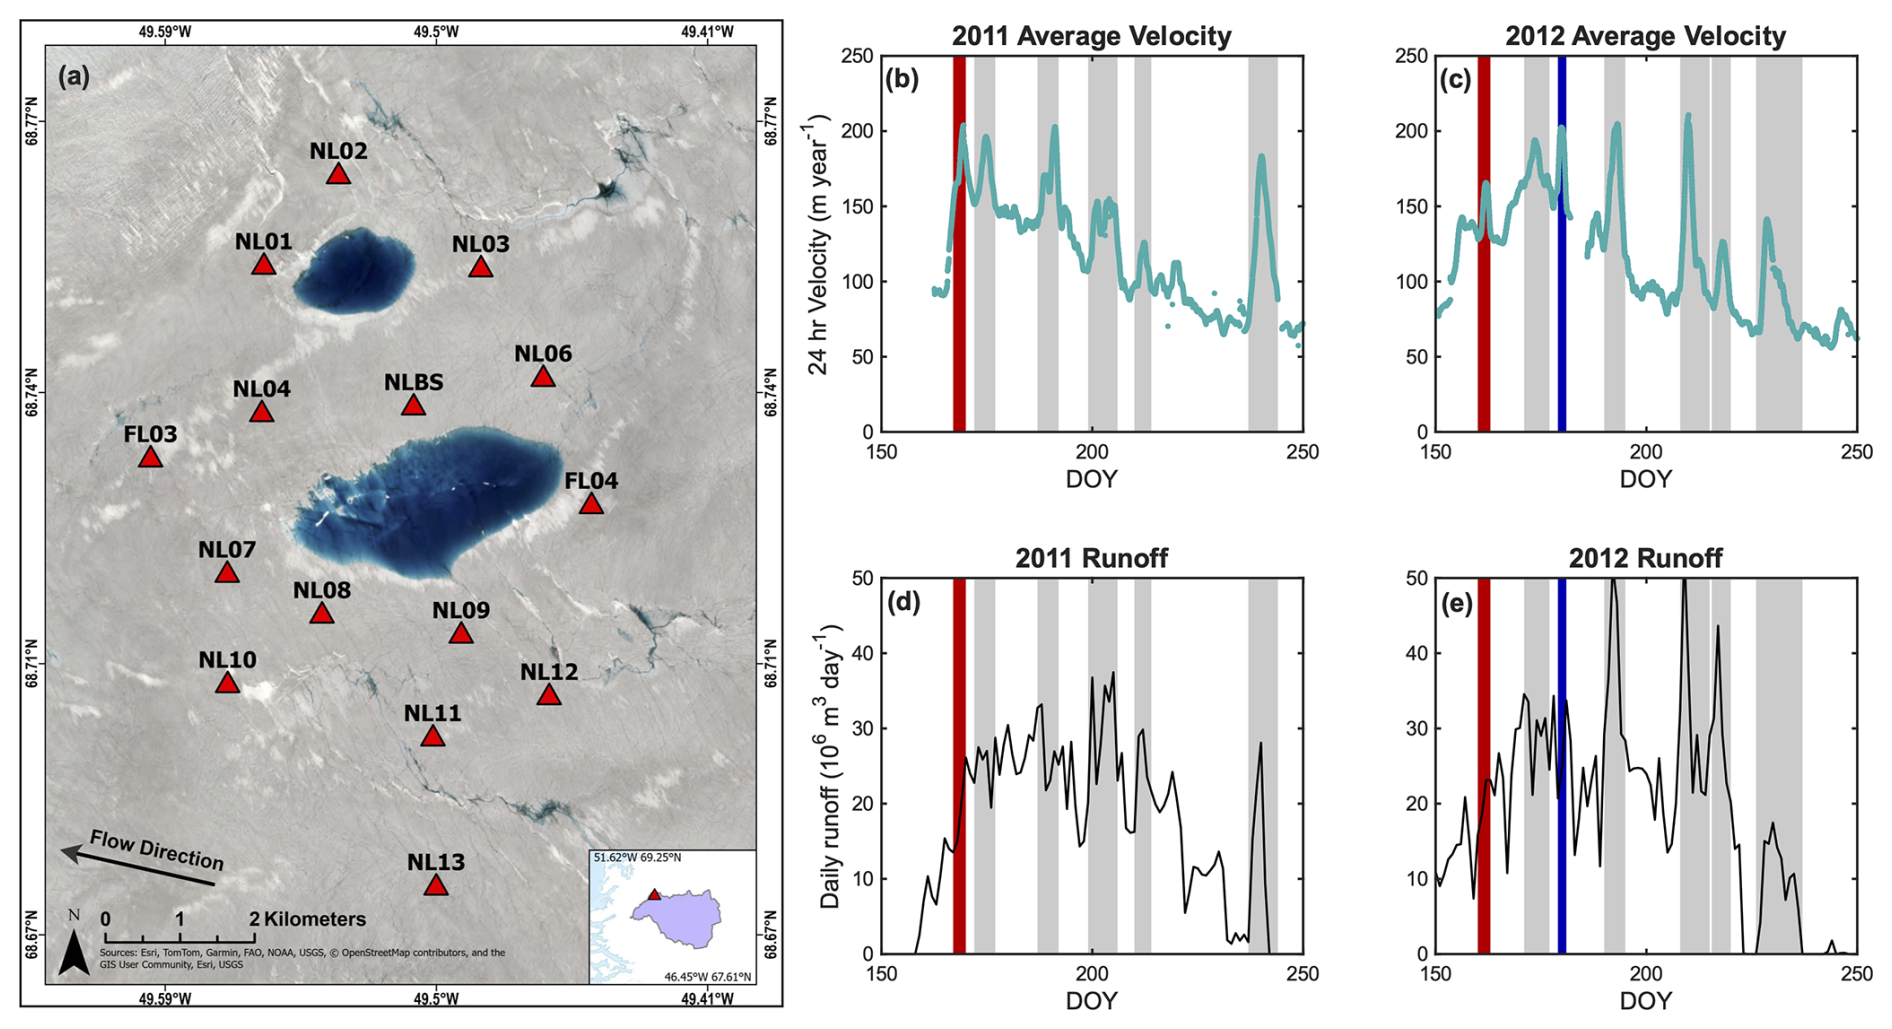
Figure 1(a) Sentinel 2 satellite imagery of study area July 2018. Sentinel 2 processed by Esri. Inset shows location of study area (red triangle) within the ice-surface catchment basin (purple). Red triangles in panel (a) represent GPS sensor locations around North Lake (at center). Annual ice flow direction is indicated. (b–c) Smoothed 24-hour velocity across GPS array and (d–e) runoff estimates based on RACMO for 2011 and 2012, respectively. Grey bars denote time periods of the speed-up events, which were used to calculate event runoff. Red bars show North Lake drainage events via hydro-fracture in which there is additional input of 0.0077 km3 as described in the text. The blue bar represents a nearby lake drainage event as described in the text.
This study utilizes a GPS array and Regional Atmospheric Climate Mode (RACMO) runoff estimates in the ablation zone of the western Greenland Ice Sheet to capture transient speed-ups (Fig. 1). Below we describe the GPS data collection and processing, our application of the Network Inversion Filter (NIF), and our approach for defining and characterizing individual transient speed-up events. We also describe how the runoff for each speed-up event was estimated.
2.1 GPS-observed ice-sheet horizontal velocities and uplift
The North Lake basin is located at ∼ 950 m a.s.l. (Fig. 1a) on ice that is ∼ 980 m thick (Das et al., 2008). It is the field locality for several previous studies on supraglacial lake drainage that use ice-sheet surface position observations from a 16-receiver GPS array deployed from 2011 to 2014 (Stevens et al., 2015, 2016, 2024; Lai et al., 2021). Due to limited data availability in the latter two years of the deployment, we focus on the melt-season observations from 15 receivers in 2011 and 12 receivers in 2012. The GPS data were collected continuously at 30 s resolution on dual frequency Trimble NetR9 receivers. The on-ice stations were individually processed as kinematic sites relative to the Greenland GPS Network (GNET) KAGA base station, situated on bedrock ∼ 55 km away (Bevis et al., 2012; Stevens et al., 2015), using the TRACK module (Chen, 1998) of the GAMIT/GLOBK software package (Herring et al., 2010). The resulting 30 s position estimates, with horizontal (vertical) 1σ errors consistently ±2 cm (±5 cm) across all stations and years (Stevens et al., 2015), were used to calculate along-flow ice-sheet surface velocities using a sliding least-squares regression with a window width of 6 h, following Stevens et al. (2016). The number of stations recording high-quality data varied through the deployment, with a maximum of 15 stations and a minimum of 11 stations available for characterizing a given speed-up event.
We used a Network Inversion Filter (NIF) algorithm (Segall and Matthews, 1997) developed for glaciological applications (Stevens et al., 2015) to characterize the pattern of speed-up associated with a late-season melt event in 2011 and compared this pattern to that observed during a supraglacial lake drainage event at the same location earlier in the year. The NIF inverts timeseries of GPS ice-sheet surface positions for vertical hydro-fracture opening, sub-horizontal slip, and basal-cavity opening (Stevens et al., 2015), assuming the ice behaves as a homogeneous, elastic material (Okada, 1985; Segall, 2010). This assumption is valid for ice deformation during or immediately following a lake drainage or similar transient speed-up (Stevens et al., 2015; Lai et al., 2021). The NIF quantifies the increased rate of ice flow relative to a background rate estimated from pre-speed-up event station velocities. For example, Stevens et al. (2015) utilized the NIF to investigate a series of early-season supraglacial lake drainages at North Lake from 2011–2013. For the 2011 lake drainage event on day of year (DOY) 169 (i.e., 2011/169), they reported a maximum surface uplift of 0.6 m and Lai et al. (2021) reported that ice-flow velocities remained elevated above their pre-drainage background rate for ∼ 2 weeks following the lake drainage. Here, we apply the same methodology to characterize the spatial distribution of basal slip and uplift during a late-season speed-up event on 2011/238. Unlike Stevens et al. (2015), we do not invert for opening along a vertical hydrofracture because no crack-normal motion is observed in the GPS positions that would indicate a hydrofracture crack opening or closing during the late-season melt event (nor is a lake present at this time). As such, we assumed that all uplift is a result of basal cavity opening and all basal slip is parallel to the local flowline direction (276–277°) for this late-season speed-up event.
A challenge in applying the NIF is that this approach requires good station coverage, is computationally expensive, and requires a relatively uniform background velocity field from which the velocity changes associated with the speed-up event can be differentiated. While the 2011/238 melt event had good station coverage (14 GPS stations, compared to 15 stations on 2011/169), many late-season speed-up events have too few stations to perform the NIF inversion. Also, the regional melt events in the mid-to-late melt season do not always have a uniform, well-defined background velocity in the period preceding the speed-up event from which transient changes can be resolved.
Thus, we developed an alternative approach to more easily identify and characterize all transient speed-up events present during the 2011 and 2012 melt seasons and draw comparisons between local lake drainages and regional melt events. Transient speed-up events were identified based on having a velocity averaged across all operating GPS sensors that was ≥ 50 m d−1 above the average background ice velocity leading up to the speed-up event. Based on this definition, six speed-up events were identified in 2011 and seven speed-up events were identified in 2012 (Fig. 1b and c). Here, the pre-speed-up event background velocity is the average velocity recorded by each sensor over the 2–7 d period that precedes the speed-up event. To qualify as a speed-up event, the average velocity during the event must remain elevated above the pre-speed-up event background velocity for a minimum of 24 h. Because the background velocity changes seasonally and locally, the pre-speed-up event velocity for each speed-up event was fit individually per station. At each station we defined the velocity response (ΔV) as the difference between the maximum velocity during the speed-up event and pre-speed up event velocity following Eq. (1):
and the normalized velocity response (ΔVN) as the ratio of maximum velocity during the speed-up event to the mean pre-speed-up event velocity following Eq. (2):
To determine the speed-up event duration, the start and end time was first estimated at each station. The start of the speed-up event was defined by the time at which the velocity remained elevated above the pre-speed-up event velocity for a minimum of 24 h. The end of the speed-up event was defined as the first time when the velocity dropped below the pre-speed-up event velocity after the maximum velocity. If the velocity did not drop below the pre-speed-up event velocity the first local minimum in velocity was used. The beginning and end times were then averaged across all stations for each speed-up event and rounded to the nearest day (Figs. 1d and e and S2 in the Supplement). In some instances, the temporal proximity of transient speed-up events to prior speed-up events limits the time frame over which the pre-speed-up event velocity could be determined. Ideally, the pre-speed-up event velocity would be determined from a full week of velocity observations, but we allowed pre-speed-up event velocities to be estimated from as little as 2 d.
2.2 Modelled estimates of runoff
To evaluate the relationship between ice velocity during each speed-up event and the input of meltwater to the subglacial drainage system, runoff at North Lake was estimated for 2011 and 2012 using the daily mean Regional Atmospheric Climate Model (RACMO) (Noël et al., 2015; Noël, 2020). To define the ice surface catchment in which North Lake resides, we used TopoToolbox (Schwangert and Scherler, 2014; Schwangert and Scherler, 2021) and the surface topography from the 10 m resolution ArcticDEM dataset (Porter et al., 2023) (Fig. 1a). The magnitude of runoff supplying the subglacial system beneath North Lake was then calculated from the summation of runoff across six local 11 km × 11 km RACMO grid cells within the catchment basin (Fig. 1d, e). The cells included in this area summation were chosen to account for the runoff that makes it to the lake basin on the time scale of a single speed-up event (median event length is 5 d).
Open channel supraglacial meltwater flow velocities on the western margin of the Greenland Ice Sheet have been estimated to be approximately 0.1 m s−1 or 8640 m d−1 (Yang et al., 2018). Thus, during a single 5 d speed-up event, melt can flow up to distances of ∼ 43 km through the North Lake supraglacial drainage system. To determine which RACMO cells contributed runoff we examined supraglacial streams mapped around North Lake (Joughin et al., 2013). However, these data only extend ∼ 30 km upstream of North Lake (Fig. S3). To identify additional RACMO cells farther upstream that may contribute runoff to North Lake, we first calculated the average sinuosity of the local upstream supraglacial streams in the Joughin et al. (2013) dataset. Taking the ratio of stream length to the straight-line distance from the stream's start to end point we find an average sinuosity of 1.14. Using this value, we calculated the maximum straight-line distance of flow transport to be 37.5 km and included all upstream RACMO cells within this distance from North Lake (Fig. S3). This analysis indicates that six RACMO cells likely feed the North Lake basin on the timescale of single speed-up event. Summing the runoff across these six local grid cells provides an estimate of the total volume of runoff driving transient acceleration at this site (Fig. 1d, e). We also estimated the maximum daily run-off rate experienced by the lake basin over the course of a speed up event. To calculate the maximum rate, we used the runoff over a single RACMO grid cell, which most closely corresponds to the distance meltwater can travel in a single day (Fig. S3).
The open channel flow velocity used in these calculations is likely an upper bound on the average flow rate, as interfluve flow (governing the transport of runoff into stream channels) is 2–3 orders of magnitude slower than open channel flow (Yang et al., 2018). Future studies incorporating more sophisticated flow routing algorithms could improve on these the predictions by generating moulin hydrographs for each runoff event; however, such calculations require better temporal and spatial resolution of runoff and improved mapping of supraglacial stream networks than is currently available. However, we stress that because runoff across the local RACMO cells is spatially quite uniform, modifying the areal extent of the drainage area will change the absolute values of runoff, but not the relative runoff differences between events.
Almost all speed-up events corresponded to a peak in runoff (Fig. 1b–e), and the converse is also true that almost all runoff spikes correspond to transient speed-ups. The beginning and end times used to calculate the runoff parameters for each speed-up event were determined using the bounds provided by the velocity response. The precise definition of these temporal bounds does influence the magnitude of the integrated runoff; however, changing these bounds by ±3–4 d did not affect any of the correlations we found between speed-up event runoff and the velocity response. Using the speed-up event time bounds, we calculated the maximum daily runoff rate (in m3 d−1) over this time interval and the total integrated runoff (in m3) for each speed-up event. We note that meltwater has been observed to dynamically flow though the subglacial system rather than accumulating over the duration of transient speed-up events (Chandler et al., 2013; Stevens et al., 2015; Lai et al., 2021). Thus, the total integrated runoff is likely an over-estimate of the melt that lies beneath the lake basin at any specific time during the speed-up event.
We also determined the change in runoff compared to the pre-event runoff for each event based on the time bounds defined by the GPS velocities. The reason to evaluate the rate of change in runoff is that there is a balance between the influx of meltwater to the subglacial system beneath the lake basin and the outflux of meltwater down the hydrologic gradient (Chandler et al., 2013; Flowers, 2015). Rapid changes in the influx (i.e., associated with a runoff event or lake drainage) relative to the base level may overwhelm the system leading to dynamic changes in the ice response (Schoof, 2010; Hewitt, 2013). Here, the pre-event runoff (Rpre) was calculated from the average daily runoff over the Vpre time period. For each event, we then defined the change in runoff (ΔR) as the difference between the maximum runoff during the speed-up event (Rmax) and the pre-event runoff (Rpre) similar to the calculation of ΔV in Eq. (1). Similarly, the normalized change in runoff (ΔRN) was computed as the ratio of maximum runoff during the speed-up event to the mean pre-speed-up event runoff analogous to the calculation of ΔVN in Eq. (2).
In the case of the early-season lake drainage events, North Lake stores significant amounts of meltwater that is released rapidly into the subglacial system over 2–5 h (Das et al., 2008; Stevens et al., 2015). This meltwater is not reflected in the daily RACMO runoff estimates. To account for the volume of meltwater stored in lakes, we estimate an “effective runoff” by assuming the entire lake-basin volume is supplied to a local bed region around the lake. To prescribe this effective runoff, we use the Stevens et al. (2015) lake-basin volume estimates for the 2011 and 2012 lake drainage events. Using the pre-drainage lake volume of 0.0077 km3 and the lake drainage duration of 5 h, the maximum and total effective runoff were determined.
Below we describe the behavior of transient speed-up events throughout the 2011 and 2012 melt seasons. We first describe the results of the NIF for the early-season lake drainage and late-season melt event in 2011. We then show how the NIF results are consistent with the overall evolution in transient speed-up event behavior throughout the early, middle, and late melt seasons. These variations in transient speed-up event characteristics (e.g., amplitude and variability of speed-up) are then correlated to seasonal changes in runoff.
3.1 Comparison of velocity response for 2011 lake drainage and late-season melt events
We first used the NIF to investigate the velocity response of the 2011/238 melt event compared to the 2011/169 lake drainage previously characterized by Stevens et al. (2015). The maximum extra basal slip, expressed in the horizontal flowline direction, was plotted relative to the background ice velocity preceding the speed-up event (Fig. 2). The magnitude of the maximum extra basal slip (∼ 1.5 m) for the 2011/238 event is approximately 3 times greater than for the 2011/169 lake drainage (∼ 0.5 m). Further, the late-season speed-up event is characterized by a significantly more uniform flowline displacement and uplift response, as highlighted by a direct station-to-station comparison (Fig. 3). The average excess flowline displacement associated with the lake drainage event is ∼ 0.13 m, compared to ∼ 1.2 m for the late-season melt event. In contrast to the flowline displacements, the lake drainage event had an average uplift of ∼ 0.6 m, which is larger than the average uplift of ∼ 0.2 m in the late-season melt event. Thus, overall, the late-season melt event is characterized by a larger amplitude and more uniform flowline displacement compared to the early-season 2011 lake drainage event (Fig. 3), but with a significantly smaller component of uplift. The early-season lake drainage also shows systematically greater uplift at stations near the lake that experience the greatest speed-up, while the late-season melt event shows more variable uplift across the array that does not correlate with speed-up (Fig. 3).
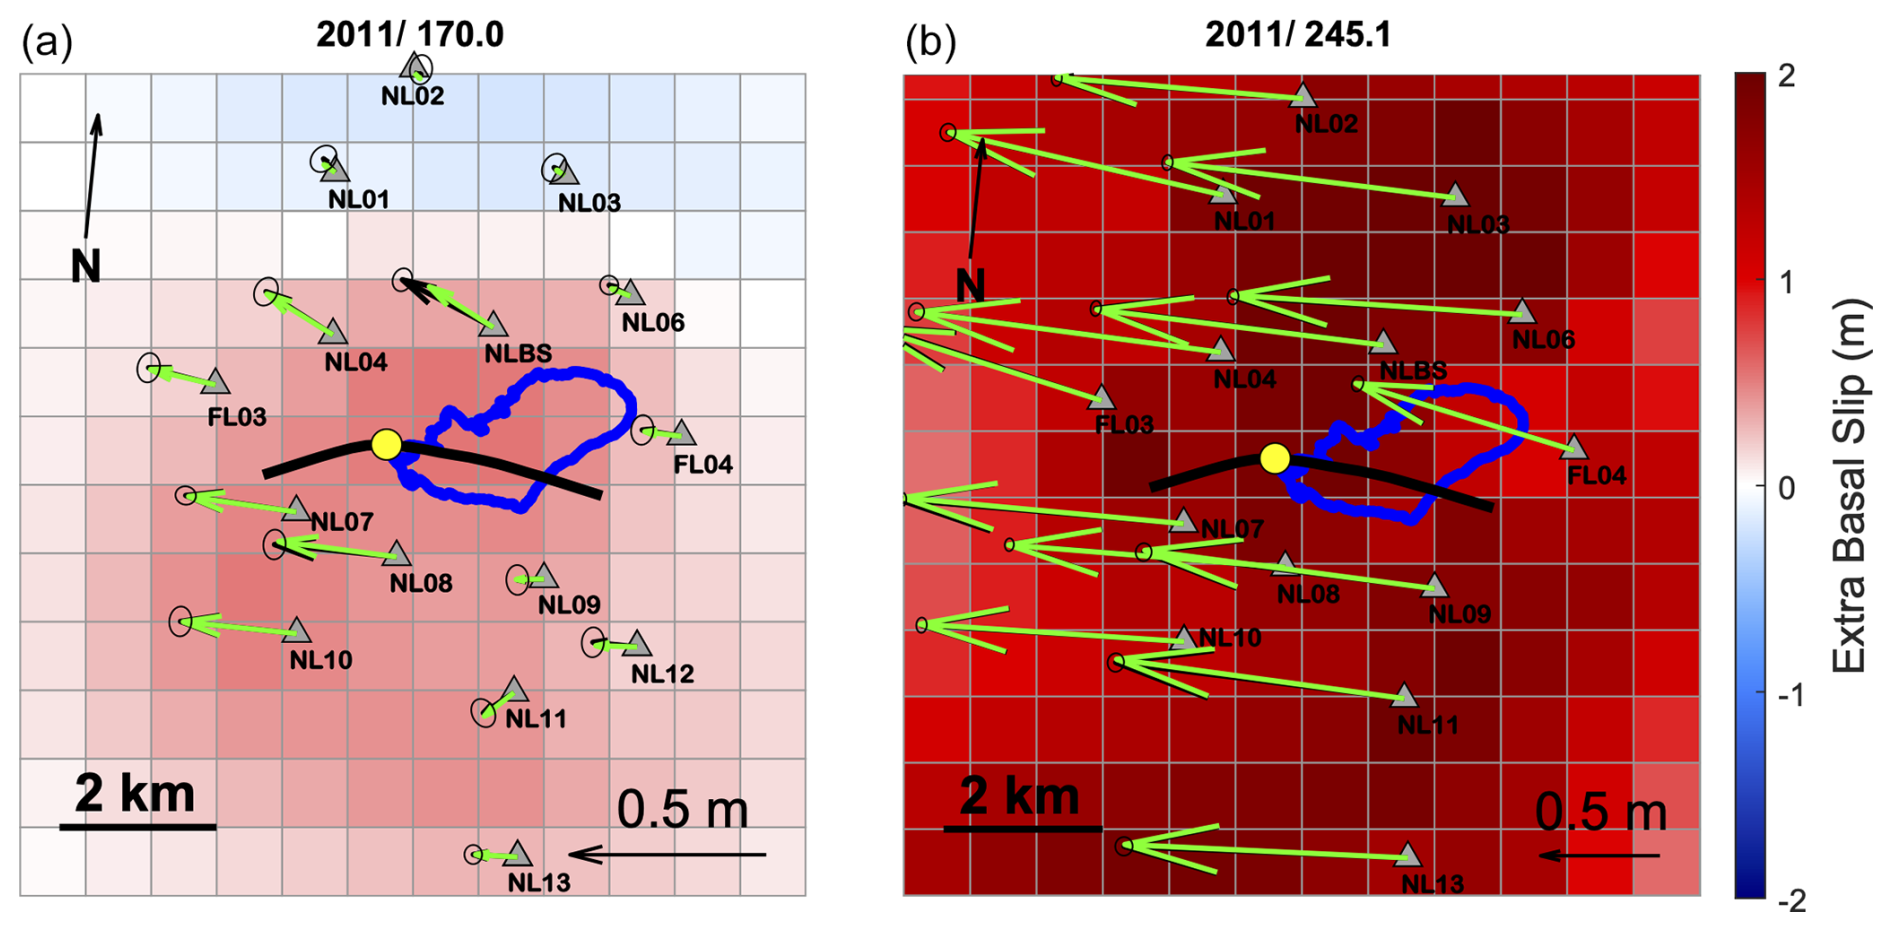
Figure 2Maximum event basal slip for (a) 2011/169 lake drainage on DOY 170.0, and (b) 2011/238 on DOY 245.1. Moulin location is denoted with yellow dot, hydro-fracture crack is shown by thick black line, and North Lake basin is outlined in blue. GPS sensor locations are shown by black triangles with the black arrows representing the GPS displacement and green arrows show NIF displacement. Dark red colors (+) indicate greater basal slip than background and blue colors indicate (−) less than background values.
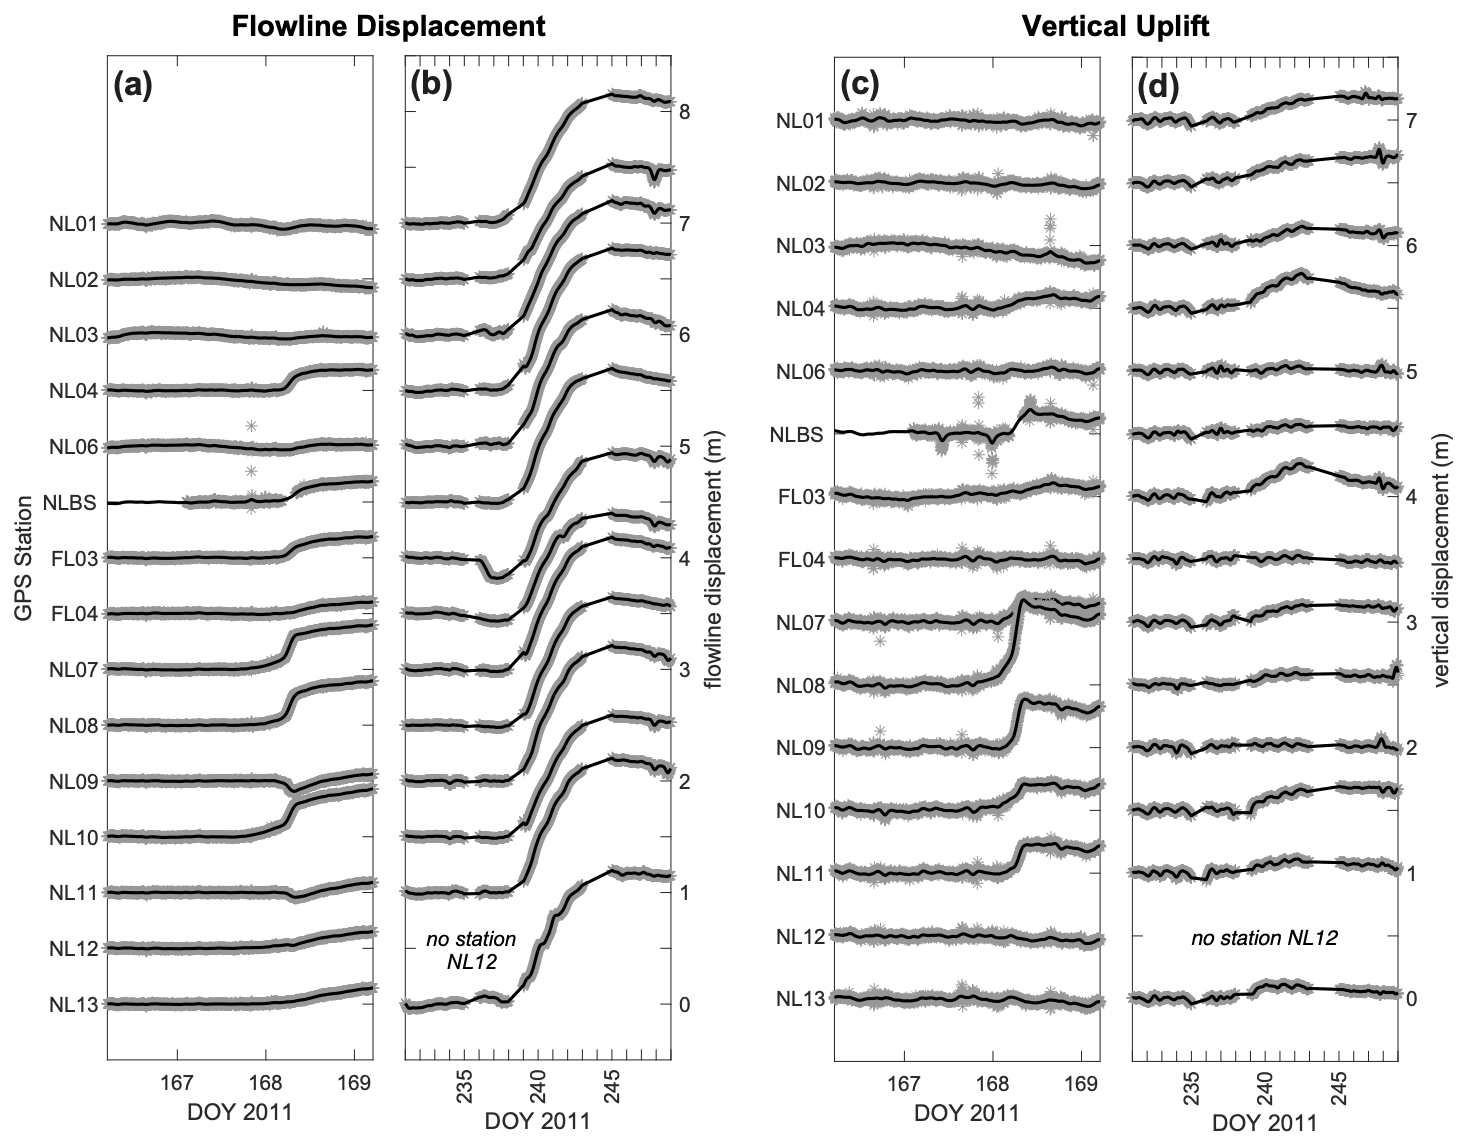
Figure 3(a–b) Flowline displacement and (c–d) uplift displacement during the 2011/169 lake drainage and 2011/238 late-season events for all recording GPS stations (station name on left y axis). The black lines represent the fit of the NIF filter and the grey dots show the recorded GPS observations.
3.2 Simplified velocity analysis of 2011 and 2012 speed-up events
To extend our analysis to all 13 transient speed-up events observed in 2011 and 2012, we next applied our simplified approach for quantifying the velocity response (ΔV) and the normalized velocity response (ΔVN), and compared these results to the runoff calculated for each speed-up event. To illustrate the robustness of this approach, we first calculated the velocity response for the 2011/238 late-season speed-up event (Fig. 4). As described above, ΔV for each station was determined from the difference between the maximum velocity, Vmax, and pre-speed-up event velocity, Vpre (Eq. 1) and the normalized velocity response, ΔVN, was determined from the ratio between Vmax and Vpre (Eq. 2). The average pre-speed-up event velocity for 2011/238 is ∼ 65 m yr−1, and the average maximum velocity is ∼ 200 m yr−1. For the 2011/238 melt event, ΔV ranges from 98.5–151.9 m yr−1 (Fig. 4), with an average of 135.5 m yr−1 and a standard deviation of ∼ 16.2 m yr−1. The normalized velocity response, ΔVN, ranges from ∼ 2.8–3.4, with an average of 3.1 and standard deviation of ∼ 0.2. The uniformity and relatively large magnitude of ΔV and ΔVN is consistent with the flowline displacements determined by the NIF (Fig. 3). Integrating of the 2011/238 melt event over its 8 d duration, gives an estimated displacement of 3.0 m or 3.6 % of the region's annual displacement.
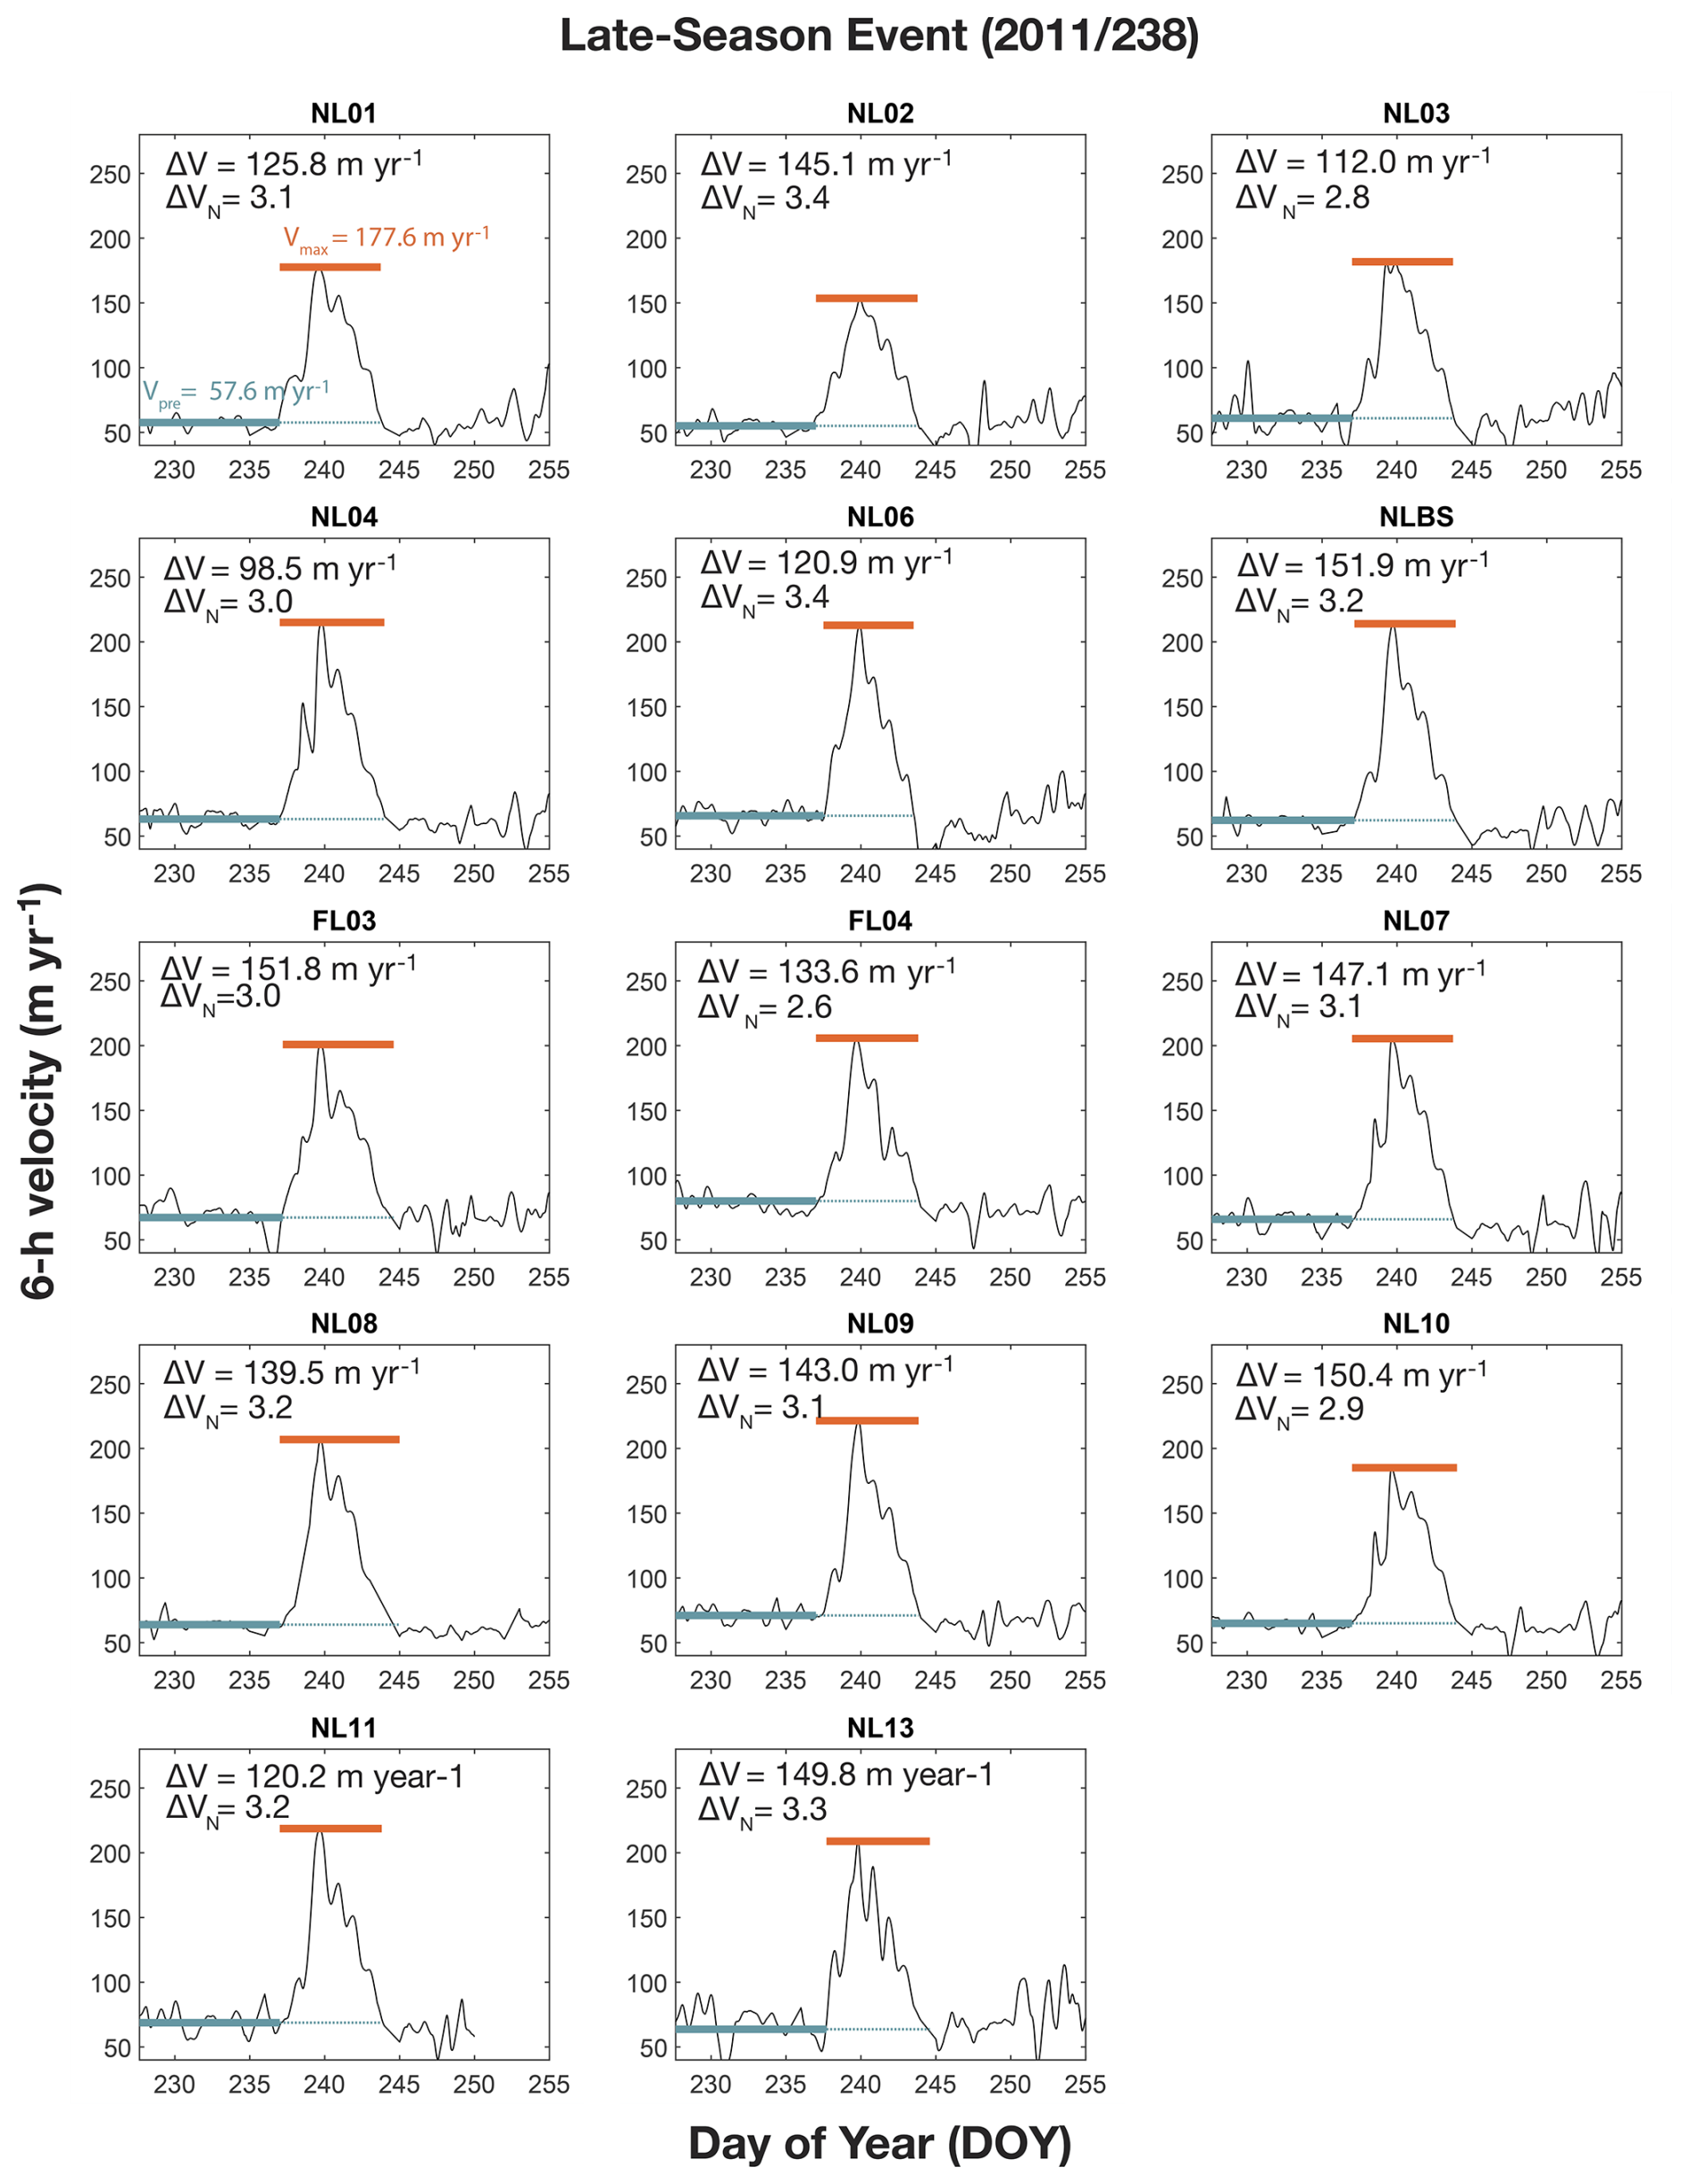
Figure 4Velocity time series at all stations for the 2011/238 late-season speed-up event. Green lines show the pre-event time period and average velocity (Vpre). Orange lines show the maximum velocity (Vmax) throughout the event. Speed-up magnitudes of ΔV (Vmax−Vpre) and ΔVN are given in upper left corner of each panel.
For comparison, we evaluated the velocity response of the 2011/169 lake drainage event (Fig. 5). This lake drainage event was studied in detail by Stevens et al. (2015), and thus we used their definition of 2011/168.85 for the pre-speed-up event end date. The pre-speed-up event start date varies from 2011/165 to 2011/166. We note that the 2011/169 lake drainage event occurs shortly after the onset of the summer speed-up; however, this increase over the background winter velocity is not included as part of the pre-speed-up event velocity estimate because it occurs before the relatively stable precursor phase identified by Stevens et al. (2015). Furthermore, because the velocity at some stations does not decrease to pre-speed-up event velocities in a timescale to accurately define the end of the velocity transient (e.g., NL09; Fig. 5), a date of 2011/172 was utilized as the end time based on the local minima in velocity at the stations following Vmax. Because the maximum velocity takes place on ∼ 2011/170, the end time of the speed-up event does not alter the velocity response calculations, which are reliant only on the pre-speed-up event velocity and the maximum velocity. Across all stations, the average pre-speed-up event velocity for 2011/169 is ∼ 158.3 m yr−1 and the average maximum velocity is ∼ 236.6 m yr−1. The ΔV for this lake drainage event ranges from 12.6–175.6 m yr−1 with an average velocity response of ∼ 78.3 m yr−1 and a standard deviation of ∼ 56.5 m yr−1 across the array. The normalized velocity response, ΔVN, ranges from 1.1 to 2.1 with an array-average of ∼ 1.5 and a standard deviation of ∼ 0.3. The average velocity across the array from 2011/168–172 is ∼ 192.8 m yr−1. Integrating over the lake drainage event duration provides an estimated displacement of 0.86 m or 1 % of the region's annual displacement. These results are consistent with the NIF findings, which similarly show a variable, muted velocity response (Fig. 3).
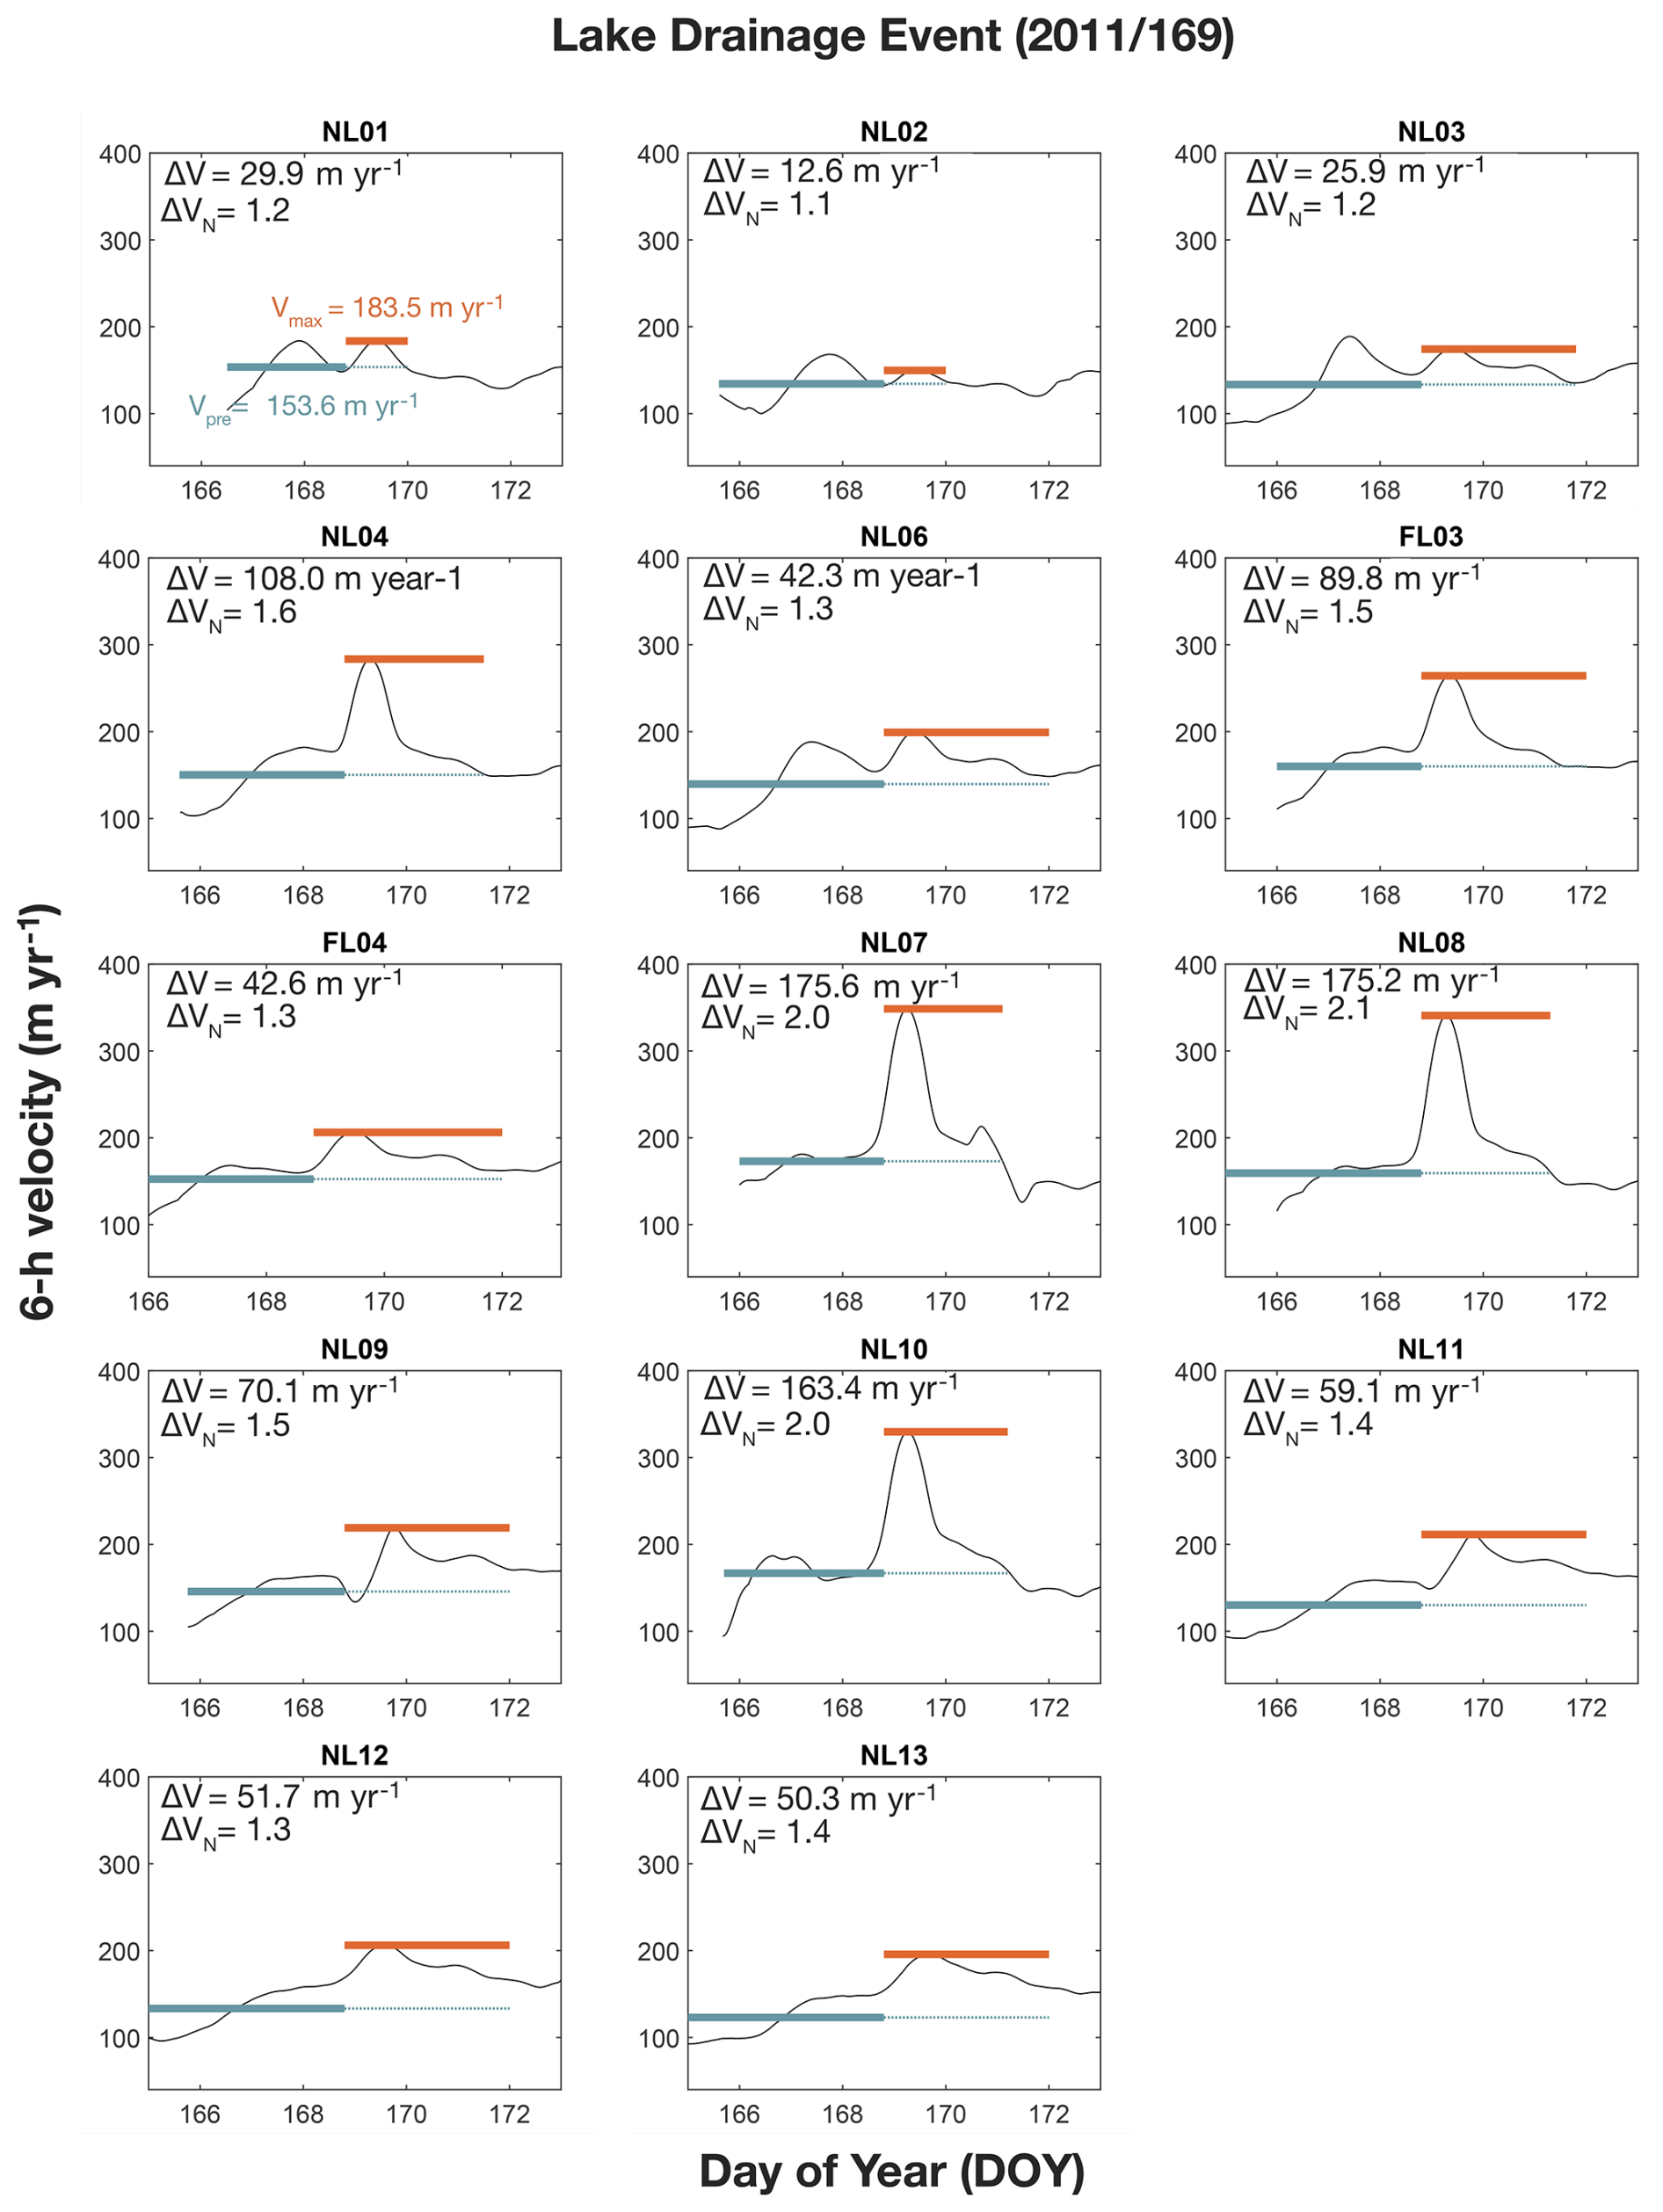
Figure 5Velocity time series at all stations for the 2011/169 lake drainage event. Green lines show the pre-event time period and average velocity (Vpre). Orange lines show the maximum velocity (Vmax) throughout the event. Speed-up magnitudes of ΔV (Vmax−Vpre) and ΔVN are given in the upper left corner of each panel.
3.3 Correlation between runoff and transient speed-up response
Following this same approach, the relationship between the velocity response and runoff was explored for all 13 transient speed-up events in 2011 and 2012. In general, Vpre for each speed-up event is related to DOY (Fig. S4) reflecting a steady decline in background velocity from the early-season peak to late-season minimum (Stevens et al., 2016). For each station, the maximum daily runoff and the total integrated runoff were compared to ΔV (Fig. 6a and c) and ΔVN (Fig. 6b and d). The maximum for ΔV reaches a value of ∼ 200 m yr−1 in both 2011 and 2012, while for each speed-up event does not exceed ∼ 150 m yr−1. The North Lake drainage events on 2011/169 and 2012/162 have significantly larger maximum effective event runoffs compared to the other speed-up events due to their short duration. However, these lake drainages have a smaller total effective runoff compared to the other speed-up events. Overall, we find that while transient speed-ups coincide with melt events as shown in Figure 1, there are no easily identifiable systematic trends between the magnitude of the velocity response and the runoff characteristics of the event (Fig. 6). We will return to this point in Sect. 4.1 where we discuss the importance of the evolving subglacial drainage conditions on modulating the transient ice response to an individual melt event (e.g., Schoof, 2010).
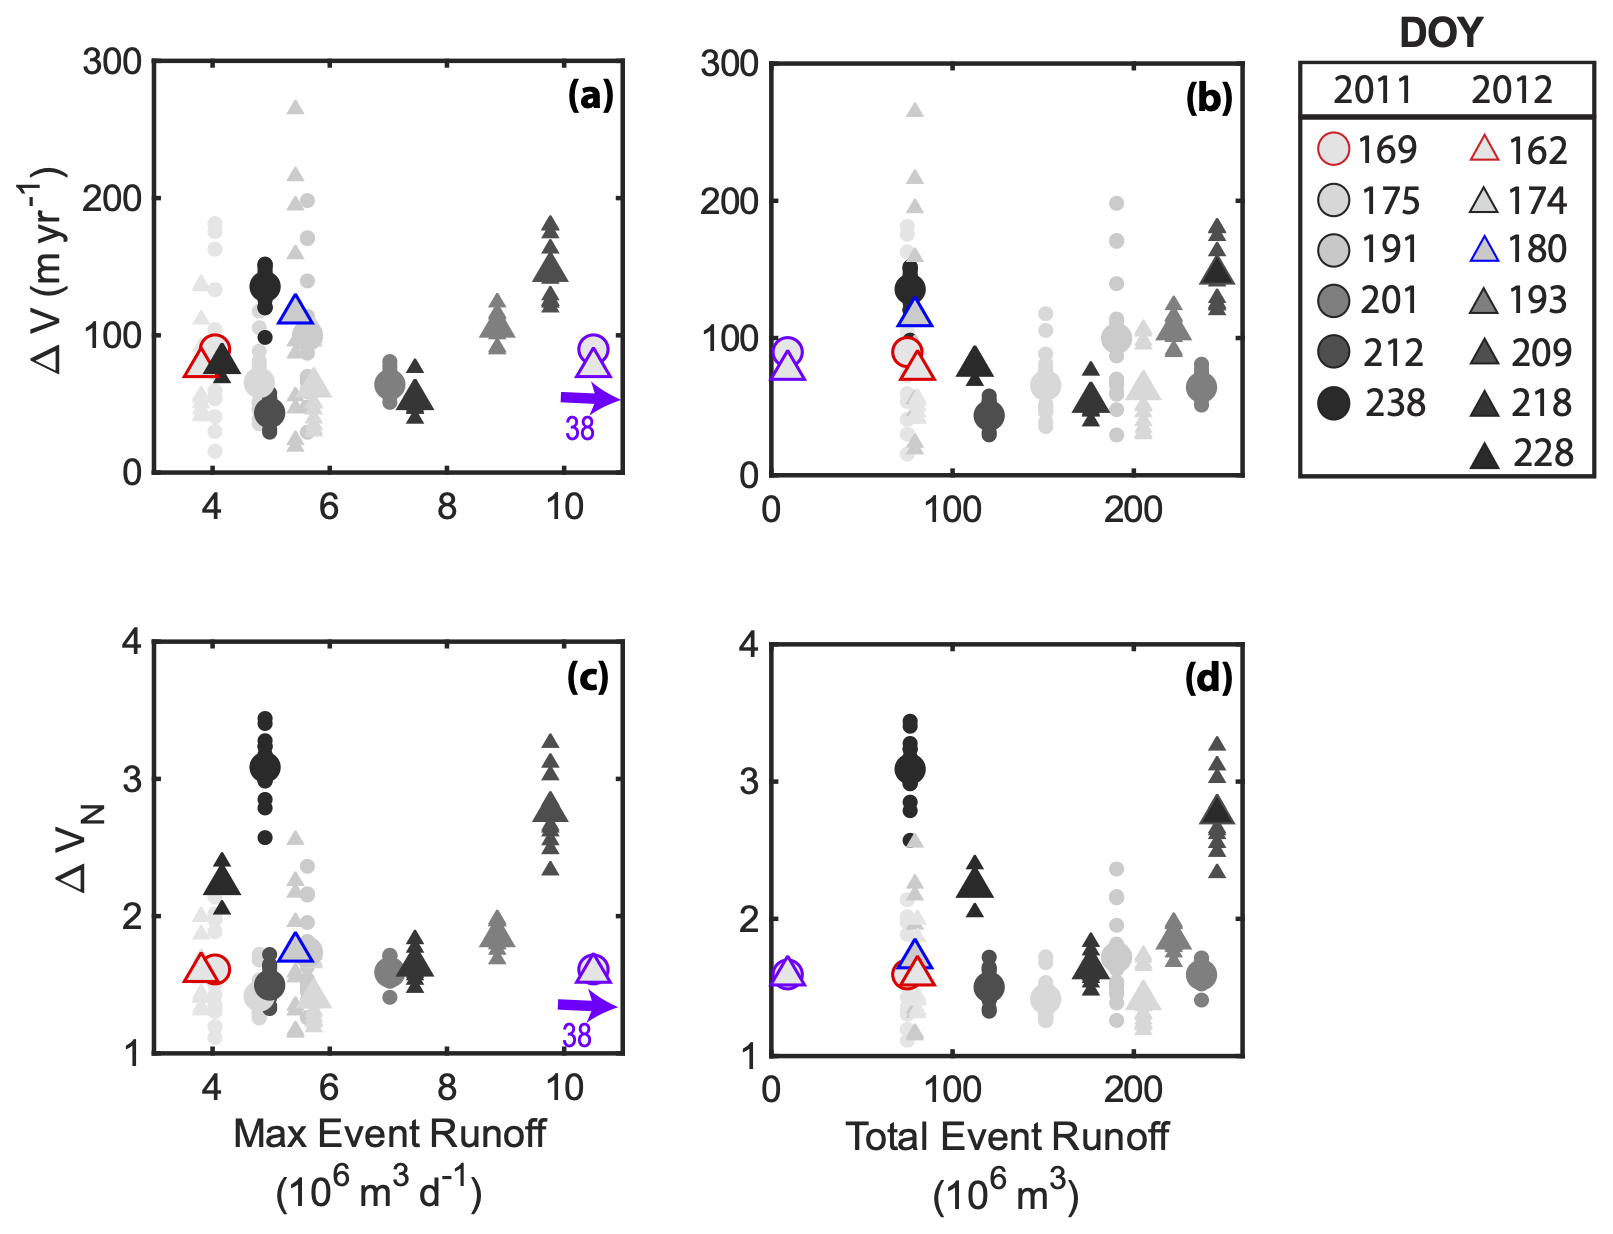
Figure 6Velocity response ΔV and ΔVN as a function of the maximum event runoff at the nearest RACMO grid cell (a, c), and total event runoff (panels b,d) integrated over the 6 local RACMO grid cells (Fig. S3a). Circles show events in 2011; triangles show events in 2012. Small symbols show ΔV and ΔVN for each individual GPS station; larger symbols show and across all stations for each event. Colors darken chronologically with the lightest grey colors indicating events early in the melt season and the darkest black colors representing events late in the melt season. Note the lack of a trend in any of the panels. The red-outlined symbols highlight the lake drainage events. The blue-outlined symbols highlight the 2012/180 nearby lake drainage event. The purple-outlined symbols show ΔV and ΔVN for the lake drainage events using “effective runoff”. In panels (a) and (c), the maximum “effective runoff” significantly exceeded the maximum runoff from RACMO (effective runoff value annotated); however the total lake volume is small compared to the integrated event runoff (b, d).
3.4 Magnitude and variability of speed-up throughout the melt season
To see if there were seasonal changes in the ice velocity response to melt events, we also examined the temporal evolution of and throughout the melt season. We did this both for all speed-up events collectively, and also for the middle and late-season regional melt events that do not coincide with local lake drainage events (Fig. 7). Overall, two main trends are observed in the data. First, there is a general increase in the magnitude of the velocity response, which is most clearly reflected in the average normalized velocity response (Fig. 7b). Specifically, increases through time with an R2 of 0.44 and a p-value of 0.01 (black, Fig. 7b). Removing the local lake drainage events from this analysis, a similar trend can be observed among the regional melt events, which have an R2 of 0.49 and a p-value of 0.02 (magenta, Fig. 7b). Second, the variability in the velocity response, as determined by the standard deviation in ΔV and ΔVN, decreases throughout the melt season both including and excluding the local lake drainage events (Fig. 7c and d). This trend is consistent with the differences initially seen in the NIF results for the 2011 lake drainage (2011/169) and late-season melt event (2011/238). However, as shown by the analysis of the regional melt events alone, this trend extends beyond just reflecting higher variability associated with the two known North Lake drainages. In particular, after DOY 200 in both years, there is significantly less variability in ΔV(Fig. 7c). The R2 value of the linear fit to the standard deviation of ΔV versus DOY is 0.36 with a p-value of 0.03 when considering all speed-up events, and has an R2 of 0.25 and p-value of 0.15 when considering the regional melt events only, indicating little in the way of a trend after lake drainages have ceased. Similarly, no strong trend is observed between the standard deviation in ΔVN and DOY when considering all speed-up events (R2 = 0.12; p-value = 0.25; Fig. 7d). We also find that because Vpre is correlated to DOY (Fig. S4), similar trends are found when comparing the velocity response parameters to Vpre (Fig. S5). Finally, we note that the largest variability is associated with the 2012/180 speed-up event, which does not correspond to a North Lake drainage. We infer this speed-up event is associated with the drainage of a neighboring lake and thus classify it as a local “flood” event; it will be discussed further in Sect. 4.2 below.
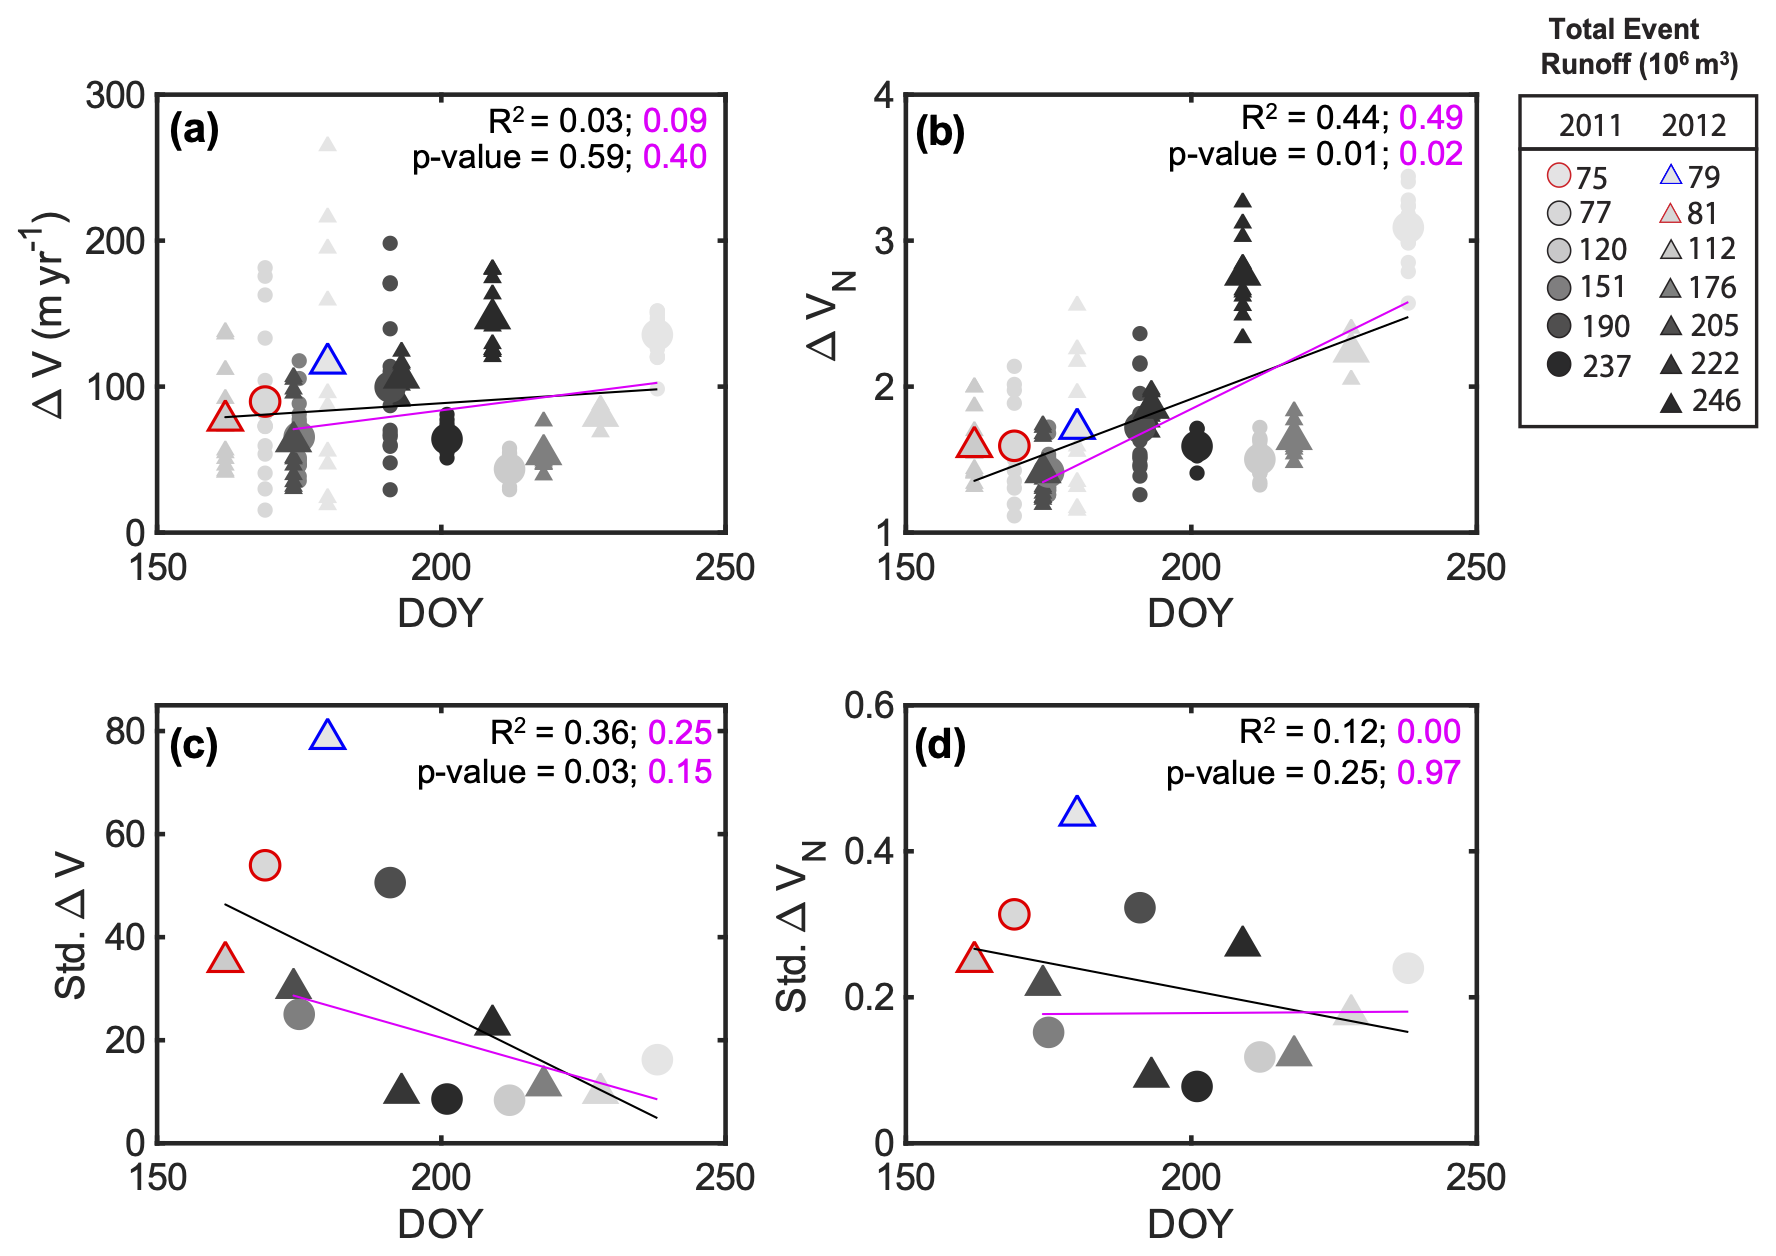
Figure 7Velocity response (a) ΔV and (b) ΔVN, as a function of day of year (DOY). Circles and triangles show events in 2011 and 2012, respectively. Individual, smaller symbols in panels (a) and (b) show individual GPS stations. Larger symbols show the average value across all stations per event. Colors darken with integrated event runoff (mm), with the lightest grey color indicating less runoff and the darkest black color representing the greatest runoff. The red-outlined symbols show the North Lake drainage events. The blue-outline symbols show the neighboring lake drainage event on 2012/180. Standard deviation of (c) ΔV and (d) ΔVN, as a function of DOY. Linear fits of all events (black lines) and regional events only (magenta lines) are displayed for all panels, with associated R2 and p-values shown in panel corners.
The relationship between ice velocities and surface melt is linked through the evolution of the subglacial drainage system (Schoof, 2010; Hoffman et al., 2011; Hewitt, 2013; Chandler et al., 2013; Andrews et al., 2014; Flowers, 2015; Joughin et al., 2013). Lai et al. (2021) used observations of uplift relaxation following lake drainage events occurring at different times of the melt season to probe this relationship, finding that, in general, mid-season lake drainage events are characterized by shorter duration speed-ups compared to those that occur earlier in the melt season. They interpreted this finding to reflect the increasing transmissivity of the subglacial drainage system as a more channelized system develops throughout the melt season. However, because lake drainage events typically do not occur late in the melt season, Lai et al. (2021) were unable to probe the full, seasonal evolution of the subglacial drainage system. In particular, they did not resolve the period late in the season when models predict that decreasing runoff input is unable to outpace the creep closure of channels (Schoof, 2010). Further, Andrews et al. (2014) used in situ observations in the mid-ablation zone to hypothesize that channelization could account for decreasing velocities in the early melt season, but not in the late melt season. Instead, they proposed that the formation of flow pathways and/or connectivity between unchannelized regions of the bed drive the late-season increase in drainage-system efficiency (Andrews et al., 2014). Hoffman et al. (2016) further argued that the dewatering of weakly connected basal cavities is necessary to describe late-season subglacial conditions. They proposed that in the late-season, while the majority of subglacial channels have closed, these dewatered cavities that maintain lower pressures, and likely drive the observed decrease in ice-sheet velocities until they are able to refill by basal melting, returning the system to its winter velocity (Hoffman et al., 2016). Here we discuss our results in the context of the subglacial conditions throughout the melt season and the velocity response associated with distal lake drainages.
4.1 Hypothesized subglacial conditions of early-season lake drainages vs. late-season melt events
The transient velocity response to runoff events compiled here extends the Lai et al. (2021) lake drainage dataset into the late melt season, at a time when background ice velocities (∼ 65 m yr−1) have dropped below the local “background” winter velocities (74–76 m yr−1 in 2011–2012; Stevens et al., 2016). The NIF analysis of the 2011/238 late-season melt event shows clear differences from early-season supraglacial lake drainage events. Specifically, the NIF describes the 2011/238 melt event as having a more-uniform, longer duration, and higher amplitude speed-up in the flowline direction, but with a significantly smaller maximum uplift as compared to the 2011/169 lake drainage event earlier that same year (Fig. 3). There is evidence that a precipitation event occurred around the 2011/238 late-season event (Doyle et al., 2015; Loeb et al., 2022). A week of warm, wet cyclonic weather was observed in early September 2011, resulting in enhanced surface melt and rainfall (Doyle et al., 2015). However, Doyle et al. (2015) found the magnitude of runoff and precipitation to still be less than that during the mid-melt season.
This difference in the velocity response to these two types of events is intriguing. The larger late-season velocity response would conventionally imply greater decoupling of the ice sheet from its bed. However, we do not observe the typical uplift associated with large speed-ups (e.g., lake drainage events). These results argue against a strongly channelized subglacial drainage system at 2011/238 since a well-developed system would be expected to quickly evacuate the runoff (consistent with the lack of an uplift signal) but simultaneously reduce the magnitude and duration of the sliding transient (inconsistent with the observations). Therefore, it is reasonable to assume that any channelized network formed during the melt season has closed substantially by 2011/238 – implying that channels may not be the primary reason that the late-season background velocity remains below the winter velocity. This is consistent with the findings of Doyle et al. (2015), who highlighted the contribution of an inefficient subglacial drainage system to the acceleration of ice flow during the late melt season.
Similarly, our analysis of the additional local and regional speed-up events in 2011 and 2012 supports the hypothesis that the state of the subglacial drainage system influences the velocity response to a greater extent than the runoff magnitude (Schoof, 2010; Hoffman et al., 2011; Hewitt, 2013). While we stress that all transient speed-ups are linked to melt events, our results show that the transient velocity response above the background rate (estimated by Vpre) is poorly correlated to runoff magnitude. We find no correlation between ΔV or ΔVN and the maximum daily runoff or the total integrated runoff during a speed-up event (Fig. 6). On the other hand, the correlation between DOY and the magnitude of speed-up (Fig. 7) suggests the subglacial drainage system evolves throughout the melt season. If this is the case, we might expect to see a more pronounced relationship between the velocity response and the rate of change in melt input.
To test this, we plotted ΔR and ΔRN versus ΔV and ΔVN, as well as versus the standard deviation of ΔV and ΔVN (Fig. 8). We find a positive correlation between ΔV and ΔVN and ΔR and ΔRN (Fig. 8a–d), with the most significant correlation seen between ΔVN and ΔRN when considering all lake drainage and melt events (R2 = 0.52; p-value = 0.01; Fig. 8d). When considering only regional melt events, the strength of the positive correlation between ΔVN and ΔRN decreases slightly (R2 = 0.51; p-value = 0.02; Fig. 8d). These trends are similar to the relationship between ΔV and ΔVN and DOY (Fig. 7a–d). We also observe a negative correlation between the standard deviation of ΔV and ΔVN and the runoff variability variables ΔR and ΔRN (Fig. 8e–h), though this correlation is less significant with p-values ranging from 0.08 to 0.82.
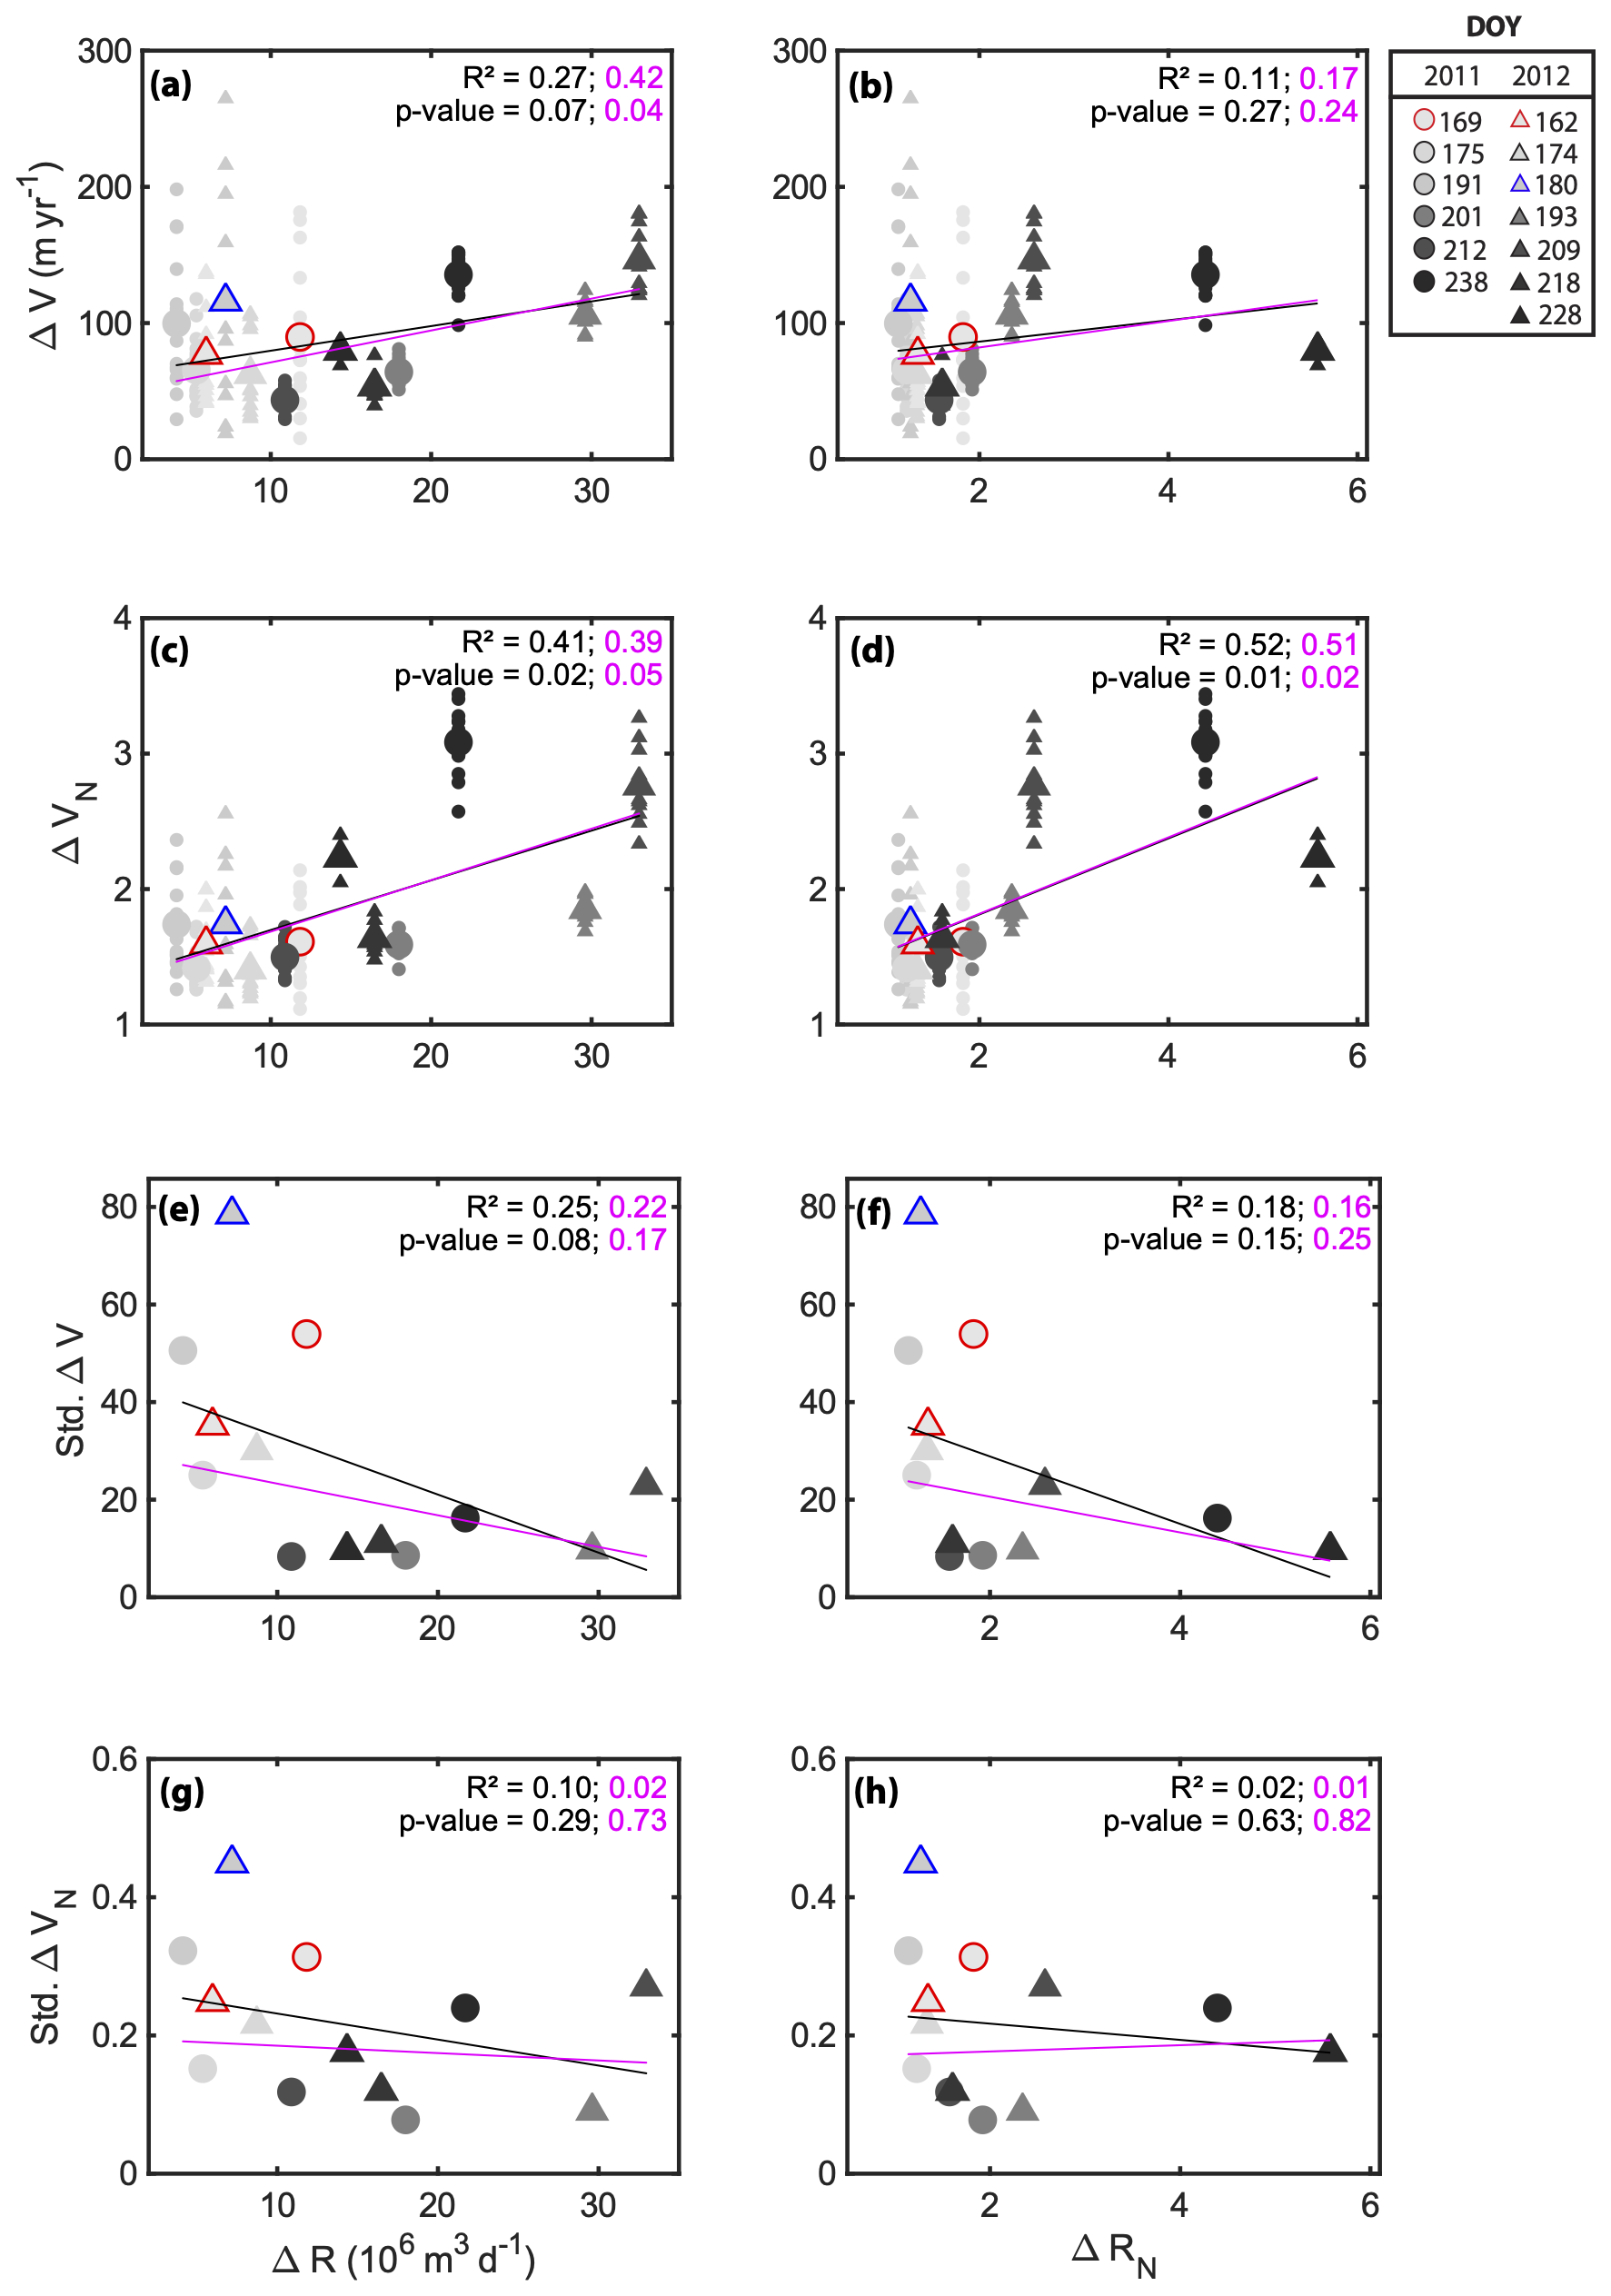
Figure 8Velocity response (a–b) ΔV, (c–d) ΔVN, (e–f) std. ΔV, (g–h) std. ΔVN, as a function of (left) ΔR and (right) ΔRN. Circles and triangles show events in 2011 and 2012, respectively. Individual, smaller symbols in panels (a)–(d) show individual GPS stations. Larger symbols show the average value across all stations per event. Colors darken with DOY, with the lightest grey color indicating the early season and the darkest black color representing the late season. The red-outlined symbols show the North Lake drainage events. The blue-outline symbols show the neighboring lake drainage event on 2012/180. Linear fits of all events (black lines) and regional events only (magenta lines) are displayed for all panels, with associated R2 and p-values shown in panel corners.
The correlations between speed-up magnitude, DOY (Fig. 7), and the rate of change of runoff (Fig. 8), highlight the interplay between the velocity response, changes in runoff, and seasonal changes in the hydrologic system (e.g., subglacial drainage efficiency and the number of open moulins). A challenge in separating the main factors driving the velocity response is the positive correlation between ΔR and ΔRN and DOY (Fig. S6). Because these variables are correlated with one another it is not surprising that they have similar relationships with ΔV and ΔVN. However, masked in the relationship shown in Fig. S6 is the fact that ΔR and ΔRN underestimate the true runoff for the 3 rapid lake drainages (i.e., RACMO runoff estimates do not account for the meltwater stored in the lake basin). In reality, the early season lake drainages have larger values of ΔR and ΔRN, but small values of ΔV and ΔVN, inconsistent with the correlations seen in Fig. 8. For example, if we used the effective runoff to estimate ΔR these values would be 23.7 × 10⁶ and 20.8 × 10⁶ m3 d−1 for the 2011 and 2012 lake drainages, respectively. Thus, while the changes in the rate of runoff may play a role in controlling the system response (particularly for runoff-driven events), the temporal evolution of the melt system remains a key variable in the overall response of the ice sheet to meltwater forcing. Additionally, ΔV and ΔVN increase late in the melt season, while their variability decreases (Fig. 7). These relationships hold not just when comparing late-season regional melt events to early-season lake drainages, but also when comparing the late-season melt events to regional melt events that occur earlier in the same melt season. This suggests the state of the subglacial system at the time the water reaches the bed drives these trends, rather than the characteristics of this melt water delivery to the bed (i.e., distribution, duration, and volume).
In 2012, many of the regional melt events between DOY ∼ 170 to ∼ 250 occur while background velocities are decreasing (Fig. S4). Considering the background velocities in isolation, this trend could be interpreted as evidence for channelized conditions until the minimum velocity at DOY 250. However, the transient speed-ups show a trend toward greater amplitude velocity responses and lower variability over this same period, suggesting the channels have likely closed even as the background velocities are still decreasing. Further, it does not appear that the input of melt during the mid- to late-season melt events significantly modify the drainage system, because the pre- and post-transient velocities remain similar for each speed-up event. Thus, the transient speed-ups provide an effective proxy to examine the subglacial conditions as the melt pulses temporarily overwhelm drainage system but do not reset it.
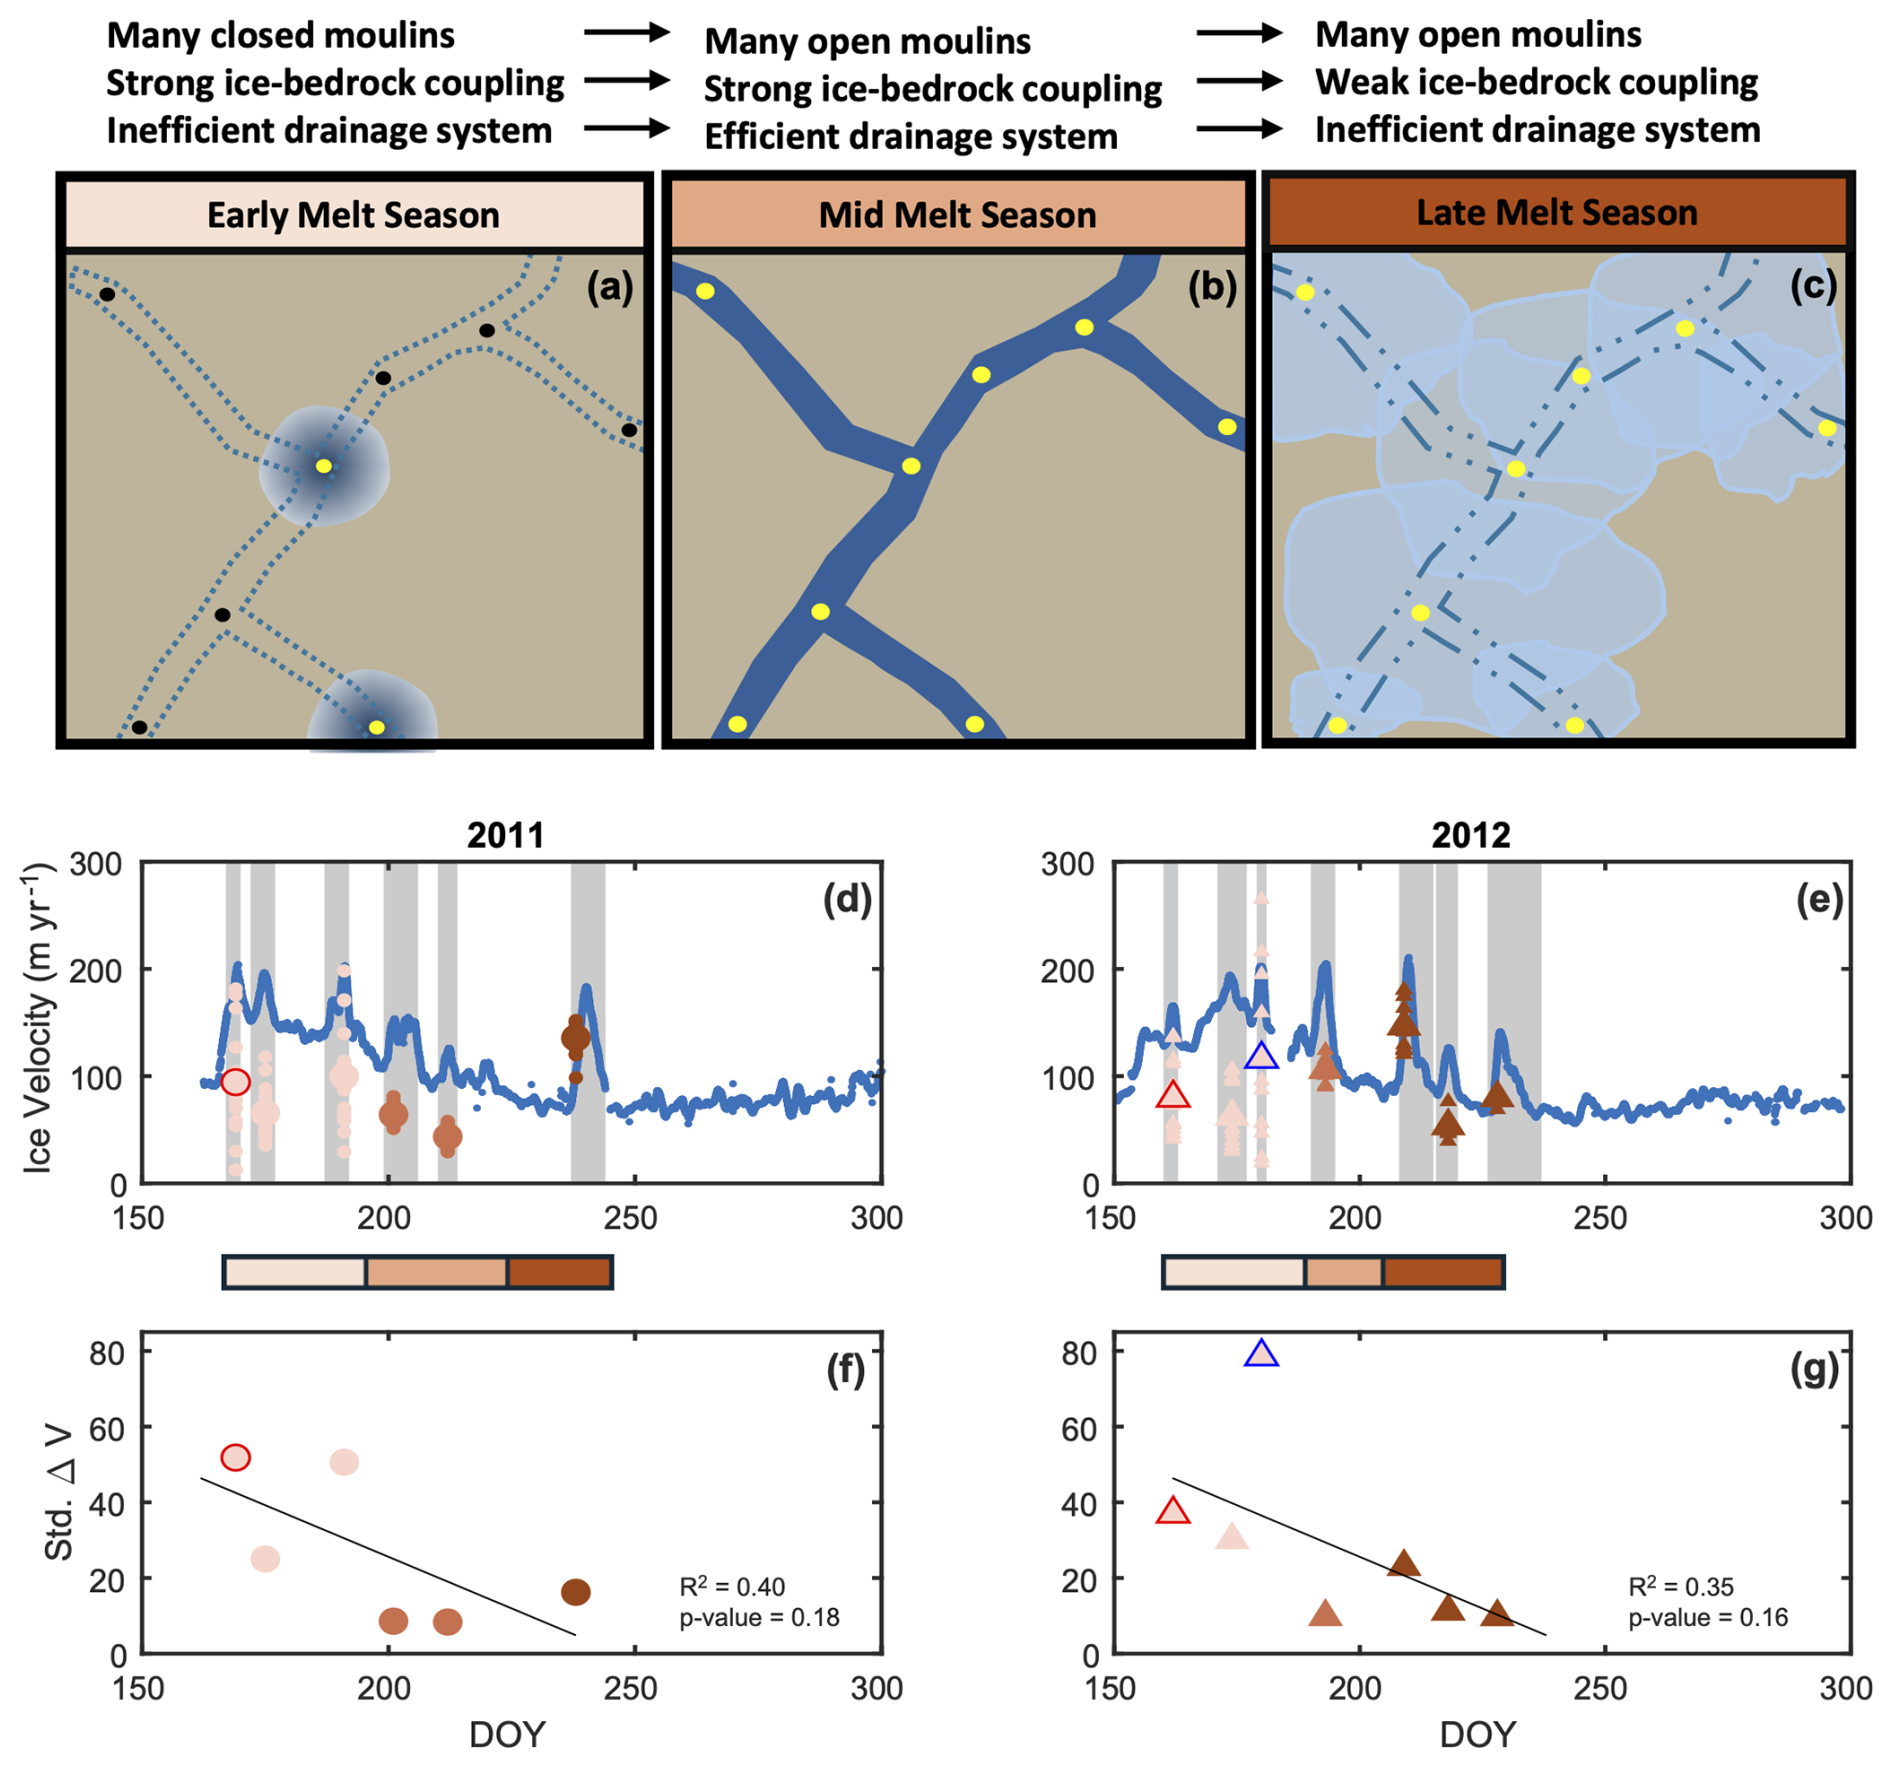
Figure 9Conceptual model for subglacial conditions and ice response to melt input during (a) early-season lake drainage events, (b) mid melt season, and (c) late melt season. Yellow solid circles represent open moulins and black solid circles represent closed moulins. Lighter blue colors indicate lesser volumes of meltwater at the bed (a, c). Dark blue colors indicate greater volumes of meltwater at the bed (a–b). The circles and triangles show the ΔV (m yr−1) of each speed-up in (d) 2011 and (e) 2012, respectively. Individual symbols in panels (c) and (d) represent GPS sensors, and the larger symbols are the array-average for each speed-up event. The red-outlined symbols are lake drainages and the blue-outlined symbol is a local lake drainage. The blue line shows the 24-hour average velocity across the GPS array. Light red colors indicate early-season events, medium red colors indicate middle season melt events, and dark red colors indicate late-season melt events (d–g). The circles and triangles show the average standard deviation of ΔV of each speed-up event in (f) 2011 and (g) 2012, respectively.
One possible interpretation of these results is that during the early season, the ice sheet is still largely coupled to the bed across the region. When a lake drainage occurs, the ice decouples from the bed directly below the lake, but frictional resistance from the surrounding regions buffers the overall velocity response. This is consistent with the heterogeneous spatial distribution of speed-up associated with lake drainages observed with more than one GPS sensor (e.g., Doyle et al., 2013; Stevens et al., 2015). For North Lake, stations NL04, FL03, NL07, NL08, and NL10 are closest to the lake and show the largest lake drainage velocity response, as well as the largest uplift signal (Stevens et al., 2015; Figs. 2 and 3). These findings are also consistent with observations of spatially variable ice velocities on ∼ weekly timescales across the region (Joughin et al., 2013). Specifically, Joughin et al. (2013) argued that higher velocities correspond to meltwater pooling in a basal topographic trough running from NE to SW through this region (Joughin et al., 2013).
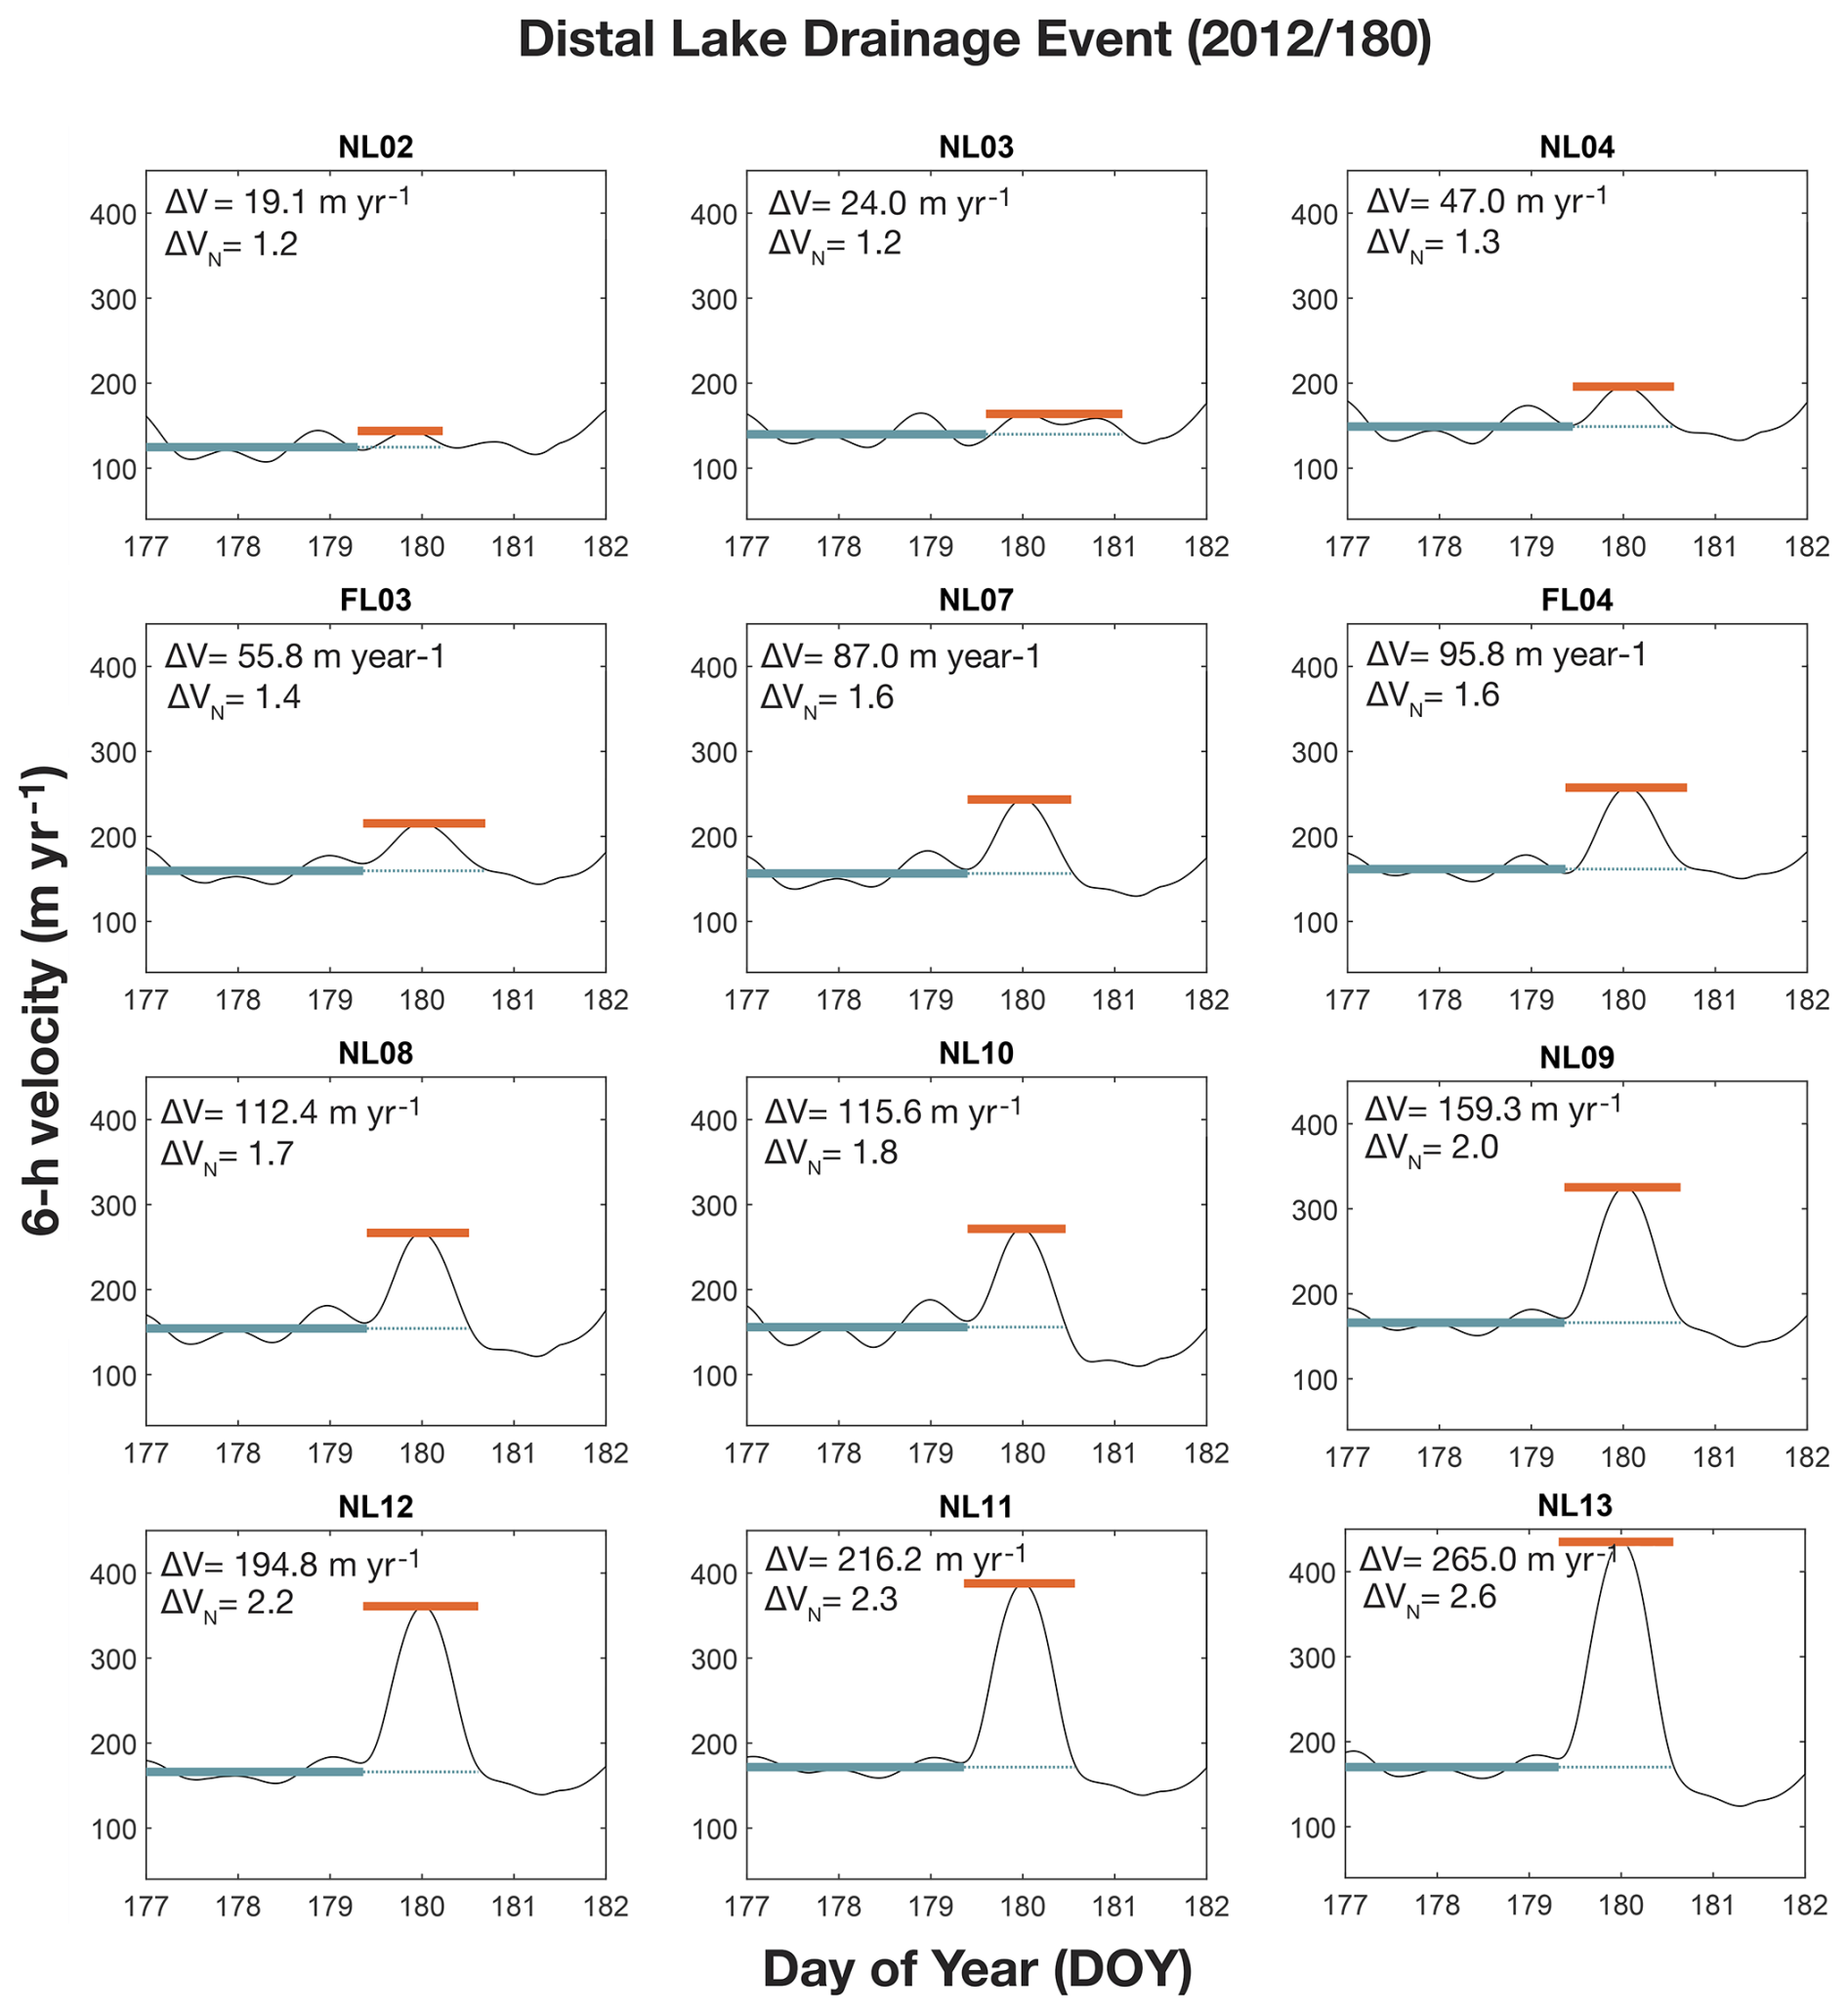
Figure 10Velocity time series at all stations for the 2012/180 speed-up event. Green lines denote the pre-event time period and average pre-event velocity (Vpre). Orange lines show the maximum velocity (Vmax) throughout the event. Speed-up magnitudes of ΔV and ΔVN are shown in upper right corner of each panel. Stations are ordered by increasing magnitude of velocity response.
By contrast, we speculate that the late-season melt event reflects a much broader and more uniform input of melt to the bed, possibly into a cavity-dominated system, influencing a larger area and producing the observed higher amplitude, more uniform sliding response. Past research has found that after the drainage of supraglacial lakes, moulins beneath lake basins remain open throughout the remainder of the melt season (Flowers, 2015). Thus, because most supraglacial lake drainages occur in the early-to-mid melt season, by the late-season there should be many open moulins available to provide direct surface-to-bed conduits for surface runoff (e.g., Krawczynski et al., 2009). Assuming these moulins remain open into the late season, they will provide a pervasive and relatively uniform network of access points to the bed (Joughin et al.., 2013; Yang and Smith, 2016). The dissociation of uplift with the late-season melt event could thus reflect the smaller magnitude runoff and more widespread input of melt to a cavity-dominated subglacial system. Another possibility is that the late season subglacial system is controlled by the behavior of a water sediment layer that has dewatered sufficiently to reduce background velocities but is still close to saturation and thus sensitive to small inputs of melt. In either scenario, our data point to a greater sensitivity of ice velocity to late-season melt input, consistent with observations by Doyle et al. (2015). However, similarly to the findings of Ing et al. (2024), the 2011/238 melt event only contributes a small amount (∼ 3.4 %) to the annual ice motion at North Lake, implying that unless such late-season runoff events become more frequent, they do not constitute a major fraction of the ice motion in this region.
The combination of a relatively large, uniform velocity response, but small uplift signal in the late-season melt events indicates that meltwater is distributed in such a way that allows large, homogenous ice accelerations. Further, the onset of these speed-up events provides preliminary information on the timing of the evolution of the subglacial drainage system away from mid-summer conditions. We present a conceptual model for the evolution of the subglacial drainage system and its relation to ice-flow dynamics in Fig. 9. Early in the season, lake drainages result in large uplift, but smaller horizontal sliding transients relative to the pre-speed-up event horizontal sliding. This response reflects the presence of water filled cavities without an established channel network to efficiently transport melt, producing high water pressures at the bed. A blister of water forms beneath the lake basin, resulting in uplift directly below the lake and a non-uniform speed-up across the array, with stations closest to the lake having the most pronounced velocity response (Fig. 9a). The formation of this blister is enabled due to the relatively low transmissivity of the unchannelized subglacial drainage system early in the melt season (e.g., Lai et al., 2021). Increases in ice velocity associated with early-season lake drainages are likely muted by the regions around the lake that remain coupled to the bed; this strong coupling persists when there is a lack of additional surface-to-bed meltwater connections. As the melt season progresses more drainages occur, creating or reopening moulins, and supplying large volumes of water to the bed. This high rate of melt input produces high-flux, lower-pressure channels, which evacuate meltwater from other areas of the bed, increasing frictional coupling adjacent to channels, and leading to the initial slow-down (e.g., Schoof, 2010; Hewitt, 2013; Fig. 9b). Finally, late in the melt season, decreased runoff causes channel closing by viscous creep on timescales of hours for the kilometer-scale ice thickness of our study region (Bartholomous et al., 2011), but potentially leaving a network of dewatered cavities. As a result, the subglacial system becomes more inefficient. However, moulins that opened throughout the melt season likely remain open, resulting in a pervasive network of surface-to-bed moulins. Taken together these two effects allow smaller magnitude regional melt events to decouple the bed over much broader areas compared to earlier in the season, producing larger, and more uniform, transient speed-ups in the late season (Fig. 9c).
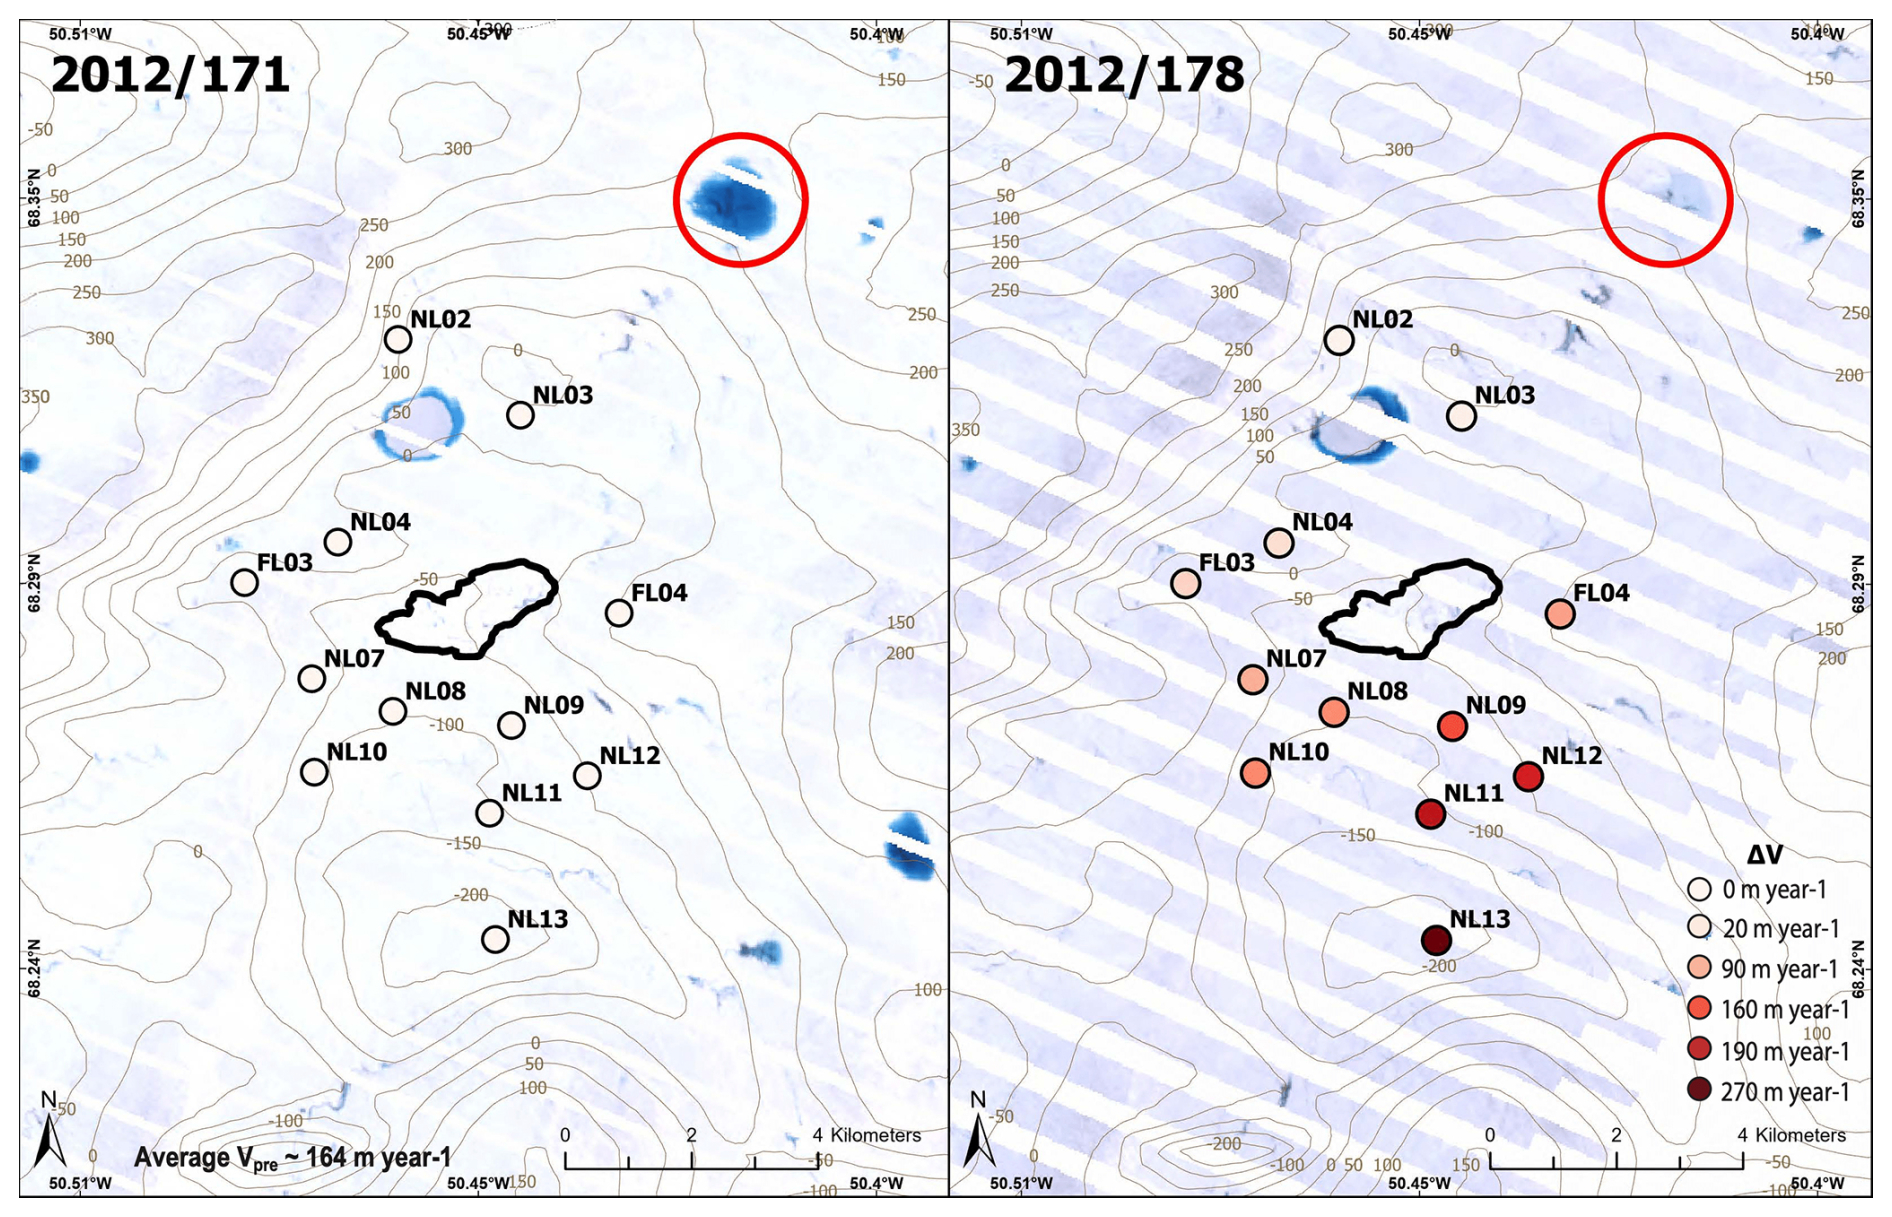
Figure 11Landsat-7 satellite map of supraglacial lake catchment basin prior to 2012/180 transient speed-up event. Landsat-7 image processed by the ESA. Circles show GPS sensor locations. White colors (a) on 2012/171 denote small ΔV (i.e., velocities equivalent to background velocities). Redder colors on (b) 2012/178 plot large ΔV (i.e., velocity magnitudes above background velocities). Brown contours show basal topography from BedMachine v3 (Morlighem et al., 2017; Morlighem, 2017). Note the larger velocities recorded by the southern stations tend to correspond to the lowest bed elevations.
Building on the ideas of Andrews et al. (2014) and Hoffman et al. (2016) late-season melt events may supply sufficient meltwater to the bed to temporarily fill dewatered cavities, increasing short-term velocities. If flow pathways between cavities in the late melt season have crept closed due to increased effective pressure, widespread melt inputs may be able to temporarily overwhelm the subglacial system. The long durations of the late-season melt events on 2011/238 and 2012/228 (7 and 9 d, respectively) indicates decreased transmissivity and the inability of melt inputs to re-establish cavity connectivity.
4.2 Variable sliding response during lake drainage events outside of the GPS array
It has been observed that transient speed-ups can also result from flood events caused by nearby lake drainages, with melt flowing to lower elevations, as dictated by the basal topography (Andrews et al., 2018; Mejia et al., 2021; Stevens et al., 2022). The mid-season speed-up event on 2012/180 shows the greatest variability in sliding response of all speed-up events analyzed in 2011 and 2012, including the North Lake drainage events (Fig. 7c and d). The for 2012/180 was ∼ 156 m yr−1 and the was ∼ 272 m yr−1 (Fig. 10). The ΔVN ranged from 1.2–2.6, with an of 1.7 and standard deviation of 0.5 (Fig. 10). However, the GPS stations that showed the greatest ΔV and ΔVN during this speed-up event (NL11, NL12, NL13; Fig. 10) differed from the GPS stations most responsive during North Lake drainages (NL7, NL8, NL10; Fig. 5).
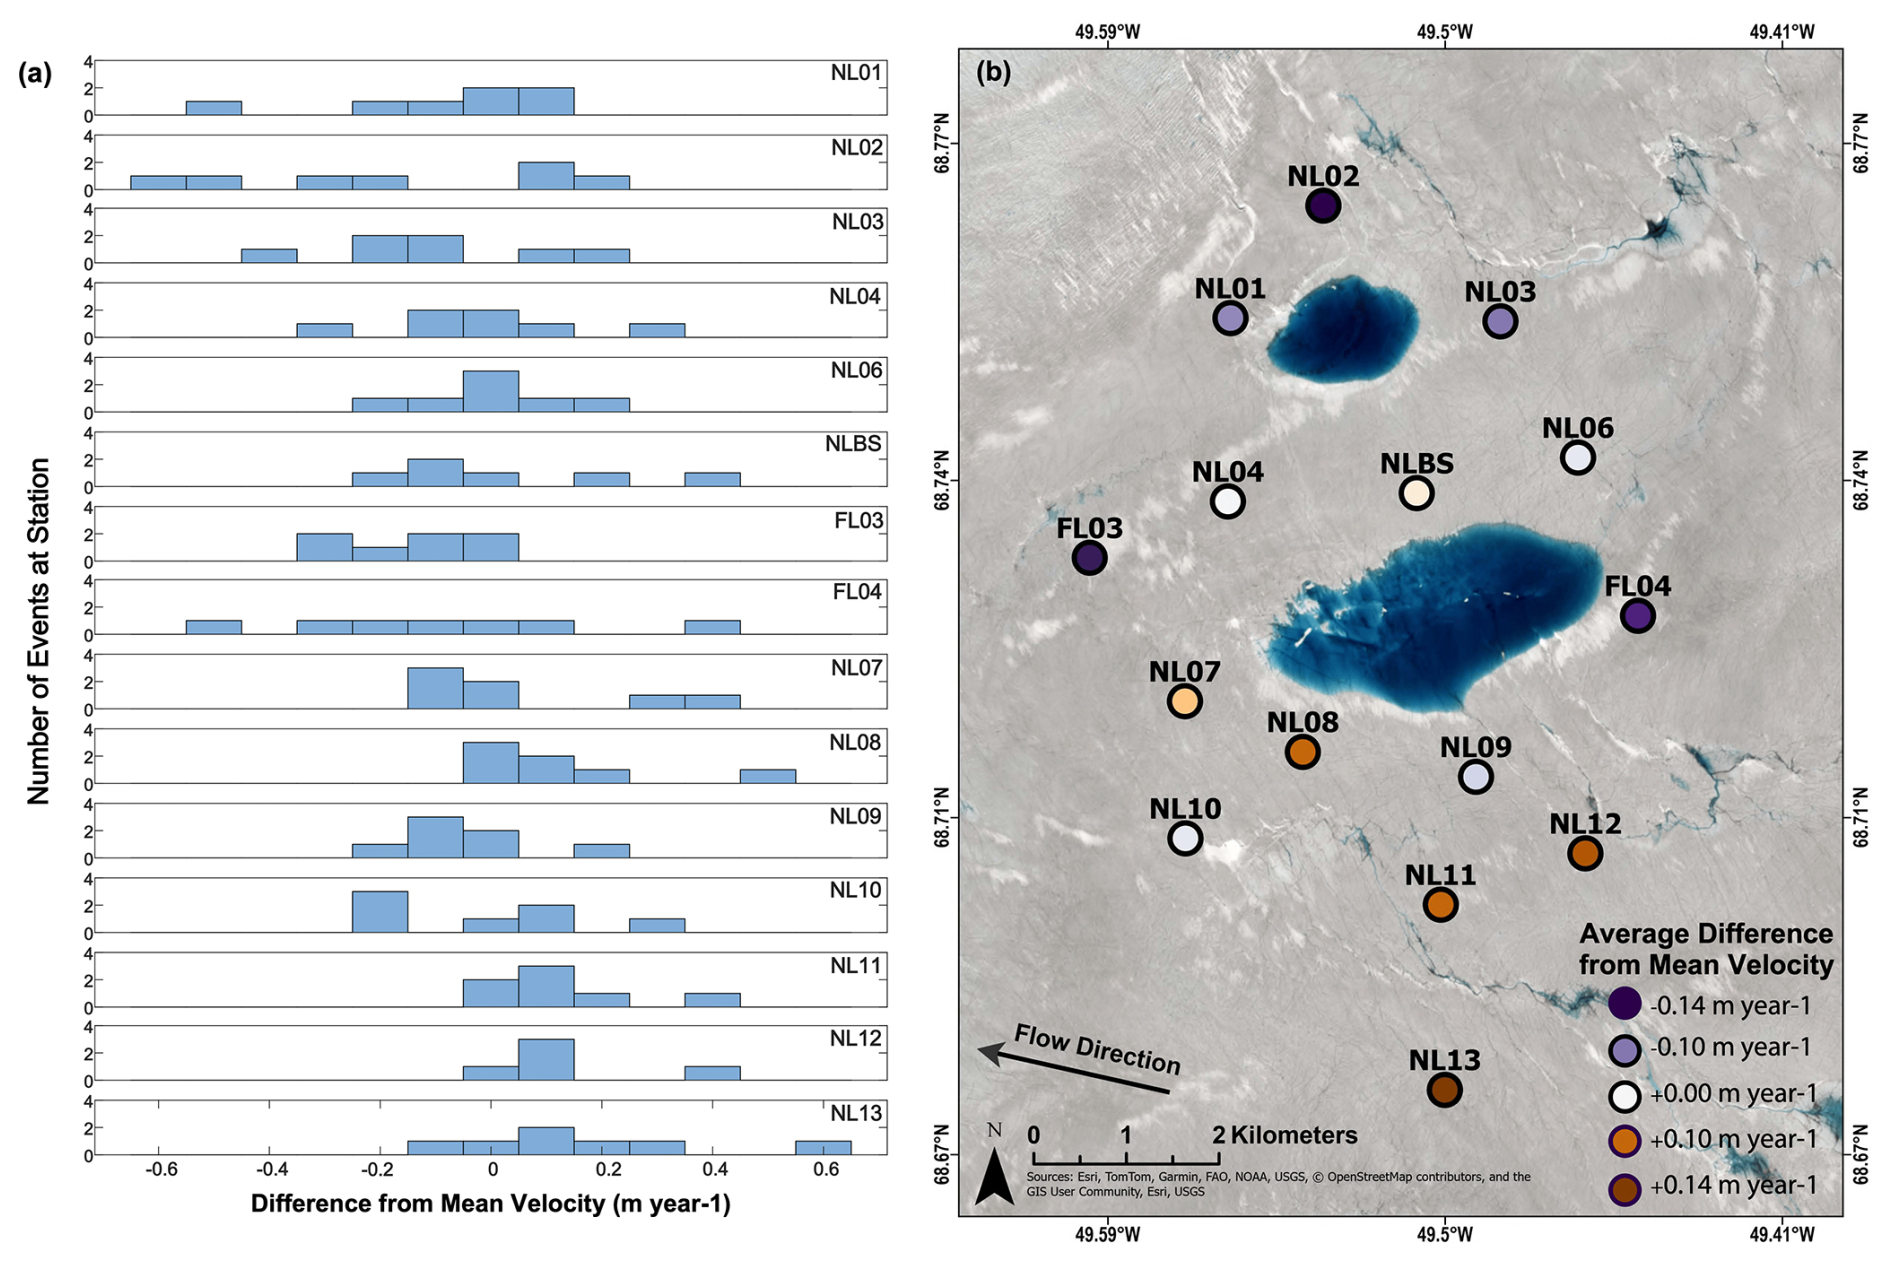
Figure 12(a) Deviation of ΔV (m yr−1) from the array mean at each station for each of the 7 transient speed-up events in 2011. (b) Average speed-up at each GPS sensor location for all events. Circles represent individual station locations: red colors show greater than and blue colors show lesser than . Note the similarity in the spatial pattern of speed-up compared to the 2012/180 neighboring lake drainage event.
To assess what caused the high variability of this speed-up event, we analyzed available Landsat-7 satellite images before and after the speed-up event. The Landsat images show a local lake drainage ∼ 8 km to the northeast of the North Lake basin occurred sometime between 2012/171 and 2012/178 (Fig. 11). Further, the spatial pattern of the velocity response shows the largest ΔV in the south and smallest ΔV in the north of the GPS array. This pattern is spatially correlated with the basal topography in the region (Morlighem et al., 2017; Morlighem, 2017), with the largest velocities coinciding with the lowest bed elevations. We interpret this to reflect that meltwater from the supraglacial lake drainage to the northeast has been preferentially transported down the hydraulic potential gradient (Chu et al., 2016), pooling in the bedrock basin to the south of North Lake. These results are consistent with Joughin et al. (2013), who described a region of elevated velocities that occurs seasonally and is aligned with the bedrock trough that extends northeast-southwest beneath North Lake. These results strongly suggest that bedrock topography influences local patterns of meltwater flow and ice-bed coupling. Moreover, the rate of subglacial flow must be no greater than ∼ 10 km d−1 (assuming the lake drainage event occurred immediately before the 2012/178 Landsat image) and no less than ∼ 1.25 km d−1 (assuming the lake drainage event occurred immediately after the 2012/171 Landsat image). For comparison, Hoffman et al. (2016) observed down-glacier flood propagation speeds ∼ 26 km d−1 following a supraglacial lake drainage in 2011 in west Greenland. These observations also point to the potential for hydro-fracture event triggering between adjacent lakes associated with stress coupling due to either ice speed-up or uplift associated with focused basal meltwater transport (Stevens et al., 2024).
In the context of the full melt season, the 2012/180 speed-up event is quite short in duration (∼ 1 d) and the background velocities dropped rapidly after the speed-up event (Fig. 9e), indicating a change in subglacial conditions towards a more efficient system. Lake drainages are often indicative of the onset of channelization (Andrews et al., 2018); however, some lake drainage events have been shown to slow ice-sheet velocities by dewatering of subglacial cavities without enlarging subglacial channels (Mejia et al., 2021). Additional observations of moulin water levels or focused subglacial hydrology modelling would be required to determine if this speed-up event is evidence of a cavity- or channel-related slow down.
Finally, we explored whether spatial patterns exist between the surface-velocity response and sensor location across the North Lake region over the entirety of the melt season. For each speed-up event in 2011, we calculated the difference in the speed-up (ΔV) at each station relative to the speed-up averaged across the array (. Overall, there are slightly smaller speed-ups relative to the array average in the northern half of the array, compared to larger speed-ups in the southern half (Fig. 12). An equivalent spatial distribution of speed-up was observed over the 2012 melt season (not shown), beyond the 2012/180 speed-up event (Fig. 11). These results further point toward the importance of basal topography in controlling patterns basal hydrology and ice-bed coupling on regional spatial scales.
This study builds upon a growing body of knowledge of the evolution of the subglacial drainage system and its effect on ice-sheet acceleration. Our findings provide insights into the structure and temporal evolution of the subglacial drainage system beneath the ablation zone on western margin of the Greenland Ice Sheet. We find enhanced ice-flow sensitivity to melt input in the form of longer, more uniform, velocity responses during late-season melt events compared to early- to mid-season lake drainage or melt events. However, the uplift signal associated with these late-season melt events is small and spatially heterogeneous, in contrast to lake drainage events in which meltwater is focused to a single location at the bed, producing pronounced, but spatially coherent uplift in a localized region. We interpret our results to imply that in the late melt season, most subglacial channels and/or connective flow pathways between cavities have substantially closed, sharply lowering basal transmissivity. At the same time, moulins formed throughout the melt season, likely remain open, allowing for pervasive and widely distributed surface-to-bed pathways for meltwater to reach the bed. The culmination of these factors results in late-season melt events that rapidly overwhelm the subglacial system and decreasing frictional coupling at the bed over larger spatial scales than lake drainages or regional melt events earlier in the season. Due to their extended duration and amplitude, these late-season melt events accommodate a larger fraction of the annual ice motion compared to lake drainage at North Lake; however, their net influence on ice sheet motion remains small (2 %–3 % of annual displacement). Further, we document that migration of meltwater pulses from lake drainages can influence sliding behavior over distances of ∼ 10 km, and that migration of these pulses appears to follow local bedrock topographic lows. Finally, this spatial variability in the velocity response persists on annual timescales, suggesting that basal topography plays a role in modulating sliding behavior over multiple timescales.
A version of the Network Inversion Filter (NIF) code for North Lake drainages is archived in a Zenodo repository (https://doi.org/10.5281/zenodo.10650188; Stevens and Larochelle, 2024).
GPS data are archived at the GAGE Facility operated by the EarthScope Consortium (https://doi.org/10.7283/T5222SJK, Das et al., 2018).
Sentinel-2 Imagery from the European Space Agency were accessed via Esri ArcGIS Pro (https://sentinel.arcgis.com/arcgis/rest/services/Sentinel2/ImageServer, last access: 28 September 2025).
The supplement related to this article is available online at https://doi.org/10.5194/tc-19-6149-2025-supplement.
GG performed the data analysis with oversight from MDB and LAS. NIF code was developed by LAS. SBD, IJ, and MDB conceived the project and collected the data with LAS. GG prepared the manuscript with contributions from all co-authors.
The contact author has declared that none of the authors has any competing interests.
Publisher’s note: Copernicus Publications remains neutral with regard to jurisdictional claims made in the text, published maps, institutional affiliations, or any other geographical representation in this paper. While Copernicus Publications makes every effort to include appropriate place names, the final responsibility lies with the authors. Views expressed in the text are those of the authors and do not necessarily reflect the views of the publisher.
Support was provided by the National Science Foundation's Office of Polar Programs (NSF-OPP) and National Aeronautics and Space Administration's (NASA's) Cryospheric Sciences Program through ARC-0520077, ARC-1023364, and NNX10AI30G to S. B. Das and M. D. Behn; OPP-1838410 to M. D. Behn; and ARC-0520382, ARC-1023382, and NNX10AI33G to I. Joughin. G. Gjerde would also like to the Boston College Undergraduate Research Fellows Program. L. A. Stevens acknowledges funding from the John Fell Oxford University Press Fund and the UK Natural Environment Research Council (grant no. NE/Y002369/1). Logistical and instrumental support was provided by UNAVCO and CH2MHILL Polar Field Services. We thank Yi Ming for suggestions on an early version of this manuscript.
This research was supported by the U.S. National Science Foundation Office of Polar Programs, Division of Arctic Sciences (grant nos. NSF ARC-10-23364, ARC-10-23382, OPP-18-38410, OPP-18-38464) and the UK Natural Environmental Research Council (grant no. NE/Y002369/1). Funding for undergraduate research was also provided by Boston College.
This paper was edited by Stephen Livingstone and reviewed by three anonymous referees.
Andrews, L. C., Catania, G. A., Hoffman, M. J., Gulley, J. D., Lüthi, M. P., Ryser, C., Hawley, R. L., and Neumann, T. A.: Direct observations of evolving subglacial drainage beneath the Greenland Ice Sheet, Nature, 514, 80–83, https://doi.org/10.1038/nature13796, 2014.
Andrews, L. C., Hoffman, M. J., Neumann, T. A., Catania, G. A., Lüthi, M. P., Hawley, R. L., Schild, K. M., Ryser, C., and Morriss, B. F.: Seasonal evolution of the subglacial hydrologic system modified by supraglacial lake drainage in western Greenland, Journal of Geophysical Research: Earth Surface, 123, 1479–1496, https://doi.org/10.1029/2017JF004585, 2018.
Bartholomaus, T. C., Anderson, R. S., and Anderson, S. P.: Growth and collapse of the distributed subglacial hydrologic system of Kennicott Glacier, Alaska, USA, and its effects on basal motion, Journal of Glaciology, 57, 985–1002, https://doi.org/10.3189/002214311798843269, 2011.
Bartholomew, I., Nienow, P., Mair, D., Hubbard, A., King, M. A., and Sole, A.: Seasonal evolution of subglacial drainage and acceleration in a Greenland outlet glacier, Nature Geoscience, 3, 408–411, https://doi.org/10.1038/ngeo863, 2010.
Bartholomew, I., Nienow, P., Sole, A., Mair, D., Cowton, T., Palmer, S., and Wadham, J.: Supraglacial forcing of subglacial drainage in the ablation zone of the Greenland ice sheet, Geophysical Research Letters, 38, https://doi.org/10.1029/2011GL047063, 2011.
Bevis, M., Wahr, J., Khan, S. A., Madsen, F. B., Brown, A., Willis, M., Kendrick, E., Knudsen, P., Box, J. E., van Dam, T. and Caccamise, D. J., Johns, B., Nylen, T., Abbott, R., White, S., Miner, J., Forsberg, R., Zhou, H., Wang, J., Wilson, T., Bromwich, D., and Francis, O.: Bedrock displacements in Greenland manifest ice mass variations, climate cycles and climate change, Proceedings of the National Academy of Sciences, 109, 11944-11948, https://doi.org/10.1073/pnas.1204664109, 2012.
Chandler, D. M., Wadham, J. L., Lis, G. P., Cowton, T., Sole, A., Bartholomew, I., Telling, J., Nienow, P., Bagshaw, E. B., Mair, D., Vinen, S., and Hubbard, A.: Evolution of the subglacial drainage system beneath the Greenland Ice Sheet revealed by tracers, Nature Geoscience, 6, 195–198, https://doi.org/10.1038/ngeo1737, 2013.
Chen, G.: GPS Kinematics Positioning for the Airborne Laser Altimetry at Long Valley, California, PhD thesis, Massachusetts Institute of Technology, http://dspace.mit.edu/handle/1721.1/9680 (last access: 19 October 2025), 1998.
Chu, W., Creyts, T. T., and Bell, R. E.: Rerouting of subglacial water flow between neighboring glaciers in West Greenland, Journal of Geophysical Research: Earth Surface, 121, 925–938, https://doi.org/10.1002/2015JF003705, 2016.
Chudley, T. R., Christoffersen, P., Doyle, S. H., Bougamont, M., Schoonman, C. M., Hubbard, B., and James, M. R.: Supraglacial lake drainage at a fast-flowing Greenlandic outlet glacier, Proceedings of the National Academy of Sciences, 116, 25468–25477, https://doi.org/10.1073/pnas.1913685116, 2019.
Clarke, G. K.: Subglacial processes, Annu. Rev. Earth Planet. Sci., 33, 247–276, https://doi.org/10.1146/annurev.earth.33.092203.122621, 2005.
Das, S. B., Joughin, I., Behn, M. D., Howat, I. M., King, M. A., Lizarralde, D., and Bhatia, M. P.: Fracture propagation to the base of the Greenland Ice Sheet during supraglacial lake drainage, Science, 320, 778–781, https://doi.org/10.1126/science.1153360, 2008.
Das, S. B., Behn, M. D., Joughin, I., and Stevens, L. A.: Greenland Fractures 2011–2014 – NL01-North Lake 01 – GPS/GNSS Observations Dataset, NSF [data set], https://doi.org/10.7283/T5222SJK, 2018.
Dow, C. F., Kulessa, B., Rutt, I. C., Tsai, V. C., Pimentel, S., Doyle, S. H., As, D. Van, Lindbäck, K., Pettersson, R., Jones, G. A., and Hubbard, A. L.: Modeling of subglacial hydrological development following rapid supraglacial lake drainage, Journal of Geophysical Research: Earth Surface, 120, 1127–1147, https://doi.org/10.1002/2014JF003333, 2015.
Doyle, S. H., Hubbard, A. L., Dow, C. F., Jones, G. A., Fitzpatrick, A., Gusmeroli, A., Kulessa, B., Lindback, K., Pettersson, R., and Box, J. E.: Ice tectonic deformation during the rapid in situ drainage of a supraglacial lake on the Greenland Ice Sheet, The Cryosphere, 7, 129–140, https://doi.org/10.5194/tc-7-129-2013, 2013.
Doyle, S. H., Hubbard, A., Fitzpatrick, A. A., Van As, D., Mikkelsen, A. B., Pettersson, R., and Hubbard, B.: Persistent flow acceleration within the interior of the Greenland ice sheet, Geophysical Research Letters, 41, 899–905, https://doi.org/10.1002/2013GL058933, 2014.
Doyle, S. H., Hubbard, A., Van De Wal, R. S., Box, J. E., Van As, D., Scharrer, K., Meierbachtol, T. W., Smeets, P. C., Harper, J. T., Johansson, E., Mottram, R. H., Mikkelsen, A. B., Wilhelms, F., Patton, H., Christoffersen, P., and Hubbard, B.: Amplified melt and flow of the Greenland ice sheet driven by late-summer cyclonic rainfall, Nature Geoscience, 8, 647–653, https://doi.org/10.1038/ngeo2482, 2015.
Flowers, G. E.: Modelling water flow under glaciers and ice sheets, Proceedings of the Royal Society A: Mathematical, Physical and Engineering Sciences, 471, 20140907, https://doi.org/10.1098/rspa.2014.0907, 2015.
Hanna, E., Jones, J. M., Cappelen, J., Mernild, S. H., Wood, L., Steffen, K., and Huybrechts, P.: The influence of North Atlantic atmospheric and oceanic forcing effects on 1900–2010 Greenland summer climate and ice melt/runoff, Int. J. Climatol., 33, 862–880, https://doi.org/10.1002/joc.3475, 2013.
Hanna, E., Topál, D., Box, J. E., Buzzard, S., Christie, F. D., Hvidberg, C., Morlighem, M., De Santis, L., Silvano, A., Colleoni, F., Sasgen, I., Banwell, A. F., van den Broeke, M. R., DeConto, R., De Rydt, J., Goelzer, H., Goassart, A., Gudmundsson, G. H., Lindbäck, K., Miles, B., Mottram, R., Pattyn, F., Reese, R., Rignot, E., Srivastava, A., Sun, S., Toller, J., Tuckett, P. A., and Ultee, L.: Short-and long term variability of the Antarctic and Greenland ice sheets, Nature Reviews Earth & Environment, 5, 193–210, https://doi.org/10.1038/s43017-023-00509-7, 2024.
Hewitt, I. J.: Seasonal changes in ice sheet motion due to melt water lubrication, Earth and Planetary Science Letters, 371, 16–25, https://doi.org/10.1016/j.epsl.2013.04.022, 2013.
Herring, T. A., King, R. W., and McClusky, S. C.: GAMIT Reference Manual: GPS Analysis at MIT, Release 10.4. Department of Earth, Atmospheric and Planetary Sciences, Massachusetts Institute of Technology, https://doi.org/10.1016/j.sciaf.2025.e02681, 2010.
Hoffman, M. J., Catania, G. A., Neumann, T. A., Andrews, L. C., and Rumrill, J. A.: Links between acceleration, melting, and supraglacial lake drainage of the western Greenland Ice Sheet, Journal of Geophysical Research: Earth Surface, 116, https://doi.org/10.1029/2010JF001934, 2011.
Hoffman, M. J., Andrews, L. C., Price, S. F., Catania, G. A., Neumann, T. A., Lüthi, M. P., Gulley, J., Ryser, C., Hawley, R. L., and Morriss, B.: Greenland subglacial drainage evolution regulated by weakly connected regions of the bed, Nature Communications, 7, 13903, https://doi.org/10.1038/ncomms13903, 2016.
Ing, R. N., Nienow, P. W., Sole, A. J., Tedstone, A. J., and Mankoff, K. D.: Minimal impact of late-season melt events on Greenland Ice Sheet annual motion, Geophysical Research Letters, 51, https://doi.org/10.1029/2023GL106520, 2024.
Joughin, I., Das, S. B., Flowers, G. E., Behn, M. D., Alley, R. B., King, M. A., Smith, B. E., Bamber, J. L., van den Broeke, M. R., and van Angelen, J. H.: Influence of ice-sheet geometry and supraglacial lakes on seasonal ice-flow variability, The Cryosphere, 7, 1185–1192, https://doi.org/10.5194/tc-7-1185-2013, 2013.
Krawczynski, M. J., Behn, M. D., Das, S. B., and Joughin, I.: Constraints on the lake volume required for hydro-fracture through ice sheets, Geophysical Research Letters, 36, https://doi.org/10.1029/2008GL036765, 2009.
Lai, C. Y., Stevens, L. A., Chase, D. L., Creyts, T. T., Behn, M. D., Das, S. B., and Stone, H. A.: Hydraulic transmissivity inferred from ice-sheet relaxation following Greenland supraglacial lake drainages, Nature Communications, 12, 1–10, https://doi.org/10.1038/s41467-021-24186-6, 2021.
Loeb, N. A., Crawford, A., Stroeve, J. C., and Hanesiak, J.: Extreme precipitation in the eastern Canadian Arctic and Greenland: An evaluation of atmospheric reanalyses, Frontiers in Environmental Science, 10, 866929, https://doi.org/10.3389/fenvs.2022.866929, 2022.
Mejia, J. Z., Gulley, J. D., Trunz, C., Covington, M. D., Bartholomaus, T. C., Xie, S., and Dixon, T. H.: Isolated cavities dominate Greenland Ice Sheet dynamic response to lake drainage, Geophysical Research Letters, 48, e2021GL094762, https://doi.org/10.1029/2021GL094762, 2021.
Morlighem, M.: BedMachine Greenland v3, Arctic Data Center [data set], https://doi.org/10.18739/A2ZS2TJDN, 2017.
Morlighem, M., Williams, C. N., Rignot, E., An, L., Arndt, J. E., Bamber, J. L., Catania, G., Chauché, N., Dowdeswell, J. A., Dorschel, B., Fentry, I., Hogan, K., Howat, I., Hubbard, A., Jakobsson, M., Jordan, T. M., Kjeldsen, K. K., Millan, R., Mayer, L., Mouginot, J., Noël, B. P. Y., O'Cofaigh, C., Palmer, S., Rysgaard, S., Seroussi, H., Siegert, M. J., Slabon, P., Straneo, F., van den Broeke, M. R., Weinrebe, W., Wood, M., and Zinglersen, K. B.: BedMachine v3: Complete bed topography and ocean bathymetry mapping of Greenland from multibeam echo sounding combined with mass conservation, Geophysical Research Letters, 44, 11–51, https://doi.org/10.1002/2017GL074954, 2017.
Noël, B.: RACMO2.3p2 Greenland Ice Sheet surface mass balance (v1.0), Utrecht University [data set], https://doi.org/10.34992/2c66-ef58, 2020.
Noël, B., van de Berg, W. J., van Meijgaard, E., Kuipers Munneke, P., van de Wal, R. S. W., and van den Broeke, M. R.: Evaluation of the updated regional climate model RACMO2.3: summer snowfall impact on the Greenland Ice Sheet, The Cryosphere, 9, 1831–1844, https://doi.org/10.5194/tc-9-1831-2015, 2015.
Okada, Y.: Surface deformation due to shear and tensile faults in a half-space, Bulletin of the Seismological Society of America, 75, 1135–1154, https://doi.org/10.1785/bssa0750041135, 1985.
Pitcher, L. H. and Smith, L. C.: Supraglacial streams and rivers, Annual Review of Earth and Planetary Sciences, 47, 421–452, https://doi.org/10.1146/annurev-earth-053018-060212, 2019.
Pritchard, H. D., Arthern, R. J., Vaughan, D. G., and Edwards, L. A.: Extensive dynamic thinning on the margins of the Greenland and Antarctic ice sheets, Nature, 461, 971–975, https://doi.org/10.1038/nature08471, 2009.
Porter, C., Howat, I., Noh, M.J., Husby, E., Khuvis, S., Danish, E., Tomko, K., Gardiner, J., Negrete, A., Yadav, B., Klassen, J., Kelleher, C., Cloutier, M., Bakker, J., Enos, J., Arnold, G., Bauer, G., and Morin, P.: ArcticDEM – Mosaics, Version 4.1, Harvard Dataverse [data set], https://doi.org/10.7910/DVN/3VDC4W, 2023.
Schoof, C.: Ice-sheet acceleration driven by melt supply variability, Nature, 468, 803–806, https://doi.org/10.1038/nature09618, 2010.
Schmid, T., Radić, V., Tedstone, A., Lea, J. M., Brough, S., and Hermann, M.: Atmospheric drivers of melt-related ice speed-up events on the Russell Glacier in southwest Greenland, The Cryosphere, 17, 3933–3954, https://doi.org/10.5194/tc-17-3933-2023, 2023.
Schwanghart, W. and Scherler, D.: TopoToolbox 2 – MATLAB-based software for topographic analysis and modeling in Earth surface sciences, Earth Surface Dynamics, 2, 1–7, https://doi.org/10.5194/esurf-2-1-2014, 2014.
Schwanghart, W. and Scherler, D.: TopoToolbox, Zenodo [code], https://doi.org/10.5281/zenodo.593110, 2021.
Segall, P.: Earthquake and volcano deformation, In Earthquake and Volcano Deformation, Princeton University Press, https://doi.org/10.1515/9781400833856, 2010.
Segall, P. and Matthews, M.: Time dependent inversion of geodetic data, Journal of Geophysical Research: Solid Earth, 102, https://doi.org/10.1029/97JB01795, 1997.
Stevens, L. A. and Larochelle, S.: Elastic stress coupling between supraglacial lakes, Zenodo [code], https://doi.org/10.5281/zenodo.10650188, 2024.
Stevens, L. A., Behn, M. D., McGuire, J. J., Das, S. B., Joughin, I., Herring, T., Shean, D. E., and King, M. A.: Greenland supraglacial lake drainages triggered by hydrologically induced basal slip, Nature, 522, 73–76, https://doi.org/10.1038/nature14480, 2015.
Stevens, L. A., Behn, M. D., Das, S. B., Joughin, I., Noël, B. P., van den Broeke, M. R., and Herring, T.: Greenland Ice Sheet flow response to runoff variability, Geophysical Research Letters, 43, 11295–11303, https://doi.org/10.1002/2016GL070414, 2016.
Stevens, L. A., Nettles, M., Davis, J. L., Creyts, T. T., Kingslake, J., Hewitt, I. J., and Stubblefield, A.: Tidewater-glacier response to supraglacial lake drainage, Nat Communications, 13, 6065, https://doi.org/10.1038/s41467-022-33763-2, 2022.
Stevens, L. A., Das, S. B., Behn, M. D., McGuire, J. J., Lai, C. Y., Joughin, I., Larochelle, S., and Nettles, M.: Elastic stress coupling between supraglacial lakes, Journal of Geophysical Research: Earth Surface, 129, https://doi.org/10.1029/2023JF007481, 2024.
Tedstone, A. J., Nienow, P. W., Gourmelen, N., Dehecq, A., Goldberg, D., and Hanna, E.: Decadal slowdown of a land-terminating sector of the Greenland Ice Sheet despite warming, Nature, 526, 692–695, https://doi.org/10.1038/nature15722, 2015.
van de Wal, R. S., Boot, W., van den Broeke, M. R., Smeets, C. J., Reijmer, C. H., Donker, J. J., and Oerlemans, J.: Large and rapid melt-induced velocity changes in the ablation zone of the Greenland Ice Sheet, Science, 321, 111–113, https://doi.org/10.1126/science.1158540, 2008.
van de Wal, R. S. W., Smeets, C. J. P. P., Boot, W., Stoffelen, M., van Kampen, R., Doyle, S. H., Wilhelms, F., van den Broeke, M. R., Reijmer, C. H., Oerlemans, J., and Hubbard, A.: Self-regulation of ice flow varies across the ablation area in south-west Greenland, The Cryosphere, 9, 603–611, https://doi.org/10.5194/tc-9-603-2015, 2015.
van den Broeke, M., Bamber, J., Ettema, J., Rignot, E., Schrama, E., van de Berg, W. J., van Meijgaard, E., Velicogna, I., and Wouters, B.: Partitioning recent Greenland mass loss, Science, 326, 984–986, https://doi.org/10.1126/science.1178176, 2009.
Yang, K. and Smith, L. C.: Internally drained catchments dominate supraglacial hydrology of the southwest Greenland Ice Sheet, Journal of Geophysical Research: Earth Surface, 121, 1891–1910, https://doi.org/10.1002/2016JF003927, 2016.
Yang, K., Smith, L. C., Karlstrom, L., Cooper, M. G., Tedesco, M., van As, D., Cheng, X., Chen, Z., and Li, M.: A new surface meltwater routing model for use on the Greenland Ice Sheet surface , The Cryosphere, 12, 3791–3811, https://doi.org/10.5194/tc-12-3791-2018, 2018.
Zwally, H. J., Abdalati, W., Herring, T., Larson, K., Saba, J., and Steffen, K.: Surface melt-induced acceleration of Greenland ice-sheet flow, Science, 297, 218–222, https://doi.org/10.1126/science.1072708, 2002.