the Creative Commons Attribution 4.0 License.
the Creative Commons Attribution 4.0 License.
 | 11 Feb 2025
Extreme precipitation associated with atmospheric rivers over West Antarctic ice shelves: insights from kilometre-scale regional climate modelling
Denis Pishniak
José Abraham Torres
Andrew Orr
Michelle Maclennan
Nander Wever
Kristiina Verro
We explore how atmospheric rivers (ARs) in a summer and winter case interact with the topography of the Amundsen Sea Embayment, West Antarctica, and deposit significant precipitation amounts. To do this we use results from three regional climate models (RCMs: MetUM, Polar-WRF, HCLIM) at a spatial resolution of 1 km. Estimates of snowfall associated with both events from all three RCM simulations compare well against observed snow height measurements over the Thwaites and Pine Island ice shelves. By contrast, snowfall estimates from ERA5 reanalysis for both events are severely underestimated (by 3–4 times) compared to the measurements. Outputs from the RCMs also show that the ARs may be associated with several millimetres of rain in both the summer and winter cases, although in the absence of in situ measurements of rainfall, this result cannot be directly verified. The RCM simulations suggest that rainfall during these events can fall directly as supercooled drizzle but also that rainfall is concentrated around steep terrain due to the interaction of ARs with complex orography. We also show that while the amount of MetUM-simulated snowfall was comparatively resolution-insensitive, the amount of rainfall simulated was not, with rainfall amounts over Thwaites Ice Shelf 4–16 times higher in 1 km simulations compared to 12 km simulations. Our work highlights that kilometre-scale models are useful tools to investigate the total precipitation amount and its partitioning into rain and snow over this globally important and climatically sensitive region, and it highlights the critical need for in situ observations of rainfall.
- Article
(6122 KB) - Full-text XML
-
Supplement
(1457 KB) - BibTeX
- EndNote


West Antarctica, and particularly the Amundsen Sea Embayment (ASE), has been the focus of attention in recent years because of the rapid pace of climate and cryospheric change there. Glaciers in the ASE, and in particular the Thwaites (TG) and Pine Island (PIG) glaciers, have been highlighted because they are accelerating and losing ice mass extremely fast, largely due to basal melting (Lhermitte et al., 2020; Rignot et al., 2019). The ice shelves restraining TG and PIG have been shown to be vulnerable to damage and weakening and are changing very rapidly, thinning and retreating in response to oceanic and atmospheric warming (Lhermitte et al., 2020; Alley et al., 2021). In fact, over a third of the mass loss from West Antarctica comes from ice shelves (Smith et al., 2020).
The health of ice shelves can be partly measured by the surface mass balance (SMB). Ice shelf SMB describes how inputs of precipitation (accumulation) are balanced by losses of melt runoff, sublimation, and evaporation (ablation). Snowfall accumulation is the primary counterbalance to dynamical and surface losses from ice shelves, with redistribution (e.g. via blowing snow) playing an additional role (Mottram et al., 2021; Lenaerts et al., 2019). Accumulation does not currently offset the aforementioned losses on ASE ice shelves (Rignot et al., 2019) but is vital to quantify because it can have an important effect on the timing and characteristics of ice shelf collapse or recession and thinning (Scambos et al., 2017; Medley and Thomas, 2019; van Wessem et al., 2023). Antarctic accumulation is expected to increase as climate changes because a warmer atmosphere has a higher saturation vapour capacity as per the Clausius–Clapeyron relationship (Clausius, 1850; Clapeyron, 1834), meaning it can retain more moisture. However, increased precipitation will likely not balance increased losses over the 21st century (Gilbert and Kittel, 2021; Kittel et al., 2022).
Extreme precipitation events account for a large proportion of annual precipitation on the ASE coast, with 50 % of annual precipitation falling in approximately 30 d yr−1 (Turner et al., 2019). And they matter: Davison et al. (2023) demonstrate that extreme precipitation can play an important role in offsetting some of the notable mass losses in the ASE, and Wille et al. (2024) show that extreme precipitation in East Antarctica in March 2022 helped to make 2022's annual mass balance positive – a rare occurrence.
Moreover, atmospheric rivers (ARs) often coincide with extreme precipitation events in the ASE region and account for up to 11 % of annual precipitation totals, despite making landfall on just ∼ 3 d yr−1 (Wille et al., 2021; Maclennan et al., 2023). These long, filament-shaped atmospheric features transport large quantities of water vapour meridionally and have been described as “rivers in the sky” that can greatly impact Antarctic precipitation variability (Shields et al., 2022). ARs are frequently associated with the presence of a high–low-pressure couplet and a blocking anticyclone that funnels warm and moist air towards the continent (Wille et al., 2019; Scott et al., 2019; Baiman et al., 2024). Adusumilli et al. (2021) showed that extreme precipitation events explained 41 % of snow height changes over the West Antarctic ice sheet in 2019 and that the majority were associated with the infrequent but intense precipitation brought by ARs. However, Davison et al. (2023) note that 2019 and 2020 were both extreme precipitation years, implying that these results may not be representative.
The localised impacts of ARs in Antarctica have been shown to be extremely important. The characteristics of ARs in Antarctica differ from those elsewhere – for instance they make landfall less frequently, and the colder polar atmosphere means they transport less moisture than at lower latitudes (Maclennan et al., 2023). They are also strongly impacted by the steep terrain of the Antarctic Ice Sheet, which often results in the coincidence of ARs with foehn events, raising temperatures and wind speeds but causing a drying (Elvidge and Renfrew, 2016; Gilbert et al., 2022). This foehn + AR combination has previously been shown to be important over the Antarctic Peninsula (Bozkurt et al., 2018; Wille et al., 2022; Zou et al., 2023; Gorodetskaya et al., 2023) and South Orkney Islands (Lu et al., 2023). Francis et al. (2023) also show that foehn winds over PIG have a considerable impact on the ice shelf mass balance via their effect on sublimation and that these can be combined with ARs to induce considerable warming. But they can also impact precipitation; for instance Gehring et al. (2022) show how an AR and foehn event combined to affect precipitation phase and the quantity of snow reaching the ground at Davis, East Antarctica. That study also showed that the specifics of how the airflow interacts with steep topography can strongly influence precipitation phase (e.g. via the impact of foehn on the sublimation of precipitation particles).
ARs are also associated with the occurrence of rainfall over Antarctica (Wille et al., 2019, 2021, 2024; Lu et al., 2023). This is primarily due to warm-air advection and moisture convergence facilitated by ARs, which elevate temperatures and increase the likelihood of liquid precipitation (Bromwich et al., 2024; Bozkurt et al., 2024). For example, ARs were responsible for approximately 30 % of the rainfall recorded in the ASE between 1980–2018 (Wille et al., 2021) and were implicated in the record-breaking East Antarctic heatwave of March 2022, which resulted in rainfall over the periphery of the ice sheet and ice shelves (Wille et al., 2024). Vignon et al. (2021) show that rain falls up to 100 d yr−1 in low-elevation regions around the Antarctic coast, including over ice shelves. Rainfall is an important climate indicator but can also contribute to surface melting by the freezing of the liquid water within the snowpack releasing latent energy to the environment, as well as lowering the surface albedo (Doyle et al., 2015; Wille et al., 2021; Box et al., 2022, 2023). Rainfall also impacts firn properties by filling pore spaces and driving densification, and if it refreezes in the snowpack, rain can form ice lenses that reduce the stability of ice shelves (Harper et al., 2023; Noël et al., 2022). The interaction of airflow with steep terrain can also impact the phase and characteristics of precipitation, for example enhancing rainfall production via the seeder–feeder mechanism (Lean and Clark, 2003) and generating supercooled drizzle in mixed-phase clouds (Fernández-González et al., 2015; Ramelli et al., 2021). Supercooled drizzle remains liquid at temperatures below the freezing point of 0 °C. Seeder–feeder processes involve a higher-level cloud (the “seeder”) precipitating ice crystals into a lower cloud containing liquid droplets (the “feeder”) where they grow via riming or vapour deposition, thus enhancing liquid precipitation (He et al., 2022).
The quantity and characteristics of precipitation falling over ice shelves in the ASE are highly dependent on localised characteristics such as orography, which are not adequately represented by either sparse in situ observations or coarse-resolution atmospheric reanalyses (Turner et al., 2019; Mottram et al., 2021; Gehring et al., 2022; Nicola et al., 2023). This constitutes a clear knowledge gap, which must be addressed to better estimate SMB and loss of mass from ice sheets (IPCC, 2019; Pritchard, 2021). Additionally, while several studies have used reanalyses to explore precipitation extremes associated with ARs over the ASE region (e.g. Francis et al., 2023; Maclennan et al., 2023; Wille et al., 2021), such datasets do not have sufficient resolution to explore the impact of complex orography on AR precipitation dynamics and characteristics. Using regional climate models (RCMs) to dynamically downscale reanalysis to high spatial and temporal resolution has been shown to be critical to resolving the important fine-scale processes, interactions, and circulations that contribute to precipitation, including extremes (Gilbert et al., 2020, 2022; Morrison et al., 2020; Lu et al., 2023).
This study uses a mini-ensemble of three state-of-the-art kilometre-scale RCMs to explore the interactions between ARs and the TG and PIG ice shelves during two extreme precipitation events in winter and summer 2020. We aim to quantify the precipitation deposited during the ARs, including rain. Over the long term, repeated rainfall events may affect the SMB and stability of these ice shelves. Additionally, we evaluate the performance of these RCMs in this region in capturing the dynamics of extreme precipitation in this climatically sensitive region, where observations are limited. By understanding the drivers and impacts of AR-induced extreme precipitation, this work seeks to determine the extent to which ice mass loss from important ice shelves and glaciers in the region can be modulated by accumulation.
We use a mini-ensemble of three regional climate models (RCMs: MetUM, Polar-WRF, and HCLIM) over the region centred on the PIG and TG ice shelves to simulate two AR extreme precipitation case studies: a winter case (23–30 June 2020) and a summer case (3–9 February 2020), which is also used in Maclennan et al. (2023). We then compare simulation outputs with near-surface meteorological automatic weather station (AWS) data on the TG ice shelf, as well as accumulation data derived from observations of snow height at the station to provide a ground truth of accumulated mass. We also include simulations by the SNOWPACK snow model (Wever, 2022), where the model-derived accumulation and snow water equivalent are derived directly from the snow height sensor measurements (Maclennan et al., 2023). SNOWPACK allows a direct comparison of the observations against RCMs and the ERA5 reanalysis (which output snow and rain mass quantities) and therefore provides a ground truth of accumulated mass that enables us to evaluate precipitation phase partitioning. Further information regarding the RCMs is given in Sect. 2.1, the ERA5 reanalysis is described in Sect. 2.2, the details of the observational data are given in Sect. 2.3, and the SNOWPACK firn model is described in Sect. 2.4.
2.1 Regional climate models
All three RCMs use a one-way nesting approach to dynamically downscale the ERA5 reanalysis (Hersbach et al., 2020, described in Sect. 2.2) to a very fine resolution (1 km horizontal grid spacing) with a series of intermediate nests. The MetUM and HCLIM use exactly the same domains, with the 1 km inner domain nested within an intermediate 3 and 12 km domain, as shown in Fig. 1a. Figure 1b shows the 1 km domain, which is focused on the region of interest. Meanwhile, Polar-WRF uses a set-up focused on the same region but with a 9 km outer domain and 3 and 1 km domains with a larger areal extent, as shown in Fig. S1 in the Supplement. The RCMs all have a model top of approximately 40 km, with 52, 65, and 70 vertical levels in Polar-WRF, HCLIM, and the MetUM, respectively, including 16, 20, and 14 levels below 1 km altitude. All three RCMs derive their model surface elevation and land–sea mask from updated high-resolution datasets. For the MetUM and Polar-WRF, this is the REMA dataset at 200 m resolution (Howat et al., 2019), whereas for HCLIM this is v3 of the MEaSUREs BedMachine elevation model (Morlighem et al., 2020; Morlighem, 2022) at 500 m resolution.
The ERA5 reanalysis is used to supply the RCMs with initial and boundary conditions. We use standard atmospheric variables to initialise the model (temperature, pressure, winds, and humidity) as well as sea surface temperature and sea ice. For Polar-WRF and HCLIM, these conditions are applied directly to the edges of the outer nest (9 and 12 km, respectively). For the MetUM, ERA5 is used to force a global model configuration of the MetUM at approximately 40 km horizontal resolution, which then provides boundary conditions for the outermost 12 km nest of the MetUM. Both HCLIM and Polar-WRF are run continuously for each case with boundary conditions supplied at three-hourly intervals and the first 24 h of the model run discarded as spin-up. The MetUM is run in “forecast mode”, which means it is reinitialised at 12-hourly intervals and then run for 24 h forecasts. The initial 12 h of each forecast is discarded as spin-up, while the second halves are kept and concatenated into a continuous time series, as in Gilbert et al. (2022).
The following subsections describe relevant technical differences and parameterisations used in each model.
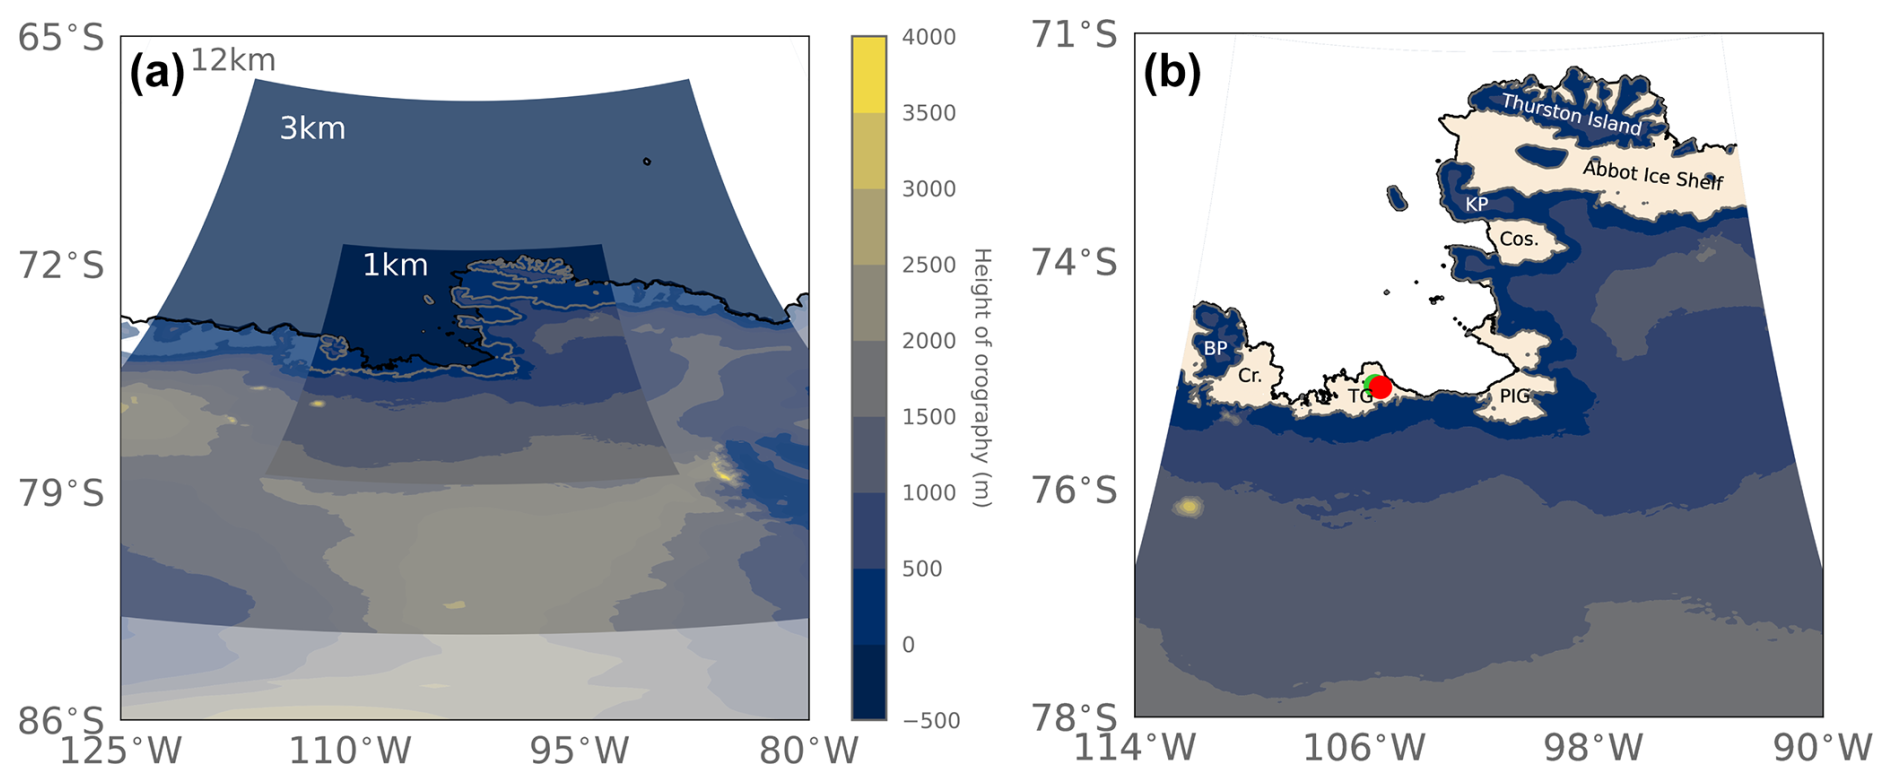
Figure 1Model domains used in this study. Panel (a) shows the mean height of the REMA orography (Howat et al., 2019) over the 12, 3, and 1 km domains, with ice shelf outlines shown in grey on the innermost 1 km domain. Panel (b) shows the 1 km domain, with ice shelves shown in off-white and important locations labelled as follows: BP (Bear Peninsula), Cr. (Crosson Ice Shelf), TG (Thwaites Glacier ice shelf), PIG (Pine Island Glacier ice shelf), Cos. (Cosgrove Ice Shelf), KP (King Peninsula), Abbot Ice Shelf, and Thurston Island. The red and green circles show the location of the Channel and Cavity stations, respectively.
2.1.1 MetUM
The MetUM global model is run using the GA7 science configuration (Walters et al., 2019), while the nested domains are run using the RA2M science configuration described in Bush et al. (2023). This means that convection is parameterised in the 12 km nest (according to the 5a scheme originally developed by Cullen, 1993), while it is explicitly resolved in the 3 and 1 km domains. The formulation of the (diagnostic) large-scale cloud scheme used in RA2M is similar to the configuration described in Gilbert et al. (2020), including the modifications of Abel et al. (2017). These adaptations limit the overlap between cloud liquid and ice phases, thereby reducing the positive cloud ice and negative cloud liquid biases present in previous model versions. The microphysics scheme is based on Wilson and Ballard (1999) with extensive modifications and represents five hydrometeors (cloud, ice, snow, rain, and graupel). The single-moment scheme uses a fixed cloud droplet number and the generic ice particle size distribution of Field et al. (2007). Further details on the scientific specification of RA2M can be found in Bush et al. (2023).
2.1.2 Polar-WRF
Polar-WRF (v4.1.1) is a version of the Advanced Research WRF core (Skamarock et al., 2019) modified to perform well in the polar regions (Xue et al., 2022). Cloud fraction is parameterised using the diagnostic scheme of Xu and Randall (1996). Convection is parameterised in the coarsest 9 km domain using the Kain–Fritsch scheme for deep and shallow convection (Kain, 2004) and explicitly resolved in the 3 and 1 km domains. Precipitation and cloud microphysics are parameterised according to the scheme of Morrison et al. (2008), which is a double-moment scheme that represents four hydrometeors (ice, snow, rain, and graupel) and is suitable for cloud-resolving simulations. A further description of the physics configuration of Polar-WRF can be found in Hines et al. (2019), Bromwich et al. (2013), and Wilson et al. (2011).
2.1.3 HCLIM
HCLIM43–AROME (HCLIM in this study) uses a statistical large-scale cloud scheme based on Bechtold et al. (1995) to determine cloud fraction, and shallow convection is parameterised according to the eddy diffusivity mass-flux framework (EDMFm; de Rooy and Siebesma, 2008; Bengtsson et al., 2017). Deep convection is explicitly resolved. A single-moment cloud microphysics scheme, ICE3 (Pinty and Jabouille, 1998; Lascaux et al., 2006), is used to parameterise precipitation, with modifications applied for cold conditions (OCND2; Müller et al., 2017). The scheme represents six species of water (vapour, cloud droplets, pristine ice, rain, snow/aggregates, and frozen drops/graupel), and the OCND2 modifications separate fast liquid-phase processes from the slower cold-phase processes. A more detailed description of the HCLIM–AROME model system is presented in Belušić et al. (2020).
2.2 ERA5 reanalysis
ERA5 is the latest reanalysis product from the European Centre for Medium-Range Weather Forecasts (ECMWF), spanning the period 1940 to present. The production of ERA5 involves the assimilation of vast quantities of historical observations into the ECMWF's operational forecast model (IFS, at cycle 41r2), which outputs variables hourly on 137 vertical levels at ∼ 31 km horizontal resolution. The model's surface orography is interpolated from numerous elevation datasets, including SRTM30, as described in ECMWF (2016). Its surface scheme, HTESSEL, represents surface fluxes, snow, and SMB-relevant quantities like melt and runoff on surface tiles (Balsamo et al., 2009), while four cloud species (cloud liquid, ice, rain, and snow) and fractional cloud cover are described prognostically by the precipitation and large-scale cloud schemes (ECMWF, 2016). Radiation is computed by the McRad scheme (Morcrette et al., 2008).
2.3 In situ data description
Observational data are taken from two instrumented stations on the eastern side of the TG ice shelf: Cavity Camp (75.033° S, 105.617° W) and Channel Camp (75.050° S, 105.4334° W), situated approximately 4 km apart. Cavity Camp is located on a flat, relatively spatially homogeneous area of the ice shelf, whereas Channel Camp is located in the surface expression of a basal melt channel, which can be regions that preferentially develop surface crevasses (Alley et al., 2016, 2021). The Cavity and Channel stations are located approximately 20 km from the grounding line region of the TG ice stream where the terrain begins to slope steeply upwards. The stations are equipped with Automated Meteorology–Ice–Geophysics Observation System (AMIGOS) instruments, including sensors to measure near-surface meteorology like near-surface air temperature, relative humidity, pressure, and wind speed, as well as firn temperature, snow height, and GPS position at hourly resolution. A full description of the AMIGOS set-up is given in Scambos et al. (2013).
2.4 SNOWPACK model
We also use output from simulations using the SNOWPACK multi-layer firn model (Wever, 2022) that were performed by Maclennan et al. (2023). In these simulations, the model is used to convert the observed snow height data from the AMIGOS instruments on the TG ice shelf to mass accumulation (Lehning et al., 2002a, b). The SNOWPACK model calculates the surface energy balance based on the observed near-surface meteorological variables, including wind speed, temperature, relative humidity, and incoming short-wave and long-wave radiation. It uses the surface energy balance to diagnose surface height changes from terms like surface melt and sublimation and also calculates snow height decreases from compaction. Then, the calculated snow height is compared to the observed snow height to determine the accumulation terms. The model diagnoses snowfall when all three of the following conditions are met: observed snow height exceeds the simulated height, relative humidity exceeds 50 %, and the difference between air and snow surface temperatures is less than 3 °C (Lehning et al., 1999; Wever et al., 2015). Accumulated snow mass is calculated according to Schmucki et al. (2014) using the density of fresh snow while describing the effect of snow erosion and deposition on snow density using the Redeposit scheme (Wever et al., 2023). This approach provides time-varying new snow density, which, for this area, results in a calculated average surface snow density of approximately 450 kg m−3. Rainfall is assumed when the air temperature exceeds 1.2 °C, during periods where the forcing model predicts precipitation. In this study, we compare the local accumulation at the Cavity and Channel stations to modelled snowfall rates. However, it is important to note that the local accumulation can be substantially impacted by net snow erosion if the station is located in a region of drifting snow divergence or by deposition when the station is in a zone of drifting snow convergence. Other sources of uncertainty concern the density of new snow, which can be of the order of 20 %–30 % (Keenan et al., 2021) and directly impacts the estimated accumulated mass from snow height measurements. Our approach also assumes that decreases in snow height are correctly captured by the model. Sublimation generally leads to very small changes in snow depth over the period of the described events, and melt during the events was also estimated to be too small to lead to any substantial surface height decrease. The snow depth measurements show a strong increase in snow depth, suggesting that any possible wind erosion of the snow surface was overshadowed by the net increase in mass in the area.
3.1 Case description
Both the summer and winter cases examined in this work have a similar synoptic set-up, with cross-terrain flow established by an atmospheric pressure dipole between the northwestern Antarctic Peninsula (high pressure) and Amundsen Sea (low pressure), as shown in Fig. 2. This same synoptic set-up is shown to be responsible for establishing cross-terrain flow and foehn winds over PIG and the wider ASE region (Francis et al., 2023). Both feature extreme precipitation, with SNOWPACK-simulated accumulation totals of 108 and 80 mm w.e. in summer at the Cavity and Channel stations, respectively, and 61 and 113 mm w.e., respectively, during winter. In both cases, observations suggest that near-surface temperatures rose to the melting point of 0 °C, supporting previous studies (e.g. Maclennan et al., 2023; Lu et al., 2023) that extreme precipitation events can have consequences not only for accumulation, but also for melting (see Fig. S2). Both cases are also detected by the Wille et al. (2021) AR-detection algorithm (not shown).
The summertime case consists of a family of three ARs that made landfall over TG and the ASE coast in quick succession, driven by a high–low-pressure couplet (Fig. 2a). A pressure dipole, with low pressure over the Amundsen Sea (reaching a minimum mean sea level pressure, MSLP, value of 951 hPa in ERA5) and high pressure over the eastern tip of South America (maximum MSLP of up to 1035 hPa), drove convergence along a pressure ridge that extended lengthways along the eastern side of the Antarctic Peninsula. The high-pressure system strengthened over the course of the case, enhancing the pressure gradient and driving more intensified convergence. This channelled moist air towards and across the West Antarctic coast, especially over the region of TG–PIG, and prevented the low-pressure systems over the Amundsen Sea from migrating. The air mass picked up moisture as it travelled over the largely sea-ice-free Bellingshausen Sea west of the peninsula and was forced over the topography of the West Antarctic Ice Sheet.
The wintertime case consists of high pressure over the Drake Passage and Bellingshausen Sea (top left of Fig. 2b, with ERA5 MSLP reaching up to 1035 hPa) and low pressure over the Amundsen Sea (bottom left of Fig. 2b, with ERA5 MSLP falling as low as 955 hPa) (Fig. 2b). A chain of low-pressure systems pushed towards the ice sheet from subpolar latitudes all the way to approximately 85° S during the case, driving high temperatures and precipitation over the ASE region.
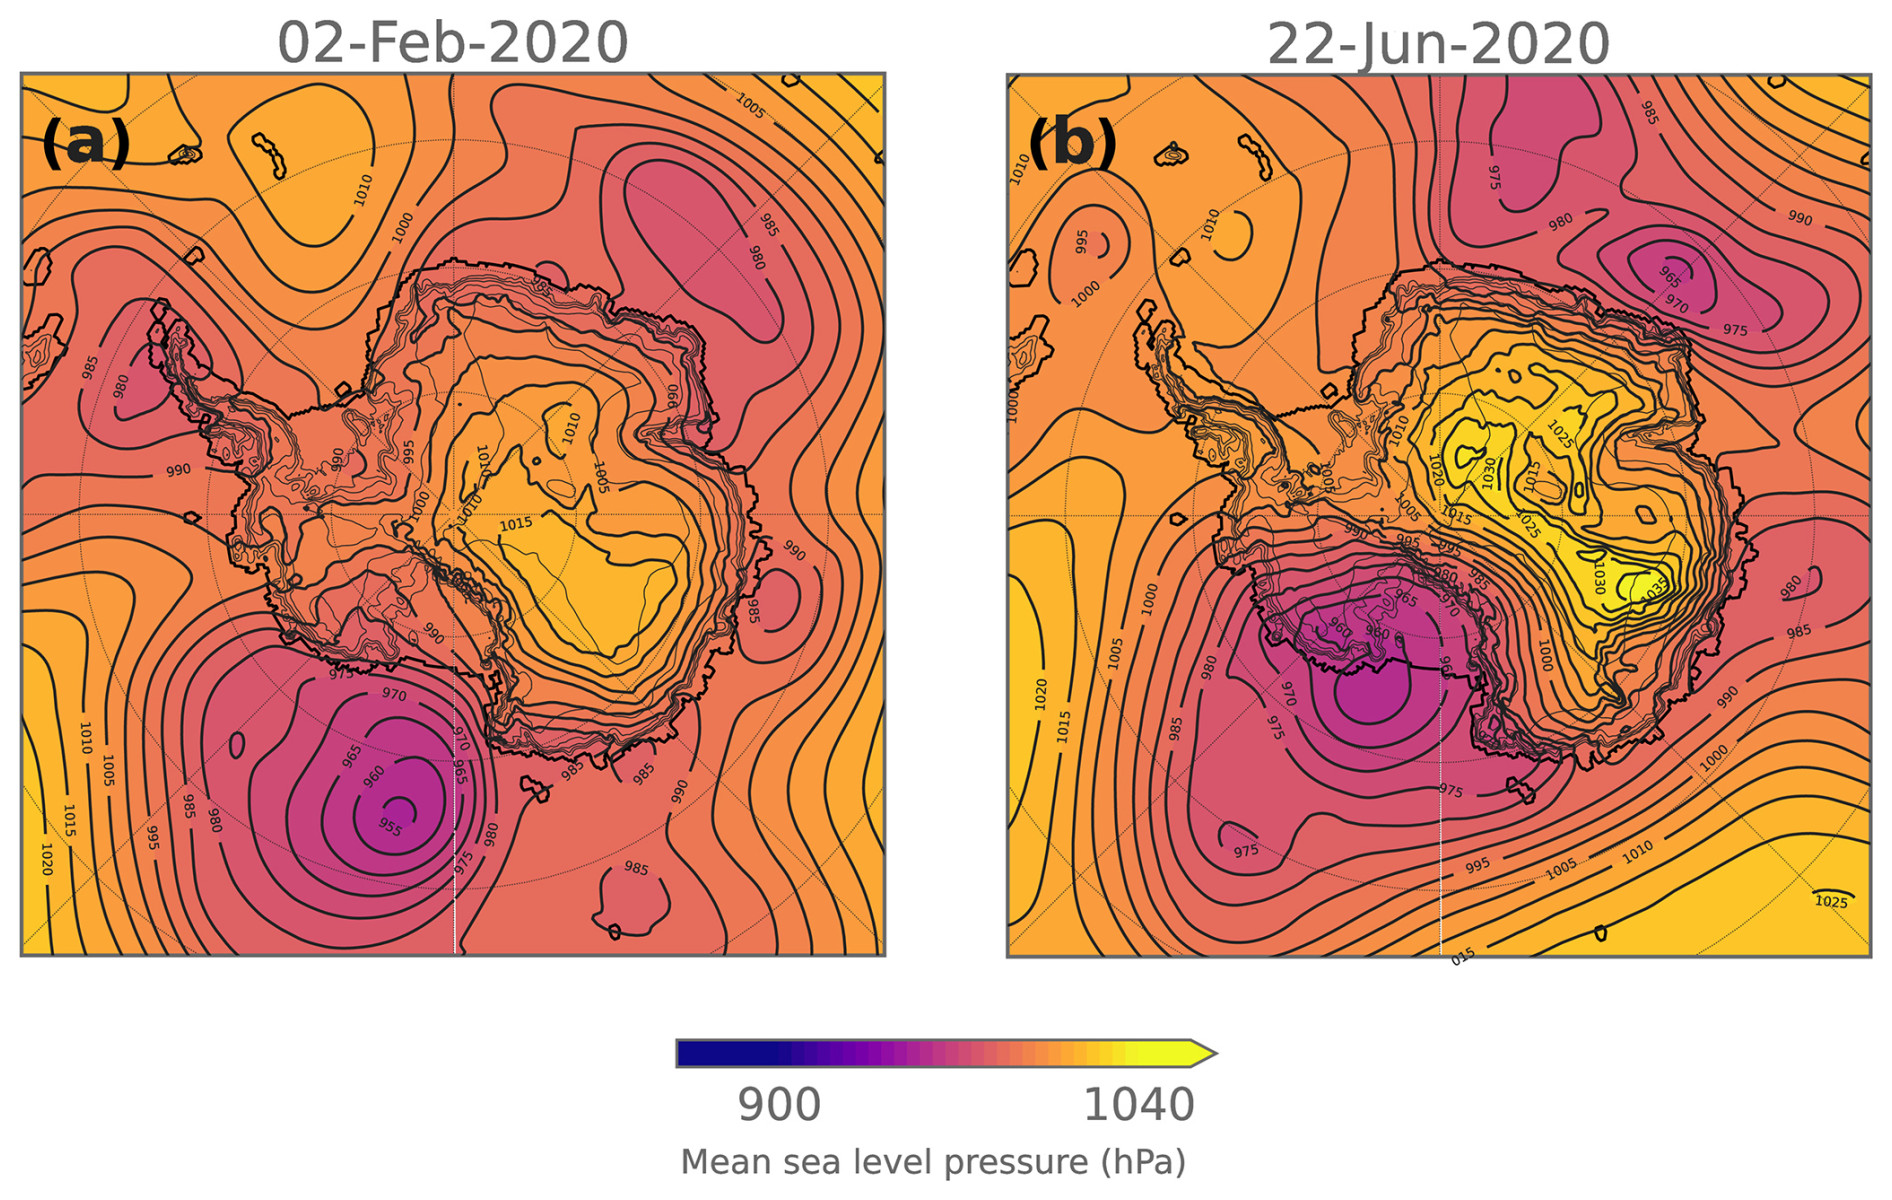
Figure 2Mean sea level pressure at the onset of the summer (a) and winter (b) cases, from the ERA5 reanalysis. Contours show mean sea level pressure (in hPa), averaged over the first 24 h of each case. Surface orography is also indicated by the grey contours.
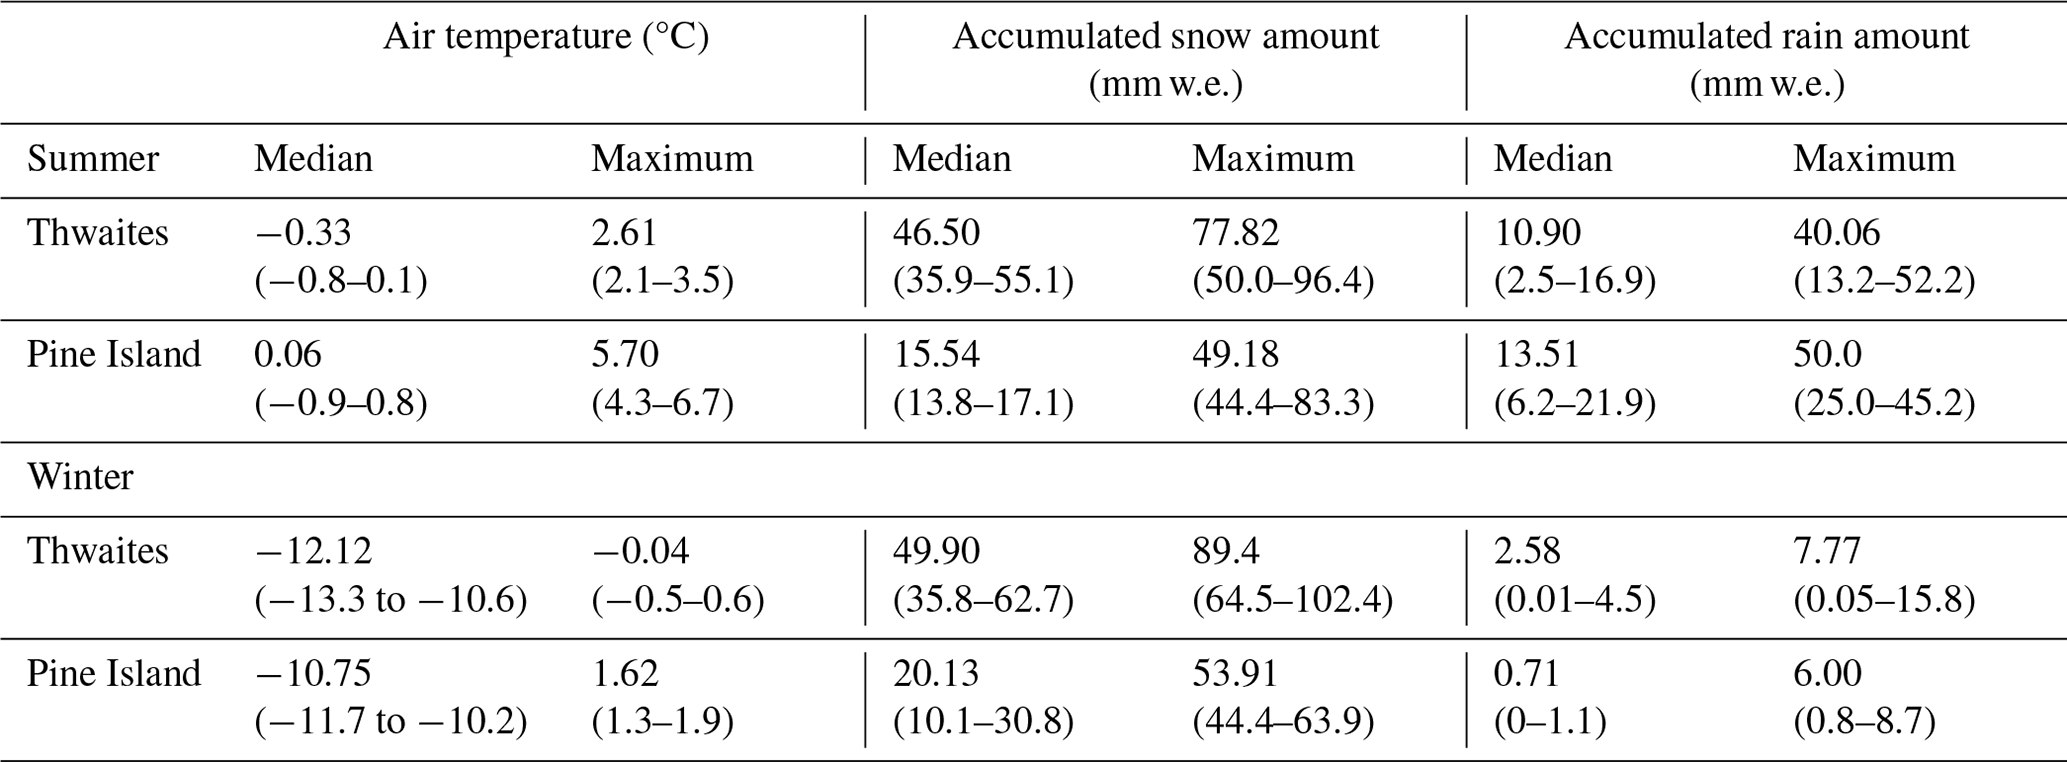
Table 1Summary statistics for key variables over the Thwaites and Pine Island ice shelves during the summer and winter case studies, as simulated by the three RCMs. Multi-model means of ice-shelf-averaged median and maximum values are shown, with the range of RCM values shown in brackets.
3.2 Precipitation
3.2.1 Time series of precipitation
The amount of snow and rain that falls over the PIG and TG ice shelves during the cases examined can tell us about the characteristics of extreme precipitation in the region. Here, we examine SNOWPACK-simulated total accumulation (shown as snow water equivalent, SWE), which comprises total precipitation minus losses via sublimation and runoff. We compare these with precipitation amounts from ERA5 and the three RCMs. Figure 3 presents SNOWPACK-simulated SWE at the two stations alongside modelled (RCM + ERA5) ice-shelf average snowfall water-equivalent amounts. An equivalent plot, which includes satellite-derived estimates of total precipitation, is shown in Fig. S3. As shown in Fig. 3a, summertime SNOWPACK-simulated SWE shows considerable differences between the two stations at Cavity and Channel, despite them being located just 4 km apart. In summer, higher overall SWE totals are simulated by SNOWPACK at Cavity than Channel, and SWE follows a different pattern at the two stations. As shown in Fig. 3a, in terms of precipitation totals at Cavity, the first AR (3 February) is indistinguishable from the second (5 February): both bring a considerable amount of precipitation, driving steady and rapid accumulation between 3–6 February, followed by a pause and then another accumulation event associated with the third AR (8–9 February). This contrasts with the pattern for Channel shown in Fig. 3a, which exhibits more modest overall accumulation totals and increases in three distinct steps associated with each AR, with the first bringing relatively little snowfall in comparison to the second and third ARs in the sequence.
Reasons for the notable differences between SNOWPACK-simulated differences at Cavity and Channel could be localised geographic factors, the spatial characteristics of the ARs, or spatial heterogeneity in accumulation across the TG ice shelf. Firstly, the Channel Camp station is located in the surface expression of a basal melt channel, which may experience higher rates of melting and therefore lower calculated accumulation (Maclennan et al., 2023). Meanwhile, the Cavity Camp station is situated on a flat region of the TG eastern ice shelf. Secondly, the ARs each made landfall on slightly different parts of the TG ice shelf, with the first falling on the western side of the TG, the second progressing from west to east across TG, and the third hitting the eastern flank of TG (Maclennan et al., 2023). Additionally, the influence of extremely localised and topographically dependent processes such as blowing or drifting snow could have played a role in redistributing snow and therefore impacting accumulation at the two stations.
In the summer case, in comparison to SNOWPACK-simulated accumulation, all RCMs underestimate snowfall and do not capture the exact timing of the snowfall related to the ARs (Fig. 3a), although this depends somewhat on the station considered. All three do better at Channel, with the MetUM and Polar-WRF simulating approximately the same amount of snowfall and HCLIM exhibiting lower amounts. The multi-model mean ice shelf median cumulative snowfall amount over TG ice shelf is 47 mm w.e. in the summer case (Table 2), which compares with a SWE of 108 mm w.e. and 80 mm w.e. simulated by SNOWPACK at Cavity and Channel, respectively, making the multi-model mean RCM estimate of median snowfall amount over TG ice shelf approximately 2 times smaller than the in situ observations suggest. Differences in simulated precipitation totals and the timing of precipitation events between the RCMs could be related to the way the models parameterise cloud microphysics or differences in their dynamics that determine how, when, and where the simulated ARs make landfall. Meanwhile, the median cumulative ERA5-derived estimate of total precipitation over TG ice shelf in the summer case is even lower than the mean RCM estimate, at 28 mm w.e. (3–4 times lower than the SNOWPACK-derived estimates), although it is still within the range of the RCM mini-ensemble (Fig. 3a). This discrepancy is likely to be related to the coarser resolution of ERA5 and its orography, which would affect the passage and trajectory of airflow in the simulations and hence the interactions between the AR and terrain. Convection is also parameterised in ERA5, which could produce different cloud dynamics and lower precipitation totals than the RCMs, which explicitly resolve convection at 1 km resolution.
In the winter case, a similar pattern is observed, with considerable differences between SNOWPACK-simulated snowfall between the Cavity and Channel stations and mismatches in terms of the timing of large snowfall deposits (Fig. 3e). However, this time, it is the Channel station that has higher accumulation totals than Cavity. The multi-model mean ice shelf median cumulative snowfall amount over TG ice shelf is 50 mm w.e. in winter, compared to 61 and 116 mm w.e. simulated by SNOWPACK at Cavity and Channel, respectively (Table 2). This means the RCMs compare slightly more favourably against observations in the winter case than in the summer case. Wintertime ERA5 values are again at the lower end of the range of RCM estimates over both ice shelves.
However, it must be noted that the snowfall/accumulation values shown in Fig. 3 are not exactly comparable because the snow height sensor measurements used to drive SNOWPACK assume all positive height differences are related to snowfall; processes that reduce accumulation, such as rain, melt, runoff, evaporation, wind-driven erosion, or sublimation cannot be directly measured. As such, all these processes impact the observed snow height, and SNOWPACK assumes that the effects of melt and sublimation are calculated correctly in its computation of the accumulation totals. As discussed in Sect. 2.4, the biggest sources of error in the SNOWPACK analysis probably come from the estimation of new snow density by the model and the uncertainty related to blowing snow convergence or divergence. Based on our analysis, we expect that other, negative, mass balance components were small during these events.
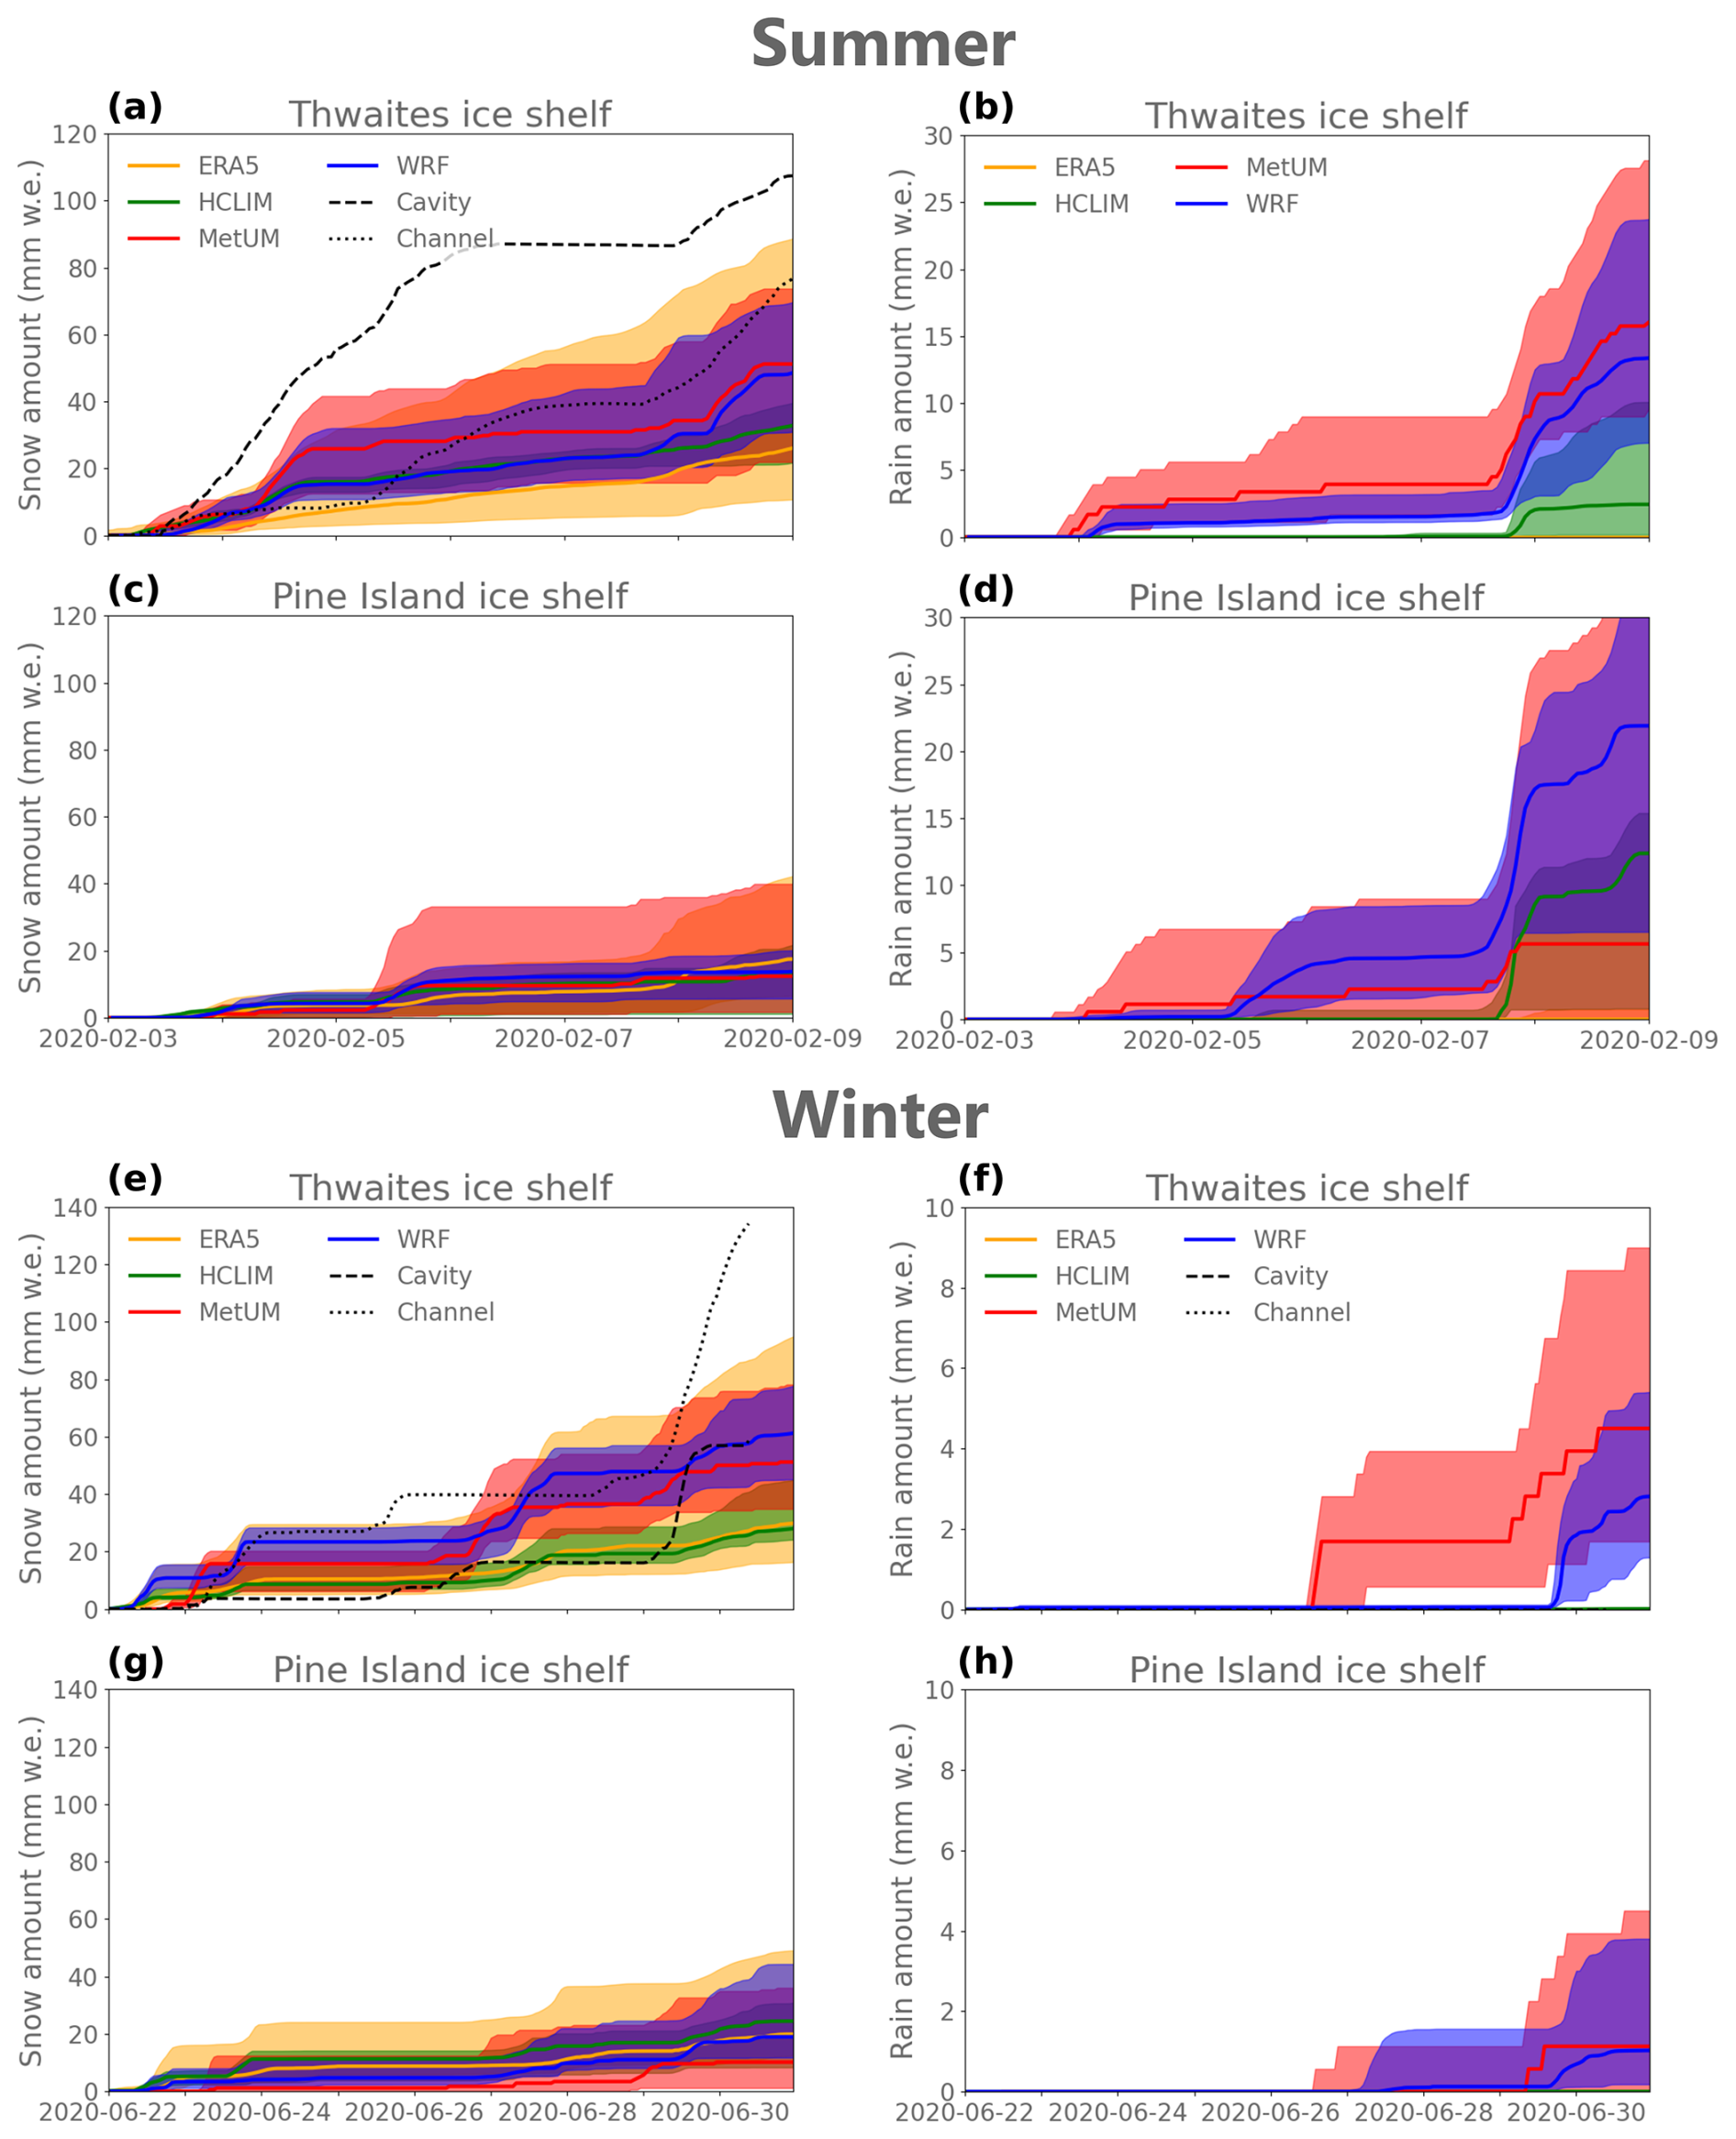
Figure 3Time series of median snow (a, c, e, g) and rain (b, d, f, h) amounts (shown as water equivalent, in mm w.e.) during the summer case study on the Thwaites (a–d) and Pine Island (e–h) ice shelves. Median results from the 1 km MetUM, Polar-WRF, and HCLIM domains are shown in red, blue, and green, respectively, and ERA5 results are given in yellow. For all models, the shaded regions show the 5th to 95th percentile range of all values simulated across each ice shelf. SNOWPACK-simulated snow amounts derived from observations at the Cavity and Channel stations are shown in panel (a) as the dashed and dotted black lines, respectively. Data are only shown until 09:00 UTC on 30 June 2020 in panel (e) due to instrument malfunction after this point. Note the different scales between summer and winter and between snow and rain.
We also compared the ERA5, RCM, and SNOWPACK-simulated totals with the GPM IMERG satellite product (see text S2 in the Supplement for further details). However, due to the product's limitations over snow- and ice-covered surfaces, as well as its reliance on reanalysis data, we chose not to include it here. Figure S3 compares the satellite estimates to the model outputs shown in Fig. 3. It shows that during both cases, the satellite-derived estimates of total precipitation are extremely close to ERA5 (reaching median values of 28 and 19 mm w.e. over the TG and PIG ice shelves in summer) and considerably lower than the RCM and SNOWPACK estimates. The similarity to ERA5 is expected because the precipitation product is partly generated using reanalysis data that have assimilated the same observations as ERA5, and ERA5 also assimilates satellite data. The lower precipitation estimates derived from satellite data, as compared to the multi-model mean of the RCM estimates, are likely related to the lower resolution of the satellite product (0.1°×0.1° or approximately 12 km) and may also reflect the difficulty of satellite sensors in measuring precipitation over cold snow and ice surfaces (Huffman et al., 2023). This underlines the challenges associated with evaluating precipitation extremes in Antarctica and reinforces the merit of high-resolution RCMs.
Neither ERA5 nor the satellite measurements shown in Fig. S3 appear capable of capturing the spatial variability over the TG ice shelf that is implied by the large differences between the Channel and Cavity observations shown in Fig. 3a and e. SNOWPACK-simulated accumulation at Channel in Fig. 3a and at both stations in Fig. 3e is mostly within the 5–95th percentile range of the RCMs and ERA5, but values at Cavity in summer and at Channel at the end of the winter case are well outside the modelled range, indicating that despite their high resolution, the RCMs still underestimate snowfall amounts compared to in situ observations. The RCM 5th–95th percentile range demonstrates that the RCMs can capture the magnitude of spatial heterogeneity implied by the differences between Cavity and Channel. However, the time series at grid points corresponding to each station's location (not shown) are extremely similar, suggesting that there are still unresolved spatial variations below the 1 km grid scale of the RCMs or processes that are incorrectly represented. This may be partly because there are important processes that are unresolved in the RCMs, such as blowing or drifting snow, or because of deficiencies in important parameterisations such as cloud microphysics. Furthermore, small-scale variations in orography can cause blowing or drifting snow to accumulate in some locations preferentially, while the scale of localised and rapidly evolving depressions or topographic features is below the grid scale of the models and may not be included in the datasets used to produce static boundary conditions such as surface altitude. The spatial variability of snow and rainfall over the domain is explored in greater detail in Sect. 3.3.3 below.
However, it must be noted that the difference between RCM and SNOWPACK snowfall totals, particularly in the summer case, is of approximately the same order of magnitude as the amount of rain simulated by the RCMs. This indicates that phase partitioning could be one of the main causes of the discrepancy between RCM-simulated and SNOWPACK-simulated snowfall. This may be because SNOWPACK uses a fairly simplistic temperature threshold to diagnose rain, based on when ERA5 2 m temperature reaches 1.2 °C. As shown in Table 2, the RCMs exhibit much warmer conditions over the TG ice shelf than ERA5, suggesting that rain would have been diagnosed much less frequently based on ERA5 temperatures than the RCM temperatures. Therefore it is possible that SNOWPACK underestimates rainfall: a conclusion also supported by the fact that all three RCMs simulate summertime rain and that two of the three simulate rain in winter. Sensitivity experiments (not shown) where the diagnostic threshold was varied between −2 and +2 °C showed that in the summer case, lower thresholds resulted in considerably higher SNOWPACK-derived rainfall totals. However, during winter, the threshold needed to be lowered to considerably below zero to prognose rainfall. Note that when SNOWPACK diagnoses rainfall, this is in addition to the accumulation derived from snow depth measurements, and calculated accumulation is unchanged.
3.2.2 Precipitation phase
We next examine the phase partitioning of precipitation in the RCMs over the TG and PIG ice shelves during both cases. During both cases, considerably more snow falls over the TG ice shelf than the PIG ice shelf in all models, with median snowfall totals on average approximately 2–3 times higher over the TG ice shelf than the PIG ice shelf (Table 1). Meanwhile, more rain falls over the PIG ice shelf in the summer case than the TG ice shelf, whereas in the winter case the TG ice shelf is rainier (Table 1).
Table 2 shows that two out of three RCMs simulate rain in winter, with 0.01–4.5 mm w.e. falling over the TG ice shelf and up to 1.1 mm w.e. over the PIG ice shelf in winter. Polar-WRF and the MetUM both simulate upwards of 1 mm w.e. in winter, while HCLIM simulates negligible amounts. Further, all three RCMs simulate rainfall in summer, with 2.5–16.9 mm w.e. rain falling over the TG ice shelf and 3.1–12.4 mm w.e. falling over the PIG ice shelf. The RCMs simulate the most rain at the end of the summer case, particularly on 7/8 February. However, the raw output from the snow height sensors on the TG ice shelf (Fig. 4) indicates a period of accumulation during this time frame (accumulating ∼ 11 mm), which appears incompatible with considerable rainfall. Typically, rain reduces the height of the snowpack by compacting snow (Marshall et al., 1999), which means that significant rainfall is unlikely on 8 February. However, there may be several explanations for this apparent inconsistency between the observations and model results.
The time series shown in Fig. 3a and b indicate that there were two periods of intense precipitation over the TG ice shelf at the end of the summer case: first from 18:00 on 7 February until 00:00 on 8 February and then from around 06:00 until 18:00 on 8 February. During that first 6 h window, the RCMs simulate minimal snowfall and relatively significant rainfall amounts: 6–7 mm w.e. in Polar-WRF and the MetUM, compared to 2–3 mm w.e. snowfall (Fig. 3a, b). However, during the second 12 h window, both snow and rain are simulated, with the MetUM and Polar-WRF simulating around 15 mm w.e. of snowfall, compared to 5–6 mm w.e. rainfall. Given that the near-surface atmospheric conditions during this case were near the melting point (see Figs. 6 and S2), with warm air overlying the snowpack and observed 2 m temperatures fluctuating between −2 and +2 °C, it is likely that precipitation was mixed phase. As a result, it is plausible that snow, rain, and wet solid precipitation such as wet snow or sleet all fell during this time. However, the RCMs used in this study have a relatively simplistic categorisation of hydrometeors: the MetUM represents five, while Polar-WRF represents four (HCLIM does not simulate considerable rain or snow during this period). Therefore, wet solid precipitation may have been classified as “rain” in the RCMs, increasing the amount of rainfall simulated. As long as the amount of snow falling was comparatively greater than the amount of liquid precipitation, the height of the snowpack could still have increased, but the amount of rain by mass would have been small. However, without ground truthing of rainfall from in situ measurements, it is difficult to say for certain whether rain indeed fell during these days.
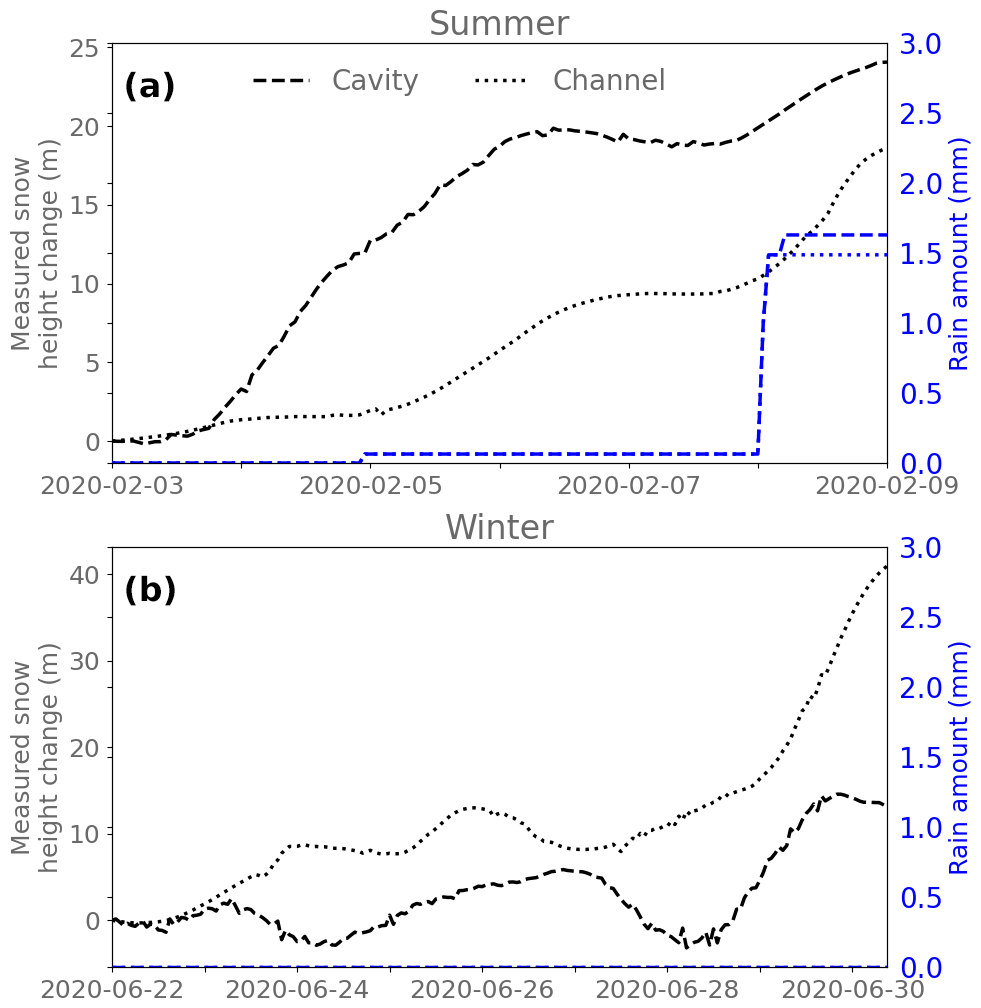
Figure 4Smoothed measured snow height and SNOWPACK-simulated cumulative rainfall amounts in the summer (a) and winter (b) cases. Plots show measured snow height change (in m) in black and rainfall amounts (in mm) in blue. Both the Cavity and Channel stations are shown.
Considering the entire summer case, it seems plausible that a small amount of rain did fall. Indeed, this is supported by the SNOWPACK output, which indicates that 1.5 and 1.6 mm fell at Channel and Cavity, respectively, during the summer case, including 0.9 mm w.e. at 00:00–06:00 UTC on 8 February at both stations (Fig. 4). The RCMs may have simulated rainfall at the wrong time or misclassified wet solid precipitation as rain. Further, as discussed above, the simple, ERA5-derived temperature threshold used to diagnose rain could cause SNOWPACK to underestimate rainfall compared to the RCMs. Additionally, any rain that fell at sub-zero temperatures (i.e. supercooled rain) would not be captured using this 1.2 °C threshold. The same explanations probably apply to simulated winter rainfall too, although winter rainfall totals are much smaller in comparison to snowfall and compared to the summer case. The caveat is that there are no in situ observations of rainfall to provide ground truthing of this result. However, the fact that rain is simulated by all three RCMs strengthens the notion that rain could indeed be falling during these extreme events and emphasises the need for in situ measurements of liquid as well as solid precipitation in West Antarctica.
3.2.3 Spatial variability of precipitation
The spatial variability of accumulated precipitation over the entire ASE region is also important. Figure 5 shows maps of accumulated snow and rain in ERA5 and the three RCMs during the two cases. In summer, the largest quantities of snow are simulated in the west of the domain (bottom right of all panels in Fig. 5a–d) and along the windward slopes of the steepest terrain, for example the sloping topography on either side of the Abbot ice shelf, and the upwind slopes above the PIG and TG ice shelves. The total magnitude of accumulated snowfall is comparable between all three RCMs and ERA5, with the MetUM and Polar-WRF standing out as the snowier models. A similar pattern is clear during winter (Fig. S4). Figure 5e–h show that rain also falls in the vicinity of steep terrain, but unlike snow, rain appears more confined to lower elevations.
Figures 3b, 3d, and 5 show that all the RCMs simulate rainfall over the TG ice shelf and PIG ice shelf during summer, while ERA5 simulates rainfall over the PIG ice shelf only. During the summer case, an RCM median of 11 mm w.e. (2.5–17 mm w.e.) rain falls over the TG ice shelf, while 13.5 mm w.e. (6–22 mm w.e.) falls over the PIG ice shelf (Table 1). Polar-WRF has relatively higher median rainfall totals over the PIG ice shelf than the MetUM and HCLIM (Fig. 3d), but if we consider the spatial distribution of accumulated rainfall shown in Fig. 5, the MetUM and Polar-WRF are extremely similar in terms of cumulative rainfall amounts. However, rain is simulated in different locations between the two models, with Polar-WRF simulating higher quantities of rainfall over the steepest terrain of Thurston Island on the northwestern boundary of the Abbot Ice Shelf and more extensive rainfall over the PIG ice shelf. Meanwhile, the MetUM simulates pockets of higher rainfall near the windward side of steep terrain, including at the edge of the PIG and TG ice shelves where the terrain begins to slope upwards more steeply. HCLIM also simulates pockets of rainfall clustered near steep topography, particularly on Thurston Island and over the PIG ice shelf, but comparatively lower accumulated totals than in the other two RCMs. ERA5 accumulated rainfall totals are highest along the steep periphery of Thurston Island and the southwestern edge of the PIG ice shelf but overall much lower than all three RCMs.
The same pattern is observed in winter, with the MetUM and Polar-WRF simulating larger quantities of rainfall than ERA5 or HCLIM, but in contrast to the summer case, the MetUM stands out as the rainier model, simulating a band of rain of up to 30 mm w.e. along the spine of the steep topography of Thurston Island (Fig. S4). More rain is simulated by all three RCMs during the summer case, because temperatures are higher and more precipitation falls in general. However, two out of three simulate modest quantities of rain during the winter case, which may indicate that even in winter liquid precipitation can still occur during the most extreme AR conditions. The differences between the RCMs in terms of the spatial distribution of rainfall and its intensity may be related to many factors, including the exact trajectory of the simulated ARs, temperature, moisture availability, model orographic interactions, and cloud microphysics.
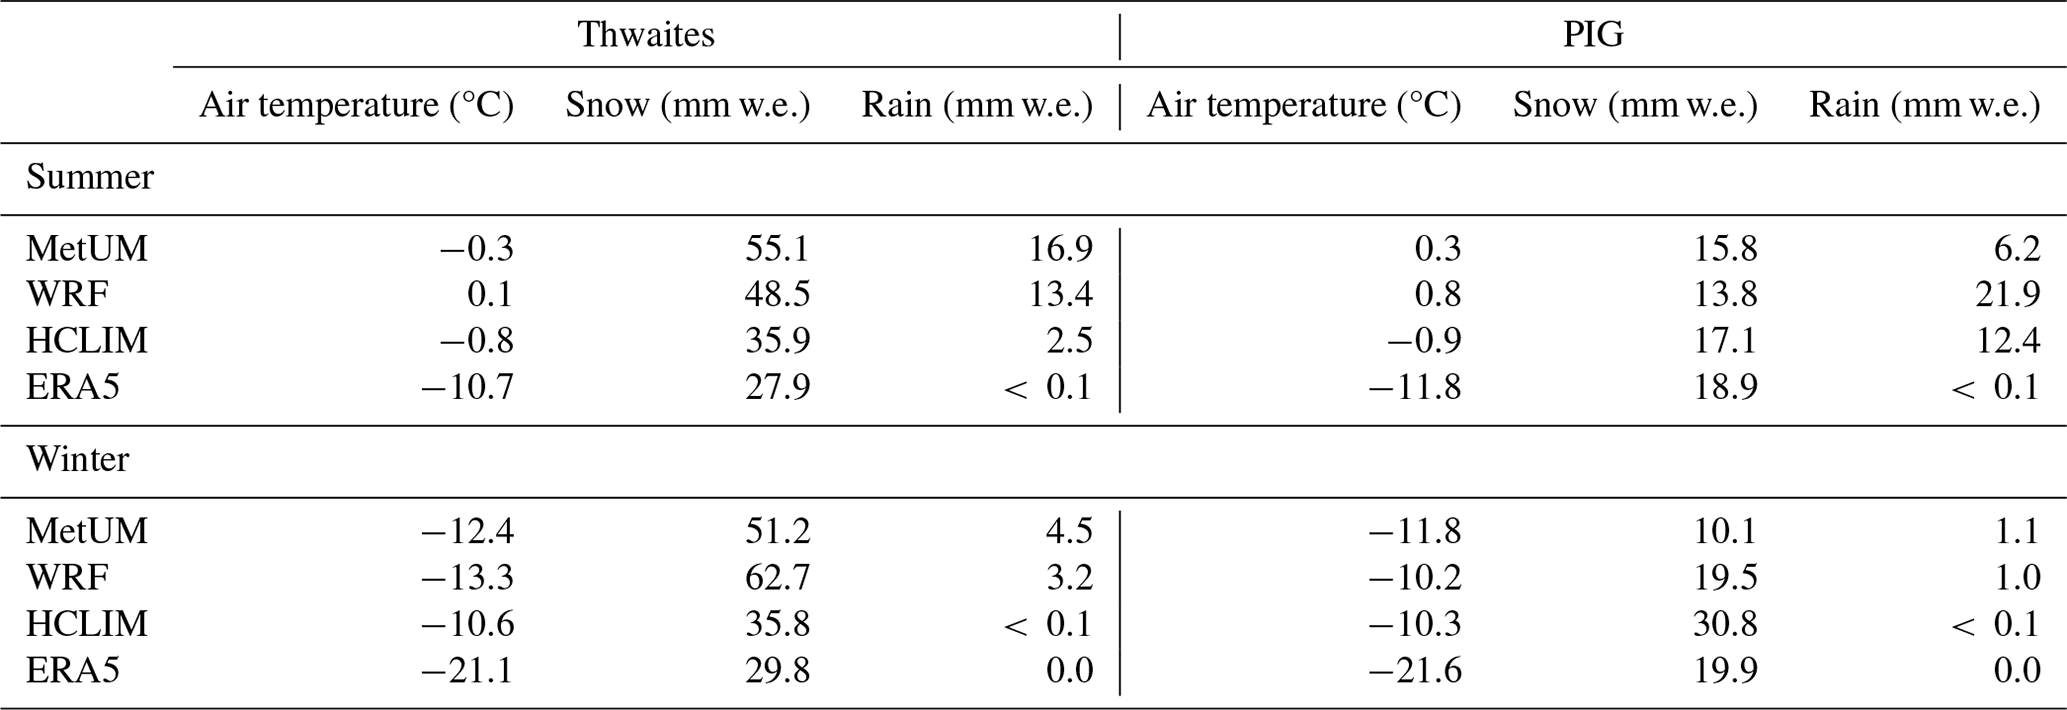
Table 2Median air temperature in degrees Celsius and median accumulated total snow and rainfall amounts in millimetres of water equivalent (mm w.e.) for each model and ERA5 over the Thwaites and Pine Island Glacier ice shelves in the summer and winter cases.
The following sections will explore the origins and physical processes leading to the production of liquid precipitation during the extreme events simulated.
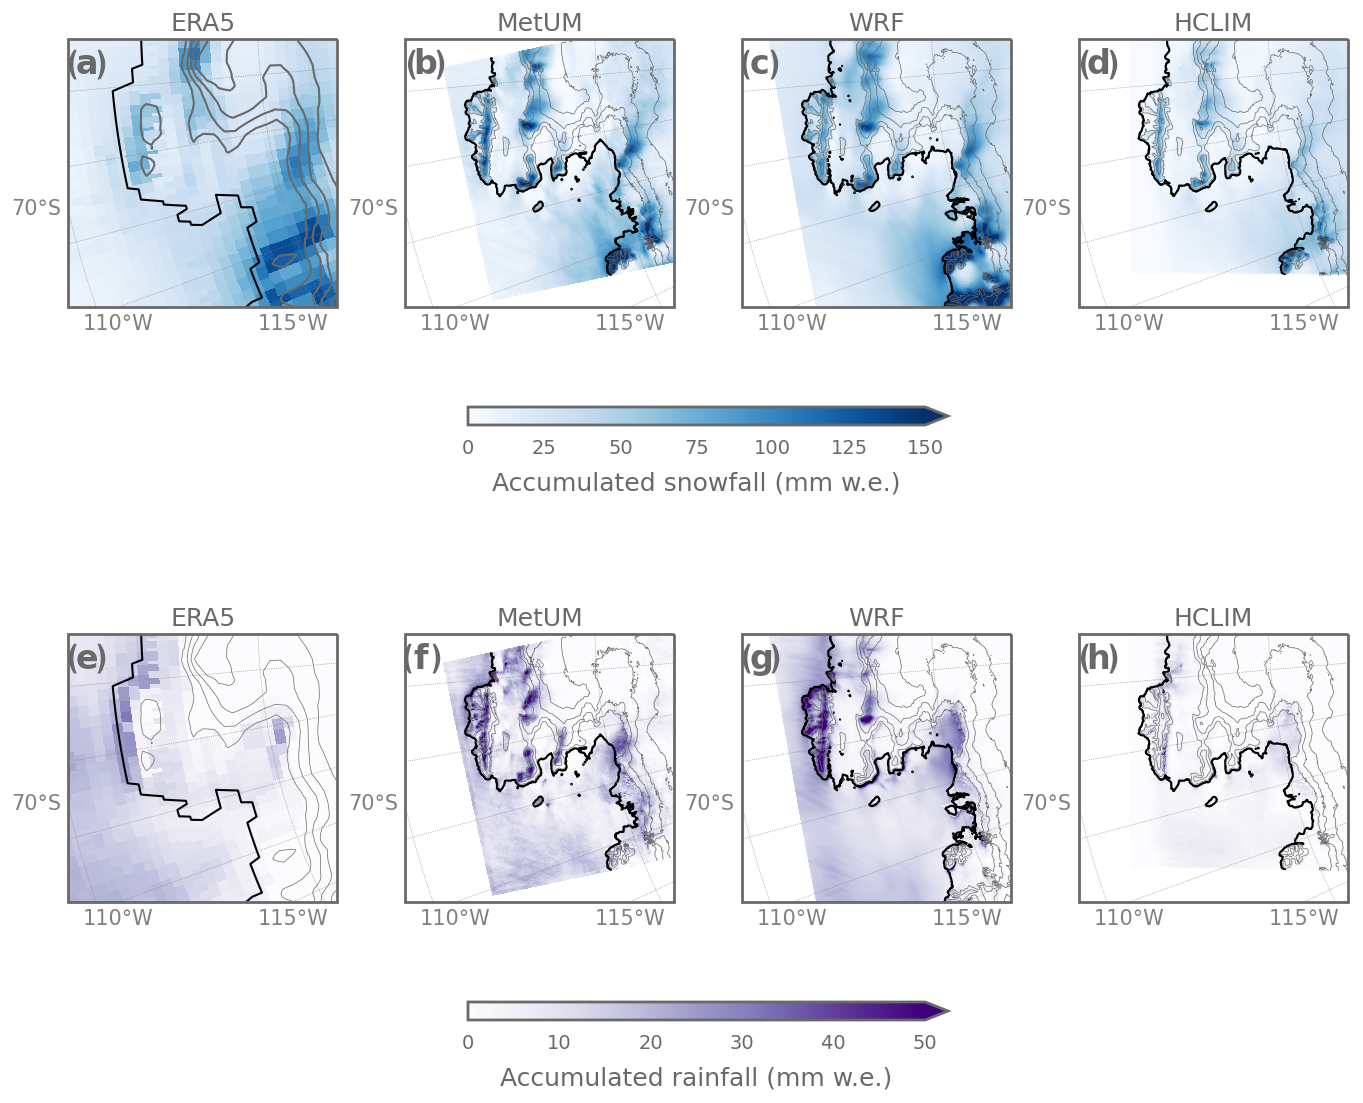
Figure 5Accumulated total snow (a–d) and rain (e–h) during the summer case (3–9 February 2020), as simulated by ERA5, the MetUM, Polar-WRF, and HCLIM at 1 km resolution. An equivalent figure for winter is shown in Fig. S4.
3.3 Origins of liquid precipitation in ARs
We have established that liquid precipitation is likely falling during the cases examined over the TG and PIG ice shelves. Next, we explore the origins of this rainfall. To avoid repetition, the following analysis will use data from the 1 km MetUM simulation only, which exhibits some of the highest rainfall totals.
Figure 6 shows the relationship between maximum air temperatures and accumulated rainfall totals during the winter and summer cases in the MetUM. Maximum temperatures reach well above freezing at the lowest elevations in summer, especially over the PIG ice shelf, where maximum temperatures of ∼ 5 °C are simulated across much of the ice shelf nearest to the surface (Fig. 6a). However, maximum temperatures above zero are also simulated during winter over the Abbot, Cosgrove, and PIG ice shelves (Fig. 6d). These above-freezing temperatures are simulated over regions in the immediate lee of steep terrain, suggesting that a foehn effect could be altering the meteorology associated with the ARs, as also shown by Francis et al. (2023) over PIG, by Gehring et al. (2022) over Davis, by Wille et al. (2022) over the Antarctic Peninsula, and Lu et al. (2023) over the South Orkney Islands. A foehn effect could be expected to produce a warm pool near the surface in the lee of steep terrain when air flow is across this topography.
Panels b and c of Fig. 6 show that there is indeed a warm pool of air at the surface over the TG and PIG ice shelves and that the region of above-freezing summer maximum mean air temperatures along the transects through TG and PIG reaches up to above 1 km in altitude and up to nearly 2 km altitude over PIG. These higher temperatures aloft may be partly associated with a foehn effect and/or by the air mass being orographically lifted, resulting in cooling, condensation, and latent heating of the surrounding atmosphere. In winter, regions of above-zero maximum air temperatures are much more spatially confined and are concentrated in small pockets over the PIG ice shelf at altitudes below 750 m (Fig. 6e), while temperatures remain below freezing along the TG transect (Fig. 6f).
Although near-surface temperatures over the PIG and TG ice shelves reach maximum values near or above freezing during both cases (Table 1, Fig. 6), median temperatures are colder, remaining below freezing during the winter case and staying very close to zero in the summer case (Table 1). Further, most of the liquid precipitation falls at times and altitudes when ambient temperatures are not above freezing, suggesting that temperatures above 0 °C are not always required to produce rainfall.
Indeed, the highest rainfall totals over both the TG and PIG ice shelves are simulated at times and altitudes where temperatures are within a few degrees of 0 °C. During the summer case, a near-surface warm pool develops each time the three ARs push air over the steep terrain, particularly over the Abbot, Cosgrove, and PIG ice shelves. When near-surface temperatures are highest (> 2 °C) and the surface warm pool is more vertically extended, rainfall totals are lower, suggesting that the highest temperatures can reduce the amount of liquid precipitation via evaporation and/or sublimation. However, during times when maximum air temperatures reduce to more moderate values of around −2 to +2 °C, rainfall totals become considerable over both the TG and PIG ice shelves. For example, rainfall totals over the TG ice shelf are highest during easterly flow, which advects warm air from regions with the strongest foehn warming, allowing it to mix and cool by the time it reaches TG. Similarly, the highest rainfall totals over PIG are simulated when the warm pool begins to fade. Over both ice shelves, the highest rainfall totals are simulated along the flanks of steep terrain and often at altitudes 500–1500 m above the surface. During the winter case temperatures are cooler, so rainfall only occurs in periods of the strongest foehn warming. However, temperatures during these periods are also within the same range of −2 to +2 °C.
The dashed lines in Fig. 6 indicate the maximum height of the 0 °C air temperature threshold, which can be considered a maximum “melt line” height. Below this threshold, snow and ice might be expected to melt and fall as rain if the melt layer that solid particles fall through is thick enough. However, in the summer case, the highest accumulated rainfall totals are not always concentrated below the melt line, especially in the case of the TG transect. Moreover, in the winter case the region of above-zero temperatures is extremely spatially constrained along the PIG transect and completely absent along the TG transect. Despite this, accumulated rainfall totals in excess of 10 mm w.e. are simulated along the transects through both ice shelves, resulting in median summer surface rainfall totals of 16.9 and 6.2 mm w.e. over the TG and PIG ice shelves, respectively, and 4.5 and 1.1 mm w.e., respectively, in winter (Table 2). This means that supercooled liquid precipitation is falling, even fairly high up in the atmosphere.
Over both ice shelves and in summer especially, accumulated rainfall totals are higher just above the surface than at the surface, indicating that some rain is being lost to evaporation, riming, or freezing as it descends through the warm near-surface layer or that rain droplets are being lofted upwards by updraughts as air is forced to flow up the steep terrain of the ice stream, as described in Silber et al. (2019). Meanwhile in winter, most of the rainfall that reaches the surface is spatially constrained to further along the TG transect, upstream of the grounding zone where the AR intersects with steep topography. Over the PIG ice shelf winter rainfall is more minimal, despite temperatures being warmer than over the TG ice shelf, as indicated in Tables 1 and 2.
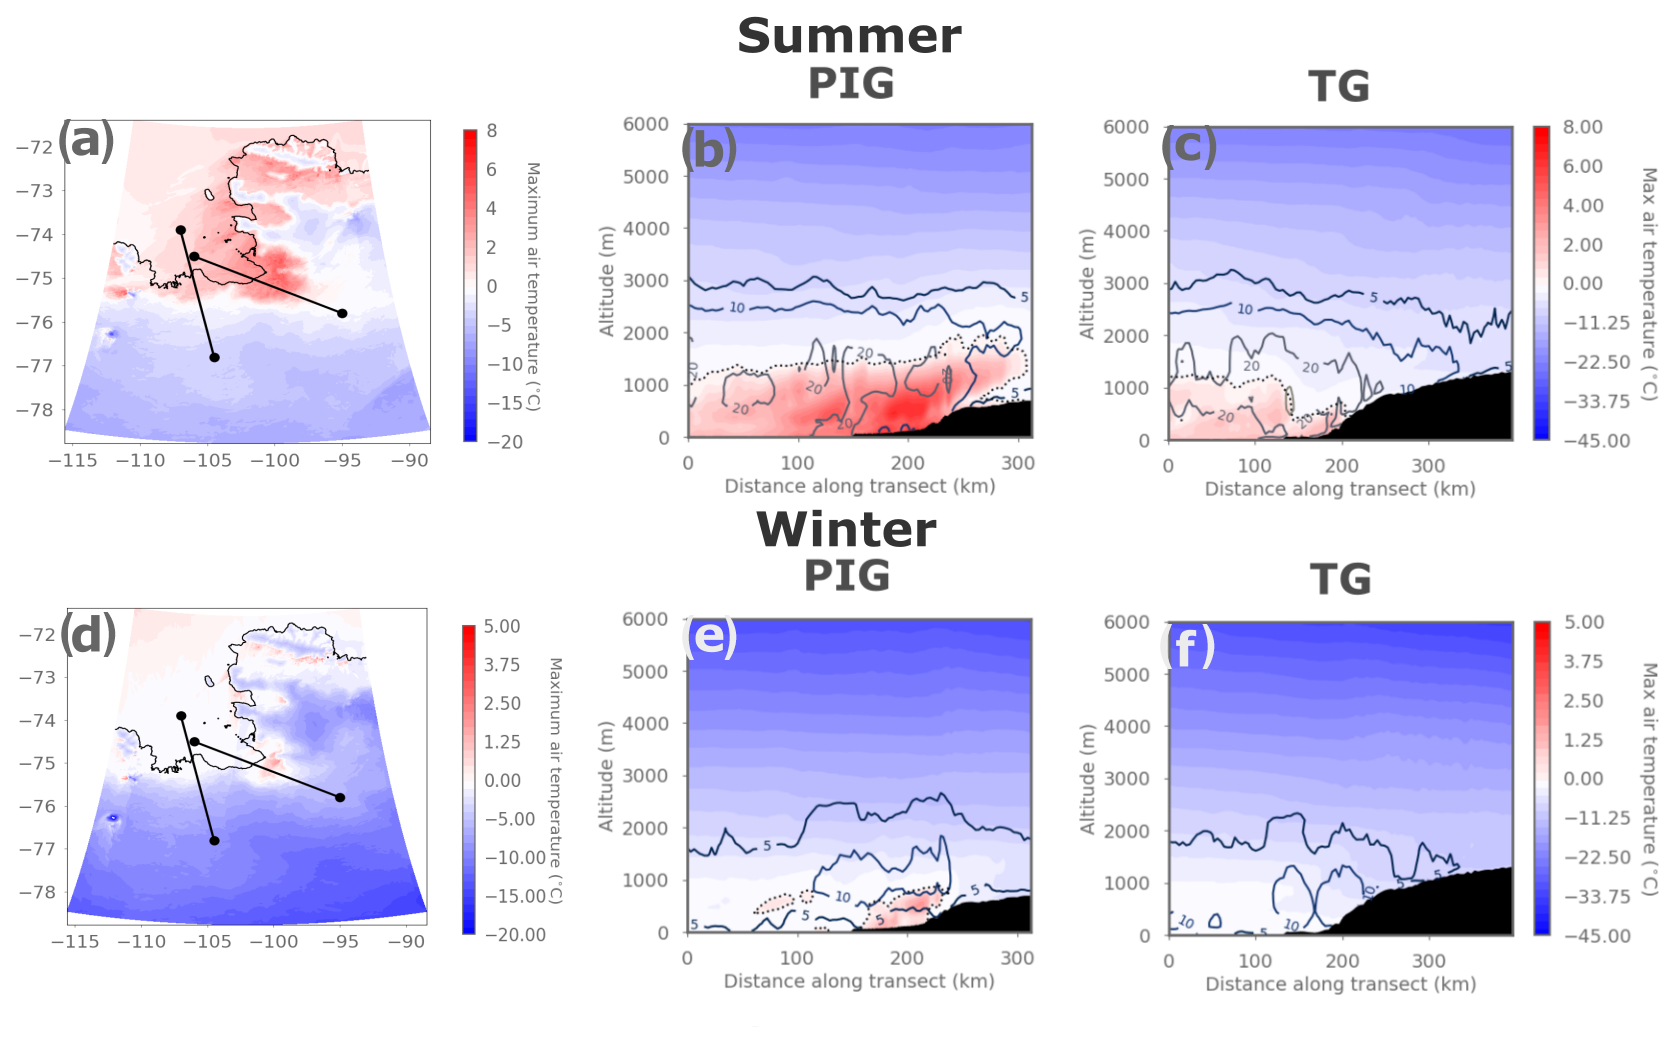
Figure 6Characteristics of maximum air temperature and accumulated rainfall during the summer case (3–9 February 2020, a–c) and the winter case (23–30 June 2020, d–f). Panels (a) and (d) show maximum 1.5 m air temperature during each case, with the locations of the PIG and Thwaites transects indicated on the map. Panels (b) and (e) show transects of maximum temperature (colours) and accumulated total rainfall (in mm w.e., contours) across the Thwaites transect, and panels (c) and (f) show the same across the PIG transect. In all transect panels, the dashed line indicates the maximum height of the 0 °C air temperature threshold. In all panels, red colours indicate maximum air temperatures above 0 °C, while blue colours indicate temperatures colder than this threshold.
As shown in Fig. 6, patterns of accumulated rainfall are relatively consistent between locations and seasons. In both seasons, rain is present at altitudes of up to ∼ 2500 m, although in summer, the height of the 5 mm w.e. accumulated rainfall contour is marginally higher, reaching up to around 3000 m a.s.l. (Fig. 6b, c). This is despite the patterns of maximum air temperature being quite different between the transects. In both seasons, there are also pockets of high accumulated snowfall totals above the surface over the ice shelves (Fig. S5), indicating that in some locations snow is sublimating and/or melting into rain as it descends through the warm layer described above. This same effect (snow transitioning to rain as it falls through a warm layer) has been observed during combined AR–foehn conditions at Davis station in East Antarctica by Gehring et al. (2022).
Liquid precipitation falls from liquid-bearing mixed-phase clouds at temperatures as cold as −11 and −8 °C in winter and summer, respectively (not shown), suggesting that the formation mechanisms are supercooled warm-rain processes. Cloud droplets reach a large enough size to descend through the atmosphere, collecting other droplets on their way and producing supercooled rain through warm-rain processes like collision–coalescence and accretion. Supercooled drizzle usually forms when there are insufficient ice nuclei to allow the atmospherically available water vapour to nucleate and grow into solid precipitation via ice processes. This is also consistent with a pristine region such as the West Antarctic and the northeasterly wind direction, which has advected air from across Ellsworth Land, where it is unlikely to have picked up ice-nucleating particles. These results also suggest that rainfall is being generated via the seeder–feeder mechanism, which increases orographic rainfall rates and can often result in the formation of supercooled drizzle in mixed-phase clouds (Fernández-González et al., 2015; Ramelli et al., 2021). The process involves ice or liquid descending from upper (seeder) levels and enhancing the rate of accretion in lower (feeder) levels, thereby increasing surface rainfall amounts (Lean and Clark, 2003). It frequently occurs in regions with significant updraughts, such as when air is forced up and over steep terrain (Ramelli et al., 2021). Finlon et al. (2020) show that the 0 °C isotherm separates the seeder and feeder levels in such cases, for example in an AR over the Southern Ocean, which is consistent with the results shown here.
In both cases, the region of accumulated rainfall reaches several hundred kilometres inland. Maximum air temperatures are higher over the PIG transect (as shown in Fig. 6a), but in summer, higher accumulated rainfall totals are simulated over the TG ice shelf and upstream (Fig. 6b). This suggests that air temperatures are not the only control on rainfall totals and that factors like large-scale cloud and synoptic patterns, as well as orography, likely influence the phase and quantity of precipitation that falls. Bromwich et al. (2024) and Bozkurt et al. (2024) also highlight the complexity of processes involved in initiating the phase transition from snow to rain in ARs.
This is also supported by Fig. 7, which shows the ratio of rain to snow over the TG and PIG transects in summer and hints at different formation mechanisms of precipitation. Hatched regions in Fig. 7a show that there are several regions where the amount of summertime rainfall exceeds the amount of snowfall: most of these regions are offshore, with some also immediately above the steepest slopes in the lee of airflow over the terrain, for example over the PIG and Abbot ice shelves. Along the TG and PIG transects shown in Fig. 7b and c, summer precipitation is largely mixed phase, and accumulated totals are dominated by snowfall. However, rain / snow ratios of above 0.5 (indicating that at least 33 % of precipitation is falling as rain) highlight regions where rainfall totals are relatively high, and liquid precipitation processes may be comparatively more important. Figure 7b shows that along the TG transect, the highest rain / snow ratio is found above the zero-degree line at higher elevations around 150 km inland above the glacier slope. However at the surface, the highest rain / snow ratios are simulated at the foot of the steep terrain, as indicated by Fig. 7d.
Along the PIG transect, much more snow falls relative to rain (Fig. 7c), except at the lowest elevations and directly above the steepest orographic gradient (Fig. 7e), where the effect of foehn-driven warming is highest (Fig. 6a, b). Over the PIG transect, the highest rain / snow ratios are found in the warmest regions, indicating that some of the rain has formed by the melting of solid precipitation as it descends through the warm near-surface layer (Fig. 6c). Some of the precipitation likely also sublimates and evaporates as it descends through this warm layer, which is illustrated by the fact that the highest rainfall fluxes are simulated in pockets above the surface in both winter and summer.
The importance of supercooled rain formation processes is especially evident in the winter case, where maximum air temperatures above 0 °C are simulated only in extremely confined locations over the PIG ice shelf (Fig. 6e). Supercooled liquid precipitation of up to more than 10 mm w.e. occurs over both ice shelves, especially at higher altitudes. This compares with maximum cumulative totals of ∼ 20 mm w.e. in summer, i.e. double the magnitude of winter.
Liquid precipitation has been shown to occur at very low temperatures in Antarctica. For example, Silber et al. (2019) demonstrated that drizzle can occur at temperatures down to −25 °C near McMurdo. They showed that in the presence of sufficient condensate, liquid precipitation can fall from stratiform clouds like those that were present during the summer case. In the cases studied here, the source of condensate was from the three ARs that made landfall, as well as the orographic lifting and condensation of moisture in the air as it was forced over the steep topography. In the pristine Antarctic atmosphere there are also fewer aerosols that can act as ice-nucleating particles, thus preventing the rapid glaciation of the cloud.
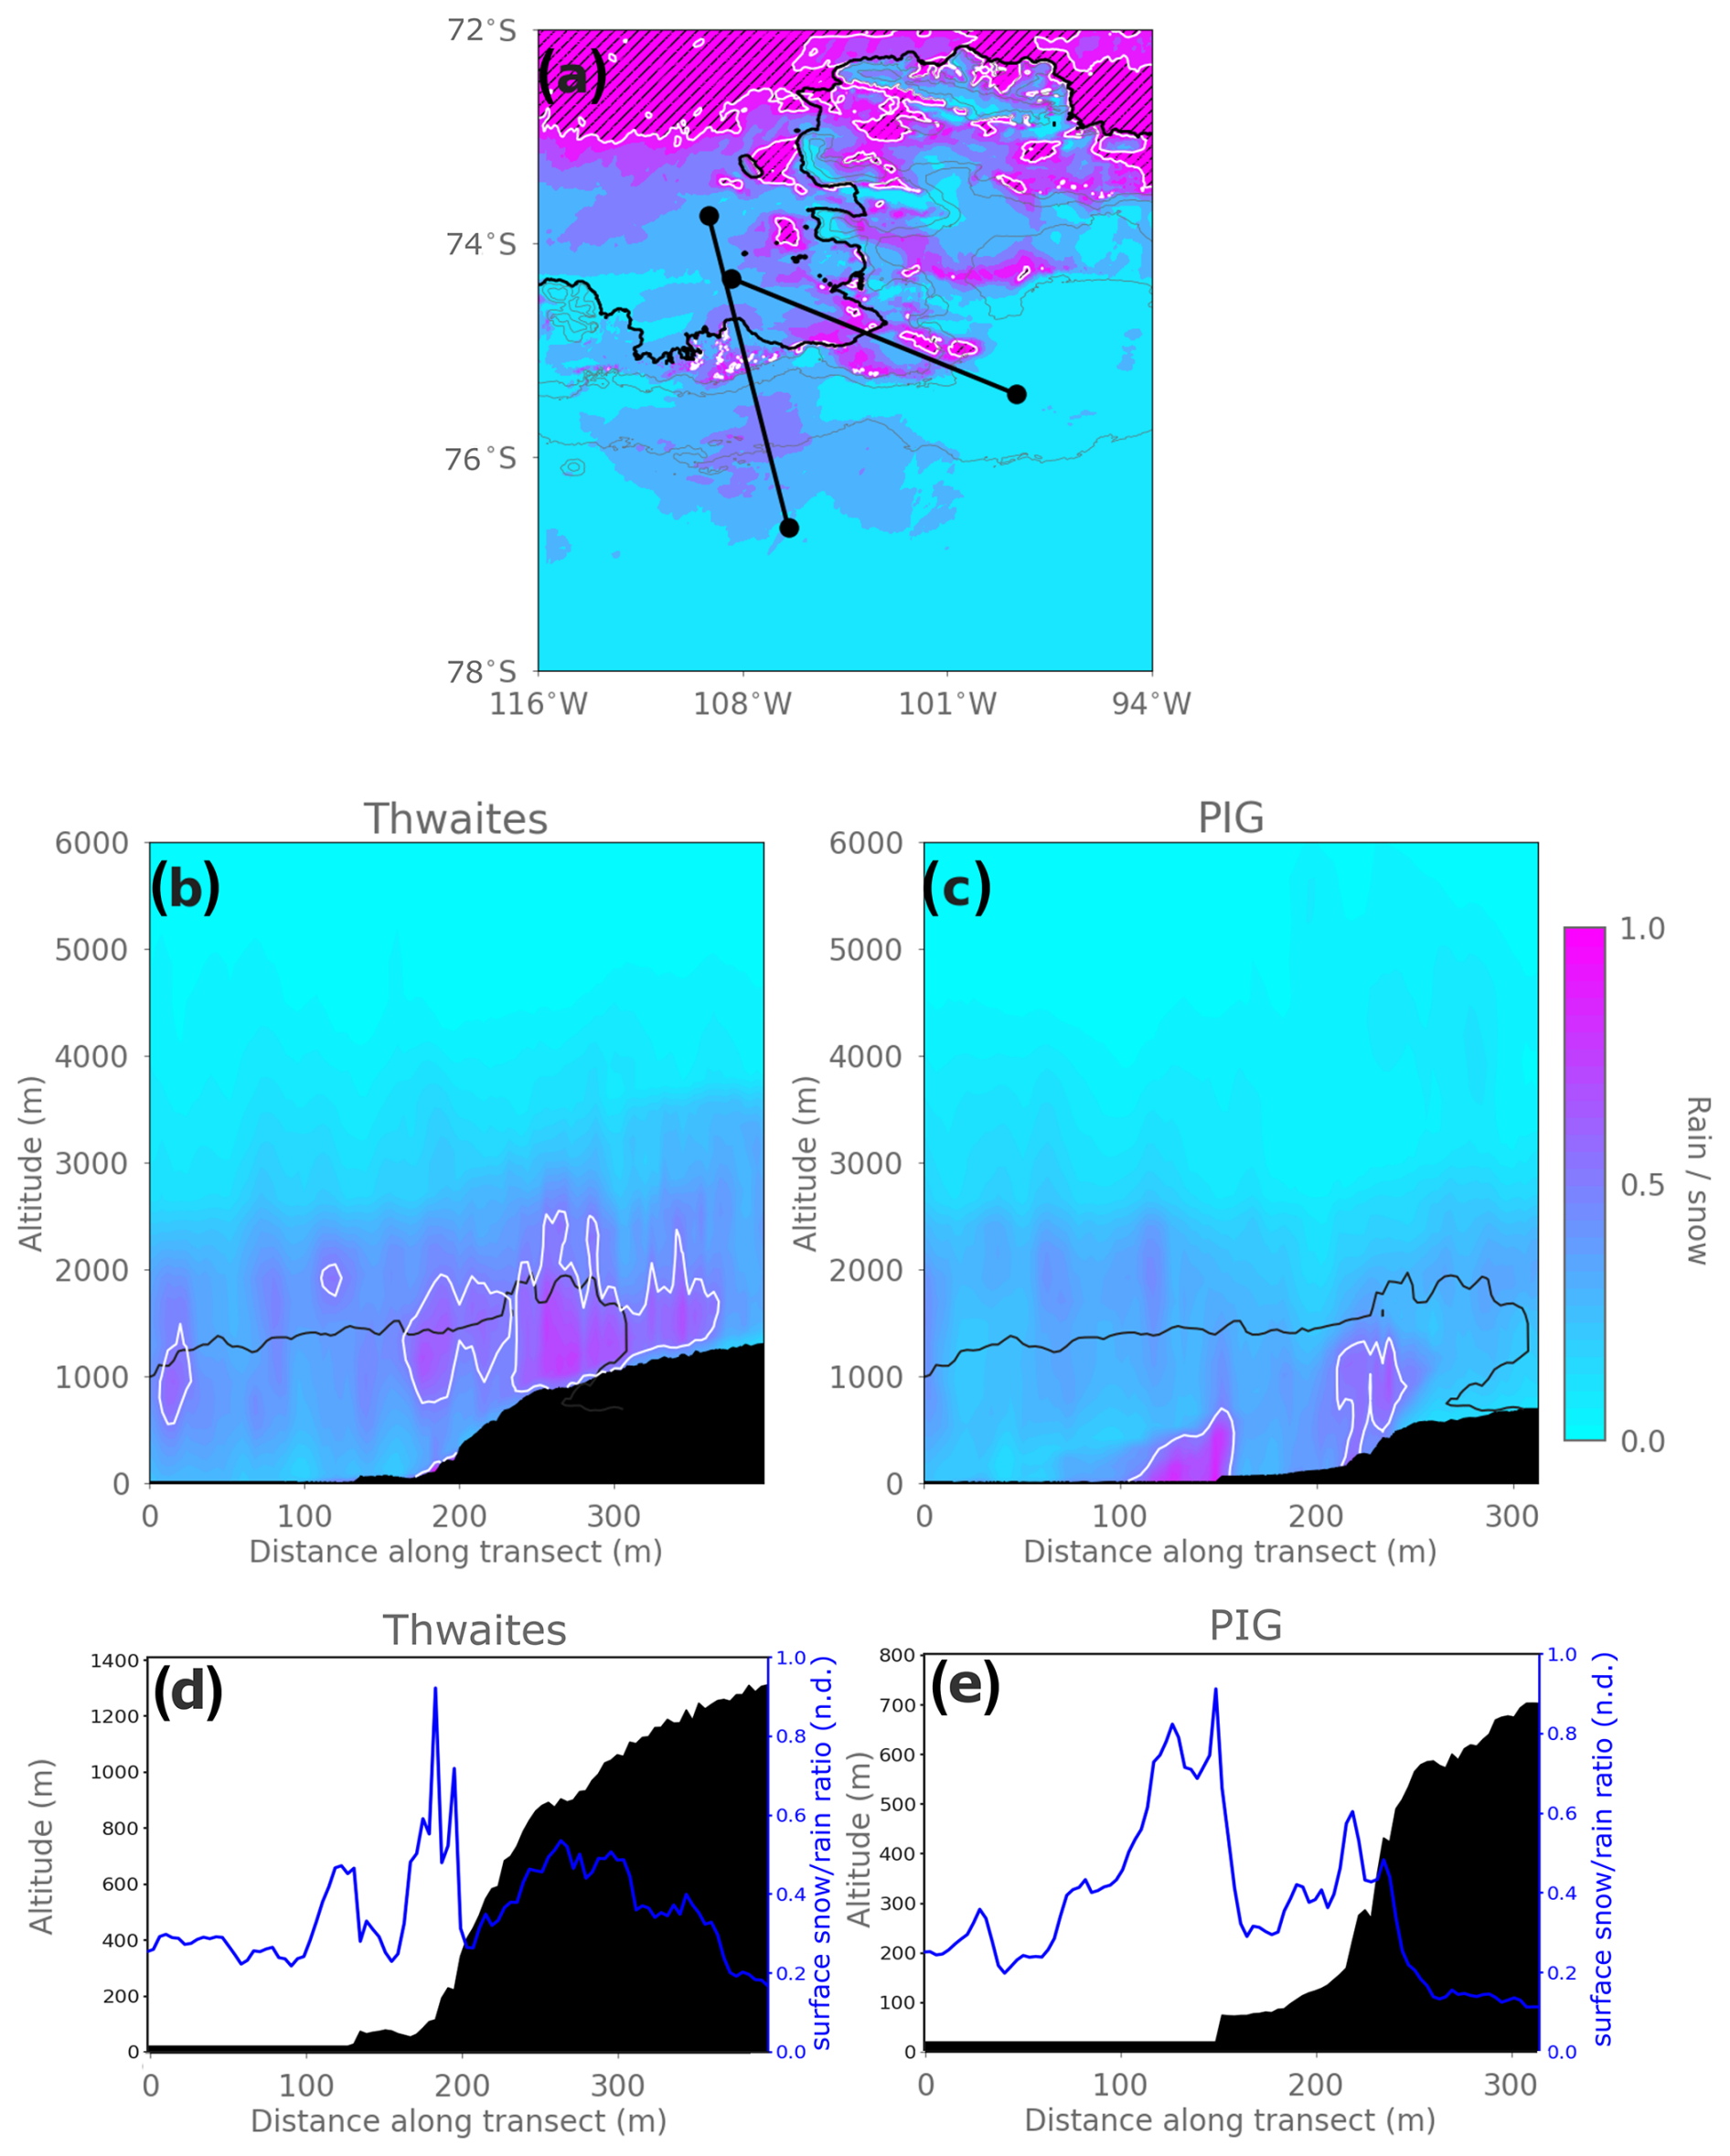
Figure 7Ratio of accumulated rain to snow averaged over the duration of the summer case (3–9 February 2020), expressed as rain / snow. Panel (a) shows the mean ratio of accumulated rain / snow at the first model level, while panels (b) and (c) show transects of accumulated rain / snow along the transects through Thwaites Glacier and Pine Island Glacier indicated in panel (a). Regions on the map in panel (a) where the ratio is above 1:1 (indicating that total rainfall is equivalent to or higher than total snowfall) are hatched. The dashed contour in panels (b) and (c) shows the maximum height of the 0 °C air temperature threshold as in Fig. 7, while the white contour outlines the region where the ratio of rain to snow is 1:2 or higher. Note the difference in colour scales used between panel (a) and panels (b) and (c). Panels (d) and (e) show the rain / snow ratio at the surface along the Thwaites Glacier (d) and Pine Island Glacier (e) transects, with the height of elevation indicated in black.
While rainfall does not occur frequently over the ASE in the current climate and is exclusively associated with extreme events like the ARs described here, these conditions may occur more often in future. Antarctic total precipitation amounts will increase with warming (by 5.5 % °C−1 on average), and the number of extreme precipitation events and ARs over the ASE will probably continue to rise with global temperatures (Nicola et al., 2023). There is also some evidence that climate change may cause ARs to shift poleward, along with the storm track (Ma et al., 2020; Chemke, 2022). Although ARs are unlikely themselves to destabilise ice shelves like the TG ice shelf, they affect accumulation and so could change the timing of future mass loss from West Antarctic glaciers (Maclennan et al., 2023). For example, Donat-Magnin et al. (2021) use RCMs to show that ablation will increase over ASE ice shelves such as the PIG and TG ice shelves, primarily driven by increased melt and runoff rates, but that the ratio of melting to snowfall is still low compared to other Antarctic ice shelves like the Ross or Filchner–Ronne. This is corroborated by Gilbert and Kittel (2021), who show that even under a high-emissions scenario, the risk of surface-driven West Antarctic ice shelf collapse is low until the end of the century because the amount of runoff is greatly outweighed by increased snowfall.
However, climate change will also increase the proportion of precipitation falling as rain, as has been shown for the Arctic (McCrystall et al., 2021). For instance, Donat-Magnin et al. (2021) show that rain occurs on 0.5 and 1 d yr−1 over the TG and PIG, respectively, in the current climate but that this may increase to 4.2 and 5.8 yr−1 by 2100. These changes to total precipitation and the phase of precipitation are extremely important for determining ice sheet and ice shelf SMB. For example, rain-on-snow events can cause the surface to darken, reducing surface albedo and enhancing melt via the melt–albedo feedback (Box et al., 2022; Stroeve et al., 2022). As the climate warms, the future of the Antarctic precipitation phase will remain an extremely pertinent subject of research.
3.4 Impact of resolution on precipitation
As noted in Sect. 1, model resolution can strongly determine the amount of precipitation simulated, especially in regions with steep topography and where precipitation is dominated by orographic processes, such as those we have shown to be occurring there.
As shown in Fig. 3 and Table 2, the RCMs simulate higher accumulated snow and rainfall totals than ERA5, which is likely related to resolution. At ∼ 31 km, the resolution of ERA5 is considerably coarser than the resolution of the 1 km innermost RCM nests. One of the variables for which this is most apparent is air temperature. As shown in Table 2, all three RCMs indicate much warmer median air temperatures over the TG and PIG ice shelves than ERA5, suggesting the lower resolution of ERA5 is not sufficient to capture the topographic modification of the AR. The absolute maximum temperatures are also lower, with median air temperatures over the PIG and TG ice shelves approximately 10 °C lower in ERA5 than the RCMs in both cases (Table 2). The agreement between the RCMs, all of which are forced by ERA5, suggests that the representation of complex topography is the cause of this difference, rather than internal model differences. This indicates that high resolution is necessary to capture the complex interactions between large-scale, mesoscale, and local meteorological processes, which are important during such conditions in this region, and that RCMs are required to reproduce the factors governing the drivers and impacts of AR events in regions with complex topography.
However, there is a trade-off when conducting simulations between resolution and computational efficiency, so it is worth investigating what kind of resolution is sufficient to capture the dynamics of extreme precipitation in this region. To explore this, Fig. 8 shows accumulated snow and rainfall totals during the summer case across the three different-resolution nests of the MetUM: 1, 3, and 12 km grid spacing.
There are few differences in accumulated snowfall amounts between the various resolution domains of the MetUM, indicating that simulated snowfall totals are comparatively insensitive to resolution. Given that snowfall dominates over rainfall, this suggests that the model can capture the dominant drivers of extreme precipitation, even at the relatively coarser resolution of 12 km. However, there is still some advantage to using higher resolution to capture finer-scale spatial variability when concentrating on smaller regions such as a single ice shelf. Furthermore, while total accumulated snowfall in the 12 km simulation is comparable to 1 km totals, the accumulated rainfall totals over TG ice shelf are 16 times lower in the 12 km simulation compared to the 1 km simulations during the summer case and 4 times lower during the winter case (Fig. 8). Across the entire domain, rain is simulated only over the steepest terrain, such as Thurston Island and the King Peninsula. Because considerably less rain falls than snow, this has a fairly minimal effect on total accumulated precipitation. Nonetheless, this suggests that subgrid-scale processes may not be parameterised adequately at coarser resolutions, for example the subgrid phase partitioning of cloud or the microphysical processes controlling the generation of supercooled drizzle. These are known problems with the MetUM (Gilbert et al., 2020; Bodas-Salcedo et al., 2016; Abel et al., 2017) and other RCMs (Hyder et al., 2018; Vergara-Temprado et al., 2018), especially in Antarctica and the Southern Ocean. This suggests that while coarser-resolution configurations of RCMs can capture the large-scale characteristics of precipitation extremes, finer grid scales are required to fully capture the complex interactions producing liquid precipitation in this region.
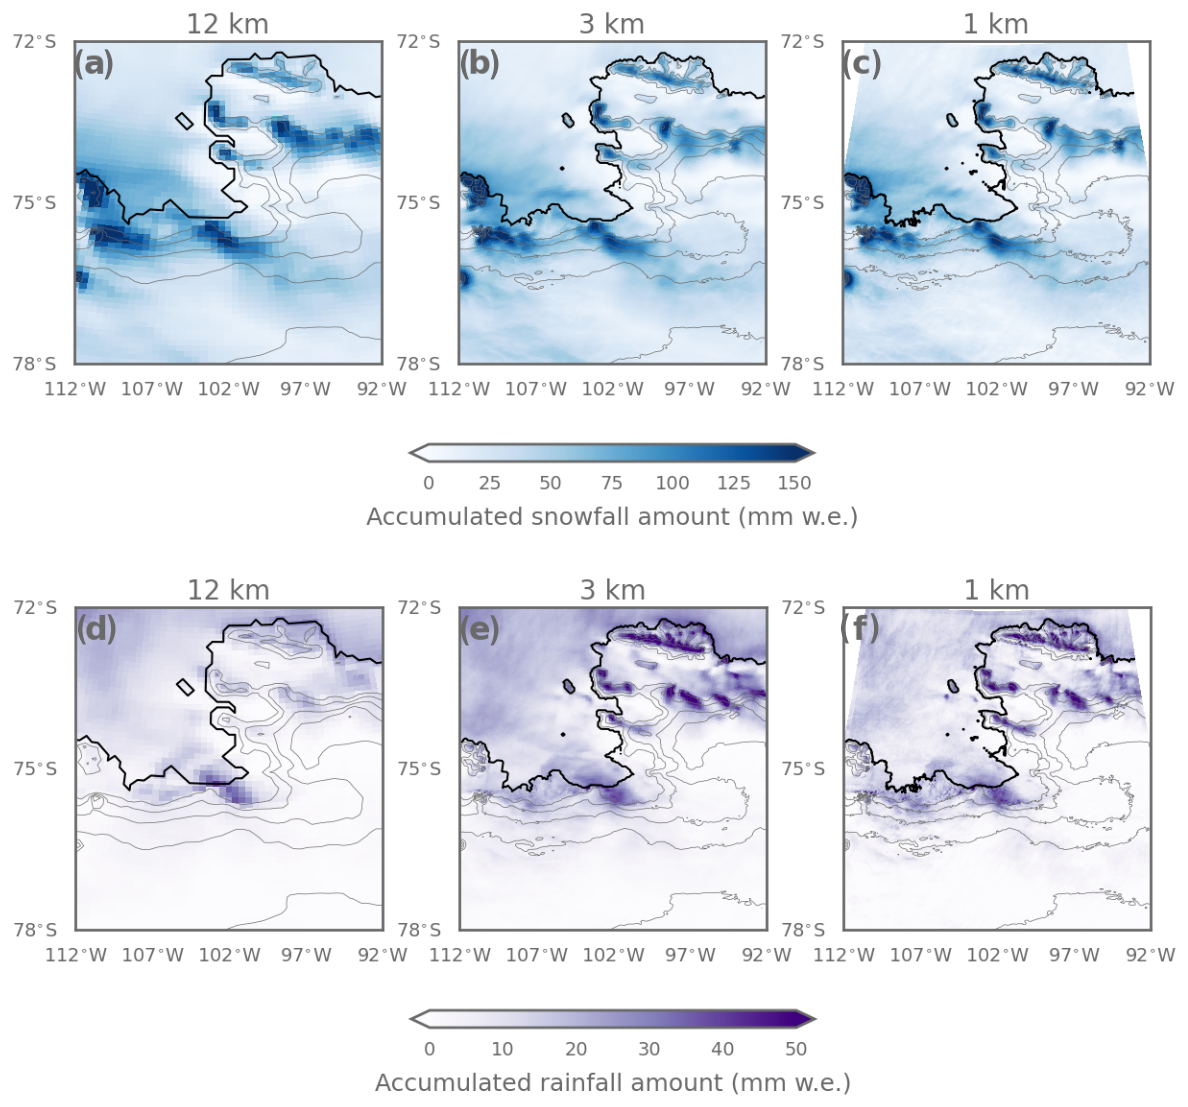
Figure 8Accumulated snowfall (a–c) and rainfall (d–f) during the summer case (3–9 February 2020), as simulated by the MetUM at 12 km, 3 km, and 1 km horizontal grid spacing.
We have used a mini-ensemble of state-of-the-art RCMs to explore the characteristics of extreme precipitation events in West Antarctica. Precipitation totals are especially high when the AR interacts with complex topography, generating snow and rain as a result of orographic uplift and allowing warm conditions favourable to liquid precipitation to persist via latent heating and foehn conditions near the surface.
We have shown that estimates of precipitation produced by the three RCMs are consistent with observations and with each other. For example, they simulate snowfall totals that are of comparable magnitude to in situ measurements of snow accumulation. However, all RCMs underestimate the amount of snowfall at both sites and do not capture the observed differences between stations, suggesting that there are highly localised, unresolved processes influencing snowfall.
The broad patterns of rain and snowfall are captured in ERA5 and all RCMs. Considering ice-shelf-averaged totals as well as the spatial distribution of precipitation, Polar-WRF and the MetUM simulate extremely similar cumulative summer snow and rainfall amounts, with HCLIM and ERA5 producing relatively less over the ice shelves of interest. However, during winter, the MetUM simulates more rain over the TG and PIG ice shelves and much higher rainfall totals over the steepest terrain in the domain. The simulated amount of rain falling in both cases is non-trivial, especially during the summer case when up to 30 mm w.e. falls over some parts of the domain. However, two of the RCMs indicate that small amounts of rain may be falling even during the winter case, when temperatures are almost entirely below freezing. The lack of in situ rainfall observations means this is impossible to verify, but the occurrence of rain in all three RCMs, ERA5 and SNOWPACK in summer, and in two out of three of the RCMs in winter supports the idea that rain is indeed falling over this region.
The RCMs compare more favourably against observations than the ERA5 reanalysis, which is unable to capture the dynamics of these events seen in the RCM output. ERA5 has been used extensively to assess the impacts of ARs in Antarctica, but we have shown that it has insufficient resolution to capture the interaction between ARs and steep topography. This is a limitation considering that the most extreme and high-impact events often result from the combination of ARs with topographically induced phenomena like foehn events and may suggest that impacts have been previously underestimated. We further evaluated the differences between MetUM simulations at varying resolution. The MetUM exhibits a convergence across resolution with respect to total precipitation, indicating that the coarser-resolution 12 km domain is sufficient to capture its large-scale dynamics and drivers. However, the 12 km MetUM configuration does not represent the phase of precipitation as accurately as higher resolutions, suggesting that kilometre-scale resolution is required for an accurate assessment of precipitation phase. Furthermore, for very detailed studies of the microphysical processes contributing to precipitation, finer resolutions – in this case 1 km – offer considerable benefits over configurations at ∼ 10 km scale. This work therefore emphasises the importance of RCMs for examining the dynamics, origins, and development of ARs in regions with complex topography. Additional sensitivity experiments, for example exploring the impact of specific microphysical parameters and processes like droplet or ice crystal number, are beyond the scope of this study but would offer insight into the processes governing precipitation phase partitioning during extreme events.
Further analysis of the MetUM simulations shows that rain is formed via different processes. In summer in the presence of a near-surface warm pool, some rain forms when solid precipitation descends through the warm near-surface layer and melts. However, in colder conditions, such as over the TG transect in summer and over both locations in winter, supercooled warm-rain processes act to form drizzle from liquid-bearing stratiform cloud in sub-zero temperatures. It is beyond the scope of this study to explore either the cloud microphysical processes that produced rain in these cases or the specific impacts of rainfall on the stability of the TG and PIG ice shelves, but both would be fruitful avenues of further research.
These findings emphasise the importance of using high-resolution modelling to fully capture the complex dynamics and processes occurring during these extreme events, as well as the need for further in situ precipitation measurements in this region, including of liquid precipitation. As climate change continues, rainfall is likely to become an increasingly regular occurrence, and further work must be done to understand its implications for melt–albedo feedback processes, latent heat release, and glacier and ice shelf surface mass balance in this critical region.
ERA5 data are available via the Copernicus Climate Data Store (https://doi.org/10.24381/cds.adbb2d47, Hersbach et al., 2023). RCM data are archived at https://doi.org/10.5281/zenodo.12697647 (Gilbert et al., 2024). AMIGOS AWS and snow sensor height data are available at https://doi.org/10.15784/601549 (Scambos, 2022), while the SNOWPACK simulations are available at https://doi.org/10.5281/zenodo.7320237 (Wever, 2022). The NASA GPM IMERG product used (in the Supplement) is the IMERGHHR Final Precipitation L3 Half Hourly 0.1 degree × 0.1 degree V07 product (Huffman et al., 2023) and is available at https://doi.org/10.5067/GPM/IMERG/3B-HH/07.
The supplement related to this article is available online at: https://doi.org/10.5194/tc-19-597-2025-supplement.
EG and AO were involved in conceptualisation; AO was involved in funding acquisition and project administration; EG, JAT, DP, and NW were responsible for data curation and methodology; EG led the formal analysis, validation, visualisation, and writing. All authors contributed to the review and editing of the manuscript.
The contact author has declared that none of the authors has any competing interests.
Publisher’s note: Copernicus Publications remains neutral with regard to jurisdictional claims made in the text, published maps, institutional affiliations, or any other geographical representation in this paper. While Copernicus Publications makes every effort to include appropriate place names, the final responsibility lies with the authors.
Ella Gilbert, José Abraham Torres, Denis Pishniak, Kristiina Verro, and Andrew Orr acknowledge support from the PolarRES project, which has received funding from the European Union's Horizon 2020 research and innovation programme H2020-LC-CLA-2018-2019-2020 under grant agreement no. 101003590. Ella Gilbert also acknowledges the use of the ARCHER2 UK National Supercomputing Service (https://www.archer2.ac.uk, last access: 4 February 2025). Michelle Maclennan acknowledges support from NASA FINESST grant no. 80NSSC21K1610. We are grateful to Jonathan Wille and one anonymous reviewer, who provided helpful comments that strengthened the manuscript.
This research has been supported by the EU Horizon 2020 (grant no. 101003590) and the National Aeronautics and Space Administration (grant no. 80NSSC21K1610).
This paper was edited by Thomas Mölg and reviewed by Jonathan Wille and one anonymous referee.
Abel, S. J., Boutle, I. A., Waite, K., Fox, S., Brown, P. R. A., Cotton, R., Lloyd, G., Choularton, T. W., and Bower, K. N.: The role of precipitation in controlling the transition from stratocumulus to cumulus clouds in a Northern Hemisphere cold-air outbreak, J. Atmos. Sci., 74, 2293–2314, https://doi.org/10.1175/JAS-D-16-0362.1, 2017.
Adusumilli, S., Fish, M. A., Fricker, H. A., and Medley, B.: Atmospheric river precipitation contributed to rapid increases in surface height of the west Antarctic ice sheet in 2019, Geophys. Res. Lett., 48, e2020GL091076, https://doi.org/10.1029/2020GL091076, 2021.
Alley, K., Scambos, T., Siegfried, M., and Fricker, H. A.: Impacts of warm water on Antarctic ice shelf stability through basal channel formation, Nat. Geosci., 9, 290–293, https://doi.org/10.1038/ngeo2675, 2016.
Alley, K. E., Wild, C. T., Luckman, A., Scambos, T. A., Truffer, M., Pettit, E. C., Muto, A., Wallin, B., Klinger, M., Sutterley, T., Child, S. F., Hulen, C., Lenaerts, J. T. M., Maclennan, M., Keenan, E., and Dunmire, D.: Two decades of dynamic change and progressive destabilization on the Thwaites Eastern Ice Shelf, The Cryosphere, 15, 5187–5203, https://doi.org/10.5194/tc-15-5187-2021, 2021.
Baiman, R., Winters, A. C., Pohl, B., Favier, V., Wille, J. D., and Clem, K. R.: Synoptic and planetary-scale dynamics modulate Antarctic atmospheric river precipitation intensity, Commun. Earth Environ., 5, 127, https://doi.org/10.1038/s43247-024-01307-9, 2024.
Balsamo, G., Beljaars, A., Scipal, K., Viterbo, P., v. d. Hurk, B., Hirschi, M., and Betts, A. K.: A Revised Hydrology for the ECMWF Model: Verification from Field Site to Terrestrial Water Storage and Impact in the Integrated Forecast System, J. Hydrometeorol., 10, 623–643, https://doi.org/10.1175/2008JHM1068.1, 2009.
Bechtold, P., Cuijpers, J. W. M., Mascart, P., and Trouilhet, P.: Modeling of Trade Wind Cumuli with a Low-Order Turbulence Model: Toward a Unified Description of Cu and Se Clouds in Meteorological Models, J. Atmos. Sci., 52, 455–463, https://doi.org/10.1175/1520-0469(1995)052<0455:MOTWCW>2.0.CO;2, 1995.
Bengtsson, L., Andrae, U., Aspelien, T., Batrak, Y., Calvo, J., de Rooy, W., Gleeson, E., Hansen-Sass, B., Homleid, M., Hortal, M., Ivarsson, K.-I., Lenderink, G., Niemelä, S., Nielsen, K. P., Onvlee, J., Rontu, L., Samuelsson, P., Muñoz, D. S., Subias, A., Tijm, S., Toll, V., Yang, X., and Køltzow, M. Ø.: The HARMONIE–AROME Model Configuration in the ALADIN–HIRLAM NWP System, Mon. Weather Rev., 145, 1919–1935, https://doi.org/10.1175/MWR-D-16-0417.1, 2017.
Belušić, D., de Vries, H., Dobler, A., Landgren, O., Lind, P., Lindstedt, D., Pedersen, R. A., Sánchez-Perrino, J. C., Toivonen, E., van Ulft, B., Wang, F., Andrae, U., Batrak, Y., Kjellström, E., Lenderink, G., Nikulin, G., Pietikäinen, J.-P., Rodríguez-Camino, E., Samuelsson, P., van Meijgaard, E., and Wu, M.: HCLIM38: a flexible regional climate model applicable for different climate zones from coarse to convection-permitting scales, Geosci. Model Dev., 13, 1311–1333, https://doi.org/10.5194/gmd-13-1311-2020, 2020.
Bodas-Salcedo, A., Hill, P. G., Furtado, K., Williams, K. D., Field, P. R., Manners, J. C., Hyder, P., and Kato, S.: Large contribution of supercooled liquid clouds to the solar radiation budget of the Southern Ocean, J. Climate, 29, 4213–4228, https://doi.org/10.1175/JCLI-D-15-0564.1, 2016.
Box, J. E., Wehrlé, A., van As, D., Fausto, R. S., Kjeldsen, K. K., Dachauer, A., Ahlstrøm, A. P., and Picard, G.: Greenland ice sheet rainfall, heat and albedo feedback impacts from the mid-August 2021 atmospheric river, Geophys. Res. Lett., 49, e2021GL097356, https://doi.org/10.1029/2021GL097356, 2022.
Box, J. E., Nielsen, K. P., Yang, X., Niwano, M., Wehrlé, A., van As, D., Fettweis, X., Køltzow, M. A., Palmason, B., Fausto, R. S., and Noël, B.: Greenland ice sheet rainfall climatology, extremes and atmospheric river rapids, Met. Apps., 30, e2134, https://doi.org/10.1002/met.2134, 2023.
Bozkurt, D., Rondanelli, R., Marín, J. C., and Garreaud, R.: Foehn event triggered by an atmospheric river underlies record-setting temperature along continental Antarctica, J. Geophys. Res.-Atmos., 123, 3871–3892, https://doi.org/10.1002/2017JD027796, 2018.
Bozkurt, D., Carrasco, J., Cordero, R., Fernandoy, F., Gómez, A., Carrillo, B., and Guan, B.: Atmospheric river brings warmth and rainfall to the northern Antarctic Peninsula during the mid-austral winter of 2023, Geophys. Res. Lett., 51, e2024GL108391, https://doi.org/10.1029/2024GL108391, 2024.
Bromwich, D. H., Otieno, F. O., Hines, K. M., Manning, K. W., and Shilo, E.: Comprehensive evaluation of polar weather research and forecasting model performance in the Antarctic, J. Geophys. Res.-Atmos., 118, 274–292, https://doi.org/10.1029/2012JD018139, 2013.
Bromwich, D. H., Gorodetskaya, I. V., Carpentier, S., Alexander, S., Bazile, E., Heinrich, V. J., Massonnet, F., Powers, J. G., Carrasco, J. F., Cayette, A., and Zou, X.: Winter Targeted Observing Periods during the Year of Polar Prediction in the Southern Hemisphere (YOPP-SH), B. Am. Meteorol. Soc., 105, E1662–E1684, https://doi.org/10.1175/BAMS-D-22-0249.1, 2024.
Bush, M., Boutle, I., Edwards, J., Finnenkoetter, A., Franklin, C., Hanley, K., Jayakumar, A., Lewis, H., Lock, A., Mittermaier, M., Mohandas, S., North, R., Porson, A., Roux, B., Webster, S., and Weeks, M.: The second Met Office Unified Model–JULES Regional Atmosphere and Land configuration, RAL2, Geosci. Model Dev., 16, 1713–1734, https://doi.org/10.5194/gmd-16-1713-2023, 2023.
Chemke, R.: The future poleward shift of Southern Hemisphere summer mid-latitude storm tracks stems from ocean coupling, Nat. Commun., 13, 1730, https://doi.org/10.1038/s41467-022-29392-4, 2022.
Clapeyron, B. P. E.: Memoir sur la puissance motrice de la chaleur, Journal de l’École royale polytechnique 23, 153–190, 1834.
Clausius, R.: Ueber die bewegende Kraft der Wärme und die Gesetze, welche sich daraus für die Wärmelehre selbst ableiten lassen, Ann. Phys., 155, 368–397, https://doi.org/10.1002/andp.18501550306, 1850.
Cullen, M. J. P.: The unified forecast/climate model, Meteorol. Mag., 122, 81–94, 1993.
Davison, B. J., Hogg, A. E., Rigby, R., Veldhuijsen, S., van Wessem, J. M., van den Broeke, M. R., Holland, P. R., Selley, H. L., and Dutrieux, P.: Sea level rise from West Antarctic mass loss significantly modified by large snowfall anomalies, Nat. Commun., 14, 1479, https://doi.org/10.1038/s41467-023-36990-3, 2023.
de Rooy, W. C. and Siebesma, A. P.: A Simple Parameterization for Detrainment in Shallow Cumulus, Mon. Weather Rev., 136, 560–576, https://doi.org/10.1175/2007MWR2201.1, 2008.
Donat-Magnin, M., Jourdain, N. C., Kittel, C., Agosta, C., Amory, C., Gallée, H., Krinner, G., and Chekki, M.: Future surface mass balance and surface melt in the Amundsen sector of the West Antarctic Ice Sheet, The Cryosphere, 15, 571–593, https://doi.org/10.5194/tc-15-571-2021, 2021.
Doyle, S. H., Hubbard, A., Van De Wal, R. S., Box, J. E., Van As, D., Scharrer, K., Meierbachtol, T. W., Smeets, P. C., Harper, J. T., Johansson, E., and Mottram, R. H.: Amplified melt and flow of the Greenland ice sheet driven by late-summer cyclonic rainfall, Nat. Geosci., 8, 647–653, https://doi.org/10.1038/ngeo2482, 2015.
ECMWF: Part IV: Physical Processes, in: IFS Documentation CY41R2, IFS Documentation, ECMWF, https://doi.org/10.21957/tr5rv27xu, 2016.
Elvidge, A. D. and Renfrew, I. A.: The causes of foehn warming in the lee of mountains, B. Am. Meteorol. Soc., 97, 455–466, https://doi.org/10.1175/BAMS-D-14-00194.1, 2016.
Fernández-González, S., Valero, F., Sánchez, J. L., Gascón, E., López, L., García-Ortega, E., and Merino, A.: Analysis of a seeder-feeder and freezing drizzle event, J. Geophys. Res.-Atmos., 120, 3984–3999, https://doi.org/10.1002/2014JD022916, 2015.
Field, P. R., Heymsfield, A. J., and Bansemer, A.: Snow Size Distribution Parameterization for Midlatitude and Tropical Ice Clouds, J. Atmos. Sci., 64, 4346–4365, https://doi.org/10.1175/2007JAS2344.1, 2007.
Finlon, J. A., Rauber, R. M., Wu, W., Zaremba, T. J., McFarquhar, G. M., Nesbitt, S. W., Schnaiter, M., Järvinen, E., Waitz, F., Hill, T. C., and DeMott, P. J.: Structure of an atmospheric river over Australia and the Southern Ocean: II. Microphysical evolution, J. Geophys. Res.-Atmos., 125, e2020JD032514, https://doi.org/10.1029/2020JD032513, 2020.
Francis, D., Fonseca, R., Mattingly, K. S., Lhermitte, S., and Walker, C.: Foehn winds at Pine Island Glacier and their role in ice changes, The Cryosphere, 17, 3041–3062, https://doi.org/10.5194/tc-17-3041-2023, 2023.
Gehring, J., Vignon, É., Billault-Roux, A. C., Ferrone, A., Protat, A., Alexander, S. P., and Berne, A.: Orographic flow influence on precipitation during an atmospheric river event at Davis, Antarctica, J. Geophys. Res.-Atmos., 127, e2021JD035210, https://doi.org/10.1029/2021JD035210, 2022.
Gilbert, E. and Kittel, C.: Surface melt and runoff on Antarctic ice shelves at 1.5 °C, 2 °C, and 4 °C of future warming, Geophys. Res. Lett., 48, e2020GL091733, https://doi.org/10.1029/2020GL091733, 2021.
Gilbert, E., Orr, A., King, J. C., Renfrew, I. A., Lachlan-Cope, T., Field, P. F., and Boutle, I. A.: Summertime cloud phase strongly influences surface melting on the Larsen C ice shelf, Antarctica, Q. J. Roy. Meteor. Soc., 146, 1575–1589, https://doi.org/10.1002/qj.3753, 2020.
Gilbert, E., Orr, A., King, J. C., Renfrew, I. A., and Lachlan-Cope, T.: A 20-Year Study of Melt Processes Over Larsen C Ice Shelf Using a High-Resolution Regional Atmospheric Model: 1. Model Configuration and Validation, J. Geophys. Res.-Atmos., 127, e2021JD034766, https://doi.org/10.1029/2021JD034766, 2022.
Gilbert, E., Pishniak, D., and Torres, J. A.: Kilometre-scale regional climate model simulations of two atmospheric river case studies in West Antarctica, Zenodo [data set], https://doi.org/10.5281/zenodo.12697647, 2024.
Gorodetskaya, I. V., Durán-Alarcón, C., González-Herrero, S., Clem, K. R., Zou, X., Rowe, P., Rodriguez Imazio, P., Campos, D., Leroy-Dos Santos, C., Dutrievoz, N., and Wille, J. D.: Record-high Antarctic Peninsula temperatures and surface melt in February 2022: a compound event with an intense atmospheric river, npj Clim. Atmos. Sci., 6, 202, https://doi.org/10.1038/s41612-023-00529-6, 2023.
Harper, J., Saito, J., and Humphrey, N.: Cold season rain event has impact on Greenland's firn layer comparable to entire summer melt season, Geophys. Res. Lett., 50, e2023GL103654, https://doi.org/10.1029/2023GL103654, 2023.
He, Y., Yi, F., Liu, F., Yin, Z., Yi, Y., Zhou, J., Yu, C., and Zhang, Y.: Natural seeder-feeder process originating from mixed-phase clouds observed with polarization lidar and radiosonde at a mid-latitude plain site, J. Geophys. Res.-Atmos., 127, e2021JD036094, https://doi.org/10.1029/2021JD036094, 2022.
Hersbach, H., Bell, B., Berrisford, P., Hirahara, S., Horányi, A., Muñoz-Sabater, J., Nicolas, J., Peubey, C., Radu, R., Schepers, D., and Simmons, A.: The ERA5 global reanalysis, Q. J. Roy. Meteor. Soc., 146, 1999–2049, https://doi.org/10.1002/qj.3803, 2020.
Hersbach, H., Bell, B., Berrisford, P., Biavati, G., Horányi, A., Muñoz Sabater, J., Nicolas, J., Peubey, C., Radu, R., Rozum, I., Schepers, D., Simmons, A., Soci, C., Dee, D., and Thépaut, J.-N.: ERA5 hourly data on single levels from 1940 to present, Copernicus Climate Change Service (C3S) Climate Data Store (CDS) [data set], https://doi.org/10.24381/cds.adbb2d47, 2023.
Hines, K. M., Bromwich, D. H., Wang, S.-H., Silber, I., Verlinde, J., and Lubin, D.: Microphysics of summer clouds in central West Antarctica simulated by the Polar Weather Research and Forecasting Model (WRF) and the Antarctic Mesoscale Prediction System (AMPS), Atmos. Chem. Phys., 19, 12431–12454, https://doi.org/10.5194/acp-19-12431-2019, 2019.
Howat, I. M., Porter, C., Smith, B. E., Noh, M.-J., and Morin, P.: The Reference Elevation Model of Antarctica, The Cryosphere, 13, 665–674, https://doi.org/10.5194/tc-13-665-2019, 2019.
Huffman, G. J., Stocker, E. F., Bolvin, D. T., Nelkin, E. J., and Tan, J.: GPM IMERG Final Precipitation L3 Half Hourly 0.1 degree x 0.1 degree V07, Greenbelt, MD, Goddard Earth Sciences Data and Information Services Center (GES DISC) [data set], https://doi.org/10.5067/GPM/IMERG/3B-HH/07, 2023.
Hyder, P., Edwards, J. M., Allan, R. P., Hewitt, H. T., Bracegirdle, T. J., Gregory, J. M., Wood, R. A., Meijers, A. J., Mulcahy, J., Field, P., and Furtado, K.: Critical Southern Ocean climate model biases traced to atmospheric model cloud errors, Nat. Commun. 9, 3625, https://doi.org/10.1038/s41467-018-05634-2, 2018.
IPCC: IPCC Special Report on the Ocean and Cryosphere in a Changing Climate, edited by: Pörtner, H.-O., Roberts, D. C., Masson-Delmotte, V., Zhai, P., Tignor, M., Poloczanska, E., Mintenbeck, K., Alegría, A., Nicolai, M., Okem, A., Petzold, J., Rama, B., and Weyer, N. M., Cambridge University Press, Cambridge, UK and New York, NY, USA, 755 pp., https://doi.org/10.1017/9781009157964, 2019.
Kain, J. S.: The Kain–Fritsch Convective Parameterization: An Update, J. Appl. Meteor. Clim., 43, 170–181, https://doi.org/10.1175/1520-0450(2004)043<0170:TKCPAU>2.0.CO;2, 2004.
Keenan, E., Wever, N., Dattler, M., Lenaerts, J. T. M., Medley, B., Kuipers Munneke, P., and Reijmer, C.: Physics-based SNOWPACK model improves representation of near-surface Antarctic snow and firn density, The Cryosphere, 15, 1065–1085, https://doi.org/10.5194/tc-15-1065-2021, 2021.
Kittel, C., Amory, C., Hofer, S., Agosta, C., Jourdain, N. C., Gilbert, E., Le Toumelin, L., Vignon, É., Gallée, H., and Fettweis, X.: Clouds drive differences in future surface melt over the Antarctic ice shelves, The Cryosphere, 16, 2655–2669, https://doi.org/10.5194/tc-16-2655-2022, 2022.
Lascaux, F., Richard, E., and Pinty, J.-P.: Numerical simulations of three different MAP IOPs and the associated microphysical processes, Q. J. Roy. Meteor. Soc., 132, 1907–1926, https://doi.org/10.1256/qj.05.197, 2006.
Lean, H. W. and Clark, P. A.: High resolution modelling of orographic rainfall, American Meteorological Society 10th Conference on Mesoscale Processes, Paper 6.7, http://ams.confex.com/ams/10Meso/techprogram/paper_62549.htm (last access: 3 February 2025), 2003.
Lehning, M., Bartelt, P., Brown, B., Russi, T., Stöckli, U., and Zimmerli, M.: Snowpack model calculations for avalanche warning based upon a new network of weather and snow stations, Cold Reg. Sci. Technol., 30, 145–157, https://doi.org/10.1016/S0165-232X(99)00022-1, 1999.
Lehning, M., Bartelt, P., Brown, B., and Fierz, C.: A physical SNOWPACK model for the Swiss avalanche warning: Part III: meteorological forcing, thin layer formation and evaluation, Cold Reg. Sci. Technol., 35, 169–184, https://doi.org/10.1016/S0165-232X(02)00072-1, 2002a.
Lehning, M., Bartelt, P., Brown, B., Fierz, C., and Satyawali, P.: A physical SNOWPACK model for the Swiss avalanche warning: Part II. Snow microstructure, Cold Reg. Sci. Technol., 35, 147–167, https://doi.org/10.1016/S0165-232X(02)00073-3, 2002b.
Lenaerts, J. T. M., Medley, B., van den Broeke, M. R. and Wouters, B.: Observing and Modeling Ice Sheet Surface Mass Balance, Rev. Geophys., 57, 376–420, https://doi.org/10.1029/2018RG000622, 2019.
Lhermitte, S., Sun, S., Shuman, C., Wouters, B., Pattyn, F., Wuite, J., Berthier, E., and Nagler, T.: Damage accelerates ice shelf instability and mass loss in Amundsen Sea Embayment, P. Natl. Acad. Sci. USA, 117, 24735–24741, https://doi.org/10.1073/pnas.1912890117, 2020.
Lu, H., Orr, A., King, J., Phillips, T., Gilbert, E., Colwell, S., and Bracegirdle, T. J.: Extreme warm events in the South Orkney Islands, Southern Ocean: Compounding influence of atmospheric rivers and föhn conditions, Q. J. Roy. Meteor. Soc., 149, 3645–3668, https://doi.org/10.1002/qj.4578, 2023.
Ma, W., Chen, G., and Guan, B.: Poleward shift of atmospheric rivers in the Southern Hemisphere in recent decades, Geophys. Res. Lett., 47, e2020GL089934, https://doi.org/10.1029/2020GL089934, 2020.
Maclennan, M. L., Lenaerts, J. T. M., Shields, C. A., Hoffman, A. O., Wever, N., Thompson-Munson, M., Winters, A. C., Pettit, E. C., Scambos, T. A., and Wille, J. D.: Climatology and surface impacts of atmospheric rivers on West Antarctica, The Cryosphere, 17, 865–881, https://doi.org/10.5194/tc-17-865-2023, 2023.
Marshall, H. P., Conway, H., and Rasmussen, L. A.: Snow densification during rain, Cold Reg. Sci. Technol., 30, 35–41, https://doi.org/10.1016/S0165-232X(99)00011-7, 1999.
McCrystall, M. R., Stroeve, J., Serreze, M., Forbes, B. C., and Screen, J. A.: New climate models reveal faster and larger increases in Arctic precipitation than previously projected, Nat. Commun., 12, 6765, https://doi.org/10.1038/s41467-021-27031-y, 2021.
Medley, B. and Thomas, E. R.: Increased snowfall over the Antarctic Ice Sheet mitigated twentieth-century sea-level rise, Nat. Clim Change, 9, 34–39, https://doi.org/10.1038/s41558-018-0356-x, 2019.
Morcrette, J.-J., Barker, H., Cole, J., Iacono, M., and Pincus, R.: Impact of a new radiation package, McRad, in the ECMWF Integrated Forecasting System, Mon. Weather Rev., 136, 4773–4798, https://doi.org/10.1175/2008MWR2363.1, 2008.
Morlighem, M.: MEaSUREs BedMachine Antarctica, Version 3, Boulder, Colorado USA, NASA National Snow and Ice Data Center Distributed Active Archive Center [data set], https://doi.org/10.5067/FPSU0V1MWUB6, 2022.
Morlighem, M., Rignot, E., Binder, T., Blankenship, D., Drews, R., Eagles, G., Eisen, O., Ferraccioli, F., Forsberg, R., Fretwell, P., and Goel, V.: Deep glacial troughs and stabilizing ridges unveiled beneath the margins of the Antarctic ice sheet, Nat. Geosci., 13, 132–137, https://doi.org/10.1038/s41561-019-0510-8, 2020.
Morrison, H., Thompson, G., and Tatarskii, V.: Impact of cloud microphysics on the development of trailing stratiform precipitation in a simulated squall line: Comparison of one- and two-moment schemes, Mon. Weather Rev., 137, 991–1007, https://doi.org/10.1175/2008MWR2556.1, 2008.
Morrison, H., van Lier-Walqui, M., Fridlind, A. M., Grabowski, W. W., Harrington, J. Y., Hoose, C., Korolev, A., Kumjian, M. R., Milbrandt, J. A., Pawlowska, H., and Posselt, D. J.: Confronting the challenge of modeling cloud and precipitation microphysics, J. Adv. Model. Earth Syst., 12, e2019MS001689, https://doi.org/10.1029/2019MS001689, 2020.
Mottram, R., Hansen, N., Kittel, C., van Wessem, J. M., Agosta, C., Amory, C., Boberg, F., van de Berg, W. J., Fettweis, X., Gossart, A., van Lipzig, N. P. M., van Meijgaard, E., Orr, A., Phillips, T., Webster, S., Simonsen, S. B., and Souverijns, N.: What is the surface mass balance of Antarctica? An intercomparison of regional climate model estimates, The Cryosphere, 15, 3751–3784, https://doi.org/10.5194/tc-15-3751-2021, 2021.
Müller, M., Homleid, M., Ivarsson, K.-I., Køltzow, M. A. Ø., Lindskog, M., Midtbø, K. H., Andrae, U., Aspelien, T., Berggren, L., Bjørge, D., Dahlgren, P., Kristiansen, J., Randriamampianina, R., Ridal, M., and Vignes, O.: AROME-MetCoOp: A Nordic Convective-Scale Operational Weather Prediction Model, Weather Forecast., 32, 609–627, https://doi.org/10.1175/WAFD-16-0099.1, 2017.
Nicola, L., Notz, D., and Winkelmann, R.: Revisiting temperature sensitivity: how does Antarctic precipitation change with temperature?, The Cryosphere, 17, 2563–2583, https://doi.org/10.5194/tc-17-2563-2023, 2023.
Noël, B., Lenaerts, J. T., Lipscomb, W. H., Thayer-Calder, K., and van den Broeke, M. R.: Peak refreezing in the Greenland firn layer under future warming scenarios, Nat. Commun., 13, 6870, https://doi.org/10.1038/s41467-022-34524-x, 2022.
Pinty, J. P. and Jabouille, P. A.: mixed-phase cloud parameterization for use in mesoscale non-hydrostatic model: simulations of a squall line and of orographic precipitations, in: Conf. on cloud physics, Everett, WA: Amer. Meteor. Soc., 217–220, 1998.
Pritchard, H. D.: Global data gaps in our knowledge of the terrestrial cryosphere, Front. Clim., 3, 689823, https://doi.org/10.3389/fclim.2021.689823, 2021.
Ramelli, F., Henneberger, J., David, R. O., Bühl, J., Radenz, M., Seifert, P., Wieder, J., Lauber, A., Pasquier, J. T., Engelmann, R., Mignani, C., Hervo, M., and Lohmann, U.: Microphysical investigation of the seeder and feeder region of an Alpine mixed-phase cloud, Atmos. Chem. Phys., 21, 6681–6706, https://doi.org/10.5194/acp-21-6681-2021, 2021.
Rignot, E., Mouginot, J., Scheuchl, B., van den Broeke, M. R., van Wessem, M. J., and Morlighem, M.: Four decades of Antarctic Ice Sheet mass balance from 1979–2017, P. Natl. Acad. Sci. USA, 116, 1095–1105, https://doi.org/10.1073/pnas.1812883116, 2019.
Scambos, T.: Visala WXT520 weather station data at the Cavity and Channel AMIGOS-III sites, U.S. Antarctic Program (USAP) Data Center [data set], https://doi.org/10.15784/601549, 2022.
Scambos, T. A., Ross, R., Haran, T., Bauer, R., Ainley, D. G., Seo, K. W., De Keyser, M., Behar, A., and MacAyeal, D. R.: A camera and multisensor automated station design for polar physical and biological systems monitoring: AMIGOS, J. Glaciol., 59, 303–314, https://doi.org/10.3189/2013JoG12J170, 2013.
Scambos, T. A., Bell, R. E., Alley, R. B., Anandakrishnan, S., Bromwich, D. H., Brunt, K., Christianson, K., Creyts, T., Das, S. B., DeConto, R., and Dutrieux, P.: How much, how fast?: A science review and outlook for research on the instability of Antarctica's Thwaites Glacier in the 21st century, Global Planet. Change, 153, 16–34, https://doi.org/10.1016/j.gloplacha.2017.04.008, 2017.
Schmucki, E., Marty, C., Fierz, C., and Lehning, M.: Evaluation of modelled snow depth and snow water equivalent at three contrasting sites in Switzerland using SNOWPACK simulations driven by different meteorological data input, Cold Reg. Sci. Technol., 99, 27–37, https://doi.org/10.1016/J.COLDREGIONS.2013.12.004, 2014.
Scott, R. C., Nicolas, J. P., Bromwich, D. H., Norris, J. R., and Lubin, D.: Meteorological drivers and large-scale climate forcing of West Antarctic surface melt, J. Climate, 32, 665–684, https://doi.org/10.1175/JCLI-D-18-0233.1, 2019.
Shields, C. A., Wille, J. D., Marquardt Collow, A. B., Maclennan, M., and Gorodetskaya, I. V.: Evaluating uncertainty and modes of variability for Antarctic atmospheric rivers, Geophys. Res. Lett., 49, e2022GL099577, https://doi.org/10.1029/2022GL099577, 2022.
Silber, I., Fridlind, A. M., Verlinde, J., Ackerman, A. S., Chen, Y. S., Bromwich, D. H., Wang, S. H., Cadeddu, M., and Eloranta, E. W.: Persistent supercooled drizzle at temperatures below −25 °C observed at McMurdo Station, Antarctica, J. Geophys. Res.-Atmos., 124, 10878–10895, https://doi.org/10.1029/2019JD030882, 2019.
Skamarock, W., Klemp, J., Dudhia, J., Gill, D. O., Liu, Z., Berner, J., Wang, W., Powers, J. G., Duda, M. G., Barker, D., and Huang, X.-Y.: A Description of the Advanced Research Polar-WRF Model Version 4.1 (No. NCAR/TN-556+STR), https://doi.org/10.5065/1dfh-6p97, 2019.
Smith, B., Fricker, H. A., Gardner, A. S., Medley, B., Nilsson, J., Paolo, F. S., Holschuh, N., Adusumilli, S., Brunt, K., Csatho, B., and Harbeck, K.: Pervasive ice sheet mass loss reflects competing ocean and atmosphere processes, Science, 368, 1239–1242, https://doi.org/10.1126/science.aaz5845, 2020.
Stroeve, J., Nandan, V., Willatt, R., Dadic, R., Rostosky, P., Gallagher, M., Mallett, R., Barrett, A., Hendricks, S., Tonboe, R., McCrystall, M., Serreze, M., Thielke, L., Spreen, G., Newman, T., Yackel, J., Ricker, R., Tsamados, M., Macfarlane, A., Hannula, H.-R., and Schneebeli, M.: Rain on snow (ROS) understudied in sea ice remote sensing: a multi-sensor analysis of ROS during MOSAiC (Multidisciplinary drifting Observatory for the Study of Arctic Climate), The Cryosphere, 16, 4223–4250, https://doi.org/10.5194/tc-16-4223-2022, 2022.
Turner, J., Phillips, T., Thamban, M., Rahaman, W., Marshall, G. J., Wille, J. D., Favier, V., Winton, V. H. L., Thomas, E., Wang, Z., and van den Broeke, M.: The dominant role of extreme precipitation events in Antarctic snowfall variability, Geophys. Res. Lett., 46, 3502–3511, https://doi.org/10.1029/2018GL081517, 2019.
van Wessem, J. M., van den Broeke, M. R., Wouters, B., and Lhermitte, S.: Variable temperature thresholds of melt pond formation on Antarctic ice shelves, Nat. Clim. Change, 13, 161–166, https://doi.org/10.1038/s41558-022-01577-1, 2023.
Vergara-Temprado, J., Miltenberger, A. K., Furtado, K., Grosvenor, D. P., Shipway, B. J., Hill, A. A., Wilkinson, J. M., Field, P. R., Murray, B. J., and Carslaw, K. S.: Strong control of Southern Ocean cloud reflectivity by ice-nucleating particles, P. Natl. Acad. Sci. USA, 115, 2687–2692, https://doi.org/10.1073/pnas.1721627115, 2018.
Vignon, É., Roussel, M. L., Gorodetskaya, I. V., Genthon, C., and Berne, A.: Present and future of rainfall in Antarctica, Geophys. Res. Lett., 48, e2020GL092281, https://doi.org/10.1029/2020GL092281, 2021.
Walters, D., Baran, A. J., Boutle, I., Brooks, M., Earnshaw, P., Edwards, J., Furtado, K., Hill, P., Lock, A., Manners, J., Morcrette, C., Mulcahy, J., Sanchez, C., Smith, C., Stratton, R., Tennant, W., Tomassini, L., Van Weverberg, K., Vosper, S., Willett, M., Browse, J., Bushell, A., Carslaw, K., Dalvi, M., Essery, R., Gedney, N., Hardiman, S., Johnson, B., Johnson, C., Jones, A., Jones, C., Mann, G., Milton, S., Rumbold, H., Sellar, A., Ujiie, M., Whitall, M., Williams, K., and Zerroukat, M.: The Met Office Unified Model Global Atmosphere 7.0/7.1 and JULES Global Land 7.0 configurations, Geosci. Model Dev., 12, 1909–1963, https://doi.org/10.5194/gmd-12-1909-2019, 2019.
Wever, N.: SNOWPACK simulations for Thwaites Cavity and Channel AMIGOS sites in West Antarctica, Zenodo [data set], https://doi.org/10.5281/zenodo.7320237, 2022.
Wever, N., Schmid, L., Heilig, A., Eisen, O., Fierz, C., and Lehning, M.: Verification of the multi-layer SNOWPACK model with different water transport schemes, The Cryosphere, 9, 2271–2293, https://doi.org/10.5194/tc-9-2271-2015, 2015.
Wever, N., Keenan, E., Amory, C., Lehning, M., Sigmund, A., Huwald, H., and Lenaerts, J.: Observations and simulations of new snow density in the drifting snow-dominated environment of Antarctica, J. Glaciol., 69, 823–840, https://doi.org10.1017/jog.2022.102, 2023.
Wille, J. D., Favier, V., Dufour, A., Gorodetskaya, I. V., Turner, J., Agosta, C., and Codron, F.: West Antarctic surface melt triggered by atmospheric rivers, Nat. Geosci., 12, 911–916, https://doi.org/10.1038/s41561-019-0460-1, 2019.
Wille, J. D., Favier, V., Gorodetskaya, I. V., Agosta, C., Kittel, C., Beeman, J. C., Jourdain, N. C., Lenaerts, J. T., and Codron, F.: Antarctic atmospheric river climatology and precipitation impacts, J. Geophys. Res.-Atmos., 126, e2020JD033788, https://doi.org/10.1029/2020JD033788, 2021.
Wille, J. D., Favier, V., Jourdain, N. C., Kittel, C., Turton, J. V., Agosta, C., Gorodetskaya, I. V., Picard, G., Codron, F., Santos, C. L. D., and Amory, C.: Intense atmospheric rivers can weaken ice shelf stability at the Antarctic Peninsula, Commun. Earth Environ., 3, 90, https://doi.org/10.1038/s43247-022-00422-9, 2022.
Wille, J. D., Alexander, S. P., Amory, C., Baiman, R., Barthélemy, L., Bergstrom, D. M., Berne, A., Binder, H., Blanchet, J., Bozkurt, D., Bracegirdle, T. J., Casado, M., Choi, T., Clem, K. R., Codron, F., Datta, R., Di Battista, S., Favier, V., Francis, D., Fraser, A. D., Fourré, E., Garreaud, R. D., Genthon, C., Gorodetskaya, I. V., González-Herrero, S., Heinrich, V. J., Hubert, G., Joos, H., Kim, S-J., John C. King, J. C., Kittel, C., Landais, A., Lazzara, M., Leonard, G. H., Lieser, J. L., Maclennan, M., Mikolajczyk, D., Neff, P., Ollivier, I., Picard, G., Pohl, B., Ralph, F. M., Rowe, P., Schlosser, E., Shields, C. A., Smith, I. J., Sprenger, M., Trusel, L., Udy, D., Vance, T., Vignon, E. Walker, C., Wever, N., and Zou, X.: The extraordinary March 2022 East Antarctica “heat” wave. Part II: impacts on the Antarctic ice sheet, J. Climate, 37, 779–799, https://doi.org/10.1175/JCLI-D-23-0176.1, 2024.
Wilson, A. B., Bromwich, D. H., and Hines, K. M.: Evaluation of Polar WRF forecasts on the Arctic System Reanalysis domain: Surface and upper air analysis, J. Geophys. Res., 116, D11112, https://doi.org/10.1029/2010JD015013, 2011.
Wilson, D. R. and Ballard, S. P.: A microphysically based precipitation scheme for the UK Meteorological Office Unified Model, Q. J. Roy. Meteor. Soc., 125, 1607–1636, https://doi.org/10.1002/qj.49712555707, 1999.
Xu, K. M. and Randall, D. A.: A semiempirical cloudiness parameterization for use in climate models, J. Atmos. Sci., 53, 3084–3102, https://doi.org/10.1175/1520-0469(1996)053<3084:ASCPFU>2.0.CO;2, 1996.
Xue, J., Xiao, Z., Bromwich, D. H., and Bai, L.: Polar Polar-WRF V4.1.1 simulation and evaluation for the Antarctic and Southern Ocean, Front. Earth Sci., 16, 1005–1024, https://doi.org/10.1007/s11707-022-0971-8, 2022.
Zou, X., Rowe, P. M., Gorodetskaya, I., Bromwich, D. H., Lazzara, M. A., Cordero, R. R., Zhang, Z., Kawzenuk, B., Cordeira, J. M., Wille, J. D., and Ralph, F. M.: Strong warming over the Antarctic Peninsula during combined atmospheric River and foehn events: Contribution of shortwave radiation and turbulence, J. Geophys. Res.-Atmos., 128, e2022JD038138, https://doi.org/10.1029/2022JD038138, 2023.