the Creative Commons Attribution 4.0 License.
the Creative Commons Attribution 4.0 License.
 | 10 Nov 2025
Brief communication: Decadal changes in topography, surface water and subsurface structure across an Arctic coastal tundra site
Jonathan A. Bachman
John Lamb
Craig Ulrich
Neslihan Taş
In ice-rich polygonal tundra, spatiotemporal heterogeneity in ground-ice melt reshapes topography, impacting infrastructure, water and carbon cycles. This study evaluates changes in topography and subsurface structure at a coastal Arctic site by comparing data from two surveys conducted a decade apart. Each survey includes electrical resistivity tomography, active layer thickness, photogrammetry, and topographic data. Results reveal subsidence and decrease in permafrost table elevation with varying intensity and spatial distribution across polygons, alongside diverse thermal-hydrological responses, such as thermokarst pool formation in high-centered-polygons and more even subsidence in flat-centered-polygons. The study also underscores the value and limitations of sporadic surveys.
- Article
(4847 KB) - Full-text XML
-
Supplement
(667 KB) - BibTeX
- EndNote


The Arctic region holds one of the world's largest carbon stocks, is warming three to four times faster than the global average, and is experiencing extreme changes as ground temperatures cross the 0 °C threshold (Rantanen et al., 2022; Tarnocai et al., 2009). Permafrost thaw can lead to major shifts in topography, water and carbon storage and fluxes, energy balance, vegetation, and erosion rates. The presence of complex feedback mechanisms within and between Arctic ecosystems and atmospheric processes introduce considerable uncertainty into climate projections (Koven et al., 2011).
Ice-wedge polygon networks, underlain by abundant and complex ground ice (wedge, vein, segregated, and pore ice), cover large areas of the Arctic tundra, with regional studies reporting up to 65 % of terrestrial surface coverage in places such as the Arctic Coastal Plain of Alaska (Lara et al., 2020; Shur et al., 2025). In these environments, ice-wedge aggradation and melt reshape the surface into polygons of various sizes and shapes, typically referred to as low-centered, flat-centered, or high-centered depending on the relative elevation of their centers compared to surrounding rims and troughs (Mackay, 2000). These polygon types correspond to different evolutionary states of ice wedges and are associated with distinct water distribution patterns, vegetation communities, and carbon fluxes (Shur et al., 2025). As ground-ice melts with a warming climate, significant and uneven subsidence due to heterogeneity in ice content and thaw rate within and across polygons leads to changes in surface and subsurface flow, accumulation of surface water (hereafter referred to as pool expansion), snow distribution, and thermal fluxes. These changes, in turn, influence microbial activity, vegetation dynamics, and the partitioning of carbon between carbon dioxide and methane emissions (Lara et al., 2020; Li et al., 2024). Importantly, in low-relief terrain where polygons are abundant, even fine-scale topographic changes can propagate to large-scale shifts in drainage networks and the extent of dry, wet, and inundated areas.
Understanding of how surface and subsurface hydrology and carbon fluxes evolve in polygonal tundra require field-based assessments of the co-evolution of microtopography, water distribution and subsurface structure. Such investigations remain rare despite the wide range of environmental conditions that increase system complexity and necessitate broad sampling (Abolt et al., 2024; Jorgenson et al., 2006; Streletskiy et al., 2017). The study by Jorgenson et al. (2006) highlights an abrupt increase in permafrost degradation, primarily in massive wedges of ice, on the central Beaufort Coastal Plain in northern Alaska. The area of degrading ice wedges (negative net ice mass balance) increased from 0.6 % in 1982 to 4.4 % by 2001. More recently, the work by Abolt et al. (2024) provides insights into thermokarst pool expansion across 27 circumpolar field sites, finding that 44 % (±15 %) of survey areas experienced pool expansion greater than 3 % per year, with an 11 % annual increase between 2010 and 2019 at a lowland site near Utqiaġvik in the northern Alaska (Abolt et al., 2024).
Assessing the co-evolution of permafrost thaw, topography, and water distribution is hindered by the lack of high-resolution and multi-scale observations of terrain and subsurface properties (Dafflon et al., 2016). A particular challenge is the difficulty of quantifying, over space and time, the ice content across the landscape and the associated subsidence driven by ice loss and ground compaction as permafrost thaws (Kokelj and Jorgenson, 2013). Additionally, measurements of ground properties are often referenced to the ground surface – a shifting reference point – introducing uncertainties that are frequently overlooked. For instance, long-term measurements of active layer thickness underestimate the rate of permafrost thaw when subsidence is not accounted for (Rodenhizer et al., 2020; Shiklomanov et al., 2013; Streletskiy et al., 2017). Rodenhizer et al. (2020) indicate that accounting for subsidence increases estimated permafrost thaw by 19 %–49 % and the estimated amount of newly-thawed carbon by 37 %–113 %. Collectively, these studies underscore the importance of jointly assessing potential changes in topography, water distribution, and subsurface structure.
In this brief communication we explore how changes in surface water distribution are associated with changes in topography and permafrost thaw across various polygon types. To this end, we evaluate decadal changes in surface water distribution, thaw layer depth, terrain elevation, and subsurface structure from the meter to hundreds-of-meters scale over a 12-year period across a polygonal tundra area near Utqiaġvik, Alaska. Besides evaluating the organization of these changes, this study aims to discuss the value and limitations of ground-based methods for sporadic assessment of the evolution of polygonal ground.
Study Site
The study site, located within the Barrow Environmental Observatory (BEO) on the Alaskan Arctic Coastal Plain, lies approximately 6 km from the Beaufort Sea near Utqiagvik, Alaska (Fig. S1). The landscape is characterized by low topographic relief, with elevations ranging from 2 to 6 m, and is dominated by polygonal ground formations (Hinkel et al., 2001). The polygon evolution processes defines the microtopography, while larger topographical patterns are shaped by processes such as ice accumulation, thermokarst lake, drainage network evolution, and landscape uplift (Kanevskiy et al., 2017). Polygons at the site include high-centered polygons having elevated centers associated with drier conditions, low-centered polygons exhibiting wet centers with well-defined rims and troughs, and flat-centered polygons representing an intermediate form, with flat terrain and wet troughs (Mackay, 2000). The permafrost temperature at the study site remains well below 0 °C, fluctuating between −12 and −5 °C at a depth of 3 m (yet it is not always entirely frozen due to the presence of saline permafrost). Core samples reaching 3 to 6 m depth around Utqiagvik, AK indicate salinity up to twice that of seawater (Brown, 1969; Dafflon et al., 2016).
This study takes place in a 475 m long, 20 m wide corridor crossing high-centered, flat-centered and low-centered polygon areas (Dafflon et al., 2016). This area was intensively studied between 2011 and 2014 to improve the understanding of the co-variability of microtopography with surface and subsurface properties (Dafflon et al., 2016; Wu et al., 2018), the development of zonation approaches to estimating subsurface properties (Wainwright et al., 2015), and the advancement of parameterization and evaluation of terrestrial ecosystem models (Bisht et al., 2018). Dafflon et al. (2016) evaluated terrain elevation using UAV-based photogrammetry, subsurface structure using Electrical Resistivity Tomography (ERT), and soil properties by analyzing soil core and measuring thaw depth. Their study indicates that the saline permafrost is spatially continuous, depth-variable, and that the increase in salinity is correlated with a decrease in ice content. Soil cores reveal volumetric ice content as high as 85 % in the top 1 m of permafrost and as low as 40 % at 2.5 m depth. Further, their analysis shows that the ice content in the top 2 m is greater in high-centered and low-centered polygon areas than in the flat-centered polygon area. These results underline the covariability between topography and permafrost characteristics including ice content and salinity distribution.
In the present study, we investigate how terrain elevation, geomorphology, surface water distribution, and subsurface characteristics observed by Dafflon et al. (2016) in 2011–2013 have changed in 2023, this using a similar characterization approach. During that period, meteorological data shows a warming trend at our field site, with decreasing freezing degree days and increasing thawing degree days (NOAA Barrow Atmospheric Baseline Observatory, https://gml.noaa.gov/data/data.php?category=Meteorology&site=BRW, last access: 30 October 2025) (Fig. S2) (Farquharson et al., 2022). Data from the Circumpolar Active Layer Monitoring (CALM) site near Utqiagvik indicate an average thaw depth increase of 0.3 cm yr−1 for the same period, though inter-annual variability is significant (Shiklomanov, 2023) (Fig. S2). In addition, a study evaluating subsidence in the same region over the 2003–2015 period reports a subsidence trend of 0.4–1.0 cm yr−1, resulting in a net elevation change of 8–15 cm over that period (Streletskiy et al., 2017). These datasets demonstrate the presence of a warming trend and subsequent geomorphological changes in the region. Besides the overall warming trend (Fig. S2), observations from the nearby CALM site indicate that in the years data were acquired for this study the average thaw depths are consistent with the trend in warming, with means of 39.3, 40.3, and 41.7 cm in 2011, 2013, and 2023, respectively (Fig. S2). Summer weather forcing, which can modulate surface water distribution and evapotranspiration, show moderate variations among these years, with June–July–August precipitation totals of 64.6, 94.6, and 83.6 mm, and mean summer air temperatures of 3.64, 3.66, and 4.51 °C in 2011, 2013, and 2023, respectively (Fig. S3).
2.1 Digital Surface Model, Orthomosaic, and Surface Water Distribution
In July 2013, a kite-based aerial system was used to capture high-resolution imagery of the study area (Dafflon et al., 2016). A Sony NEX-5R digital camera was mounted on a Picavet rig positioned approximately 2 m below the kite line, enabling stable, downward-looking shots from an altitude of about 45 m. Images were captured automatically at 3 s intervals, covering roughly 73 by 48 m per frame with a pixel resolution of 0.015 m. In September 2023, aerial imagery was acquired using a similar methodology, but with a DJI Mini 2 UAV platform. For both surveys (2013 and 2023), ground control targets, spaced approximately 20 m apart, were positioned along the corridor and surveyed using a centimeter-grade real-time kinematic (RTK) differential GPS. Agisoft Metashape software was used to extract features, align images, and produce georeferenced outputs, including a digital surface model and RGB orthomosaic for each campaign. Analysis of the data products indicated that the digital surface model can be used as a terrain model proxy because of the low-stature vegetation, and that the products achieved a spatial resolution of approximately 0.05 m, with an estimated positioning accuracy within 6 cm across all axes (x, y, z) based on multiple RTK GPS surveys. In addition, inaccuracies in RTK base station setup and correction, which are difficult to assess in evolving landscapes, can introduce a constant shift of a few centimeters between surveys. The digital surface model and RGB orthomosaic were used to evaluate changes in water distribution and topography using Python and Matlab. Visualization Toolkit (VTK) and ParaView were used to generate a 3D animation showcasing topography, vegetation, and water distribution in 2013 and 2023 (https://youtu.be/1_5yZp7yw94, last access: 30 October 2025).
A Random Forest model was applied to the 2013 and 2023 RGB orthomosaics to classify water versus non-water pixels. Given the distinct visual characteristics between the two years – with the 2023 image containing more visible surface water, and the 2013 image showing denser vegetation with underlying water – manual pixel selection for training was required to improve model accuracy. The training dataset consisted of approximately one hundred thousand manually labeled pixels from a subset area of the orthomosaics. Each year's labeled pixels were split into an 80 % training set and a 20 % held out test set. A random forest classifier was then trained on four features, the RGB channels plus the blue to green channel ratio. On the independent test set, the models achieved an accuracy of ∼ 98 % for both years. The models were applied to the entire orthomosaics to predict water presence at the pixel level, and the resulting maps were subtracted to visualize surface-water changes.
2.2 Subsurface Properties and Structure
A 475 m long electrical resistivity tomography (ERT) transect along the centerline of the studied corridor was acquired in September 2011 and 2023 using a 112-electrode SuperSting R8 system (Advanced Geosciences, Inc.) with a 0.5 m electrode spacing, and a roll-along acquisition technique (Dafflon et al., 2016). Electrode locations were measured using a RTK differential GPS in 2011 and 2023. In 2023, the electrodes were placed along a measuring tape installed between control points every 50 m that were either wooden poles remaining from the 2011 survey or re-surveyed based on the 2011 coordinates. While the RTK GPS-surveyed x–y coordinates were deemed precise enough for the goals of this study, the RTK-GPS elevation measurements contained some noise and inaccuracies associated with inconsistencies among the short surveys conducted over the three days of ERT acquisition, including in GPS signal quality, base station settings, and GPS pole positioning across organic-rich areas and in the presence of surface water. To increase accuracy, the elevation for each electrode was extracted from the digital surface models, whose ground control targets were all surveyed consistently under ideal conditions.
The collected ERT data used a dipole-dipole survey setup with a maximum distance of 18 m between the nearest injection and potential electrodes and a maximum distance between adjacent injection (or potential) electrodes of 3 m. Data quality control included the exclusion of low-quality measurements, including those with signal potentials below 3 mV. The acquisition of reciprocal measurements for about 15 % of datasets indicates a mean percentage difference of about 6 %. ERT datasets were processed and inverted using the open-source pygimli library and its ERTManager module (Rücker et al., 2017). A parameterized mesh was created for each campaign based on sensor positions, with mesh quality settings and electrode spacing tailored to improve resolution and reduce inversion artifacts. Differences between observed and modeled apparent resistivities were calculated to quantify model accuracy. For the 2011 dataset, a chi-squared value of 1.93 was achieved, along with a mean percentage difference of 12.30 % and a log-scale mean percentage difference of 2.41 %. The 2023 dataset achieved a chi-squared value of 1.94, a mean percentage difference of 12.03 %, and a log-scale mean percentage difference of 2.47 %. Although the 2011 and 2023 surveys were both acquired in September, we note that differences in the ERT data need to be carefully interpreted given the inter-annual variability in climate forcing that impacts surface water distribution, thaw layer depth and moisture (Fig. S3), as well as the slight differences in electrode positioning and topography that lead to different mesh grid for the inversion.
In addition, the thaw depth was measured at 3 m intervals along the ERT transect by pushing a tile probe into the ground until reaching frozen soil. Collected at the end of the warm season, these measurements are used as a proxy for active layer thickness, the soil layer overlying permafrost that thaws in summer and refreezes in winter. For data comparison, the nearby electrical resistivity of the active layer was estimated by averaging the resistivity values for mesh cells in the 0.5 m lateral interval around each measurement and from 0 to 0.5 m depth. Resistivity was also extracted from the 0.5 to 1 and 0.5 to 1.5 m depth intervals using the same approach.
The distribution of active layer thickness, resistivity, and topography was then visualized for each polygon type and surveyed year. The year-to-year differences (2011 vs. 2023) for each polygon type were assessed with the Mann–Whitney U test, which compares rank distributions of independent samples, with the Wilcoxon signed-rank test, which evaluates paired differences, and with the Hodges–Lehmann estimator of the median difference and its confidence interval. This was applied across all polygon types, without differentiating troughs, rims, and centers due to limited thaw-depth data. This method offers an integrated measure of local changes, expected to be greater in ice-rich areas or those warming faster. Individual datasets (e.g., ERT) can further localize these changes.
3.1 Spatio-temporal Variability in Microtopography and Surface Water Distribution
Our results indicate that decadal changes in topography and surface water are highly variable across the landscape, both in magnitude and distribution, with localized hotspots of permafrost degradation and surface water accumulation (Figs. 1 and 2). Locations with significant increases in trough width and water accumulation are more noticeable in high-centered and flat-centered polygons than in low-centered polygons. In the high-centered polygon area, a limited number of relatively large pools formed in previously dry areas. By contrast, the increase in surface water in the flat-centered polygon area is more evenly distributed, primarily associated with trough widening and small-scale variability in ground subsidence (Fig. 2). These fine-scale changes in the flat-centered polygon area appear to contribute to an overall increase in surface water that is similar to or greater than that observed in the high-centered polygons area.
The observed increase in surface water accumulation along the transect aligns with the findings of Abolt et al. (2024), who estimated an average 11 % annual net increase in thermokarst pool extent between 2010 and 2019 at a lowland site near Utqiaġvik (Abolt et al., 2024). While their study underlines that some pools shrink while new ones form, our study does not indicate the presence of areas with a significant decrease in surface water. However, our acquisition timing and frequency may limit sensitivity to detecting decreases. Nonetheless, our results highlight varying characteristics of permafrost degradation across areas with different polygonal topography.
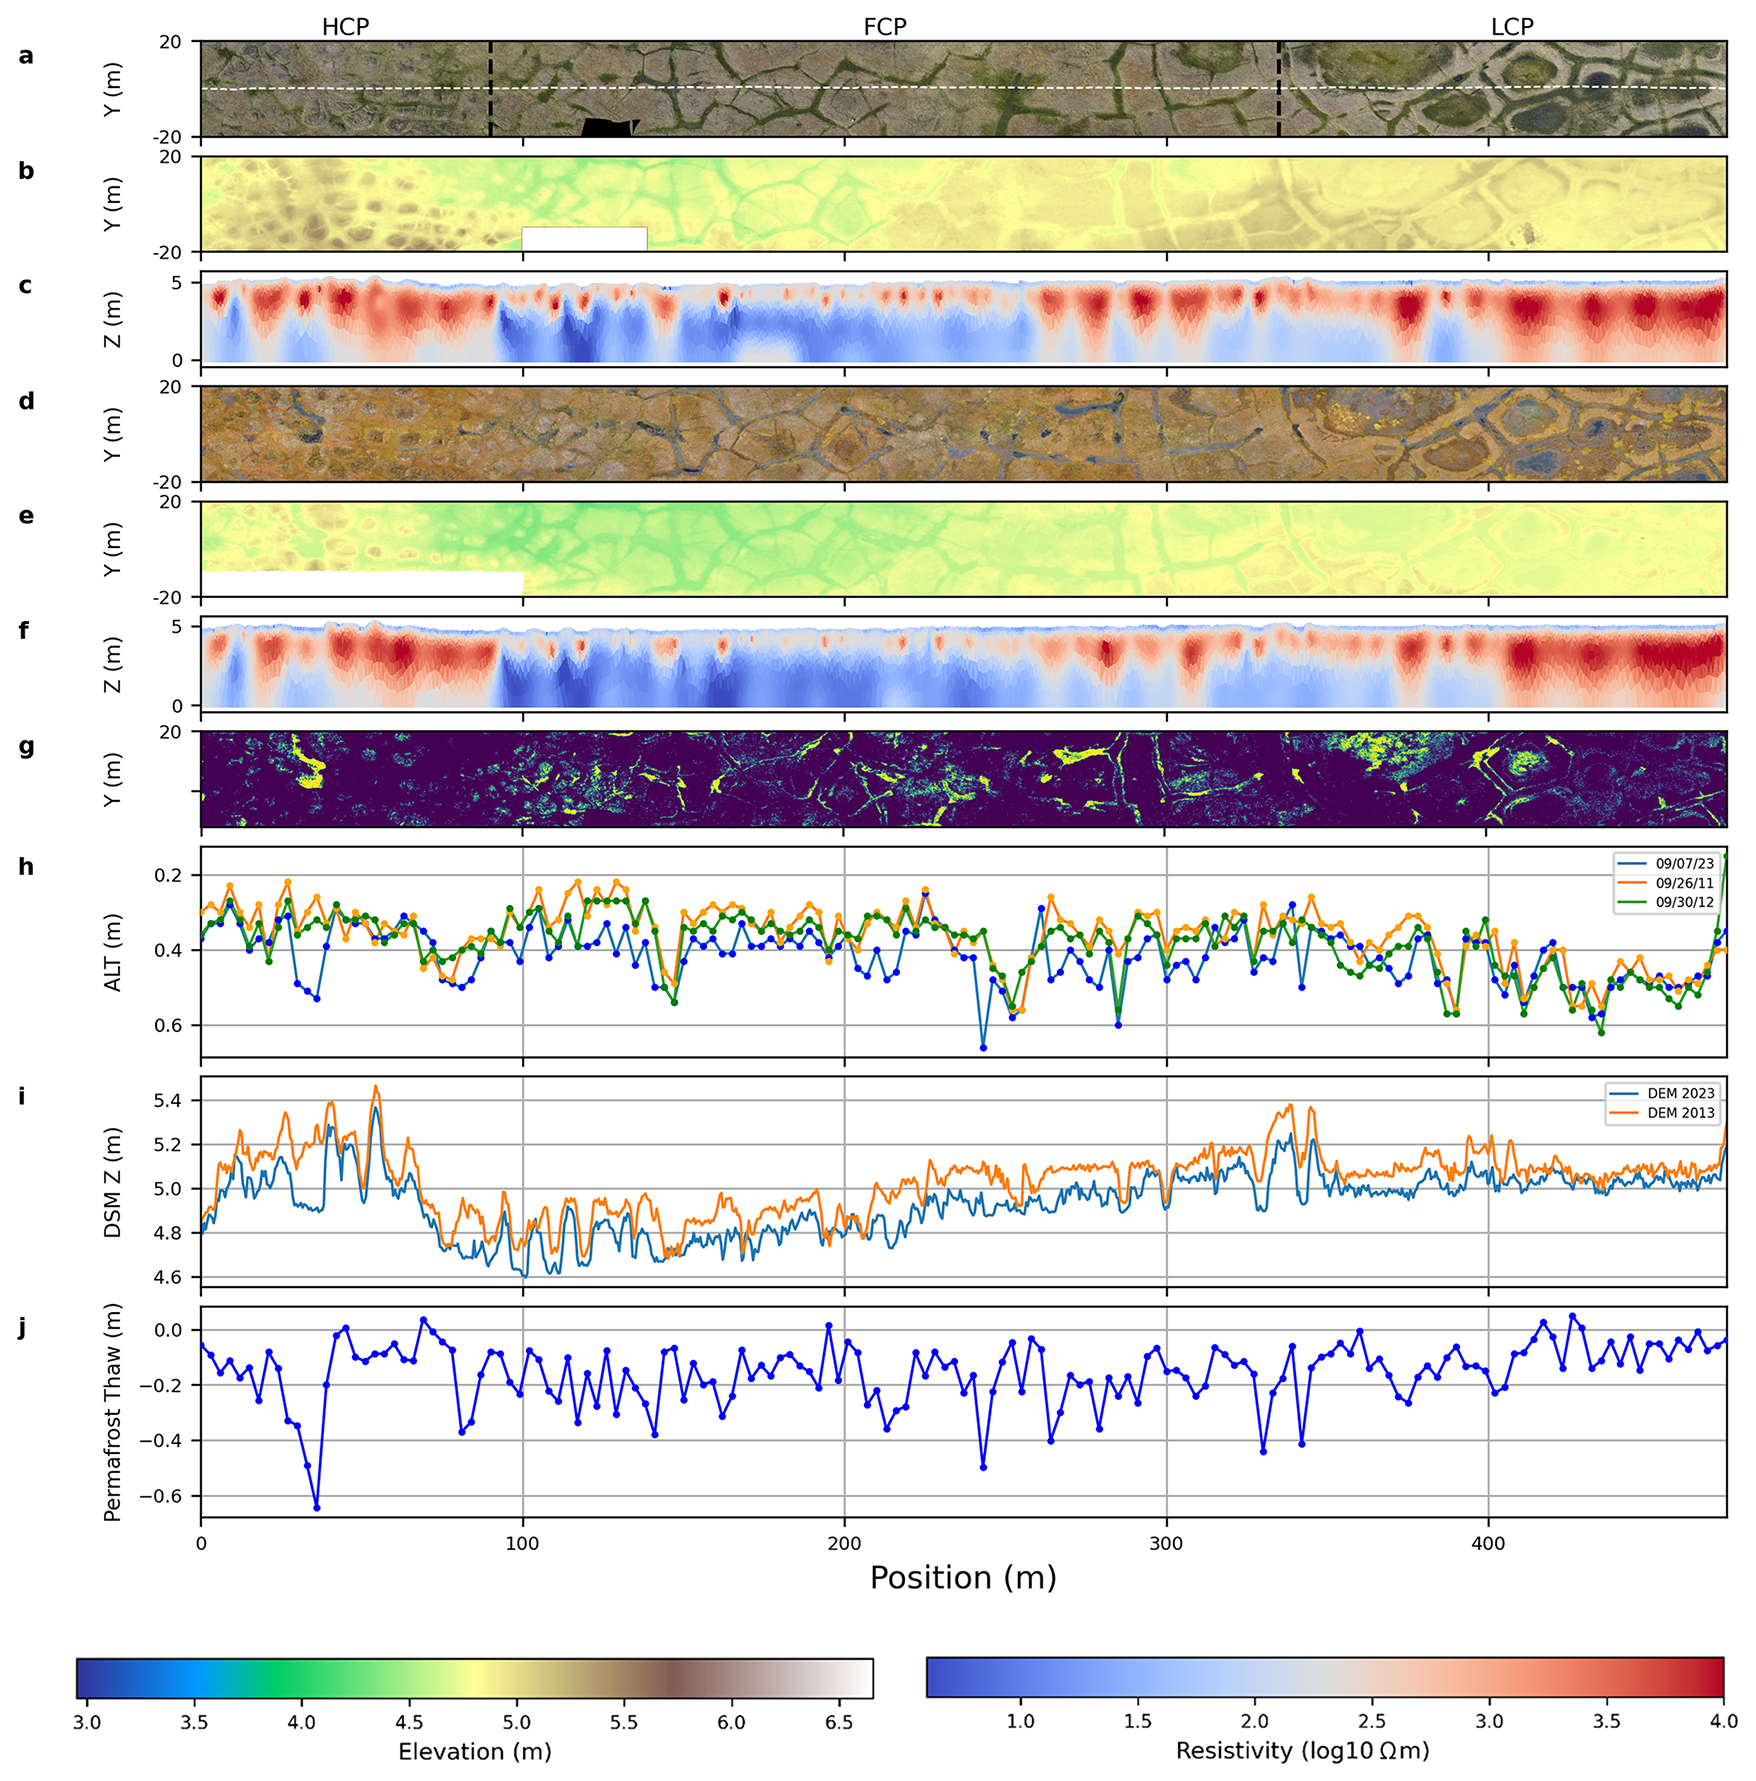
Figure 1Surface and subsurface properties across various polygon types, including high-centered (HCP; left), flat-centered (FCP; middle) and low-centered (LCP; right). Datasets include (a) 2013 RGB orthomosaic, (b) 2013 digital surface model (DSM) elevation, (c) 2011 ERT, (d) 2023 RGB orthomosaic, (e) 2023 DSM elevation, (f) 2023 ERT, (g) pool expansion (in yellow, binary map) based on the RGB orthomosaics and a random forest algorithm, (h) active layer thickness (ALT) measurements, (i) elevation from the DSMs along the ERT transect, and (j) estimated permafrost thaw (defined as change in permafrost table elevation) based on changes in ALT and ground elevation. Note that field notes and visual observations indicate that the pool expansions in the center of LCPs in (g) are classification artifacts, presumably due to the particularly complex, changing mixture of water, solids, moss, and sedge at these locations.
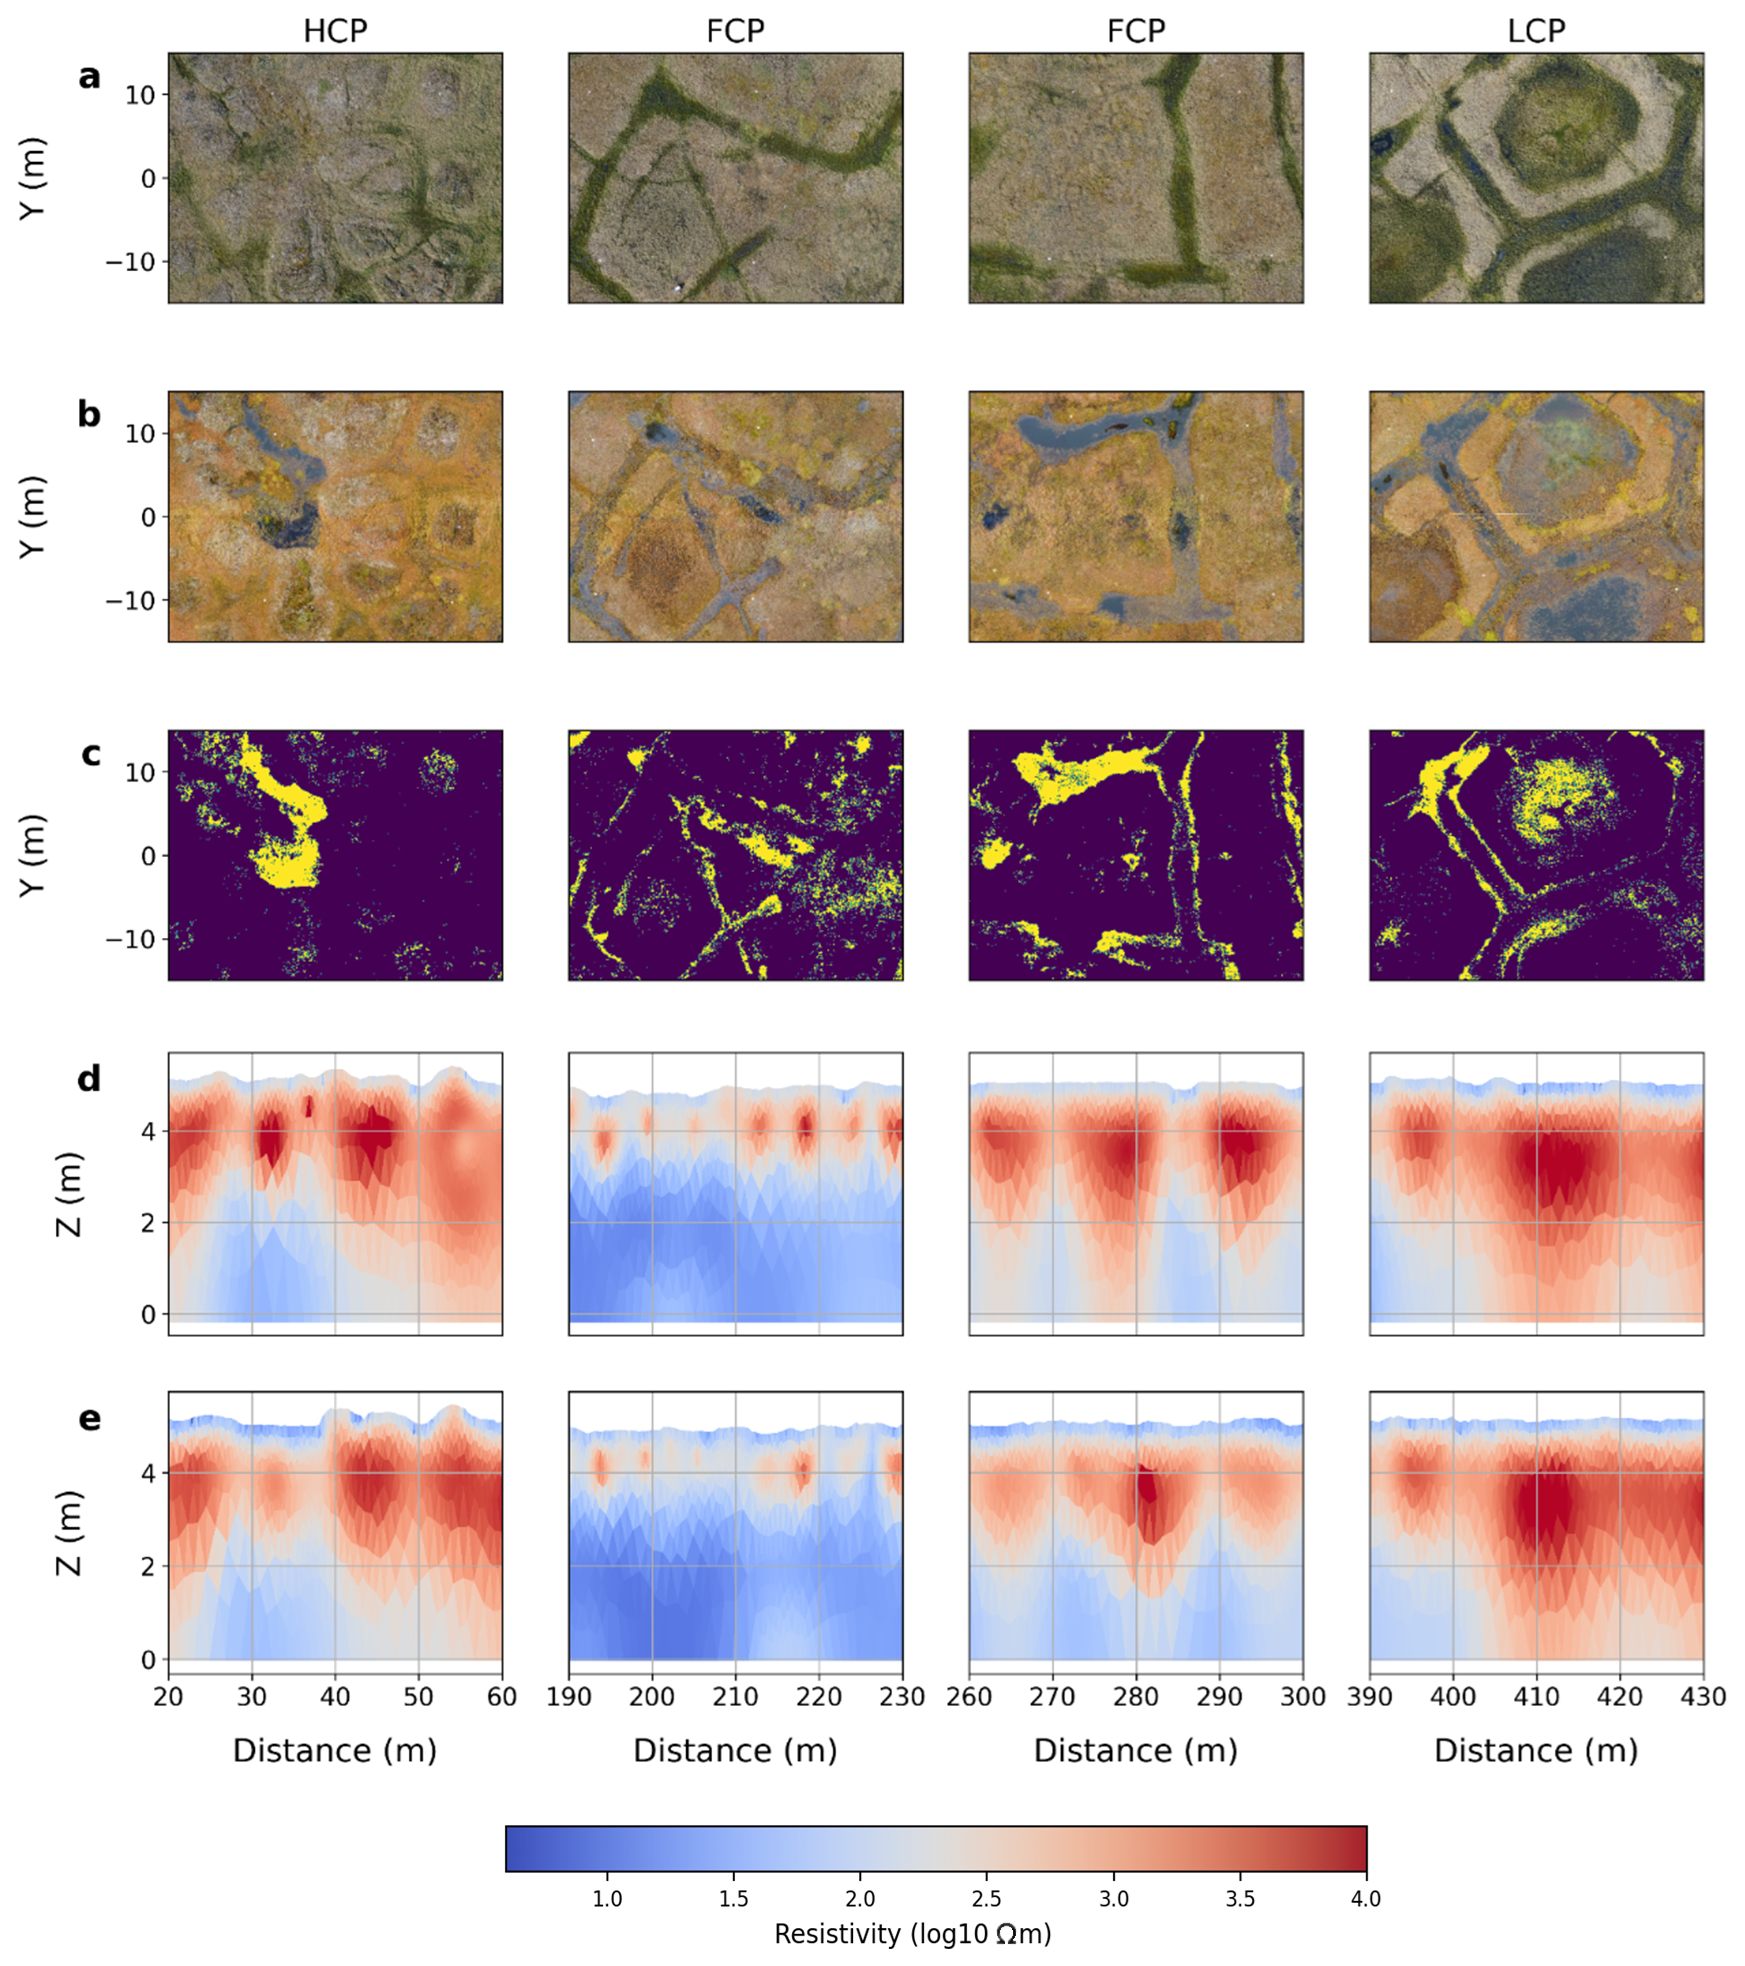
Figure 2Decadal changes in surface and subsurface properties in four areas. Datasets include (a) 2013 RGB orthomosaic, (b) 2023 RGB orthomosaic, (c) pool expansion (in yellow) based on the RGB orthomosaics and a random forest algorithm, (d) 2011 ERT, and (e) 2023 ERT. Note that field notes and visual observations indicate that the pool expansion in the center of LCP in (c) is a classification artifact, presumably due to the particularly complex, changing mixture of water, solids, moss, and sedge at this location.
3.2 Controls on Increased Surface Water, Thawing, and Subsidence
The observed decadal changes in surface water are accompanied by significant variations in active layer thickness and resistivity, which differ by polygon type (Fig. 1). Mann–Whitney U tests indicate significant increases in median active layer thickness over the study period in flat-centered polygons (p<0.001) and high-centered polygons (p=0.0491), but not in low-centered polygons (p=0.083) (Fig. 3; with additional statistical tests results in Table S1). These changes are consistent with the observations of stronger surface subsidence and decrease in permafrost table elevation in high-centered and flat-centered polygons than in low-centered polygons (Figs. 1 and 3).
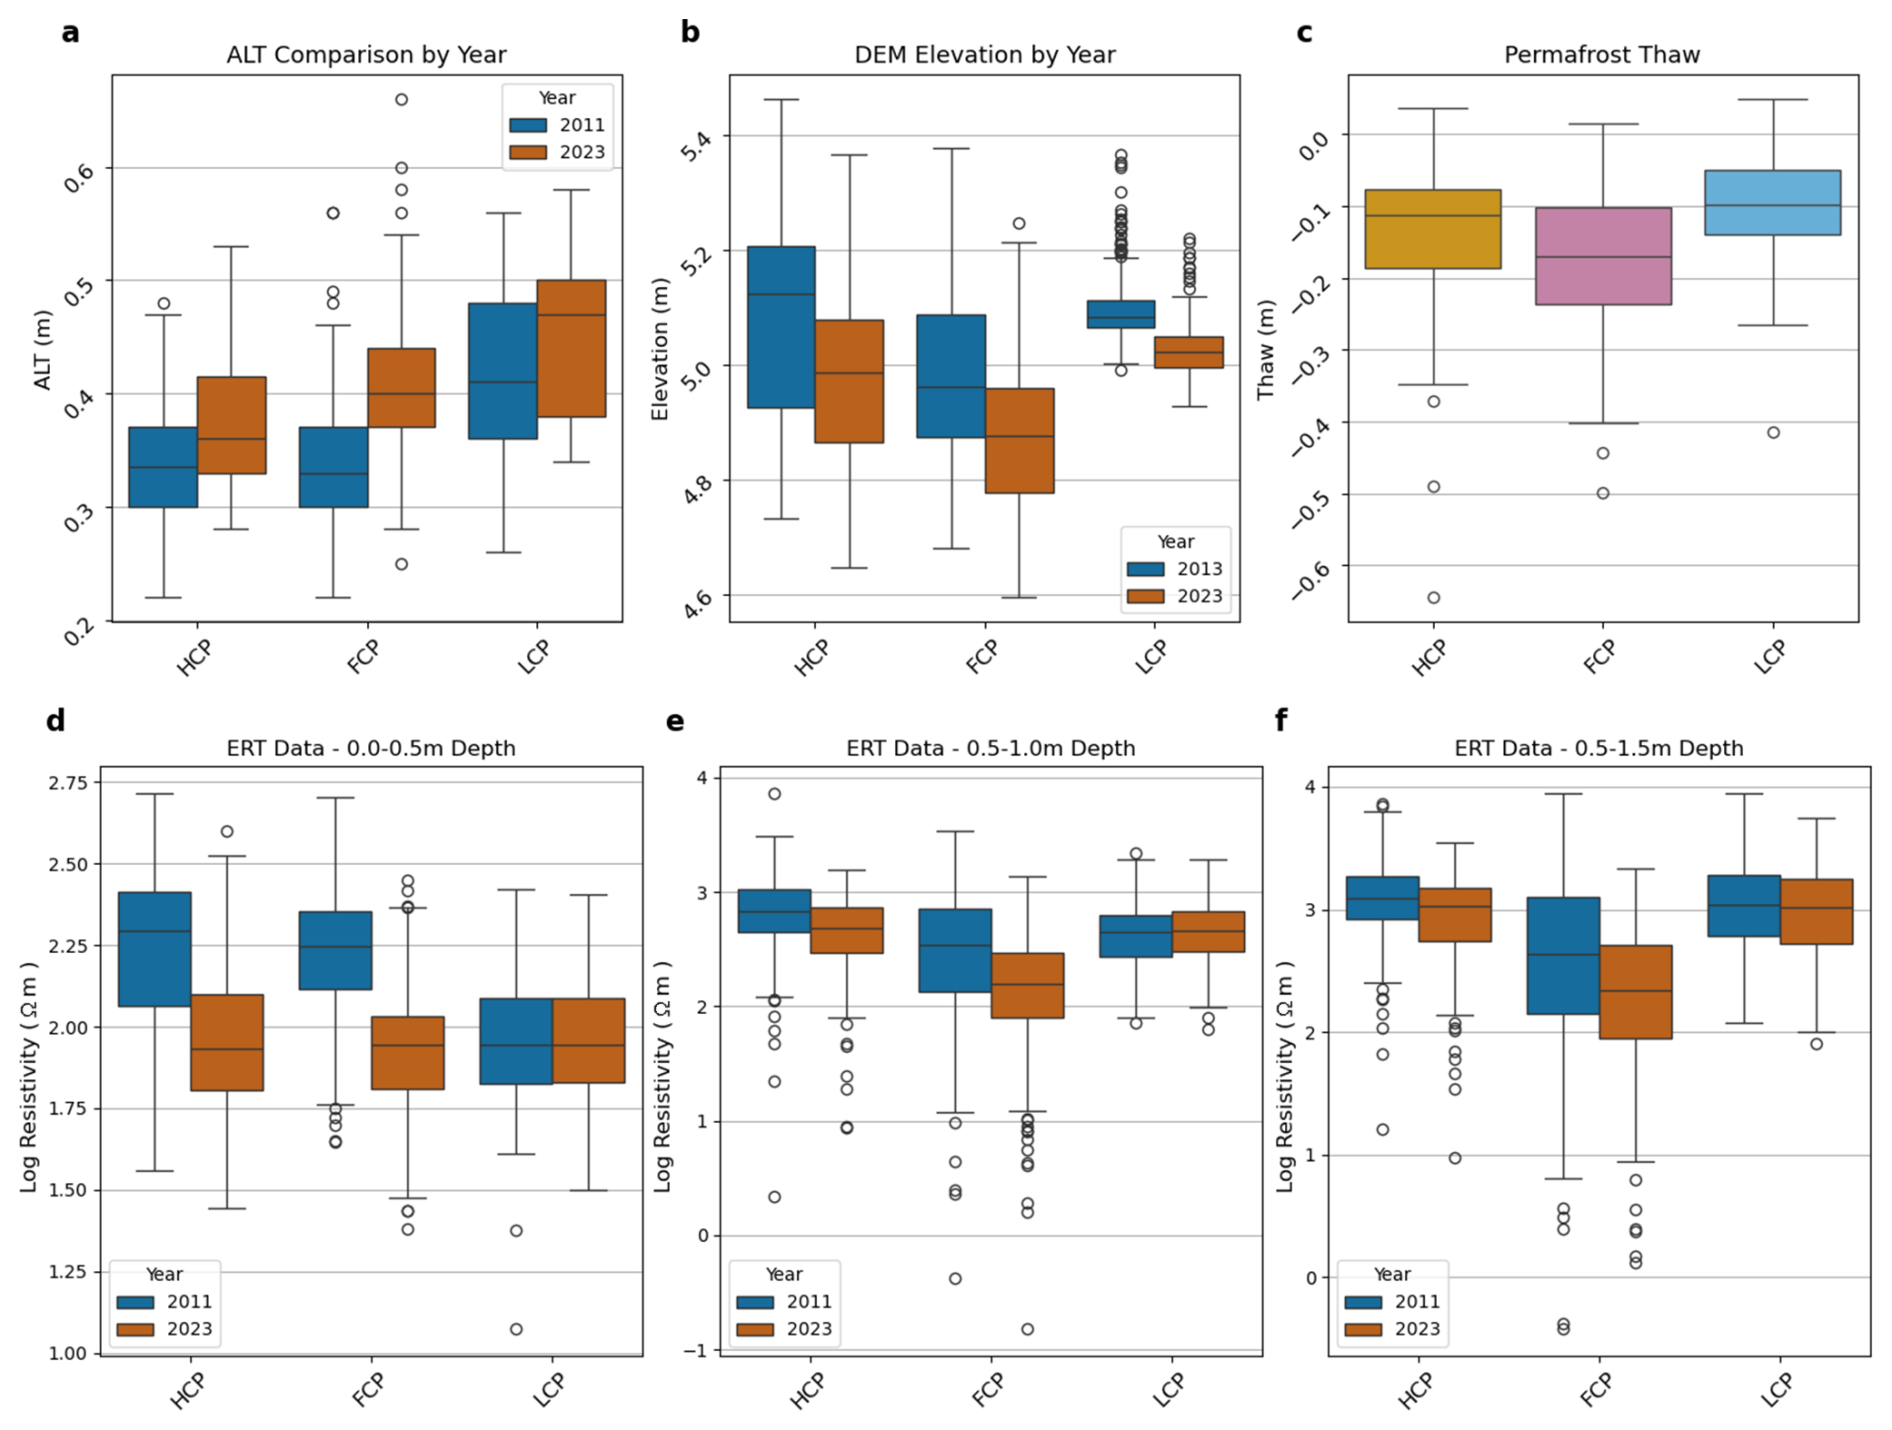
Figure 3Changes by polygon type (HCP = high-centered, FCP = flat-centered; LCP = low-centered): (a) Active layer thickness (ALT), (b) elevation, (c) permafrost thaw (defined as change in permafrost table elevation), and average resistivity for the (d) 0–0.5, (e) 0.5–1 and (f) 0.5–1.5 m depth interval. p-values from the Mann–Whitney U test comparing 2011 and 2023: (a) HCP: 0.049, FCP: <0.001, LCP: 0.083 (b) HCP: <0.001, FCP: <0.001, LCP: <0.001, (d) HCP: <0.001, FCP: <0.001, LCP: 0.749, (e) HCP: <0.001, FCP: <0.001, LCP: 0.316, and (f) HCP: <0.001, FCP: <0.001, LCP: 0.315. See Table S1 for additional statistical test results.
Electrical resistivity in the 0–0.5 and 0.5–1 m depth intervals decreased significantly in both high-centered and flat-centered polygon areas (p<0.001), consistent with a deepening of the active layer. This aligns with the expectation that, while the top organic layer may dry slightly during thaw, the overall volume of thawed material increases, with the lower portion of the thaw layer remaining wet due to ice melt and/or other hydrological processes (Dafflon et al., 2017; Rodenhizer et al., 2020; Tran et al., 2018). In contrast, no significant resistivity changes were observed in these depth intervals in the low-centered polygons area (p>0.3), corroborating a slower rate of permafrost degradation. Beyond the changes classified by polygon type (Fig. 3), visual inspection along the ERT transects (Figs. 1 and 2) indicates that while some large changes in resistivity are collocated with wide troughs and ice wedges, many others are associated with more subtle depressions or expressed diffusely across the landscape.
Though high- and flat-centered polygon areas both show relatively similar changes in active layer thickness, ground surface elevation, and surface water accumulation, the spatial patterns of these changes are distinct due to different subsurface structures. ERT and soil core data from the site show that the high-centered polygon area is characterized by large troughs relative to polygon diameter, a large volume of ice wedges beneath the troughs, and numerous ice veins throughout the polygons (Fig. 1c). This ice presumably originates from freshwater and is therefore more resistive compared to surrounding saline material (Dafflon et al., 2016). Such zones with large troughs and ice content have been identified as more prone to further degradation (Kanevskiy et al., 2017). Indeed, the newly formed pools in the high-centered polygons area observed in Fig. 2 shows surface characteristics similar to those reported at a different site (Figs. S12–S16 in Kanevskiy et al., 2017). Although the exact conditions that led to pool formation are unknown, Kanevskiy et al. (2017) reported that these features are typically triggered by an increase in active layer thickness during exceptionally warm and wet summers. Additionally, a snow survey across various polygon types at a nearby site found that high-centered polygons are associated with much higher spatial variability in snow depth than flat- and low-centered polygons (Wainwright et al., 2017), which could contribute to the particularly heterogeneous subsidence observed in the high-centered polygons area.
In contrast with the high-centered polygon area, the flat-centered polygon area exhibits smaller ice wedges beneath the troughs, less ice veins, ice-rich permafrost limited to shallow depths, and a strong salinity gradient with depth (Fig. 1c) (Dafflon et al., 2016). The smaller amount of ice in flat-centered polygon compared to high- and low-centered polygons areas may contribute to faster degradation as less latent heat must be absorbed. The relatively low amount and heterogeneity of ice-content in this area are also expected to constrain the magnitude and variability of subsidence. Our observations of subsidence, along with the fact that the topography is relatively flat, align closely with this conceptual model. The flat-centered polygon area shows relatively even subsidence across the area, with small changes occurring at many locations, including in trough, rim and center.
Finally, the low-centered polygon area shows less significant increases in active layer thickness, degradation, or subsidence. Low-centered polygons tend to have a large amount of surface water, and geophysical and soil core data tend to show that the low-centered polygon area has a greater ice-content than the flat-centered polygon. While their ice-content is more similar to high-centered polygon, the permafrost structure is more ataxitic with a lower presence of ice veins and ice wedges (Figs. 1c and 2) (Dafflon et al., 2016). The low-centered polygon landscape and subsurface structure appear to contribute to more stable conditions during the period of this study.
Overall, while this study does not attempt to fully disentangle the effects of surface water (dominant in low-centered polygons), microtopography-driven snow distribution, and the role of ice-rich material in latent heat and subsidence, the results demonstrate that subsidence occurs with varied patterns across the landscape, including varying intensity and unevenness. Spatially variable subsurface characteristics and thaw rates are key drivers of the amount and distribution of subsidence. In addition, the results of this study reinforce the conclusion of Kanevskiy et al. (2017) that understanding the contrast between degradation and stability across areas, and the associated evolution of the landscape, remains complex. This complexity remains a major challenge to understanding trajectories of ground stability and distribution of surface and subsurface water, processes that are essential for infrastructure management, land transition assessment, and the parameterization of Earth system models.
3.3 Challenges in Capturing Variability in Thermal and Hydrological Trajectories
The results of this study highlight the value of collecting independent datasets that capture above-ground, ground-surface, and subsurface properties to gain a comprehensive understanding of hydrological changes in permafrost systems. Multiple datasets are needed due to the complexity of geomorphological and hydrological changes occurring during permafrost degradation, as well as the uncertainties inherent in individual measurements, which may lead to misinterpretation when considered independently. For example, integrating thaw depth measurements with ground elevation changes for estimating permafrost degradation is crucial to avoid the underestimation of thaw rates, ice volume loss, and soil mass loss (Rodenhizer et al., 2020). In the present study, where decadal changes in thaw depth are expected to be limited compared to lower latitudes where both permafrost and air temperatures are warmer, measuring variation in topography has still proven to be important for capturing small changes that may accelerate as ice melts. Subsidence is consistent with variations in thaw depth when averaged across the various polygon types, but they are not strongly correlated across each individual point due to the heterogeneity of ice content and thaw rates. Overall, the convolution of spatially varying thaw rates and ice content creates large heterogeneity in hydrological and topographic changes.
Capturing fine-scale elevation and its temporal changes to estimate subsidence and changes in permafrost table elevation in Arctic permafrost environments poses significant challenges, particularly concerning uncertainty and accuracy. In-field assessment of ground surface elevation is complicated by the presence of a soft organic layer with highly variable water content and a poorly defined transition between the peat layer and vegetation (e.g., dwarf shrubs, graminoids, and mosses). The presence of surface water poses an additional challenge, and these factors together give rise to considerable uncertainty in locating ground-based measurements, which typically use the ground surface as a reference point. An additional source of uncertainty in ground elevation between repeated surveys arises from potential inaccuracies in the RTK base station coordinates, which are difficult to detect in evolving landscapes and can introduce a constant shift across the dataset. This uncertainty makes relative changes easier to interpret than absolute differences. Caution in acquiring and interpreting elevation measurements is especially critical in contexts like this study, where small spatial and temporal variations in ground surface elevation have a major impact on surface and subsurface hydrology. Overall, ground elevation and its associated uncertainty affect many data products, including ground subsidence, permafrost table elevation, topographic metrics (e.g., surface flow lines), and the comparability of time-lapse ERT datasets. In high-resolution ERT surveys, accounting for topographic variation complicates data comparison over time due to differences in surface conditions, inversion meshes, and the associated regularization and convergence processes.
The above-mentioned complexity underscores the importance of developing strategies to manage uncertainties as effectively as possible, and bridging temporal and spatial scales in coverage and resolution. While sporadic above- and below-ground surveys such as those conducted here are valuable for model evaluation and satellite data product development, their interpretation requires careful consideration of seasonal and interannual variability, as well as the limited spatial coverage that constrains their representativeness across the Arctic. Our study draws on datasets from years that align relatively closely with the long-term fitted trend in active layer thickness at the nearby Utqiagvik Circumpolar Active Layer Monitoring (CALM) site (Figs. S2 and S3). Results may differ, and the detection of broader trends can be limited if one of the acquisitions is conducted during an exceptionally warm or cold year. Improving the temporal resolution and associated understanding in subsurface variables, such as using CALM or other monitoring networks data, is highly valuable to weigh in inter-annual variability. Merging sporadic surveys with temporally continuous measurements is also becoming increasingly feasible due to the growing availability and affordability of autonomous instrumentation (Dafflon et al., 2017; Wielandt et al., 2023), as well as community efforts in discussing best practices in data acquisition, including for ERT (Herring et al., 2023). Further, due to increase in resolution, satellite imagery may become well-suited for integration with ground-based data to facilitate scaling while possibly better capturing changes in shallow surface water distribution with more surveys conducted under similar conditions of water color, turbidity, and vegetation cover (Abolt et al., 2024). The results of this study advocate for further integration of multiple datasets across a range of scales to improve the understanding of controls on pool formation and drying, assess changes in permafrost table elevation and ice content, and disentangle the impact of thawing mechanisms on water distribution from changes in lateral inputs caused by rerouted surface flow.
This study documents changes occurring within polygonal tundra landscapes over a decadal timescale in Utqiaġvik, Alaska. Our findings demonstrate that changes in surface water distribution occur and are closely linked to subsidence, permafrost thaw, and decreased permafrost resistivity. Additionally, more intense thaw and ice loss is observed in high- and flat-centered polygons than in low-centered polygons. The observed expansion of thermokarst pools and trough widening illustrates how permafrost thaw can trigger local ground subsidence, a primary control on infrastructure hazards, landscape change, and methane emissions. Yet, studies from sites with a wide range of geological history and environmental conditions are needed to improve the predictability of such changes and their implications. The results support the need for future studies that characterize the small- to large-scale feedback mechanisms associated with permafrost thaw. Also, this study underscores the importance of combining multiple data products to capture the intensity and spatial heterogeneity of subsidence and its controls. Such insights are essential for refining models that simulate Arctic ecosystem responses to a warming climate, ultimately improving our understanding of how permafrost thaw contributes to changes in global carbon and water cycling.
The 2023 survey, 2011 ERT, and 2013 UAV datasets presented in this study have been submitted to the ESS-DIVE repository at https://doi.org/10.15485/2564382 (Dafflon et al., 2025b), https://data.ess-dive.lbl.gov/view/doi:10.5440/1233229 (Dafflon et al., 2025a), and https://doi.org/10.5440/1177858 (Dafflon et al., 2015), respectively.
The supplement related to this article is available online at https://doi.org/10.5194/tc-19-5499-2025-supplement.
BD, CU and JL planned this study and collected the various datasets in 2011, 2013, and 2023. JB and BD analyzed the datasets and prepared the manuscript. JL and NT reviewed the manuscript. All authors contributed to the study and approved the final version of the paper.
The contact author has declared that none of the authors has any competing interests.
Publisher's note: Copernicus Publications remains neutral with regard to jurisdictional claims made in the text, published maps, institutional affiliations, or any other geographical representation in this paper. While Copernicus Publications makes every effort to include appropriate place names, the final responsibility lies with the authors. Views expressed in the text are those of the authors and do not necessarily reflect the views of the publisher.
This article is part of the special issue “Emerging geophysical methods for permafrost investigations: recent advances in permafrost detecting, characterizing, and monitoring”. It is not associated with a conference.
We thank UIC Science for their guidance and for allowing us to conduct our research on the traditional homelands of the Iñupiat. We thank the CALM program and community for making data publicly available. The authors also thank NOAA for the atmospheric data used in this study. We thank Robin Thibault for support on using pygimli library. This material is based upon work supported by Next-Generation Ecosystem Experiments (NGEE Arctic) funded by the U.S. Department of Energy Office of Science Office of Biological and Environmental Research (award no. DE-AC02-05CH11231).
The Next Generation Ecosystem Experiment (NGEE) Arctic project is supported by the Office of Biological and Environmental Research in the U.S. Department of Energy's Office of Science (award no. DE-AC02-05CH11231).
This paper was edited by Ylva Sjöberg and reviewed by Kamini Singha and one anonymous referee.
Abolt, C. J., Atchley, A. L., Harp, D. R., Jorgenson, M. T., Witharana, C., Bolton, W. R., Schwenk, J., Rettelbach, T., Grosse, G., Boike, J., Nitze, I., Liljedahl, A. K., Rumpca, C. T., Wilson, C. J., and Bennett, K. E.: Topography controls variability in circumpolar permafrost thaw pond expansion, J. Geophys. Res.-Earth Surf., 129, e2024JF007675, https://doi.org/10.1029/2024JF007675, 2024.
Bisht, G., Riley, W. J., Wainwright, H. M., Dafflon, B., Yuan, F., and Romanovsky, V. E.: Impacts of microtopographic snow redistribution and lateral subsurface processes on hydrologic and thermal states in an Arctic polygonal ground ecosystem: a case study using ELM-3D v1.0, Geosci. Model Dev., 11, 61–76, https://doi.org/10.5194/gmd-11-61-2018, 2018.
Brown, J.: Ionic concentration gradients in permafrost, Barrow, Alaska, Cold Regions Research and Engineering Laboratory (U.S.), https://erdc-library.erdc.dren.mil/server/api/core/bitstreams/81b728f8-7d5b-4ef8-e053-411ac80adeb3/content (last access: 30 October 2025), 1969.
Dafflon, B., Peterson, J., Ulrich, C., and Hubbard, S.: Low-altitude remote sensing dataset of DEM and RGB mosaic for AB corridor on July 13 2013 and L2 corridor on July 21 2013, Utqiagvik (Barrow), Alaska, Next-Generation Ecosystem Experiments (NGEE) Arctic, ESS-DIVE repository [data set], https://doi.org/10.5440/1177858, 2015.
Dafflon, B., Hubbard, S., Ulrich, C., Peterson, J., Wu, Y., Wainwright, H., and Kneafsey, T. J.: Geophysical estimation of shallow permafrost distribution and properties in an ice-wedge polygon-dominated Arctic tundra region, Geophysics, 81, WA247–WA263, https://doi.org/10.1190/geo2015-0175.1, 2016.
Dafflon, B., Oktem, R., Peterson, J., Ulrich, C., Tran, A. P., Romanovsky, V., and Hubbard, S. S.: Coincident aboveground and belowground autonomous monitoring to quantify covariability in permafrost, soil, and vegetation properties in Arctic tundra, Journal of Geophysical Research: Biogeosciences, https://doi.org/10.1002/2016jg003724, 2017.
Dafflon, B., Hubbard, S., Peterson, J., and Ulrich, C.: Electrical resistivity tomography, electromagnetic data, and permafrost cores acquired near Utqiagvik, Alaska, 2011–2015, Next-Generation Ecosystem Experiments (NGEE) Arctic, ESS-DIVE repository [data set], https://data.ess-dive.lbl.gov/view/doi:10.5440/1233229, 2025a.
Dafflon, B., Ulrich, C., Lamb, J., and Bachman, J.: Topography, surface water distribution and subsurface structure in 2023 across an Arctic coastal tundra site near Utqiagvik, Alaska, Next-Generation Ecosystem Experiments (NGEE) Arctic, ESS-DIVE repository [data set], https://doi.org/10.15485/2564382, 2025b.
Farquharson, L. M., Romanovsky, V. E., Kholodov, A., and Nicolsky, D.: Sub-aerial talik formation observed across the discontinuous permafrost zone of Alaska, Nat. Geosci., 15, 475–481, 2022.
Herring, T., Lewkowicz, A. G., Hauck, C., Hilbich, C., Mollaret, C., Oldenborger, G. A., Uhlemann, S., Farzamian, M., Calmels, F., and Scandroglio, R.: Best practices for using electrical resistivity tomography to investigate permafrost, Permafrost Periglacial Processes, 34, 494–512, 2023.
Hinkel, K. M., Doolittle, J. A., Bockheim, J. G., Nelson, F. E., Paetzold, R., Kimble, J. M., and Travis, R.: Detection of subsurface permafrost features with ground-penetrating radar, Barrow, Alaska, Permafrost Periglacial Processes, 12, 179–190, 2001.
Jorgenson, M. T., Shur, Y. L., and Pullman, E. R.: Abrupt increase in permafrost degradation in Arctic Alaska, Geophys. Res. Lett., 33, https://doi.org/10.1029/2005gl024960, 2006.
Kanevskiy, M., Shur, Y., Jorgenson, T., Brown, D. R. N., Moskalenko, N., Brown, J., Walker, D. A., Raynolds, M. K., and Buchhorn, M.: Degradation and stabilization of ice wedges: Implications for assessing risk of thermokarst in northern Alaska, Geomorphology (Amst.), 297, 20–42, 2017.
Kokelj, S. V. and Jorgenson, M. T.: Advances in thermokarst research, Permafrost Periglacial Processes, 24, 108–119, 2013.
Koven, C. D., Ringeval, B., Friedlingstein, P., Ciais, P., Cadule, P., Khvorostyanov, D., Krinner, G., and Tarnocai, C.: Permafrost carbon-climate feedbacks accelerate global warming, Proc. Natl. Acad. Sci. U. S. A., 108, 14769–14774, 2011.
Lara, M. J., McGuire, A. D., Euskirchen, E. S., Genet, H., Yi, S., Rutter, R., Iversen, C., Sloan, V., and Wullschleger, S. D.: Local-scale Arctic tundra heterogeneity affects regional-scale carbon dynamics, Nat. Commun., 11, 4925, https://doi.org/10.1038/s41467-020-18768-z, 2020.
Li, Y., Xue, Y., Roy Chowdhury, T., Graham, D. E., Tringe, S. G., Jansson, J. K., and Taş, N.: Genomic insights into redox-driven microbial processes for carbon decomposition in thawing Arctic soils and permafrost, mSphere, 9, e0025924, https://doi.org/10.1128/msphere.00259-24, 2024.
Mackay, J. R.: Thermally induced movements in ice-wedge polygons, western Arctic coast: A long-term study, Geographie Physique Et Quaternaire, 54, 41–68, 2000.
Rantanen, M., Karpechko, A. Y., Lipponen, A., Nordling, K., Hyvärinen, O., Ruosteenoja, K., Vihma, T., and Laaksonen, A.: The Arctic has warmed nearly four times faster than the globe since 1979, Commun. Earth Environ., 3, https://doi.org/10.1038/s43247-022-00498-3, 2022.
Rodenhizer, H., Ledman, J., Mauritz, M., Natali, S. M., Pegoraro, E., Plaza, C., Romano, E., Schädel, C., Taylor, M., and Schuur, E.: Carbon Thaw Rate Doubles When Accounting for Subsidence in a Permafrost Warming Experiment, Journal of Geophysical Research: Biogeosciences, 125, e2019JG005528, https://doi.org/10.1029/2019JG005528, 2020.
Rücker, C., Günther, T., and Wagner, F. M.: pyGIMLi: An open-source library for modelling and inversion in geophysics, Comput. Geosci., 109, 106–123, 2017.
Shiklomanov, N.: Thaw depth measurements from the Circumpolar Active Layer Monitoring (CALM) project for site “Barrow, CRREL Plots” (U2), Alaska North Slope, United States, Alaska (1962–2023), Arctic Data Center, https://doi.org/10.18739/A27940W32, 2023.
Shiklomanov, N. I., Streletskiy, D. A., Little, J. D., and Nelson, F. E.: Isotropic thaw subsidence in undisturbed permafrost landscapes, Geophys. Res. Lett., 40, 6356–6361, 2013.
Shur, Y., Jones, B. M., Jorgenson, M. T., Kanevskiy, M. Z., Liljedahl, A., Walker, D. A., Ward Jones, M. K., Fortier, D., and Vasiliev, A.: Formation of low-centered ice-wedge polygons and their orthogonal systems: A review, Geosciences (Basel), 15, 249, https://doi.org/10.3390/geosciences15070249, 2025.
Streletskiy, D. A., Shiklomanov, N. I., Little, J. D., Nelson, F. E., Brown, J., Nyland, K. E., and Klene, A. E.: Thaw subsidence in undisturbed tundra landscapes, barrow, Alaska, 1962–2015, Permafrost Periglacial Processes, 28, 566–572, 2017.
Tarnocai, C., Canadell, J. G., Schuur, E. A. G., Kuhry, P., Mazhitova, G., and Zimov, S.: Soil organic carbon pools in the northern circumpolar permafrost region, Global Biogeochem. Cycles, 23, https://doi.org/10.1029/2008gb003327, 2009.
Tran, A. P., Dafflon, B., Bisht, G., and Hubbard, S. S.: Spatial and temporal variations of thaw layer thickness and its controlling factors identified using time-lapse electrical resistivity tomography and hydro-thermal modeling, J. Hydrol., 561, 751–763, 2018.
Wainwright, H. M., Dafflon, B., Smith, L. J., Hahn, M. S., Curtis, J. B., Wu, Y., Ulrich, C., Peterson, J. E., Torn, M. S., and Hubbard, S. S.: Identifying multiscale zonation and assessing the relative importance of polygon geomorphology on carbon fluxes in an Arctic tundra ecosystem, Journal of Geophysical Research: Biogeosciences, 120, 788–808, 2015.
Wainwright, H. M., Liljedahl, A. K., Dafflon, B., Ulrich, C., Peterson, J. E., Gusmeroli, A., and Hubbard, S. S.: Mapping snow depth within a tundra ecosystem using multiscale observations and Bayesian methods, The Cryosphere, 11, 857–875, https://doi.org/10.5194/tc-11-857-2017, 2017.
Wielandt, S., Uhlemann, S., Fiolleau, S., and Dafflon, B.: TDD LoRa and Delta Encoding in Low-Power Networks of Environmental Sensor Arrays for Temperature and Deformation Monitoring, J. Signal Process. Syst., 1–13, https://doi.org/10.1007/s11265-023-01834-2, 2023.
Wu, Y., Ulrich, C., Kneafsey, T., Lopez, R., Chou, C., Geller, J., McKnight, K., Dafflon, B., Soom, F., Peterson, J., and Hubbard, S. S.: Depth-Resolved Physicochemical Characteristics of Active Layer and Permafrost Soils in an Arctic Polygonal Tundra Region, Journal of Geophysical Research: Biogeosciences, 123, 1366–1386, 2018.