the Creative Commons Attribution 4.0 License.
the Creative Commons Attribution 4.0 License.
 | 04 Nov 2025
Snow particle motion in process of cornice formation
Hongxiang Yu
Benjamin Walter
Jianping Huang
Ning Huang
Snow cornices are a common snow pattern in cold regions, and their fracture and collapse can easily trigger avalanches. Despite numerous observations and experimental simulations on their formation process, the microscopic mechanism of their initial stage of formation remains unclear. In this paper, based on wind-tunnel experiments and high-speed photography, experimental studies on the trajectory of particles surrounding the snow cornice were carried out. The experiment results reveal the distinct differences in particle size, impact velocity, and impact angle between the surface and edge of a cornice. The findings show that edge-deposited particles are generally smaller and more dendritic, attaching mainly through low-velocity saltation and mechanical interlocking, while surface deposition is dominated by larger and faster particles. The different probability distributions of impacting velocities and angles in these two regions are attributed to variations in airflow and local cornice topography. Both surface and edge regions, however, exhibit a characteristic vertical impact velocity threshold of 2–2.5 m s−1, which is the dominant parameter governing particle adherence or rebound. A static adhesion model incorporating particle morphology parameters for edge deposition was developed and experimentally validated, confirming its effectiveness in predicting the influence of particle size and shape on adhesion thresholds. Overall, this research reveals the micro-dynamics underlying initial cornice growth, providing a theoretical basis for avalanche modeling and infrastructure protection in alpine environments, as well as offering a methodological and mechanical framework for studying snow and ice adhesion in both natural and engineered systems.
- Article
(3401 KB) - Full-text XML
- Companion paper
- BibTeX
- EndNote


Snow consists of ice crystals. Snow particles may adhere to the surface at particle-bed collision. Therefore, wind can shape the snow cover and produce special patterns by redistributing snow over various areas, such as sastrugi, snow dunes (Sommer et al., 2018b), and snow cornices (Seligman et al., 1936). Snow cornice is one of the naturally formed accumulation patterns in cold mountain regions. Their collapse may induce snow avalanches (Vogel et al., 2012).
Previous field observations have consistently shown that the optimal wind speed range for cornice formation lies between one and two times the threshold wind speed (Vogel et al., 2012; Eckerstorfer et al., 2013; Hancock et al., 2020). Recently, wind-tunnel experiments have further shown that cornice growth is maximized when the wind speed exceeds the threshold value by 40 % (Yu et al., 2023). However, the micro-mechanism for particle adhesion to the cornice edge has not been studied in detail, due to the difficulty in observing the formation process at the particle scale.
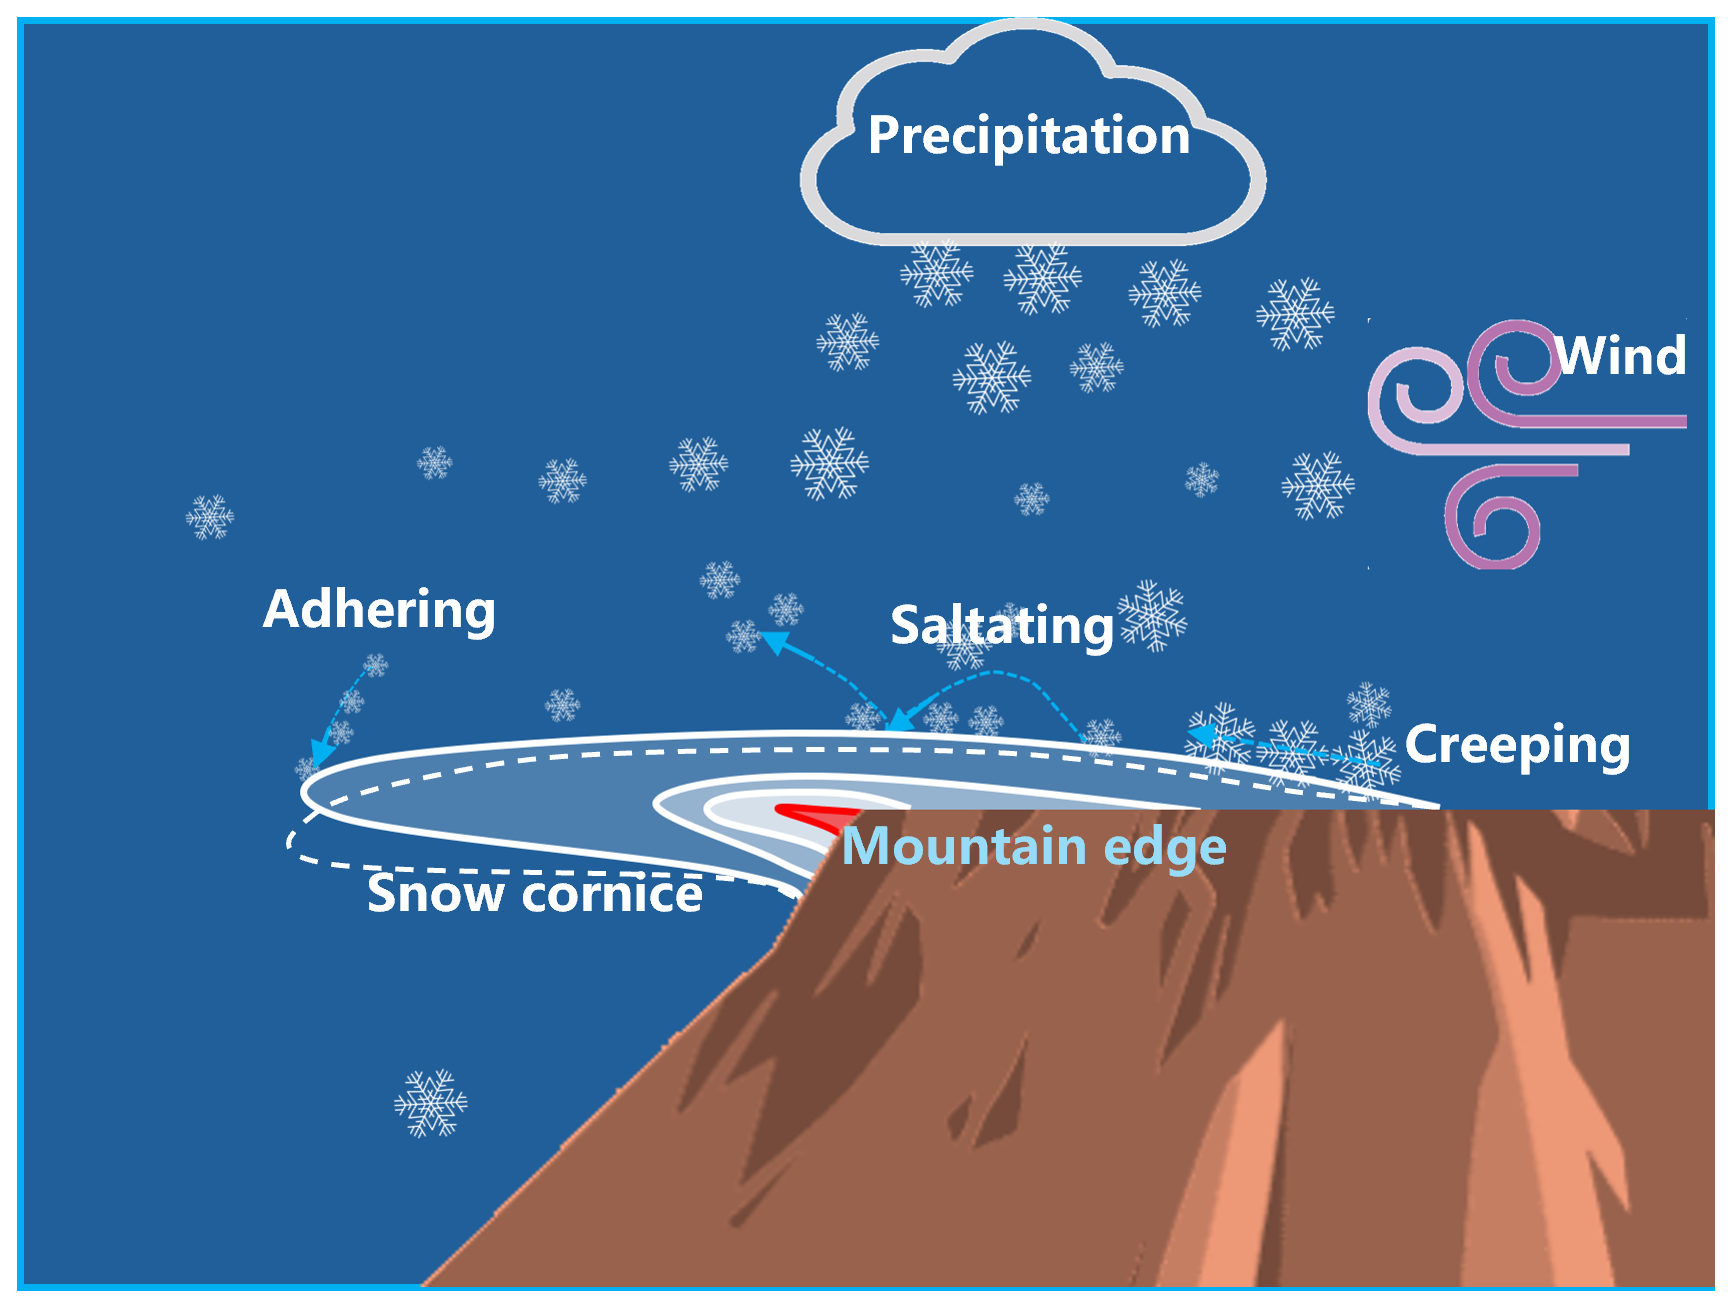
The growth of a snow cornice can be divided into several stages (Montagne, 1980; Vogel et al., 2012; Eckerstorfer et al., 2013). In the initial stage, a thin slab forms at the mountain edge (highlighted in red in Fig. 1), mainly by adhesion of wind-transported snow particles. When more snow accumulates on the relatively flat surface above the edge, it can gradually be conveyed toward the slab tip – especially via wind-transported particles – thereby increasing the thickness at the cornice root. This sustained supply of snow from the platform region plays a key role in the transformation of a small slab into a fully developed cornice in nature. In the subsequent stage, repeated deposition from intermittent drifting and precipitation successively adds new layers of snow to the cornice. This layer-by-layer accumulation is accompanied by a gradual increase in both length and thickness of the cornice. As the cornice grows larger, the overhanging mass of snow is increasingly influenced by gravitational forces, which may cause it to bend downward (shown in the white dashed line in Fig. 1) and promote internal compaction near the edge. Eventually, when the cornice becomes too large and shear stress exceeds a critical threshold, it breaks off and collapses. The evolution of a wedge-shaped cornice – from initial slab formation to subsequent snow accumulation on the flat surface – has been experimentally investigated in our previous work (Yu et al., 2023), with particular focus on the relationship between cornice growth rate and air mass transport. However, the specific mechanisms governing the very initial stage, that is, how airborne snow particles first adhere and accumulate to form the small slab at the edge, remain unexplored.
Previous field studies (Vogel et al., 2012; Eckerstorfer et al., 2013; van Herwijnen and Fierz, 2014; Hancock et al., 2020) mainly focused on the morphological variation, constrained by the limitations of observation equipment, making it difficult to observe how particles adhere to the mountain edges. Currently, there are several hypotheses on how snow particles adhere at the edge: Irregularly-shaped snow particles interlock with each other by their dendrites (Seligman et al., 1936); Charged snow particles are attracted by the strong electric field above the snow cornice surface (Latham and Montagne, 1970); Pressure melt and frictional heat (Latham and Montagne, 1970) when particles contact other surfaces leads to a quasi-liquid layer facilitating fast sintering. However, the mechanism behind the wedge-shaped (Seligman et al., 1936) snow cornice has not yet been investigated.
Cornice growth is often accompanied by drifting snow (Eckerstorfer et al., 2013; Yu et al., 2023), in which a snow particle saltation layer exists. Drifting snow particles move in three modes, namely, creep, saltation, and suspension, with the first two modes contributing most to snow mass transport (Bagnold, 2012). When snow particles collide with the surface, three processes may occur: (1) Rebound occurs when a portion of particle kinematic energy is lost, but may rebound from the surface; (2) Deposition occurs when the particle loses all its kinematic energy upon impact with the ground; (3) Eject occurs when the particle transfers the kinematic energy to other particles on the ground upon impact with surface, resulting in the entrainment of other particles resting on the surface.
During particle-surface collision, the particles transfer momentum and energy from the air to the surface. These processes are characterized using rebound and splash functions based on theoretical models (Lämmel et al., 2017; Comola and Lehning, 2017) or observations (Anderson and Haff, 1991). Particle impact velocity and impact angle (Walter et al., 2024) are two critical factors influencing key processes such as rebounding, deposition, and splashing. These parameters play a significant role in determining how particles interact with surfaces upon collision. However, the specific method by which particle impact velocity and impact angle influence particle adhesion, particularly in the context of snow cornice formation, remains poorly understood. Thus, investigation is needed to clarify the relationship between these impact parameters and the adhesion mechanisms.
Here, we carry out a wind-tunnel experiment of cornice formation, focusing on particle trajectory and adhesion process in snow cornice formation. Based on the experimental results, we investigate the micro-physical mechanism for cornice formation.
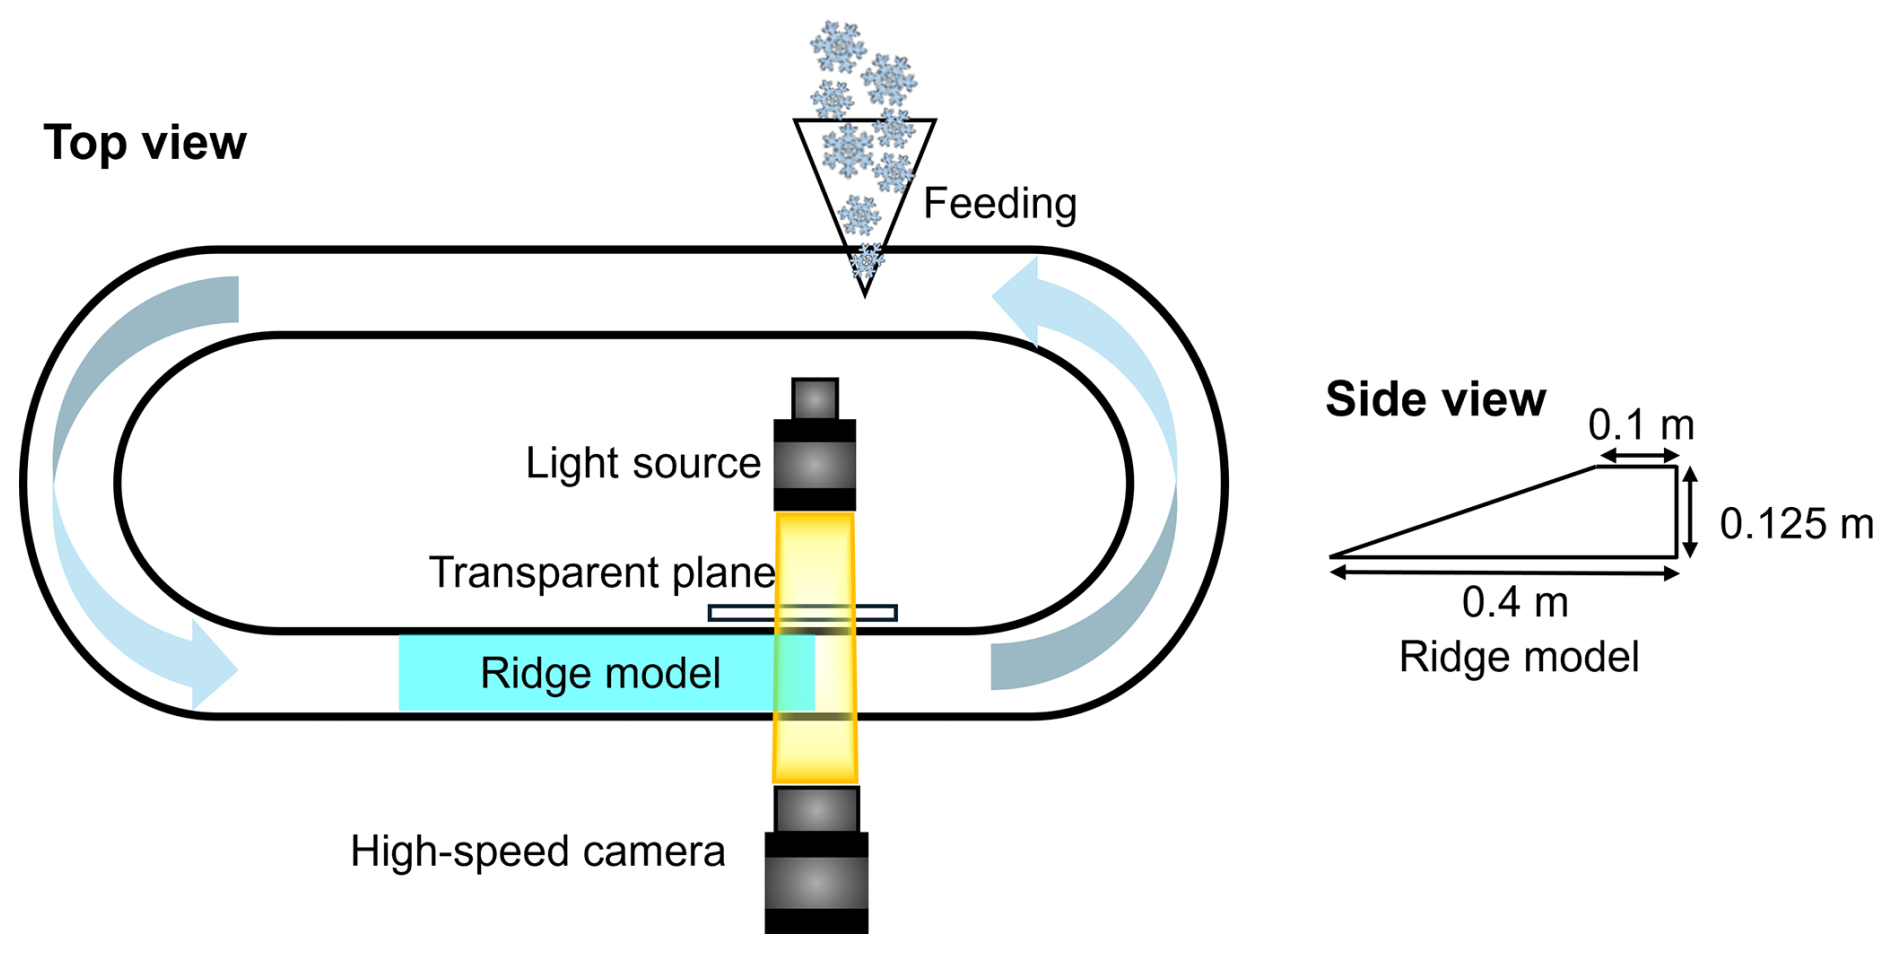
The wind-tunnel experiments are carried out in a ring wind tunnel in the cold lab of the WSL Institute for Snow and Avalanche Research, in Davos, Switzerland. The experiment setup is shown in Fig. 2. The working section of the wind tunnel is 1 m in length, with a cross-section area of 0.2 m (width) × 0.5 m (height), and has been successfully used for several drifting snow experiments (Wahl et al., 2024; Walter et al., 2024; Yu et al., 2023; Sommer et al., 2017, 2018a). Further details of the wind tunnel can be found in Yu et al. (2023). For tracing particle trajectories, a high-speed camera system is deployed. A feeding system is used to supply snow particles. The feeding rate of snow particles is manually kept stable. The snow particles are produced by a snow maker (Schleef et al., 2014). The geometrical diameters are 300–500 µm, and the shape of the snow crystals is dendritic, visually analyzed under a microscope. The room temperature of the cold lab is controlled and set at −5 °C, and the wind speed is kept at 4 m s−1. The wind speed inside the wind tunnel is nearly uniform with a very thin (around 2 cm) boundary layer (Sommer et al., 2017; Yu et al., 2023). A ridge model with a fixed size (height 0.125 m, total length 0.4 m, flat surface length 0.1 m) is built with compacted snow before each experiment, and its side view is shown in Fig. 2.
Before conducting the experiment, we performed preliminary tests on both fresh snow particles and aged snow particles. Fresh snow particles, characterized by their highly dendritic shapes, were compared to decomposed snow particles, which are characterized by small, rounded shapes after being stored for several days at a constant temperature of °C. The results show that both types of snow particles are capable of forming a snow cornice. However, fresh snow particles exhibit a significantly higher propensity for cornice formation and are much easier to consolidate into a stable structure. Therefore, fresh snow particles were used in the subsequent experiments.
The high-speed camera system consists of a high-speed camera (Phantom VEO710), an LED lamp as a light source, and a transparent plane positioned at the opposite side of the camera to diffuse the light source and achieve uniform illumination. The system is employed for shadowgraphy analysis. The shadowgraphy is a technique used for extracting the moving particle's size, velocity, and trajectory. It is similar to PTV (particle tracking velocimetry) (Baek and Lee, 1996; Tagliavini et al., 2022), which has the same algorithms for particle information, and it has been frequently used in recent snow-related studies, for its advantages in robustness, non-intrusiveness, and accessibility. Shadowgraphy is particularly suitable for tracking snow particles, which are partially transparent and irregular in shape. It has been successfully applied to measuring particle mass flux, velocity, and size distribution (Paterna et al., 2016; Walter et al., 2024). The sampling frequency of the camera is set as 3 kHz, corresponding to a time interval of 333.32 µs. A total of 18 repeated individual experiments were conducted under the same experimental conditions. Each experiment lasted 4–5 s and produced 12 455 images of particle trajectories. The duration of each case was limited by the camera memory. A sequence of the different growth steps is illustrated in Fig. 3a of Yu et al. (2023). Here we only concentrate on the initial stage of snow cornice growth, where particles accumulate at the edge to form a thin slab on the leeward side of the ridge model. After the images are obtained, particle-bed collision events are selected visually. Then, particle sizes and trajectories in these events are analysed by image processing as follows.
2.1 Particle recognition
The gray value of the snow cornice base is much higher than that of airborne snow particles. Thus, the images are first transferred into binary format by the two threshold gray values to recognize both the snow cornice base and airborne snow particles. The cornice zone is detected according to the first threshold gray value. The airborne snow particles are then detected according to the second threshold gray value after extracting the cornice from the image.
Particle size as recognized by the first-time binary analysis using the second threshold gray value is normally smaller than its real size, as shown in Fig. 3a–b. To compensate for the underestimated particle areas caused by binarization, a dilation process (Gonzalez and Woods, 2017) is applied after the binarization, which fills the small spaces around the snow particle and smooths the particle's boundary, as depicted in Fig. 3c and its zoomed-in counterpart in Fig. 3d.
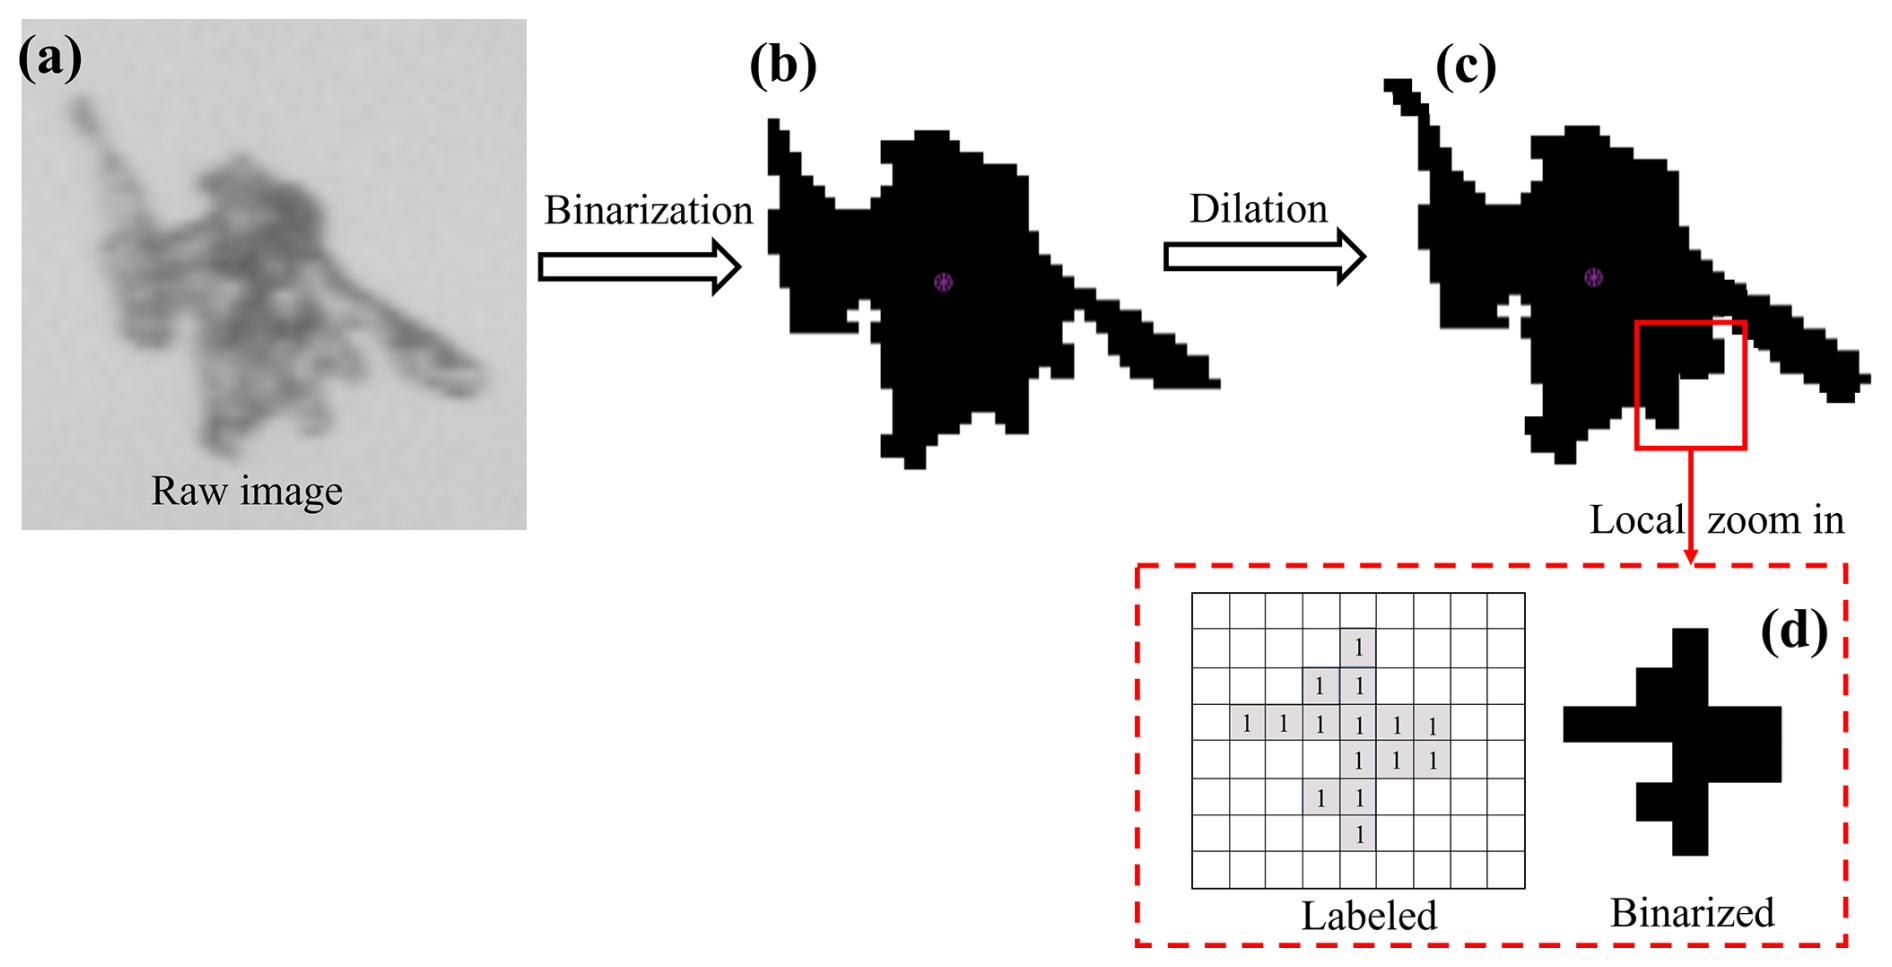
To distinguish the noise points from air-flow snow particles, opening and closing processes (Solomon and Breckon, 2011) are then operated. The opening process eliminates very fine objects (noise points) and smooths the snow cornice boundary, and the closing process corrects the image such as filling the tiny empty holes inside of the snow particles.
After the above image pre-processing, particle recognition is carried out by using the Seed-Filling Algorithm (SFA). SFA is an algorithm used to fill closed regions in an image. It starts from a seed point and gradually fills the regions adjacent to it with the same color until the boundary is reached. Snow particle area is calculated based on the connected component label analysis (CCLA), a common image processing method for connecting the adjacent foreground pixels that have the same pixel value (Di Stefano and Bulgarelli, 1999; Rafael and Richard, 1993).
During image processing, the particle's area and perimeter are saved in a numerical matrix in binarized format. Thus, the particle's projected area Ap can be estimated by calculating the sum of all the connected component labels, and the particle's perimeter P is the sum of all the boundary labels. The particle's equivalent diameter is calculated based on the value of its projected area: . The dendricity of each particle was quantified using the method proposed by Bartlett et al. (2008), based on two-dimensional image analysis. Specifically, dendricity was calculated as . The specific surface area (SSA) of particles was estimated from two-dimensional images by measuring the perimeters and areas of particles, following the stereological approach proposed by Ren et al. (2021). According to this method, SSA is calculated as . This approach enables the statistical analysis of SSA distribution based on 2D image data, and its validity and limitations have been demonstrated in comparison with three-dimensional and conventional measurement methods. For each dendritic particle, the projected area Ap and perimeter P were averaged over the frames in which the particle was detected along its trajectory in the time-series, which effectively minimizes the influence of particle orientation on the calculated size. All pre-processing of images (dilation, opening, closing operations) and particle recognition in this work are programmed using the MATLAB software. To assess the uncertainty of the shadowgraphy technique, particle diameter information was obtained through both visual identification, where the number of pixels occupied by the particle was counted by eye, and algorithmic recognition. By comparing the two methods, we found that the maximum relative error in particle diameter identification using the shadowgraphy technique is approximately 16 %.
2.2 Particle trajectory tracking
By using the above particle recognition method, we obtained a series of images that contain the particle information. Then, the trajectory and velocity of snow particles are obtained using the trajectory recognition method that judges the relative position of the neighboring particles.
We paired each particle from the previous time series of images by using the nearest-neighbor algorithms (NNA) (Crocker and Grier, 1996) to match the targeted particle's position in each frame image. NNA is a particle search method, as shown in Fig. 4. In each time step, we search for the position of the target particle in the last frame of an image within the predefined search radius. The center of the corresponding circle area is assumed to be at the mass center of the target particle in the last frame, and the radius is 6 mm. We then match the target particle by its shadow surface area similarity. By recognizing the position of the target particle in each frame image, we obtain the velocity of the target particles.
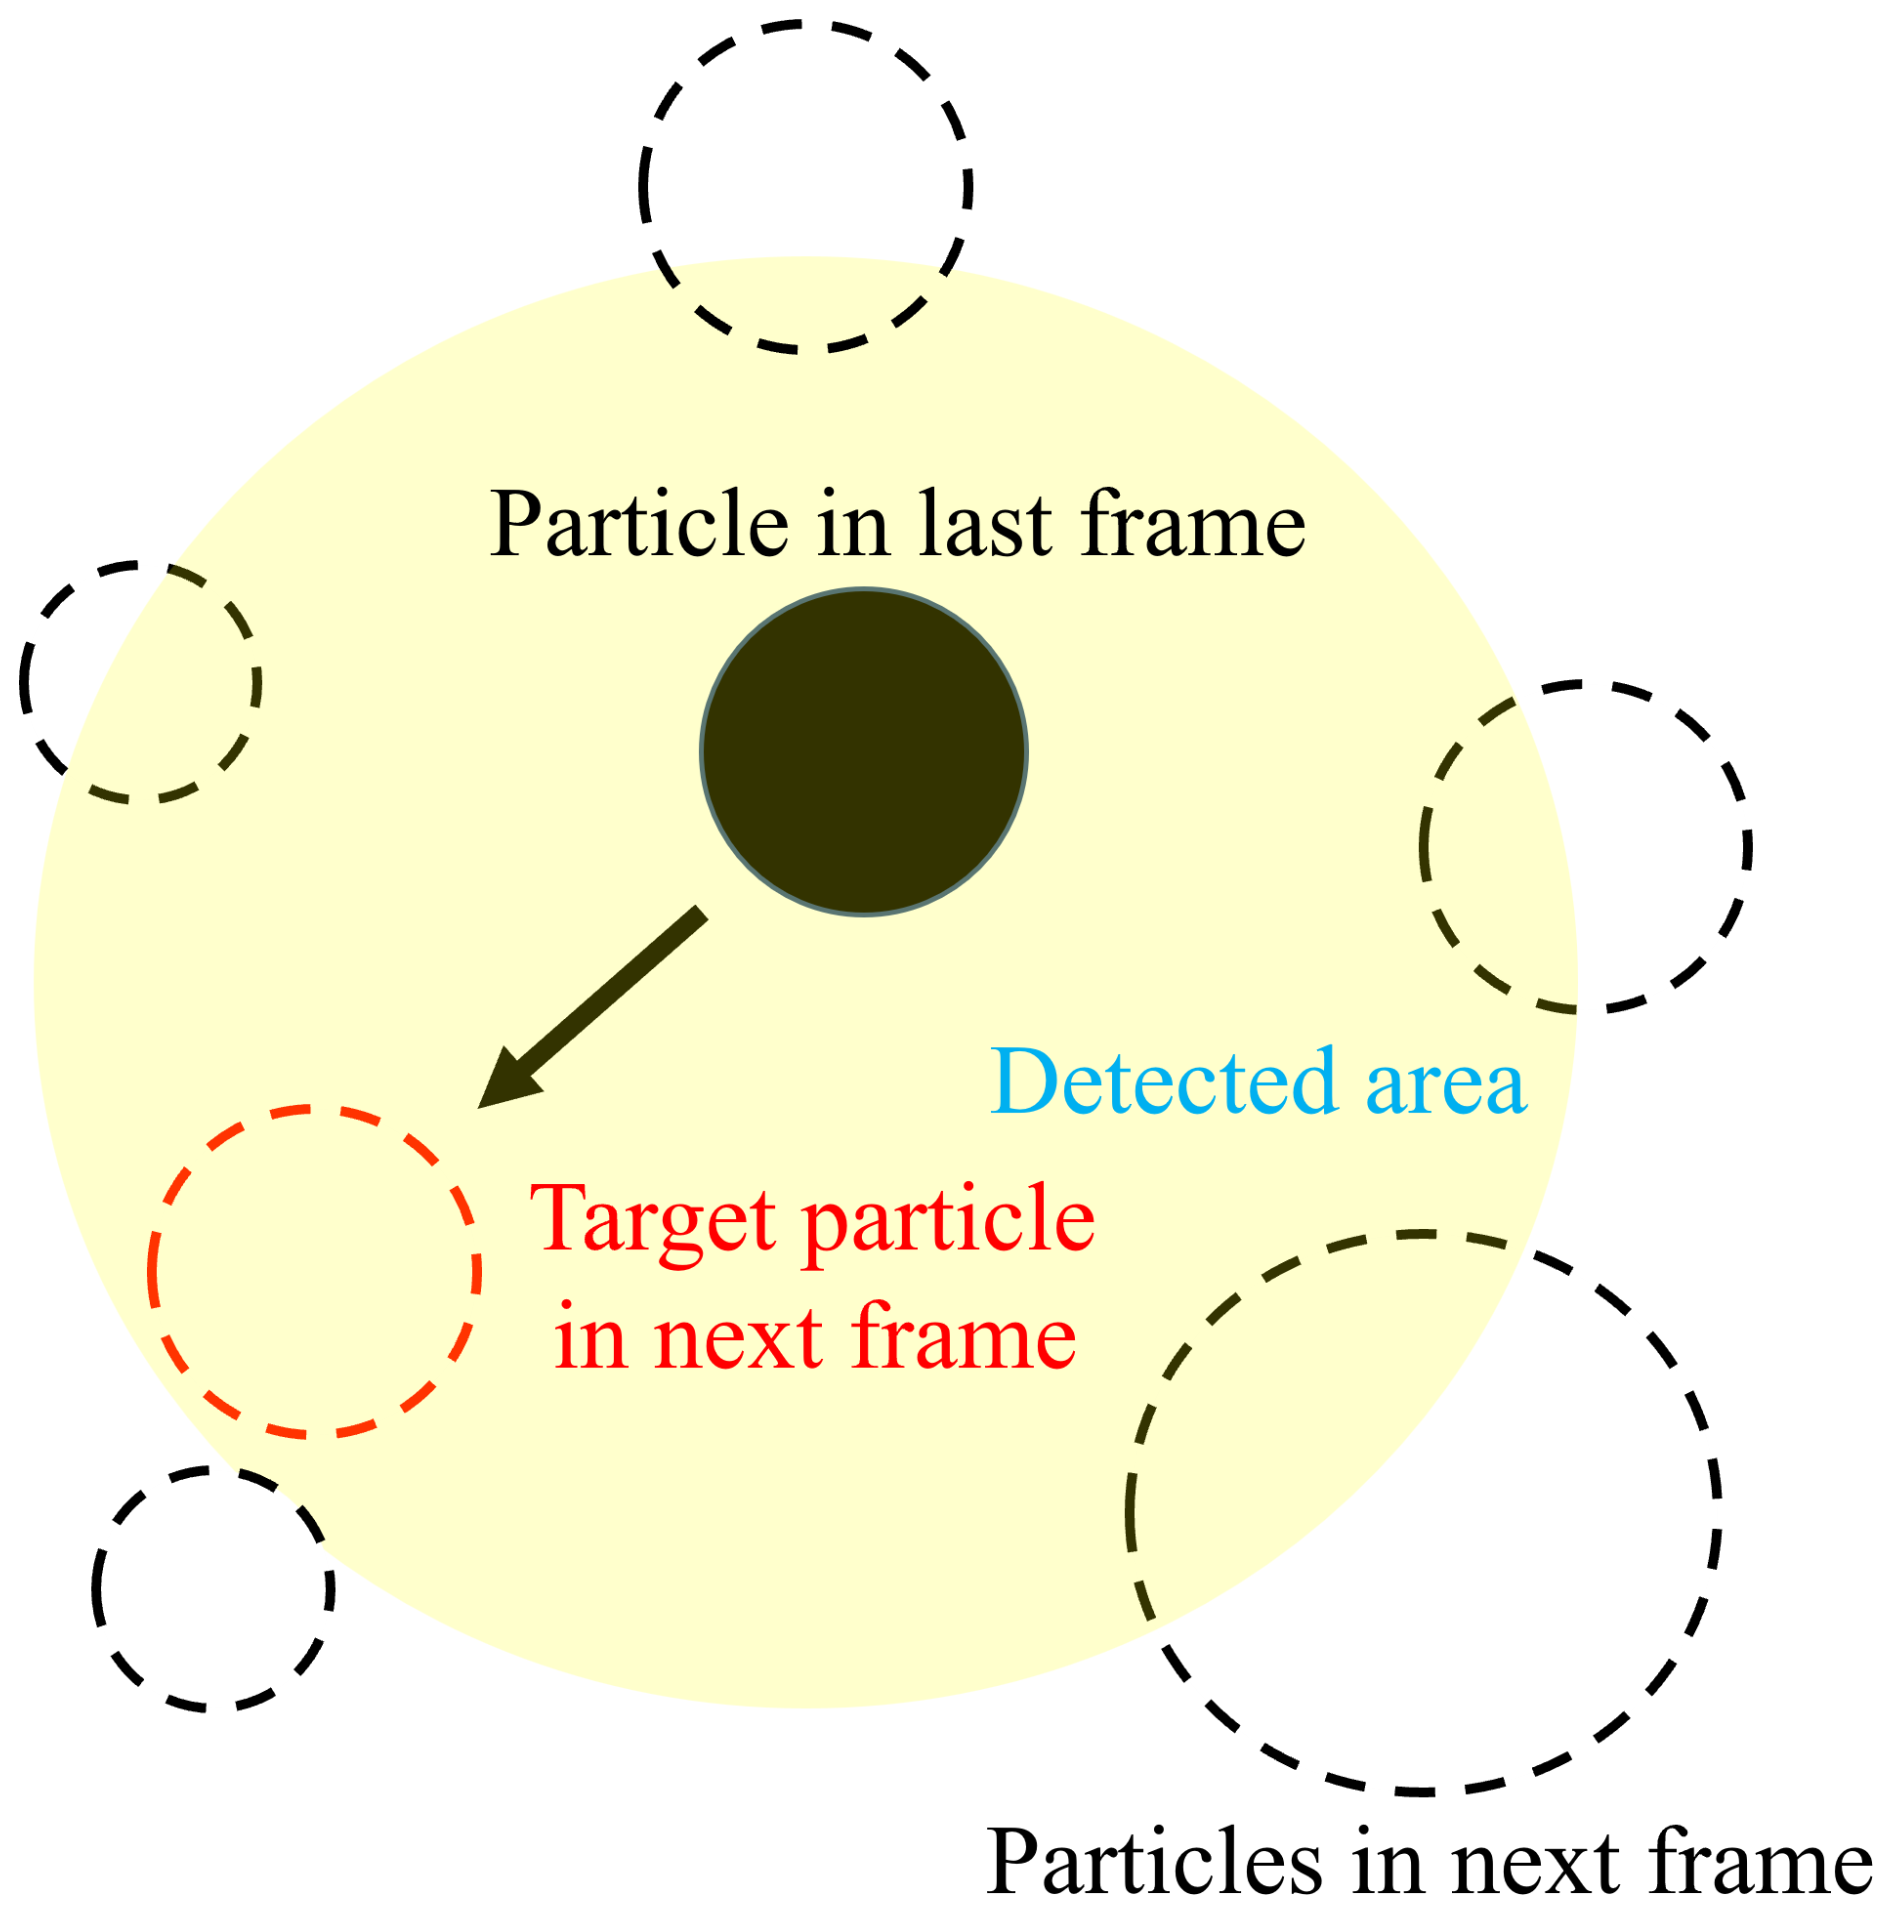
Figure 4Schematic of particle detection method in post-processing high-speed camera images. The full circle is the particle from the last frame, the dashed circle is the particles from the second frame, and the yellow region is the predefined search area.
The kth target particle's horizontal and vertical velocity at a given time step Δt is calculated as:
in which x and y are the coordinate positions in x-axis and y-axis, t is the current time, and Δt is the time interval of a high-speed camera. Therefore, the magnitude of particle velocity vp is:
where vpx and vpy are the velocity component in x and y direction, respectively. The particle moving angle θp can be calculated as:
A particle contact event is defined when the particle's vertical velocity is from negative (downward) to zero or positive (upward) among several adjacent images. The impact velocity is then defined as the velocity before the contact, and the rebound velocity is defined as the velocity after the contact. Similarly, we analyzed the differences between manual identification and particle tracking algorithm recognition, and found that the maximum relative errors in particle velocity and angle identified by the algorithm are 5 % and 18 %, respectively.
By maintaining the wind speed in the experiment at a constant (4 m s−1), the study analyzed 655 collision particles interacting with the snow surface. These interactions included particles that rebounded, impacted, or deposited on the snow, as determined through an image post-processing method. Among these particles, 186 adhered to the cornice edge, while 469 adhered to the cornice upper surface. The cornice edge here refers to the spatial range of the 1 mm vertical front end of a dynamically growing cornice, and the cornice surface refers to the cornice's topside with the total length at the current time step minus the edge length, as is shown in Fig. 5a.
The distributions of the snow particle impact velocity, impact angle, and size distribution are shown in Fig. 5b. The blue points represent the particles that adhere to the edge and the red points represent those that adhere to the surface. The size of all points represents the particle's diameter. It can be concluded that particles that adhere to the edge have relatively lower and more narrowly-distributed values of impact velocity, but widely-distributed impact angle, compared to the particles that adhere to the surface.
To investigate the differences between edge and surface particles, we analyzed the adhering particle's size distribution, impact velocity, and impact angle in the following sections.
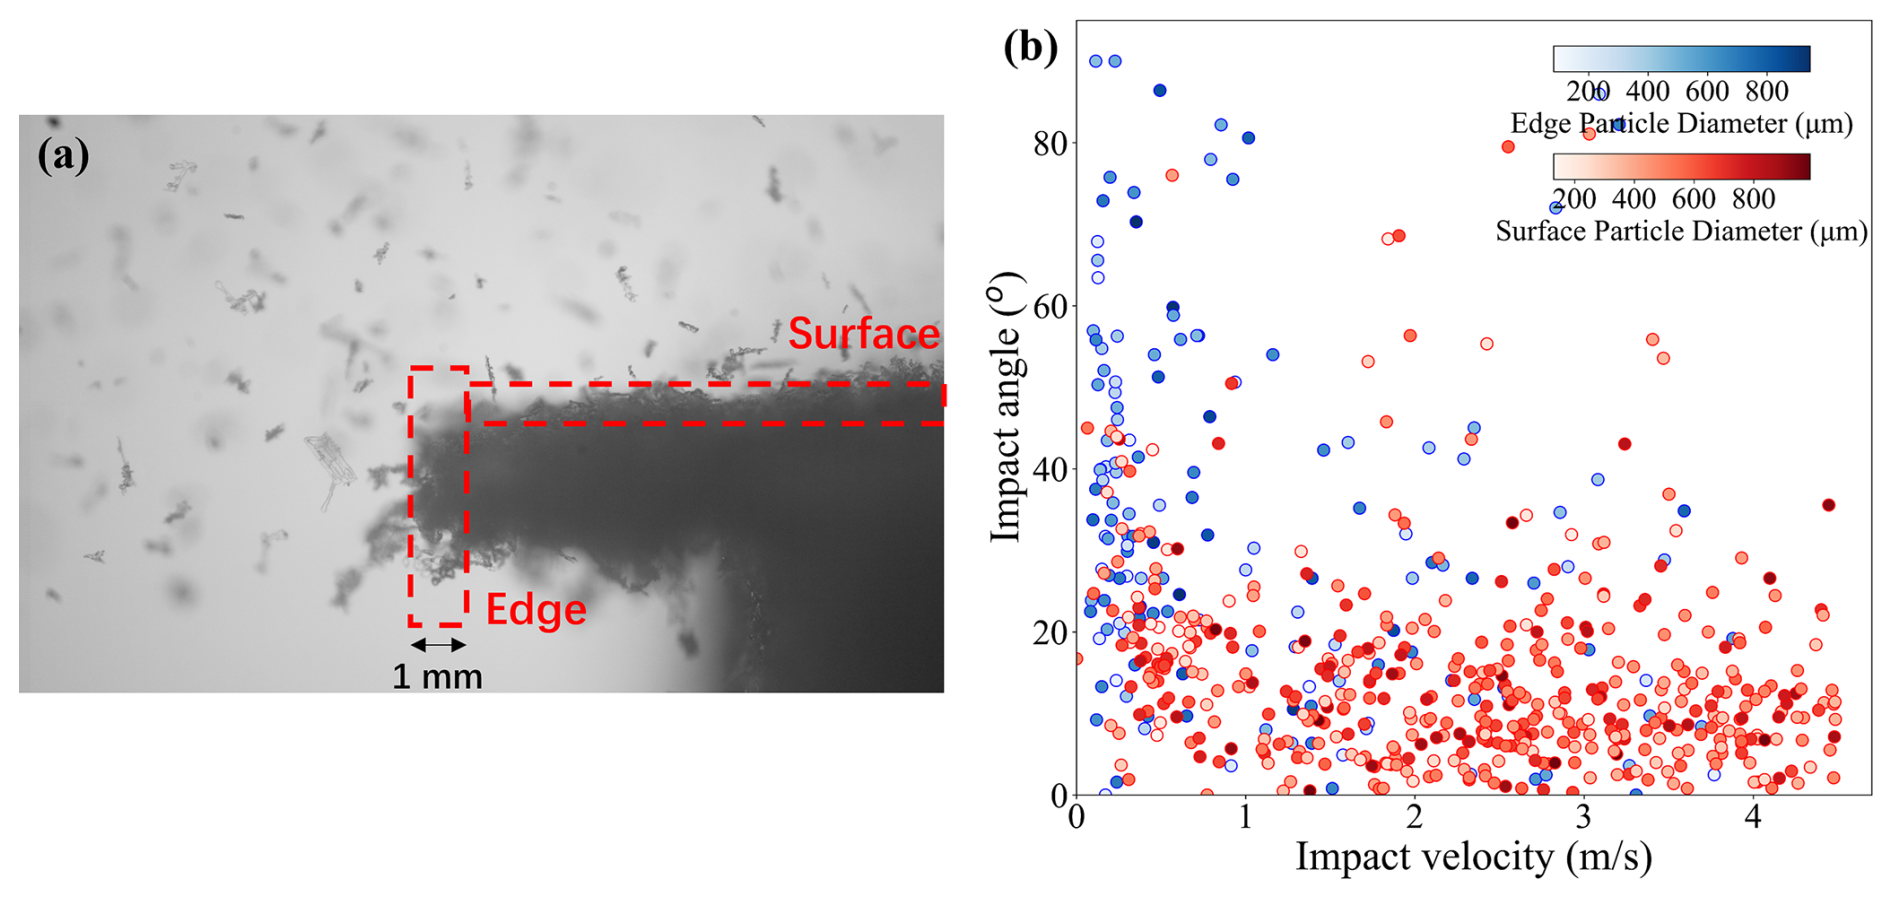
Figure 5(a) Cornice edge and surface, with the dashed box indicating the regions of edge and surface. (b) Impact velocity and impact angle of snow particles of different sizes (deeper color represents larger size) on edge (in blue points) and surface (in red points).
3.1 Particle size and shape
The size distribution of particles adhering at different positions on a dynamically evolving cornice is analyzed, as shown in Fig. 6. For all particles adhering to the cornice surface, their size distribution follows the Log-normal distribution described by , with the average diameter µm. For particles adhering at the edge, their size distribution follows the Log-normal distribution described by , with the average diameter µm. For particles adhering to the surface, their size distribution follows the Log-normal distribution function described by , with the average diameter µm. It can be concluded that particles with smaller sizes adhere more likely on the edge, and larger particles adhere more likely on the cornice surface.
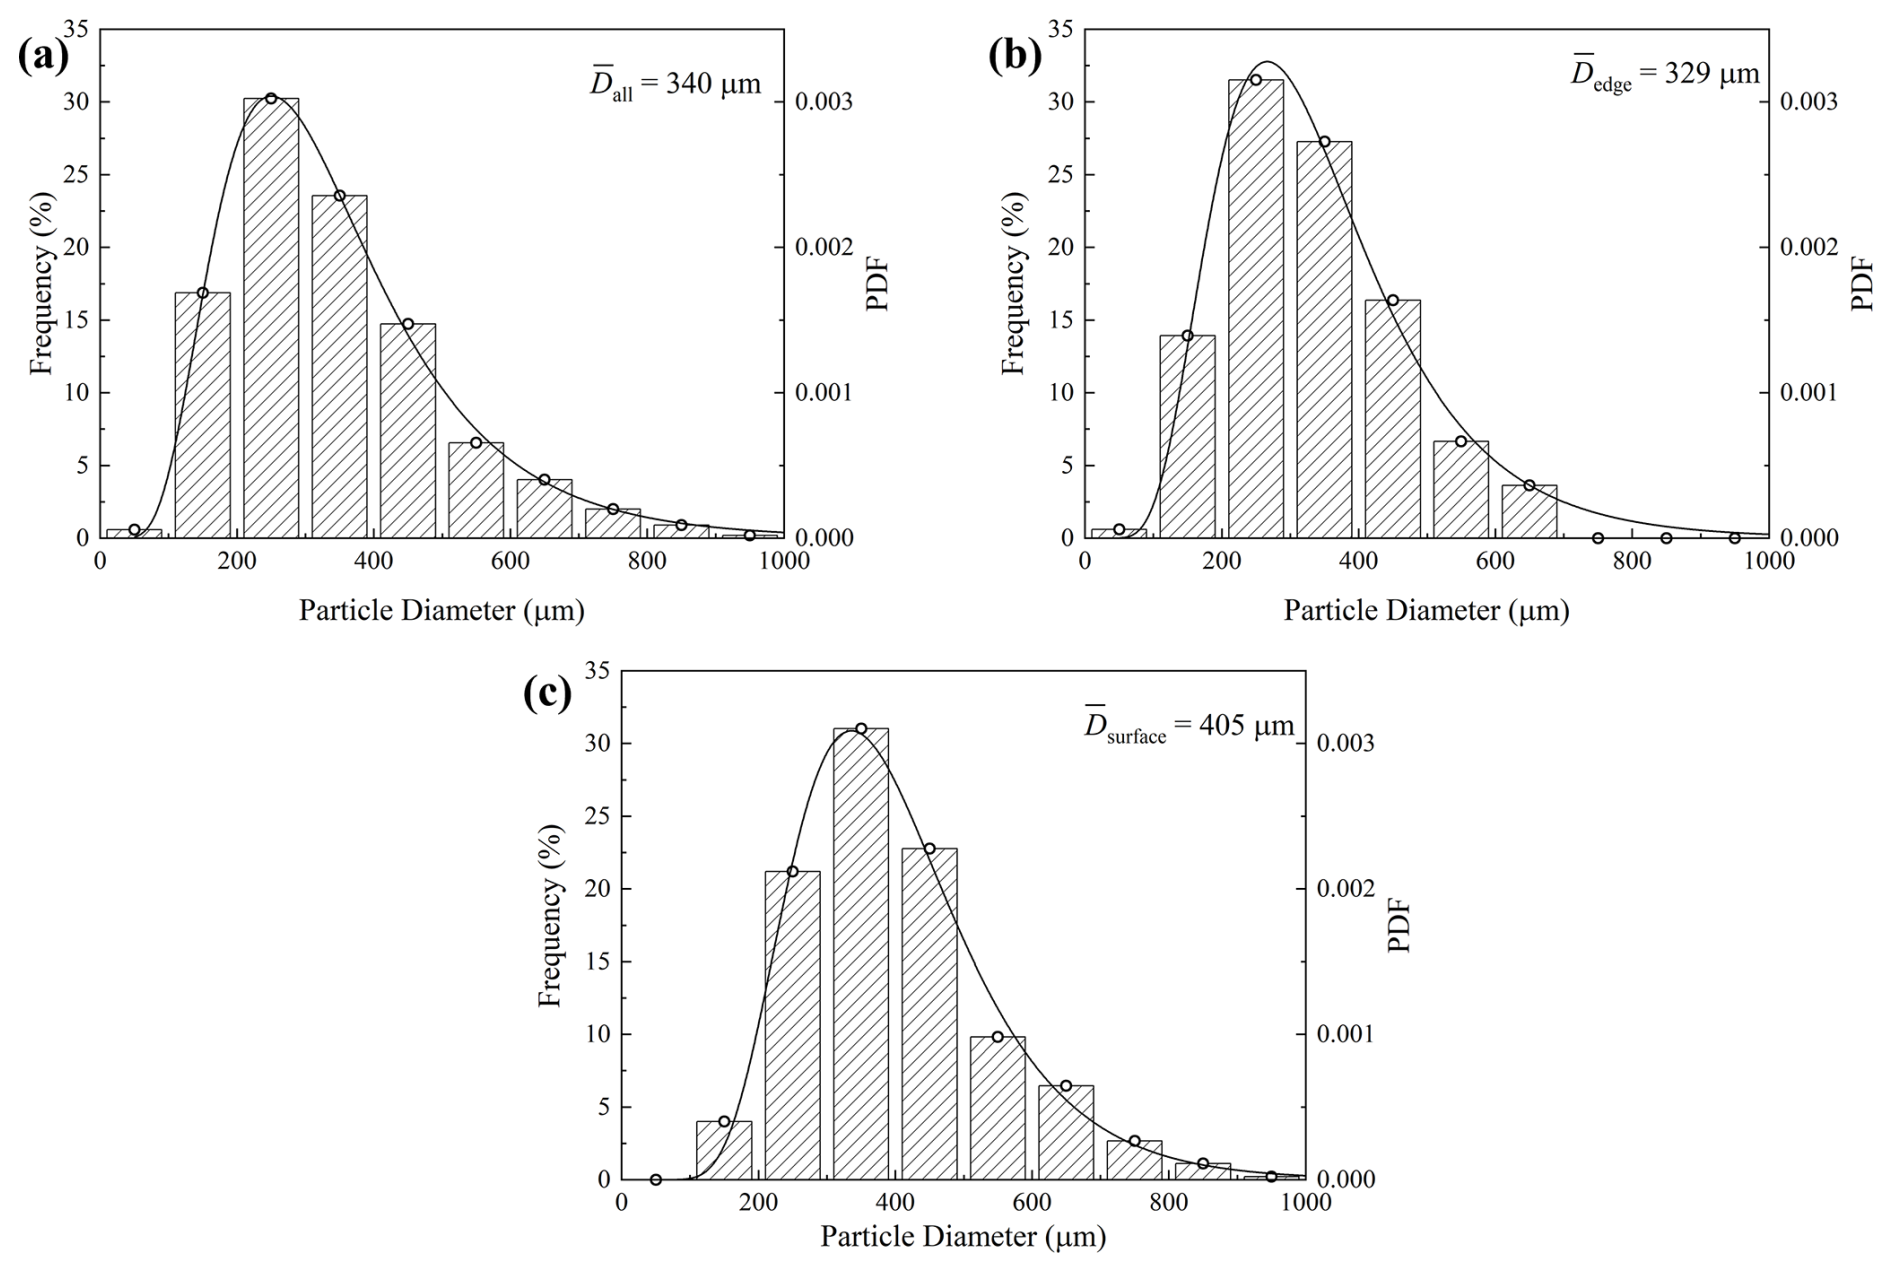
Figure 6Size distribution of particles at different positions. (a) Airborne particles. (b) Adhesion particles at the edge. (c) Adhesion particles on the surface. The gray shadow represents the existence frequency of particles with different sizes.
In addition to particle size, dendricity and specific surface area (SSA) are important indicators of particle morphology and surface characteristics. As illustrated in Fig. 7a, the average dendricity of edge particles is 1.9, higher than that of surface 1.4. Meanwhile, the distribution range of the edge particles (1 to 4.7) is broader than that of the surface particles (1 to 3.1). These results indicate that the edge particles have more fragmented or branched morphologies, while particles on the surface are generally more regular and compact.
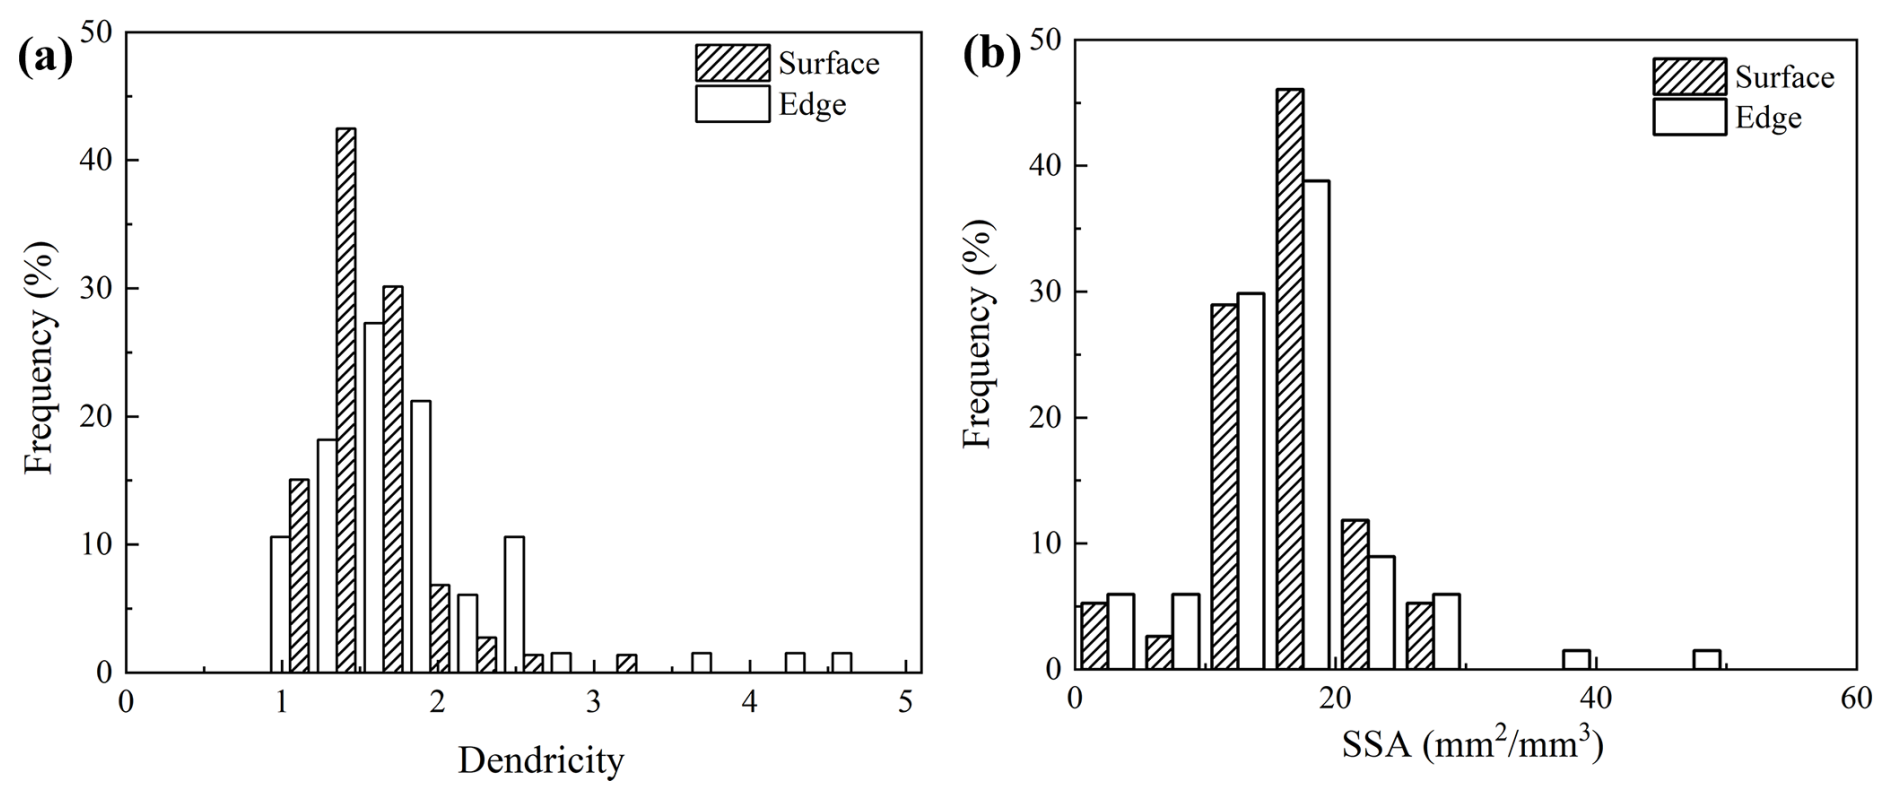
Figure 7Frequency distributions of (a) dendricity and (b) specific surface area (SSA) for particles adhering to the edge and surface.
However, the SSA values of edge particles and surface particles are similar, with the average value of 20 mm2 mm−3, as is shown in Fig. 7b. This similarity arises because both edge and surface particles originate from the same snow source. Therefore, dendricity is a more critical factor in determining whether a particle can adhere to an edge or the surface. In particular, edge particles with high dendricity have more contact points with neighboring particles on the cornice, which may lead to a greater cohesion force Fc – the force counteracts the gravity force Fg and allows the edge particle to adhere. In contrast, surface particles may experience less cohesion force, and their gravity acts in the same direction as the cohesion force, making gravity either irrelevant or even beneficial for particle adherence.
Combining the analysis of particle size, dendricity, and SSA distribution, we find that smaller particles and dendritic particles are more prone to adhere to the edge, while larger and more spherical particles tend to deposit on the surface. This phenomenon is closely related to the aerodynamic behavior of particles in the air. Specifically, the pattern of particle deposition is primarily governed by the Stokes number (Comola et al., 2019), a dimensionless parameter that compares the inertial response time (particle relaxation time) of a particle to the characteristic time scale of the fluid flow. In general, particles with smaller sizes, as well as large particles with irregular shapes, tend to have lower relaxation times than spherical particles of the same size (Loth, 2008). As a result, for such small particles and large, highly dendritic ones, viscous forces dominate over inertia, enabling the particles to quickly respond to changes in local fluid velocity and closely follow the streamlines. Such particles therefore preferentially deposit on the edges–where the wind speed is near zero and accompanied by a reflux vortex (DeBonis, 2022; Yu et al., 2025). In contrast, for spherical particles, especially those with larger size, inertial forces become more significant relative to viscous drag, making these particles less responsive to fluid velocity changes and more likely to deposit on the main surfaces–which are generally characterized by a stable boundary layer and low turbulence.
3.2 Particle movement pattern
Near-surface moving particles were captured using a high-speed camera. Creeping (particles rolling or sliding over the surface before settling) and saltating (particles successively jumping over the surface before settling) (Bagnold, 2012) are the two primary modes contributing to cornice growth. Particles in creeping mode, predominantly larger particles, exhibit two distinct patterns of adherence to the snow cornice surface. One pattern involves particles slowly rolling forward and stopping at a certain point, referred to as “creeping” (Fig. 8a), while the other involves particles rolling to the edge, where they are captured through interlocking with the dendritic structure, termed “hanging” (Fig. 8b). These two patterns together account for approximately 14 % of the total adhered particles and typically move slowly. In contrast, most of the adhered particles are transported primarily via saltation. Among these, approximately 82 % of the total adhered particles deposit before reaching the front end of the snow cornice, which we refer to as “impact” (Fig. 8c). About 4 % of the total adhered particles are saltating particles that detach from the edge, move back, and are recaptured by the snow cornice edge, influenced by reflux vortex (Yu et al., 2025) or the potential electric field (Yu et al., 2022), a process we term “back moving” (Fig. 8d).
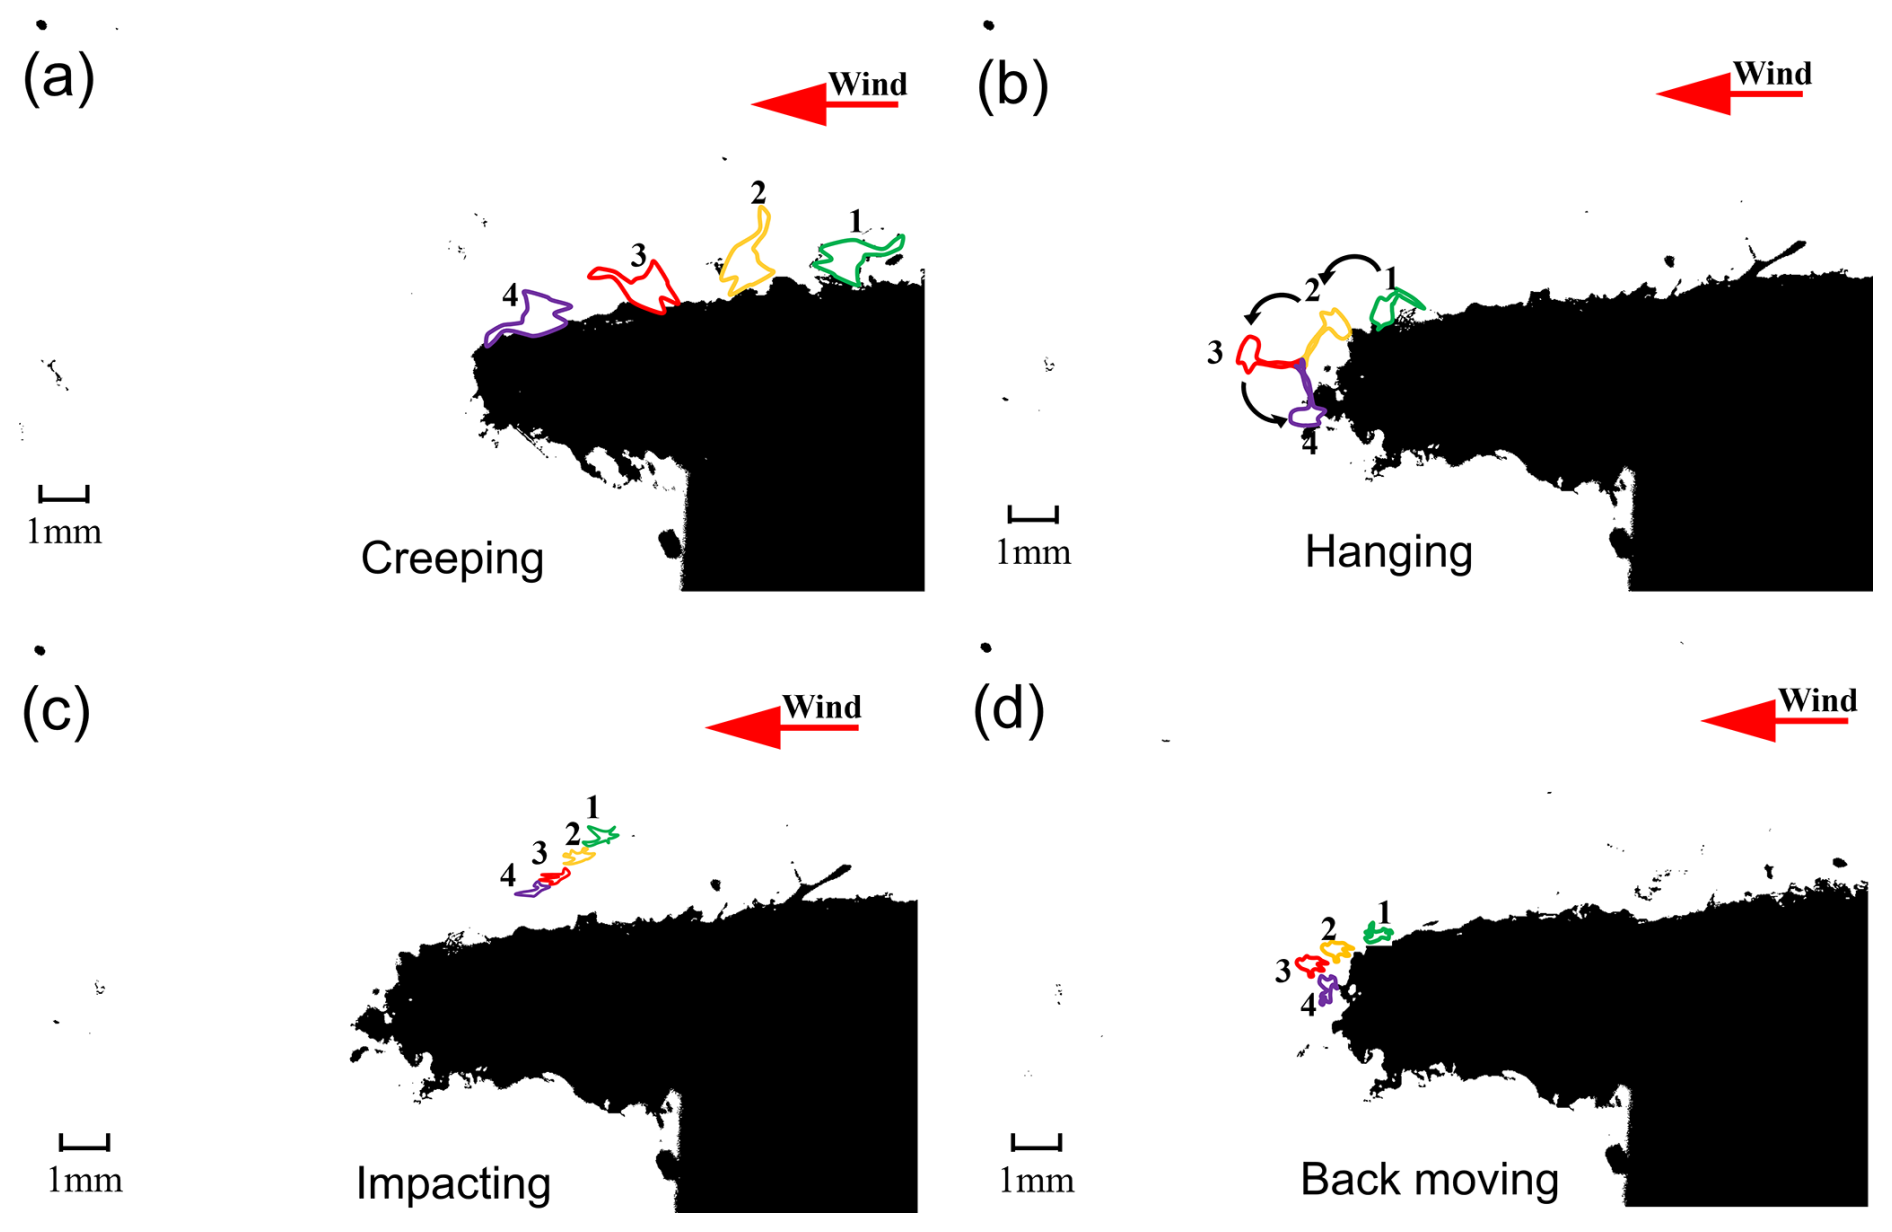
Figure 8Four adhering patterns of snow particles (1, 2, 3, 4 represents for different time steps).(a) Creeping particles. (b) Hanging particles. (c) Impacting particles. (d) Back moving particles.
3.3 Particle impact velocity and angle
Here, vim is defined as the impact velocity of the particle. θim is defined as the angle of particle incidence on the horizontal cornice surface, ranging from 0° (parallel to the surface) to 90° (perpendicular to the surface), and this angle measures how steeply a particle approaches the surface or edge before sticking. Only particles impacting the cornice surface from above (incidence angle 0–90°) are considered, while particles with trajectories suggesting backward-moving (θim>90°) are excluded. We first analyze the vim and θim of 469 particles adhered on the surface and 186 particles adhered on the edge. In natural conditions, the snow cornice will slowly bend and deform under the gravity force. In our experiment, the snow cornice can be considered as horizontally growing in the whole process, and the bending effect of the snow cornice can be neglected for the short observation time. We subdivided the values of vim and θim into different bins and analyzed their relative frequency. The average value of each bin is plotted as dots and the standard deviation is plotted as error bars in Fig. 9.
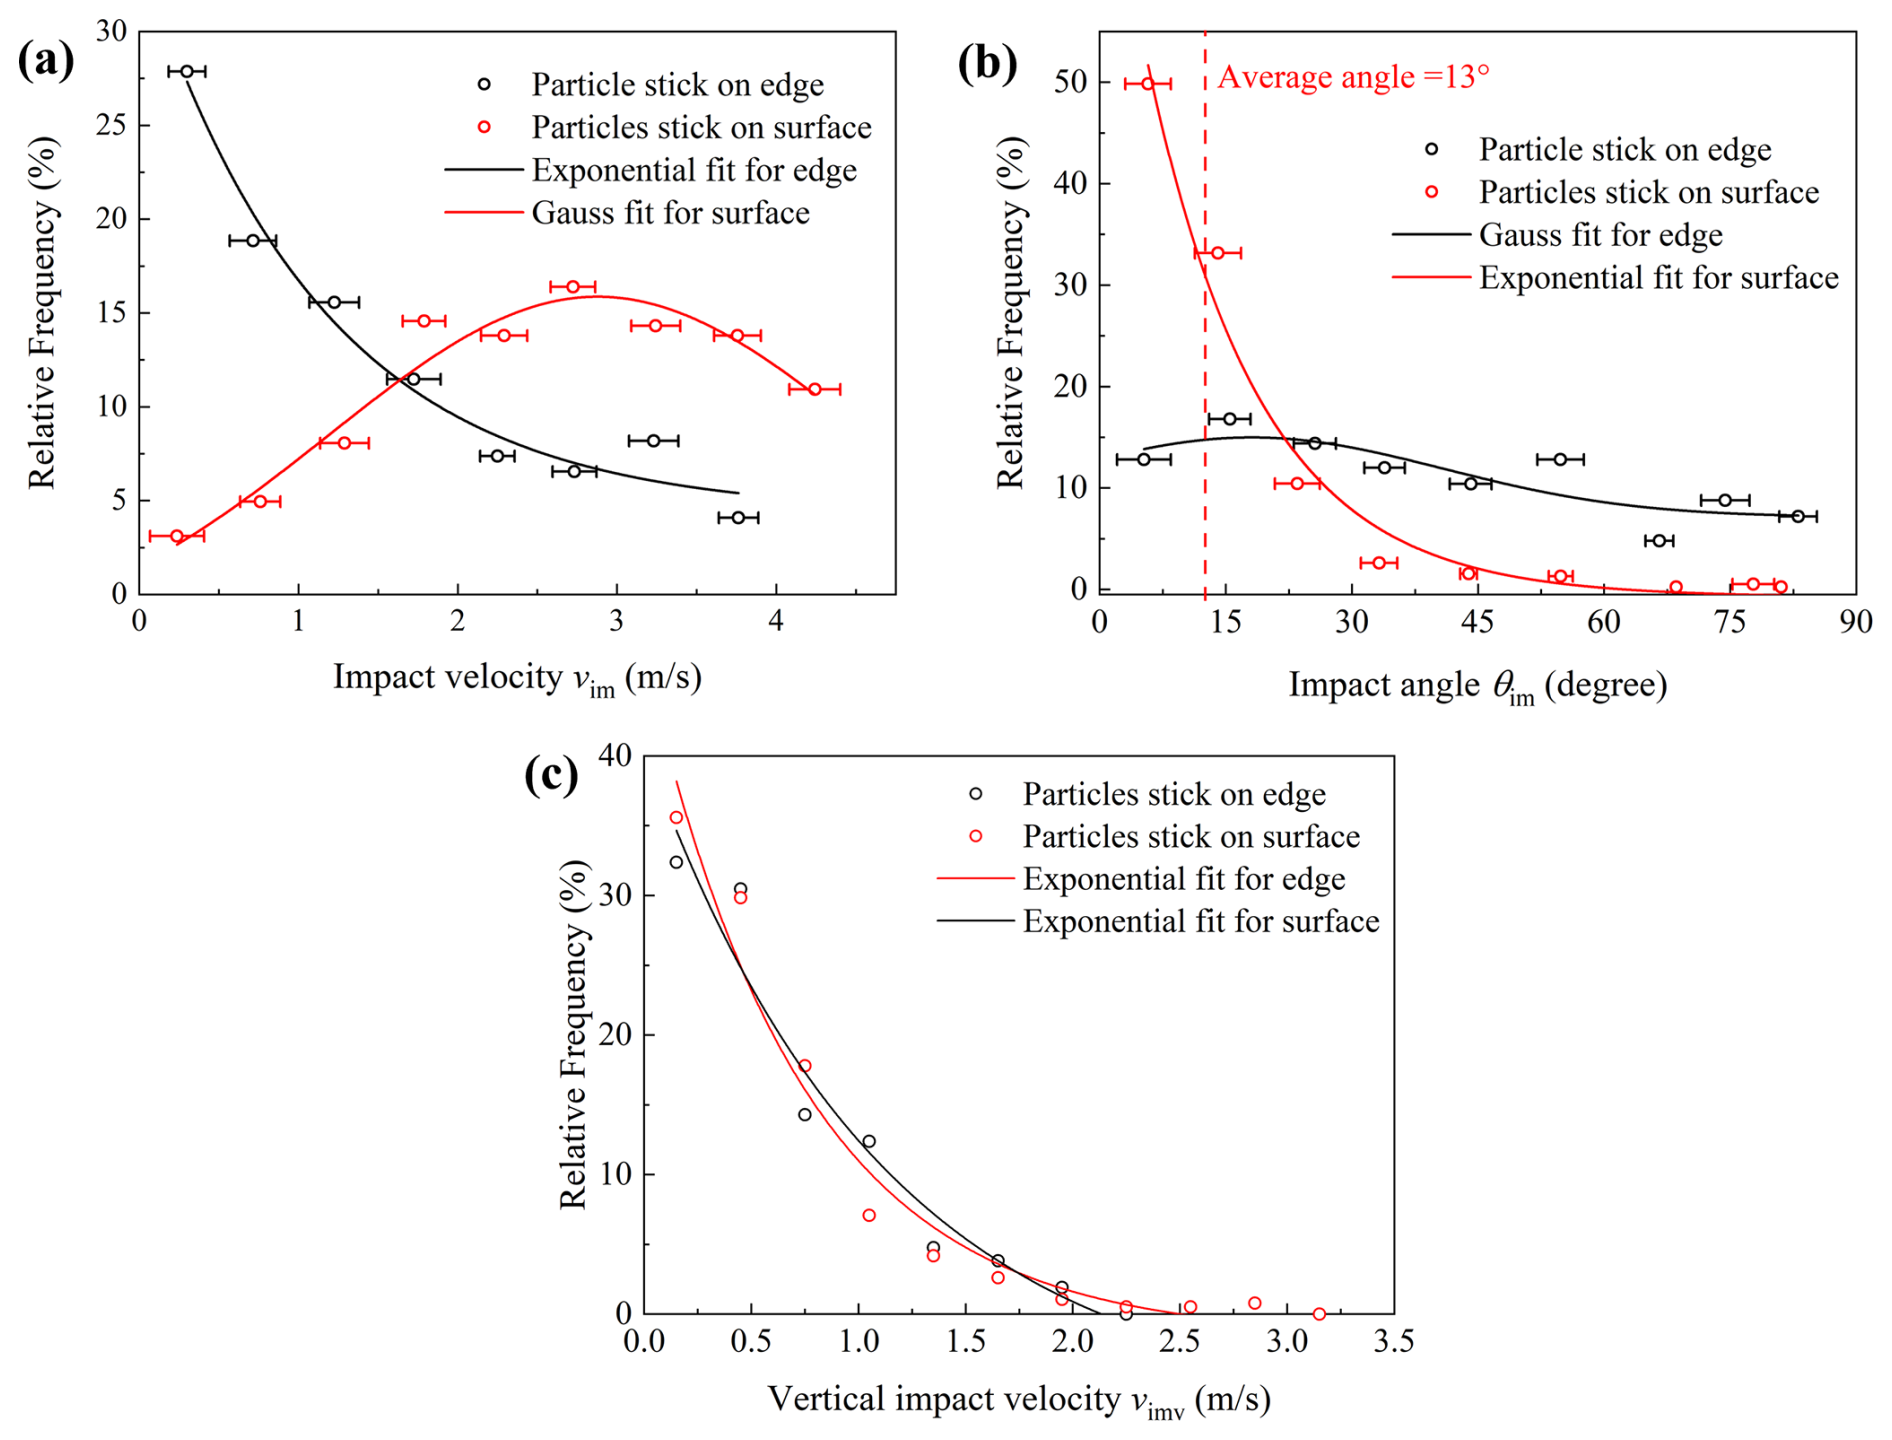
Figure 9Relative frequencies of (a) impact velocity, (b) impact angle, and (c) vertical impact velocity of particles adhering to the edge and surface.
The relative frequencies of vim and θim represent the probabilities of adhesion particle with a certain impact velocity or impact angle range. It is shown in Fig. 9a that for edge particles, the adhesion probability exponentially decreases with the increasing value of vim. Specifically, the relative frequency of impact velocities of edge particles follows the exponential function (R2=0.96). This indicates that particles with lower impact velocities are more likely to adhere to the edge. The majority of edge particle adhesion occurs at velocities below 1.5 m s−1, highlighting the critical role of low-velocity impacts in cornice growth. While the relative frequency of the impact velocities of surface particles follows the Gaussian distribution function of (R2=0.91), with values mainly concentrated at 3 m s−1. This indicates that particles deposited on the surface normally have a higher impact velocity than the edge. This is because the snowpack on the surface is thicker than at the edge, as the cornice has a wedge shape. As a result, the surface can absorb more impact energy through longer force chains, allowing particles with higher impact velocities to adhere. In contrast, the thinner snowpack at the edge cannot effectively dissipate kinetic energy, so high-speed particle impacts often lead to erosion or fracture at the edge.
The low number of particles adhering to the surface at low impact velocities can be attributed to the wind speed in the wind tunnel, which is set at 4 m s−1. At this wind speed, the majority of particles are entrained and transported at higher velocities, leaving only a small fraction of particles moving at very low velocities near the cornice's surface.
As is shown in Fig. 9(b) that the frequency of impact angles of surface particles follows the Exponential distribution function (R2=0.97), with values mainly concentrated below 17°. While the frequency of impact angles of edge particles follows the Gaussian distribution function (R2=0.72), with values distributed more uniformly in range. The average value of impact anlges of surface particles is 13°, which is consistent with the previous experimental results of Nishimura and Hunt (2000), as is shown in the red dash in Fig. 9b. Particles at the edge can adhere even at higher impact angles, as the edge provides a partially sheltered micro-environment where the local wind speed is lower. This reduction in wind velocity decreases the tendency for particle rebound and thereby increases the likelihood of adherence, even under conditions of increased impact angle.
Furthermore, we combined the impact velocity and angle by analyzing the vertical impact velocity (vimv=vimsin θim) in Fig. 9c. The relative frequency of vertical impact velocities for both surface particles and edge particles follow the exponential distribution, with surface particles (R2=0.96), and edge particles (R2=0.95). Particles adhere at low vertical impact velocities, whether on edges or surfaces. For both edge and surface particles, the threshold vertical impact velocity ranges from 2–2.5 m s−1, with edge particles having a lower threshold velocity compared to surface particles. The differences in impact velocity and angle distribution between surface and edge particles are due to the variations in the fluid field caused by the unique topography at the edge, where a sudden change in velocity and pressure (Yu et al., 2025). It is noted that the vertical impact velocity distributions of surface particles and edge particles are in the same trend, although the impact velocity and impact angle distributions of edge particles and surface particles are different. It indicates that particle adhesion is mainly affected by the vertical impact velocity. This is because only the vertical kinetic energy provided by the normal velocity can be used to overcome the adhesion energy barrier of the surface, whereas the tangential velocity cannot assist the particle in detaching from the surface in the vertical direction (John, 1995).
3.4 Static force analysis of adhering particles on the cornice edge
To investigate the effect of dendricity on the particle adherence at the edge, forces acting on a particle adhering to the edge are analyzed in this section.
Considering the differences in particle size distribution between the edge particles and surface particles, we conducted a static analysis of the particles at the edge. As shown in Fig. 10, a newly deposited particle i adheres to the foremost particle j at the edge of the cornice. Particle i is subjected to gravity Fg, the cohesive force Fc exerted by particle j, and the frictional force Ff at the contact surface. Due to the separation of flow, the wind velocity and surface shear stress near the edge of the cornice are close to zero (Shehadi, 2018; DeBonis, 2022; Yu et al., 2025), allowing the drag and lift forces acting on particle i to be neglected compared to other forces (Schmidt, 1980).
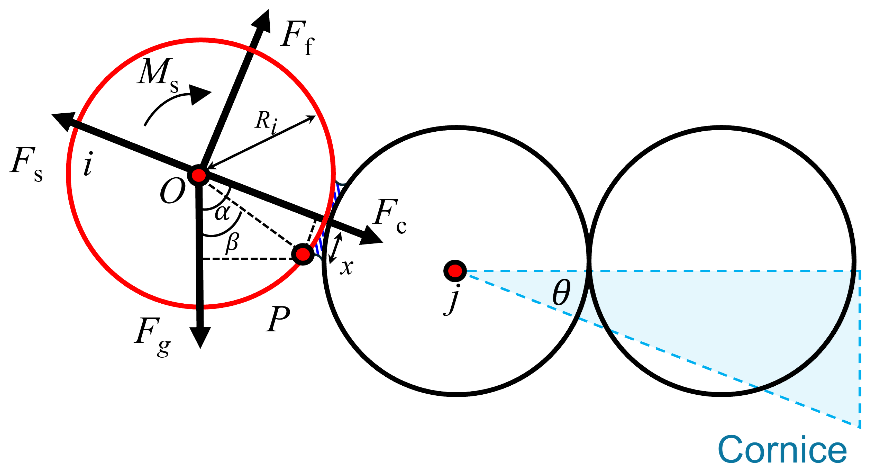
The force and moment balance equations for particle i can be expressed as:
where α is the angle between the line connecting the centers of the two particles and the direction of gravity, x is the radius of the bond (blue shadowed area). The radius of the bond can be assumed to vary linearly with particle radius x=δR, with ratio δ = 0.1–0.25 (Golubev and Frolov, 2001). The gravity force Fg acts at point P through the moment arm Rsin β, with the angle between Fg and line given by β=α−arcsinδ. The friction force Ff acts at P through moment arm Rcos (arcsinδ), which is the perpendicular distance from the line of action of Ff to the point P, projected along the particle-center line. Fs is the support force exerted by particle j on particle i. The frictional force Ff is given by:
where μf is the friction coefficient of the ice surface.
Substituting Eqs. (5), (6) and (8) into Eq. (7) yields:
The bond cohesive force Fc for a spherical particle is given by (Szabo and Schneebeli, 2007):
where τb is the bond shear stress. While for non-spherical particles, particularly those with dendritic structures, the cohesion force is higher than that of spherical particles, due to the stronger geometrical interlocking between particles. Thus, dendricity should be considered in the calculation of the cohesion force for non-spherical particles. Previous study shows that the sharp edges of particles can lead to an increase in cohesion via interlocking (Vivacqua et al., 2019). Thus, here we introduce a weighting parameter A into Eq. (10) for dendritic particles:
where dd is the dendricity value of non-spherical particles. For spherical particles, dendricity is a constant: dd=1, and Eq. (11) is equivalent to Eq. (10). The weighting parameter A for snow should be determined by the experiment. For those particles that adhere on the edge, the average value of dendricity dd=1.9, as is shown in Fig. 7.
The gravitational force of the particle is:
where R is the particle radius, ρi=900 kg m−3 is the density of ice, and g=9.8 m s−2 is the gravity acceleration. By substituting Eqs. (11) and (12) into the left side of Eq. (9), we obtained the expression for the ratio of :
Meanwhile, the right side of Eq. (9) can be defined as a function ϕ, which is affected by the ratio δ, angle α, and friction coefficient μf:
In which, the friction coefficient μf ranges from 0.2 to 0.7 (McClung and Schaerer, 2006), and the angle α varies from 0 to 90° according to the experiment result. The resulting values of ϕ are illustrated in the contour plot shown in Fig. 11. Notably, ϕ decreases with increasing μf at all α, which indicates that higher friction reduces the need for a strong cohesive force to maintain stability. For a given μf, ϕ increases at larger angles, meaning that higher cohesion is required to keep the particle stable at the edge. When angle α=90°, the cohesion force is perpendicular to the gravity force; under this condition, the particle is most difficult to adhere to the edge. The bottom-right blank areas correspond to the instability status for particles where adhesion doesn't happen.
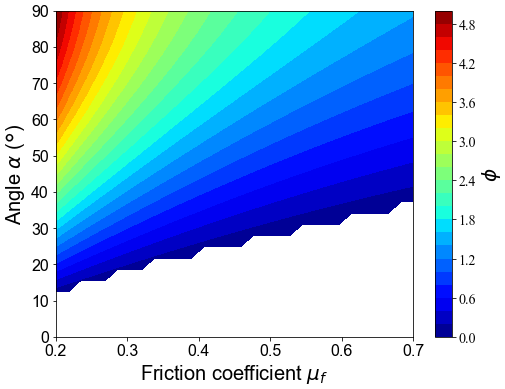
Considering the most challenging condition for a particle to adhere to the edge occurs when the angle α=90° and the friction coefficient μf=0.2. The corresponding ϕ≈5. Therefore, by combining Eqs. (9), (13) and (14), we can obtain:
Based on the experimental results shown in Fig. 6b, the maximum radius of particles adhering to the edge is 325 µm. Therefore, we have:
with δ = 0.1, τb=1.8 kPa (Jamieson and Johnston, 1990), dd=1.9, and φmax=5, we can derive the value of parameter A≈0.07.
Therefore, in general, the cohesion force for edge particles, considering the shape effect, can be expressed as:
and the threshold radius Rth for particles that can adhere to the edge can be estimated by:
For each δ, the threshold radius Rth increases linearly with dendricity, as is shown in the Fig. 12. A higher value of the ratio δ indicates a larger contact surface, which in turn allows larger particles to adhere to the edge. δ is mainly dependent on the air temperature and relative humidity (Colbeck, 1982). Furthermore, we divided the radius into different bins based on the dendricity values. By comparing the averaged radius of various dendricity, we found that the experimental result is in good agreement with the model-predicted results. The experimental data lie between the theoretical curves for δ=0.15 and δ=0.25. It can be concluded that the maximum particle size capable of adhering to the edge increases with increasing dendricity. Which means greater dendricity enables larger particles to remain attached, suggesting that the complexity of the particle shape helps counteract gravity.
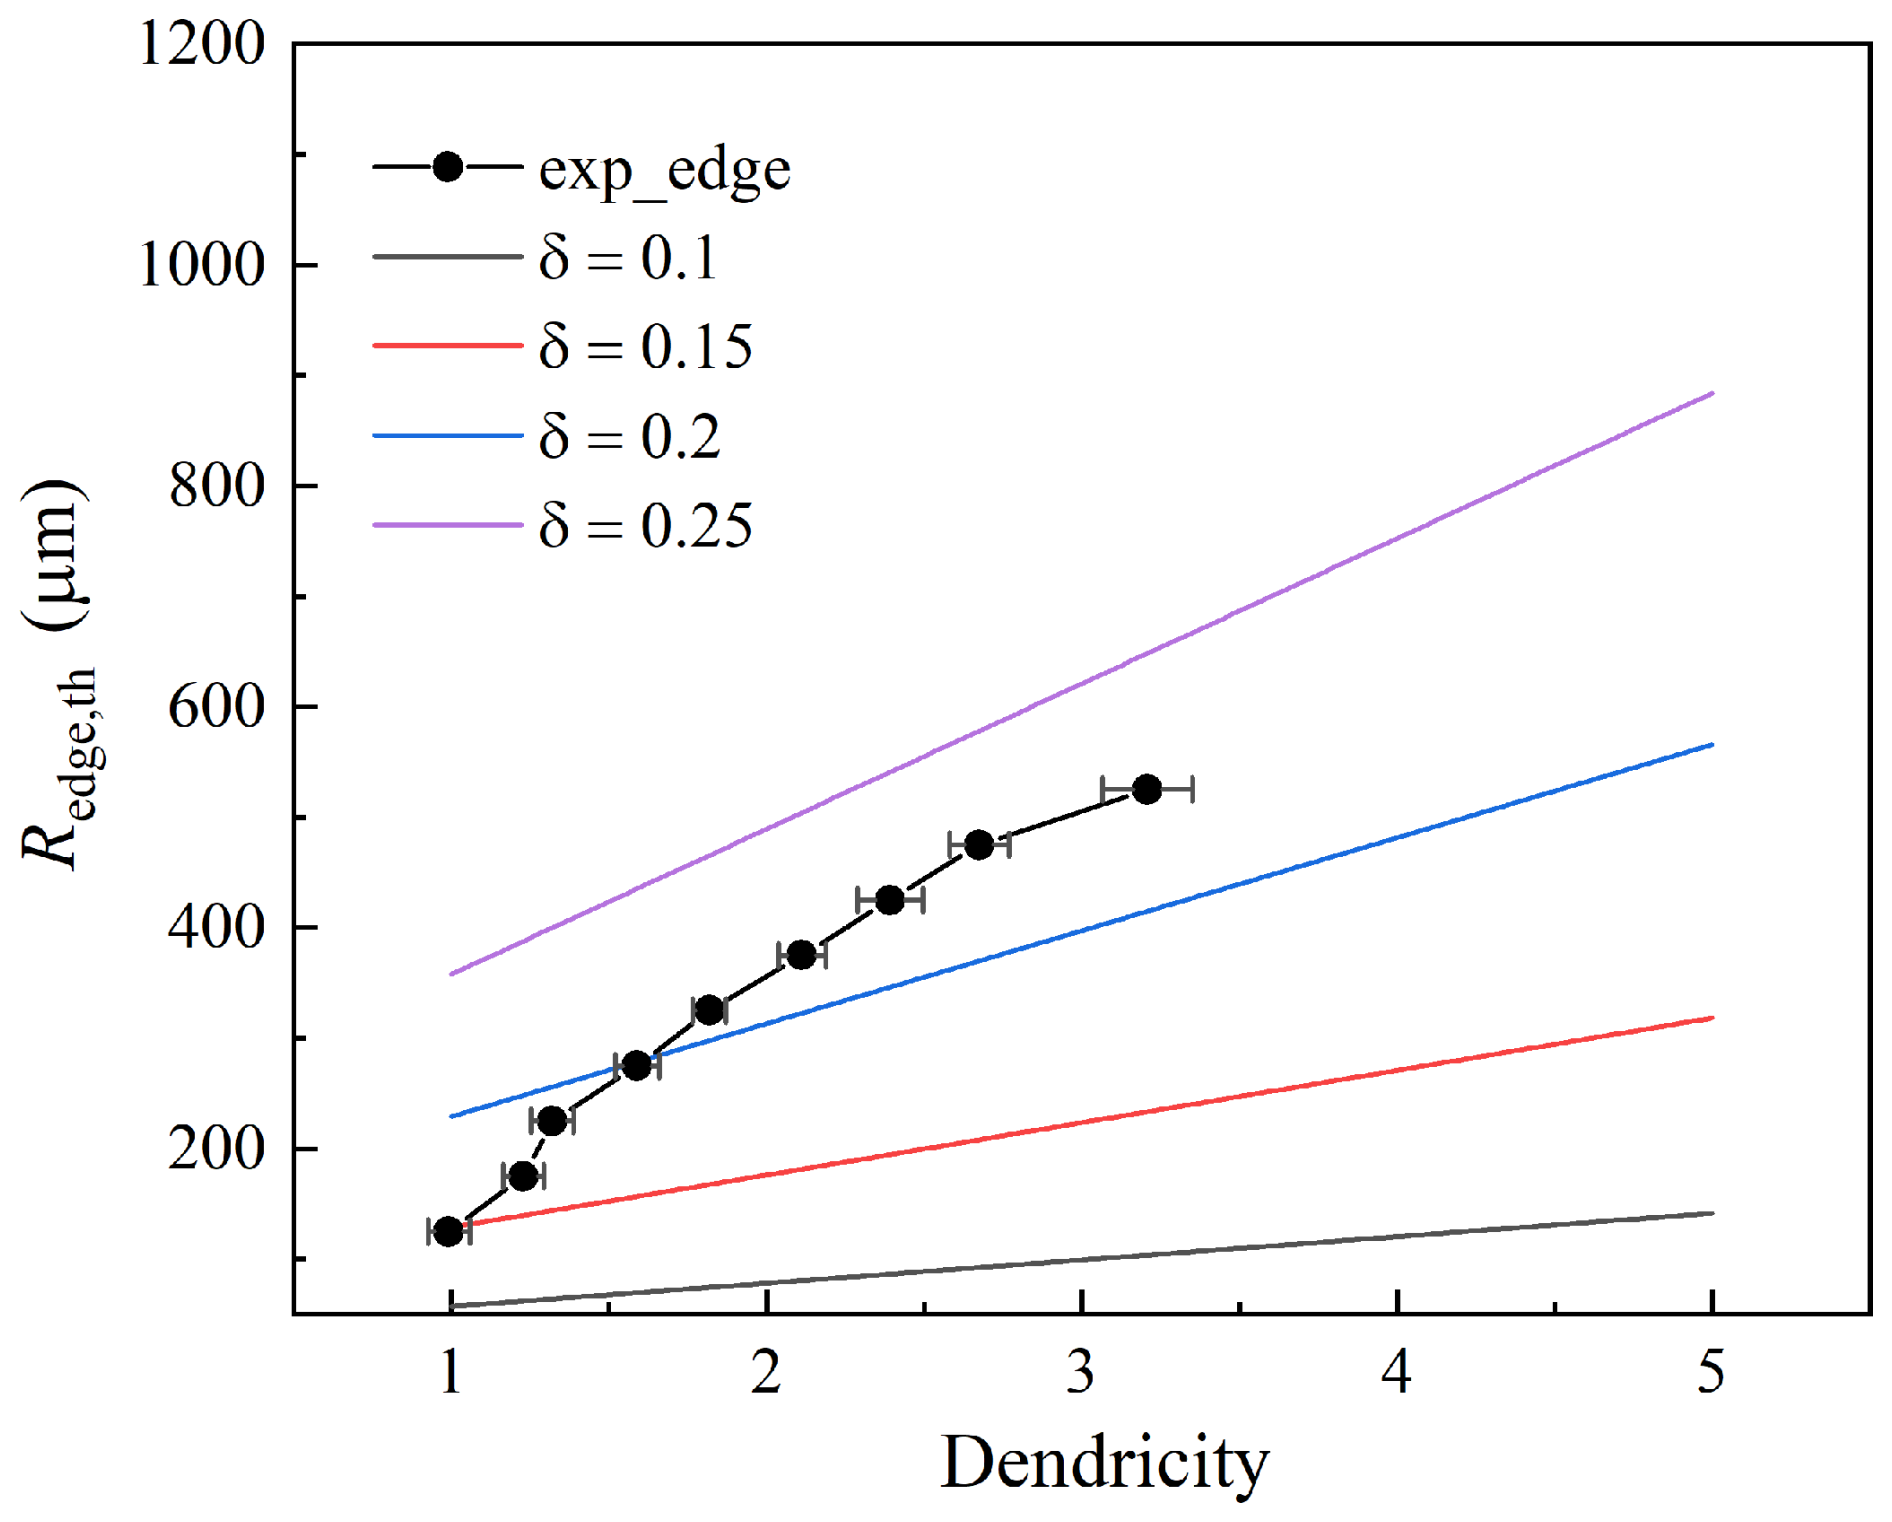
Figure 12Experimental and theoretical threshold radius of edge-adhering particles as a function of dendricity for various δ values.
This study elucidates the micro-mechanisms underlying the initial formation of snow cornices through wind-tunnel experiments and high-speed particle tracking, facilitated by a novel snow particle recognition program. Direct observation and quantitative analysis reveal that near-surface saltation and creeping are the dominant mechanisms by which snow particles adhere to cornice structures. The vast majority of adhered particles settle on the upper surface via saltation, while only a smaller proportion is able to deposit or interlock at the front edge, often aided by their dendritic morphology.
Our experiments demonstrate that, despite local variations in particle size, velocity, and impact angle, the adhesion of snow particles – on both edge and surface – is governed primarily by the vertical impact velocity, with an adhesion threshold between 2–2.5 m s−1. Edge-adhering particles are consistently smaller and exhibit higher dendricity compared to those on the surface, a trend explained by the force analysis showing that smaller and more branched particles possess a higher ratio of cohesive to gravitational forces (), enhancing their attachment stability especially under edge conditions.
Based on the experimental result, the static force on the particle adhering to the edge has been analyzed. The model quantitatively explains the preferential adhesion of smaller and dendritic snow particles observed in experiments. The cohesion force model incorporates dendricity, reflecting the enhanced contact area and thus higher cohesion for non-spherical, dendritic particles compared to spherical ones. By introducing dendricity into the expression for cohesion force, the model can predict the threshold radius for particle adhesion as a function of dendricity, particle properties, and environmental parameters. The model highlights the critical role of particle shape and microstructure, alongside environmental conditions, in determining edge adhesion in snow cornices.
Although this study focuses on the initial stage of snow cornice formation at the micro-scale, the fundamental processes of adhesion of wind-transported snow particles are consistent across all scales, from laboratory conditions to natural environments. The direct experimental observations of single particles help bridge the gap between theoretical models and natural phenomena. Our experiments and findings enhance predictions of cornice growth and avalanche risk, with broader implications for understanding snow adhesion on both natural features and infrastructure, such as ice crevasse formation and wire icing.
Future studies should continue to explore the interactions between environmental factors and particle behavior to refine our understanding of snow cornice dynamics. Numerical simulations will be essential for a more comprehensive understanding of the coupling between the flow field and snow cornice dynamics, and investigate the effects of mountain morphology on cornice growth.
| Symbol | Definition and units |
| A | Weighting parameter for dendricity |
| Ap | Projected area of particle [m2] |
| D | Diameter of particle [m] |
| g | Gravity acceleration [m s−2] |
| R | Particle radius [m] |
| Rth | Threshold radius for particles adhering to the edge [m] |
| vp | Particle velocity [m s−1] |
| vpx | Particle velocity component in x direction [m s−1] |
| vpy | Particle velocity component in y direction [m s−1] |
| vimv | Vertical impact velocity of particle [m s−1] |
| Fc | Cohesive force [N] |
| Ff | Frictional force [N] |
| Fg | Gravity force [N] |
| Fs | Supporting force [N] |
| Ms | Total moment [N⋅m] |
| P | Perimeter of particle [m] |
| x | Radius of contact surface [m] |
| t | Current time [s] |
| τb | Bond shear stress [Pa] |
| Δt | Time step [s] |
| Tair | Air temperature [°C] |
| θp | Particle moving angle [°] |
| θim | Particle impact angle [°] |
| θ | Cornice angle [°] |
| α | Angle between direction of gravity and cohesion force [°] |
| β | Angle between direction of gravity and line [°] |
| μf | Friction coefficient of ice surface |
| ρi | Ice density [kg m−3] |
| δ | Ratio of contact radius to particle radius |
| dd | Dendricity |
| SSA | Specific surface area [mm2 mm−3] |
Code and data are available on request from the corresponding author.
YHX designed the experiments. YHX and LG carried out the experiments. YHX performed the data analysis, and prepared the first draft. ML, BW, HJP and HN reviewed and edited the paper. HN and ML organized this study, contributed to its conceptualization, discussion, and finalized the paper.
The contact author has declared that none of the authors has any competing interests.
Publisher’s note: Copernicus Publications remains neutral with regard to jurisdictional claims made in the text, published maps, institutional affiliations, or any other geographical representation in this paper. While Copernicus Publications makes every effort to include appropriate place names, the final responsibility lies with the authors. Views expressed in the text are those of the authors and do not necessarily reflect the views of the publisher.
The authors would like to thank the WSL Institute Snow and Avalanche Research SLF for making the experimental facilities available for our study. We thank Alec van Herwijnen for his invaluable experiment support. Additionally, we are deeply grateful to the two anonymous reviewers and two scholars (Li Hongyi and Li Bailiang) for their insightful comments and constructive suggestions, which have greatly contributed to improving the quality and clarity of this paper.
This work was supported by the Joint Funds of the National Natural Science Foundation of China (grant no. U22A20564), the Young Scientists Fund of the National Natural Science Foundation of China (grant no. 42406255), China Postdoctoral Science Foundation (grant no. 2024M751257), the Natural Science Foundation of Gansu Province (grant no. 24JRRA525), the Fundamental Research Funds for the Central Universities (grant no. lzujbky-2025-pd07), and the Swiss National Science Foundation (grant no. 200020-179130).
This paper was edited by Guillaume Chambon and reviewed by two anonymous referees.
Anderson, R. S. and Haff, P. K.: Wind modification and bed response during saltation of sand in air, in: Aeolian grain transport 1, 21–51, Springer, https://doi.org/10.1007/978-3-7091-6706-9_2, 1991. a
Baek, S. J. and Lee, S. J.: A new two-frame particle tracking algorithm using match probability, Experiments in Fluids, 22, https://doi.org/10.1007/BF01893303, 1996. a
Bagnold, R. A.: The physics of blown sand and desert dunes, Courier Corporation, https://doi.org/doi=10.1007/978-94-009-5682-7_2, 2012. a, b
Bartlett, S. J., Rüedi, J.-D., Craig, A., and Fierz, C.: Assessment of techniques for analyzing snow crystals in two dimensions, Annals of Glaciology, 48, 103–112, https://doi.org/10.3189/172756408784700752, 2008. a
Colbeck, S. C.: An overview of seasonal snow metamorphism, Reviews of Geophysics, 20, 45–61, https://doi.org/10.1029/RG020i001p00045, 1982. a
Comola, F. and Lehning, M.: Energy- and momentum-conserving model of splash entrainment in sand and snow saltation, Geophysical Research Letters, 44, 1601–1609, https://doi.org/10.1002/2016GL071822, 2017. a
Comola, F., Giometto, M., Salesky, S., Parlange, M., and Lehning, M.: Preferential Deposition of Snow and Dust Over Hills: Governing Processes and Relevant Scales, Journal of Geophysical Research: Atmospheres, 124, https://doi.org/10.1029/2018JD029614, 2019. a
Crocker, J. C. and Grier, D. G.: Methods of Digital Video Microscopy for Colloidal Studies, Journal of Colloid and Interface Science, 179, 298–310, https://doi.org/10.1006/jcis.1996.0217, 1996. a
DeBonis, J.: A Large-Eddy Simulation Of Turbulent Flow Over A Backward Facing Step, https://doi.org/10.2514/6.2022-0337, 2022. a, b
Di Stefano, L. and Bulgarelli, A.: A simple and efficient connected components labeling algorithm, in: Proceedings 10th International Conference on Image Analysis and Processing, 322–327, https://doi.org/10.1109/ICIAP.1999.797615, 1999. a
Eckerstorfer, M., Christiansen, H. H., Vogel, S., and Rubensdotter, L.: Snow cornice dynamics as a control on plateau edge erosion in central Svalbard, Earth Surface Processes and Landforms, 38, 466–476, 2013. a, b, c, d
Golubev, V. N. and Frolov, A.: On the correlation between tensile strength and stress wave velocities of dry coherent snow based on its structural model, Annals of Glaciology, 32, 70–74, https://doi.org/10.3189/172756401781819562, 2001. a
Gonzalez, R. C. and Woods, R. E.: Digital Image Processing, 4th edn., Pearson, ISBN 9781292223049, 2017. a
Hancock, H., Eckerstorfer, M., Prokop, A., and Hendrikx, J.: Quantifying seasonal cornice dynamics using a terrestrial laser scanner in Svalbard, Norway, Nat. Hazards Earth Syst. Sci., 20, 603–623, https://doi.org/10.5194/nhess-20-603-2020, 2020. a, b
Jamieson, J. and Johnston, C.: In-Situ Tensile Tests of Snow-Pack Layers, Journal of Glaciology, 36, 102–106, https://doi.org/10.3189/S002214300000561X, 1990. a
John, W.: Particle-Surface Interactions: Charge Transfer, Energy Loss, Resuspension, and Deagglomeration, Aerosol Science Technology, 23, 2–24, https://doi.org/10.1080/02786829508965291, 1995. a
Lämmel, M., Dzikowski, K., Kroy, K., Oger, L., and Valance, A.: Grain-scale modeling and splash parametrization for aeolian sand transport, Physical Review E, 95, 022902, https://doi.org/10.1103/PhysRevE.95.022902, 2017. a
Latham, J. and Montagne, J.: The possible importance of electrical forces in the development of snow cornices, Journal of Glaciology, 9, 375–384, 1970. a, b
Loth, E.: Drag of non-spherical solid particles of regular and irregular shape, Powder Technology, 182, 342–353, https://doi.org/10.1016/j.powtec.2007.06.001, 2008. a
McClung, D. and Schaerer, P. A.: The avalanche handbook, The Mountaineers Books, ISBN: 978-1-68051-539-8, 2006. a
Montagne, J.: The University Course in Snow Dynamics – A Stepping-Stone to Career Interests in Avalanche Hazards, Journal of Glaciology, 26, 97–103, https://doi.org/10.3189/S0022143000010637, 1980. a
Nishimura, K. and Hunt, J. C. R.: Saltation and incipient suspension above a flat particle bed below a turbulent boundary layer, Journal of Fluid Mechanics, 417, 77–102, https://doi.org/10.1017/S0022112000001014, 2000. a
Paterna, E., Crivelli, P., and Lehning, M.: Decoupling of mass flux and turbulent wind fluctuations in drifting snow, Geophysical Research Letters, 43, 4441–4447, 2016. a
Rafael, G. and Richard, W.: Digital Image Processing, in: Digital Image Processing, 57–68, ISBN 013168728X, 9780131687288, 1993. a
Ren, Q., Ding, L., Dai, X., Jiang, Z., Ye, G., and De Schutter, G.: Determination of specific surface area of irregular aggregate by random sectioning and its comparison with conventional methods, Construction and Building Materials, 273, 122019, https://doi.org/10.1016/j.conbuildmat.2020.122019, 2021. a
Schleef, S., Jaggi, M., Löwe, H., and Schneebeli, M.: An improved machine to produce nature-identical snow in the laboratory, Journal of Glaciology, 60, 94–102, https://doi.org/10.3189/2014JoG13J118, 2014. a
Schmidt, R. A.: Threshold Wind-Speeds and Elastic Impact in Snow Transport, Journal of Glaciology, 26, 453–467, https://doi.org/10.3189/S0022143000010972, 1980. a
Seligman, G., Seligman, G. A., and Douglas, C.: Snow structure and ski fields: being an account of snow and ice forms met with in nature, and a study on avalanches and snowcraft, Macmillan and Company, limited, https://doi.org/10.2307/1786360, 1936. a, b, c
Shehadi, E.: Large Eddy Simulation of Turbulent Flow over a Backward-Facing Step, PhD thesis, https://doi.org/10.13140/RG.2.2.17703.24480, 2018. a
Solomon, C. J. and Breckon, T.: Fundamentals of Digital Image Processing: A Practical Approach with Examples in Matlab, https://doi.org/10.1002/9780470689776, 2011. a
Sommer, C. G., Lehning, M., and Fierz, C.: Wind tunnel experiments: saltation is necessary for wind-packing, Journal of Glaciology, 63, 950–958, https://doi.org/10.1017/jog.2017.53, 2017. a, b
Sommer, C. G., Lehning, M., and Fierz, C.: Wind tunnel experiments: influence of erosion and deposition on wind-packing of new snow, Frontiers in Earth Science, 6, 4, https://doi.org/10.3389/feart.2018.00004, 2018a. a
Sommer, C. G., Wever, N., Fierz, C., and Lehning, M.: Investigation of a wind-packing event in Queen Maud Land, Antarctica, The Cryosphere, 12, 2923–2939, https://doi.org/10.5194/tc-12-2923-2018, 2018b. a
Szabo, D. and Schneebeli, M.: Subsecond sintering of ice, Applied Physics Letters, 90, 151916–151916, https://doi.org/10.1063/1.2721391, 2007. a
Tagliavini, G., Khan, M. H., Mccorquodale, M., Westbrook, C., and Holzner, M.: Wake characteristics of complex-shaped snow particles: Comparison of numerical simulations with fixed snowflakes to time-resolved particle tracking velocimetry experiments with free-falling analogs, Physics of Fluids, 34, 055112, https://doi.org/10.1063/5.0089759, 2022. a
van Herwijnen, A. and Fierz, C.: Monitoring snow cornice development using time-lapse photography, in: Proceedings of the International Snow Science Workshop, 865–869, https://api.semanticscholar.org/CorpusID:56056200 (last access: 29 October 2025) 2014. a
Vivacqua, V., López, A., Hammond, R., and Ghadiri, M.: DEM analysis of the effect of particle shape, cohesion and strain rate on powder rheometry, Powder Technology, 342, 653–663, https://doi.org/10.1016/j.powtec.2018.10.034, 2019. a
Vogel, S., Eckerstorfer, M., and Christiansen, H. H.: Cornice dynamics and meteorological control at Gruvefjellet, Central Svalbard, The Cryosphere, 6, 157–171, https://doi.org/10.5194/tc-6-157-2012, 2012. a, b, c, d
Wahl, S., Walter, B., Aemisegger, F., Bianchi, L., and Lehning, M.: Identifying airborne snow metamorphism with stable water isotopes, The Cryosphere, 18, 4493–4515, https://doi.org/10.5194/tc-18-4493-2024, 2024. a
Walter, B., Weigel, H., Wahl, S., and Löwe, H.: Wind tunnel experiments to quantify the effect of aeolian snow transport on the surface snow microstructure, The Cryosphere, 18, 3633–3652, https://doi.org/10.5194/tc-18-3633-2024, 2024. a, b, c
Yu, H., Li, G., Huang, N., and Lehnin, M.: Idealized Study of a Static Electrical Field on Charged Saltating Snow Particles, Frontiers in Earth Science, 10, 880466, https://doi.org/10.3389/feart.2022.880466, 2022. a
Yu, H., Li, G., Walter, B., Lehning, M., Zhang, J., and Huang, N.: Wind conditions for snow cornice formation in a wind tunnel, The Cryosphere, 17, 639–651, https://doi.org/10.5194/tc-17-639-2023, 2023. a, b, c, d, e, f, g
Yu, H., Li, G., Jafari, M., Lehning, M., Huang, J., and Huang, N.: Effect of snow cornice formation on wind fields and snow deposition: Insights from numerical simulations, Journal of Geophysical Research: Atmospheres, 130, e2024JD042702, https://doi.org/10.1029/2024JD042702, 2025. a, b, c, d