the Creative Commons Attribution 4.0 License.
the Creative Commons Attribution 4.0 License.
 | 29 Oct 2025
Emulating the expansion of Antarctic perennial firn aquifers in the 21st century
Sanne B. M. Veldhuijsen
Willem Jan van de Berg
Peter Kuipers Munneke
Nicolaj Hansen
Fredrik Boberg
Christoph Kittel
Charles Amory
Michiel R. van den Broeke
Perennial firn aquifers (PFAs) are year-round bodies of liquid water within firns, which modulate meltwater runoff to crevasses, potentially impacting ice-shelf and ice-sheet stability. Recently identified in the Antarctic Peninsula, PFAs form in regions with both high surface melt and snow accumulation rates and are expected to expand due to the anticipated increase in surface melt and snowfall. Using a firn model to predict future Antarctic PFAs for multiple climatic forcings is relatively computationally expensive. To address this, we developed an XGBoost perennial firn aquifer emulator, a fast machine learning model. It was trained, using a scenario and spatial blocking evaluation approach, on PFA output of simulations from the firn densification model IMAU-FDM, which was forced by the combined regional climate model RACMO2.3p2 and the global climate model CESM2 for three emission scenarios (SSP1-2.6, SSP2-4.5 and SSP5-8.5). The trained emulator was applied on nine additional forcings (2015–2100) from the regional climate models MAR and HIRHAM in combination with five global climate models. We show that the emulator is robust, explaining at least 89 % of the variance in PFA presence and meltwater storage. Our results indicate that, for the SSP1-2.6 and SSP2-4.5 scenarios, PFAs remain mostly restricted to the Antarctic Peninsula. For SSP5-8.5, PFAs expand to Ellsworth Land in six out of the seven simulations and to Enderby Land in East Antarctica in five out of the seven simulations. Furthermore, the emulator predicts PFAs for similar surface melt and accumulation conditions when forced with MAR or RACMO data. For HIRHAM these conditions are slightly different, due to the different relationship between temperature, accumulation and melt in HIRHAM compared with RACMO. Overall, our findings show that PFAs are likely to expand in a warmer Antarctica, irrespective of the emission scenario, increasing the risk that an ice shelf collapses due to hydrofracturing.
- Article
(7294 KB) - Full-text XML
-
Supplement
(1570 KB) - BibTeX
- EndNote


The Antarctic Ice Sheet (AIS) has been losing mass since at least 2002 (Shepherd et al., 2019), contributing ∼10 % to global average sea level rise since 1993 (Oppenheimer et al., 2019). The primary factor currently contributing to AIS mass loss is enhanced basal melt beneath ice shelves (Smith et al., 2020), leading to their thinning, enhanced iceberg calving or collapse. This, in turn, reduces the ice-shelf buttressing effect, allowing inland ice to flow faster into the ocean. Another process that can indirectly reduce the buttressing effect of ice shelves is melt-pond-driven hydrofracturing. This mechanism contributes to ice-shelf disintegration, thereby reducing the ice-shelf volume, which in turn reduces the ice-shelf buttressing. This process is expected to increase under future warming (Lai et al., 2020; van Wessem et al., 2023). In the case of the disintegration of Larsen A and B ice shelves in 1995 and 2002, respectively, depletion of the firn air content and subsequent meltwater ponding and infilling of crevasses is generally thought to have caused hydrofracturing (Scambos et al., 2000; Banwell et al., 2013). Surface meltwater accumulation on ice shelves can trigger ice-shelf collapse when tensile stresses are sufficiently large (Banwell et al., 2013). Currently, 60 % of the ice-shelf area buttresses upstream ice and is vulnerable to hydrofracturing if inundated by meltwater (Lai et al., 2020).
While much attention has been directed to melt accumulation on the ice-shelf surface following firn air depletion, meltwater storage within the firn layer can also modulate meltwater drainage to crevasses (e.g. Scambos et al., 2009). Under climatic conditions characterized by high surface melt rates and snow accumulation, liquid water can persist year-round within the firn's pore space, forming perennial firn aquifers (PFAs). As snow has a low thermal conductivity (Calonne et al., 2019), high snowfall rates in autumn and winter rapidly cover and insulate the summer meltwater and thereby prevent it from refreezing in winter.
PFAs are common across south-east Greenland (e.g. Forster et al., 2014; Miège et al., 2016). On the AIS, firn aquifers have been observed on Wilkins and Müller ice shelves in the western Antarctic Peninsula (AP) (Montgomery et al., 2020; MacDonell et al., 2021), the warmest and wettest region of Antarctica. An exploratory firn modelling study predicted PFAs to occur also on the grounded ice along the north-western coast of the AP (van Wessem et al., 2021). Combining regional climate model (RCM) output with satellite data confirms a high probability of PFA occurrence in all these regions (Di Biase et al., 2024). Increasing surface melt and snowfall may result in future PFA expansion, also to other regions of Antarctica. Similarly, an inland expansion of aquifers occurred over the last decades in Greenland (Horlings et al., 2022). However, the future distribution of PFAs in Antarctica has not yet been explored.
The year-round availability of water at depth in firn aquifers can lead to hydrofracturing when stress conditions shift to favour tensile extension or reduced compression, even during the winter (Scambos et al., 2009). This mechanism can initiate cascading drainage events that cause rapid and large-scale ice-shelf disintegration. The partial break-ups of northern and north-western Wilkins Ice Shelf in 1993, 1998 and 2008–2009 could well exemplify this process, as the detection of bright reflectors in airborne radar surveys indicated the presence of a firn aquifer (e.g. Braun et al., 2009; Scambos et al., 2000; Montgomery et al., 2020). These events highlight how water stored in firn aquifers can accelerate disintegration. Similarly, Müller Ice Shelf, which also contains firn aquifers, has lost a considerable portion of its surface area (49 %) since the 1950s (Cook and Vaughan, 2010) while neighbouring Jones and Wordie ice shelves, with similar climatic conditions, have completely disintegrated (Cook and Vaughan, 2010).
PFAs can also play an important role over the grounded ice. In Greenland, liquid water from PFAs drains through crevasses to the bed (Poinar et al., 2017), leading to basal lubrication, at least temporarily increasing ice velocity and ice discharge into the ocean (Zwally et al., 2002). Warming through the release of latent heat during refreezing changes the ice rheology (Hubbard et al., 2016). Hence, understanding the future evolution of PFAs is relevant when assessing the future stability of ice shelves and grounded ice.
Offline firn models forced by outputs of RCMs have proven to be useful tools to simulate the ice-sheet wide transient evolution of firns. They have already been used to simulate historical firn aquifers over Greenland (Brils et al., 2024) and the AP (van Wessem et al., 2021). RCMs are better suited for this than global climate models (GCMs), whose resolution is too coarse to correctly represent strong coastal gradients in precipitation and surface melt (Bozkurt et al., 2021), which are particularly important for PFA formation (van Wessem et al., 2021). In addition, most GCMs do not properly represent important physical processes, such as the snowmelt–albedo feedback (Jakobs et al., 2019).
For future projections of PFA extent, multiple climatic scenarios and combinations of RCMs and GCMs are ideally used, as projections of near-surface climatic conditions and surface melt extent over Antarctica vary widely among models (Carter et al., 2022; Kittel et al., 2021). However, running a firn model for multiple forcings is relatively computationally demanding and requires 3-hourly model output, which is regularly unavailable. To enable projections under a wide range of climate forcings, we developed an XGBoost-based PFA emulator to estimate future PFA extent. Emulators are statistical or machine learning models that are trained on specific output of a more complex model. Emulators can be based on simple statistical models, such as linear regression, or use more advanced machine learning approaches, such as random forest or XGBoost regressors. Several studies have used emulators to simulate firn properties (Dunmire et al., 2024; Verjans et al., 2021; Jourdain et al., 2024), as well as other ice-sheet processes (Van Katwyk et al., 2023). XGBoost is a decision tree-based method (Chen and Guestrin, 2016) that has been shown to outperform other machine learning algorithms, such as neural networks, random forest regression and linear regression methods, for various glaciological applications (Anilkumar et al., 2023; Iban and Bilgilioglu, 2023; Sun et al., 2024).
We train and evaluate the PFA emulator using output from the IMAU Firn Densification Model v1.2AD (IMAU-FDM v1.2AD), which was recently updated by Veldhuijsen et al. (2024d) to better simulate transient firn densification in a changing climate. IMAU-FDM was forced by future climate realizations of the GCM CESM2, dynamically downscaled over the entire AIS by the RCM RACMO2.3p2 to a 27 km resolution, for emission scenarios SSP1-2.6, SSP2-4.5 and SSP5-8.5 (Veldhuijsen et al., 2024d). We subsequently apply our emulator to 12 climate projections from three polar RCMs (RACMO2.3p2, MAR3.11 and HIRHAM5), forced by several GCMs. We then report the resulting PFA distribution and expansion on the AIS.
2.1 IMAU-FDM firn model and forcing
IMAU-FDM version v1.2AD is a semi-empirical 1D firn densification model that simulates the time evolution of firn depth, density, temperature, grain size and liquid water content. Firn compaction is calculated based on the semi-empirical dry-snow densification equations of Arthern et al. (2010) with an updated dynamical densification expression to cope with changing climate forcing (Veldhuijsen et al., 2024d). The updated expression lets densification rate depend on firn temperature, grain size and overburden pressure, whereas previously the densification rate was modelled as depending on firn temperature along with averages over the past 40 years of accumulation and surface temperature. The vertical percolation of liquid water from melt or rain is simulated using the bucket method, whereby liquid water is only retained through capillary forces (i.e. irreducible water). The maximum irreducible water decreases with increasing density (Coléou and Lesaffre, 1998). The meltwater can percolate through all layers in a single time step and (partly) refreeze when it reaches a layer with non-zero pore space and a temperature below the freezing point. Once the liquid water content of the lowermost firn layer exceeds the maximum irreducible water content, the surplus is assumed to instantaneously leave the firn column as runoff. The bucket method is computationally efficient but does not allow for saturated pore spaces, preferential flow, standing water over ice layers or horizontal flow. Since perennial firn aquifers (PFAs) are defined as saturated firns, IMAU-FDM cannot simulate them. However, the model does simulate the insulation of downward percolating liquid water by sufficiently high accumulation rates, which prevent the meltwater from refreezing in the winter. Therefore, the presence of year-round or spring liquid water in a firn has been successfully used to identify the presence of an aquifer (Forster et al., 2014; van Wessem et al., 2021; Brils et al., 2024).
In the simulations presented here, IMAU-FDM is forced at the upper boundary, the snow surface, with 3-hourly values of snowfall, sublimation, snowdrift erosion, 10 m wind speed, surface temperature, surface melt and rainfall from simulations of the regional climate model (RCM) RACMO2.3p2 at a 27 km resolution (van Wessem et al., 2023). RACMO2.3p2 was in turn forced by the Community Earth System Model version 2 model output (CESM2) (Danabasoglu et al., 2020). These simulations consist of a historical climate realization (1950–2014) and climate realizations for low-, middle- and high-emission future (2015–2100) scenarios (SSP1-2.6, SSP2-4.5 and SSP5-8.5, respectively). The projected Antarctic end-of-century (2090–2100) warming in SSP5-8.5 in CESM2 (+6.7 K) compared with 2005–2015 is stronger than the mean Antarctic warming in CMIP6 models (+4.8 K); this enables us to train the firn model on a wide range of temperatures (Dunmire et al., 2022; Kittel et al., 2021). The coupling between RACMO2.3p2 and IMAU-FDM is unidirectional. The stand-alone approach of IMAU-FDM allows for a more realistic initialization and higher vertical resolution than RACMO's built-in firn model, which uses similar physics. The disadvantage is that interaction with the atmosphere is not possible. An initial firn layer is obtained by looping over the forcing of the 1950–2000 reference period until the firn layer is in equilibrium with the surface climate. The model employs up to 3000 layers of 3 to 15 cm thickness, which represent the firn properties in a Lagrangian way. For further details of the model set up and forcing, we refer to Veldhuijsen et al. (2024d).
2.2 PFA emulator
We develop a PFA emulator that mimics how IMAU-FDM transiently simulates PFAs. We use the annual perennial amount of liquid water content (LWC) as the target variable (see Sect. 2.2.1). To emulate PFAs we use an extreme gradient boosting (XGBoost) machine learning model (Chen and Guestrin, 2016). The model was developed in Python using the open-source scikit-learn and XGBoost packages. XGBoost sequentially builds an ensemble of weak decision trees. In each iteration, it fits a new tree to the residuals of the previous iteration, optimizing a specific objective function to minimize the overall prediction error.
XGBoost is chosen for its high predictive accuracy and because it has been shown to outperform other machine learning algorithms, including neural networks, random forest regression and linear regression methods, in predicting, e.g., snow water equivalent, snow avalanche susceptibility and glacier mass balance (Anilkumar et al., 2023; Iban and Bilgilioglu, 2023; Sun et al., 2024) and in general for medium-sized and large (>10 000) tabular datasets (Grinsztajn et al., 2022). Additionally, XGBoost is highly scalable, meaning it can handle large datasets and complex models. Furthermore, XGBoost incorporates regularization techniques to prevent overfitting and has built-in mechanisms to estimate feature importance. Recently, a random forest model, a bagging algorithm that trains decision trees in parallel, has been used to emulate firn air content over Antarctica (Dunmire et al., 2024). While random forest is known for its simplicity, ease-of-use and resistance to overfitting, XGBoost often better captures complex non-linear relationships, especially in scenarios where there are interactions between features or when the dataset is high-dimensional (Fatima et al., 2023).
2.2.1 Target variable and input features
Our target variable is the annual perennial LWC, which is defined as the minimum vertically integrated LWC over a year, based on model output at 10 d intervals. An annual perennial LWC of 0 indicates the absence of LWC at some point during a year, meaning there is no PFA. A drawback of this approach is that it does not differentiate between years with brief periods without LWC (e.g. 10 d) and years with long periods without LWC (e.g. 10 months). Since the target variable, the annual perennial LWC, cannot take negative values, this prevents negative values from counterbalancing positive biases in the predictions (e.g. an asymmetric distribution of the errors). To address this, we introduce negative values to represent the number of days without LWC during periods when PFAs are absent. This enables us to capture both the presence and absence of LWC in a unified way. For example, if LWC is absent for 10 d, the target value is −10; if LWC is absent for 10 months, the target value is approximately −300. Although the negative and positive quantities are conceptually distinct, their absolute magnitudes are comparable in scale, providing a relatively smooth transition around 0. To further clarify, this method does not involve averaging LWC values with negative values. Instead, the target variable is a single, unified measure that can take either positive values (indicating LWC amount) or negative values (indicating days without LWC). If the target variable exceeds 0, it is considered to indicate the presence of a PFA.
The climate variables used as input features for our emulator are (1) total annual snow accumulation (snowfall minus evaporation/sublimation), (2) total autumn (MAM) snow accumulation, (3) total summer (DJF) snowfall, (4) total annual liquid water input (surface melt plus rainfall), (5) annual melt-over-accumulation (MoA) ratio, (6) mean annual surface temperature, (7) mean summer (DJF) surface temperature and (8) annual seasonal temperature amplitude. These input features describe the most important mass fluxes and boundary conditions governing firn density, temperature and LWC and ultimately the presence of PFAs (Kuipers Munneke et al., 2014; van Wessem et al., 2021). The annual seasonal temperature amplitude is defined as the difference between the average temperature of the warmest month and the coldest month. For the summer, we consider snowfall instead of snow accumulation, due to the likely presence of evaporation alongside sublimation, which decreases liquid water input, compared with sublimation, which decreases snow accumulation. To account for the time it takes for a firn to adjust to climatic conditions, we consider averages over the past 5, 10 and 30 years of the input features. Additionally, we include surface elevation and surface slope as input features, as the topography influences short-term climate variability, such as extreme precipitation (González Herrero et al., 2023). This amounts to 23 input features in total.
2.2.2 Dataset selection
The emulator is trained to predict annual perennial LWC across Antarctica. The dataset consists of 18 136 IMAU-FDM grid cells with 85 time steps each (years between 2015 and 2100), amounting to 4.6×10⁶ data points for three climate scenarios. However, for most of the AIS, the climate conditions are not favourable for aquifer formation, i.e. too dry and/or too cold, even under strong future warming. For instance, RACMO forced by CESM2 predicts that 76 % of the AIS does not experience any melt by the end of the century, even for the SSP5-8.5 scenario (Veldhuijsen et al., 2024d). To minimize the influence of non-aquifer locations, we limit the training dataset to aquifer-favourable locations. For each scenario, we select data points where PFAs are present or where the duration without LWC is shorter than 150 d. In addition, we select data points with aquifer-favourable conditions, defined as having more than 400 of accumulation and more than 200 of melt (van Wessem et al., 2021; Brils et al., 2024). From the remaining dataset, we randomly select 5000 points from each scenario. In total, our dataset used for training consists of 123 000 data points (2.6 % of the total AIS data points).
2.2.3 Emulator training
Our dataset has a spatial and temporal structure; to ensure independence between training and testing data, we split the training and testing data strategically rather than randomly (Roberts et al., 2017). Firstly, we evaluate the performance using spatial blocking cross-validation, with R2 as the scoring metric. For this, we divide the area in which firn aquifers occur into eight regions. During the cross-validation, we leave out one region at a time. Since firn aquifers are rare on the AIS, cross-validation ensures that the model is evaluated on the full dataset. Additionally, we also evaluate the performance by leaving out each of the three emission scenarios at a time, referred to as scenario blocking cross-validation. The initial 30 years of the future simulations (2015–2045) were excluded from the validation scores to avoid dependency on the other scenarios. Finally, we use all scenarios and regions for training the emulator, to ensure that the widest possible range of warming trends and climatic conditions are included in the emulator.
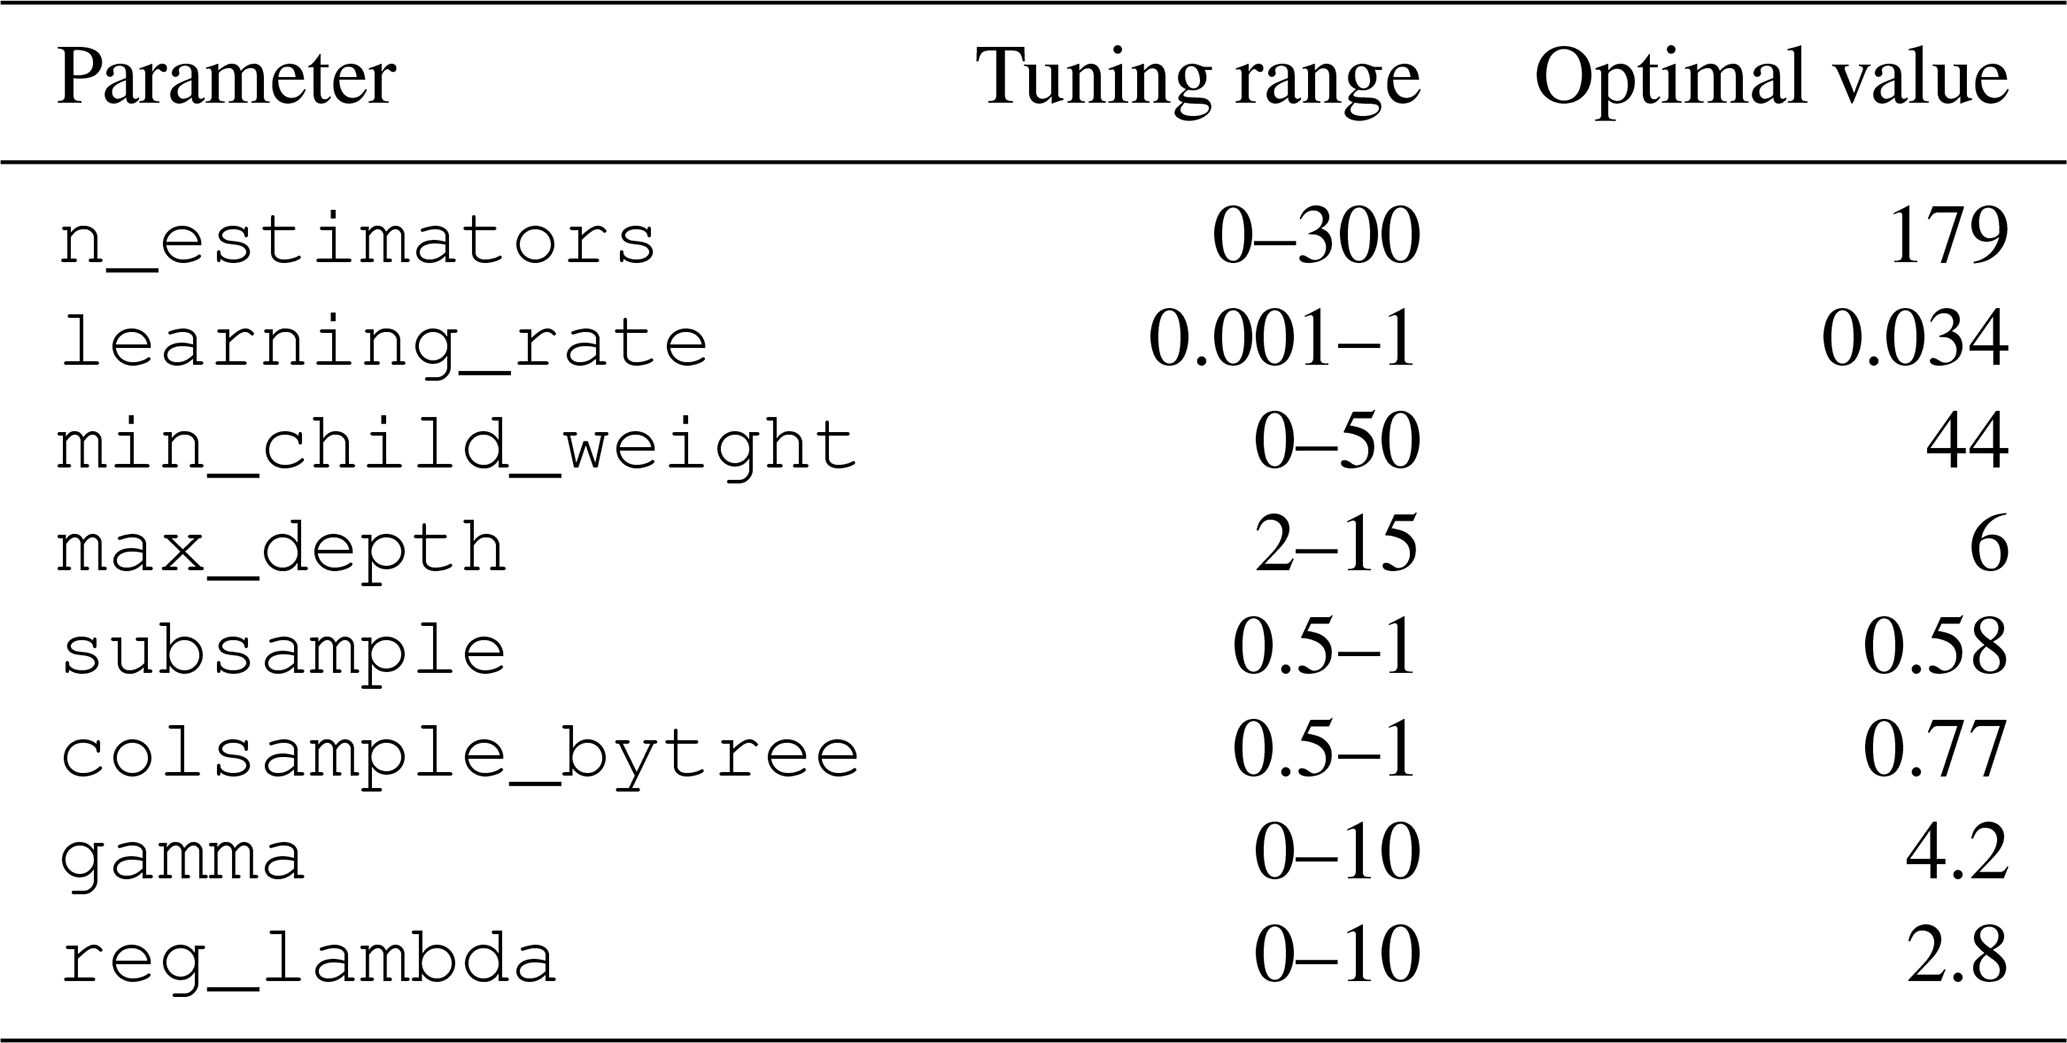
The hyperparameters are tuned using the BayesSearchCV function (built-in in scikit-learn) during the spatial blocking cross-validation. Eight key hyperparameters involved in the XGBoost algorithm were optimized. Firstly, the number of estimators (n_estimators) refers to the number of trees. The learning rate (learning_rate) controls the step size at which the optimizer makes updates to the weights. The regularization techniques included in XGBoost are the maximum depth of the trees (max_depth), the minimum weight needed in a leaf node (min_child_weight), the subsample ratio of the training instances (subsample), the subsample ratio of columns when constructing each tree (colsample_bytree), the minimum loss reduction (gamma) and the regularization degree (reg_lambda).
2.3 Emulator training and forcing data
IMAU-FDM simulations forced by RACMO-CESM for three scenarios (SSP1-2.6, SSP2-4.5 and SSP5-8.5) were used to train the PFA emulator. By applying the emulator to output from three polar RCMs, an ensemble of 12 scenarios of perennial LWC predictions for 2015–2100 is produced (Table 1). CESM2-forced runs of MAR (Jourdain et al., 2024) and HIRHAM (Hansen et al., 2021) RCMs are available for SSP1-2.6, SSP2-4.5 and SSP5-8.5 and SSP1-2.6 and SSP5-8.5, respectively. In addition, MAR simulations driven by global climate models (GCMs) ACCESS-1.3, NorESM1-M and CNRM-CM6-1 for SSP5-8.5 (Kittel et al., 2021) and HIRHAM simulations driven by GCMs EC-Earth3 for SSP5-8.5 (Boberg et al., 2022) were used. The horizontal resolution of each climate forcing is preserved in the emulator simulations. Although the probability of SSP5-8.5 scenarios is conceived as low, they are useful to assess low-probability/high-impact futures and they characterize the climate of the 22nd century (the probability for these conditions increases to about 7 % by 2150) (Sarofim et al., 2024). In addition, we are limited by the unavailability of downscaled forcing datasets over Antarctica for the alternative emission scenario SSP3-7.0.
Table 1List of available forcing datasets of regional climate models (RCMs) driven by global climate models (GCMs) along with the GCM era, GCM ensemble member number, RCM horizontal resolution and the available scenarios. We use the period 1980–2100 of all forcing datasets.
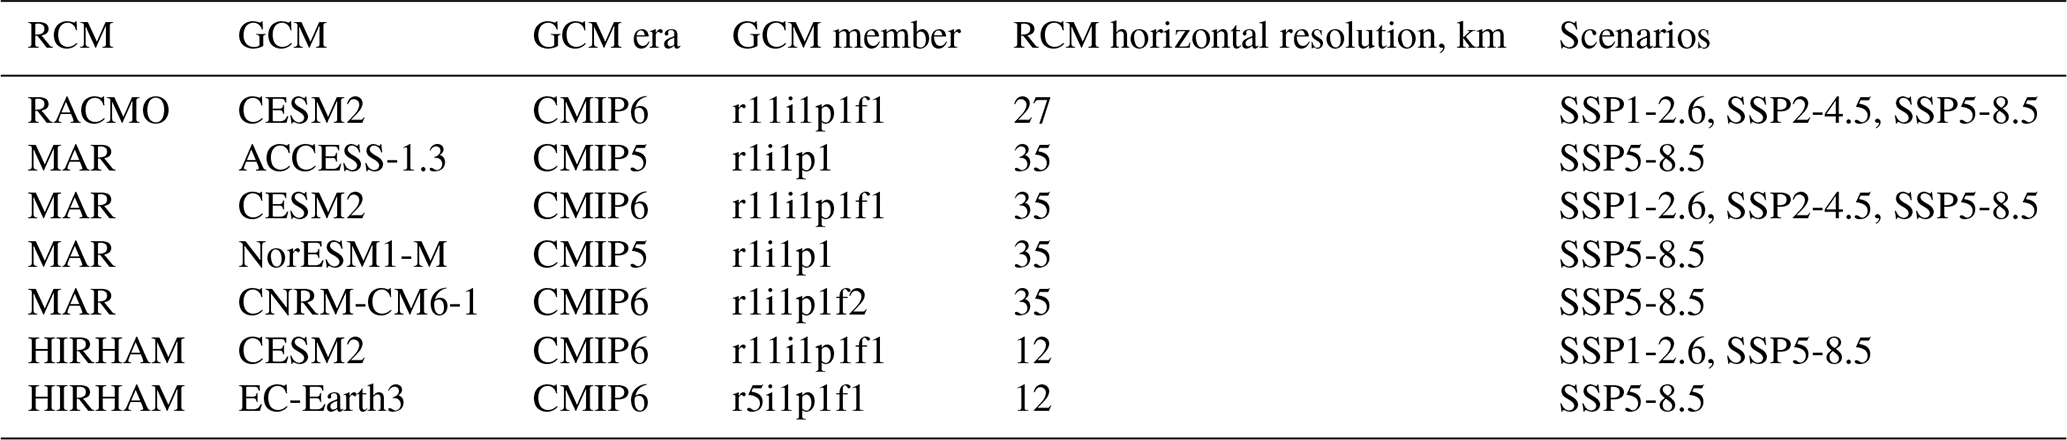
Even for the contemporary AIS climate, significant differences in near-surface air temperature, snowfall and melt exist between these three RCMs (Mottram et al., 2021; Carter et al., 2022). An important difference between the RCMs lies in the handling of precipitation advection: MAR allows precipitation to be advected through the atmospheric layers until the surface is reached, whereas RACMO and HIRHAM deposit precipitation instantaneously. Furthermore, RACMO and MAR use subsurface schemes optimized over snow and ice for Antarctica, while HIRHAM applies simpler surface snow physics for ice surfaces. In addition, notable climatic differences between the GCM simulations exists; for instance, the 21st century AIS warming for the four selected GCMs for MAR for SSP5-8.5 ranges from +3.2 K (NorESM1-M) to +8.5 K (CNRM-CM6-1; Kittel et al., 2021).
3.1 Emulator tuning
The eight regions used for the spatial blocking cross-validation are shown in Fig. 1. The optimal hyperparameters obtained during the spatial blocking cross-validation are listed in Table 2. We found that removing the 30-year average total annual liquid water input (surface melt plus rainfall) and surface temperature input features improved the performance. Therefore, we leave out the 30-year total annual liquid water input feature. The 30-year surface temperatures were replaced by the 30-year averaged temperature trend. This led to a small improvement in the performance (3 % less false negatives and 1 % less false positives).
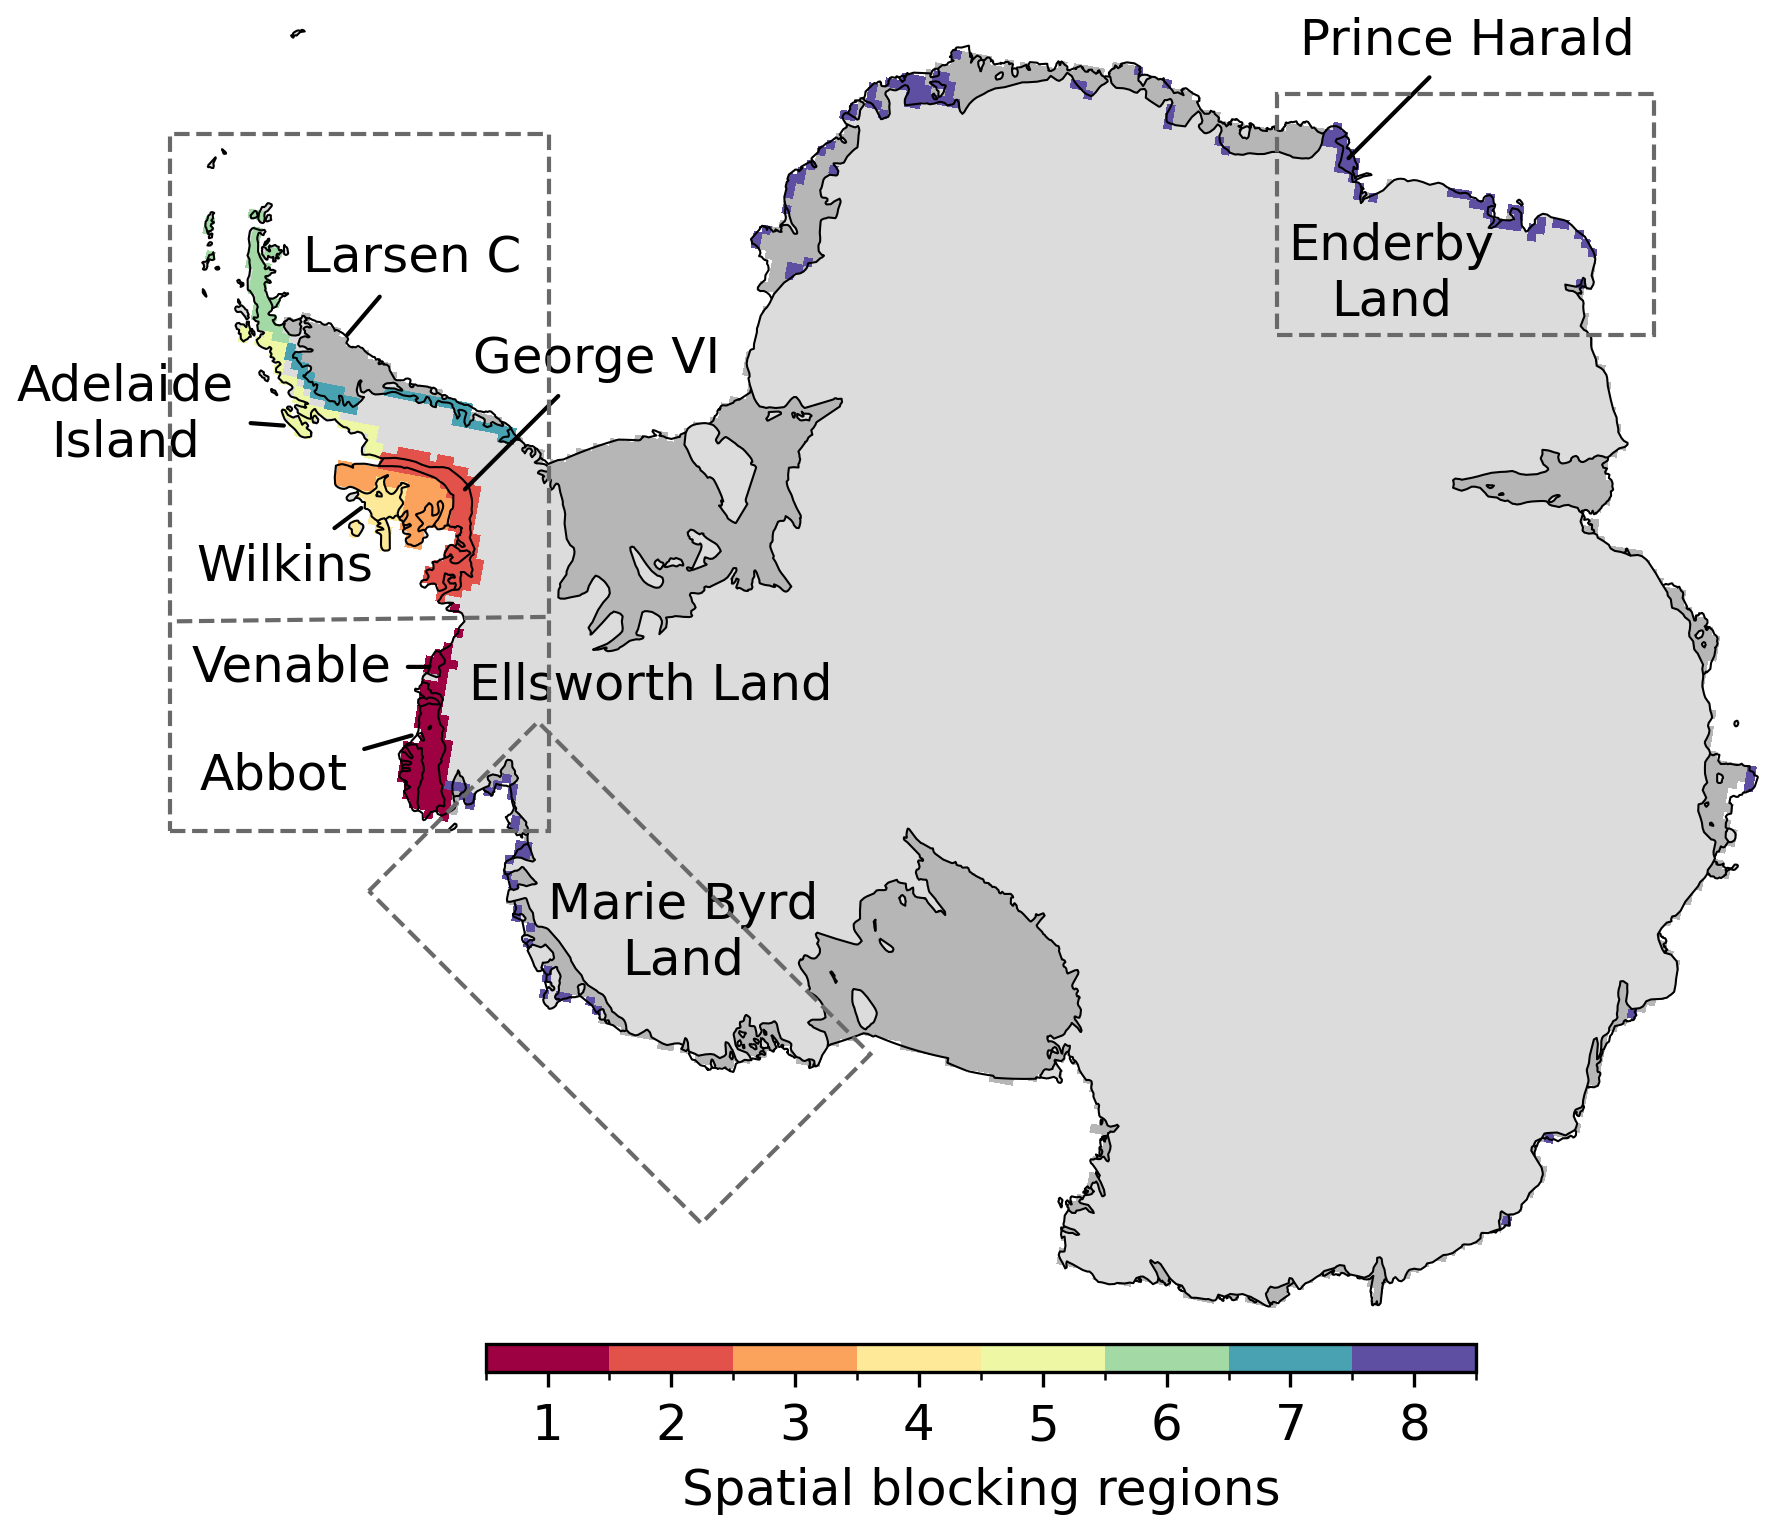
Table 2Hyperparameter ranges used for tuning and their optimal values.
3.2 Emulator evaluation
During the spatial blocking cross-validation, the emulator explains 89 % of the variance in the IMAU-FDM perennial liquid water content (LWC) (R2=0.89; Fig. 2a). The RMSE is 86 (mm for positive values, days for negative values) and the bias is 0.4 (mm for positive values, days for negative values). However, in this work we aim to predict the presence or absence of aquifers rather than perennial LWC. When employing a positive perennial LWC threshold to identify aquifers, the emulator successfully predicts 88 % of the IMAU-FDM aquifers (12 % false negatives) with 9 % false positives. The emulator yields an R2 value of 0.90 for the years with perennial firn aquifers (PFAs) of each grid point (Fig. 2c). Maps of PFA years of the Antarctic Peninsula and Ellsworth Land for the spatial blocking for SSP5-8.5 are shown in Fig. 3. Although Fig. 2c indicates some spread and outliers, Fig. 3 demonstrates that the firn model and emulator largely agree on the firn aquifer distribution; the differences are rather subtle. The performance, while using spatial blocking, is poorest on and around Larsen C and D ice shelves (region 7, RMSE =8 years), with under- and overestimates. When randomly, instead of strategically, splitting our training and testing data, the emulator yields a misleadingly high R2 value of 0.98; this highlights the importance of strategically splitting the data to prevent overfitting.
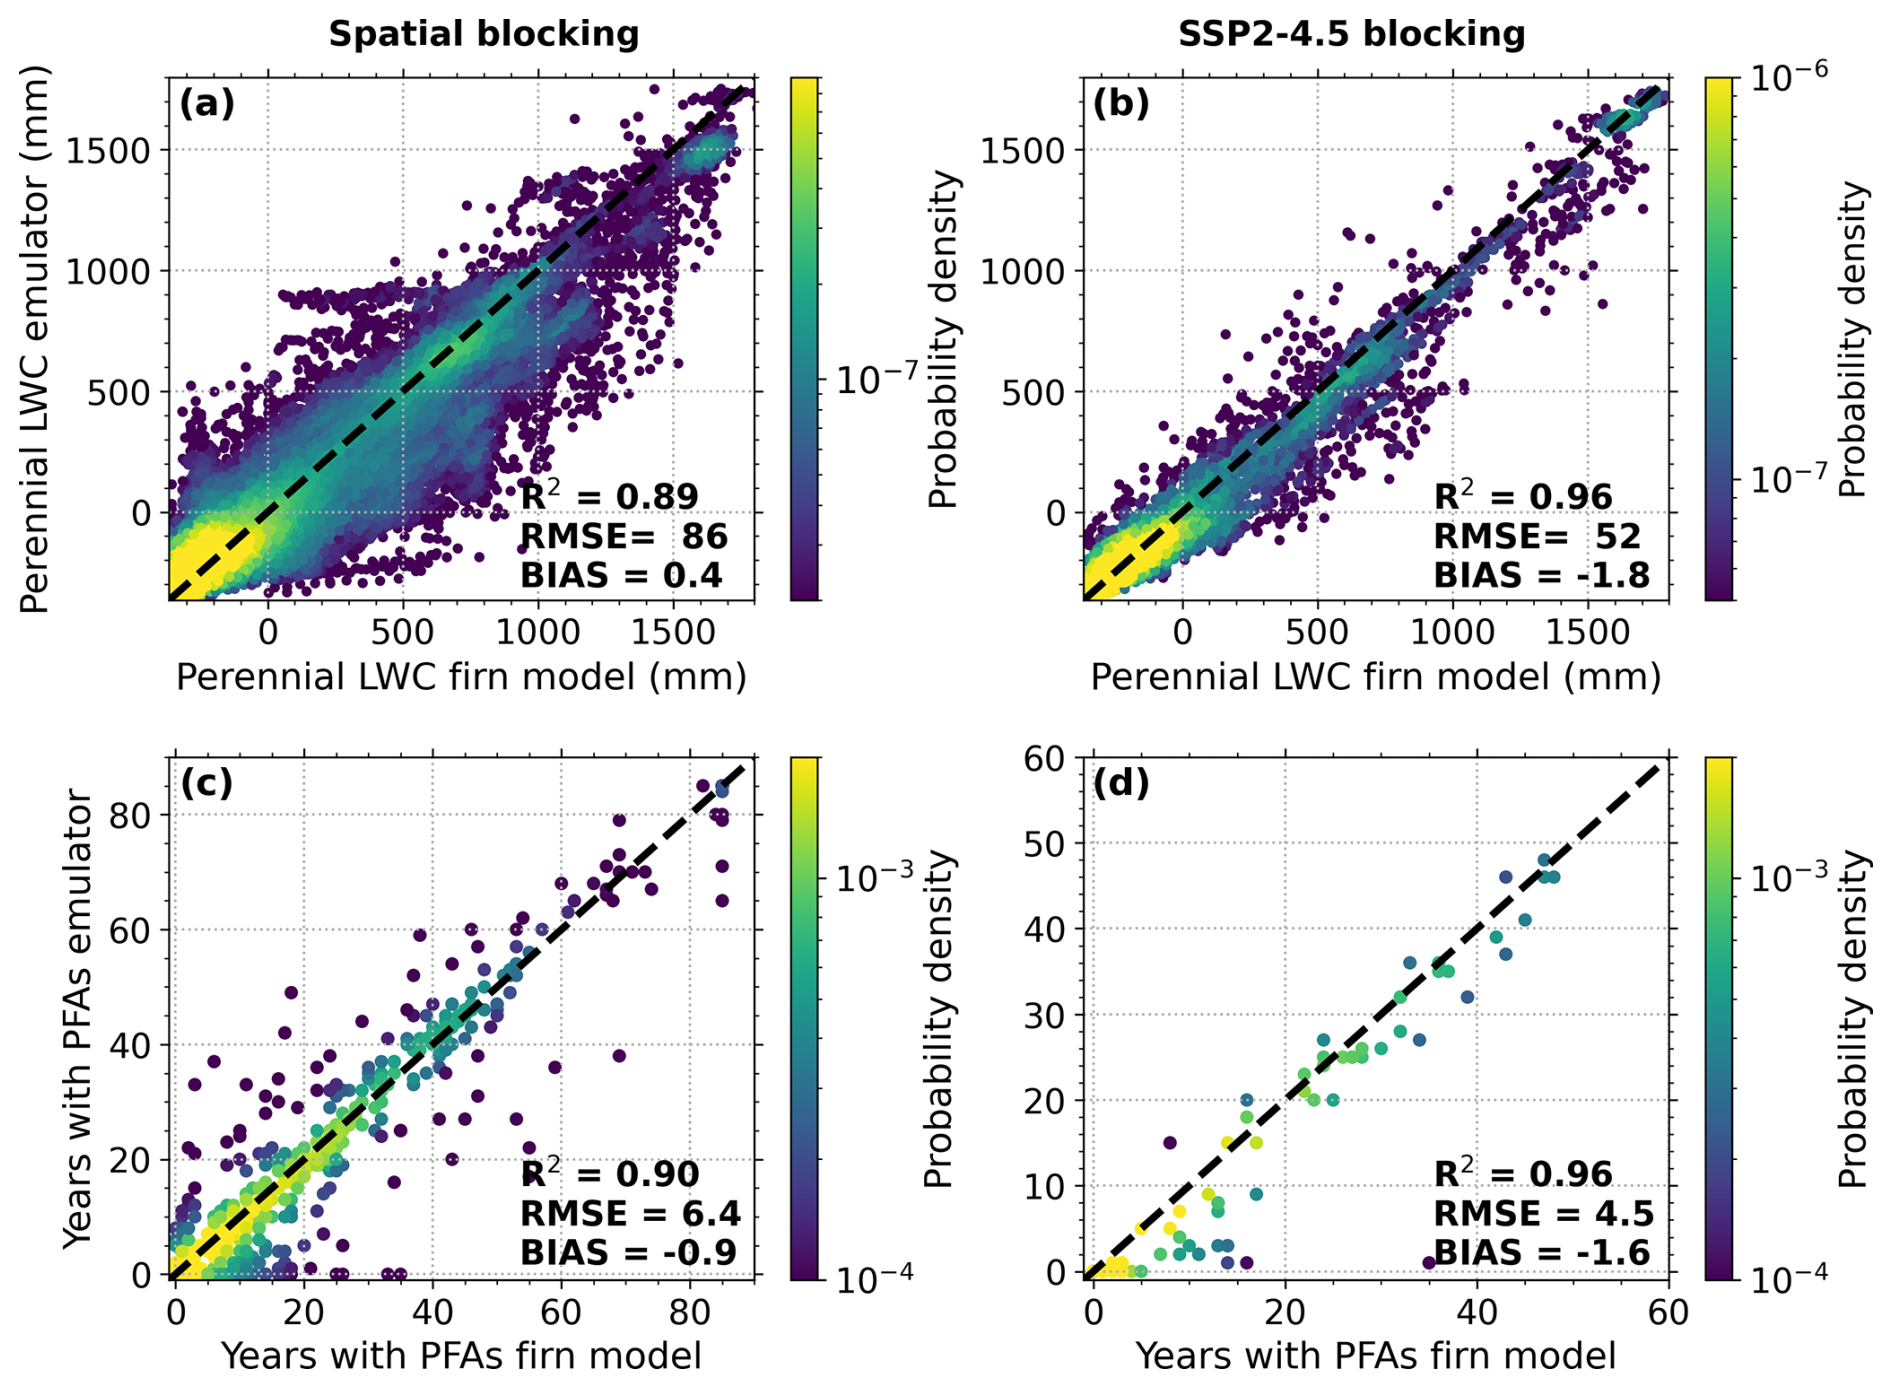
Figure 2(a, b) Perennial liquid water content (LWC) and (c, d) number of years with perennial firn aquifers (PFAs) from the (a, b) spatial blocking cross-validation and (c, d) SSP2-4.5 block validation. Panels (a) and (b) include the data points used for training and evaluation described in Sect. 2.2.2. Panels (c) and (d) include all locations where either the emulator or the model forecasts the presence of an aquifer or predicts fewer than 150 d without LWC in at least one year in the associated scenario.
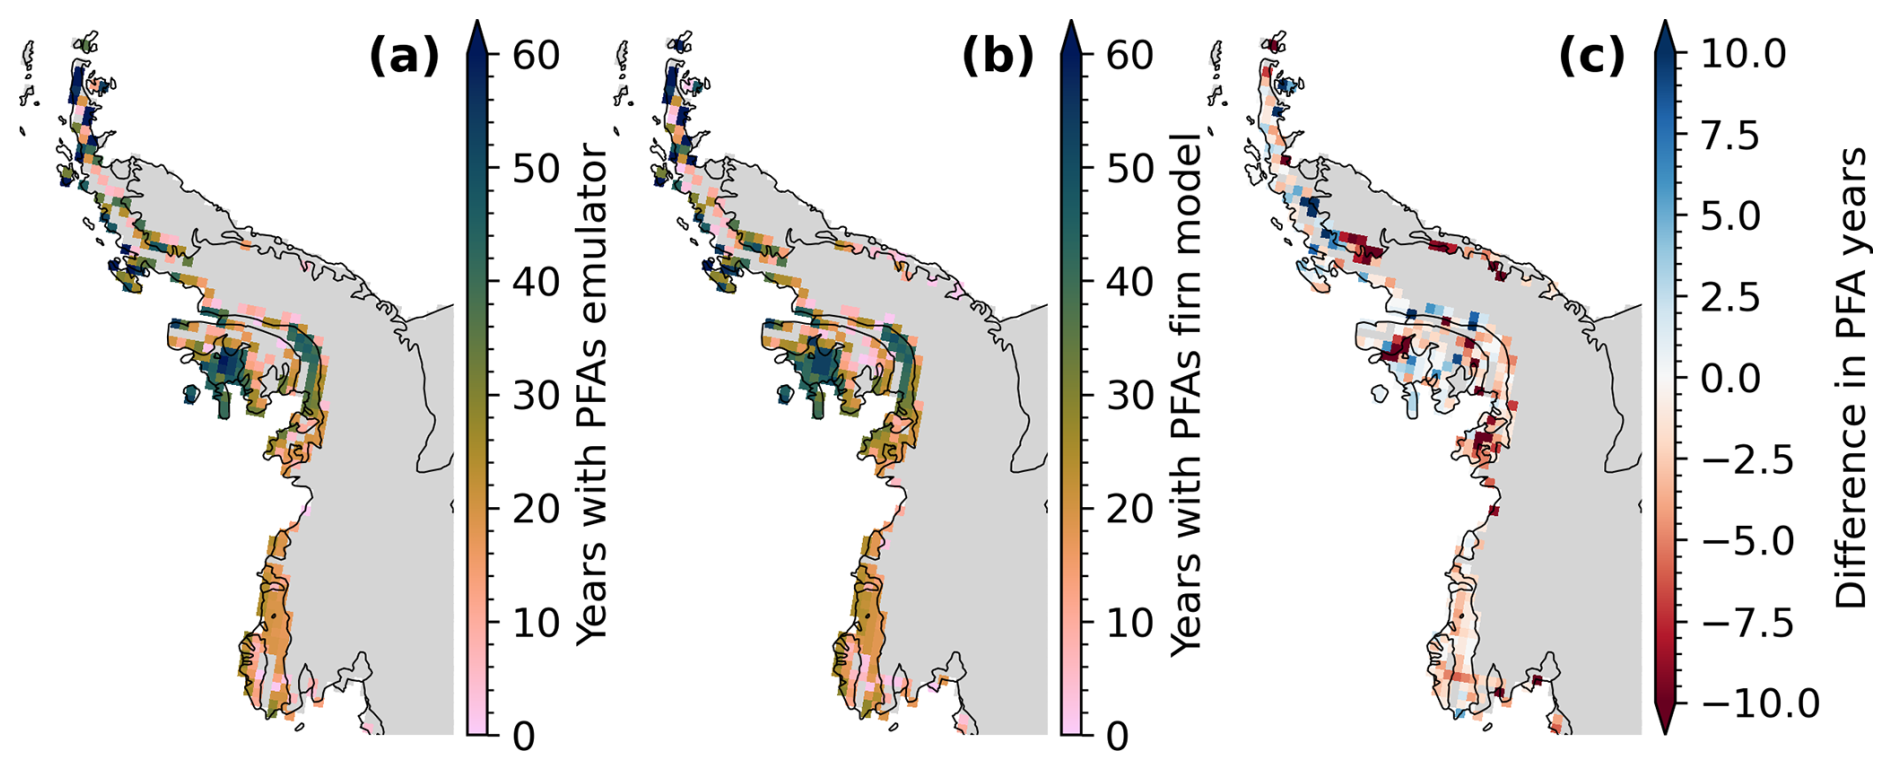
Figure 3Number of years with perennial firn aquifers (PFAs) under SSP5-8.5 from (a) the emulator during the spatial blocking validation and (b) the IMAU-FDM firn model and (c) the difference. The location of the depicted region is indicated in Fig. 1.
During the validation in which SSP2-4.5 is left out, the emulator yields an R2 value of 0.96 for both the perennial LWC and the years with PFAs (Fig. 2b and d). For this, we include all data of all locations where either the emulator or the model forecasts the presence of an aquifer or predicts fewer than 150 d without LWC in at least one year. The emulator successfully predicts 88 % of the IMAU-FDM aquifer years of the SSP2-4.5 scenario (12 % false negatives), with 7 % false positives. The results for leaving out SSP1-2.6 are similar, with the emulator predicting 92 % of the aquifer years with 11 % false positives (R2=0.96 and 0.97 for perennial LWC and years with PFAs, respectively). When leaving out the SSP5-8.5 scenario, the emulator predicts 89 % of the aquifer years, with 15 % false positives (R2=0.9 and 0.91 for perennial LWC and years with PFAs, respectively). The larger error can be attributed to the large differences in warming trend.
Four example time series from the spatial blocking and scenario blocking evaluations are shown in Fig. 4. This figure shows that the emulator can mimic the growth as well as the shrinking of aquifers. The figure also illustrates that deviations from the firn model mainly occur during the onset of aquifer formation, when aquifers are relatively small.
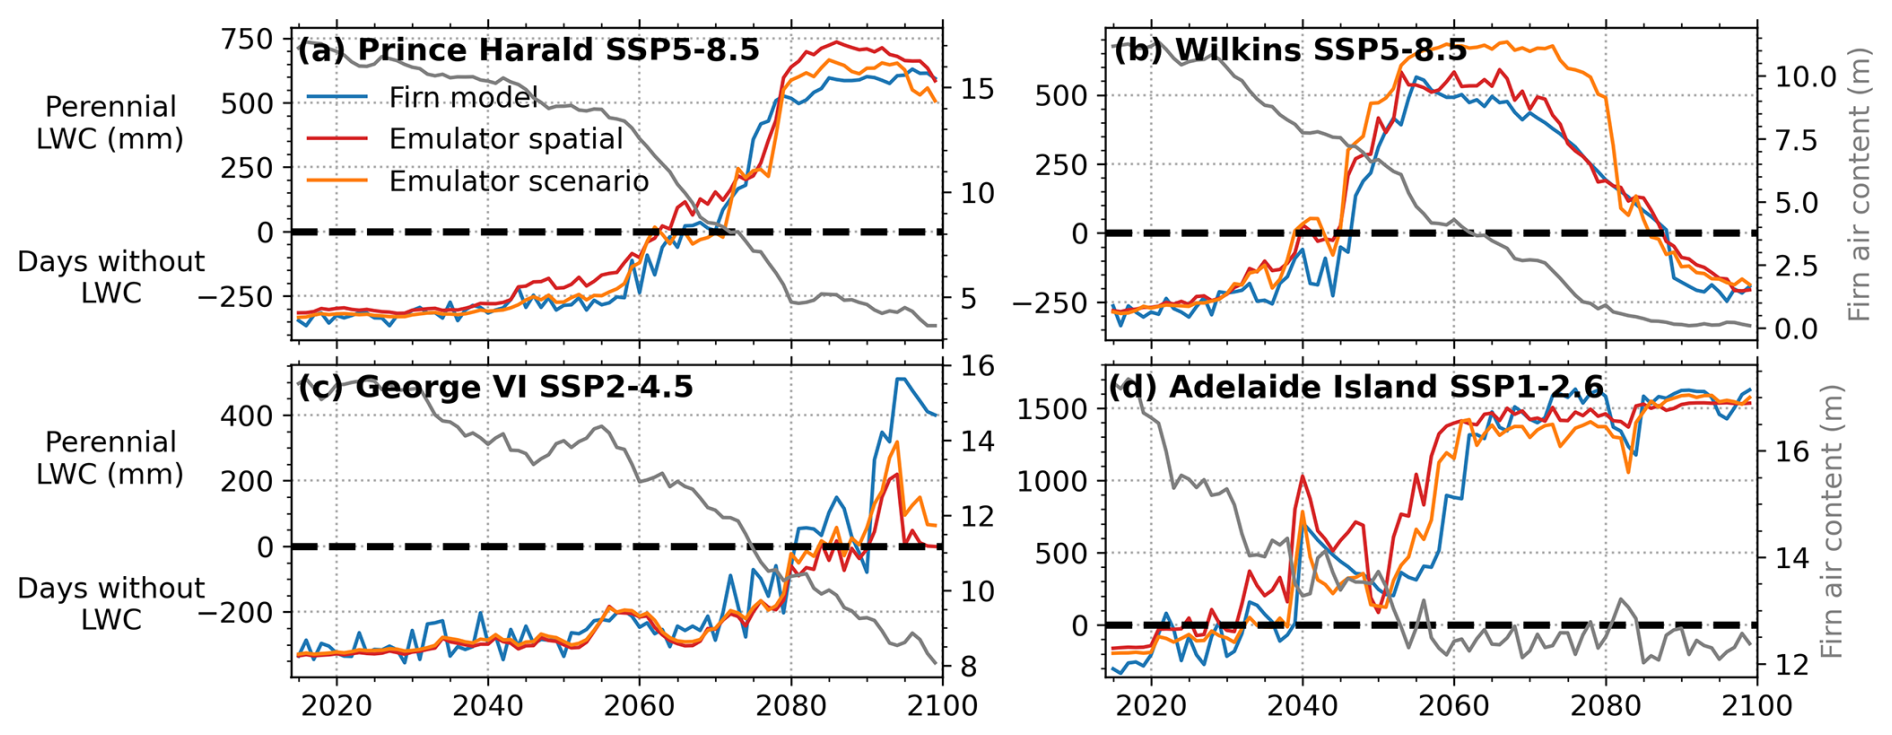
Figure 4Example time series of perennial liquid water content (LWC)/days without LWC for the firn model (blue) and the emulator, for spatial blocking (red) and for scenario blocking (orange), as well as firn air content for the firn model (grey), for individual grid points and different scenarios: (a, b) SSP5-8.5, (c) SSP2-4.5, (d) SSP1.2-6. The locations of the grid points are indicated in Fig. 1.
4.1 PFA predictions under scenarios SSP1-2.6 and SSP2-4.5
The trained emulator is used to predict perennial firn aquifers (PFAs) over the period 2015–2100 for the 12 forcings listed in Table 1. It should be noted that all available SSP1-2.6 and SSP2-4.5 regional climate model (RCM) forcings are from CESM2. For SSP1-2.6 and SSP2-4.5, PFAs are projected to remain mostly restricted to the Antarctic Peninsula (AP), except for expansion to Enderby Land (East Antarctica) under SSP2-4.5 for MAR-CESM (Fig. 5). The emulator predicts PFAs along the north-western coast of the AP for all forcings. Additionally, the emulator predicts PFAs on Wilkins Ice Shelf for SSP1-2.6 and SSP2-4.5 and on George VI Ice Shelf for SSP2-4.5 for RACMO-CESM forcings. Emulator predictions for MAR-CESM show aquifers on Wilkins and George VI ice shelves for SSP2-4.5 and both MAR forcings predict aquifers along the grounding lines of Larsen C Ice Shelf. Figure 6a shows time series of PFA extent for all SSP1-2.6 and SSP2-4.5 emulator simulations. As all RCMs are forced with the same two CESM2 realizations, peaks and minima in the modelled PFA extent align. The emulator forced by MAR predicts the highest PFA extent by 2100 for SSP1-2.6 (50 000 km2) and SSP2-4.5 (87 000 km2), followed by RACMO (31 000 and 43 000 km2), while HIRHAM-CESM only predicts a PFA extent of 19 000 km2 for SSP1-2.6. Part of the difference between the RCMs arises from the distinct horizontal resolutions. Overall, PFA expansion starts to accelerate in around the year 2050 in these runs.
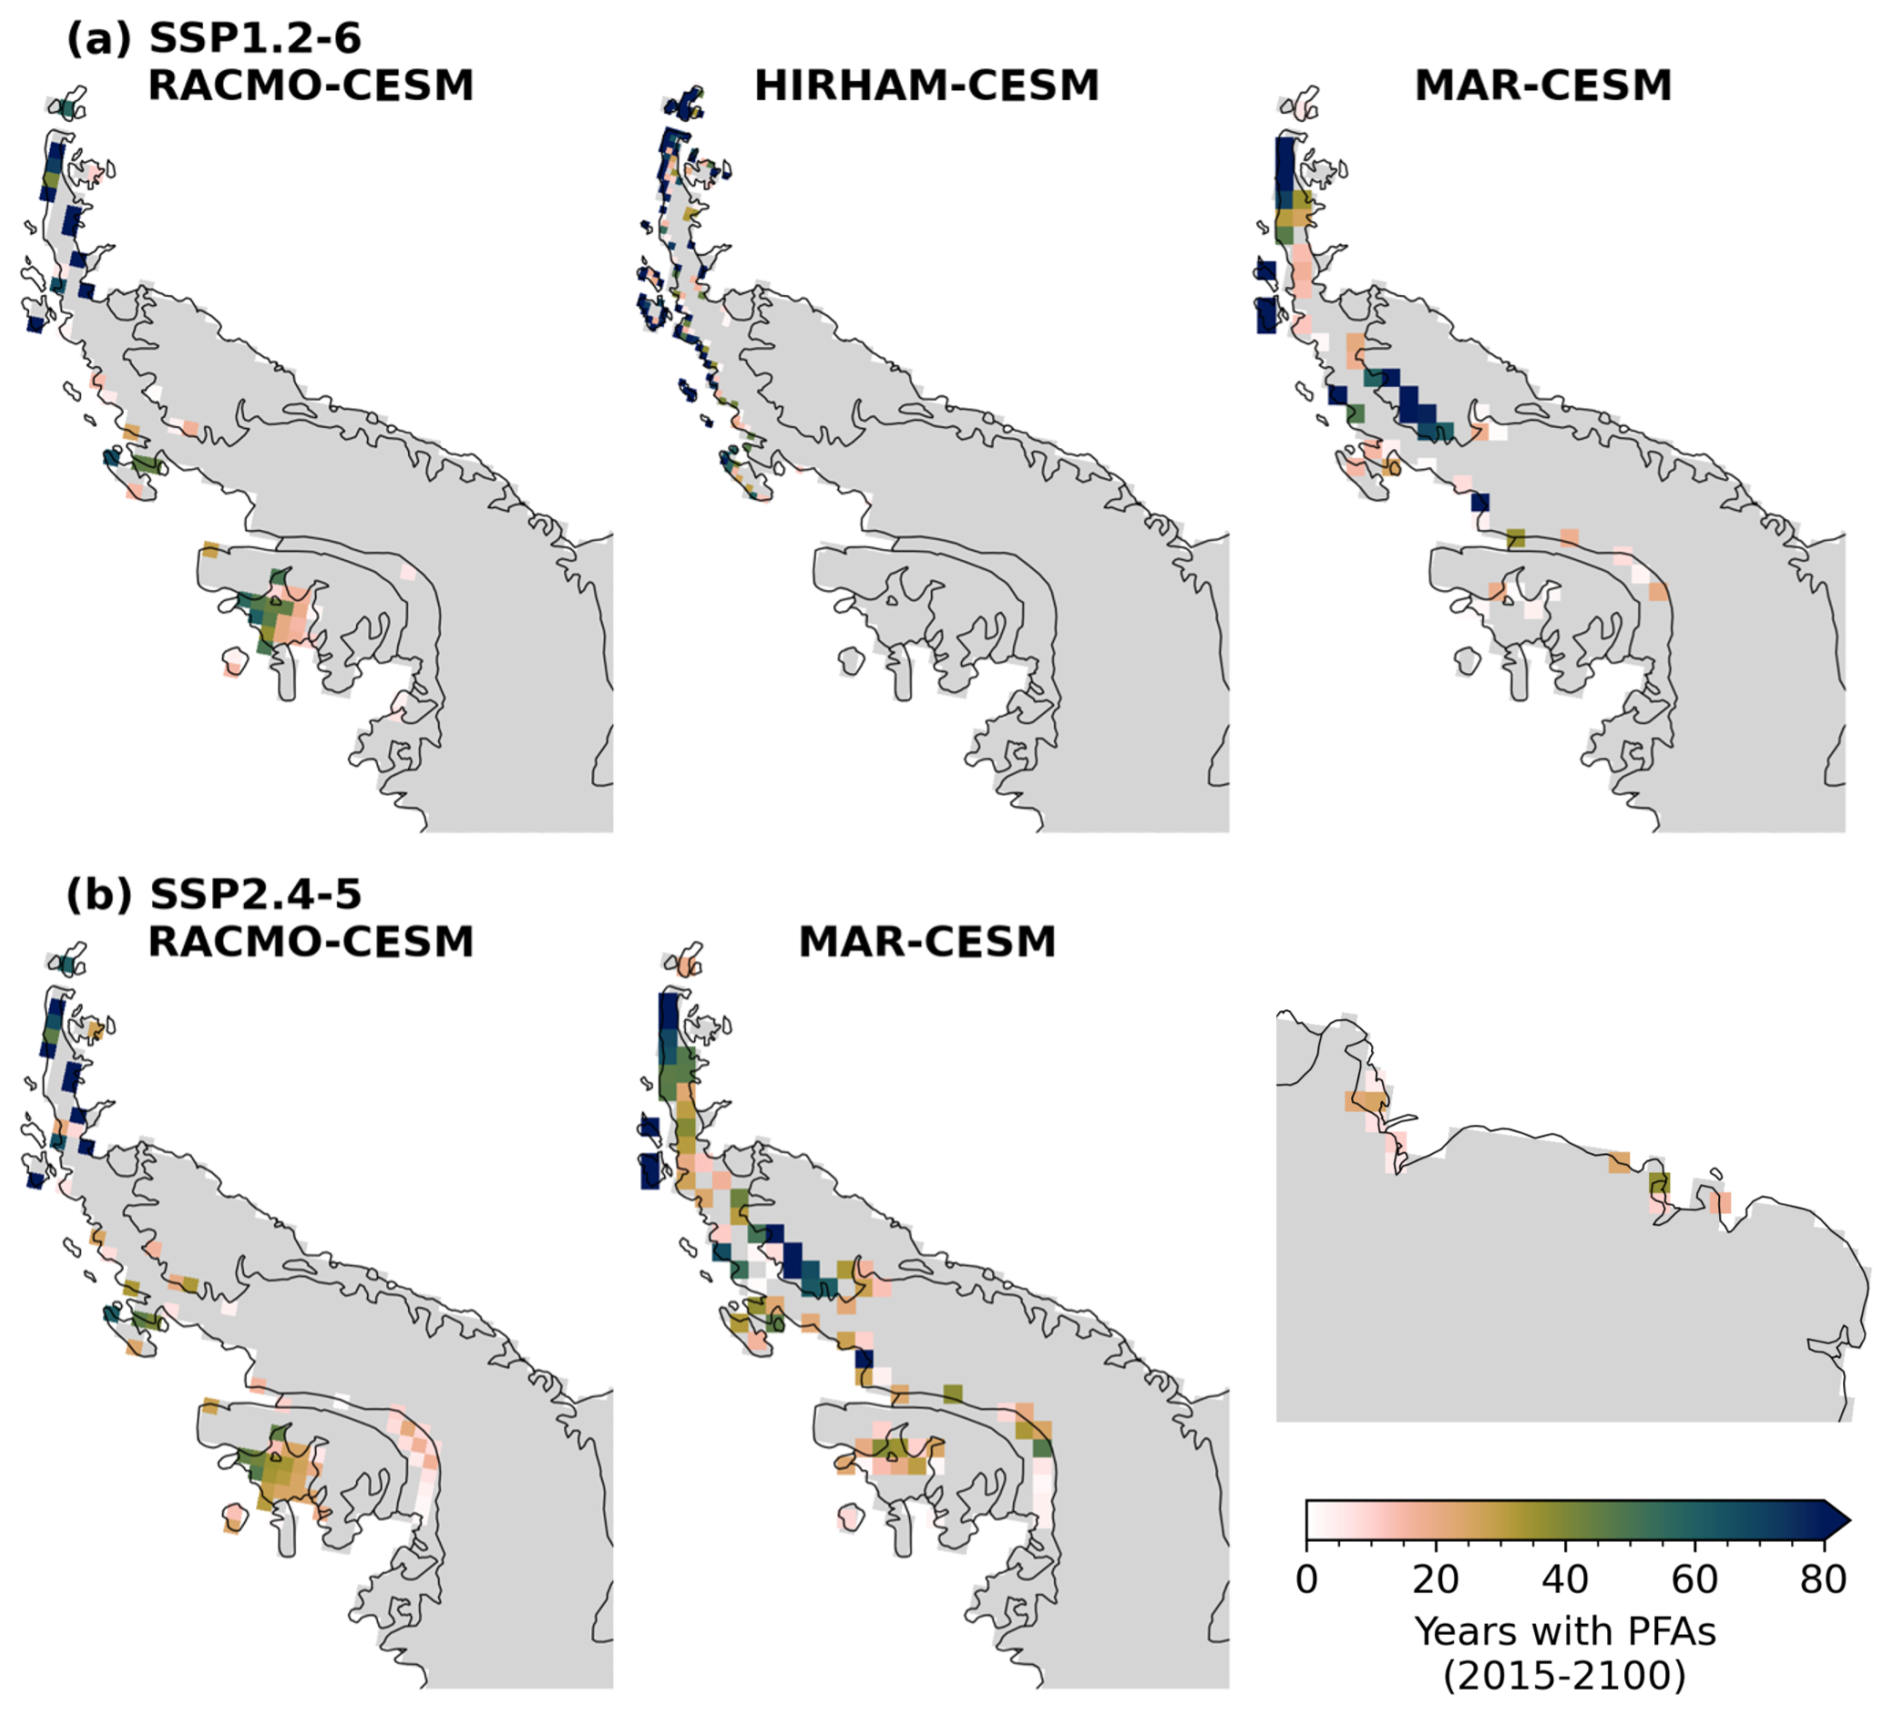
Figure 5Number of years with perennial firn aquifers (PFAs) simulated by the emulator for (a) SSP1-2.6 and (b) SSP2-4.5 forcing datasets over the period 2015–2100 for the Antarctic Peninsula. The MAR-CESM SSP2-4.5 forcing also includes Enderby Land. The locations of the depicted regions are indicated in Fig. 1.
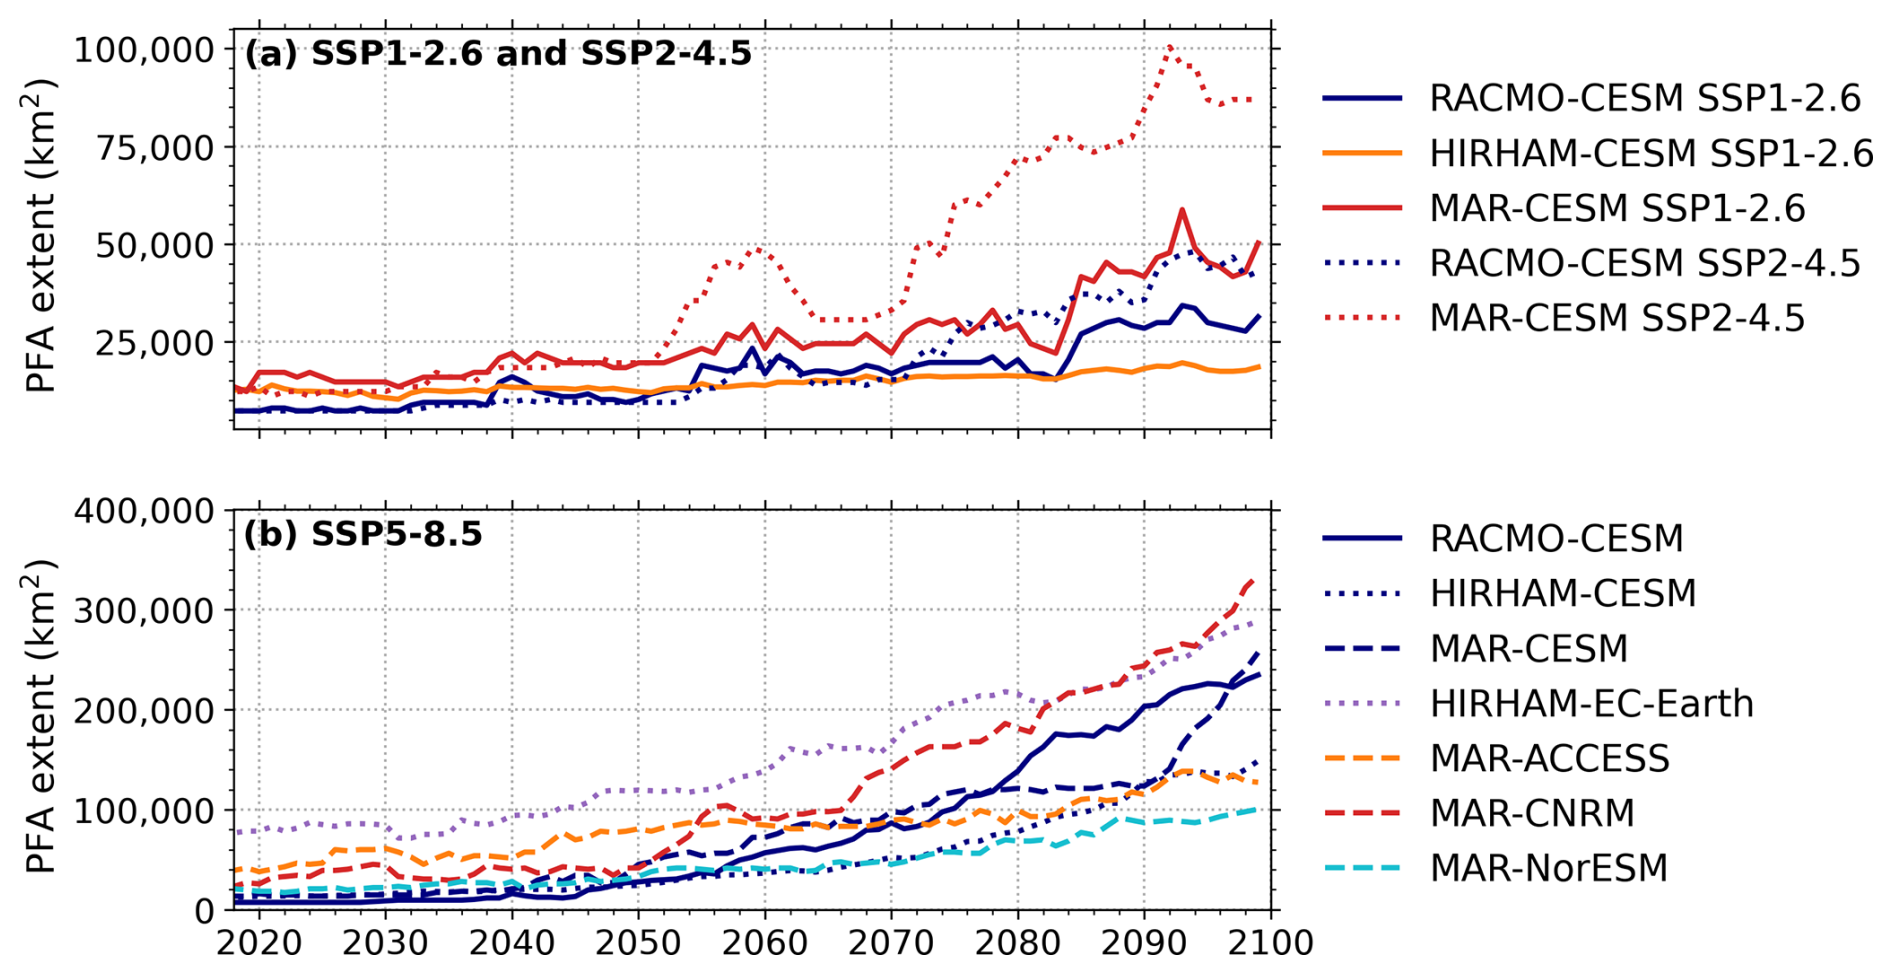
Figure 6Time series of perennial firn aquifer (PFA) extent simulated by the emulator for all climatic forcing datasets for scenarios (a) SSP1-2.6 and SSP2-4.5 and (b) SSP5-8.5.
4.2 PFA predictions under scenario SSP5-8.5
For SSP5-8.5, the emulator predicts that PFAs expand within the AP and to Ellsworth Land, on and around Abbot and Venable ice shelves, except for MAR-NorESM, which only expands within the AP (Fig. 7). The emulator predicts aquifers along the north-western coast of the AP and along the grounding lines of Larsen C, George VI and Wilkins ice shelves for all forcings. In addition, the simulation forced by RACMO-CESM stands out, as it predicts extensive PFA coverage on Wilkins, George VI and Abbot ice shelves (between 70 % and 100 % of the ice-shelf area). In contrast, all MAR and HIRHAM-EC-Earth driven simulations show extensive PFA coverage on Larsen C Ice Shelf (>12 000 km2). PFAs are also predicted for five out of the seven forcings in Enderby Land in East Antarctica (Fig. 8a). MAR-ACCESS and MAR-NorESM are the two forcings for which PFAs are not predicted in this region and also yield the lowest overall PFA extents (100 000 km2 and 127 000 km2 by 2100, respectively, Fig. 6b). For HIRHAM-EC-Earth and MAR-CNRM, the emulator predicts PFAs in Marie Byrd Land. For MAR-CNRM, the largest PFA extent by 2100 is predicted to be 334 000 km2, followed by HIRHAM-EC-Earth, at 289 000 km2. Notably, for HIRHAM-EC-Earth the emulator predicts at least twice the initial (2015) PFA extent (72 000 km2), compared with the other simulations, related to the higher initial temperatures (see Sect. 4.3). Using the same global climate model (GCM) forcing (CESM2), RACMO and MAR yield comparable PFA extent (257 000 and 234 000 km2), while HIRHAM-CESM predicts a considerably lower extent (148 000 km2). Conversely, for SSP1-2.6 and SSP2-4.5, for MAR the emulator yields a higher PFA extent compared with RACMO for the same GCM forcing. PFA expansion starts to accelerate in around the year 2050 for the CESM2 and CNRM-CM6 forcings, similarly to SSP1-2.6 and SSP2-4.5 (Fig. 6).
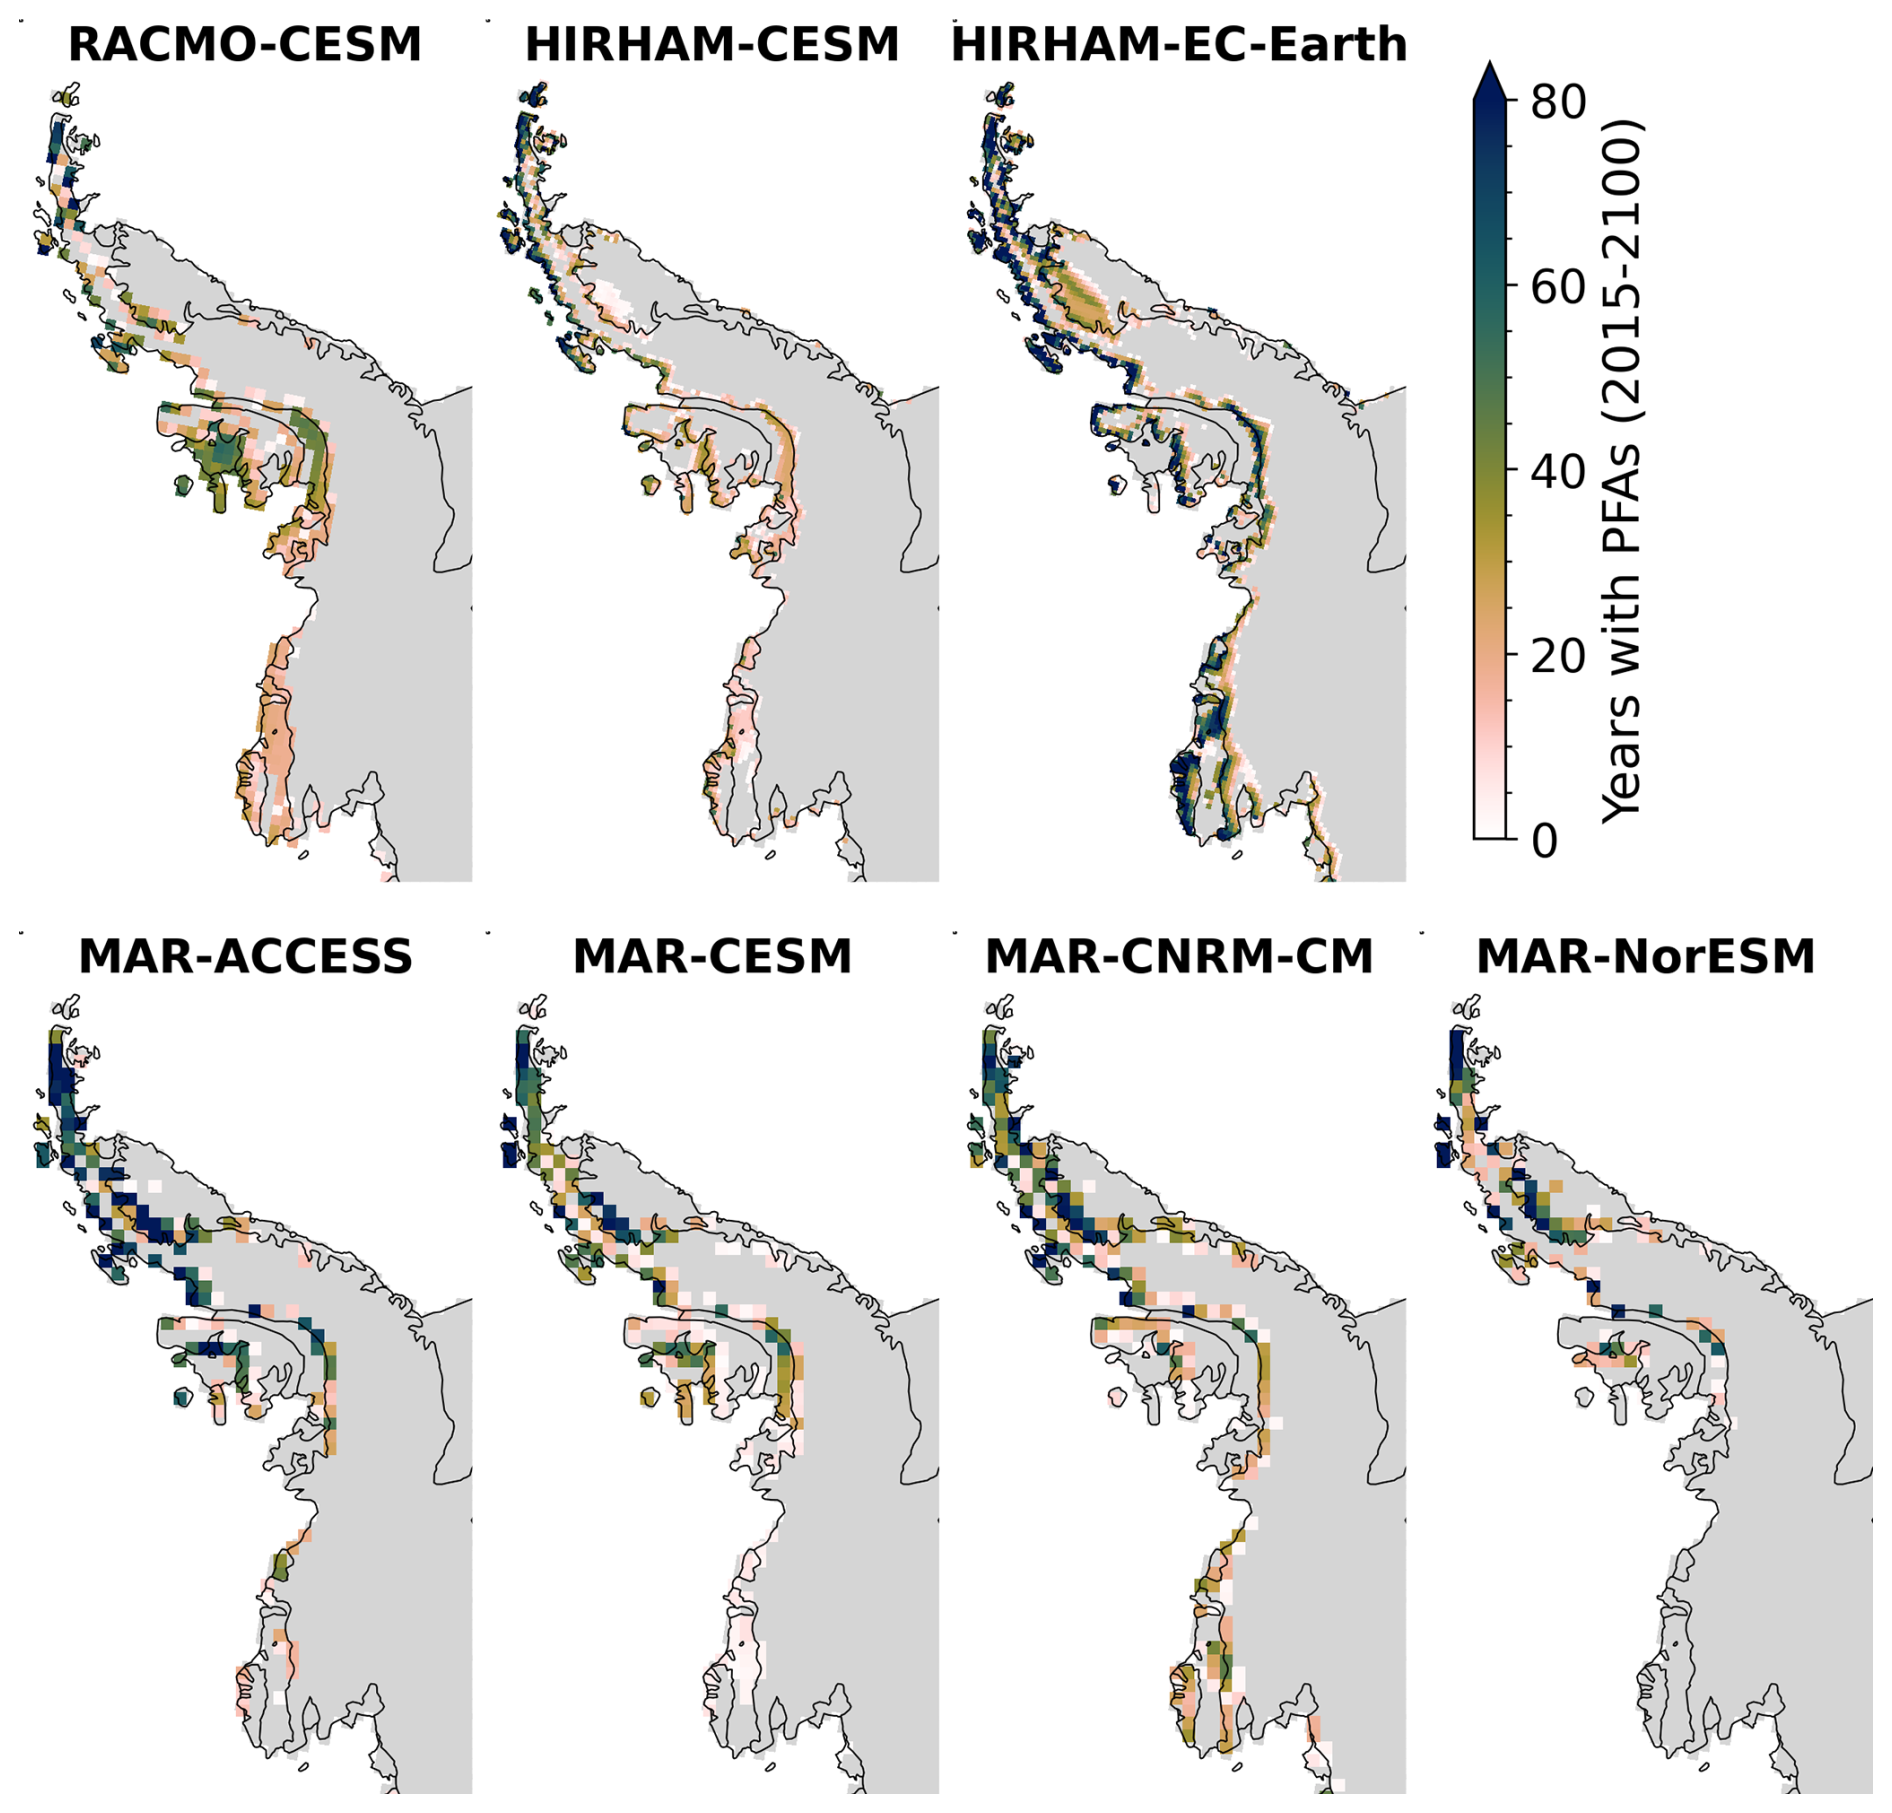
Figure 7Number of years with perennial firn aquifers (PFAs) simulated by the emulator for SSP5-8.5 forcing datasets for the Antarctic Peninsula and Ellsworth Land. The locations of the depicted regions are indicated in Fig. 1.
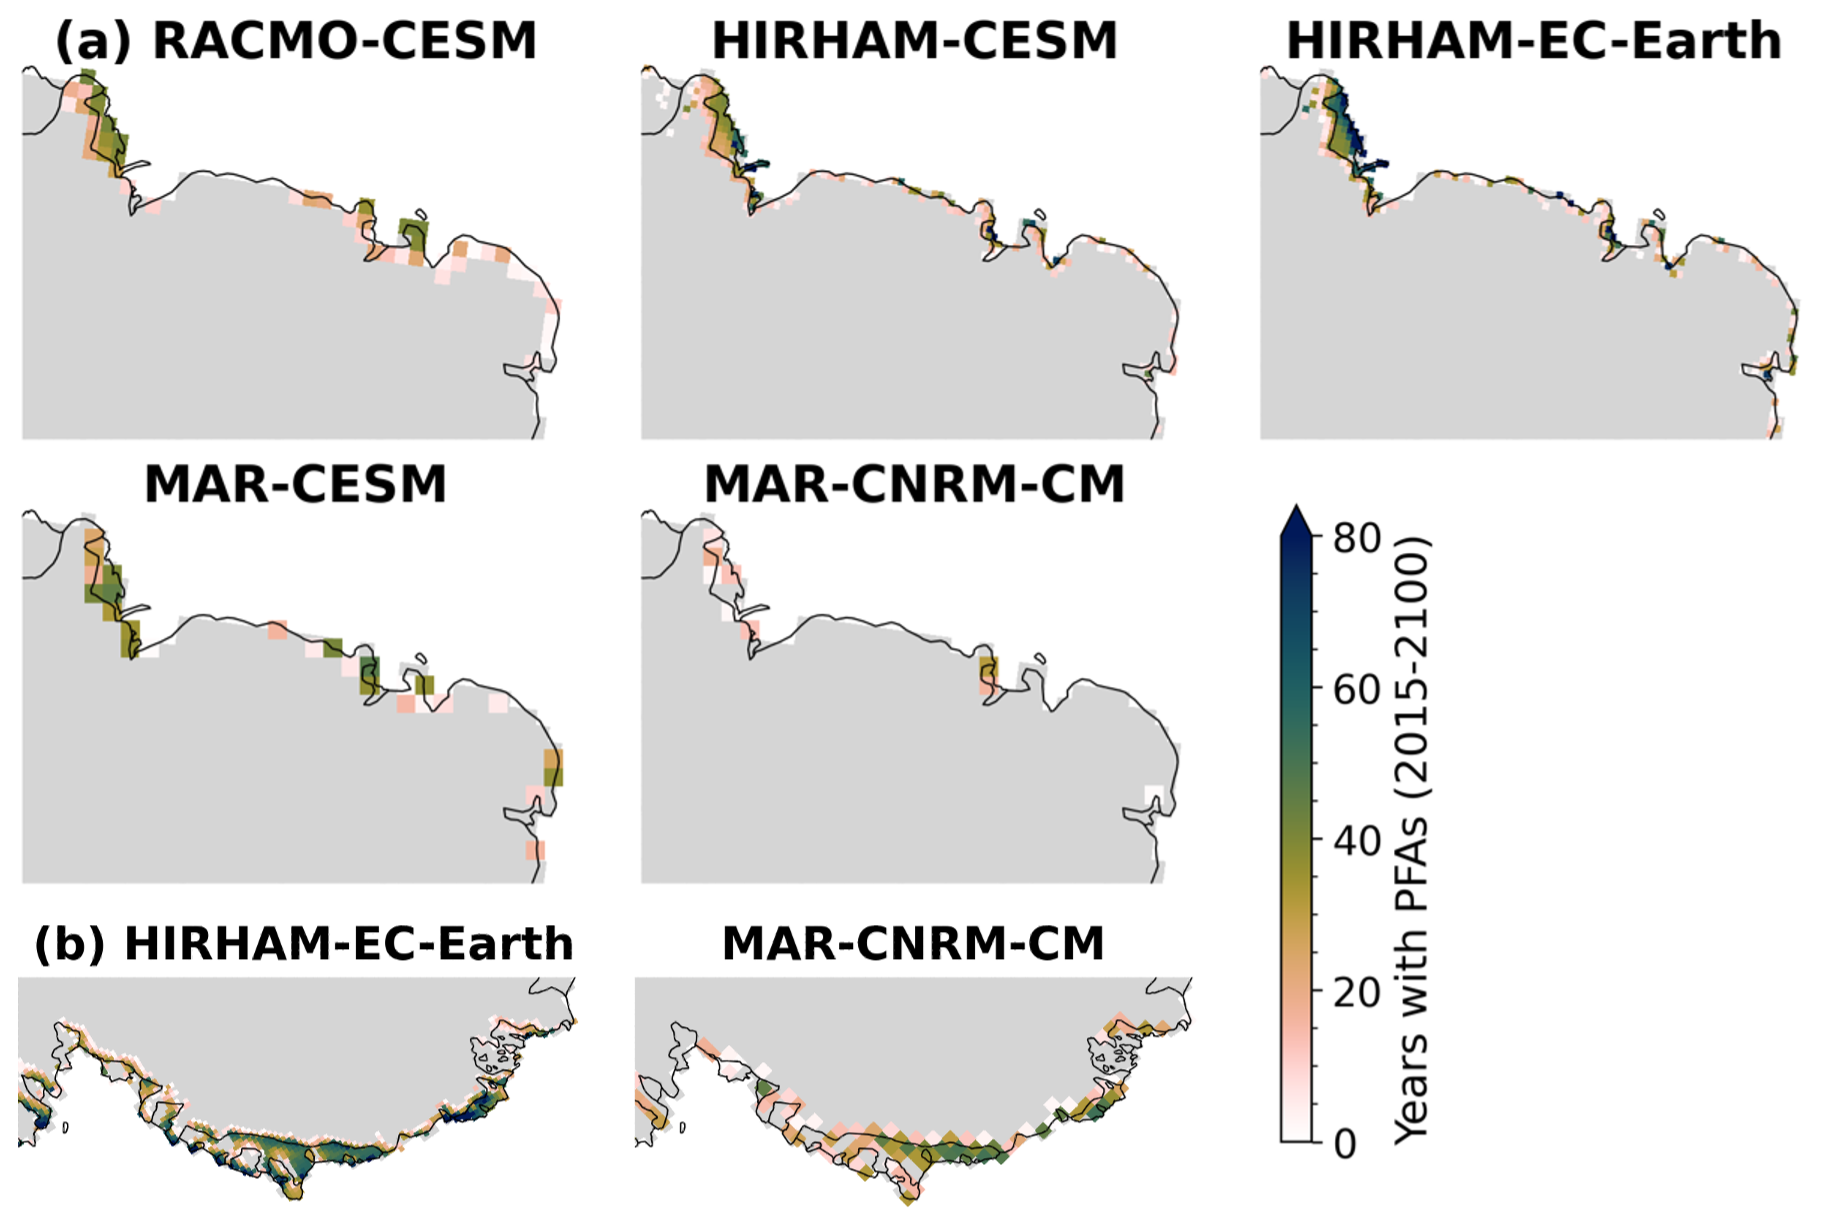
Figure 8Number of years with perennial firn aquifers (PFAs) simulated by the emulator for SSP5-8.5 forcing datasets for (a) Enderby Land and (b) Marie Byrd Land. The locations of the depicted regions are indicated in Fig. 1.
4.3 Climatic drivers
The previous sections show a large range of PFA predictions by the emulator, caused by differences in the climatic forcing. Firstly, differences in initial surface temperature and warming between the forcing datasets explain part of the spread (Fig. 9b). For example, for MAR-NorESM, the smallest PFA extent for SSP5-8.5 by 2100 is predicted, as it has the smallest AIS end-of-century (2090–2100) warming (+3.3 K) compared with 2005–2015 and the lowest end-of-century surface temperature (241.6 K). Conversely, HIRHAM-EC-Earth and MAR-CNRM-CM have the highest temperatures by 2090–2100 for SSP5-8.5 (245.9 and 244.9 K, respectively), with warming of +4.6 and +6.6 K, respectively, and the emulator predicts the largest PFA extent. For HIRHAM-EC-Earth, the initial temperature is high, related to the warm bias over Antarctica in EC-Earth3 (Boberg et al., 2022); this explains the high PFA extent at the start of the emulator simulation. For SSP1-2.6 and SSP2-4.5, the largest PFA extent is predicted for MAR-CESM, this is also the warmest model combination (Fig. 9a).
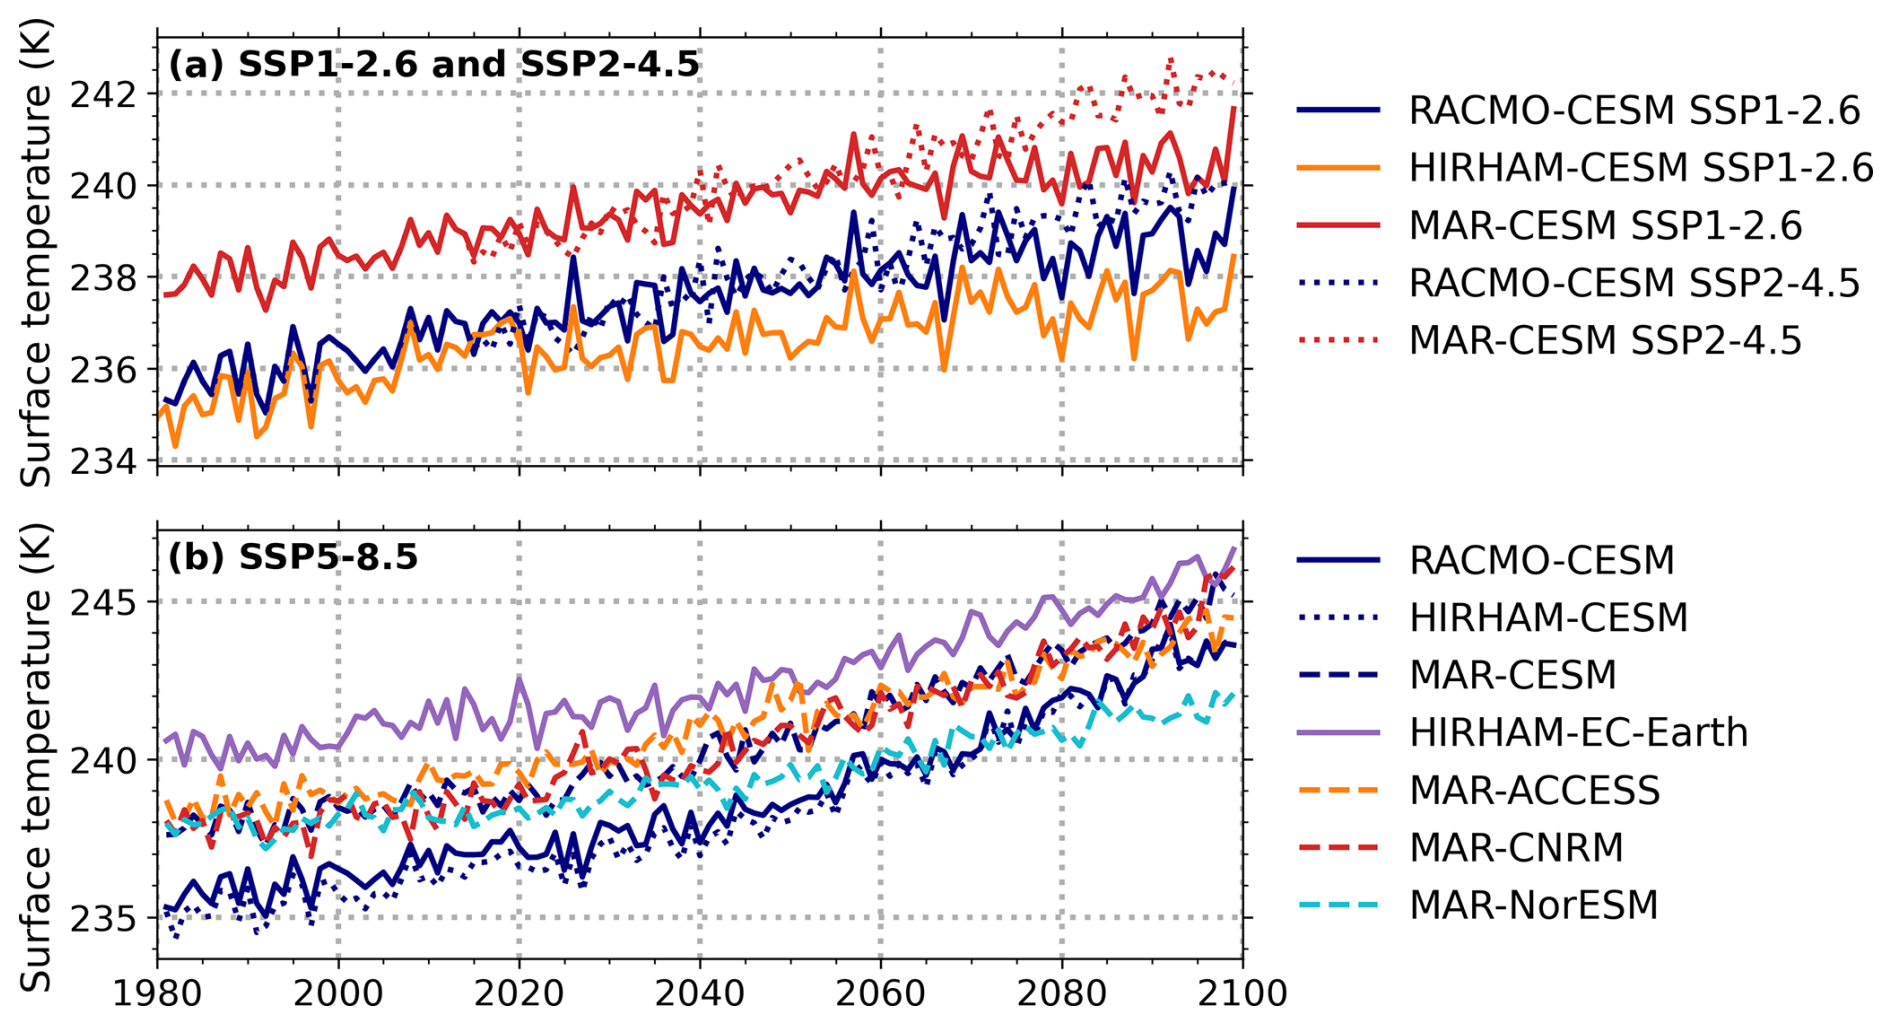
Figure 9Time series of annual average AIS surface temperature for all climatic forcing datasets for scenarios (a) SSP1-2.6 and SSP2-4.5 and (b) SSP5-8.5.
Significant regional differences also exist between RCMs for the same GCM forcing, in this case CESM2. For example, on Larsen C Ice Shelf the emulator predicts more aquifers for MAR, compared with RACMO and HIRHAM; this is related to high surface melt and high accumulation at the foot of the mountains, which are absent in the other two regional climate models (Fig. 10; see Fig. S2 in the Supplement for surface temperature). Conversely, the absence of extensive PFAs on Wilkins and George VI ice shelves for MAR and HIRHAM is due to lower accumulation compared with RACMO. Furthermore, HIRHAM-CESM calculates lower surface melt rates than the other two models, despite mean surface temperatures in HIRHAM-CESM being comparable to those in RACMO-CESM.
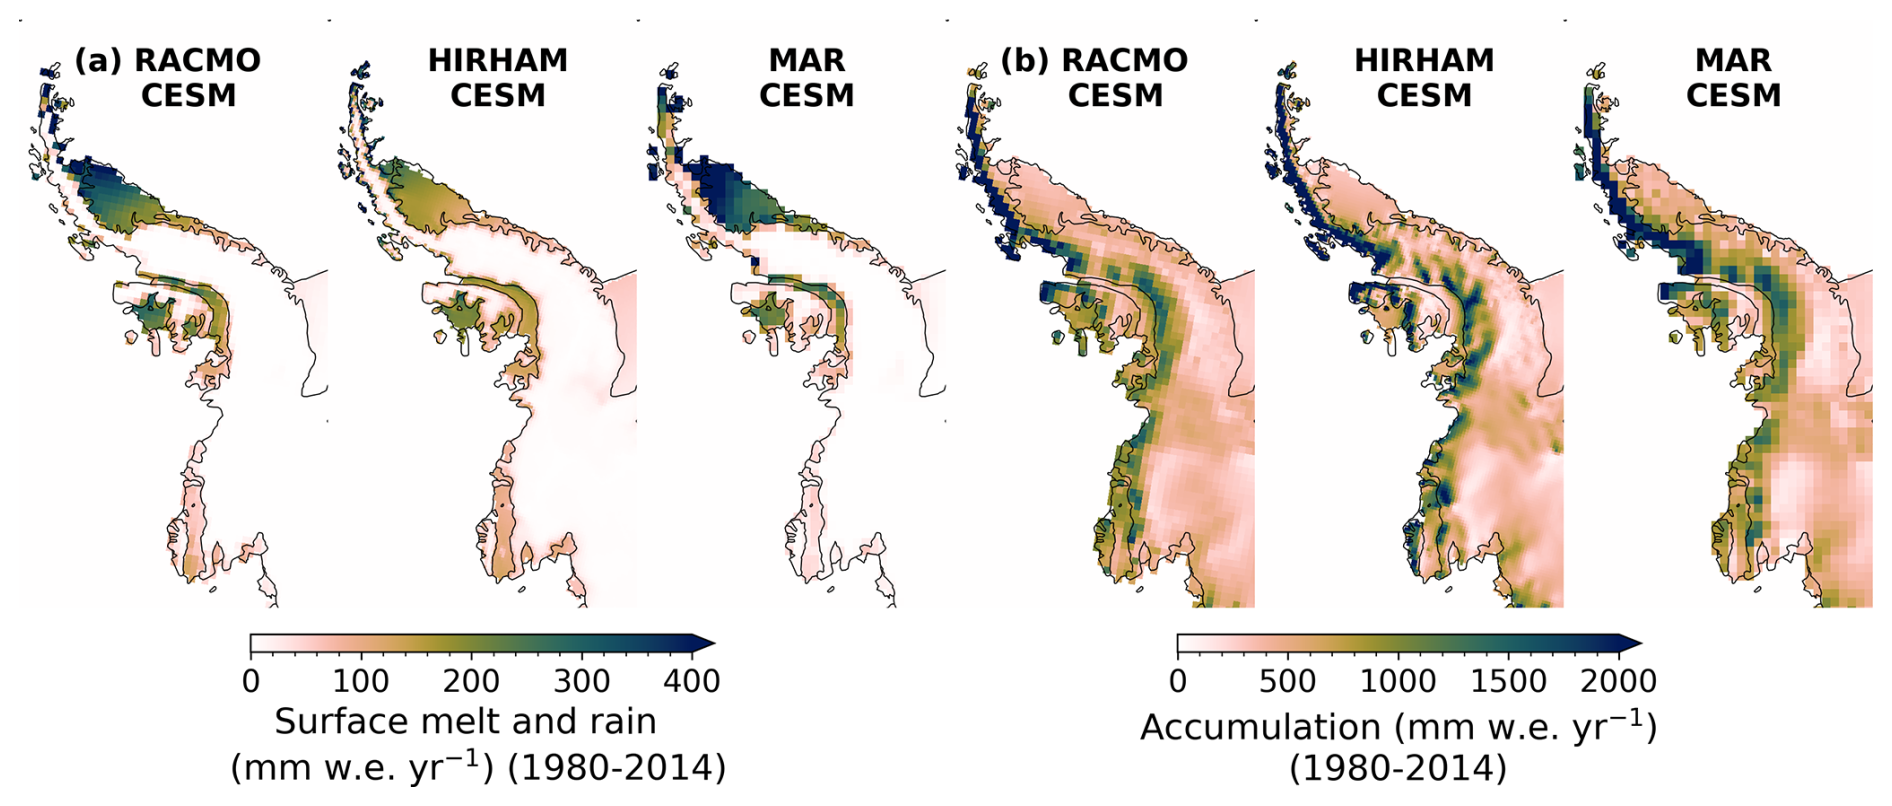
Figure 10Annual average (a) surface melt and rainfall and (b) snow accumulation over the historical period (1980–2014) for RACMO-CESM, HIRHAM-CESM and MAR-CESM. The locations of the depicted regions are indicated in Fig. 1.
Figure 11a shows that the presence of PFAs for RACMO and MAR driven emulator simulations is strongly governed by the rates of accumulation and melt (plus rain), here shown as averages for the preceding 10 years. It shows that at least 300 of surface melt and 600 of accumulation are required for aquifers to form. When melt and accumulation exceed 600 and 1000 , respectively, an aquifer is predicted in nearly all cases, in line with Brils et al. (2024). The same figure for HIRHAM (Fig. S2a) suggests that PFAs also form at slightly lower surface melt and accumulation rates. This is because HIRHAM models considerably less surface melt and accumulation for a given temperature than MAR and RACMO (Fig. S3 in the Supplement). The results of the emulator for HIRHAM thus appear less reliable, as it has different modelled relations between temperature, accumulation and melt, compared with RACMO. Therefore, in the remainder, we focus on the emulator results from RACMO and MAR forcings.
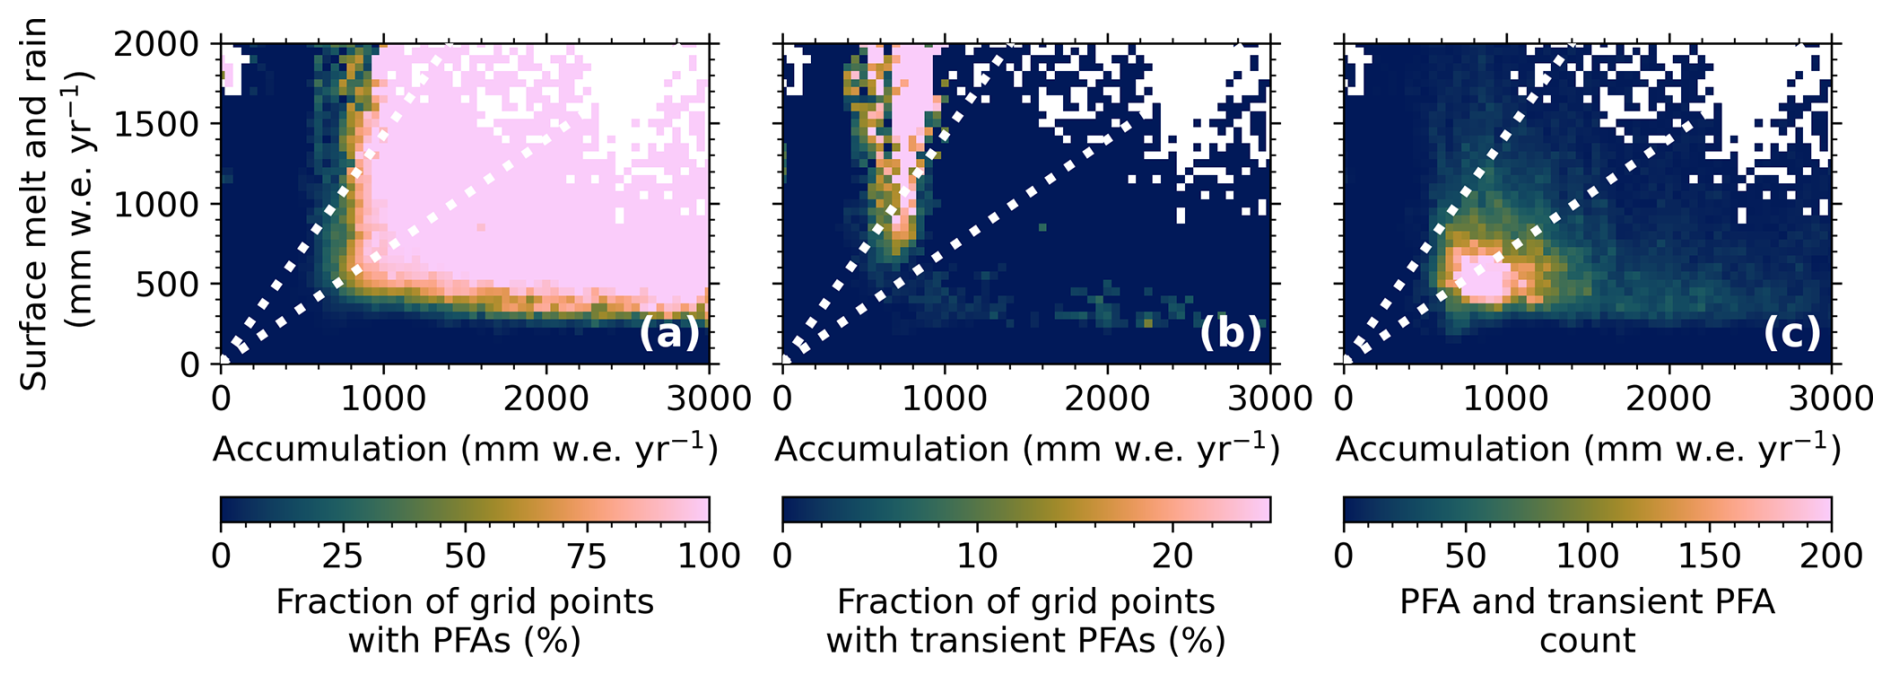
Figure 11Percentage of (a) perennial firn aquifer (PFA) occurrence and (b) transient PFA occurrence and (c) total amount of PFA and transient PFA occurrence, simulated by the emulator for all RACMO and MAR forcings, as a function of annual surface melt and rainfall (y axis) and snow accumulation (x axis). The grid cells are grouped in melt and accumulation bins of 50 . The dotted lines indicate the 0.7 and 1.7 melt-over-accumulation (MoA) thresholds.
4.4 Transient PFAs
As Fig. 4b shows, PFAs can also develop, shrink and subsequently disappear and henceforth will be referred to as transient PFAs. This shrinkage and disappearance occurs when the firn layer becomes too thin (i.e. the firn air is too depleted) to host an aquifer. A transient PFA is defined as a PFA that existed for at least 5 years but will have disappeared before the year 2100. Figure 11b shows the presence of transient PFAs simulated with the emulator, as a function of melt (plus rain) against accumulation rates for RACMO and MAR simulations. The white dotted lines indicate the melt-over-accumulation (MoA) ratios of 0.7 and 1.7, which are theoretical thresholds for indicating ice slabs and ablation zone, respectively (Brils et al., 2024). Transient PFAs mainly occur once the 0.7 and, especially, the 1.7 thresholds have been exceeded and mainly below accumulation rates of 1000 .
Figure S4 shows the locations of these transient PFAs for the RACMO and MAR (SSP5-8.5) driven emulator simulations. Transient PFAs mainly occur along the boundaries of PFA regions. Most notably, transient PFAs occur on Wilkins Ice Shelf for RACMO-CESM for the SSP5-8.5 scenarios. Transient PFAs mainly occur under SSP5-8.5, covering on average 28 000 km2 by 2100, which is 13 % compared with the 2100 PFA extent (Fig. 11). In the SSP1-2.6 and SSP2-4.5 scenarios, the extent of transient PFAs is, on average, only 4200 km2, 9 % of the 2100 PFA extent.
5.1 Firn model and observations
Since our emulator is trained on IMAU-FDM data, the uncertainties inherent to the firn model will also persist in the emulator. High surface melt and snowfall conditions are favourable for perennial firn aquifer (PFA) formation; however, some processes that are not included in IMAU-FDM can inhibit their formation despite these conditions. For instance, firn aquifers are known to drain in heavily crevassed areas (Poinar et al., 2017), a process that is not included in the firn model. In addition, ice lenses can also limit vertical meltwater percolation to deeper firn, thereby increasing refreezing (e.g. Culberg et al., 2021), although they generally form under lower accumulation conditions (Brils et al., 2024). The bucket method does not include preferential flow; this can lead to underestimation of the percolation depth of liquid water and therefore aquifer recharge, as observed in Greenland (Miller et al., 2018; Vandecrux et al., 2020). The firn model also does not allow for lateral meltwater transport, which has been observed within aquifers, but with a limited measured specific discharge (60–140 m yr−1; Montgomery et al., 2020; Miller et al., 2018). Conversely, not including lateral meltwater transport in streams can also result in underestimating aquifer presence. For instance, on the firn-terminating Priestley Glacier, meltwater flows down the ice shelf across blue ice into the section of the ice shelf with thicker surface snow, where it probably saturates the firn and feeds firn aquifers (Bell et al., 2018). Similar firn-terminating streams have been observed on Amery and Nivlisen ice shelves (e.g. Fricker et al., 2002; Kingslake et al., 2015; Leppäranta et al., 2013).
In addition, the use of irreducible water content hinders the ability to estimate the volume of meltwater stored within a PFA. Nonetheless, the bucket method is used as it is a fast and stable meltwater scheme, in contrast to many Richards' equation-based models that are computationally more expensive and prone to numerical instabilities. While it is impossible to estimate the volume of meltwater stored within a PFA with the bucket method, the presence of year-round liquid water in the firn can be used as an indication of PFA presence (Kuipers Munneke et al., 2014). Brils et al. (2024) simulated aquifers in Greenland using IMAU-FDM, agreeing with 62 % of the aquifers observed by airborne and ground-penetrating radar measurements. The mismatch can be explained by the underestimation of observationally detected aquifers due to widely spaced radar data, resolution and process limitations of the firn model, e.g. drainage of meltwater into crevasses that is not included in the model and/or biases in the climatic forcing.
In Antarctica, PFAs have thus far only been observed in situ on Wilkins and Müller ice shelves (Montgomery et al., 2020; MacDonell et al., 2021). Using an integrated approach combining satellite and regional climate model (RCM) data, PFAs are also predicted along the north-western coast of the Antarctic Peninsula (AP) and on George VI Ice Shelf (Di Biase et al., 2024). PFAs along the north-western coast, indicated by the satellite as well as the RCM data, agree with our emulator results. However, historical PFA extent on Wilkins and George VI ice shelves appears to be underestimated in the emulator simulations. In contrast, on Larsen C Ice Shelf, current PFAs are simulated by the emulator for all MAR forcing datasets, while PFA probability is low here (Di Biase et al., 2024). Müller Ice Shelf is located in a region with complex topography, which is not resolved in the RCMs. Overall, the modelled historical PFA extent shows moderate agreement with observations, especially for intermediate accumulation and surface melt rates. As future warming leads to increased melt and accumulation, the emulator is expected to produce more accurate PFA predictions, compared with the contemporary estimates. This is because warming is likely to shift more locations into well-defined PFA climate regimes, characterized by high melt and accumulation, where aquifer formation is highly certain, rather than into regimes with lower melt and accumulation, where aquifer formation is less consistent (Fig. 11).
5.2 XGBoost emulator
Our PFA emulator captures at least 89 % of the simulated PFA variance. Despite its demonstrated generalization capabilities, we emphasize that XGBoost models can be prone to errors when used beyond their range of training conditions (Chen and Guestrin, 2016). Given the large spatial variability in climatic conditions across the AIS, the range of the individual input features is probably covered in the training data. However, our findings suggest that some specific combinations of these features may be absent in the training data. This is illustrated by the lower melt and accumulation for a given temperature in HIRHAM, compared with RACMO and MAR. As a result, the emulator predicts PFAs for HIRHAM forcings under unrealistically low melt and accumulation rates (Brils et al., 2024; van Wessem et al., 2021). RACMO and MAR are in better agreement on the conditions of PFA formation, reinforcing our confidence in the emulator's performance. However, if a different RCM is used for either training or predicting, the consistency between the RCMs should be evaluated to ensure reliable results. Additionally, our work highlights the importance of using spatial and scenario blocking instead of randomly splitting training and testing data. In the latter approach, the training and testing data are very similar, while, with spatial or scenario blocking, XGBoost is trained and tested on datasets with slightly different characteristics. As a result, overfitting and overoptimistic perception of the predictive power is prevented (Roberts et al., 2017).
5.3 PFA expansion uncertainties
The emulator predicts a large range of possible PFA distributions, caused by differences in the climatic forcing. This highlights the usefulness of the emulator as it allows incorporation of a wide range of climate forcings to better capture the variability and uncertainty. Overall, PFA expansion responds primarily to the modelled warming, either by a higher emission scenario or by a warmer model. Larsen C Ice Shelf stands out in this regard, as all emulator simulations for MAR clearly predict PFAs here, as well as in colder runs, such as MAR-NorESM (Figs. 5 and 7). Generally, PFAs occur on the windward side of Antarctic and Greenland mountain ranges and receive moist and mild air masses originating from the sea, resulting in favourable conditions for PFA formation (Turner et al., 2019). Larsen C Ice Shelf is considered too dry, as it is located on the leeward side of the AP mountain range. This ice shelf is frequently affected by föhn winds, resulting in dry and warm conditions (Luckman et al., 2014). Nevertheless, substantial PFAs are predicted here by the emulator for MAR, as this is the only RCM that allows precipitation to be advected over the mountains before reaching the surface. Advection of precipitation is also included in the recently developed RACMO2.4 version (van Dalum et al., 2024). However, as described in Sect. 5.1, MAR overestimates current PFA extent on Larsen C Ice Shelf, suggesting that advection of precipitation might be overestimated. In addition, the coarse resolution of MAR (35 km) contributes to this effect as blocking of humid air is underestimated (Datta et al., 2018). This, in turn, can cause overestimation of clouds, precipitation, longwave radiation and, consequently, melt on Larsen C Ice Shelf.
The horizontal resolutions of all forcing datasets and thus emulator results range from 12 to 35 km. However, Van Wessem et al. (2016) suggest that, even at 5.5 km resolution, underestimation of the height and slope of the orographic barrier may result in underestimation of precipitation and föhn winds in the AP. Another uncertainty concerning the emulator results is that all SSP1-2.6 and SSP2-4.5 simulations are indirectly driven by CESM2, which exhibits a high climate sensitivity, along with a cold bias and a high precipitation bias over the AIS (Dunmire et al., 2022). However, these biases do not necessarily persist in the downscaled RCM output (Veldhuijsen et al., 2024d).
5.4 Implication for future ice-shelf and ice-sheet stability
While there is a substantial spread in PFA predictions by the emulator between the climate models, some general patterns emerge. Under SSP1-2.6 and SSP2-4.5, the emulator predicts that PFAs remain restricted to but expand within the AP, the region where aquifers are currently present. For SSP5-8.5, aquifer expansion is more pronounced within the AP. In addition, for SSP5-8.5, PFAs expand to Ellsworth Land in six out of seven simulations and to Enderby Land in East Antarctica in five out of seven simulations. This expansion within the AP can potentially contribute to ice-shelf collapse in this region, also for SSP1-2.6 and SSP2-4.5. Significant tensile stresses observed on Wilkins and Larsen C ice shelves (Lai et al., 2020) suggest that these areas may be vulnerable to further instability caused by PFAs, although the PFA expansion on Larsen C Ice Shelf by MAR might be overestimated, as explained in Sect. 5.3. The stress regime on George VI suggests it is currently resilient to hydrofracturing. In Ellsworth Land, substantial tensile stresses on Abbot Ice Shelf suggest that PFAs under SSP5-8.5 could induce hydrofracturing here. Similarly, ice shelves in Enderby Land are vulnerable to collapse, though they do not provide substantial buttressing (Lai et al., 2020). Furthermore, PFA expansion on the grounded ice, which mainly occurs in the north-western AP, could cause meltwater drainage through crevasses to the bed (Poinar et al., 2017). This drainage may result in enhanced basal lubrication, increasing ice velocity and ice discharge into the ocean (Zwally et al., 2002).
As new PFAs are developing, the firn air content is also decreasing (Fig. 4). If warming continues, the firn air content eventually becomes fully depleted, after which the PFAs disappear, making them transient. Our results only show transient PFAs along the boundaries of PFA regions and on Wilkins Ice Shelf in SSP5-8.5 (Fig. S4), but this is expected to increase after 2100. In fact, explicit firn simulations for Greenland suggest that PFAs are a committed transition state from healthy firn to depleted firn in high accumulation regions (>1000 mm yr−1; Brils et al., 2024). The duration of such transient PFA presence will decrease with stronger warming rates or lower accumulation rates due to relatively quick firn air depletion. Thus, the difference in the timing of ice-shelf vulnerability because of PFAs and firn air depletion becomes smaller. This is illustrated by the stable PFA on Adelaide Island (Fig. 4d), which has a high accumulation rate over the historical period (3100 mm yr−1) and low warming rate over the 21st century (+3.2 K). In contrast, on Wilkins Ice Shelf, the historical accumulation rate is relatively low (800 mm yr−1) and the warming rate is high (+7.2 K), resulting in the disappearance of the PFA after 40 years (Fig. 4b). However, the onset of the aquifer still occurs decades earlier than the firn air depletion, highlighting the importance of considering PFAs, rather than solely firn air depletion, when assessing vulnerability to hydrofracturing.
An XGBoost machine learning emulator was set up to predict future Antarctic perennial firn aquifers (PFAs; 2015–2100) for an ensemble of 12 simulations from three regional climate models (RCMs; RACMO, MAR and HIRHAM) in combination with five global climate models (GCMs). The emulator was trained with simulations of three scenarios (SSP1-2.6, SSP2-4.5 and SSP5-8.5) from IMAU-FDM forced by RACMO-CESM. For training and testing, we used a scenario and spatial blocking evaluation approach and not random selections of training, testing and evaluation data, as the latter approach is vulnerable for overfitting. We firstly demonstrate that the emulator successfully estimates PFAs; it explains at least 89 % of the variance in PFA presence and perennial liquid water content. Secondly, we project, based on the available model simulations, that, for SSP1-2.6 and SSP2-4.5, PFA presence remains restricted to the Antarctic Peninsula (AP). For SSP5-8.5, PFAs expand within the AP and expand to Ellsworth Land in six out of the seven simulations, to Enderby Land in East Antarctica in five out of the seven simulations and to Marie Byrd Land in two out of the seven simulations. Lastly, we observe a large spread among the RCM and GCM emulator predictions, related to differences in the climatic input, highlighting the necessity of analysing multiple RCM and GCM combinations and the usefulness of the emulator in making such analysis feasible. Further analysis of the results shows that the emulator, while using RACMO and MAR simulations, projects PFAs for similar surface melt and accumulation conditions. When the emulator is fed with HIRHAM data, these conditions are slightly different, caused by different relations between temperature, accumulation and melt in HIRHAM compared with RACMO. Concluding, our results show that, irrespective of the emission scenario, firn aquifers are likely to expand in a warmer Antarctica. This highlights the importance of understanding the impacts PFAs have on ice-sheet hydrology, instability and ice-shelf instability.
The code of IMAU-FDM v1.2AD is available at https://doi.org/10.5281/zenodo.10723570 (Veldhuijsen et al., 2023). The code of the XGBoost model is published at https://doi.org/10.5281/zenodo.13750024 (Veldhuijsen et al., 2024a) The emulator results (perennial liquid water content) are published at https://doi.org/10.5281/zenodo.13626884 (Veldhuijsen et al., 2024b). The firn model results (perennial liquid water content) are published at https://doi.org/10.5281/zenodo.10723570 (Veldhuijsen et al., 2024c).
The supplement related to this article is available online at https://doi.org/10.5194/tc-19-5157-2025-supplement.
SBMV and WJvdB defined the research goals and designed the study. SBMV developed the XGBoost model, performed the simulations and analysed the results. NH and FB provided HIRHAM data and CK and CA provided MAR data. All authors contributed to discussions on the manuscript.
At least one of the (co-)authors is a member of the editorial board of The Cryosphere. The peer-review process was guided by an independent editor, and the authors also have no other competing interests to declare.
Publisher's note: Copernicus Publications remains neutral with regard to jurisdictional claims made in the text, published maps, institutional affiliations, or any other geographical representation in this paper. While Copernicus Publications makes every effort to include appropriate place names, the final responsibility lies with the authors.
This work was funded by the Netherlands Organization for Scientific Research (grant no. OCENW.GROOT.2019.091). Fredrik Boberg and Nicolaj Hansen are supported by the Danish State through the National Centre for Climate Research (NCKF); further, Nicolaj Hansen is also supported by the Novo Nordisk Foundation project PRECISE (NNF23OC0081251). We thank Kamilla Hauknes Sjursen for her valuable feedback on the development procedure of the XGBoost model. Willem Jan van de Berg acknowledges support from the NESSC. Sanne B. M. Veldhuijsen used ChatGPT to enhance the readability of a previous version of the manuscript. Following this, the content was reviewed and edited as necessary and full responsibility is taken for the final publication.
This work was funded by the Netherlands Organization for Scientific Research (grant no. OCENW.GROOT.2019.091). Fredrik Boberg and Nicolaj Hansen are supported by the Danish State through the National Centre for Climate Research (NCKF); further, Nicolaj Hansen is also supported by the Novo Nordisk Foundation project PRECISE (grant no. NNF23OC0081251).
This paper was edited by Kaitlin Keegan and reviewed by Devon Dunmire and one anonymous referee.
Anilkumar, R., Bharti, R., Chutia, D., and Aggarwal, S. P.: Modelling point mass balance for the glaciers of the Central European Alps using machine learning techniques, The Cryosphere, 17, 2811–2828, https://doi.org/10.5194/tc-17-2811-2023, 2023. a, b
Arthern, R. J., Vaughan, D. G., Rankin, A. M., Mulvaney, R., and Thomas, E. R.: In situ measurements of Antarctic snow compaction compared with predictions of models, J. Geophys. Res.-Earth, 115, https://doi.org/10.1029/2009JF001306, 2010. a
Banwell, A. F., MacAyeal, D. R., and Sergienko, O. V.: Breakup of the Larsen B Ice Shelf triggered by chain reaction drainage of supraglacial lakes, Geophys. Res. Lett., 40, 5872–5876, https://doi.org/10.1002/2013GL057694, 2013. a, b
Bell, R. E., Banwell, A. F., Trusel, L. D., and Kingslake, J.: Antarctic surface hydrology and impacts on ice-sheet mass balance, Nat. Clim. Change, 8, 1044–1052, https://doi.org/10.1038/s41558-018-0326-3, 2018. a
Boberg, F., Mottram, R., Hansen, N., Yang, S., and Langen, P. L.: Uncertainties in projected surface mass balance over the polar ice sheets from dynamically downscaled EC-Earth models, The Cryosphere, 16, 17–33, https://doi.org/10.5194/tc-16-17-2022, 2022. a, b
Bozkurt, D., Bromwich, D. H., Carrasco, J., and Rondanelli, R.: Temperature and precipitation projections for the Antarctic Peninsula over the next two decades: contrasting global and regional climate model simulations, Clim. Dynam., 56, 3853–3874, https://doi.org/10.1007/s00382-021-05667-2, 2021. a
Braun, M., Humbert, A., and Moll, A.: Changes of Wilkins Ice Shelf over the past 15 years and inferences on its stability, The Cryosphere, 3, 41–56, https://doi.org/10.5194/tc-3-41-2009, 2009. a
Brils, M., Munneke, P. K., Jullien, N., Tedstone, A. J., Machguth, H., van de Berg, W., and van den Broeke, M.: Climatic drivers of ice slabs and firn aquifers in Greenland, Geophys. Res. Lett., 51, e2023GL106613, https://doi.org/10.1029/2023GL106613, 2024. a, b, c, d, e, f, g, h, i
Calonne, N., Milliancourt, L., Burr, A., Philip, A., Martin, C. L., Flin, F., and Geindreau, C.: Thermal conductivity of snow, firn, and porous ice from 3-D image-based computations, Geophys. Res. Lett., 46, 13079–13089, https://doi.org/10.1029/2019GL085228, 2019. a
Carter, J., Leeson, A., Orr, A., Kittel, C., and van Wessem, J. M.: Variability in Antarctic surface climatology across regional climate models and reanalysis datasets, The Cryosphere, 16, 3815–3841, https://doi.org/10.5194/tc-16-3815-2022, 2022. a, b
Chen, T. and Guestrin, C.: Xgboost: A scalable tree boosting system, in: Proceedings of the 22nd acm sigkdd international conference on knowledge discovery and data mining, 13–17 August 2016, San Francisco, CA, USA, 785–794, https://doi.org/10.1145/2939672.2939785, 2016. a, b, c
Coléou, C. and Lesaffre, B.: Irreducible water saturation in snow: experimental results in a cold laboratory, Ann. Glaciol., 26, 64–68, https://doi.org/10.3189/1998AoG26-1-64-68, 1998. a
Cook, A. J. and Vaughan, D. G.: Overview of areal changes of the ice shelves on the Antarctic Peninsula over the past 50 years, The Cryosphere, 4, 77–98, https://doi.org/10.5194/tc-4-77-2010, 2010. a, b
Culberg, R., Schroeder, D. M., and Chu, W.: Extreme melt season ice layers reduce firn permeability across Greenland, Nat. Commun., 12, 2336, https://doi.org/10.1038/s41467-021-22656-5, 2021. a
Danabasoglu, G., Lamarque, J.-F., Bacmeister, J., Bailey, D., DuVivier, A., Edwards, J., Emmons, L., Fasullo, J., Garcia, R., Gettelman, A., Hannay, C., Holland, M. M., Large, W. G., Lauritzen, P. H., Lawrence, D. M., Lenaerts, J. T. M., Lindsay, K., Lipscomb, W. H., Mills, M. J., Neale, R., Oleson, K. W., Otto-Bliesner, B., Phillips, A. S., Sacks, W., Tilmes, S., van Kampenhout, L., Vertenstein, M., Bertini, A., Dennis, J., Deser, C., Fischer, C., Fox-Kemper, B., Kay, J. E., Kinnison, D., Kushner, P. J., Larson, V. E., Long, M. C., Mickelson, S., Moore, J. K., Nienhouse, E., Polvani, L., Rasch, P. J., and Strand, W. G.: The community earth system model version 2 (CESM2), J. Adv. Model. Earth Sy., 12, e2019MS001916, https://doi.org/10.1029/2019MS001916, 2020. a
Datta, R. T., Tedesco, M., Agosta, C., Fettweis, X., Kuipers Munneke, P., and van den Broeke, M. R.: Melting over the northeast Antarctic Peninsula (1999–2009): evaluation of a high-resolution regional climate model, The Cryosphere, 12, 2901–2922, https://doi.org/10.5194/tc-12-2901-2018, 2018. a
Di Biase, V., Kuipers Munneke, P., Veldhuijsen, S., de Roda Husman, S., van den Broeke, M., Noël, B., Buth, L., and Wouters, B.: Probability of firn aquifer presence in Antarctica by combining remote sensing and regional climate model data, Geophys. Res. Lett., 51, e2024GL109367, https://doi.org/10.1029/2024GL109367, 2024. a, b, c
Dunmire, D., Lenaerts, J. T. M., Datta, R. T., and Gorte, T.: Antarctic surface climate and surface mass balance in the Community Earth System Model version 2 during the satellite era and into the future (1979–2100), The Cryosphere, 16, 4163–4184, https://doi.org/10.5194/tc-16-4163-2022, 2022. a, b
Dunmire, D., Wever, N., Banwell, A. F., and Lenaerts, J. T.: Antarctic-wide ice-shelf firn emulation reveals robust future firn air depletion signal for the Antarctic Peninsula, Communications Earth & Environment, 5, 100, https://doi.org/10.1038/s43247-024-01255-4, 2024. a, b
Fatima, S., Hussain, A., Amir, S. B., Ahmed, S. H., and Aslam, S. M. H.: Xgboost and random forest algorithms: an in depth analysis, Pakistan Journal of Scientific Research, 3, 26–31, https://doi.org/10.57041/pjosr.v3i1.946, 2023. a
Forster, R. R., Box, J. E., Van Den Broeke, M. R., Miège, C., Burgess, E. W., Van Angelen, J. H., Lenaerts, J. T., Koenig, L. S., Paden, J., Lewis, C., Gogineni, S. P., Lauschen, C., and McConnel, J. R.: Extensive liquid meltwater storage in firn within the Greenland ice sheet, Nat. Geosci., 7, 95–98, https://doi.org/10.1038/ngeo2043, 2014. a, b
Fricker, H. A., Allison, I., Craven, M., Hyland, G., Ruddell, A., Young, N., Coleman, R., King, M., Krebs, K., and Popov, S.: Redefinition of the Amery ice shelf, East Antarctica, grounding zone, J. Geophys. Res.-Sol. Ea., 107, ECV–1, https://doi.org/10.1029/2001JB000383, 2002. a
González Herrero, S., Vasallo, F., Bech, J., Gorodetskaya, I., Elvira Montejo, B., and Justel, A.: Extreme precipitation records in Antarctica, Int. J. Climatol., 1–14, https://doi.org/10.1002/joc.8020, 2023. a
Grinsztajn, L., Oyallon, E., and Varoquaux, G.: Why do tree-based models still outperform deep learning on typical tabular data?, Adv. Neur. In., 35, 507–520, 2022. a
Hansen, N., Langen, P. L., Boberg, F., Forsberg, R., Simonsen, S. B., Thejll, P., Vandecrux, B., and Mottram, R.: Downscaled surface mass balance in Antarctica: impacts of subsurface processes and large-scale atmospheric circulation, The Cryosphere, 15, 4315–4333, https://doi.org/10.5194/tc-15-4315-2021, 2021. a
Horlings, A. N., Christianson, K., and Miège, C.: Expansion of firn aquifers in southeast Greenland, J. Geophys. Res.-Earth, 127, e2022JF006753, https://doi.org/10.1029/2022JF006753, 2022. a
Hubbard, B., Luckman, A., Ashmore, D. W., Bevan, S., Kulessa, B., Kuipers Munneke, P., Philippe, M., Jansen, D., Booth, A., Sevestre, H., Tison, J.-L., O'leary, M., and Rutt, I.: Massive subsurface ice formed by refreezing of ice-shelf melt ponds, Nat. Commun., 7, 11897, https://doi.org/10.1038/ncomms11897, 2016. a
Iban, M. C. and Bilgilioglu, S. S.: Snow avalanche susceptibility mapping using novel tree-based machine learning algorithms (XGBoost, NGBoost, and LightGBM) with eXplainable Artificial Intelligence (XAI) approach, Stoch. Env. Res. Risk A., 37, 2243–2270, https://doi.org/10.1007/s00477-023-02392-6, 2023. a, b
Jakobs, C. L., Reijmer, C. H., Kuipers Munneke, P., König-Langlo, G., and van den Broeke, M. R.: Quantifying the snowmelt–albedo feedback at Neumayer Station, East Antarctica, The Cryosphere, 13, 1473–1485, https://doi.org/10.5194/tc-13-1473-2019, 2019. a
Jourdain, N. C., Amory, C., Kittel, C., and Durand, G.: Changes in Antarctic surface conditions and potential for ice shelf hydrofracturing from 1850 to 2200, EGUsphere [preprint], https://doi.org/10.5194/egusphere-2024-58, 2024. a, b
Kingslake, J., Ng, F., and Sole, A.: Modelling channelized surface drainage of supraglacial lakes, J. Glaciol., 61, 185–199, https://doi.org/10.3189/2015JoG14J158, 2015. a
Kittel, C., Amory, C., Agosta, C., Jourdain, N. C., Hofer, S., Delhasse, A., Doutreloup, S., Huot, P.-V., Lang, C., Fichefet, T., and Fettweis, X.: Diverging future surface mass balance between the Antarctic ice shelves and grounded ice sheet, The Cryosphere, 15, 1215–1236, https://doi.org/10.5194/tc-15-1215-2021, 2021. a, b, c, d
Kuipers Munneke, P., M. Ligtenberg, S., Van Den Broeke, M., Van Angelen, J., and Forster, R.: Explaining the presence of perennial liquid water bodies in the firn of the Greenland Ice Sheet, Geophys. Res. Lett., 41, 476–483, https://doi.org/10.1002/2013GL058389, 2014. a, b
Lai, C.-Y., Kingslake, J., Wearing, M. G., Chen, P.-H. C., Gentine, P., Li, H., Spergel, J. J., and van Wessem, J. M.: Vulnerability of Antarctica's ice shelves to meltwater-driven fracture, Nature, 584, 574–578, https://doi.org/10.1038/s41586-020-2627-8, 2020. a, b, c, d
Leppäranta, M., Järvinen, O., and Mattila, O.-P.: Structure and life cycle of supraglacial lakes in Dronning Maud Land, Antarct. Sci., 25, 457–467, https://doi.org/10.1017/S0954102012001009, 2013. a
Luckman, A., Elvidge, A., Jansen, D., Kulessa, B., Munneke, P. K., King, J., and Barrand, N. E.: Surface melt and ponding on Larsen C Ice Shelf and the impact of föhn winds, Antarct. Sci., 26, 625–635, https://doi.org/10.1017/S0954102014000339, 2014. a
MacDonell, S., Fernandoy, F., Villar, P., and Hammann, A.: Stratigraphic analysis of firn cores from an Antarctic ice shelf firn aquifer, Water-Sui., 13, 731, https://doi.org/10.3390/w13050731, 2021. a, b
Miège, C., Forster, R. R., Brucker, L., Koenig, L. S., Solomon, D. K., Paden, J. D., Box, J. E., Burgess, E. W., Miller, J. Z., McNerney, L., Brautigam, N., Fausto, R. S., and Gogineni, S.: Spatial extent and temporal variability of Greenland firn aquifers detected by ground and airborne radars, J. Geophys. Res.-Earth, 121, 2381–2398, https://doi.org/10.1002/2016JF003869, 2016. a
Miller, O., Solomon, D. K., Miège, C., Koenig, L., Forster, R., Schmerr, N., Ligtenberg, S. R., and Montgomery, L.: Direct evidence of meltwater flow within a firn aquifer in southeast Greenland, Geophys. Res. Lett., 45, 207–215, https://doi.org/10.1002/2017GL075707, 2018. a, b
Montgomery, L., Miège, C., Miller, J., Scambos, T. A., Wallin, B., Miller, O., Solomon, D. K., Forster, R., and Koenig, L.: Hydrologic properties of a highly permeable firn aquifer in the Wilkins Ice Shelf, Antarctica, Geophys. Res. Lett., 47, e2020GL089552, https://doi.org/10.1029/2020GL089552, 2020. a, b, c, d
Mottram, R., Hansen, N., Kittel, C., van Wessem, J. M., Agosta, C., Amory, C., Boberg, F., van de Berg, W. J., Fettweis, X., Gossart, A., van Lipzig, N. P. M., van Meijgaard, E., Orr, A., Phillips, T., Webster, S., Simonsen, S. B., and Souverijns, N.: What is the surface mass balance of Antarctica? An intercomparison of regional climate model estimates, The Cryosphere, 15, 3751–3784, https://doi.org/10.5194/tc-15-3751-2021, 2021. a
Oppenheimer, M., Glavovic, B., Hinkel, J., van de Wal, R., Magnan, A. K., Abd-Elgawad, A., Cai, R., Cifuentes-Jara, M., Deconto, R. M., Ghosh, T., Hay, J., Ben, M., Meyssignac, B., Sebesvari, Z., A, S., Dangendorf, S., and Frederikse, T.: Sea level rise and implications for low lying islands, coasts and communities, The Intergovernmental Panel on Climate Change, https://doi.org/10.1017/9781009157964.006, 2019. a
Poinar, K., Joughin, I., Lilien, D., Brucker, L., Kehrl, L., and Nowicki, S.: Drainage of Southeast Greenland firn aquifer water through crevasses to the bed, Front. Earth Sci., 5, 5, https://doi.org/10.3389/feart.2017.00005, 2017. a, b, c
Roberts, D. R., Bahn, V., Ciuti, S., Boyce, M. S., Elith, J., Guillera-Arroita, G., Hauenstein, S., Lahoz-Monfort, J. J., Schröder, B., Thuiller, W., Warton, D. I., Wintle, B. A., Hartig, F., and Dormann, C. F.: Cross-validation strategies for data with temporal, spatial, hierarchical, or phylogenetic structure, Ecography, 40, 913–929, https://doi.org/10.1111/ecog.02881, 2017. a, b
Sarofim, M. C., Smith, C. J., Malek, P., McDuffie, E. E., Hartin, C. A., Lay, C. R., and McGrath, S.: High radiative forcing climate scenario relevance analyzed with a ten-million-member ensemble, Nat. Commun., 15, 8185, https://doi.org/10.1038/s41467-024-52437-9, 2024. a
Scambos, T., Fricker, H. A., Liu, C.-C., Bohlander, J., Fastook, J., Sargent, A., Massom, R., and Wu, A.-M.: Ice shelf disintegration by plate bending and hydro-fracture: Satellite observations and model results of the 2008 Wilkins ice shelf break-ups, Earth Planet. Sc. Lett., 280, 51–60, https://doi.org/10.1016/j.epsl.2008.12.027, 2009. a, b
Scambos, T. A., Hulbe, C., Fahnestock, M., and Bohlander, J.: The link between climate warming and break-up of ice shelves in the Antarctic Peninsula, J. Glaciol., 46, 516–530, https://doi.org/10.3189/172756500781833043, 2000. a, b
Shepherd, A., Gilbert, L., Muir, A. S., Konrad, H., McMillan, M., Slater, T., Briggs, K. H., Sundal, A. V., Hogg, A. E., and Engdahl, M. E.: Trends in Antarctic Ice Sheet elevation and mass, Geophys. Res. Lett., 46, 8174–8183, https://doi.org/10.1029/2019GL082182, 2019. a
Smith, B., Fricker, H. A., Gardner, A. S., Medley, B., Nilsson, J., Paolo, F. S., Holschuh, N., Adusumilli, S., Brunt, K., Csatho, B., Harbeck, K., Markus, T., Neumann, T., Siegfried, M. R., and Zwally, H. J.: Pervasive ice sheet mass loss reflects competing ocean and atmosphere processes, Science, 368, 1239–1242, https://doi.org/10.1126/science.aaz5845, 2020. a
Sun, L., Zhang, X., Xiao, P., Wang, H., Wang, Y., and Zheng, Z.: Fusing daily snow water equivalent from 1980 to 2020 in China using a spatiotemporal XGBoost model, J. Hydrol., 632, 130876, https://doi.org/10.1016/j.jhydrol.2024.130876, 2024. a, b
Turner, J., Phillips, T., Thamban, M., Rahaman, W., Marshall, G. J., Wille, J. D., Favier, V., Winton, V. H. L., Thomas, E., Wang, Z., van den Broeke, M., Hosking, J. S., and Lachlan-Cope, T.: The dominant role of extreme precipitation events in Antarctic snowfall variability, Geophys. Res. Lett., 46, 3502–3511, https://doi.org/10.1029/2018GL081517, 2019. a
van Dalum, C. T., van de Berg, W. J., Gadde, S. N., van Tiggelen, M., van der Drift, T., van Meijgaard, E., van Ulft, L. H., and van den Broeke, M. R.: First results of the polar regional climate model RACMO2.4, The Cryosphere, 18, 4065–4088, https://doi.org/10.5194/tc-18-4065-2024, 2024. a
Van Katwyk, P., Fox-Kemper, B., Seroussi, H., Nowicki, S., and Bergen, K. J.: A variational LSTM emulator of sea level contribution from the Antarctic ice sheet, J. Adv. Model. Earth Sy., 15, e2023MS003899, https://doi.org/10.1029/2023MS003899, 2023. a
van Wessem, J. M., Ligtenberg, S. R. M., Reijmer, C. H., van de Berg, W. J., van den Broeke, M. R., Barrand, N. E., Thomas, E. R., Turner, J., Wuite, J., Scambos, T. A., and van Meijgaard, E.: The modelled surface mass balance of the Antarctic Peninsula at 5.5 km horizontal resolution, The Cryosphere, 10, 271–285, https://doi.org/10.5194/tc-10-271-2016, 2016. a
van Wessem, J. M., Steger, C. R., Wever, N., and van den Broeke, M. R.: An exploratory modelling study of perennial firn aquifers in the Antarctic Peninsula for the period 1979–2016, The Cryosphere, 15, 695–714, https://doi.org/10.5194/tc-15-695-2021, 2021. a, b, c, d, e, f, g
van Wessem, J. M., van den Broeke, M. R., Wouters, B., and Lhermitte, S.: Variable temperature thresholds of melt pond formation on Antarctic ice shelves, Nat. Clim. Change, 13, 161–166, https://doi.org/10.1038/s41558-022-01577-1, 2023. a, b
Vandecrux, B., Mottram, R., Langen, P. L., Fausto, R. S., Olesen, M., Stevens, C. M., Verjans, V., Leeson, A., Ligtenberg, S., Kuipers Munneke, P., Marchenko, S., van Pelt, W., Meyer, C. R., Simonsen, S. B., Heilig, A., Samimi, S., Marshall, S., Machguth, H., MacFerrin, M., Niwano, M., Miller, O., Voss, C. I., and Box, J. E.: The firn meltwater Retention Model Intercomparison Project (RetMIP): evaluation of nine firn models at four weather station sites on the Greenland ice sheet, The Cryosphere, 14, 3785–3810, https://doi.org/10.5194/tc-14-3785-2020, 2020. a
Veldhuijsen, S., van de Berg, W. J., Kuipers Munneke, P., and van den Broeke, M. R.: IMAU-FDM v12AD TC release, Zenodo [code], https://doi.org/10.5281/zenodo.10723570, 2023. a
Veldhuijsen, S., van de Berg, W. J., Kuipers Munneke, P., Hansen, N., Boberg, F., Kittel, C., Amory, C., and van den Broeke, M. R.: Code perennial firn aquifer emulator, Zenodo [code], https://doi.org/10.5281/zenodo.13750024, 2024a. a
Veldhuijsen, S., van de Berg, W. J., Kuipers Munneke, P., Hansen, N., Boberg, F., Kittel, C., Amory, C., and van den Broeke, M. R.: Data perennial firn aquifer emulator, Zenodo [data set], https://doi.org/10.5281/zenodo.13692364, 2024b. a
Veldhuijsen, S., van de Berg, W. J., Kuipers Munneke, P., Hansen, N., Boberg, F., Kittel, C., Amory, C., and van den Broeke, M. R.: IMAU-FDMv1.2AD perennial LWC (1950–2100), Zenodo [data set], https://doi.org/10.5281/zenodo.13692385, 2024c. a
Veldhuijsen, S. B. M., van de Berg, W. J., Kuipers Munneke, P., and van den Broeke, M. R.: Firn air content changes on Antarctic ice shelves under three future warming scenarios, The Cryosphere, 18, 1983–1999, https://doi.org/10.5194/tc-18-1983-2024, 2024d. a, b, c, d, e, f
Verjans, V., Leeson, A., McMillan, M., Stevens, C., van Wessem, J. M., van de Berg, W. J., van den Broeke, M. R., Kittel, C., Amory, C., Fettweis, X., Hansen, N., Boberg, F., and Mottram, R.: Uncertainty in East Antarctic firn thickness constrained using a model ensemble approach, Geophys. Res. Lett., 48, e2020GL092060, https://doi.org/10.1029/2020GL092060, 2021. a
Zwally, H. J., Abdalati, W., Herring, T., Larson, K., Saba, J., and Steffen, K.: Surface melt-induced acceleration of Greenland ice-sheet flow, Science, 297, 218–222, https://doi.org/10.1126/science.1072708, 2002. a, b