the Creative Commons Attribution 4.0 License.
the Creative Commons Attribution 4.0 License.
 | 31 Jan 2025
Subglacial discharge effects on basal melting of a rotating, idealized ice shelf
Irena Vaňková
Xylar Asay-Davis
Carolyn Branecky Begeman
Darin Comeau
Alexander Hager
Matthew Hoffman
Stephen F. Price
Jonathan Wolfe
When subglacial meltwater is discharged into the ocean at the grounding line, it acts as a source of buoyancy, enhancing flow speeds along the ice base that result in higher basal melt rates. The effects of subglacial discharge have been well studied in the context of a Greenland-like, vertical calving front, where Earth's rotation can be neglected. Here we study these effects in the context of Antarctic ice shelves, where rotation is important. We use a numerical model to simulate ocean circulation and basal melting beneath an idealized three-dimensional ice shelf and vary the rate and distribution of subglacial discharge. For channelized discharge, we find that in the rotating case, total melt-flux anomaly increases with two-thirds power of the discharge, in contrast to existing non-rotating results for which the melt-flux anomaly increases with one-third power of the discharge. The higher melt-flux anomaly with discharge is attributed to a more extensive area of the ice-shelf base being exposed to direct high melting by the rising plume as it is deflected due to Earth's rotation and its path is prolonged. For distributed discharge, we find that in both the rotating and the non-rotating cases, the melt-flux anomaly increases with two-thirds power of the discharge. Furthermore, in the rotating case, the addition of channelized, subglacial discharge can produce either a higher or a lower ice-shelf basal melt-flux anomaly than the equivalent amount of distributed discharge, depending on its location along the grounding line relative to the directionality of the Coriolis force. This contrasts with previous results from non-rotating, vertical ice-cliff simulations, where distributed discharge was always found to be more efficient than channelized discharge at enhancing the terminus-averaged melt rate. The implication, based on our idealized simulations, is that melt-rate parameterizations attempting to include subglacial discharge effects that are not geometry- and rotation-aware may produce total melt-flux anomalies that are off by a factor of 2 or more.
- Article
(4694 KB) - Full-text XML
- BibTeX
- EndNote


Subglacial freshwater originates as meltwater formed at the glacier bed or as meltwater draining there from supraglacial or englacial sources. It is discharged into the ocean at the grounding line, where the ice goes afloat. Being released at depth, this freshwater is a source of buoyancy that accelerates as an ascending meltwater plume along the ice-shelf base or the vertical calving face, enhancing entrainment of ambient waters and modulating melt rates. In Alaska and Greenland, where supraglacial melting is a significant contributor to subglacial discharge, local measurements near marine-terminating glaciers have shown such high seasonal submarine melting that it could only have been driven by enhanced subglacial discharge from summer surface melt (Motyka et al., 2003; Washam et al., 2019). Circulation and renewal in some fjords have been shown to be driven almost entirely by subglacial discharge (Gladish et al., 2015; Carroll et al., 2017; Slater et al., 2018; Hager et al., 2022b). Meanwhile, the importance of subglacial discharge for sub-ice-shelf circulation and melting in Antarctica is less clear because the drainage of supraglacial meltwater to the bed is lacking, and present-day subglacial discharge is sourced only from subglacial melting that is much smaller in magnitude. However, there has been a recent surge of interest in the influence of subglacial discharge on basal melting beneath Antarctic ice shelves. Dow et al. (2022) and Hager et al. (2022a) demonstrate that the large catchment sizes in some parts of Antarctica, when combined with high subglacial melting, can lead to subglacial discharge fluxes similar in magnitude to the surface-derived melt fluxes in Greenland. Dow et al. (2022) found correspondence between elevated satellite-derived basal melt rates near grounding lines and locations of modeled subglacial meltwater discharge at some ice shelves. Pelle et al. (2023) found that it was necessary to incorporate a parameterization of subglacial discharge effects (Jenkins, 2011) on basal melting with plume theory (Jenkins, 1991; Lazeroms et al., 2018) to achieve reasonable agreement with satellite-derived basal melt rates, as two-dimensional plume theory on its own underestimated localized high melting near an inferred subglacial channel.
While several studies have implemented subglacial discharge into Antarctic regional domains and studied its effects on circulation beneath ice shelves, basal melting, and continental shelf properties (Nakayama et al., 2021; Goldberg et al., 2023; Gwyther et al., 2023), the current understanding of melt-rate sensitivities to subglacial discharge is, with exception of the work of Wekerle et al. (2024), primarily based on plume theory (Jenkins, 2011) and on idealized studies focused on a Greenland-like, vertical ice front (Xu et al., 2012, 2013; Kimura et al., 2014; Slater et al., 2015) or a narrow ice tongue (Cai et al., 2017; Wiskandt et al., 2023). Jenkins (2011) included subglacial discharge in non-rotational, one-dimensional plume theory. Using dimensional analysis, he found that the melt rate, within some distance of the freshwater source, has a linear dependence on temperature and one-third power dependence on subglacial discharge. These theoretical results were to some extent reproduced in non-rotating, idealized numerical simulations of melting, two-dimensional vertical faces (Xu et al., 2012; Sciascia et al., 2013), two-dimensional ice tongues (Cai et al., 2017; Wiskandt et al., 2023), and three-dimensional vertical faces (Xu et al., 2013; Kimura et al., 2014). These studies typically find a sub-linear, power-law relationship between melt rates () and subglacial discharge (Fs) of the form , with n<1. While Xu et al. (2012) found , in line with theory, the remaining idealized, two-dimensional studies found slightly stronger melt-rate dependence on subglacial discharge; Sciascia et al. (2013) found n=0.5, Cai et al. (2017) found n=0.57, and Wiskandt et al. (2023) found n between 0.41 and 0.47 for different fjord temperatures. The three-dimensional study of Xu et al. (2013) also found a stronger melt-rate dependence on subglacial discharge, with n between 0.5–0.9, as opposed to the theoretical one-third power. Kimura et al. (2014) found a more complex functional relationship, with the melt rate saturating once a critical discharge rate has been reached and the resulting high inflow velocity forced the plume away from the ice face. Wekerle et al. (2024) found in a three-dimensional, global, realistic configuration focused on the 79° North Glacier Tongue that included rotation. However, in their study, shelf conditions could evolve as a function of discharge given their configuration was global and shelf conditions were not restored, allowing for conflation of the discharge and shelf temperature effects on melting. Finally, Jackson et al. (2022) addressed the relationship between basal melting and discharge observationally. Their estimates from a relatively warm Alaskan glacier showed that plume theory underestimated melting by over an order of magnitude, but the one-third power dependence of melt rate on discharge seemed to hold, albeit with substantial uncertainties.
The question of how the horizontal distribution of subglacial discharge along grounding lines affects melt rates has also been addressed before to some extent. Kimura et al. (2014) considered the case for an unstratified water column and found that two channels in close proximity produced higher melt rates than a single channel with the equivalent total discharge. Slater et al. (2015) considered a more realistic, stratified setup, in which plumes can reach neutral buoyancy, and found that distributed discharge always produces a higher total melt rate than the equivalent channelized discharge.
Crucially, what the convectively forced plume model and the existing idealized numerical studies have neglected is the effect of Earth's rotation, as have all other common basal melt-rate parameterizations used to force ice-sheet models (Burgard et al., 2022), including those that incorporate subglacial discharge (Pelle et al., 2023). The omission of Earth's rotation is typically justified based on the ratio of fjord or ice-tongue width (W) to the first-mode baroclinic deformation radius (Rd) being smaller than or close to unity. However, Jackson et al. (2018), focusing on shelf-driven forcing, show that even for , which includes most of Greenland's fjords, three-dimensional dynamics are integral to understanding the fjord circulation. The omission of Earth's rotation is certainly not appropriate for Antarctic-like ice-shelf cavities, where . In this paper, we revisit the relationship between the submarine melting and subglacial discharge for a rotating, Antarctic-like configuration. The simulations are idealized, and their purpose is to provide insight into melt-rate sensitivities to subglacial discharge that, in a realistic, global configuration, would be computationally expensive and potentially challenging to interpret. The idealized simulations are performed using a relatively coarse resolution compared to the Greenland-like, vertical ice-cliff studies, in line with the goal of understanding sensitivities in realistic, global model configurations.
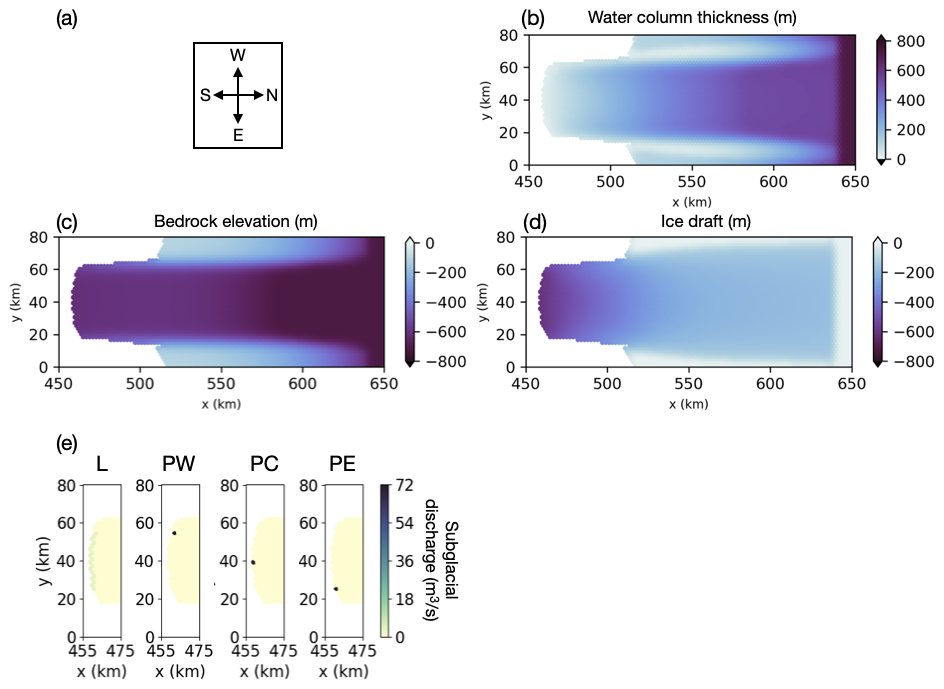
Figure 1(a) Convention for geographic references in text. (b–d) Idealized ISOMIP+ domain setup. (b) Water column thickness. (c) Bedrock elevation. (d) Ice draft. (e) Distribution of subglacial discharge of Fs=72 m3 s−1 at the grounding line along a line (L) or at point west (PW), point center (PC), or point east (PE).
For idealized testing, we use the ocean component of the Energy Exascale Earth System Model (E3SM), the Model for Prediction Across Scales – Ocean (MPAS-Ocean; Ringler et al., 2013). MPAS-Ocean is a finite-volume ocean model that solves the hydrostatic Boussinesq equations. It uses a horizontal mesh defined by a centroidal Voronoi tessellation. The simulations presented here use a planar mesh, rather than one on the surface of a sphere. In our experimental setup, parameterizations and coefficient choices follow the Ocean0 configuration (Fig. 1) from the second Ice Shelf-Ocean Model Intercomparison Project, ISOMIP+ (Asay-Davis et al., 2016). We use the z* vertical coordinate (Adcroft and Campin, 2004) in the open ocean. Beneath ice shelves, the coordinate follows the ice draft, and at the seafloor, layers are dropped when they intersect the bathymetry. As a result, the thickness of the top vertical layer, in contact with the ice-shelf base, varies smoothly from being thinnest near the grounding line (∼0.75 m), thickening towards the ice-shelf front (∼15 m), to being thickest in the open ocean (∼21 m). The Ocean0 experiments presented here are performed with 36 vertical levels and 2 km horizontal resolution. Sensitivity runs with 1 km and 4 km horizontal resolutions and 72 vertical levels were also run and produced qualitatively similar results. The change in resolution can be largely compensated for through an appropriate change in viscosity. For mixing, we employ horizontal and vertical Laplacian diffusivities and viscosities with values from Table 4 in Asay-Davis et al. (2016) that had been chosen to be sufficiently low not to suppress eddies but high enough to avoid numerical instabilities. There are two vertical diffusivity and viscosity values, one for a stable and one for an unstable vertical profile. Horizontal diffusivity and viscosity are constant. We use the linear equation of state. The ice-shelf geometry is static. Ice-shelf basal melting is calculated using the three-equation parameterization with standard coefficients (Jenkins et al., 2010), except for the heat transfer coefficient that was tuned to give a prescribed melt rate as per the ISOMIP+ design document (Asay-Davis et al., 2016). Following Losch (2008), temperature and salinity for calculating thermal driving for ice-shelf basal melting are found by vertically averaging over cells within 10 m of the ice base. In our vertical coordinate system, this Losch layer is necessary for melt-rate convergence with increasing vertical resolution (Gwyther et al., 2020). The Losch layer also acts as an additional source of vertical mixing near the ice base, effectively forming a mixed boundary layer of constant, spatially uniform thickness, which is used by the basal melt-rate parameterization. Heat and freshwater fluxes associated with basal melting are distributed into the ocean based on an exponential profile, with a decay length scale of 10 m, which effectively acts as enhanced vertical diffusivity near the boundary. Frazil ice is allowed to form, but it is not advected with the flow. At each time step, the model checks for frazil ice formation in the top 100 m of the water column, and any frazil mass is brought to the surface immediately and added to interfacial basal melting. The rotating cases use an f-plane configuration with the Coriolis parameter of s−1, which corresponds to the latitude of 75° S.
Initially, potential temperature and salinity are prescribed as horizontally uniform and linearly increasing with depth, with surface values of °C and Ss=33.8 PSU in all cases. In the base case, the properties at the deepest point are Tb=1 °C and Sb=34.7 PSU. At the northern boundary, potential temperature and salinity are restored to the initial values throughout the simulations. No slip boundary conditions are applied at the sidewalls. Subglacial discharge into the ocean at the grounding line is implemented as a volume flux of freshwater at the local pressure-dependent freezing point. Because there is no prescribed evaporation, sea level in the idealized domain increases over time due to the flux of subglacial discharge and ice-shelf basal melt into the domain. The circulation within the ice-shelf cavity is entirely driven by buoyancy forcing from ice-shelf basal melt and grounding-line freshwater flux. The simulations were run for 2 years, by which time the melt-rate pattern had developed and stabilized. Analysis is based on the last monthly mean outputs from the 2-year simulations.
In the first set of experiments, we study the melt-rate response to varying Fs, the spatially integrated subglacial freshwater flux, and how this response changes with different Fs distributions along the grounding line in a rotating framework. We prescribe the boundary shelf conditions as in the base case (Tb=1 °C and Sb=34.7 PSU). We then vary total Fs between 0 and 720 m3 s−1. For each tested Fs value, we also vary its horizontal release location (Fig. 1e) as follows:
-
(L) Fs is distributed along a line corresponding to the deepest part of the grounding line.
-
(PW) Fs is applied at a point in the westernmost grid cell of L (in the case described immediately above).
-
(PC) Fs is applied at a point in the center grid cell of L.
-
(PE) Fs is applied at a point in the easternmost grid cell of L.
These experiments were also carried out in a non-rotating framework, setting f=0 s−1, for comparison of our findings with those from previous studies.
The next set of experiments tests melt-rate sensitivity to varying amount of Fs across different potential temperatures. We keep the surface temperature fixed at −1.9 °C and vary the seafloor potential temperature Tb between −1.9 and 4 °C. The temperature profile was kept linear, and salinity was adjusted to keep the same density profile in all simulations. This sensitivity test was performed for a distributed discharge (L) in a rotating framework.
Simulations were run with Tb values of −1.9, −1, 0, 1, 2, and 4 °C and with Fs values of 0, 7.2, 72, 180, 360, 540, and 720 m3 s−1 to capture sensitivities and regimes of interest. Not every combination of Tb and Fs was run for every horizontal release location. Tb values were chosen to include the present-day range and plausible future range of temperatures occupying the continental shelves of Antarctica. Similarly, Fs values were chosen to span the relatively wide range of modeled subglacial discharge regimes around Antarctica (e.g., Hager et al., 2022b).
By design, some models, such as MPAS-Ocean, are required to have more than a single layer at the grounding line. This then brings up the modeling choice of where to apply Fs in the vertical. In the above experiments, we chose to distribute Fs uniformly in the vertical. Melt-rate sensitivity to this modeling choice is addressed in Appendix A.
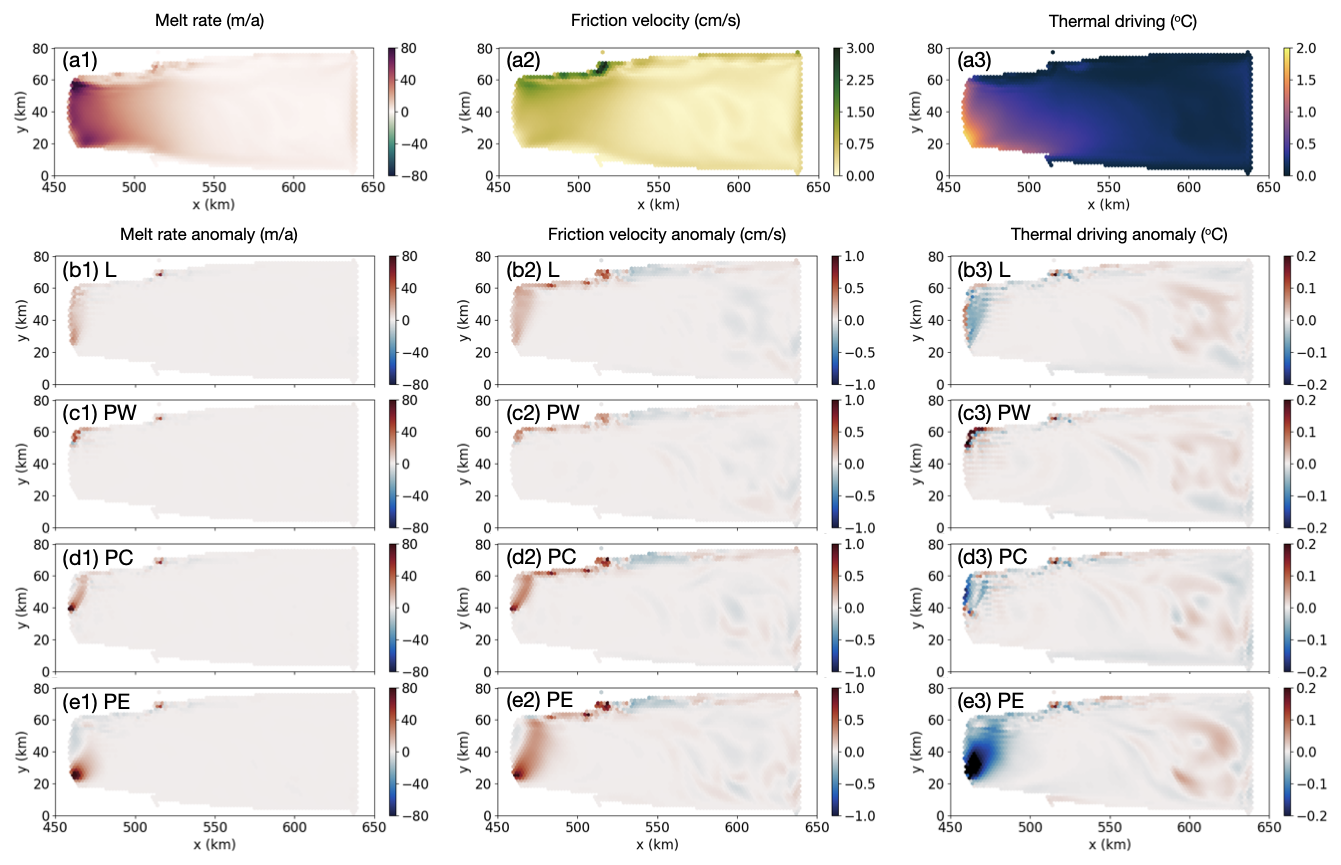
Figure 2(a) Melt rate, friction velocity, and thermal driving for the reference case without subglacial discharge (Fs=0 m3 s−1). (b–e) Melt-rate, friction-velocity, and thermal-driving anomalies when Fs=72 m3 s−1 is added at various locations along the grounding line. (b) Fs is distributed along a line (L). (c–e) Fs is channelized, released at (c) point west (PW), (d) point center (PC), and (e) point east (PE).
With Fs=0 m3 s−1, the total basal melt flux over the ice shelf increases quadratically with the far-field potential temperature (Fig. A1a), in agreement with previous simulations (Holland et al., 2008) and theory (Jenkins et al., 2018). By construction, melt rates are proportional to friction velocity and thermal driving. In the rotating case, the melt-rate spatial pattern is such that melting is highest at the deepest parts of the ice shelf and enhanced at the western grounding line (Fig. 2a1). This holds as long as the thermal driving remains sufficient (Fig. 2a3) to support melting, while the ascending meltwater plume veers westward under the influence of the Coriolis force (Fig. 2a2). The friction velocity shown here in figures (e.g., Fig. 2, second column) is a good proxy for plume speed as long as the plume is attached to the ice base.
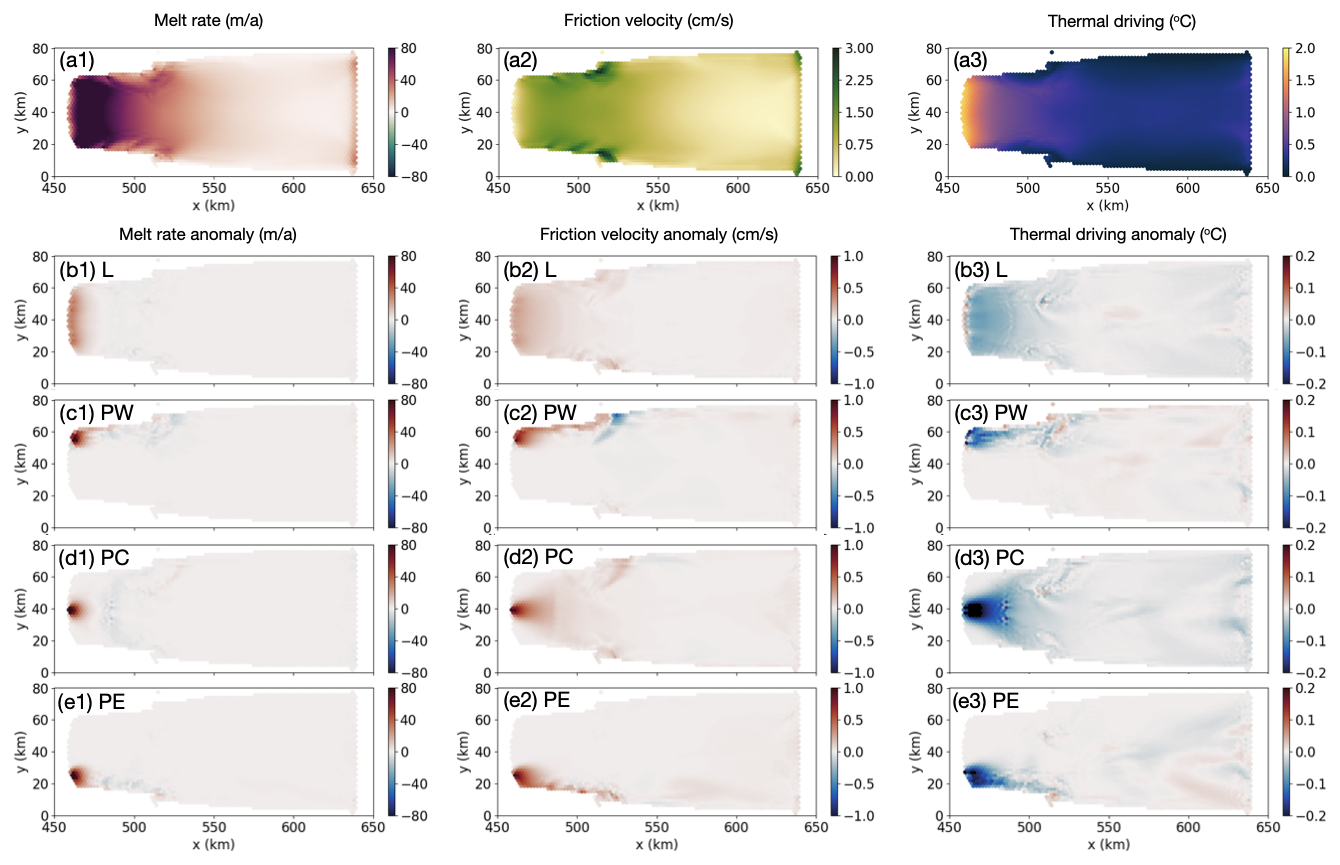
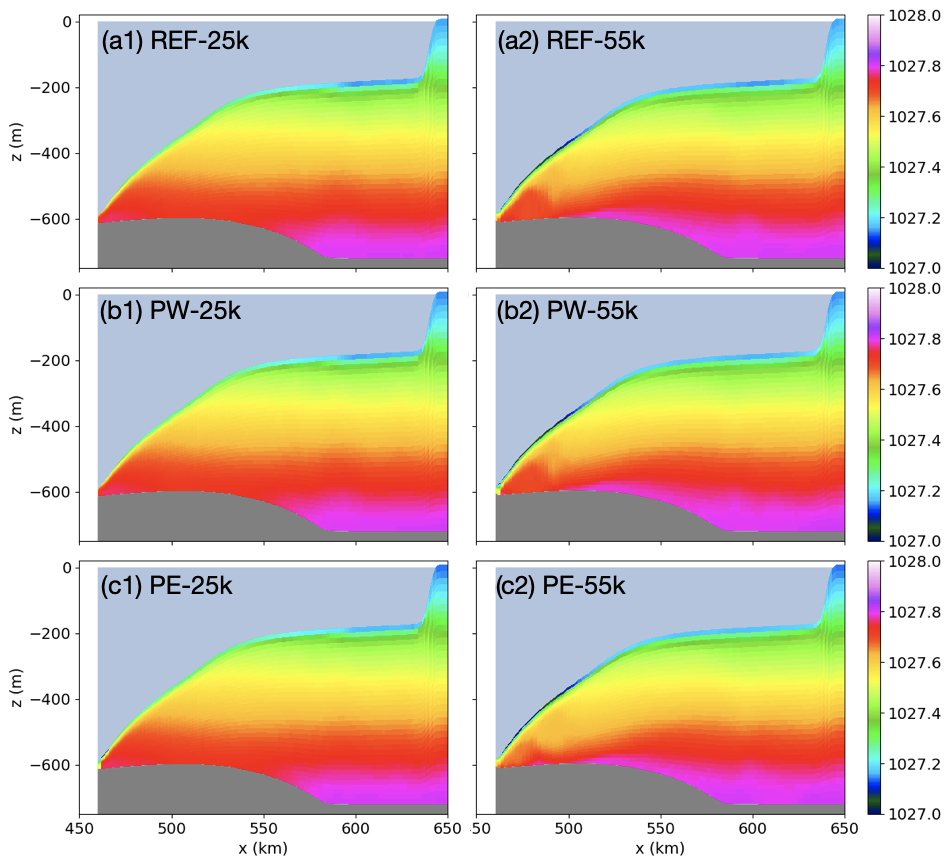
Figure 4Potential density sections. (a) Reference case without subglacial discharge (Fs=0 m3 s−1). (b) Channelized discharge (Fs=72 m3 s−1) applied at point west (PW). (c) The same as (b) but for point east (PE). The sections are located at y=25 and 55 km, from left to right, corresponding to progression from east to west (Fig. 1).
The interplay between friction velocity and thermal driving, when Fs is introduced, is shown in Fig. 2 for the rotating case and in Fig. 3 for the non-rotating one. The sections shown are for the moderate discharge strength of Fs=72 m3 s−1; however, the results do not change qualitatively with the strength of Fs within the tested range of values. Fs enhances friction velocities (e.g., Figs. 2e2 and 3e2) due to added buoyancy, increasing melt that cools the boundary layer (e.g., Figs. 2e3 and 3e3), which in turn suppresses melt. Near the Fs source, the friction velocity increase is so high that it dominates any cooling, producing positive melt-rate anomalies; however, with increasing distance from the source, melt-driven cooling starts compensating for the heightened friction velocity, resulting in little change in melt rates (e.g., Figs. 2e1 and 3e1). The plume slows down quickly as it rises, entrains ambient waters, and thickens. In the rotating case, the plume veers westward relative to its direct, upslope, and northward direction with no rotation. The result is meltwater accumulation near the western grounding line (Fig. 4a2), compared to the east (Fig. 4a1), and increased overall stratification with lighter waters at the surface and meltwater extending deeper into the water column in the west (Fig. 4a2). This stratification asymmetry, already present in the reference case with rotation, sets the stage for the observed qualitative differences in melt response when Fs is introduced and its release location is varied along the grounding line (Fig. 2, left column).
To quantify the rotational effects on the bulk scaling relationship between basal melting and Fs, we introduce , the anomaly in spatially integrated basal melt volume flux with respect to the reference case with Fs=0 m3 s−1. We use total melt-flux anomalies rather than spatially averaged melt-rate anomalies because for relatively localized anomalies, as is the case here, the latter would introduce a more evident dependence of the results on ice-shelf area. As the analysis is focused on the last monthly mean output (of 24 months of simulation) is also averaged in time. We observe that, in the presence of rotation, is strongly dependent on the horizontal release location of point source Fs (Fig. 5a), especially compared to the non-rotating case (Fig. 5b).
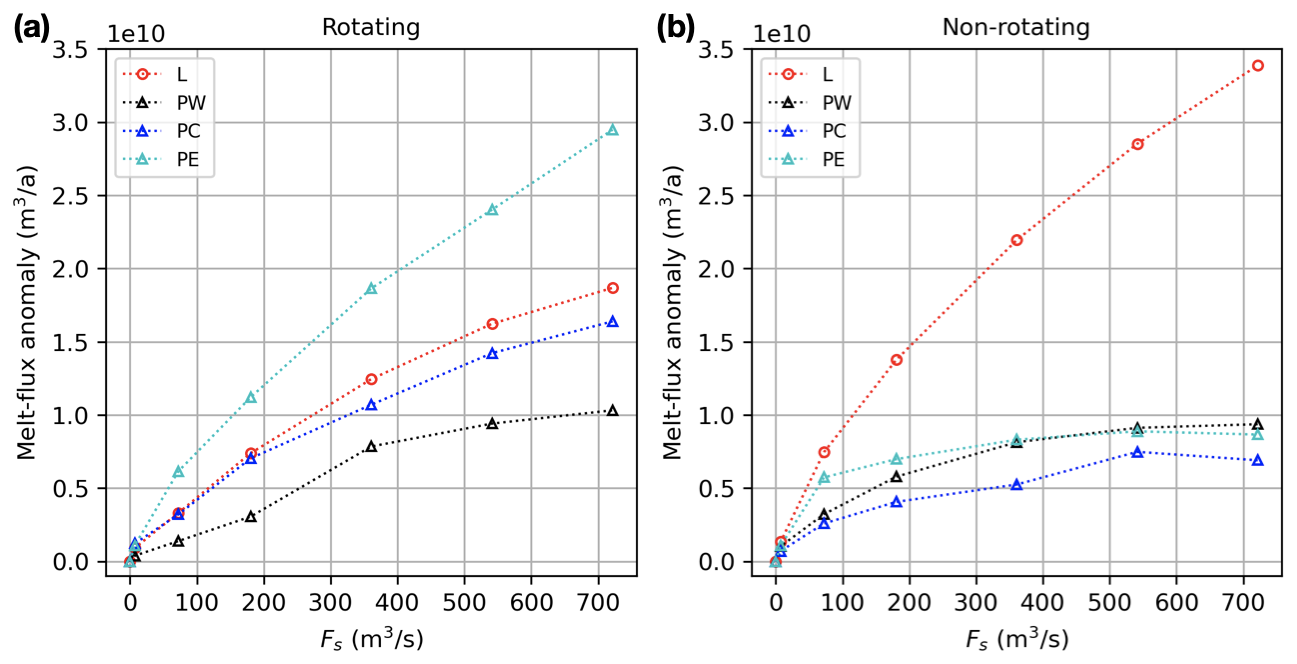
Figure 5Total melt-flux anomaly () as a function of subglacial discharge (Fs) and its horizontal release location and distribution. (a) Rotating case, horizontal distribution sensitivity: Fs is distributed along a line (L) or released at different channelized points (west – PW, center – PC, east – PE). (b) The same as (a) but for the non-rotating case.
3.1 Melt sensitivity to horizontal discharge release location
Starting with the rotating case, the point-source experiments (PW, PC, and PE) show that the most effective location to apply Fs in terms of is at the eastern portion of the grounding line; more than doubles when Fs is applied in the east, rather than in the west (Fig. 5a). When an equivalent Fs is distributed along the grounding line (L), the resulting is approximately halfway between the in the PW and PE cases and is slightly higher than in the PC case. in the PE case is about 1.5 times higher than in the distributed (L) case. This is in part due to a larger portion of the ice-shelf area sustaining positive melt-rate anomalies when the plume is located farther east on the grounding line (Fig. 2e1) compared to its central (Fig. 2d1) or western location (Fig. 2c1). Consistent with the point-source experiment, the distributed case experiences a larger spatial extent of melt-rate increase in the east than in the west (Fig. 2b1).
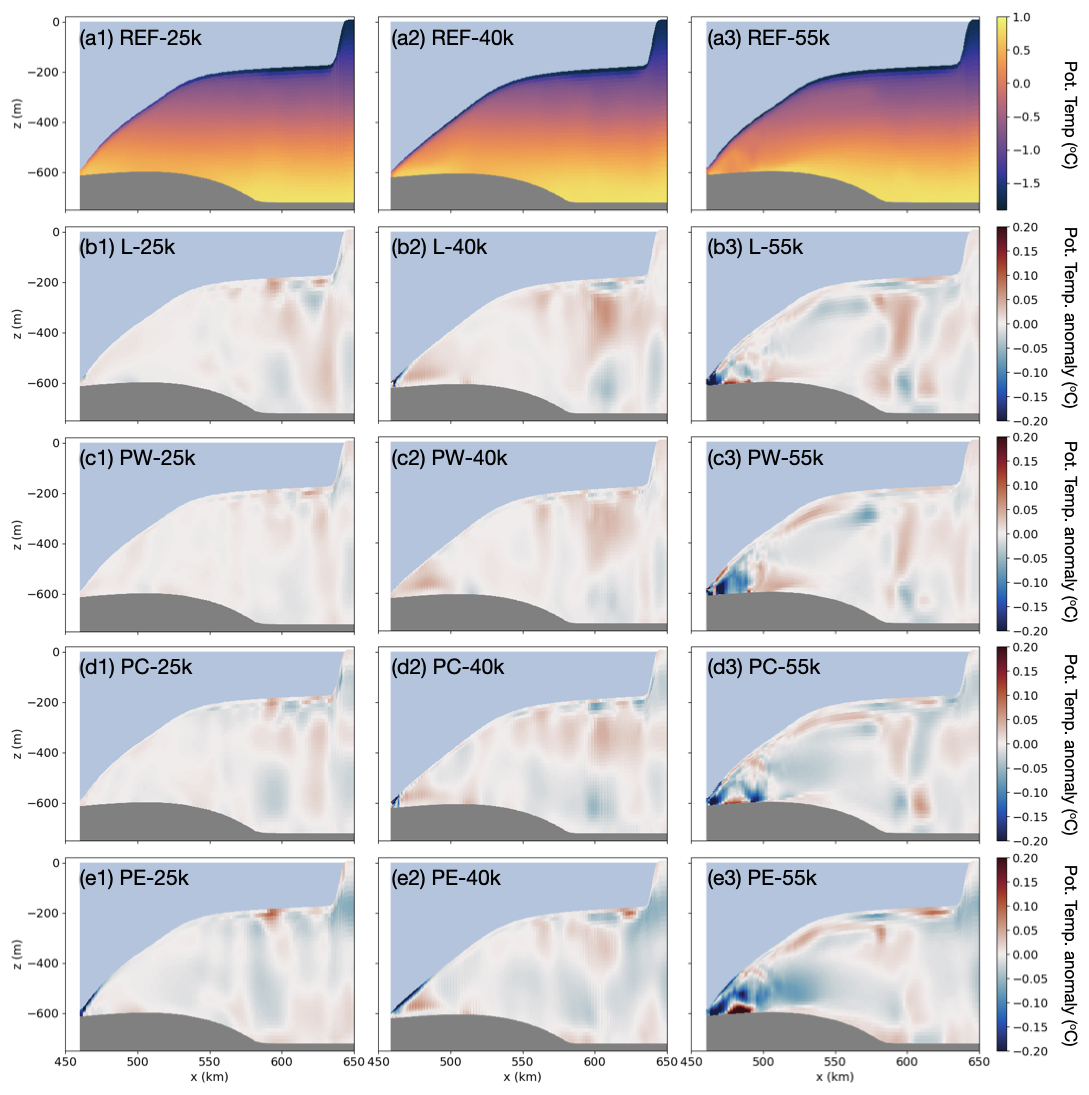
Figure 6(a) Potential-temperature sections for the reference case without subglacial discharge (Fs=0 m3 s−1). (b–e) Potential-temperature anomalies when Fs=72 m3 s−1 is added at various locations along the grounding line. (b) Fs is distributed along a line (L). (c–e) Fs is channelized and released at (c) point west (PW), (d) point center (PC), and (e) point east (PE). The sections are located at y=25, 40, and 55 km, from left to right, corresponding to progression from east to west (Fig. 1).
When Fs is released at a point in the east (PE), where the water column beneath the ice shelf is less stratified compared to the west (Fig. 4c1 vs. 4c2), the added freshwater induces high flow speeds, cooling, and freshening in a thin layer near the ice base, with relative warming beneath it (Fig. 6e1). This fast, thin outflow near the ice base persists as the plume rises, spreads laterally, and turns west (Fig. 6e2). However, along the eastern and central transects, no portion of the plume has reached neutral buoyancy as it does in the non-rotating case (Fig. A2e1). Instead, the plume becomes neutrally buoyant in the western part of the domain, where the presence of the western boundary forces the plume to flow upslope, rise, and mix, as visible in the large temperature anomaly throughout the western section (Fig. 6e3). The addition of Fs has increased vertical mixing in the west, as evidenced by relative warming at the top and relative cooling at the bottom of the water column.
When Fs is released at a point in the center of the grounding line (PC), the response downstream of the release location is similar to the PE case, only weaker (Fig. 6d vs. 6e). The friction velocity increase is lower in this case (Fig. 2d2 vs. 2e2) because the water column is more stratified here, having already been freshened by meltwater coming from the east. This also means that the density difference between the subglacial discharge and the surface waters is reduced, as is the driving force for the plume ascent. Finally, the presence of the western boundary means that, the closer the discharge location is to the west, the less distance the plume is able to travel across the ice shelf before it encounters the boundary and is forced upward along the ice base (Fig. 2, second column).
When Fs is released at a point near the western boundary (PW), these tendencies are even more amplified. The water column is more stratified here, the surface water along the ice base is fresher and lighter (Fig. 4b2), and the proximity of the western boundary is closer, which forces upward flow of meltwater almost immediately upon release (Fig. 2c2). The result is that the plume has less distance to travel along the ice base and it becomes neutrally buoyant deeper in the water column. This is seen as relative warming at the top and relative cooling at the bottom of the water column, much closer to the grounding line (Fig. 6c3). Unlike in the PE and PC cases, for PW this relative warming at the top extends as far as the boundary layer, causing a warm anomaly in the thermal driving (Fig. 2c3).
In summary, the east–west asymmetry in meltwater distribution means that Fs added in the west inputs less buoyancy and therefore less available potential energy into the system than Fs added in the east. Together with the east–west asymmetry in stratification, this means that when injected in the west, the plume becomes neutrally buoyant deeper in the water column, keeping any positive melt-rate anomalies closer to the grounding line and lowering their magnitude (Fig. 2, left column).
3.2 Scaling relationships between subglacial discharge and melt
We now turn our attention to the scaling relationship between melt flux and Fs, which has been extensively studied for non-rotating scenarios. Figure 5 not only shows that depends on the horizontal distribution of Fs for the rotating case with point-source discharge, but also indicates that the functional form of the sub-linear relationship between and Fs differs depending on whether rotation is included and whether Fs is distributed or channelized (Fig. 5).
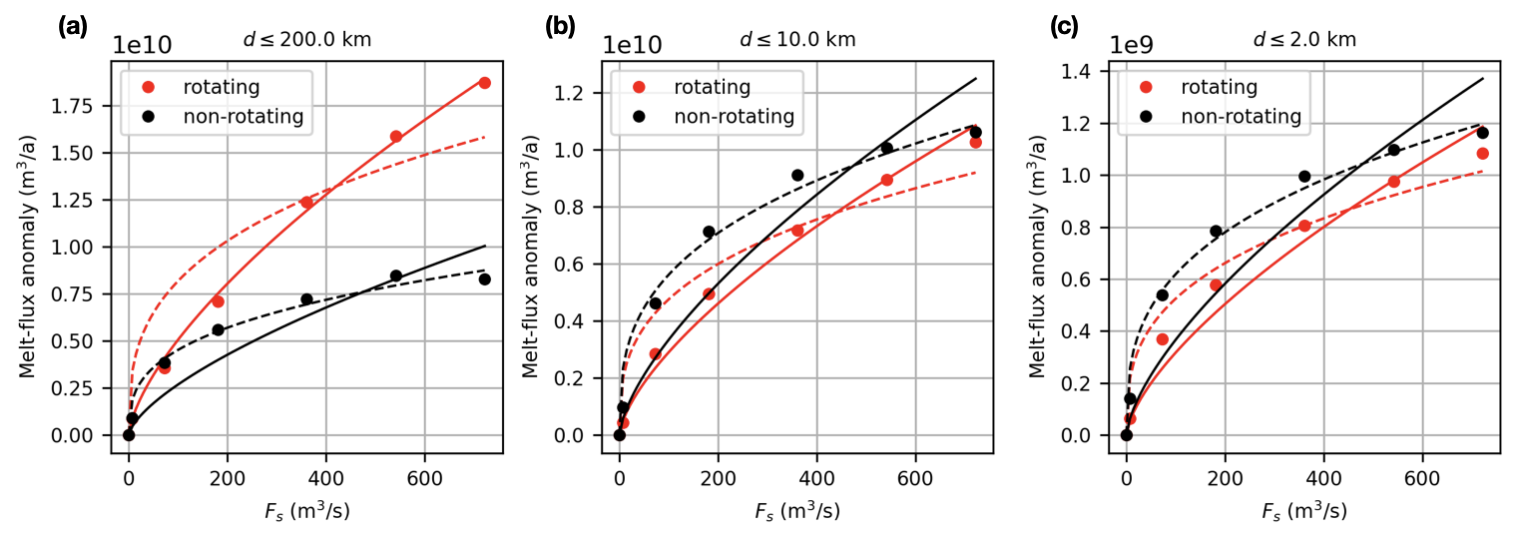
Figure 7Scaling relationships between the integrated melt-flux anomaly () and subglacial discharge (Fs) for channelized system from averaged PW, PC, and PE experiments as in Fig. 5. The melt-flux anomaly is integrated over distance d from the discharge location. The dashed line scales with Fs to one-third power, and the solid line scales with Fs to two-thirds power.
To investigate how the functional form of the sub-linear relationship between Fs and depends on rotation for the channelized drainage system, we first remove differences associated with the domain asymmetries and the presence of boundaries. To do that, we average the results for all three point release cases separately for the rotating and the non-rotating scenarios (Fig. 5). We confirm that the non-rotating case complies with theory; that is, scales with one-third power of Fs (Fig. 7a, dashed black line), as in Jenkins (2011). However, in the rotating case, the one-third power scaling clearly overestimates for low Fs and underestimates it for high Fs (Fig. 7a, dashed red line), which means that the curvature of the one-third power scaling is incorrect. A higher power scaling seems to be a better fit for the rotating case; we find that scales well with two-thirds power of Fs. We note that the stronger scaling with Fs for the rotating case does not depend on f as long as (Fig. A1c).
Nevertheless, the theory of Jenkins (2011) should still hold in the rotating case at small distances from the source before the Coriolis effect becomes important. To test this, instead of integrating over the entire domain, we integrate melt-flux anomalies over a fixed distance from the Fs source. We compare integrated over the whole domain, over an area within 10 km of the source, and within 2 km of the source (Fig. 7a–c). We observe that, for the rotating case, the scaling between and Fs becomes closer to one-third power as melt fluxes are integrated over a smaller area nearer to the source (Fig. 7c), as expected from the non-rotating, convectively forced plume theory.
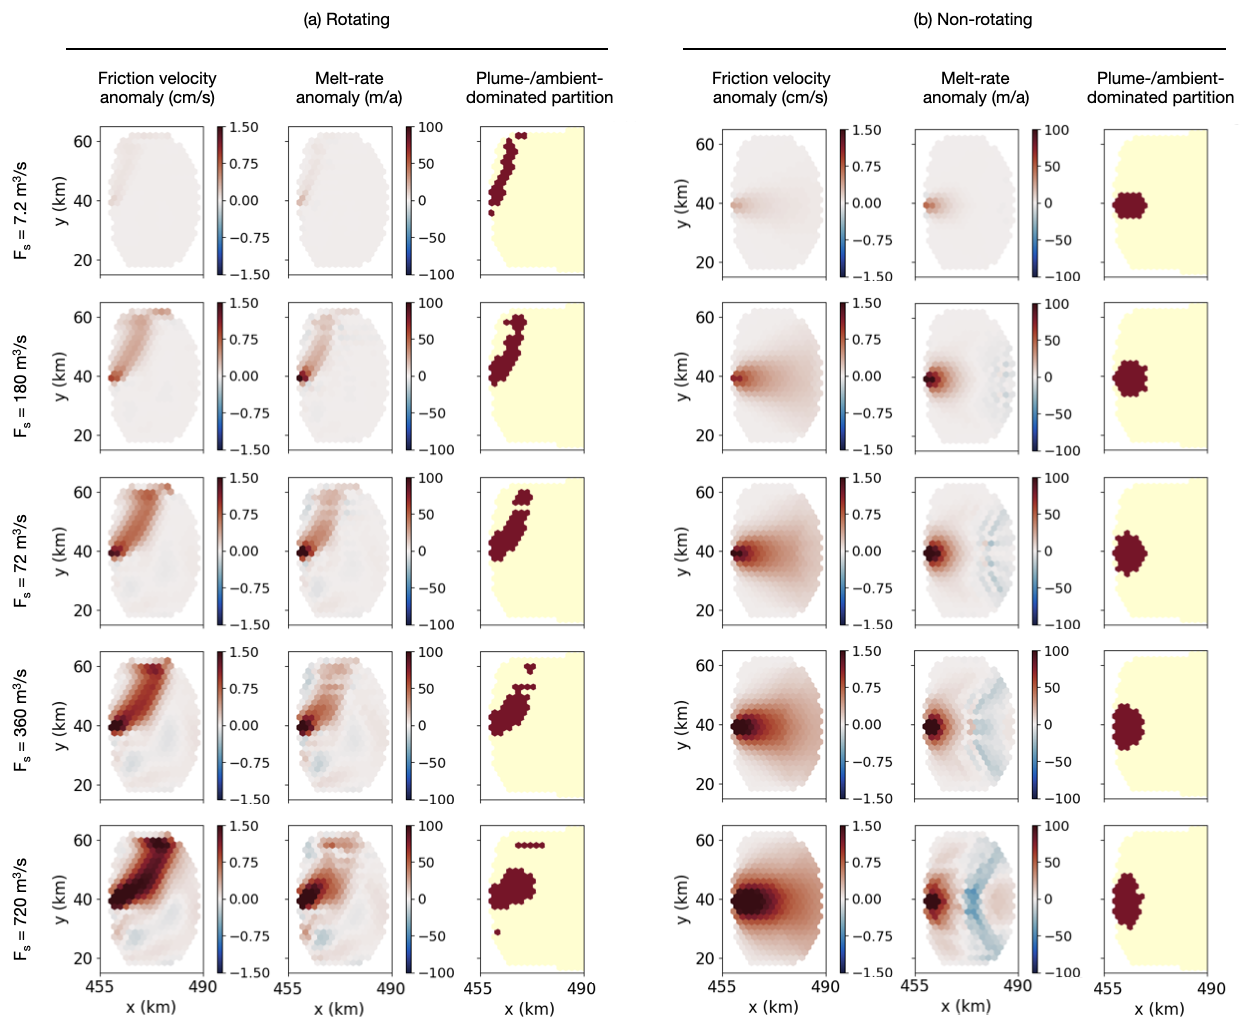
Figure 8Friction velocity anomaly; melt-rate anomaly; and area partitioning into high-melt, plume-dominated (dark area) and low-melt, ambient-dominated (light area) regions for the (a) rotating and (b) non-rotating case. We show the ice-shelf area within 30 km of the Fs source, which is used in the analysis in Fig. 9. The rows are different values of the channelized discharge Fs released at point center (PC).
To further investigate possible causes of the power-law difference due to the inclusion of rotation, we partition the ice-shelf area into a high-melt, plume-dominated region and a low-melt, ambient-dominated region and study how each partition contributes to the overall melt-flux anomaly. To capture the high-melt region near the Fs source and along the path of the elevated plume-driven friction velocities in each case, we define the plume-dominated partition as the region where the melt-rate anomaly exceeds the threshold of 10 % of the maximum melt-rate anomaly and the ambient-dominated partition as the remainder of the ice shelf (Fig. 8). Because most of the melt-rate anomaly occurs within a few tens of kilometers of the grounding line, we restrict our attention to the area within 30 km of the Fs source (shown in Fig. 8 for the PC case). As done previously, for both the rotating and the non-rotating scenarios, we average the results from all three point release cases (PE, PC, and PW). We quantify the relative contribution of the two partitions to the total melt-flux anomaly and inspect the change in the partition area and in the mean melt-rate anomaly, averaged over each partition separately, as Fs increases. The melt-flux anomaly (e.g., Fig. 9a) is the product of the mean melt-rate anomaly (e.g., Fig. 9b) and the area over which the melt-rate anomaly is averaged (e.g., Fig. 9c). The partitioning changes from case to case (Fig. 8); therefore the melt-rate anomaly is averaged and the melt-flux anomaly integrated over a different area for each partition in each scenario.
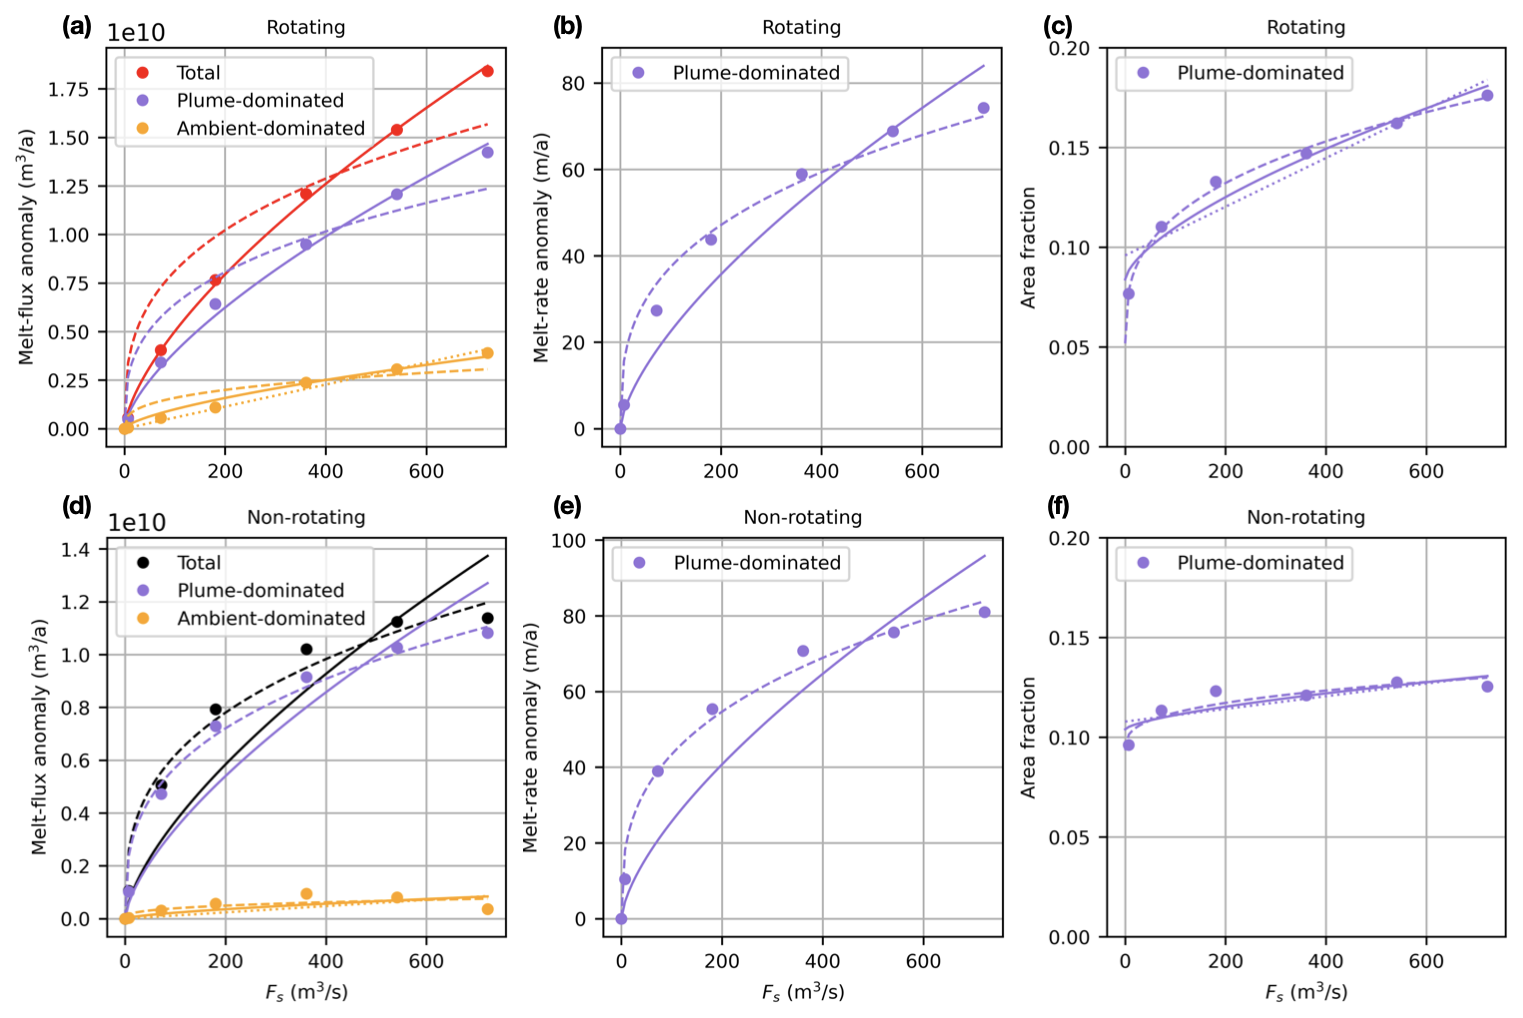
Figure 9Scaling relationships with subglacial discharge (Fs) for different quantities evaluated over a plume-dominated or ambient-dominated partition (Fig. 8) of the ice-shelf base within 30 km of the discharge location. We consider the averaged channelized experiments. (a, d) Spatially integrated melt-flux anomaly. (b, e) Spatially averaged melt-rate anomaly. (c, f) Area fraction of an ice-shelf partition. Panels (a)–(c) show the rotating case and panels (d)–(f) the non-rotating case results. In all panels, the dashed line scales with Fs to one-third power, the solid line scales with Fs to two-thirds power, and the dotted line (where applicable) is a linear scaling with Fs.
We observe that most of the melt-flux increase with Fs occurs over the plume-dominated partition in both the rotating and the non-rotating cases (Fig. 9a, d). Therefore, explaining the melt-flux anomaly behavior of the plume-dominated partition is sufficient to the understanding of the total melt-flux anomaly behavior as Fs increases. We find that while the melt-flux anomaly respects the power-law scaling identified above, with rotation and without (Fig. 9a, d), the melt-rate anomaly averaged over the plume-dominated partition scales with one-third power of Fs both with and without rotation (Fig. 9b, e). This is reconciled by the observation that the area fraction of the plume-dominated partition scales with one-third power of Fs in the presence of rotation (Fig. 9c) but is nearly constant in the non-rotating case (Fig. 9f). This means that it is the increase in the area of the plume-dominated partition that causes stronger dependence of the melt-flux anomaly on Fs when rotation is included. By design, the plume-dominated partition (Fig. 8a, right column) closely follows the plume path identified by high friction velocities (Fig. 8a, left column). Therefore, it is clear that the higher area increase in the plume-dominated partition with Fs is related to the increasing distance over which the plume is deflected by the Coriolis force as its flow speed increases. While for the rotating case the plume path increases with the strength of Fs, this is not the case for the non-rotating case, where the flow is upward along the ice base independent of Fs. There, as the plume cools with increased melt near the discharge location, an initially sharp melt-rate increase quickly declines with distance (Fig. 8b, middle column), resulting in little area change in the plume-dominated partition (Fig. 8b, right column).
Turning to the distributed system and repeating the same analysis, we observe that scales with two-thirds power of Fs for both the rotating and the non-rotating case (Fig. A3a, solid lines). When averaged over cells within 2 km of the source, that is 1 grid-cell distance away from the Fs source, the scaling with Fs lies between one-third and two-thirds power (Fig. A3c), but already when averaged over 10 km distance from the Fs source, the scaling is much closer to two-thirds power for both cases (Fig. A3b). The analysis that partitions the ice-shelf area within 30 km of the Fs source into plume-dominated and ambient-dominated regions shows similar results for the rotating and non-rotating scenarios. Most of the melt-flux anomaly with Fs occurs over the plume-dominated partition in both the rotating and the non-rotating cases (Fig. A4a, d). In both cases, the melt-rate anomaly averaged over the plume-dominated partition (Fig. A4b, e) and the area fraction of the plume-dominated partition (Fig. A4c, f) scale with Fs similarly such that their product gives a two-third power dependence of the melt-flux anomaly on Fs (Fig. A4a, d). For the distributed system, there is some sensitivity of the exact scaling relation of both the area fraction and the associated melt-rate anomaly with Fs to the choice of the partitioning criteria, but the result – that these scalings are the same with and without rotation – is independent of the threshold.
From our idealized experiments that include rotation, we found that channelized discharge can either increase or decrease the integrated melt-flux anomaly compared to the distributed system, in our particular setup by about 50 % (Fig. 5a). This contrasts with findings from non-rotating experiments by Slater et al. (2015). They modeled a Greenland-like vertical ice front and varied the distribution of freshwater discharge along the grounding line, concluding that distributed Fs is always more efficient in driving melting than channelized Fs in their simulations by up to a factor of 5. Results from our non-rotating experiments are qualitatively consistent with Slater et al. (2015), and we observe a higher for horizontally distributed than for channelized discharge. This is particularly pronounced as Fs increases, owing to the higher exponent in the power-law relationship between and Fs in the distributed case than in the channelized case (Fig. 5b). A key reason why the findings of Slater et al. (2015) – that the melt-rate response to discharge increases with the number of sources – do not apply in the rotating case is that they rely on individual plumes not interacting with each other. In the non-rotating case, individual plumes only interact when spaced sufficiently close together, but in the rotating case, the plumes interact even if spaced far from each other. Rotation eventually makes all melt from individual plumes coalesce on one side of the domain, which results in less ice-shelf area available for discharge-driven melt-rate increase compared to the non-rotating case.
The reason for the two-thirds power dependence of melt flux on Fs in the non-rotating, distributed case compared to the one-third power dependence in the channelized, non-rotating case is not clear but appears to be related to the faster growth of the area of the plume-dominated partition with Fs in the distributed case and may be related to interacting plumes. Although this difference has not been explicitly discussed in previous studies, it may be implicitly present in the work of Xu et al. (2013). They studied the relationship between submarine melt rate and discharge through three-dimensional simulations of a vertical ice front, finding a more complicated, sub-linear relationship than a simple power law, and identified two regimes, one appropriate for low Fs and the other for high Fs. In the light of our results, this difference can be attributed to the way variations in Fs magnitude were prescribed in their study: Xu et al. (2013) fixed the value of Fs in each grid cell, and, to increase total discharge, they increased the number of grid cells where this fixed Fs was applied. Thus, for lower values of Fs, they effectively simulated a channelized system and, for higher values of Fs, the system effectively became distributed. As a consequence, according to our results, the power law gradually changes from a one-third to a two-thirds power dependence, giving rise to the more complicated functional relationship reported on in Xu et al. (2013). Notably, the parameterization of Xu et al. (2013), subsequently adopted by the Ice Sheet Model Intercomparison Project for CMIP6 – Greenland Ice Sheet (ISMIP6-GIS; Slater et al., 2020), is widely used in ice-sheet models as the standard vertical ice-cliff melt-rate parameterization. While we are not able to simulate vertical cliffs, our results from non-rotating ice-shelf simulations suggest that the functional form of the melt-rate dependence on discharge from Xu et al. (2013) may need to be revised. Specifically, rather than the exponent (n) being a function of the discharge strength, our simulations indicate that n depends on whether the discharge is distributed () or channelized ().
Our results have implications for melt-rate parameterizations that attempt to realistically account for the effects of subglacial discharge on ice-shelf basal melting. The same amount of total discharge can more than double if located in the east as opposed to the west of the domain (for the Southern Hemisphere). This result is based on a highly idealized ice-shelf domain and will likely change quantitatively as additional geometric complexities are included. The sensitivity of to discharge location along the grounding line is not accounted for in existing parameterizations (Jenkins, 2011; Pelle et al., 2023) and may be difficult to include accurately, especially for more complicated geometries. Our results highlight the sensitivity of melt rates to the location of channelized, submarine discharge and, therefore, also highlight the importance of accurate modeling of subglacial meltwater discharge via subglacial hydrology models.
We have primarily focused on characterizing spatially integrated melt-flux anomalies in the presence of subglacial discharge, as have previous ocean modeling studies of melting vertical cliffs and floating ice tongues. While some ice-sheet modeling studies indicate that spatially averaged melt rates are far more important for determining ice-sheet dynamics than their spatial variations (Joughin et al., 2024), a more extensive body of literature argues that melt rates near grounding lines and pinning points matter to the ice-sheet dynamics much more than melt rates elsewhere on the ice shelf (Gagliardini et al., 2010; Fürst et al., 2016; Reese et al., 2018; Zhang et al., 2020). An understanding of how the melt-rate anomalies due to subglacial discharge ultimately affect ice-sheet dynamics will require an ice-sheet model with a suitable melt-rate parameterization (e.g., Pelle et al., 2023) or a coupled ice-sheet–ocean–subglacial hydrology model.
We studied the effect of subglacial discharge on submarine melt rates for an idealized, Antarctic-like ice shelf within a rotating reference frame. This work complements existing studies focusing on non-rotating, idealized, Greenland-like vertical calving fronts and narrow ice tongues. The motivation for the study was to develop a conceptual understanding of the sensitivities and response of the system in an idealized setup before conducting global, realistic simulations. Relevant to the realistic simulations, we found that with restoring shelf conditions, the total melt-flux anomaly scales with two-thirds power of the discharge. This is a stronger melt-flux anomaly dependency on discharge than found in previously studied non-rotating cases. It results from a larger fraction of the ice-shelf base being exposed to high melt rates, locally driven by the rising plume that is deflected under rotation and whose travel path increases when forced by stronger discharge. We also found that the melt-rate response is strongly sensitive to the location of the discharge along the grounding line; the efficiency of subglacial discharge, in terms of the total melt-flux anomaly, grows with distance from the area where meltwater ultimately accumulates due to rotational effects (the western ice-shelf margin in this study). The relationship between the melt-flux anomaly and the number of sources for a given total discharge derived from non-rotating, vertical cliff experiments does not translate to the rotating ice-shelf scenario. Our results complicate the task of melt-rate parameterizations aspiring to account for subglacial discharge effects in that there is a significant additional melt-flux sensitivity to discharge location. The sensitivity to the location of discharge also lends new importance to accurate modeling of subglacial hydrology.
We tested the total melt-flux anomaly sensitivity to the modeling choice of Fs vertical distribution as follows:
-
(T) Fs is concentrated in the top vertical layer.
-
(U) Fs is uniformly mixed in the vertical.
-
(B) Fs is concentrated in the bottom vertical layer.
This sensitivity test was performed for a distributed discharge in a rotating framework for three different bottom potential temperatures, −1, 0, and 1 °C. As expected, based on the different amounts of added available potential energy, the highest is produced when Fs is released at the bottom vertical layer and the lowest when Fs is released at the top layer (Fig. A1b). While the difference in caused by a choice of vertical release location can be up to 20 %, this choice does not affect the scaling relationship between and Fs.
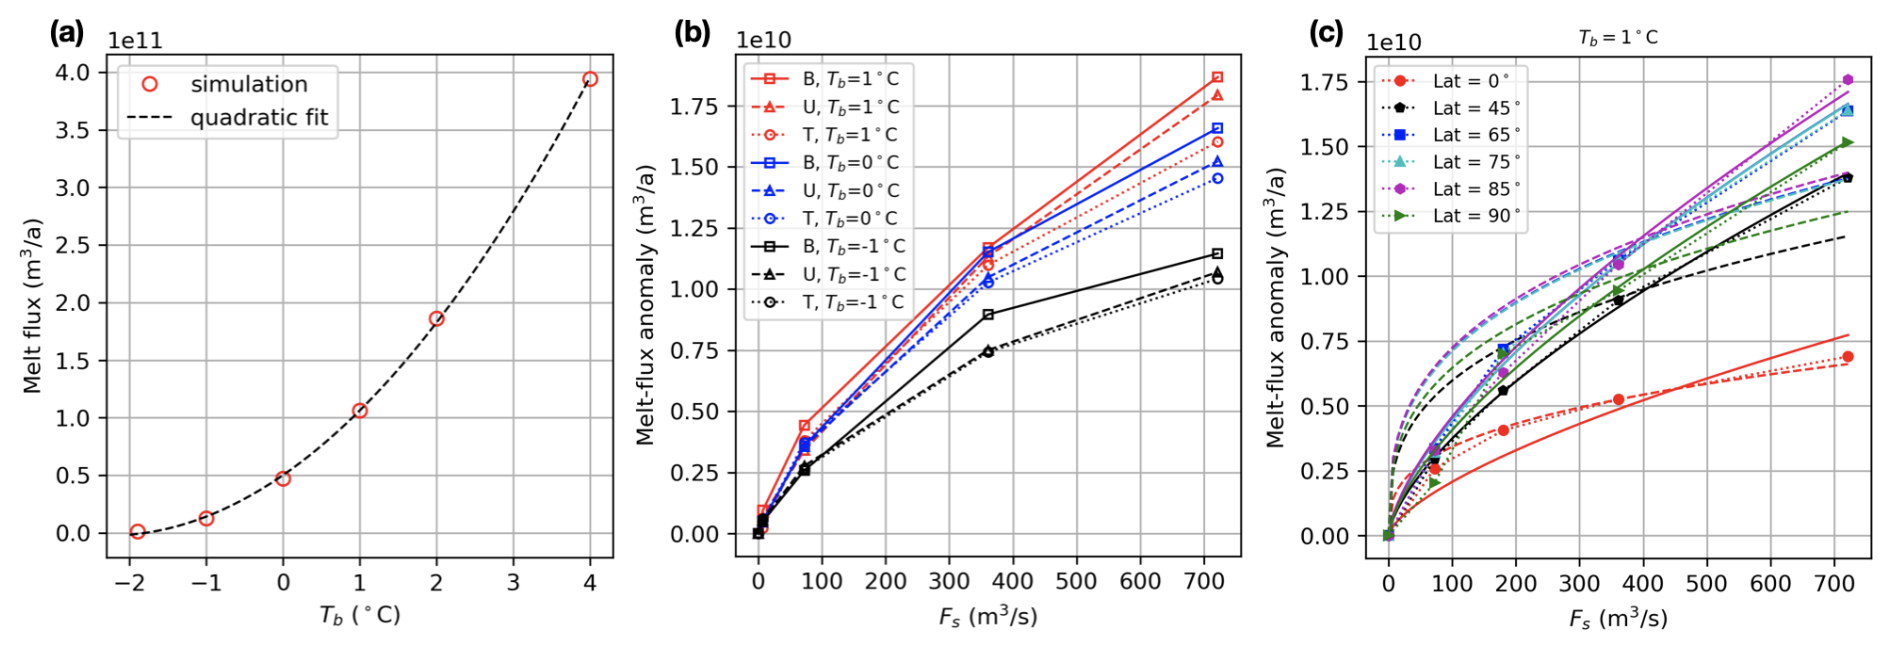
Figure A1(a) Mean reference basal melt flux for different shelf conditions set by property restoration at the northern boundary; Tb is the restoring potential temperature at the seafloor. The dashed line shows a quadratic fit. (b) Total melt-flux anomaly () as a function of distributed subglacial discharge strength (Fs) for different vertical release locations and temperatures. The sensitivity is tested for a rotating case, and Fs is distributed along a line (L) and released at the bottom (B) layer or top (T) layer or uniformly mixed in the vertical (U). (c) as a function of Fs for varying latitude via the Coriolis parameter. The dashed line is scaling with Fs to one-third power, and the solid line is scaling with Fs to two-thirds power, using a least-squares fit. The filled dots connected by dotted lines are simulation results.
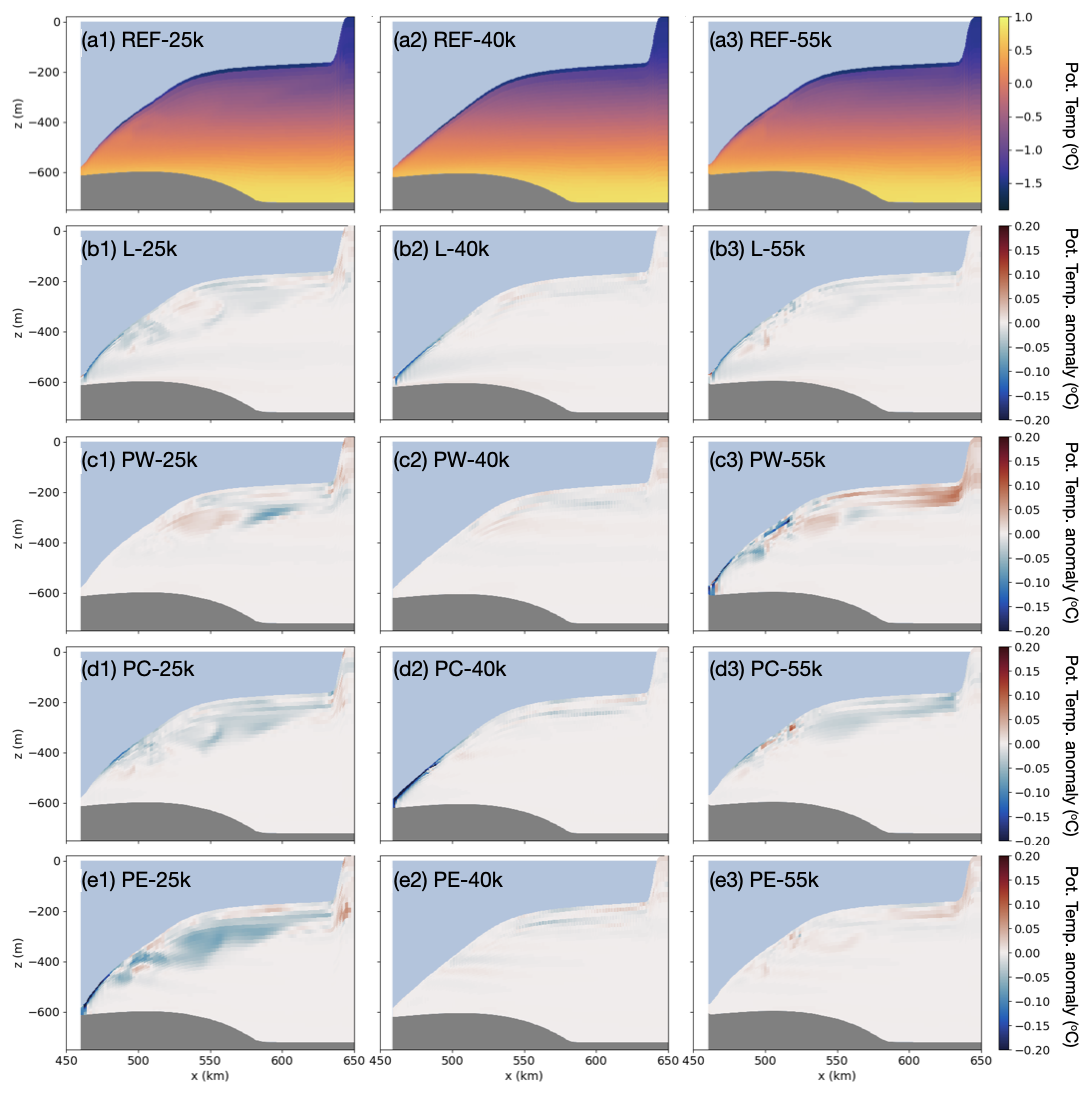
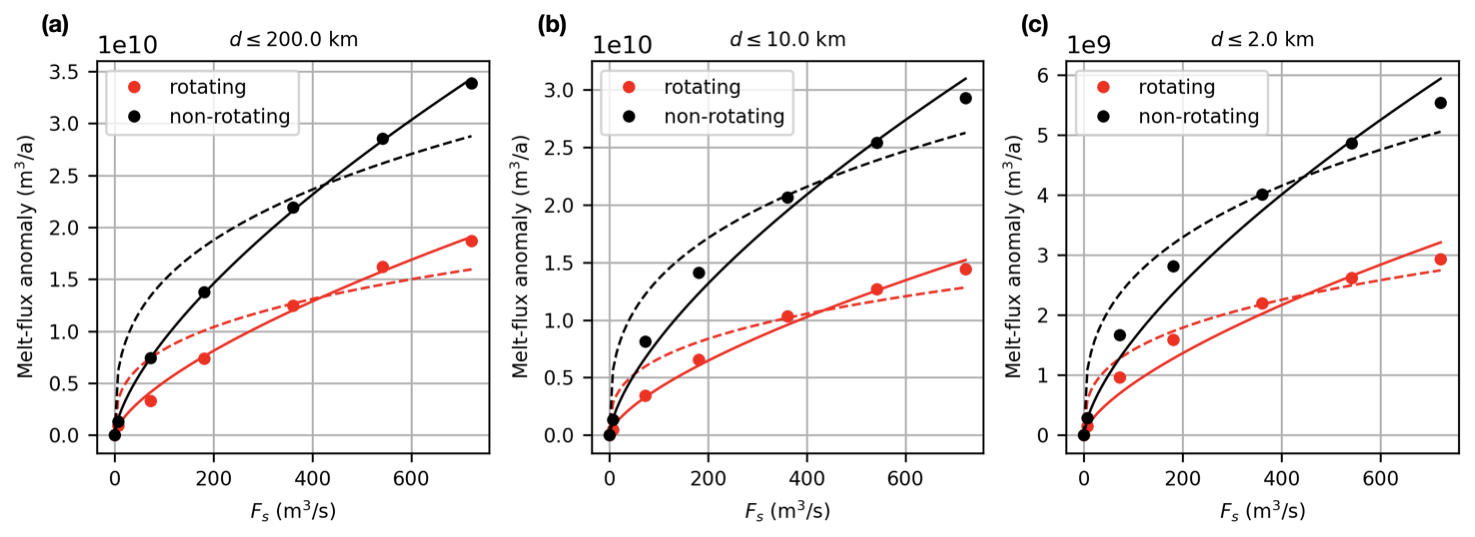
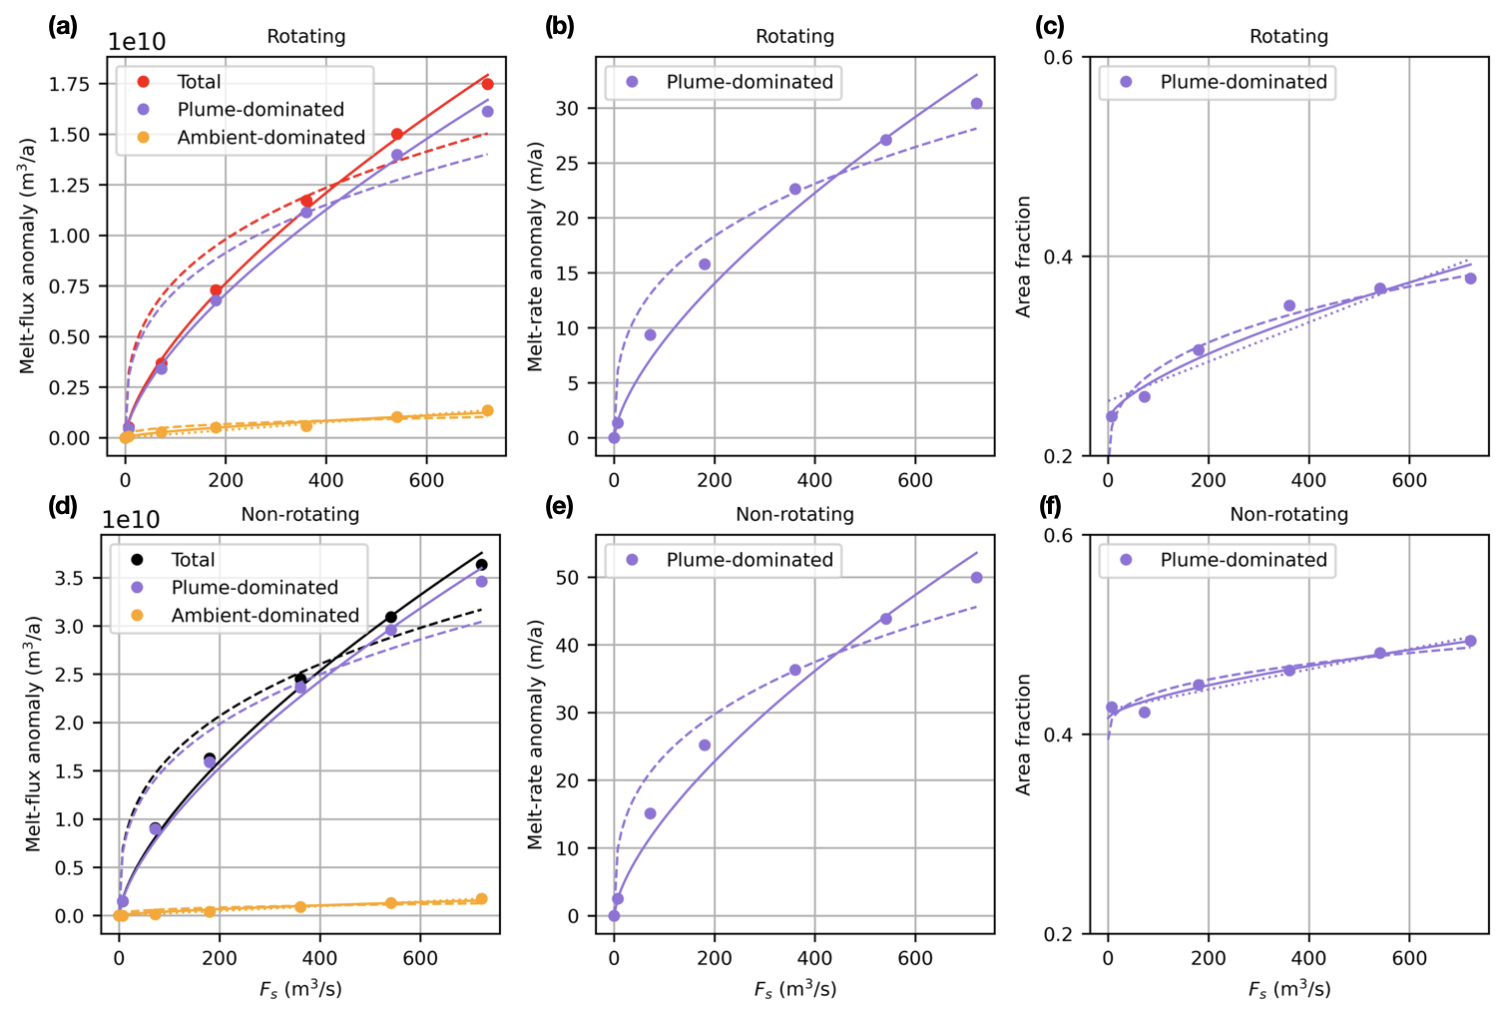
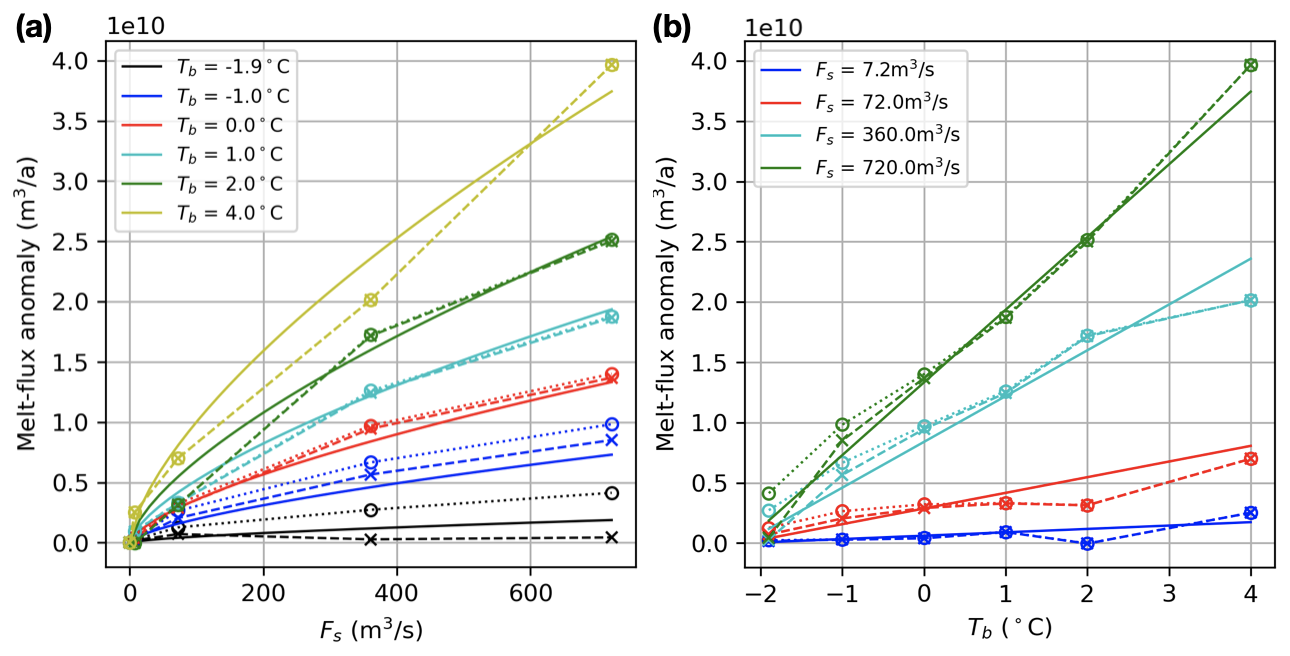
Figure A5(a) The relationship between the total melt-flux anomaly () and distributed subglacial discharge (Fs) for different Tb values. (b) The relationship between and Tb for different Fs values. In both panels, the circles connected by dotted lines are modeled anomalies calculated from the interfacial melt rate, while the crosses connected by dashed lines are modeled anomalies calculated from the total melt rate – the sum of the interfacial melt rate and freezing rate due to frazil formation. The solid line is the fit from Eq. (A1).
We also tested the robustness of the scaling relationship between and Fs to varying latitude via the Coriolis parameter. This was tested for the PC case for latitudes of 45, 65, 85, and 90° S, in addition to the latitudes of 0 and 75° S that are the focus of the paper. We find that in cases where , scales well with two-thirds power of Fs independently of latitude (Fig. A1c).
Finally, to check whether the scaling of with Fs holds across different ambient temperatures, we run temperature sensitivity experiments for the rotating, distributed case. We find that the two-thirds power scaling holds across different values of far-field bottom potential temperature (Fig. A5a), especially for interfacial melting. At colder temperatures ( °C), when significant quantities of frazil form and frazil freezing anomalies largely compensate for interfacial melting anomalies, the sensitivity to Fs drops and is saturated (Fig. A5a, dashed black line). Unfortunately, the representation of frazil dynamics in MPAS-Ocean is rather simplistic, so we are not in a position to investigate frazil-related dynamics in greater detail. Finally, based on the rotating, distributed case, we confirm that depends approximately linearly on ambient potential temperature (Fig. A5b) in the same way as it does in the non-rotating, convectively forced plume theory (Jenkins, 2011). The functional fit used to produce the solid curves in Fig. A5 is
with being imposed. The remaining coefficients T0 and k can be obtained using regression, but their values will likely depend on the ice-shelf dimensions and shape. The least-squares fit in Fig. A5 yields T0 that is a bit lower than the freezing point, indicating that the equation does not apply well when ambient temperatures are close to the freezing point and when frazil dynamics become important (Fig. A5a, dashed black line), as already discussed.
The E3SM code is available at https://github.com/E3SM-Project/E3SM (last access: 20 September 2024), and the branch used for the simulations presented here is https://github.com/irenavankova/E3SM/tree/sg_pull_w_fraz (last access: 20 September 2024; Git hash: 52b7bf50d52f7d9d4214ae656f225fb45223a2ee) and https://doi.org/10.11578/E3SM/dc.20240301.3 (E3SM Project, DOE, 2024). The test cases were constructed and run using COMPASS (Configuration Of Model for Prediction Across Scales Setups), available at https://github.com/MPAS-Dev/compass (last access: 20 September 2024) and https://doi.org/10.5281/zenodo.14753064 (Asay-Davis et al., 2025).
IV conceptualized the research, coded the freshwater discharge flux feature into MPAS-Ocean and E3SM, conducted the simulations, analyzed the results, made the plots, and wrote the original manuscript. XAD and IV discussed and shaped the research along the way. XAD, DC, and JW provided software support. XAD, CBB, DC, AH, MH, and SFP contributed to the review and editing process. MH, SFP, and IV contributed funding and acquired resources.
The contact author has declared that none of the authors has any competing interests.
Publisher's note: Copernicus Publications remains neutral with regard to jurisdictional claims made in the text, published maps, institutional affiliations, or any other geographical representation in this paper. While Copernicus Publications makes every effort to include appropriate place names, the final responsibility lies with the authors.
This research used resources provided by the Los Alamos National Laboratory Institutional Computing Program, which is supported by the US Department of Energy National Nuclear Security Administration under contract no. 89233218CNA000001. We gratefully acknowledge the computing resources provided on Blues, a high-performance computing cluster operated by the Laboratory Computing Resource Center at Argonne National Laboratory. We thank the two anonymous reviewers for their valuable feedback.
This research has been supported by the Scientific Discovery through Advanced Computing (SciDAC) program, funded by the US Department of Energy (DOE) Office of Science's Advanced Scientific Computing Research and Biological and Environmental Research programs. Irena Vaňková also received funding from the Laboratory Directed Research and Development program of Los Alamos National Laboratory (project no. 20220812PRD4).
This paper was edited by Nicolas Jourdain and reviewed by two anonymous referees.
Adcroft, A. and Campin, J.-M.: Rescaled Height Coordinates for Accurate Representation of Free-Surface Flows in Ocean Circulation Models, Ocean Model., 7, 269–284, https://doi.org/10.1016/j.ocemod.2003.09.003, 2004. a
Asay-Davis, X. S., Cornford, S. L., Durand, G., Galton-Fenzi, B. K., Gladstone, R. M., Gudmundsson, G. H., Hattermann, T., Holland, D. M., Holland, D., Holland, P. R., Martin, D. F., Mathiot, P., Pattyn, F., and Seroussi, H.: Experimental design for three interrelated marine ice sheet and ocean model intercomparison projects: MISMIP v. 3 (MISMIP +), ISOMIP v. 2 (ISOMIP +) and MISOMIP v. 1 (MISOMIP1), Geosci. Model Dev., 9, 2471–2497, https://doi.org/10.5194/gmd-9-2471-2016, 2016. a, b, c
Asay-Davis, X., Hoffman, M., Begeman, C., Petersen, M., Hillebrand, T., Han, H., Nolan, A., Brus, S., Wolfram, P. J., Barthel, A., Capodaglio, G., Calandrini, S., Vankova, I., Denlinger, A., Van Roekel, L., Eidenbenz, Y., Bosler, P., Brady, R., Perego, M., Moore-Maley, B., Takano, Y., Cao, Z., Zhang, T., Lilly, J., Carlson, M., Smith, C., Turner, M., and Engwirda, D.: MPAS-Dev/compass: v1.6.0 (1.6.0), Zenodo [code], https://doi.org/10.5281/zenodo.14753064, 2025. a
Burgard, C., Jourdain, N. C., Reese, R., Jenkins, A., and Mathiot, P.: An assessment of basal melt parameterisations for Antarctic ice shelves, The Cryosphere, 16, 4931–4975, https://doi.org/10.5194/tc-16-4931-2022, 2022. a
Cai, C., Rignot, E., Menemenlis, D., and Nakayama, Y.: Observations and Modeling of Ocean-Induced Melt beneath Petermann Glacier Ice Shelf in Northwestern Greenland, Geophys. Res. Lett., 44, 8396–8403, https://doi.org/10.1002/2017GL073711, 2017. a, b, c
Carroll, D., Sutherland, D. A., Shroyer, E. L., Nash, J. D., Catania, G. A., and Stearns, L. A.: Subglacial Discharge-Driven Renewal of Tidewater Glacier Fjords, J. Geophys. Res.-Oceans, 122, 6611–6629, https://doi.org/10.1002/2017JC012962, 2017. a
Dow, C. F., Ross, N., Jeofry, H., Siu, K., and Siegert, M. J.: Antarctic Basal Environment Shaped by High-Pressure Flow through a Subglacial River System, Nat. Geosci., 15, 892–898, https://doi.org/10.1038/s41561-022-01059-1, 2022. a, b
E3SM Project, DOE: Energy Exascale Earth System Model v3.0.0, DOECode [software], https://doi.org/10.11578/E3SM/dc.20240301.3, 2024. a
Fürst, J. J., Durand, G., Gillet-Chaulet, F., Tavard, L., Rankl, M., Braun, M., and Gagliardini, O.: The Safety Band of Antarctic Ice Shelves, Nat. Clim. Change, 6, 479–482, https://doi.org/10.1038/nclimate2912, 2016. a
Gagliardini, O., Durand, G., Zwinger, T., Hindmarsh, R. C. A., and Le Meur, E.: Coupling of Ice-Shelf Melting and Buttressing Is a Key Process in Ice-Sheets Dynamics, Geophys. Res. Lett., 37, 1–5, https://doi.org/10.1029/2010GL043334, 2010. a
Gladish, C. V., Holland, D. M., Rosing-Asvid, A., Behrens, J. W., and Boje, J.: Oceanic Boundary Conditions for Jakobshavn Glacier. Part I: Variability and Renewal of Ilulissat Icefjord Waters, 2001–14, J. Phys. Oceanogr., 45, 3–32, https://doi.org/10.1175/JPO-D-14-0044.1, 2015. a
Goldberg, D. N., Twelves, A. G., Holland, P. R., and Wearing, M. G.: The Non-Local Impacts of Antarctic Subglacial Runoff, J. Geophys. Res.-Oceans, 128, e2023JC019823, https://doi.org/10.1029/2023JC019823, 2023. a
Gwyther, D. E., Kusahara, K., Asay-Davis, X. S., Dinniman, M. S., and Galton-Fenzi, B. K.: Vertical Processes and Resolution Impact Ice Shelf Basal Melting: A Multi-Model Study, Ocean Model., 147, 101569, https://doi.org/10.1016/j.ocemod.2020.101569, 2020. a
Gwyther, D. E., Dow, C. F., Jendersie, S., Gourmelen, N., and Galton-Fenzi, B. K.: Subglacial Freshwater Drainage Increases Simulated Basal Melt of the Totten Ice Shelf, Geophys. Res. Lett., 50, e2023GL103765, https://doi.org/10.1029/2023GL103765, 2023. a
Hager, A. O., Hoffman, M. J., Price, S. F., and Schroeder, D. M.: Persistent, extensive channelized drainage modeled beneath Thwaites Glacier, West Antarctica, The Cryosphere, 16, 3575–3599, https://doi.org/10.5194/tc-16-3575-2022, 2022a. a
Hager, A. O., Sutherland, D. A., Amundson, J. M., Jackson, R. H., Kienholz, C., Motyka, R. J., and Nash, J. D.: Subglacial Discharge Reflux and Buoyancy Forcing Drive Seasonality in a Silled Glacial Fjord, J. Geophys. Res.-Oceans, 127, e2021JC018355, https://doi.org/10.1029/2021JC018355, 2022b. a, b
Holland, P. R., Jenkins, A., and Holland, D. M.: The Response of Ice Shelf Basal Melting to Variations in Ocean Temperature, J. Climate, 21, 2558–2572, https://doi.org/10.1175/2007JCLI1909.1, 2008. a
Jackson, R. H., Lentz, S. J., and Straneo, F.: The Dynamics of Shelf Forcing in Greenlandic Fjords, J. Phys. Oceanogr., 48, 2799–2827, https://doi.org/10.1175/JPO-D-18-0057.1, 2018. a
Jackson, R. H., Motyka, R. J., Amundson, J. M., Abib, N., Sutherland, D. A., Nash, J. D., and Kienholz, C.: The Relationship Between Submarine Melt and Subglacial Discharge From Observations at a Tidewater Glacier, J. Geophys. Res.-Oceans, 127, e2021JC018204, https://doi.org/10.1029/2021JC018204, 2022. a
Jenkins, A.: A One-Dimensional Model of Ice Shelf-Ocean Interaction, J. Geophys. Res.-Oceans, 96, 20671–20677, https://doi.org/10.1029/91JC01842, 1991. a
Jenkins, A.: Convection-Driven Melting near the Grounding Lines of Ice Shelves and Tidewater Glaciers, J. Phys. Oceanogr., 41, 2279–2294, https://doi.org/10.1175/JPO-D-11-03.1, 2011. a, b, c, d, e, f, g
Jenkins, A., Nicholls, K. W., and Corr, H. F. J.: Observation and Parameterization of Ablation at the Base of Ronne Ice Shelf, Antarctica, J. Phys. Oceanogr., 40, 2298–2312, https://doi.org/10.1175/2010JPO4317.1, 2010. a
Jenkins, A., Shoosmith, D., Dutrieux, P., Jacobs, S., Kim, T. W., Lee, S. H., Ha, H. K., and Stammerjohn, S.: West Antarctic Ice Sheet Retreat in the Amundsen Sea Driven by Decadal Oceanic Variability, Nat. Geosci., 11, 733–738, https://doi.org/10.1038/s41561-018-0207-4, 2018. a
Joughin, I., Shapero, D., and Dutrieux, P.: Responses of the Pine Island and Thwaites glaciers to melt and sliding parameterizations, The Cryosphere, 18, 2583–2601, https://doi.org/10.5194/tc-18-2583-2024, 2024. a
Kimura, S., Holland, P. R., Jenkins, A., and Piggott, M.: The Effect of Meltwater Plumes on the Melting of a Vertical Glacier Face, J. Phys. Oceanogr., 44, 3099–3117, https://doi.org/10.1175/JPO-D-13-0219.1, 2014. a, b, c, d
Lazeroms, W. M. J., Jenkins, A., Gudmundsson, G. H., and van de Wal, R. S. W.: Modelling present-day basal melt rates for Antarctic ice shelves using a parametrization of buoyant meltwater plumes, The Cryosphere, 12, 49–70, https://doi.org/10.5194/tc-12-49-2018, 2018. a
Losch, M.: Modeling Ice Shelf Cavities in a z Coordinate Ocean General Circulation Model, J. Geophys. Res.-Oceans, 113, 1–15, https://doi.org/10.1029/2007JC004368, 2008. a
Motyka, R. J., Hunter, L., Echelmeyer, K. A., and Connor, C.: Submarine Melting at the Terminus of a Temperate Tidewater Glacier, LeConte Glacier, Alaska, USA, Ann. Glaciol., 36, 57–65, 2003. a
Nakayama, Y., Cai, C., and Seroussi, H.: Impact of Subglacial Freshwater Discharge on Pine Island Ice Shelf, Geophys. Res. Lett., 48, e2021GL093923, https://doi.org/10.1029/2021GL093923, 2021. a
Pelle, T., Greenbaum, J. S., Dow, C. F., Jenkins, A., and Morlighem, M.: Subglacial Discharge Accelerates Future Retreat of Denman and Scott Glaciers, East Antarctica, Sci. Adv., 9, eadi9014, https://doi.org/10.1126/sciadv.adi9014, 2023. a, b, c, d
Reese, R., Gudmundsson, G. H., Levermann, A., and Winkelmann, R.: The Far Reach of Ice-Shelf Thinning in Antarctica, Nat. Clim. Change, 8, 53, https://doi.org/10.1038/s41558-017-0020-x, 2018. a
Ringler, T., Petersen, M., Higdon, R. L., Jacobsen, D., Jones, P. W., and Maltrud, M.: A Multi-Resolution Approach to Global Ocean Modeling, Ocean Model., 69, 211–232, https://doi.org/10.1016/j.ocemod.2013.04.010, 2013. a
Sciascia, R., Straneo, F., Cenedese, C., and Heimbach, P.: Seasonal Variability of Submarine Melt Rate and Circulation in an East Greenland Fjord, J. Geophys. Res.-Oceans, 118, 2492–2506, https://doi.org/10.1002/jgrc.20142, 2013. a, b
Slater, D. A., Nienow, P. W., Cowton, T. R., Goldberg, D. N., and Sole, A. J.: Effect of Near-Terminus Subglacial Hydrology on Tidewater Glacier Submarine Melt Rates, Geophys. Res. Lett., 42, 2861–2868, https://doi.org/10.1002/2014GL062494, 2015. a, b, c, d, e
Slater, D. A., Straneo, F., Das, S. B., Richards, C. G., Wagner, T. J. W., and Nienow, P. W.: Localized Plumes Drive Front-Wide Ocean Melting of A Greenlandic Tidewater Glacier, Geophys. Res. Lett., 45, 12350–12358, https://doi.org/10.1029/2018GL080763, 2018. a
Slater, D. A., Felikson, D., Straneo, F., Goelzer, H., Little, C. M., Morlighem, M., Fettweis, X., and Nowicki, S.: Twenty-first century ocean forcing of the Greenland ice sheet for modelling of sea level contribution, The Cryosphere, 14, 985–1008, https://doi.org/10.5194/tc-14-985-2020, 2020. a
Washam, P., Nicholls, K. W., Münchow, A., and Padman, L.: Summer Surface Melt Thins Petermann Gletscher Ice Shelf by Enhancing Channelized Basal Melt, J. Glaciol., 65, 662–674, https://doi.org/10.1017/jog.2019.43, 2019. a
Wekerle, C., McPherson, R., von Appen, W.-J., Wang, Q., Timmermann, R., Scholz, P., Danilov, S., Shu, Q., and Kanzow, T.: Atlantic Water Warming Increases Melt below Northeast Greenland's Last Floating Ice Tongue, Nat. Commun., 15, 1336, https://doi.org/10.1038/s41467-024-45650-z, 2024. a, b
Wiskandt, J., Koszalka, I. M., and Nilsson, J.: Basal melt rates and ocean circulation under the Ryder Glacier ice tongue and their response to climate warming: a high-resolution modelling study, The Cryosphere, 17, 2755–2777, https://doi.org/10.5194/tc-17-2755-2023, 2023. a, b, c
Xu, Y., Rignot, E., Menemenlis, D., and Koppes, M.: Numerical Experiments on Subaqueous Melting of Greenland Tidewater Glaciers in Response to Ocean Warming and Enhanced Subglacial Discharge, Ann. Glaciol., 53, 229–234, https://doi.org/10.3189/2012AoG60A139, 2012. a, b, c
Xu, Y., Rignot, E., Fenty, I., Menemenlis, D., and Flexas, M. M.: Subaqueous Melting of Store Glacier, West Greenland from Three-Dimensional, High-Resolution Numerical Modeling and Ocean Observations, Geophys. Res. Lett., 40, 4648–4653, https://doi.org/10.1002/grl.50825, 2013. a, b, c, d, e, f, g, h
Zhang, T., Price, S. F., Hoffman, M. J., Perego, M., and Asay-Davis, X.: Diagnosing the sensitivity of grounding-line flux to changes in sub-ice-shelf melting, The Cryosphere, 14, 3407–3424, https://doi.org/10.5194/tc-14-3407-2020, 2020. a