the Creative Commons Attribution 4.0 License.
the Creative Commons Attribution 4.0 License.
 | 20 Oct 2025
Quantifying the impacts of atmospheric rivers on the surface energy budget of the Arctic based on reanalysis
John J. Cassano
Mark W. Seefeldt
Hailong Wang
Weiming Ma
Wen-wen Tung
We present a comprehensive analysis of Arctic surface energy budget (SEB) components during atmospheric river (AR) events identified by integrated water vapor transport exceeding the monthly 85th-percentile climatological threshold in 3-hourly ERA5 reanalysis data from January 1980 to December 2019. Analysis of average anomalies in SEB components, net SEB, and the overall AR contribution to both the seasonal SEB components and net SEB climatology reveals clear seasonality and distinct land–sea–sea ice contrast patterns. Over the sea-ice-covered central Arctic Ocean, ARs significantly impact net SEB, inducing substantial surface warming in fall, winter, and spring. This warming is primarily driven by large anomalies in surface downward longwave radiation (LWD), which average 29–45 W m−2 during the cold seasons. In contrast, AR-related LWD anomalies are smaller in summer, averaging around 15 W m−2, indicating a reduced impact during this season. Over sub-polar oceans, ARs have the most substantial positive impact on net SEB in cold seasons, mainly attributed to significant positive turbulent heat flux anomalies. AR-related turbulent heat anomalies reduce the upward turbulent flux, contributing up to −11 % relative to its seasonal climatology. In summer, ARs induce negative impacts on net SEB, primarily due to reduced shortwave radiation from increased cloud cover during AR events. Over continents, ARs generate smaller absolute impacts on net SEB because the large LWD anomalies are largely offset by corresponding increases in upward longwave radiation, particularly during cold seasons. Additionally, the seemingly large relative contributions of ARs to the net SEB over land primarily reflects the small magnitude of the climatological net SEB over continents. Greenland, especially western Greenland, exhibits significant downward longwave radiation anomalies associated with ARs, which drive large net SEB anomalies and contribute >54 % to mean SEB and induce amplified surface warming year-round. This holds significance for melt events, particularly during summer. Additionally, results of AR-related SEB impacts strongly depend on detection methods, as restrictive AR detection algorithms that emphasize extreme AR events, with large AR-related anomalies, do not necessarily indicate a large overall contribution to the SEB climatology due to the low occurrence frequency of these events. This study quantifies the role of ARs in the surface energy budget, contributing to our understanding of the Arctic warming and sea ice decline in ongoing Arctic amplification.
- Article
(12492 KB) - Full-text XML
-
Supplement
(21986 KB) - BibTeX
- EndNote


The Arctic is a multifaceted environment, distinguished by close interactions among its atmosphere, ocean, sea ice, and land components. It is influenced by various forcing components from lower latitudes, operating across a wide range of timescales and space scales (Serreze et al., 2007). The Arctic has experienced disproportionate and accelerated warming compared to the global average temperature increase over the past decades (Cohen et al., 2014; Graversen et al., 2008; Polyakov et al., 2002; Screen and Simmonds, 2010; Serreze et al., 2009; Serreze and Barry, 2011; Serreze and Francis, 2006; Taylor et al., 2022). This phenomenon is widely known as Arctic amplification and is a significant aspect of climate change in the Arctic.
Multiple physical mechanisms likely contribute to Arctic amplification. Locally, these mechanisms include the surface–albedo feedback (Hall, 2004; Screen and Simmonds, 2010; Serreze et al., 2009; Serreze and Barry, 2011; Zhang et al., 2018), Planck and lapse rate feedback (Pithan and Mauritsen, 2014; Zhang et al., 2018, 2021b), and cloud–convection feedback and cloud-radiative forcing (Abbot et al., 2009; Alexeev et al., 2005; Lee et al., 2017; Mortin et al., 2016; Shupe and Intrieri, 2004), along with radiative effects associated with greenhouse gasses (Graversen and Wang, 2009; Shindell and Faluvegi, 2009). Moreover, additional studies emphasize a remote forcing perspective with the investigation of strong poleward moisture and heat flux transports (Graversen et al., 2008; Mortin et al., 2016; Park et al., 2015b), particularly through atmospheric rivers in recent years (Baggett et al., 2016; Hegyi and Taylor, 2018; Mattingly et al., 2018, 2020, 2023; Neff, 2018), to explore Arctic amplification.
Atmospheric rivers (ARs) are long and narrow filaments of enhanced moisture transport typically associated with a low-level jet and extratropical cyclone (Ralph et al., 2018). In mid-latitudes, ARs are commonly identified in the warm conveyor belts of synoptic-scale cyclones, particularly low-level jets (Ralph et al., 2006, 2004). Some literature even considers ARs to be part of cyclones (Bao et al., 2006; Dacre et al., 2015; Neiman et al., 2008). ARs and cyclones exhibit strong statistical and dynamic relationships (Eiras-Barca et al., 2018; Guo et al., 2020; Zhang et al., 2019). In the Arctic, poleward moisture transport is also closely linked to cyclone activity, including intensity, frequency, and duration (Villamil-Otero et al., 2018). Arctic cyclones account for over 70 % of the average annual moisture transport, with their track orientation and upper-level steering flow significantly influencing poleward moisture flux (Fearon et al., 2021).
Given the finding that ARs have been shown to play a pivotal role in modulating polar hydroclimate (Nash et al., 2018), there has been increasing research interest in the influence of ARs on polar weather and climate in recent years. This growing attention is evident in various Arctic studies (Baggett et al., 2016; Guan et al., 2016; Ma et al., 2021; Mattingly et al., 2023, 2020; Zhang et al., 2023a, b) and Antarctic studies (Gorodetskaya et al., 2014; Shields et al., 2022; Wille et al., 2019, 2021, 2024b, a) that highlight the significance of ARs in enhancing moisture, downward infrared radiation, cloud-radiative effects, precipitation patterns, and the surface energy balance. These complex interactions potentially contribute to sustained surface warming in the Arctic region.
Over the Arctic, surface turbulent and radiative fluxes link the land, ocean, and sea ice surface to the atmosphere. In general, during the cold season, net heat fluxes transfer energy away from the surface to the atmosphere, facilitating surface cooling and winter sea ice formation and growth. These processes are mostly reversed during the warm months, due to strong net solar radiation fluxes, facilitating surface warming and sea ice melting (Serreze et al., 2007). Previous studies have found that the enhanced moisture transport associated with ARs leads to anomalously large downward longwave radiation and net longwave radiation, which influences the subsequent surface radiation and energy budgets, resulting in enhanced surface warming and sea ice decline over the Arctic in the boreal winter (Hegyi and Taylor, 2018; Woods and Caballero, 2016; Zhang et al., 2023b). Furthermore, the changes in downward longwave radiation emerge as a crucial factor driving the cold-season Arctic surface warming trend (Zhang et al., 2021b), inspiring us to investigate the specific characteristics of downward longwave radiation closely linked with ARs.
The surface energy budget (SEB) of the Arctic represents the net surface heat flux between incoming solar and thermal radiation and outgoing thermal radiation from the Earth's surface, along with energy exchanges through sensible and latent heat fluxes (Serreze et al., 2007). Short-term perturbations in the SEB, as caused by ARs, may be of climatological significance depending on their magnitude and frequency. These perturbations influence surface warming or cooling, accelerate or decelerate sea ice growth, and can even contribute to sea ice melting and alter sea ice extent. Moreover, the impacts of ARs on the SEB can extend beyond sea ice regions to encompass land ice dynamics. These impacts include various facets including melting rates and warming of the snowpack, affecting snowmelt timing, alterations in ice mass balance, and overall surface energy exchange processes (Goldenson et al., 2018; Guan et al., 2016). Therefore, accurate quantification of these energy fluxes is essential for understanding the dynamics of the Arctic climate and its response to external forcings, such as the influx of moisture-laden ARs.
This study aims to comprehensively quantify the SEB impacts associated with ARs over the Arctic across the entire annual cycle. We seek to unravel the intricate interactions between these atmospheric features and the Arctic SEB by analyzing the spatiotemporal distribution of ARs and associated SEB anomalies. Furthermore, we intend to quantify the total climatological contributions of ARs to the surface radiative and turbulent heat fluxes and the net SEB of the Arctic when considering the AR occurrence frequency over a 40-year period. ARs are not solely responsible for the occurrence of extremely large SEB anomalies, which also involve Arctic air masses and their local transformation (Murto et al., 2023; Papritz et al., 2023). However, gaining a comprehensive understanding of the intricate relationship between ARs and the SEB provides valuable insights into the remote mechanisms driving Arctic warming, sea ice melt, and changes in the regional climate.
The study is organized as follows: data and methods are in Sect. 2. Section 3 discusses the frequency of AR occurrences. AR impacts on Arctic SEB are analyzed and discussed in Sect. 4. Sections 5 and 6 address the surface impacts of ARs and the associated uncertainties and limitations, respectively. Finally, Sect. 7 summarizes the conclusions of the study. This research endeavors to contribute to a deeper understanding of the complex climate dynamics at play in the region through rigorous examination and quantification of the influence of ARs on the surface energy budget in the Arctic.
2.1 AR detection and tracking
An ensemble Arctic AR index database (Tung et al., 2023) was developed by Zhang et al. (2023a), where a total of 12 AR indices were created based on combinatory conditions of either integrated water vapor transport (IVT) or integrated water vapor (IWV) applied with three levels of monthly climate thresholds (75th, 85th, and 95th percentiles). The data utilized for this AR database were sourced from the 3-hourly fifth generation of ECMWF atmospheric reanalysis (ERA5; Hersbach et al., 2020) and 3-hourly NASA Modern-Era Retrospective Analysis for Research and Applications, version 2 (MERRA-2; Gelaro et al., 2017) from 1980 to 2019. The NASA MERRA-2 source data were obtained from the AR Tracking Method Intercomparison Project (Shields et al., 2018). Among the AR indices, the IVT-based 85th-percentile climate threshold index (85th_IVT) is consistent with the most commonly adopted indices in AR research (e.g., Guan and Waliser, 2015, 2019; Ma et al., 2020; Zhang et al., 2023b). Besides, it has been found that between the two reanalyses (ERA5 and MERRA-2), the 0.25° × 0.25° ERA5 IVT field is more precise than the coarser-resolution 0.5° × 0.625° MERRA-2 IVT for AR detection and tracking (Zhang et al., 2023a). Therefore, in this work, we use the 85th_IVT-based AR index in ERA5 to analyze the impacts of ARs on the SEB over the Arctic.
The AR detection and tracking algorithm using the ERA5 85th_IVT-based index is briefly summarized as follows, while more detailed descriptions of the ensemble AR detection algorithm can be found in Zhang et al. (2021a, 2023a). First, for each grid point in the IVT field, we select the 3-hourly datum at 12:00 UTC each day during neutral or weak El Niño–Southern Oscillation (ENSO) events, grouping the data by month and calculating the 85th percentile for each month across the 40-year period. The selection of the neutral or weak ENSO events aims to establish a standard climate threshold for testing ARs without the influence of ENSO. The resultant monthly 85th-percentile values establish a time series of climate thresholds. Next, at each time step, we identify spatial targets as connected grid points with IVT values equal to or greater than their monthly climate thresholds. We then apply the method of principal curves (Hastie and Stuetzle, 1989) to estimate the length of a target formed by aggregating the maximum IVT values at each latitude and longitude within the spatial pattern. The algorithm uses a periodic boundary condition about each latitude. The width of a target is calculated as the total Earth surface area of the identified grid points divided by the length. Any target with length exceeding or equal to 1500 km while the ratio of length to width is greater than or equal to 2 is considered to indicate the potential presence of an AR object. We then examine the time sequence of the potential AR objects to construct events with the Lagrangian tracking framework based on the spatial proximity and morphological similarity between two consecutive 3-hourly time steps (Guan and Waliser, 2019). We determine Arctic AR events as those penetrating the Arctic region (defined as 60° N and northwards) and then persisting in the region for at least 18 h. The AR detection has been facilitated with distributed parallel computing, specifically, the divide-and-recombine approach using the R-based DeltaRho back-ended by a Hadoop system (Cleveland and Hafen, 2014; Tung et al., 2018).
2.2 ERA5 surface fluxes
In addition to the ERA5 85th_IVT-based AR index (Tung et al., 2023; Zhang et al., 2023a), we analyze the surface radiative and turbulent fluxes and near-surface temperature in ERA5. It is noted that ERA5 is the latest reanalysis released by ECMWF in 2019, with high spatial (0.25° longitude by 0.25° latitude) and temporal (hourly) resolutions. It is based on ECMWF Integrated Forecasting System (IFS) CY41r2 by 4D-Var data assimilation and model forecasts with 137 hybrid sigma/model levels to 1 Pa in the vertical (Hersbach et al., 2020). It has been considered a state-of-the-art global reanalysis for the Arctic (Graham et al., 2019b).
We retrieve hourly surface accumulated fluxes from ERA5 for the 40-year period between January 1980 and December 2019: surface thermal radiation downwards (also known as surface downward longwave radiation, LWD), surface net thermal radiation (also known as surface net longwave radiation, LWN), surface net solar radiation (also known as surface net shortwave radiation, SWN), surface latent heat flux (LH), and surface sensible heat flux (SH). All variables have units of J m−2, with the ECMWF sign convention of positive vertical flux values directed downwards towards the surface.
To be consistent with the AR index's 3-hourly instantaneous temporal information and to quantify AR-related SEB over the Arctic, accumulated surface fluxes (J m−2) are converted to hourly mean surface fluxes (W m−2), which are considered instantaneous surface fluxes at the center of each hour (i.e., 00:30, 01:30, …, 23:30 UTC). We then further linearly interpolate these values to the start of each hourly period (i.e., 00:00, 01:00, …, 23:00 UTC) and downsample the time series to 3-hourly intervals from 00:00 to 21:00 UTC to match the temporal resolution of the AR index. Moreover, we define total surface turbulent heat flux (TH) as the sum of SH and LH. The net SEB is expressed as the sum of the net radiation at the surface (i.e., sum of the LWN and SWN) and net total TH (i.e., sum of the SH and LH); that is,
where LWN represents the difference between LWD and surface upward longwave radiation (LWU), while SWN is the difference between surface downward shortwave radiation and upward shortwave radiation.
In a physical context, a positive net SEB signifies a net transfer of energy from the atmosphere to the surface, while a negative net SEB means the opposite direction of the energy transfer. From a climatological perspective, the net SEB is negative during the Arctic cold season, facilitating surface cooling, sea ice formation, and sensible heat loss from the ocean. In contrast, a positive net SEB dominates the Arctic summer, leading to melting, subsequent reductions in Arctic sea ice, and replenishment of the ocean's reservoir of sensible heat (Serreze et al., 2007). In addition, we downsample ERA5 instantaneous hourly 2 m air temperature (T2m) and surface skin temperature (surface temperature) to the same 3-hourly time intervals from January 1980 to December 2019 to examine ARs' warming effects on the surface as done in previous work (e.g., Hegyi and Taylor, 2018; Woods and Caballero, 2016; Zhang et al., 2023b).
2.3 Analysis of AR-related surface energy budgets over the Arctic
Composite analyses are performed in order to investigate the impact of the ARs on the surface energy budget components. For each of the surface flux variables, T2m and surface temperature, calculations are performed at each grid point and for each 3-hourly time step of the day. The 40-year mean climatological values are computed for each day of the year at 3-hourly frequency, and then 3-hourly anomalies for all variables are derived from 1980 to 2019, relative to the corresponding 40-year mean climatology. Given the pronounced seasonality of Arctic ARs outlined by Zhang et al. (2023a), our focus is directed towards the surface energy budgets associated with ARs during the four distinct seasons: spring (March–May), summer (June–August), fall (September–November), and winter (December–February). Specifically, within each of the four seasons, the 40-year mean climatology values for each 3-hourly time step falling within the respective season are obtained at each grid point. Figure 1 illustrates the spatial distribution of AR occurrence frequency in each season. The 40-year mean climatology values of each surface flux variable, T2m, and surface temperature are visualized in panel (a) of Figs. 2–7. Similarly, the mean anomalies when AR events occur for each season at each grid point are determined by averaging the anomaly values across all AR occurrences that align with the given season. The corresponding results are displayed in panel (b) of Figs. 2–7 and depict the deviation of the surface fluxes, T2m, and surface temperature from the 40-year climatological mean during AR events. To assess statistical significance, anomalies are evaluated at the 95 % confidence level using a two-tailed t test. To account for temporal autocorrelation, we adjust the effective sample size by dividing the total number of AR time steps at a grid point by the average number of time steps during individual AR events, allowing the sample size to reflect distinct AR events at each grid point. To avoid overwhelming the main figures, these significance results are displayed in Figs. S5–S13 in the Supplement.
To assess the contributions of ARs to the SEB components, we first calculate the relative contributions of AR-related anomalies, normalized by the mean value of each respective component. The results are presented in panel (c) of Figs. 2–4 and 6–7. This method allows us to estimate the accumulated influence of ARs on the SEB component relative to their overall values. Mathematically, the results shown in panel (c) result from the following calculation at each individual grid point within the study domain for each season:
-
Calculate the total extra energy contributed by each SEB component when ARs are present as , where FAR represents the mean of any term in the SEB equation when an AR is present, FAll denotes the seasonal mean of any term in the SEB equation, and tAR indicates the total number of 3-hourly time steps during which ARs are present.
-
Calculate the total energy for each component as FAll⋅tAll, where tAll signifies the total number of 3-hourly time steps within each season.
-
Determine the ratio of these two terms, which provides an estimate of the magnitude of AR anomaly for each SEB component relative to the average value for each component, as outlined in Eq. (2), noting that the ratio of tAR to tAll is simply the AR frequency shown in Fig. 1.
As discussed earlier, the significant influence of ARs on surface radiative and turbulent fluxes underscores the potential role of ARs in driving net SEB fluctuations. Furthermore, these net SEB fluctuations bear a crucial role in governing the extent and volume of sea ice. These considerations motivated our inquiry into the influence of AR occurrences on net SEB anomalies. To quantify the impact of ARs on changing individual components of the SEB and, in turn, the resulting net SEB, we further employ a normalization approach that compares the accumulated effect of ARs on surface radiative and turbulent fluxes to the overall climatological SEB. To do this, we multiply the mean seasonal AR anomalies for each flux term (panel b of Figs. 2–4, 6–7) by the frequency of AR occurrence (Fig. 1) to account for both the magnitude of the AR anomaly and the occurrence frequency of ARs at any given location. We then normalize this by dividing by the absolute value of the mean SEB (Fig. 3a) to obtain the relative magnitude of the AR impact for each flux term relative to the total SEB. The results are visualized in panel (d) of Figs. 2–4 and 6–7. It is important to note that the use of the absolute value of the net SEB is deliberately chosen to maintain consistency with the sign of AR-related SEB term anomalies displayed in panel (b). A positive sign in panel (d) signifies ARs' positive contribution to net SEB and therefore warming effects. The normalization, which accounts for the absolute net SEB, allows for an assessment and comparison of the contributions of AR occurrence in varying the individual SEB components associated with ARs and their subsequent influence on the net SEB. Mathematically, the results depicted in panel (d) of Figs. 2–4 and 6–7 stem from the following calculation conducted at each individual grid point within the study domain for each season.
-
Calculate the total extra energy contributed by each term in the SEB equation when ARs are present as .
-
Compute the absolute value of total SEB energy as |net SEBAll|⋅tAll, where |net SEBAll| represents the absolute value of seasonal-mean net SEB at a given grid point.
-
The ratio of these two terms indicates the relative contribution of the AR anomaly for each SEB term to the total seasonal SEB, as shown in Eq. (3).
We summarize key features from Figs. 1–8 into Tables 1 and S1–S3 for each SEB component and the net SEB across four sub-regions – the central Arctic (including the Barents and Kara seas), sub-polar oceans, continents, and Greenland (Fig. S1) – for each season. These tables present regional averages for several metrics, including climatology (panels a), composite anomalies (panels b), AR contributions to individual SEB component (panels c), AR contributions to absolute net SEB (panels d), and AR occurrence frequency (as shown in Fig. 1). To derive these results, we calculate the area-averaged means by summing the area-weighted (by cosine of their latitude) values from grid points within each region. Additionally, we calculate the difference between the area-averaged AR contribution to the net SEB and the area-averaged AR frequency, representing an additional AR contribution, which is presented in the last row of the tables.
The spatial distributions of 40-year average AR frequency (Fig. 1) exhibit prominent seasonality and regional characteristics. Table 1 summarizes the area-averaged AR frequency for four sub-regions (Fig. S1) during each season. It is noted that the AR occurrence frequency presented in Fig. 1 resembles the analysis in Zhang et al. (2023a), with the distinction that we emphasize the seasonal frequency as a percentage of total time steps within each season instead of annual percentage. The central Arctic Ocean has the lowest AR frequency in the study domain, ranging from 10.4 % (summer) to 10.8 % (spring). AR frequency in the other sub-regions ranges from 11.1 % to 12.7 %, with the seasonal lowest values (11.1 % to 11.8 %) in summer and frequencies usually above 12 % in the fall, winter, and spring. The seasonal change in AR frequency in sub-polar latitudes parallels changes in storm track intensity, while the lower values in the central Arctic reflect the lower frequency of storms at high latitudes year-round (Valkonen et al., 2021). As seen in Fig. 1, over sub-polar regions, the maximum AR occurrence frequency shifts from the Arctic Atlantic sector stretching from the Barents–Kara seas to central Siberia in fall and winter to the Greenland–Labrador seas and the Arctic Pacific sector (i.e., Bering Sea) extending towards Alaska and western Canada in spring, with the greatest seasonal magnitudes in summer concentrated over the Labrador Sea. Around the Arctic pole, ARs are fewest in winter, gradually increasing from spring to fall, which possibly reflects the seasonal poleward shift of jet streams in summer, but retreating equatorwards in winter, along with colder polar temperature reducing water vapor contents and influencing AR occurrence in winter.
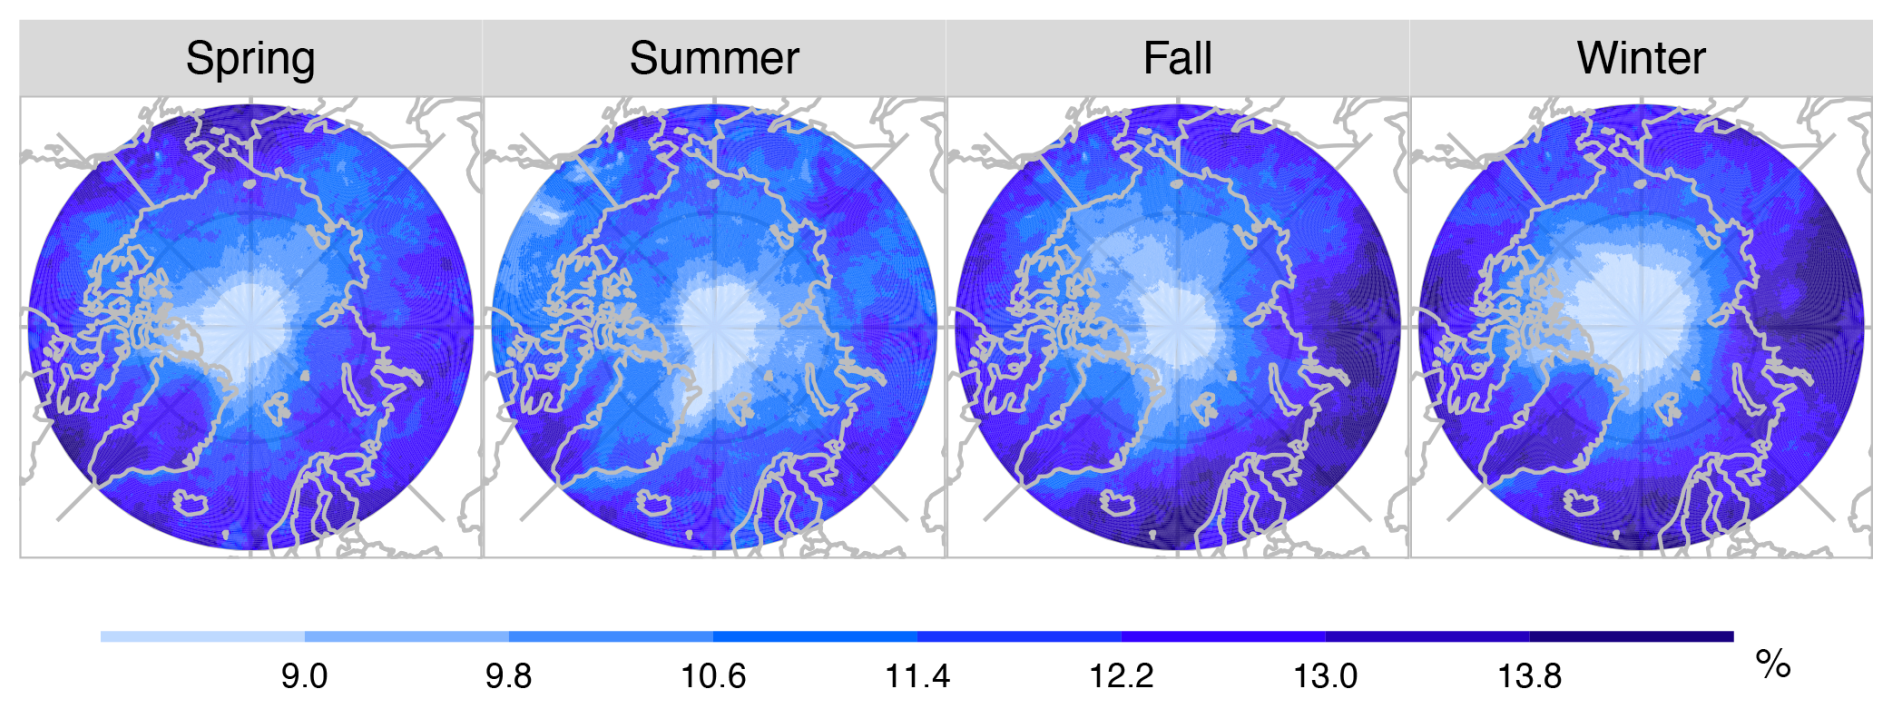
Figure 1Spatial distributions of 40-year average AR occurrence frequency (percentage of AR occurrence time steps, unit: %) in each of the four seasons – spring (March–May), summer (June–August), fall (September–November), and winter (December–February) – from January 1980 to December 2019.
Our initial investigation focuses on assessing the impacts of ARs on the surface radiation components and the corresponding surface responses, including surface downward longwave radiation (LWD, Fig. 2), the net surface energy budget (SEB, Fig. 3), net surface longwave radiation (LWN, Fig. 4), T2m and surface temperature (Fig. 5), net surface shortwave radiation (SWN, Fig. 6), and surface turbulent flux (TH, Fig. 7). As detailed in Sect. 2.3, for each of the analyzed SEB terms, our analysis comprises four aspects: calculating the average climatology during each season (panel a), determining composite anomalies during the presence of ARs (panel b), and establishing the total contributions from each radiation term to the respective climatology (panel c) and to absolute net SEB (panel d) due to the occurrence of ARs. The regional average results for each season can be found in Tables 1 and S1, which also indicate how the relative AR contribution to the net SEB compares to the AR frequency.
4.1 Surface radiative fluxes
4.1.1 Surface downward longwave radiation
The 40-year climatological LWD in the central Arctic (Fig. 2a and Table 1) exhibits strong seasonality, with the highest values in summer (297 W m−2) and the lowest in winter (188 W m−2). There is also a clear meridional gradient, with larger values at lower latitudes, except Greenland, than at higher latitudes. Additional spatial variability comes from land–sea contrasts with larger values over open water in the cool seasons compared to over land or sea ice. On average, LWD over sub-polar oceans is more than 40 W m−2 greater than that over land and sea ice in winter (Table 1). Finally, high-elevation locations, such as the Greenland ice sheet, have less LWD due to the colder and drier atmosphere at the surface over high terrain.
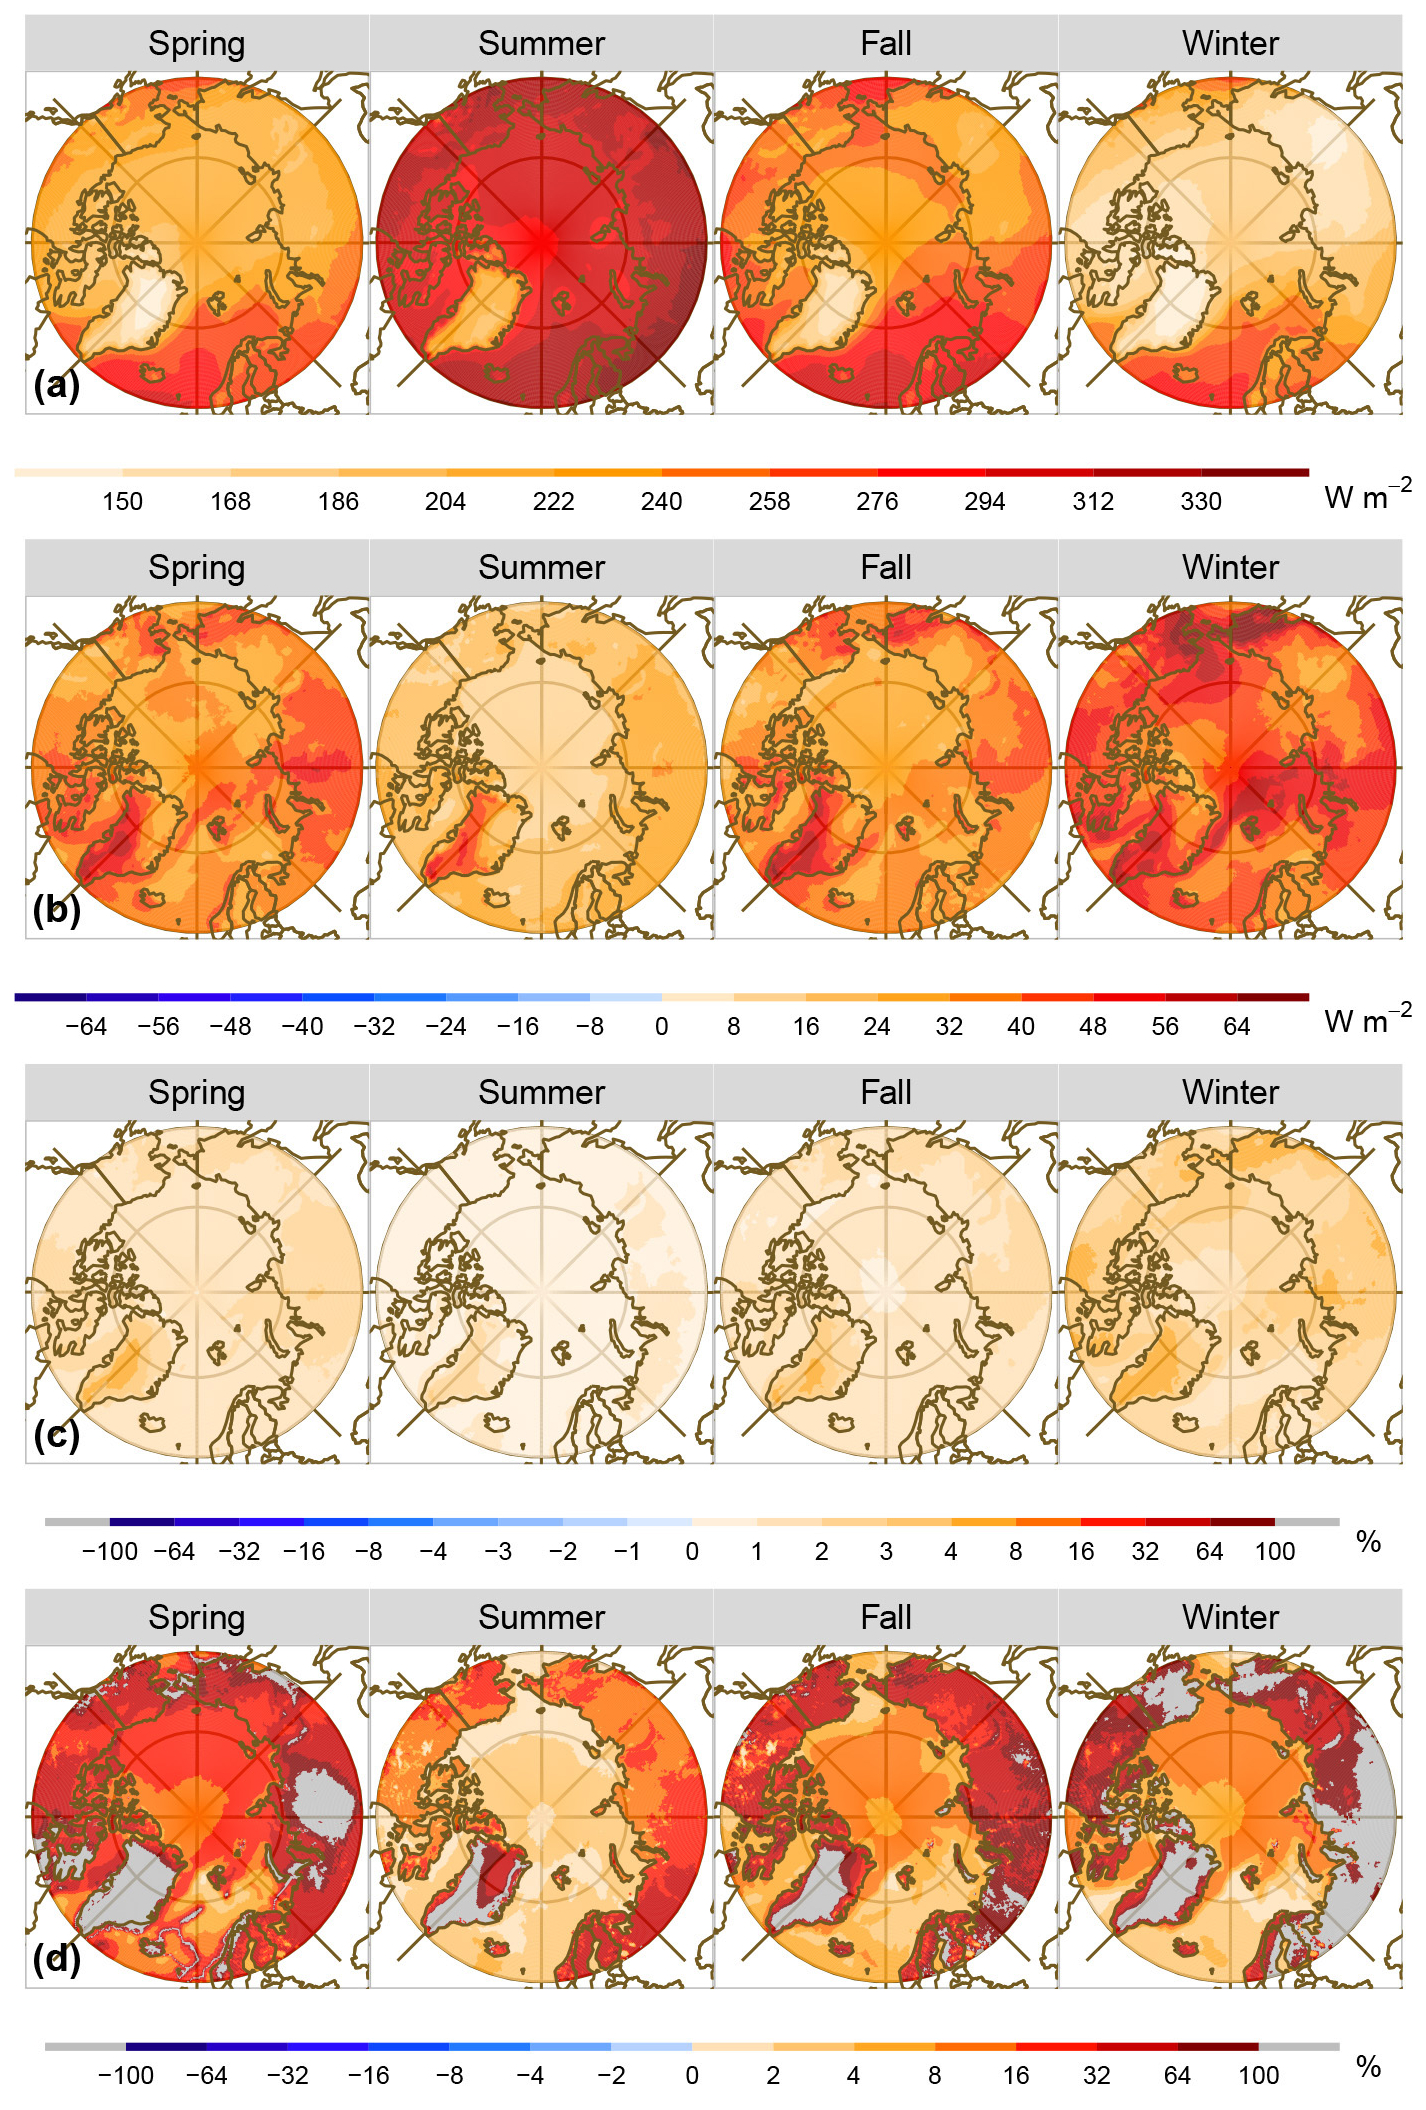
Figure 2Maps showing (a) the spatial distributions of 40-year mean surface downward longwave radiation (LWD, unit: W m−2) across spring (March–May), summer (June–August), fall (September–November), and winter (December–February) from 1980 to 2019. (b) Spatial distributions of 40-year mean LWD anomalies (unit: W m−2) during the presence of AR events within each season. (c) Spatial distributions of the fraction of the 40-year AR contribution (unit: %) of the total LWD anomalies to the mean LWD climatology for each season. (d) Spatial distributions of the fraction of the 40-year AR contribution (unit: %) of the total LWD anomalies to the absolute values of 40-year mean SEB for each season. The percentage results greater than 100 % or less than −100 % are shaded in grey for clarity. Note that all positive values of fluxes are directed downwards at the surface.
Table 1Regional average results of surface downward longwave radiation (LWD, top part) and net surface energy budget (SEB, bottom part) across different seasons: spring, summer, fall, and winter. Results include AR occurrence frequency (AR Freq., unit: %), climatology (Climatology, unit: W m−2), composite anomalies (Anomalies, unit: W m−2), total AR contribution to the respective climatology (Cotrib. to climo, unit: %) and total AR contribution to absolute net SEB (Cotrib. to SEB, unit: %), and relative AR contribution to the net SEB compared to the AR frequency (Extra AR, unit: %).
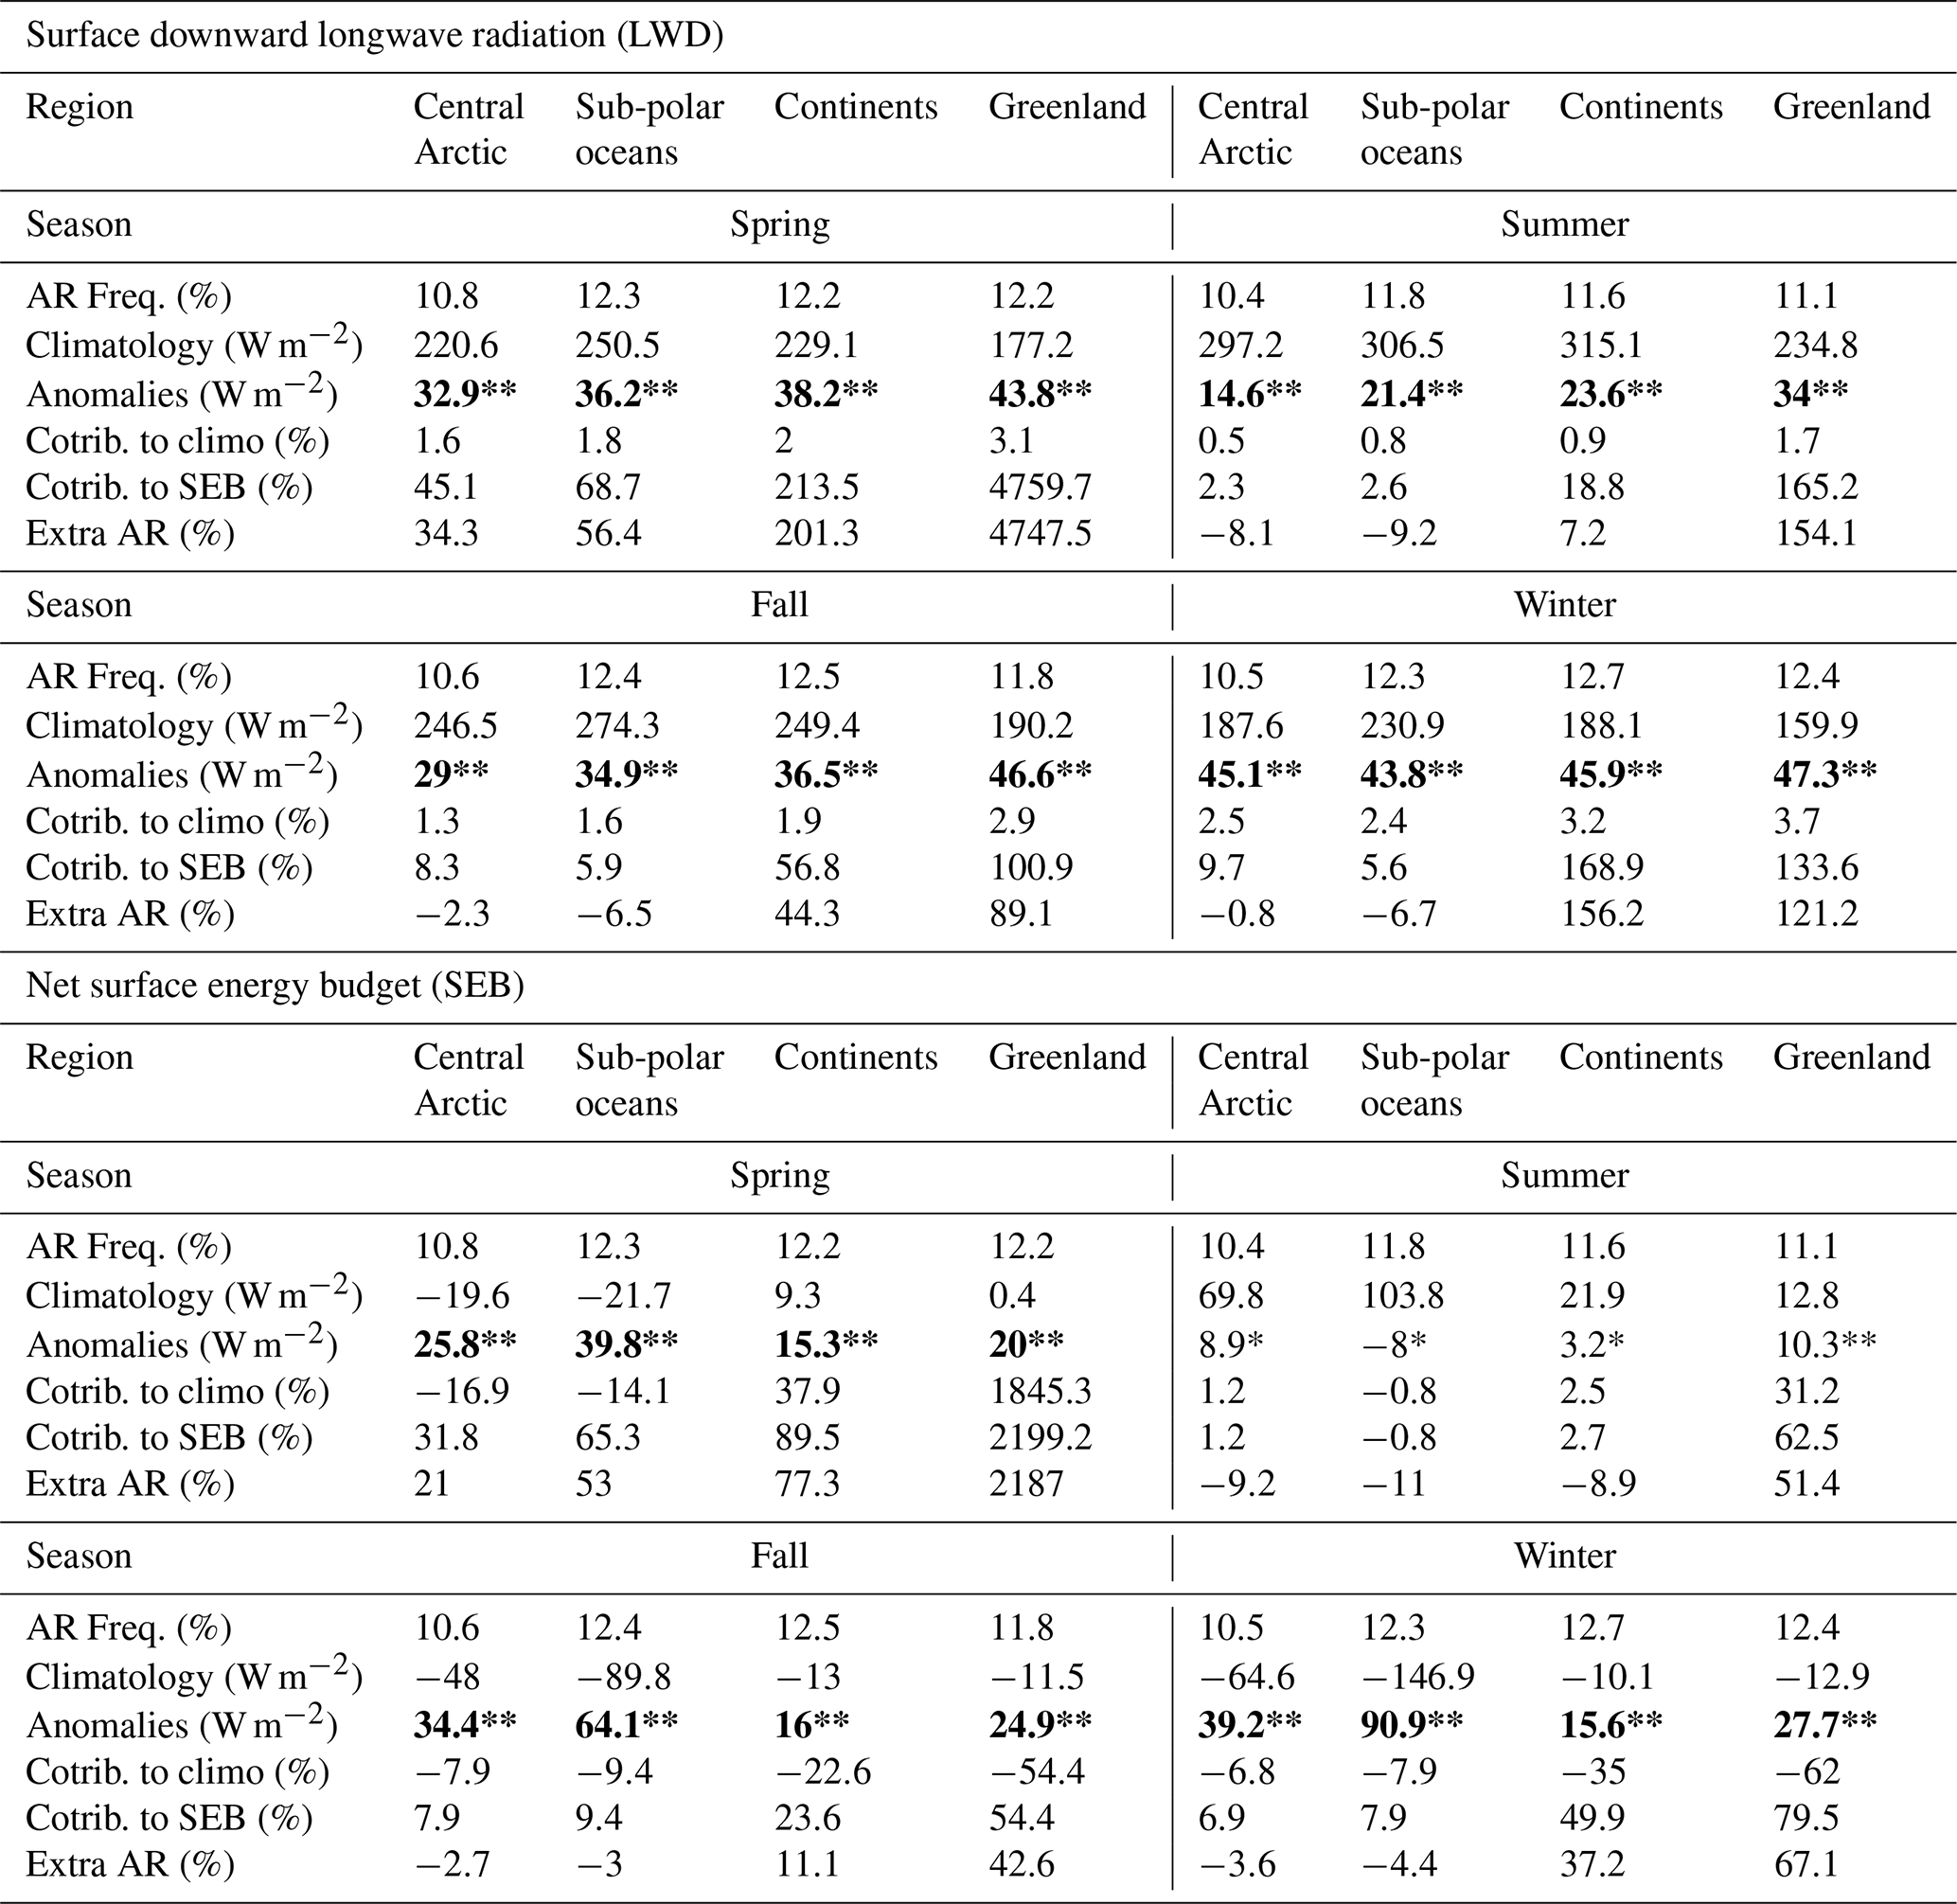
Symbols indicating the percentage of anomalies within each region at a 95 % confidence level determined using a two-tailed t test with adjusted effective sample size reflecting distinct AR events: one asterisk (*), two asterisks (**), and bold values with two asterisks (X**) represent >50 %, >90 %, and >95 % of grid points, respectively, as shown in Figs. S5 and S9.
Across the study domain ARs produce significant positive LWD anomalies, likely attributed to enhanced water vapor content associated with ARs and cloud formation (particularly low-level liquid clouds; Shupe and Intrieri, 2004). All positive LWD anomalies observed across the Arctic are statistically significant at the 95 % confidence level (Fig. S5). Unlike the seasonality in Fig. 2a, AR-related surface LWD anomalies (Fig. 2b) are largest in winter and similar across all sub-regions, with area-averaged anomalies in excess of 40 W m−2 (Table 1). The AR-related surface LWD anomalies are smallest in summer, ranging from 15 W m−2 over the central Arctic to 34 W m−2 over Greenland, with sub-polar ocean and land areas having similar LWD anomalies (21 to 24 W m−2). Spring and fall have AR LWD anomalies that are slightly smaller than those seen in winter, with Greenland having the largest anomalies (44 to 47 W m−2) followed by sub-polar ocean and land areas (35 to 38 W m−2) and the central Arctic (29 to 33 W m−2). Overall, the large LWD anomalies in winter and small anomalies in summer are potentially related to the previous finding that the highest sensitivity of longwave cloud forcing to the liquid water path corresponds to clouds with a low liquid water path and that sensitivity decreases as liquid water path increases (Chen et al., 2006). In winter, Arctic clouds have relatively low amounts of liquid water, so an increase in cloud liquid water associated with Arctic ARs leads to a larger LWD. In addition, the winter AR LWD may be more connected to clear-sky LWD than that in summer, given the dry and cold Arctic conditions. A previous study suggests that clear-sky LWD plays a more prominent role in contributing to surface warming during cold seasons when conducting an Arctic SEB analysis (Zhang et al., 2021b).
ARs consistently induce some of the largest positive LWD anomalies of anywhere in the study domain over western and southern Greenland throughout the year (Fig. 2b). The location of the largest LWD anomalies over portions of the Greenland ice sheet is consistent with previous work that has suggested ARs play an important role in triggering melt events over the ice sheet (Mattingly et al., 2018, 2020, 2023; Neff, 2018; Neff et al., 2014). Moreover, during the cold seasons (fall, winter, and spring), the largest LWD anomalies over continents are observed east of the Ural Mountains, in western Alaska, in eastern Siberia, and in portions of the Canadian Archipelago. These AR-related LWD anomalies are particularly important over continental regions, where they may contribute to the warming and thawing of seasonally snow-covered ground and permafrost, potentially altering surface energy budgets and hydrological processes (Guan et al., 2016; Goldenson et al., 2018). Over sub-polar oceans, the largest LWD anomalies in cold seasons occur in the Greenland–Barents seas and Bering–Chukchi–Beaufort seas, extending between these two maxima particularly in winter and, to a lesser extent, in spring. These large LWD anomalies, particularly near the sea ice edge in the northern Greenland and Barents seas, in the Kara Sea, and in the Chukchi and Beaufort seas, are likely an important driver for ongoing changes in sea ice extent and volume. Specifically, the large LWD anomalies may serve to initiate sea ice melt in spring, delay the onset of ice formation in the fall, and slow ice growth in the winter (Huang et al., 2019a, b; Park et al., 2015a; Zhang et al., 2023b). However, the degree to which these anomalies contribute to sea ice melt or delay ice growth likely depends on local cryosphere conditions, such as snow and ice conditions. Moreover, these impacts of sea ice extent and volume likely contribute to increased water vapor and the emergence of associated LWD anomalies, as observed in Fig. 2b.
The distinct positive AR-induced LWD anomalies (Fig. 2b) prompt us to examine their overall contributions to the LWD climatology, taking AR occurrence frequency into account, as shown in Fig. 2c. Despite large AR LWD anomalies, their corresponding contributions remain modest due to the large baseline LWD climatology (Fig. 2a), with regional averages ranging from 0.5 %–1.7 % in summer to 2.4 %–3.7 % in winter, while transitional seasons – spring and fall – show intermediate values (1.3 %–3.1 %) across the study domain (Table 1). Over Greenland, modest increases in contributions in winter, spring, and fall (2.9 %–3.7 % in Table 1) are observed, due to both a smaller LWD climatology (Fig. 2a and Table 1) and pronounced AR LWD anomalies (Fig. 2b and Table 1). However, the contribution decreases in summer to 1.7 % due to the increased LWD climatology. Other areas with smaller LWD climatology, such as the North American and Eurasian continents, show secondary large contributions (1.9 %–3.2 % in winter, spring, and fall and 0.9 % in summer). Although AR occurrence frequency is high over sub-polar oceans (Fig. 1 and Table 1), AR-related anomalous LWD contributions to the climatology are comparatively limited, ranging from 0.8 % in summer to 1.6 %–2.4 % in winter, spring, and fall due to the higher LWD climatology in these regions. In contrast, the central Arctic, with fewer AR occurrences, exhibits smaller contributions, averaging 0.5 %–2.5 % across seasons. Notably, in winter, large AR LWD anomalies over sub-polar oceans – particularly along sea ice margins extending from northern Greenland to the Barents–Kara and Chukchi seas, as seen in Fig. 2b – amplify anomalous positive LWD contributions, as seen in Fig. 2c.
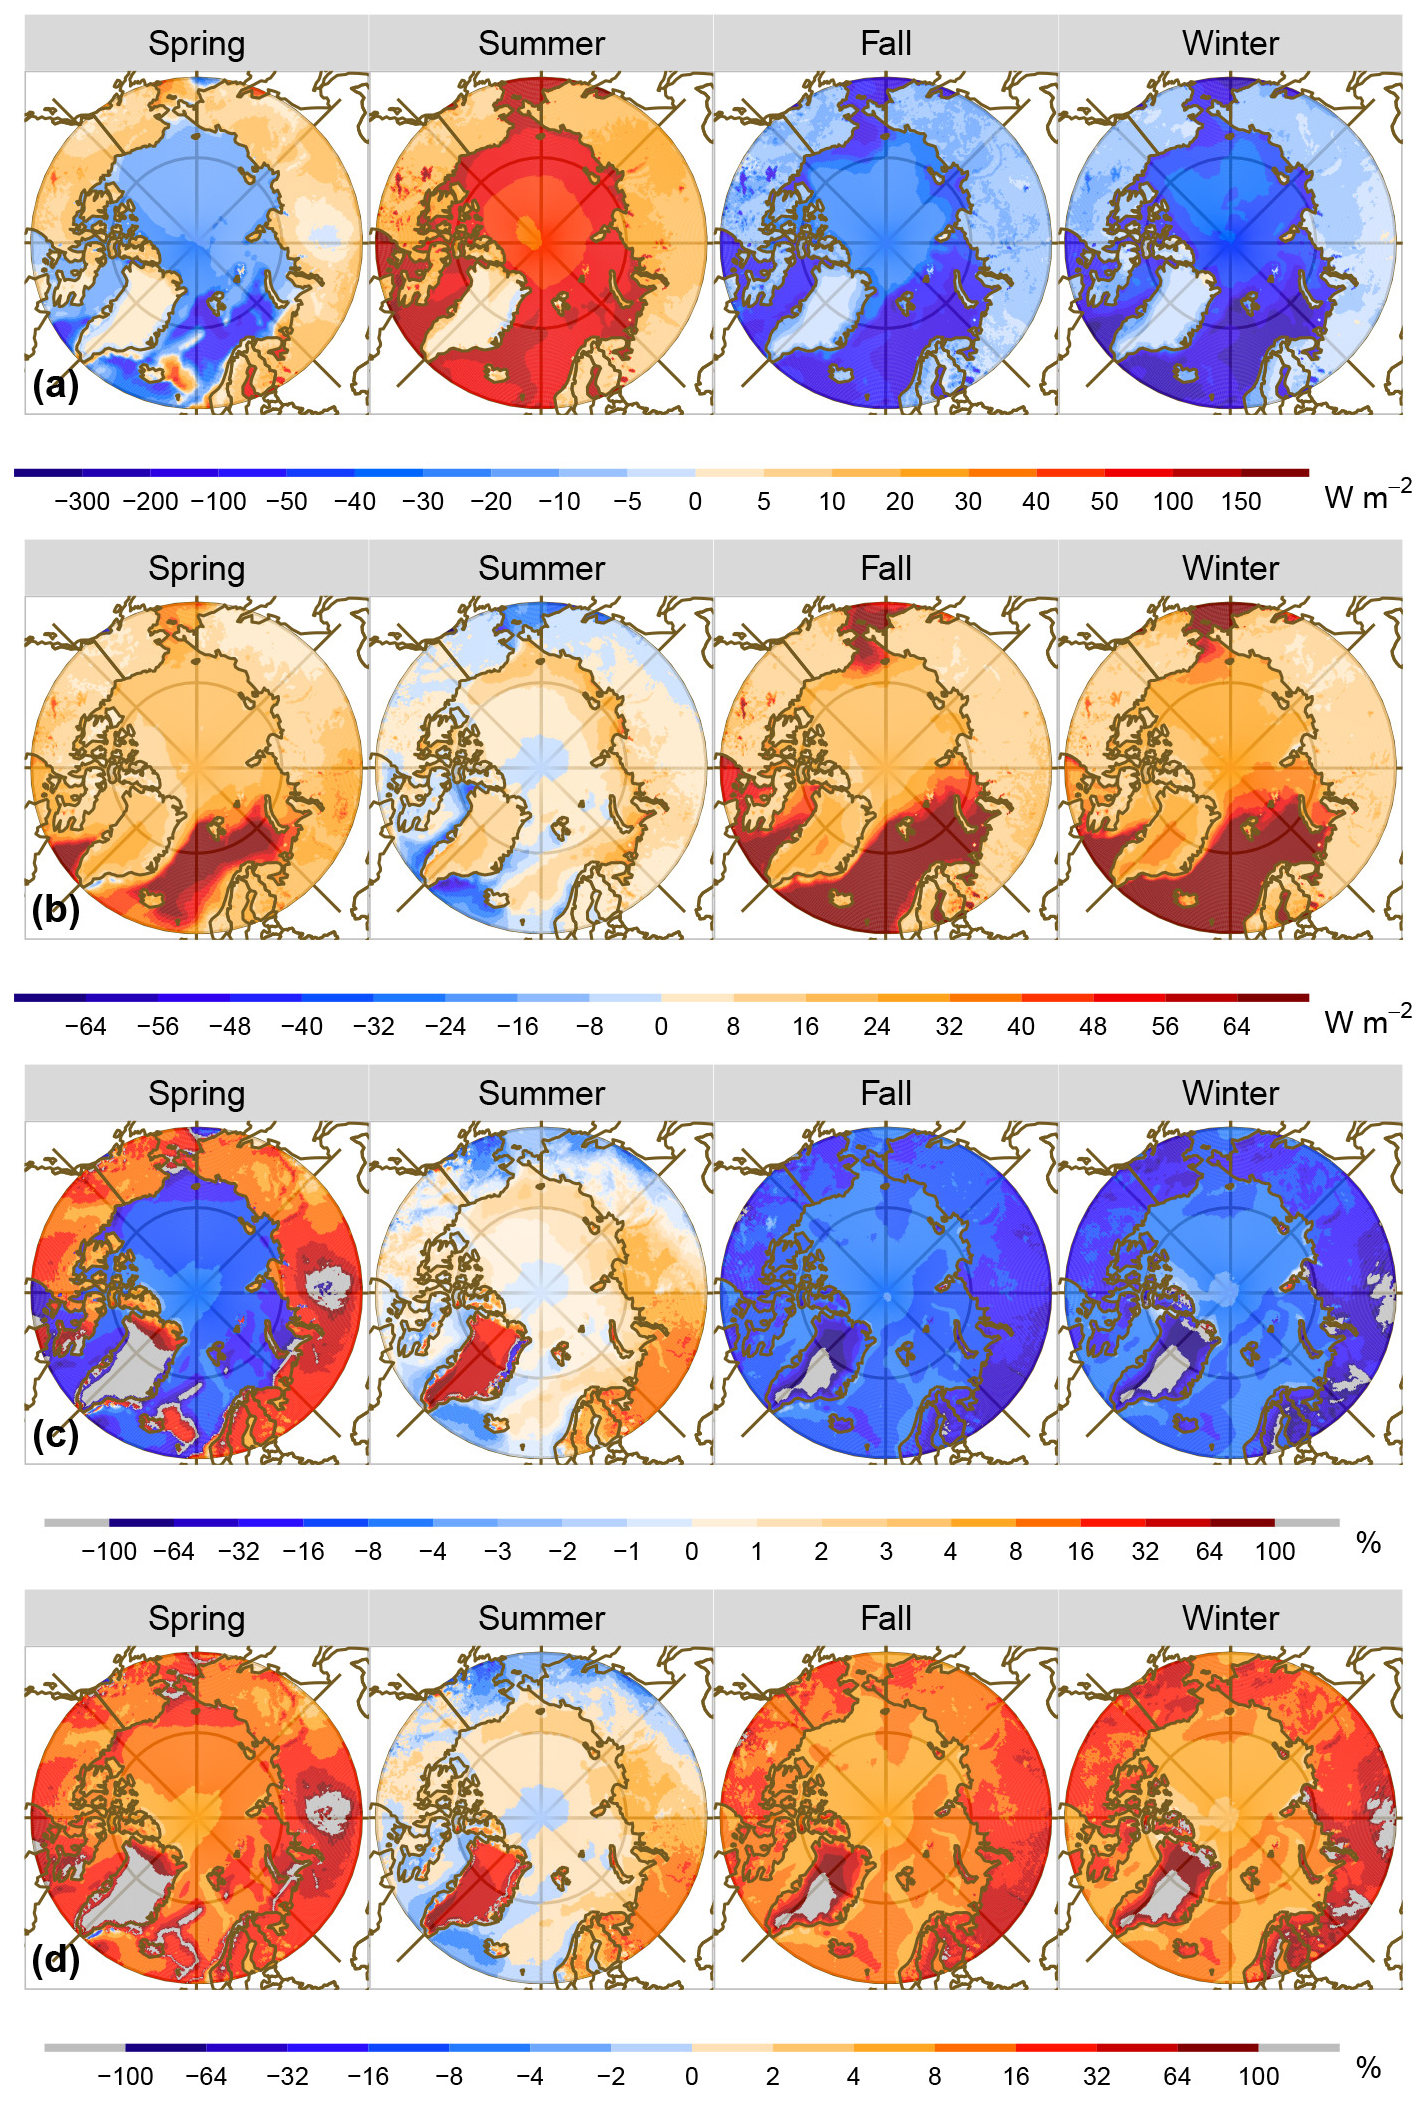
Figure 3Similar to Fig. 2 but for the results according to the net surface energy budgets (SEBs).
The pronounced impact of ARs on surface LWD motivated us to explore their contribution to the mean SEB (Fig. 3a). The contributions of seasonally integrated AR LWD anomalies to the mean SEB are depicted in Fig. 2d. While substantial contributions are seen in Fig. 2d, these values often result from the combination of large AR LWD anomalies (Fig. 2b) and high AR frequency (Fig. 1) and, critically, small mean seasonal SEB values (Fig. 3a). In such cases, the high relative contribution is due to moderate to large absolute LWD anomalies amplified by the small magnitude of the background net SEB values (Fig. 3a). This is particularly evident in regions, such as Greenland and central Eurasia during spring and winter, where AR contributions to the SEB exceed 100 %. These locations are shaded in grey in Fig. 2d to enhance clarity and avoid confusion with less physically meaningful regions.
Despite these caveats, AR-associated LWD anomalies make positive contributions to the net SEB (Fig. 2d) although their relative contribution to the net SEB does not always exceed their frequency of occurrence (Table 1, last row showing extra AR contribution). The AR LWD anomalies make the most substantial contribution to the net SEB over the North American and Eurasian continents and Greenland across all seasons (19 % to > 200 % of the net SEB), with the relative contribution of ARs far exceeding their frequency of occurrence. This suggests that ARs can play an outsized role in the net SEB in these regions relative to how often they occur but with the caveat that the very large AR contribution to the net SEB is due in part to the near-zero SEB over land (Fig. 3a), rather than to anomalously large AR-related LWD anomalies alone. Conversely, there are small relative contributions of AR-related LWD to the net SEB over sub-polar open-water regions in fall and winter (<6 %), which are less than the AR frequency of occurrence, owing to the large net SEB associated with open water at these times of the year (Fig. 3a). The AR-related LWD contribution to net SEB over sub-polar oceans is largest in spring (69 %) due to the reduced net SEB over open water in this season, while summer has the smallest AR-related LWD contribution to the net SEB (3 %) as a result of the smaller AR LWD anomalies and relatively large SEB in this season. Over the central Arctic Ocean, differently from the seasonality observed in the AR-related LWD anomalies shown in Fig. 2b, the ARs' total contribution of LWD anomalies to the net SEB is largest in spring (45 %), far exceeding the AR frequency of occurrence. In contrast, the AR-related LWD contribution to the net SEB is small (<10 %) during the rest of the year and is less than the corresponding AR frequency. Again, this pattern is largely driven by the seasonality of the background net SEB (Fig. 3a; Table 1), which is smallest in spring and thus amplifies the relative impact of ARs during that season, especially combined with the large LWD anomalies (Fig. 2b).
Prior research has demonstrated the crucial role of springtime clouds and their associated cloud-radiative effects in dictating the onset of sea ice melt and the eventual extent of fall sea ice (Huang et al., 2019a). Our findings reinforce these observations, indicating that the presence of ARs and associated augmented clouds, and the accompanying enhanced LWD, likely play an important role in the initiation of sea ice melt in spring via the large AR contribution to the net SEB and modest contributions to the seasonal climatology. Considering the opposite signs of surface energy budgets between the colder seasons (fall, winter, and spring) and summer (Fig. 3a), AR-related LWD expedites the sea ice melt in summer, although Fig. 2c–d suggest that this may be a relatively minimal impact. Conversely, in fall and winter, ARs' positive contributions to both the climatological LWD (Fig. 2c) and net SEB (Fig. 2d) act against the negative net SEB (Fig. 3a), implying the potential for delaying the sea ice recovery.
Over the central Arctic, the analysis of AR-related LWD anomalies presented above (Fig. 2b) highlights the large absolute impact of ARs during the winter, with anomalies in excess of 40 W m−2 and the second-highest anomalies occurring in spring (>30 W m−2 in Table 1). In terms of relative contributions, anomalous positive ARs account for the largest increase in LWD climatology in winter (2.5 %) and contribute most significantly to the average net SEB in spring, accounting for at least 45 % and surpassing the corresponding AR frequency by more than 34 % (Table 1). While ARs and analogous poleward moisture intrusions have traditionally received considerable attention during the winter period, our study highlights a distinctive finding. When normalized by both the LWD climatology and net SEB, the most substantial contributions from AR-related LWD anomalies occur not only in winter but also in spring, when the melt of sea ice is initiated.
4.1.2 Net surface longwave radiation
The climatological net surface longwave radiation (LWN) in the Arctic (Fig. 4a and Table S1) is consistently negative, cooling the surface and exhibiting distinct seasonal variations and a spatial land–sea ice contrast, influenced by surface temperature (Fig. 5a) and LWD (Fig. 2a). In the sub-polar regions, the maximum negative LWN shifts from the land in summer (−53 W m−2 for continents and −51 W m−2 for Greenland) to open water in fall (−51 W m−2) and winter (−56 W m−2), with similar values over sub-polar land and water in spring ( W m−2). The central Arctic Ocean displays a unique seasonality: the least LWN cooling occurs in summer (−23 W m−2), reaching its peak in winter (−44 W m−2), while spring (−40 W m−2) and fall (−34 W m−2) have intermediate values.
The large positive LWD anomalies associated with ARs (Fig. 2b) are partially counteracted by the opposing surface upward longwave radiation (LWU) anomalies, resulting in consistently significant but smaller positive magnitudes of LWN anomalies across the Arctic study domain (Fig. 4b), ranging from 12 to 31 W m−2 (Table S1). Nearly all these anomalies are statistically significant, except for in a small area over Russia in winter and a minor area over central Canada in fall and winter (Fig. S6). The distribution of AR LWN anomalies exhibits a land–sea contrast in each season. In winter, the smaller response of sub-polar oceanic sea surface temperatures (SSTs) to the presence of ARs, compared to land or sea ice regions (Fig. 4b), results in small LWU anomalies and therefore amplified LWN anomalies, with a regional average of 31 W m−2. The next largest LWN anomalies in winter are over the central Arctic Ocean (22 W m−2) and are driven by large LWD anomalies (Fig. 2b) offset by moderate increases in surface temperature (Fig. 5b). In winter, AR LWN anomalies are smallest over Greenland (18 W m−2) and land areas (12 W m−2) due to the large AR-associated increase in surface temperature in these regions (Fig. 5b). In summer, the land–sea contrast of AR LWN anomalies diminishes, decreasing to 21 W m−2 for sub-polar oceans and 14 W m−2 for the central Arctic Ocean but increasing to 17 and 22 W m−2 for continents and Greenland, respectively. Spring and fall have a similar spatial distribution of AR LWN anomalies but smaller magnitudes compared to winter over the sea and summer over the land.
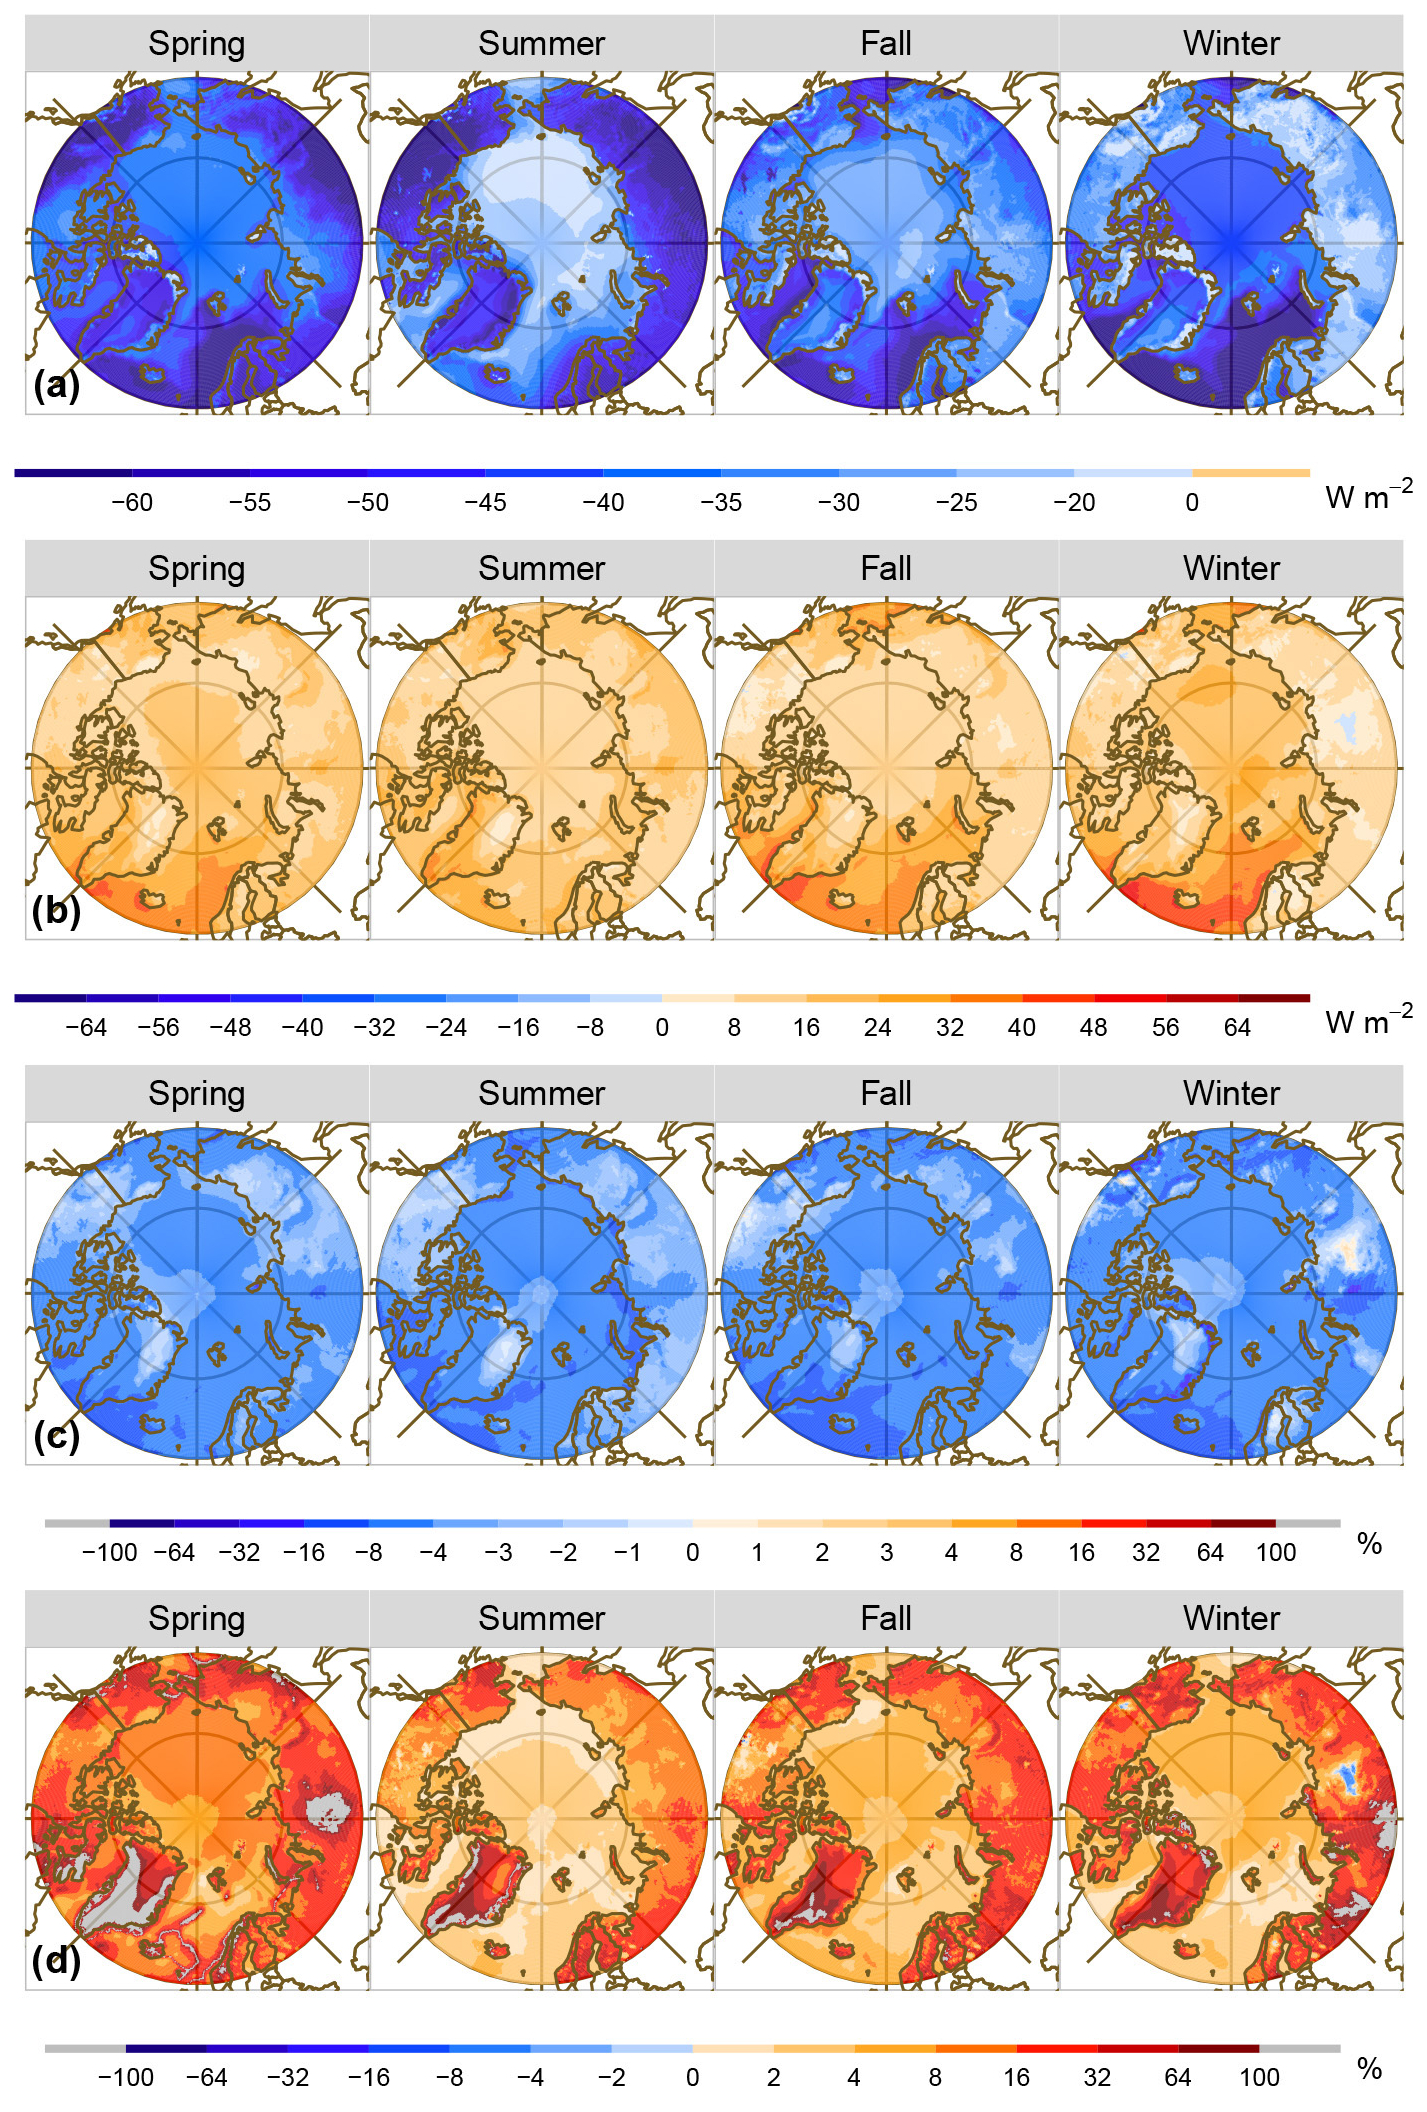
Figure 4Similar to Fig. 2 but for the results according to the net surface longwave radiation (LWN).
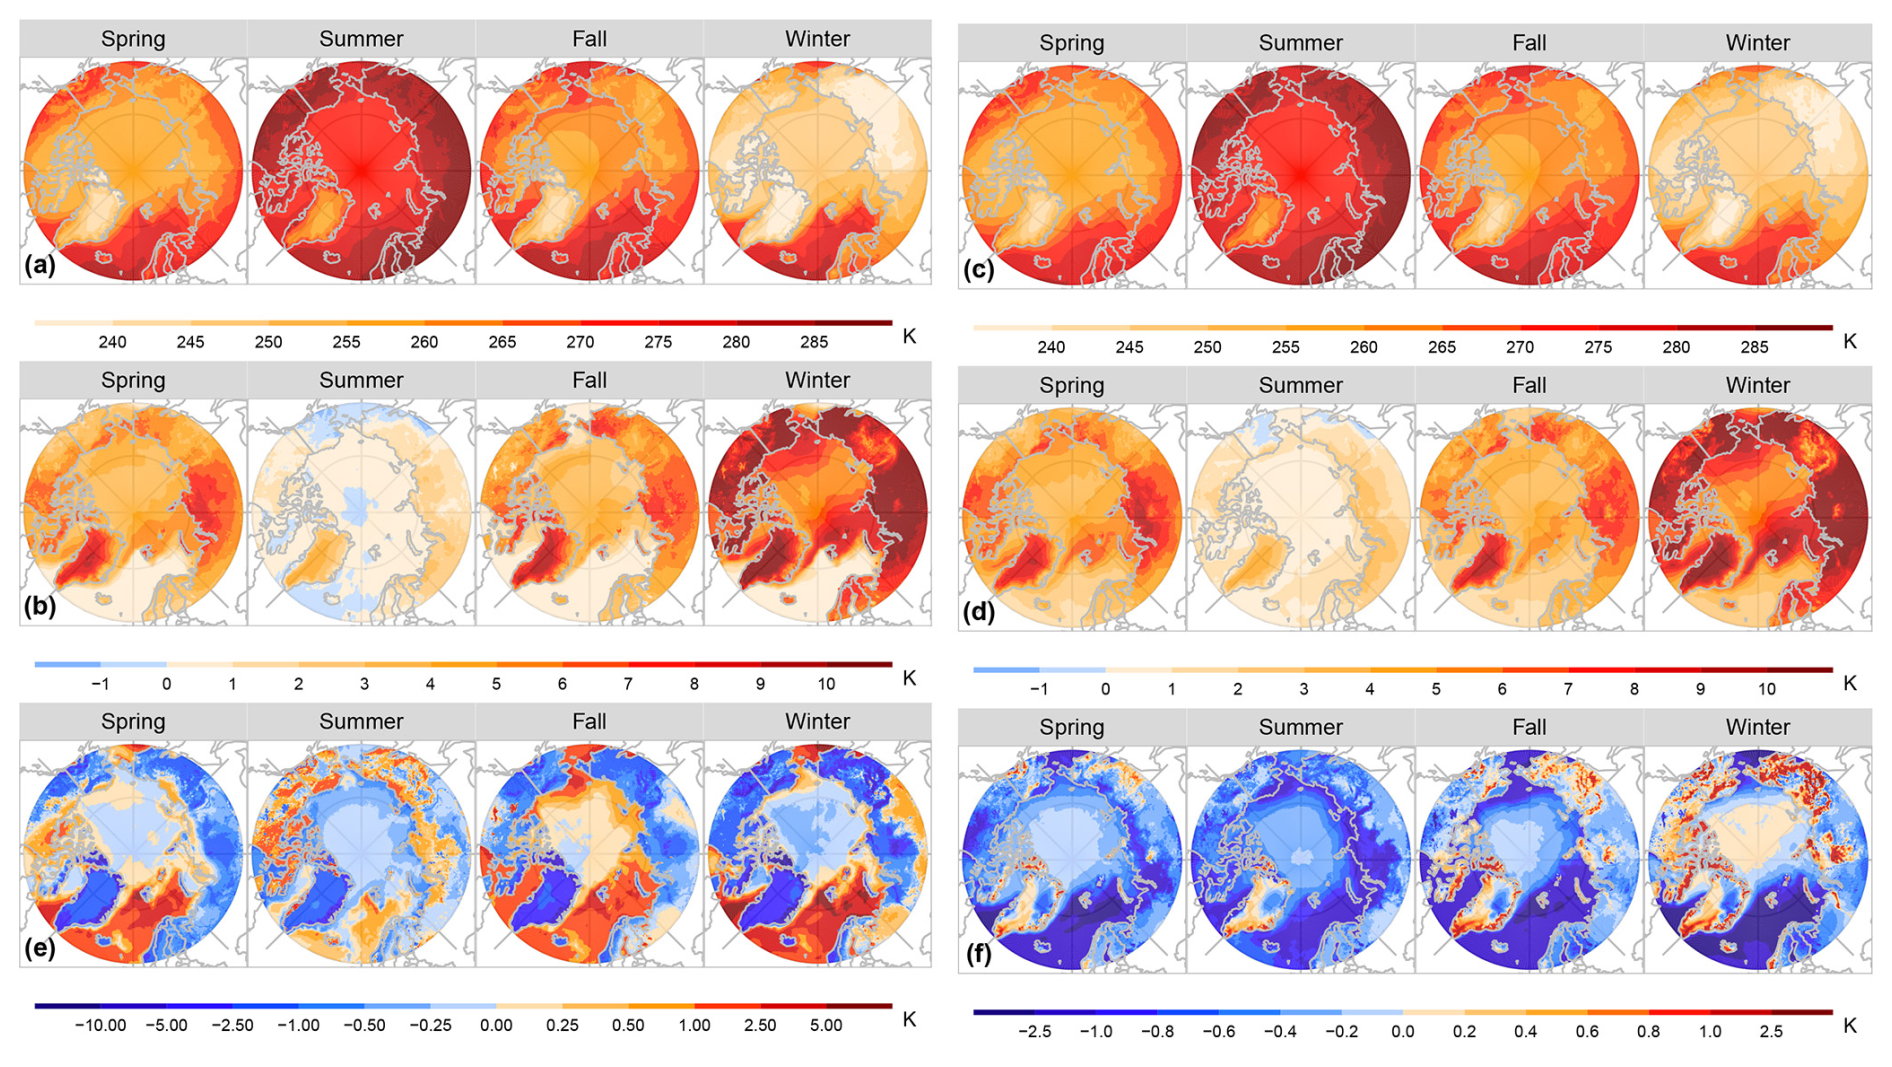
Figure 5(a) Spatial distributions of 40-year mean surface skin temperature (surface temperature, unit: K) during each of the four seasons – spring (March–May), summer (June–August), fall (September–November), and winter (December–February) – from 1980 to 2019. (b) Spatial distributions of 40-year mean surface skin temperature anomalies (unit: K) during the presence of AR events during each season from 1980 to 2019. Panels (c) and (d) are similar to (a) and (b) but for the results of T2m. (e) The differences (unit: K) between the 40-year mean surface temperature in (a) and the 40-year mean T2m in (c), shown as surface temperature−T2m. (f) The differences (unit: K) between the 40-year mean surface temperature anomalies associated with ARs in (b) and the 40-year mean T2m anomalies associated with ARs in (d), shown as anomalies in surface temperature−anomalies in T2m.
As seen in Fig. 4b, over the central Arctic Ocean, the impacts of ARs on LWN are particularly conspicuous within the marginal ice zone, such as the Barents–Kara seas in winter and to a lesser extent in fall and the pack ice area in spring. The local maximum AR-related positive LWN anomalies signify that the presence of Arctic ARs potentially triggers melting and diminishing sea ice coverage within these marginal sea ice regions (Boisvert et al., 2016; Zhang et al., 2023b) and retards the thickening process of the ice layer over pack ice areas (Persson et al., 2017), particularly during winter and spring when the sea ice is maximum. The impacts of ARs on the LWN are weaker in summer. Consistent with AR LWD anomalies observed in Fig. 2b, ARs generate large significant LWN anomalies over sub-polar oceans, particularly the North Atlantic during cold seasons, as well as western and southern Greenland, supporting their crucial role in triggering melt events over the Greenland ice sheet (Mattingly et al., 2018, 2020). While smaller in magnitude, the AR-induced LWN anomalies also appear over Arctic continental regions. In cold seasons, the anomalous LWN from ARs can contribute to earlier snowmelt, reduced snow accumulation, and altered permafrost thermal regimes.
AR-induced positive LWN anomalies make negative contributions to the LWN climatology across most of the study domain (Fig. 4c) due to the overall negative LWN climatology, highlighting how ARs generally offset climatological LWN cooling across all four seasons. Although AR LWN anomalies (Fig. 4b) are smaller than AR LWD anomalies (Fig. 2b), their contributions to total LWN climatology are relatively large due to the smaller values of LWN climatology (Fig. 4a). Still, each season shows a strong land–sea contrast in AR-related contributions to LWN climatology. The highest contribution magnitudes are over sub-polar oceans, averaging −7 % (Table S1). This is driven by amplified AR LWN anomalies (Fig. 4b) and high AR frequency (Fig. 1), both of which outweigh the larger baseline LWN magnitudes (Fig. 4a). Over the North Atlantic sector, the local maximum contributions extend into southern Greenland, while contributions in northern Greenland are smaller due to reduced AR LWN anomalies and lower AR frequency. In the central Arctic Ocean, AR contributions to LWN are highest in summer (−6.3 %) due to the lowest climatological LWN cooling, while contributions are smaller in other seasons (around −5 %) as climatological cooling intensifies. Continental regions show the smallest AR contributions to LWN in spring and summer, attributed to high climatological cooling, while these contributions slightly increase in fall and winter as the LWN climatology magnitudes diminish.
When normalized by the mean net SEB (Fig. 3a), the spatial distribution of total anomalies in LWN associated with ARs, as shown in Fig. 4d, resembles the pattern in Fig. 2d but with reduced magnitudes (Table S1). It is important to remember that the large relative contribution is due, in part, to the small SEB. Still, the most significant AR contributions are observed over regions with small mean SEB (Fig. 3a), such as the Eurasian and North American continents and Greenland, throughout the year (13 % to > 100 % of the net SEB). The large relative contributions often exceed their corresponding AR occurrence frequency, particularly in spring. Although AR LWN anomalies have larger absolute magnitudes over sub-polar oceans (Fig. 4b), their relative contribution to net SEB significantly decreases year-round due to the larger mean SEB (Fig. 3a). The AR-related LWN contribution to net SEB over sub-polar oceans is most pronounced in spring (49 %), primarily due to the reduced net SEB over open water in this season, surpassing the corresponding AR frequency by 37 %. In contrast, summer and winter exhibit the smallest AR-related LWN contribution to the net SEB (3 %) due to smaller AR LWN anomalies in summer and a larger mean net SEB in winter, both falling below the corresponding AR frequency by 9 %. As the mean net SEB decreases in fall, the relative contribution slightly increases to 5 %, still below the corresponding AR frequency. Over the central Arctic Ocean, ARs' total contribution of LWN anomalies to the net SEB is highest in spring (21 %), exceeding the AR occurrence frequency. However, it decreases to 2 %–4 % in other seasons, with this percentage falling below the corresponding AR frequency.
The discussion above highlights the interplay between AR-induced LWD anomalies and the surface temperature response to ARs in determining AR impact on net LW. The small response of sub-polar ocean SST to ARs results in ARs having the largest (or near largest in summer) absolute impact on net LW anomalies in this region throughout the year. Given the high frequency of AR occurrence, their cumulative contributions to the LWN climatology are also highest in this region across all seasons. However, because the net SEB is large over the sub-polar oceans, the AR-induced net LW contribution to the net SEB is relatively small and less than the AR frequency, except in spring. Over continental land areas, AR-induced net LW anomalies are smaller than over sub-polar oceans or the central Arctic, except in summer when the anomalies are larger over land than the central Arctic, due to the large AR-induced warming of surface temperature (Fig. 5b). Consequently, the cumulative contributions of ARs to LWN over continents remain lower across all seasons, except in winter when reduced climatological LWN cooling leads to a slight increase in contributions. Because the net SEB is small over land, the AR net LW contribution to the net SEB is large and consistently exceeds the AR frequency. Similar results, with larger AR-induced anomalies, are seen over Greenland and emphasize that ARs are an important factor in melt events there.
The results over the central Arctic are more complex. AR-induced net LW anomalies are intermediate compared to those over sub-polar oceans and land in fall, winter, and spring, ranging from 16 to 22 W m−2. This is because AR-induced LWD anomalies are large (Fig. 2b) but so is the surface temperature response to ARs (Fig. 5b). Despite the magnitude of these anomalies, the relatively low AR occurrence frequency in this region limits their overall contributions to LWN climatology, which remain at an average of −5 % to −6 % throughout the year. Due to higher seasonal net SEB climatology in fall and winter (Fig. 3a), the AR-induced net LW contribution to the net SEB is limited (∼4 %) and falls below the AR frequency. This indicates that despite the large contribution to LWD, ARs have limited net LW impact on the energy budget because much of the LWD is offset by concurrent surface warming. In contrast, in spring, due to the small net SEB climatology, AR-induced net LW anomalies contribute 21 % to the net SEB, far exceeding AR frequency at this time of year, suggesting that ARs are important leading into the sea ice melt season and may serve to initiate melt. In summer, small AR-induced LWD anomalies and predominantly non-significant surface warming (Table S2 and Fig. S12) result in the smallest seasonal net LW anomalies in the central Arctic (14 W m−2) with a minimal contribution to the net SEB (2 %) that is much smaller than the AR frequency. However, owning to the seasonal low LWN climatology, anomalous ARs contribute a relatively large fraction to LWN climatology during this time (−6.3 %), suggesting that ARs may help counteract radiative cooling in the central Arctic at this time of year.
4.1.3 Net surface shortwave radiation
The net surface shortwave radiation (SWN) received at the Arctic surface (Fig. 6a and Table S1) displays significant seasonal variation, with the highest values occurring during summer (>65 W m−2) and the lowest during winter (<6 W m−2), primarily attributable to the limited daylight hours and low solar angles in winter. A noticeable meridional gradient is observed, with the maximum SWN in sub-polar continental and ocean regions in summer (>150 W m−2), due to a higher solar angle and lower albedo. SWN is less over Greenland (65 W m−2) and in the central Arctic (100 W m−2) in the summer due to the higher surface albedo. During the transition seasons, the Arctic receives a greater overall SWN in spring as compared to the fall.
Across the entire Arctic, ARs exhibit significant negative SWN anomalies (Figs. 6b and S7), particularly in summer and spring, primarily attributed to the enhanced cloud formation, mainly low-level thick clouds, which reflect solar radiation and reduce SEB. The AR-induced decreasing SWN is most pronounced in summer when the solar radiation is at its maximum (Fig. 6a). A meridional gradient is observed, with larger anomaly magnitudes in lower-albedo sub-polar regions and lower magnitudes in areas of the sea-ice-covered Arctic Ocean and the Greenland ice sheet, which have high albedo, resulting in attenuated SWN effects associated with ARs. In summer, the regional average anomaly ranges from −17 W m−2 over Greenland and −22 W m−2 over the central Arctic Ocean to −35 and −52 W m−2 for continents and sub-polar oceans, respectively. AR-related SWN effects are attenuated in the sea-ice-covered Arctic Ocean and the Greenland ice sheet, possibly due to the similarity between the albedo of the sea-ice-covered surface and the clouds associated with ARs, resulting in comparable SWN (Curry and Ebert, 1992; Miller et al., 2015). The spatial variations from land–sea ice contrasts noted in summer are also evident in spring, but to a lesser extent, with anomalies ranging from −6 to −29 W m−2. Due to limited SWN in fall and winter, AR-related SW impacts are significantly reduced, especially over the central Arctic in winter, where anomalies are predominantly not statistically significant (Table S1 and Fig. S7).
Overall, negative AR SWN anomalies contribute to reductions in SWN climatology across most of the Arctic domain throughout each season (Fig. 6c). Although sub-polar oceans and continents show notably large anomalies in summer, and to a less extent in spring, these total integrated anomalous contributions remain modest (−4 % for sub-polar oceans and −3 % for continents) due to the generally high SWN climatology in these regions during these seasons. In contrast, slightly higher contributions are observed in fall and winter, driven by the high frequency of ARs and the lower baseline values of SWN climatology. Overall, the largest negative contributions are noted over sub-polar oceans (−4 % to −5 %), primarily due to substantial AR SWN anomalies in summer and spring, along with high AR frequency throughout much of the year (particularly in fall, winter, and spring). Other regions display more modest contributions (−2 % to −3 %) consistently across the year. Local maxima of relative contributions (ranging from 2 % to 4 %) are also evident over the central Arctic Ocean in spring and summer, highlighting the potential role of ARs in modulating surface energy budgets and delaying the onset and progression of sea ice melt during the melt season.
The SWN from ARs makes negative contributions to the net SEB, primarily during spring, somewhat less in summer, and to a limited degree in fall and winter (Fig. 6d). The most pronounced negative contribution occurs over the continents and Greenland in spring (−67 % and −554 %) and summer (−27 % and −47 %), with the magnitude of these contributions greatly exceeding the AR frequency. Again, these amplified effects stem from the small seasonal net SEB climatology in these regions, when even moderate SWN reductions from ARs can significantly alter the energy balance. In contrast, AR SWN contributions to the net SEB are much smaller in fall (−12 % and −5 %) and winter (−8 % and −1 %), with percentage values lower than their corresponding AR frequency during these seasons. As the net SEB climatology increases, the relative contribution of AR-induced SWN anomalies over the sub-polar and Arctic oceans diminishes in spring and summer, with negligible impact in fall and winter.
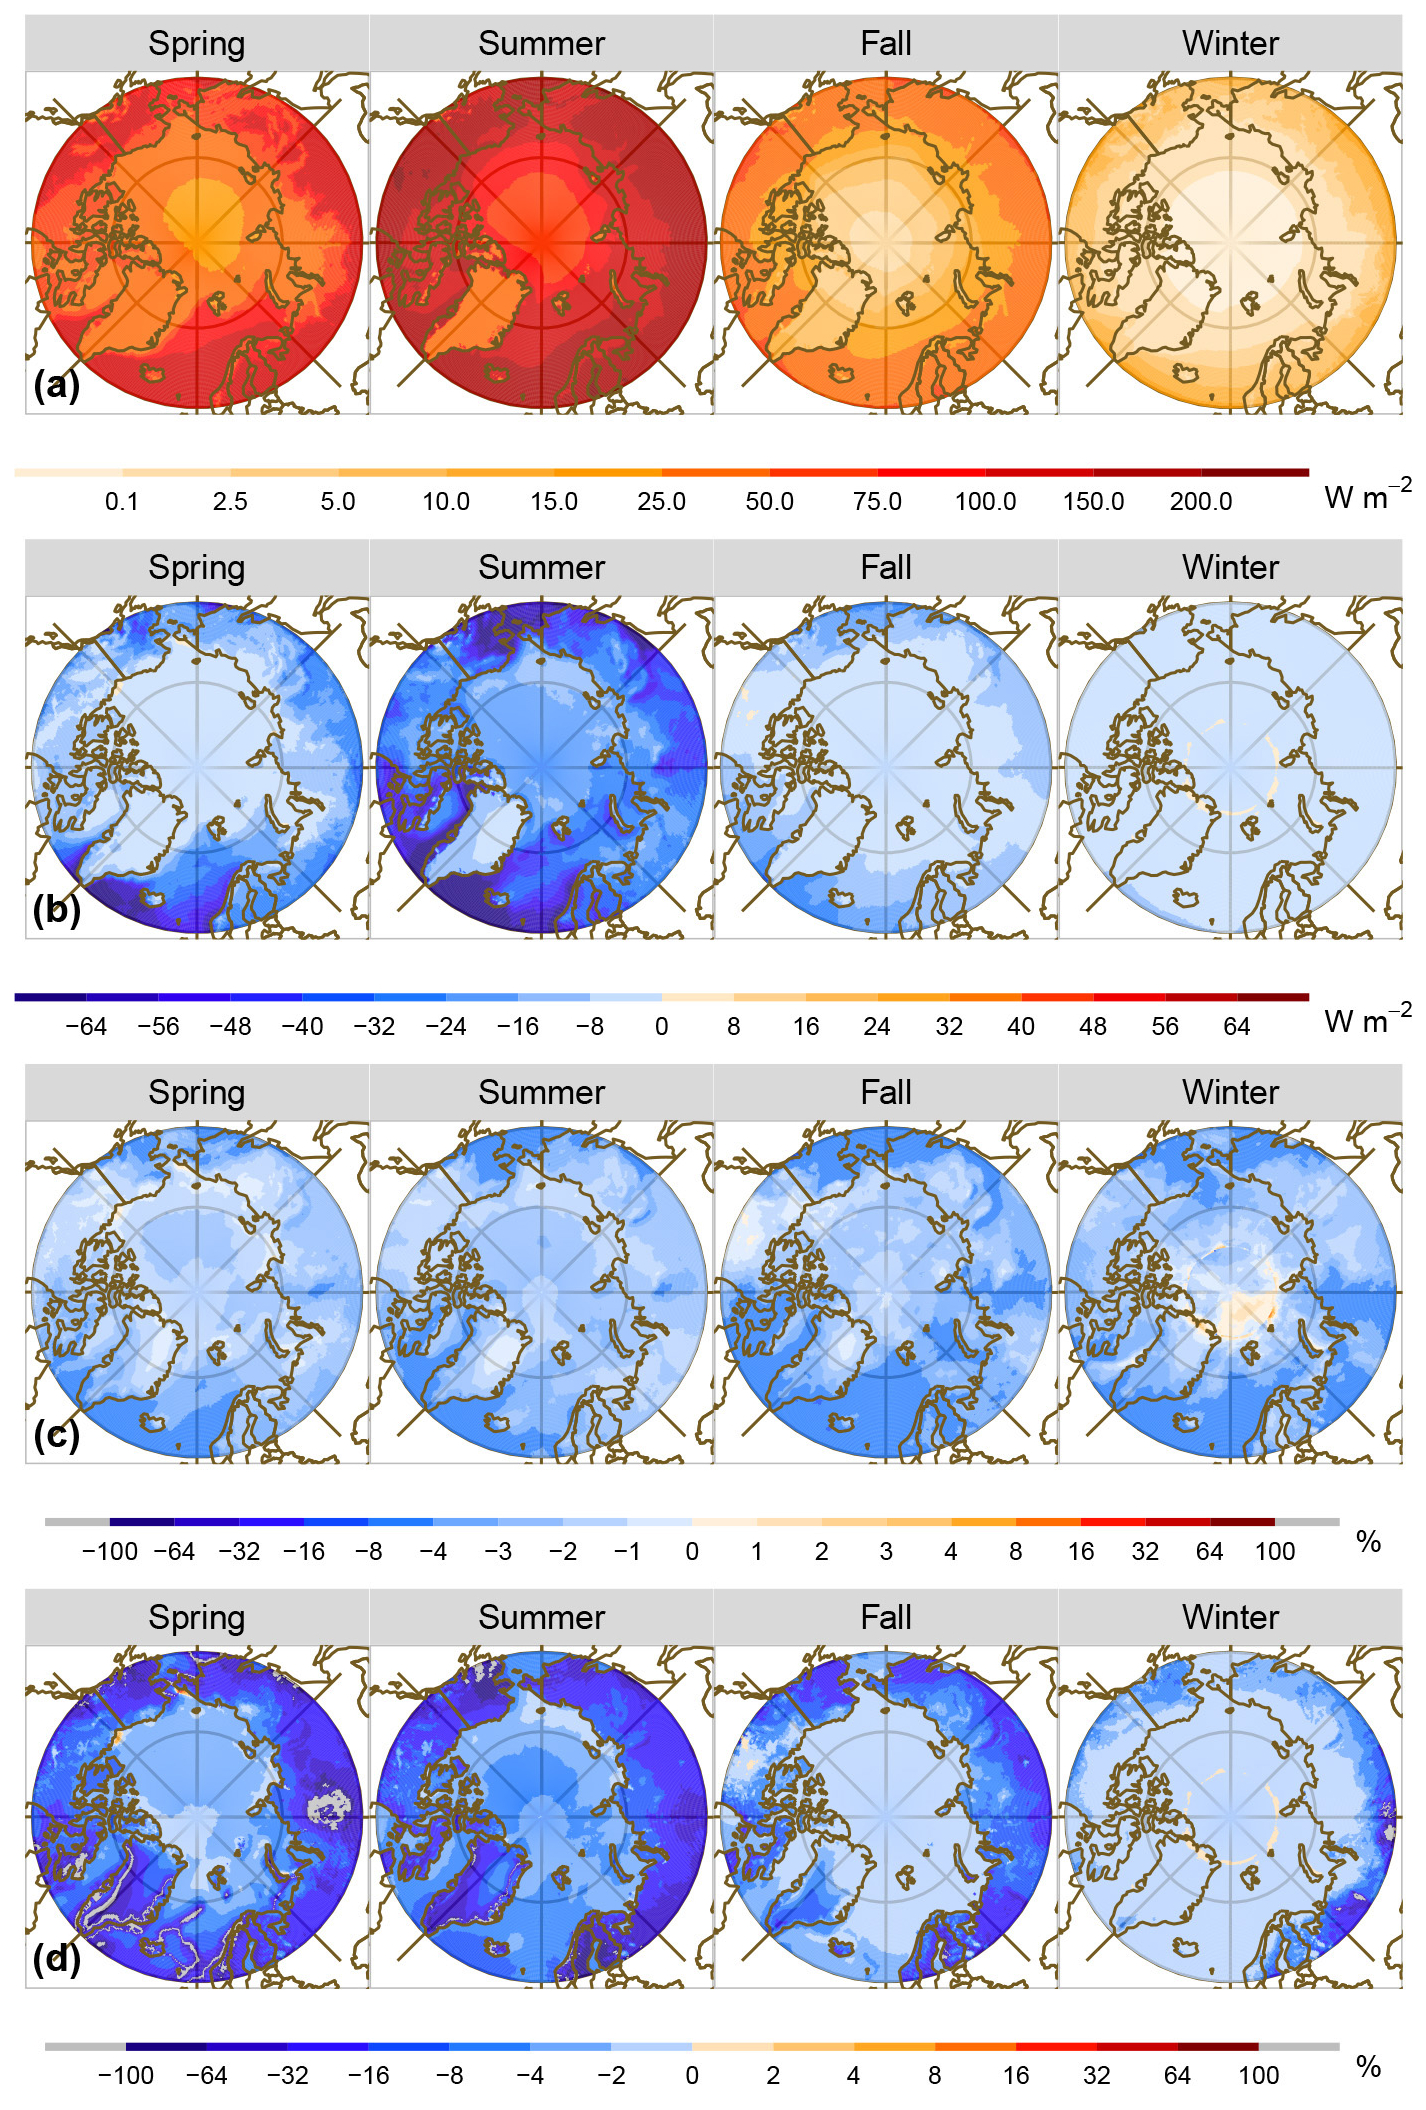
Figure 6Similar to Fig. 2 but for results according to the net shortwave radiation (SWN).
Comparing AR-related LWN and SWN anomalies (Figs. 4 and 6, Table S1) highlights distinct radiative impacts of ARs across surfaces with varying albedos. In summer, AR-related SWN cooling effects are more pronounced over the low-albedo sub-polar oceans (−52 W m−2) and continents (−35 W m−2), compared to the ice-covered high-albedo Greenland ice sheet (−17 W m−2) and central Arctic (−22 W m−2). In contrast, AR-induced LWN anomalies show smaller variations across these regions, ranging from 14 to 22 W m−2. As a result, while AR SWN dominated the net radiative budgets over the sub-polar oceans and continents, the impacts of ARs on SWN and LWN are comparable over Greenland and the central Arctic. During the cold seasons (spring, fall, and winter), ARs play a warming role over Greenland and the central Arctic, with AR LWN exceeding the corresponding AR SWN in both absolute anomalies and relative contribution to their respective climatology and the net SEB. ARs also result in radiative warming over the sub-polar oceans and continents in fall and winter, with a slight cooling effect in spring. Notably, AR-related LW radiative warming and SW radiative cooling effects in spring are crucial to influencing the fall sea ice extent, depending on their magnitudes (Cox et al., 2016).
4.2 Surface turbulent heat fluxes
Turbulent heat (TH) fluxes are a crucial component of the surface energy balance in the Arctic and play a significant role in influencing the regional climate, sea ice changes, and atmospheric circulation patterns (Bourassa et al., 2013). Turbulent sensible heat (SH) and latent heat (LH) fluxes constitute essential components of the energy exchange between the Earth's surface and the overlying atmosphere through turbulent mixing and eddy processes.
The 40-year climatological Arctic TH (Fig. 7a and Table S1) exhibits significant regional seasonality characterized by contrasts between land, sea, and sea ice. In summer, the relatively warm and wet Arctic surface drives upward SH and LH, resulting in upward (negative) TH across most of the Arctic (excluding Greenland). The regional averages range from −81 W m−2 over continents and −16 W m−2 over sub-polar oceans to −7 W m−2 over the central Arctic. In winter, the radiatively cooled surface results in near-surface temperature inversions (Fig. 5e) over much of the land, including the Greenland ice sheet. As a result, the continents and Greenland experience downward TH (11 and 24 W m−2, respectively), from stronger downward SH (Fig. S2a) and weak downward LH (Fig. S3a). In contrast, the relatively warm sub-polar oceans exhibit stronger upward TH, averaging −96 W m−2, with the most intense areas extending to the Barents–Kara seas. The sea-ice-covered portions of the central Arctic Ocean (Fig. 7a), like land areas and Greenland, experience downward TH in winter. This is due to the presence of a near-surface temperature inversion (Fig. 5e), resulting in a downward SH (Fig. S2a) that is offset slightly by a weak upward LH (Fig. S3a) due to limited surface evaporation with lower moisture content. Despite the downward TH over the ice-covered portions of the Arctic Ocean, the area-averaged TH for the central Arctic region, which includes the Barents and Kara seas, is upward (−21 W m−2) due to the large upward fluxes in these seas. The two transition seasons, spring and fall, display patterns more similar to summer but with reduced magnitudes over continents and an increase in the central Arctic and sub-polar oceans. In fall, winter, and spring, the cold and dry Greenland ice sheet consistently experiences downward TH (13 to 24 W m−2), with a small upward heat flux (−1 W m−2) in summer.
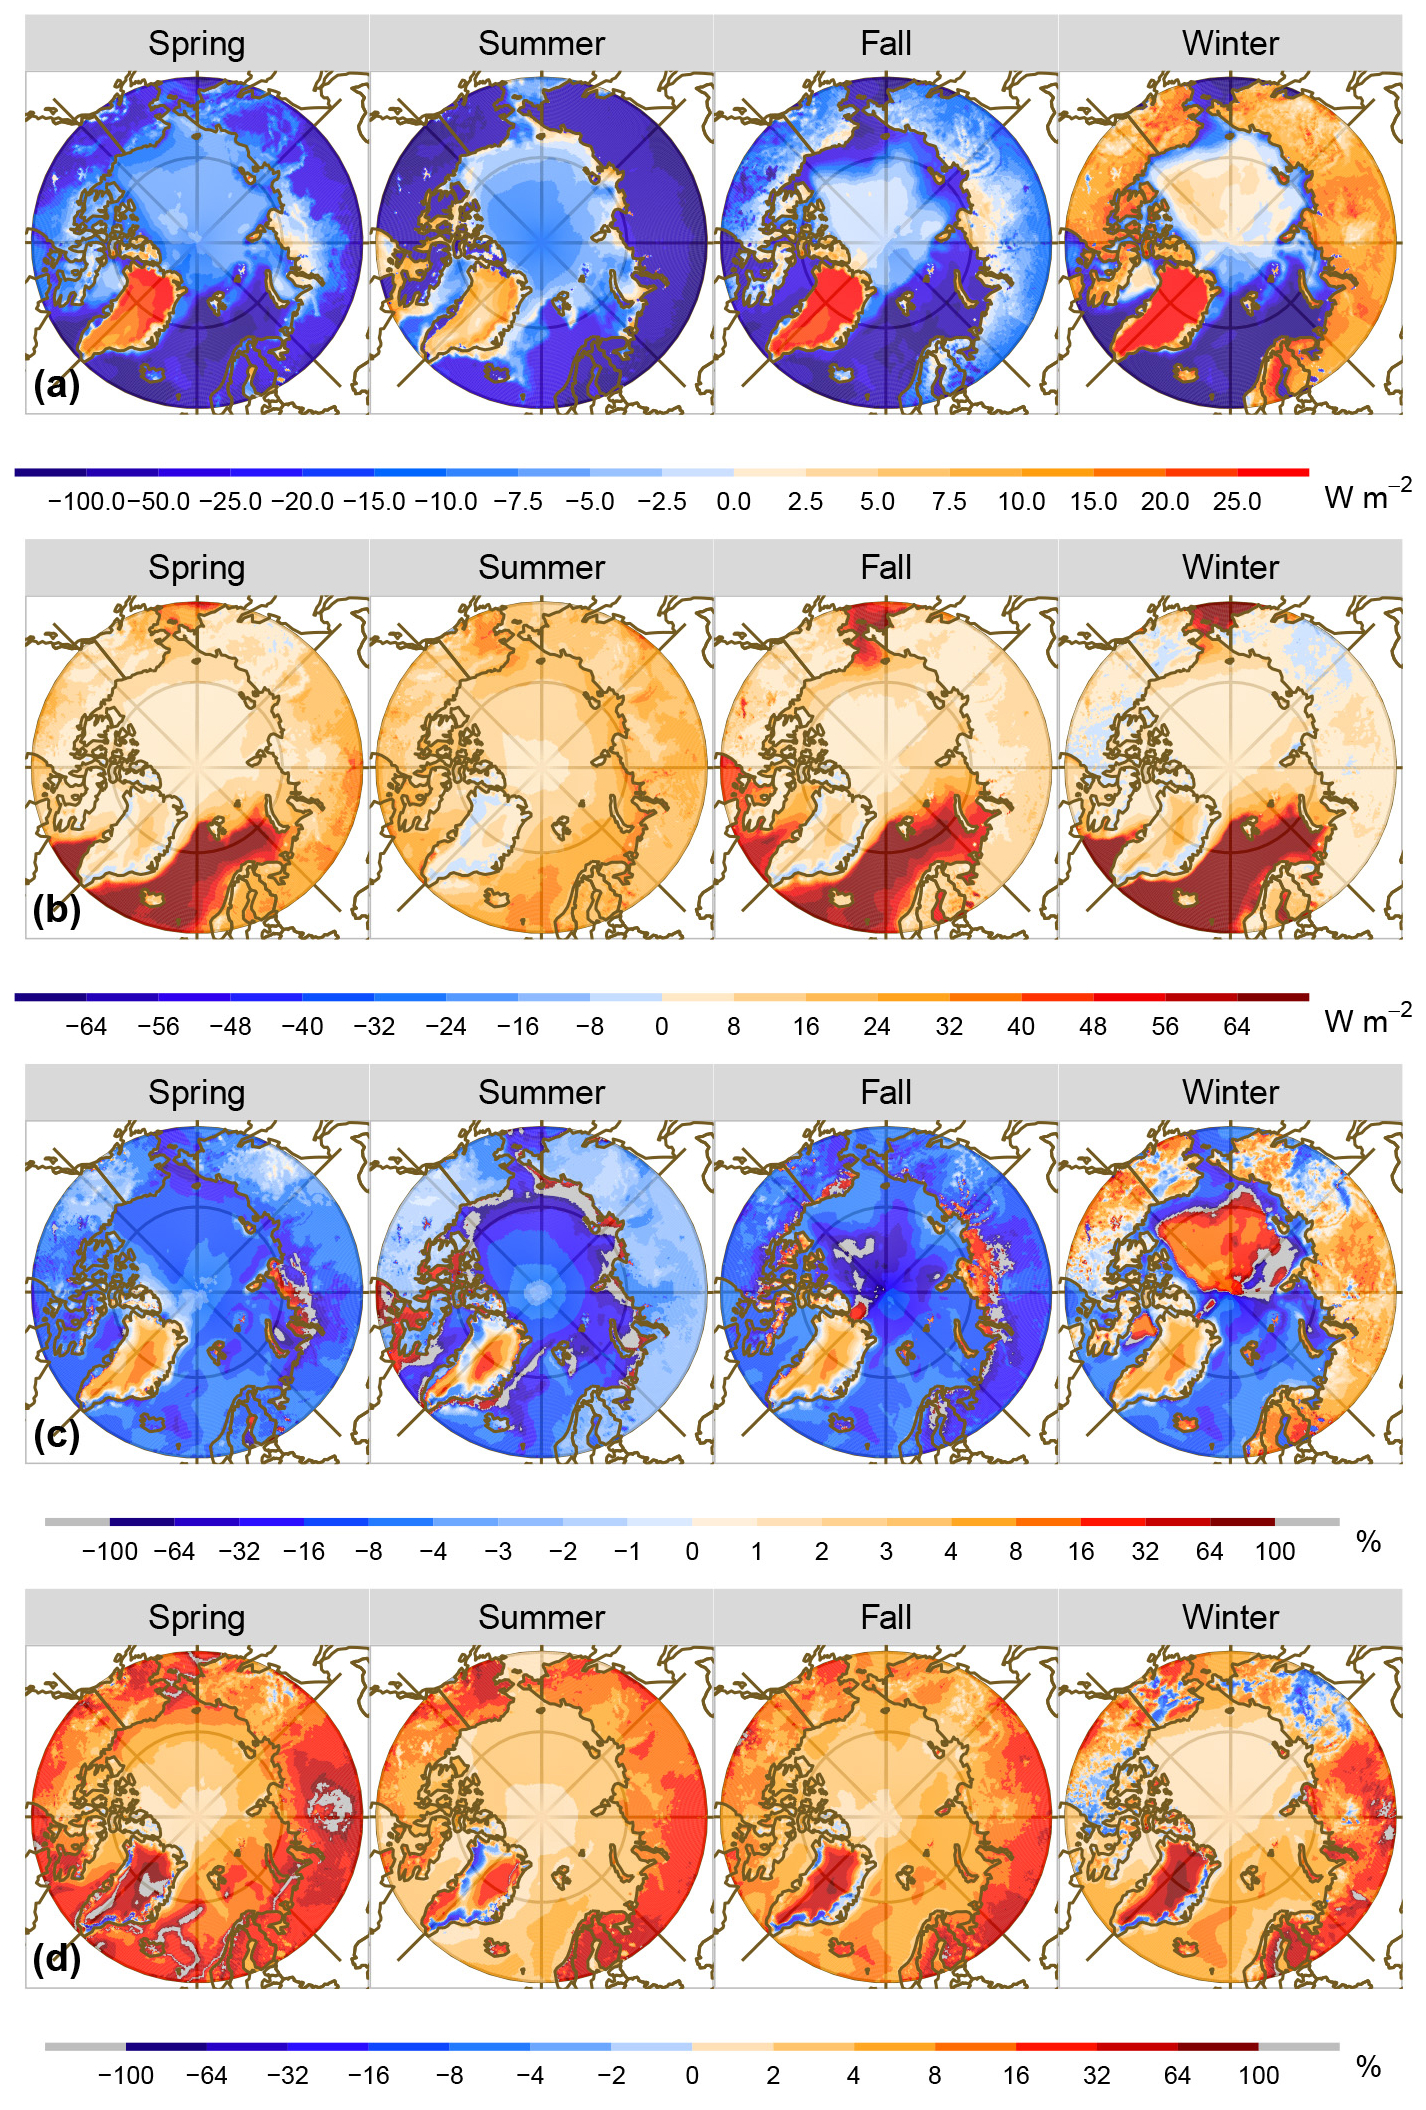
Figure 7Similar to Fig. 2 but for results according to the turbulent heat flux (TH).
In Fig. 7b and Table S1, it can be seen that ARs induce pronounced statistically significant positive (downward) TH anomalies across most of the Arctic region, primarily attributed to the increased temperature and moisture associated with ARs overlying the cold Arctic surface. Consistent with Fig. 7a, the AR-related anomalies exhibit seasonal variability and distinct land–sea–sea ice contrasts. The most substantial impact of AR TH is evident over sub-polar oceans, particularly during the colder seasons. Unlike in other Arctic regions, the surface temperature over the sub-polar oceans exhibits only very weak warming during AR events (Fig. 5b), but the presence of near-surface warm air associated with the ARs (Fig. 5d) weakens the climatological ocean-to-air temperature gradient (warmer ocean and colder air) (Fig. 5e and f), causing a reduction (42 to 62 W m−2) in the normally large upward TH (−58 to −96 W m−2). In winter, other regions display much weaker positive (downward) TH anomalies, with slightly lower portions at the 95 % confidence level (18 W m−2 over the central Arctic, 10 W m−2 over Greenland, 6 W m−2 over continents). Unlike over the sub-polar oceans, the surface temperature over land and sea-ice-covered regions exhibits strong warming during AR events. This surface warming, in conjunction with similar-magnitude near-surface warming (Fig. 5d), results in areas of both strengthened and weakened near-surface temperature gradients (Fig. 5f) that differ from the pronounced weakening of the near-surface temperature gradient over the sub-polar oceans. As a result, the AR-related TH anomalies are much smaller over the land and sea-ice-covered regions than over areas of open water in the winter. Similar patterns are seen in fall and spring with reduced-magnitude TH anomalies over Greenland (7 W m−2), similar-magnitude TH anomalies over the central Arctic Ocean (15–21 W m−2), and larger anomalies over continents (15–10 W m−2) compared to the winter anomalies. In summer, the AR-related downward TH anomalies are much weaker over the sub-polar oceans (23 W m−2) compared to the colder seasons but still larger than over land or sea ice regions. The continental areas have the next largest downward TH anomalies in summer (21 W m−2) driven by stronger warming of the near-surface air (Fig. 5d) relative to the ground (Fig. 5b and f). Over the sea-ice-covered portion of the Arctic Ocean, the surface temperature exhibits little warming during AR events (Fig. 5b), since the ice surface is already near the melting point, while the near-surface air warms (Fig. 5d and f), resulting in a moderate downward TH anomaly (17 W m−2). The Greenland ice sheet experiences the smallest AR-related TH anomaly in summer (6 W m−2), yet over 80 % of anomalies are statistically significant.
ARs influence Arctic TH climatology in complex and variable ways (Fig. 7c); it is primarily influenced by the complex climatology patterns across the Arctic domain (Fig. 7a). Over sub-polar oceans, substantial positive AR TH anomalies act to partially offset the strong negative TH climatology, averaging −7 % to −11 % relative to its climatology. In the central Arctic, weaker positive AR TH anomalies produce distinct seasonal patterns of the contributions, with amplified negative contributions in spring, summer, and fall due to low negative TH climatology, while near the North Pole and Chukchi Sea, positive contributions in winter arise from mild positive climatology. Continental regions display weak negative contributions in summer, reflecting their high TH climatology, with increased contribution magnitudes in spring and fall as TH climatology declines and positive contributions in winter due to overall positive climatology. Greenland's high TH climatology and weaker AR TH anomalies limit contributions to 3 %–4 % in spring, fall, and winter, while in summer, central Greenland shows positive contributions and the coastlines show negative contributions, averaging −3 %. Additionally, extreme contributions observed over minimal TH climatology areas – such as sea ice margins in the central Arctic Ocean during summer and winter and northern Siberia in spring and fall – significantly impact regional averages. For example, the positive 36.7 % contributions averaged for the continents in spring (Table S1) contrast with predominantly negative contributions, as seen in Fig. 7c.
Figure 7d and Table S1 reveal that, as anticipated, AR TH anomalies make large relative contributions to the mean SEB over continents and Greenland, with the maximum in spring (61 % and >100 %) and similar percentages across the other seasons (16 %–17 % and 7 %–28 %). In all seasons the AR TH anomaly contribution to the mean SEB exceeds its corresponding AR occurrence frequency. While the largest AR TH anomalies are seen over the sub-polar oceans (Fig. 7b), the contribution of these anomalies to the mean SEB is much smaller (Fig. 7d) due to the large climatological net SEB over the oceans (Fig. 3a). In summer, fall, and winter the AR TH anomalies contribute 3 % to 7 % to the mean SEB, and these contributions are less than the corresponding AR frequency. Due to the smallest net SEB climatology, the largest contribution of AR TH anomalies to the mean SEB over the sub-polar oceans is 67 % in spring, far exceeding the corresponding AR frequency by 55 %. Over the central Arctic Ocean, ARs' total contribution of TH anomalies to the mean SEB is largest in spring (19 %), exceeding the AR frequency by 8 %, but small during the rest of the year (3 %–4 %) and less than the AR frequency. Both Fig. 7c and Fig. 7d display a localized maximum relative contribution along the sea ice margins (e.g., Chukchi Sea, Barents–Kara–Laptev seas), with the maximum in spring. This is primarily attributed to the higher AR occurrence frequency (Fig. 1) and the local maximum in TH anomalies (Fig. 7b).
The analysis of AR-related TH anomalies in Fig. 7 highlights the ARs' substantial absolute impact over the sub-polar oceans, particularly in the cold seasons, which exceeds the corresponding LWD anomalies in Fig. 2b. Their overall contributions to TH climatology vary across regions, while their relative contribution to the net SEB is most pronounced in spring, due to the small net SEB climatology. Moderate AR-related TH anomalies are seen year-round over continental areas and the Greenland ice sheet (Fig. 7b). Despite their smaller absolute magnitudes, the contributions of these anomalies to the TH climatology and net SEB are significant due to lower TH and net SEB climatology in these areas. In the central Arctic Ocean, there are moderate AR-related TH anomalies (Fig. 7b) but amplified contributions to total TH climatology, while their contribution to the mean SEB exceeds the AR frequency only in the spring (Table S1). However, there are local maxima in both absolute AR-related TH anomalies (particularly in summer) and their corresponding relative contribution to both TH climatology (notable in summer and winter) and mean SEB (particularly in spring), located over the sea ice margins extending to the sub-polar oceans. Additionally, AR-related TH features over the coastlines, such as the presence of weak negative anomalies and corresponding negative AR contribution to both the climatology and net SEB, are different from those observed over the Greenland interior. Although these weak coastal anomalies are not statistically significant (Fig. S8), further investigation is necessary to understand the underlying factors contributing to these features.
4.3 Net surface energy budget
The pronounced seasonality of the Arctic SEB components (Figs. 2a, 4a, 6a, 7a), characterized by spatial land–sea–sea ice contrast, leads to a distinctive regional seasonality of net SEB, as shown in Fig. 3a. In summer, dominated by a substantial SWN, positive net SEB is observed across most of the study domain, ranging from 104 W m−2 over sub-polar oceans and 70 W m−2 over the central Arctic to 22 and 13 W m−2 over continents and Greenland, respectively (Table 1). In contrast, in winter (and to a lesser extent in fall), when SW is at a minimum, the net SEB is primarily driven by LWN and TH. This results in a net upward SEB flux with average values ranging from −147 W m−2 (−90 W m−2) over sub-polar oceans and −65 W m−2 (−48 W m−2) over the central Arctic to −10 W m−2 (−13 W m−2) and −13 W m−2 (−12 W m−2) over continents and Greenland, respectively. Spring displays a distinctive spatial variability, with weak downward net SEB flux over continents (9 W m−2) and near-zero fluxes over Greenland but surface energy loss (upward net SEB) over the sub-polar oceans (−22 W m−2) and central Arctic (−20 W m−2). Additionally, distinct variations in the sea ice margins of the central Arctic Ocean (Fig. 3a) are observed year-round, with larger positive net SEB values contributing to summer sea ice melting and larger negative net SEB values leading to refreezing from fall and winter to spring.
ARs induce discernible net SEB anomalies across the entire Arctic domain, which are predominantly statistically significant in cold seasons; while in summer, ARs have a distinct yet weak impact, with a large portion of areas showing non-significant anomalies (Figs. 3b and S9). The spatial distributions of AR-induced net SEB anomalies exhibit pronounced land–sea–sea ice contrasts. In cold seasons, the most pronounced positive impacts are observed over sub-polar oceans, ranging from 91 W m−2 in winter to 64 and 40 W m−2 in fall and spring (Table 1). These positive anomalies are primarily driven by substantial positive TH anomalies (Fig. 7b) and positive LWN anomalies (Fig. 4b), greatly surpassing weaker negative SW impacts (Fig. 6b). The intensified positive net SEB anomalies extend northwards to the sea ice margins of the Arctic Ocean. Much smaller AR-related net SEB anomalies are seen over the central Arctic, averaging between 26 and 39 W m−2. This potentially hinders sea ice refreezing in fall and winter (Zhang et al., 2023b) and may trigger sea ice melt in spring, especially over marginal ice zones. To provide context, we note that an additional +20 W m−2 sustained over a 10 d AR period during one season corresponds to a cumulative energy input of approximately 17.3 MJ m−2. Assuming all of this energy goes into melting ice and using the latent heat of fusion for ice (∼334 kJ kg−1), this would be sufficient to melt roughly 5.2 cm of ice (52 kg m−2 of sea ice). While this is a simplified calculation and does not account for other energy sinks such as sensible heat flux, conduction, or the energy required to melt snow first, it does suggest that AR-induced anomalies can provide meaningful energy for localized melt, particularly near sea ice margins or glacier ablation zones. However, the extent to which these anomalies directly trigger sea ice melt likely depends on local snow and ice conditions, and the influence is expected to be most relevant in regions with relatively warm sea surfaces such as the Barents, Chukchi, and Arctic suboceanic sectors. In areas with thicker snow cover or colder background conditions, these anomalies may have more limited or indirect effects. AR-induced net SEB anomalies are notably weaker over the continents and Greenland (15–28 W m−2) and are dominated by the LWN AR anomalies. In summer over the sub-polar oceans, the large negative SWN anomalies exceed the positive TH and LWN anomalies, resulting in an average of negative net SEB anomalies of −8 W m−2, with over half of these anomalies being statistically significant. The largest negative impacts are located over the Bering Sea, the North Atlantic, and the western margins of Greenland extending to the Baffin Bay and Labrador Sea. The dominance of SWN anomalies on the net SEB is due to the low albedo over the ocean regions. Other regions exhibit areas of positive or weak negative net SEB AR impacts, though much of these are non-significant (Fig. S9), with area average anomaly values ranging from 3 to 10 W m−2. The larger positive net SEB anomalies are found over the high-albedo sea ice and ice sheet surfaces, while smaller anomalies are seen over the lower-albedo continental areas due to the larger cooling effect from SWN in this region (Fig. 6b). Over the Arctic Ocean, a distinct coastal contrast is evident, likely sustaining sea ice melt over the sea ice margins in summer.
Figure 3c and d illustrate the AR-induced anomalous net SEB contributions to both the net SEB climatology and its absolute value, respectively. Identical contributions are seen in Fig. 3c and d where the mean net SEB climatology is positive, while opposite values appear where the climatology is negative. Regional average contributions in Table 1 differ slightly due to variable net SEB climatology directions (both positive and negative) across regions, such as Greenland where net SEB climatology over central areas contrasts with features along the coastline (Fig. 3a). While weak AR-induced absolute net SEB anomalies are observed over land, their total contributions to the mean net SEB (Fig. 3c–d) are most evident over continents, particularly in cold seasons (spring 90 %, winter 50 %, and fall 24 % in Table 1), with much lower contributions in summer (3 %) and Greenland throughout the year (>54 %), far exceeding their corresponding AR frequency, except over continental regions in summer. The large relative AR contribution to the net SEB is a result of the small climatological mean net SEB over the continents and Greenland (Fig. 3a). The sub-polar oceans, which experience the largest positive (downward) absolute impacts in cold seasons (Fig. 3b), contribute less in a relative sense to the mean SEB, ranging from 65 % in spring to 8 %–9 % in fall and winter due to the large climatological values of net SEB. In summer, ARs result in an overall cooling impact on the net SEB with a relative contribution of −1 %. In the central Arctic, the relative contributions are even smaller, ranging from 32 % in spring and 7 %–8 % in fall and winter to and 1 % in summer. This is attributed to the smaller magnitudes in both AR occurrence frequency and AR-induced total net SEB anomalies. As a result, the AR relative contribution to the net SEB is less than the AR frequency in all seasons, except spring, when it exceeds the AR frequency by 21 %.
Focusing on the central Arctic, the results discussed above – that ARs make a negligible relative contribution to the net SEB in all seasons except spring – are surprising. Figure 3b illustrates the substantial absolute impact of ARs on net SEB in winter, averaging 39 W m−2 (Table 1), with maximum anomalies extending to the Arctic Pacific and Atlantic sectors. This explains the attention of the Arctic AR literature given to this season and area (e.g., Zhang et al., 2023b; Baggett et al., 2016). However, these large anomalies occur with low frequencies (Fig. 1) such that when considering their cumulative impact on the net SEB they make small relative contributions that are less than the AR frequency in all seasons except spring. Nevertheless, local maximum contributions to the mean SEB over the Arctic sea ice margins are observed, including the Bering–Chukchi seas and Barents–Kara seas in spring.
Previous studies (Baggett et al., 2016; Fearon et al., 2021; Hegyi and Taylor, 2018; Woods et al., 2013; Woods and Caballero, 2016; Zhang et al., 2023b) have primarily focused on ARs, or analogous strong moisture intrusions, emphasizing their impacts on LWD in specific case studies or limited geographic and seasonal context. In contrast, our study expands upon these earlier investigations by conducting a comprehensive assessment of the impact of Arctic ARs on all terms in the SEB. We explore AR-induced radiative and turbulent SEB flux average anomalies, their seasonal variation, and the relative contributions to their climatology and mean SEB over a continuous 40-year period (from 1980 to 2019) – a perspective that has not been adequately explored in the existing literature. Both positive and negative anomalies in AR-induced SEB terms of the Arctic have climatological significance, as they signify deviations in the energy budget at the surface, impacting local temperature as well as influencing the rate of ice growth/melt (Persson et al., 2017; Serreze et al., 2007).
5.1 AR-induced surface and air temperature response
Our findings are mostly consistent with prior research, emphasizing that variations in Arctic surface temperature are predominantly driven by changes in LWD across various spatial and temporal scales (Cullather et al., 2016; Gong and Luo, 2017; Kim et al., 2017; Murto et al., 2023; Persson et al., 2017; Woods and Caballero, 2016). By comparing the spatial patterns presented in Figs. 2 and 5, our study confirms that the 40-year average LWD (Fig. 2a) and AR-related LWD anomalies (Fig. 2b) closely correspond to climatological mean surface and T2m air temperatures (Fig. 5a, c) and AR-induced surface and air temperature anomalies (Fig. 5b, d), particularly in cold seasons (fall, winter, and spring).
We observe that the spatial patterns of AR-induced surface temperature and T2m anomalies significantly differ from AR-induced SEB anomalies (Fig. 3b) but closely resemble AR-related LWD anomalies (Fig. 2b). Overall, ARs induce statistically significant surface and near-surface atmospheric warming in the Arctic, particularly in cold seasons, with maximum warming in winter. This effect displays a clear land–sea–sea ice contrast, with amplified warming over land and to a lesser extent over the sea-ice-covered central Arctic Ocean and a minimum impact over sub-polar oceans. On average, the AR-induced surface (T2m) warming in winter is largest over continents (9.5 K (9.4 K)) and Greenland (8.6 K (8.3 K)), less over the central Arctic (6.2 K (6.8 K)), and smallest over the sub-polar oceans (3.2 K (5.2 K)) (Table S2). In summer, the temperature responses exhibit different spatial patterns that do not resemble any of the AR-induced individual SEB components. Instead, the surface temperature response in summer (Fig. 5b) closely mirrors the AR net SEB anomalies (Fig. 3b): cooling responses over the Arctic Pacific, the Arctic Atlantic–western Greenland–Baffin Island, and the North Pole are influenced by negative net SEB anomalies, while warming effects over land are affected mainly by positive net SEB anomalies. However, as shown in Fig. S12, most areas of surface cooling are not statistically significant. The uniform weak warming observed over the sea-ice-covered Arctic Ocean in summer contrasts with the amplified positive net SEB anomalies over the marginal sea ice area (Fig. 3b). This difference is likely due to the constraint imposed by melting of sea ice, limiting the surface temperature increase. Consequently, the average AR-induced surface (T2m air) response in summer is nearly 0 K (0.9 K) for sub-polar oceans, 0.1 K (0.8 K) for the Arctic Ocean, and 1.1 K (1.7 K) and 2.8 K (2.9 K) for continents and Greenland, respectively (Table S2).
Furthermore, the surface and near-surface responses induced by ARs (Fig. 5b, d) strongly influence subsequent anomalies in the SEB components. Specifically, during cold seasons, amplified surface and near-surface responses are observed. The large AR-induced surface warming over land and Greenland results in stronger compensating LWU anomalies, consequently yielding smaller LWN anomalies (Fig. 4b), despite large LWD anomalies (Fig. 2b). Simultaneously, ARs produce comparable surface and near-surface air temperature warming (Fig. 5d), resulting in small TH anomalies over land. In contrast, the limited surface warming over sub-polar oceans gives rise to substantial LWN anomalies. This, along with the warmer air associated with ARs (Fig. 5d), generates pronounced positive TH anomalies (Fig. 7b). Over the Arctic Ocean, moderate rises in surface and near-surface temperatures, along with the related LWU anomalies associated with ARs, partially offset the large LWD anomalies, resulting in the secondary large LWN and TH anomalies.
Moreover, Fig. 5e–f show that surface temperature inversions (shaded in blue in Fig. 5e) experience a slight decrease over the sea-ice-covered central Arctic Ocean in winter (Fig. 5f). In contrast, a pronounced reduction in surface temperature inversions is noted over a large part of high-elevation mountainous areas in continents during winter, with a smaller scattered area in fall and spring and persisting in the ablation zone of Greenland throughout the year. In summary, during cold seasons, AR-related surface and air temperature responses are mainly driven by LWD anomalies associated with ARs, while in summer, the responses are influenced by anomalies associated with the net SEB, with the surface response closely resembling that of the net SEB anomalies.
5.2 ARs' crucial role in triggering Greenland ice sheet melt
Throughout the year, ARs exert significant warming effects on Greenland, with the most pronounced impacts occurring during cold seasons (Fig. 5b, d). Greenland, being one of the driest regions in the Arctic, is especially susceptible to AR impacts. In cold seasons, the intensified surface warming in Greenland (6–9 K, as shown in Table S2) is primarily driven by strong positive LWD anomalies associated with ARs (Fig. 2b), in contrast to the weaker positive TH anomalies (Fig. 7b). In contrast, during summer, the moderate warming (3 K) over Greenland aligns more closely with positive SEB anomalies, suggesting that anomalies in each SEB component during ARs contribute to the surface response and subsequent melting effects.
Notably, in the southwest of Greenland where ARs are frequent (Fig. 1), previous research (Mattingly et al., 2018) suggests that ARs contribute to substantial surface mass loss in summer and that this contribution is primarily attributed to TH anomalies, particularly enhanced SH anomalies. Mattingly et al. (2020) argue that the amplified SH anomalies may result from strong southerly winds at lower elevations, a significant temperature contrast between the ice surface and the near-ice atmosphere associated with ARs, and increased aerodynamic roughness in snow-free areas. This differs from our findings that show small TH anomalies (Fig. 7b) and larger LWN anomalies (Fig. 4b) that dominate the net SEB AR-induced anomalies (Fig. 3b) over Greenland in summer. This discrepancy with Mattingly et al. (2020) possibly results from the utilization of different AR detection algorithms. Their detection method imposes a strict minimum threshold of 150 kg m−1 s−1 for IVT and exclusively considers northward moisture transport from the Arctic. Moreover, their focus is on the strongest AR days, where the maximum IVT exceeds the 90th percentile of all AR IVT values at each basin and each season. These criteria are designed to capture extreme strongly northward AR transport events affecting Greenland, potentially resulting in heightened SH. At higher elevations in Northeast Greenland, certain distinct patterns emerge. AR-related LWN anomalies (Fig. 4b) are weakly positive, while SWN anomalies (Fig. 6b) are weakly negative and the TH anomalies (Fig. 7b) dominate the net SEB anomaly in this region (Fig. 3b). These anomalies collectively contribute to the localized smaller positive net SEB anomalies in Northeast Greenland (Fig. 3b), leading to subsequent weak surface warming over the northeast ablation zone (Fig. 5b, d). These patterns align with findings from Mattingly et al. (2020, 2023), where they suggest that the foehn effect from ARs leads to increased SH.
6.1 Influence of AR detection methods on results
The characteristics of ARs and the consequential impact on SEB are significantly influenced by the methods used to detect ARs. Different AR detection algorithms can yield varying AR statistics. For illustration, we compare the results with those from Ma et al. (2024, referred to as M24), which is based on the algorithm developed by Guan and Waliser (2019) but applies it to ERA5 reanalysis, for AR occurrence frequency (Fig. 8a), AR LWD anomalies (Fig. 8b), and the overall contribution to mean LWD climatology (Fig. 8c) and net SEB (Fig. 8d) for the same 40-year period as analyzed above. Detailed information regarding the AR detection method of M24 is provided in Guan and Waliser (2019). While both methods share common IVT 85th-percentile climatological thresholds and a 1500 km length criterion, the M24 algorithm introduces additional requirements regarding the mean IVT direction and coherence in IVT directions. However, the most notable distinction between the two algorithms lies in the requirement of a minimum IVT of 100 kg m−1 s−1 to complement the 85th-percentile climatological thresholds in the M24 index.
In Fig. 8a, a significant year-round reduction in AR occurrence frequency across the entire Arctic region is evident when using the M24 index, in contrast to the results shown in Fig. 1. Notably, during the cold seasons, particularly over the central Arctic Ocean, very few ARs are detected, as indicated by the large light-blue area in Fig. 8a. The area-averaged AR occurrence frequency for the four regions range from 1 % to 7 % in cold seasons (Table S3), in contrast to above 12 % in the results discussed in Sect. 3. These distinct spatial differences between the two AR detection methods are primarily attributed to the minimum IVT requirement of 100 kg m−1 s−1 used in Guan and Waliser (2019). As shown in Fig. S4, for January (representative of winter), the 85th-percentile climate threshold in most of the Arctic domain falls below 100 kg m−1 s−1. This results in minimal AR occurrences over the central Arctic Ocean in winter, as well as in fall and spring, in the M24 index (Fig. 8a). Consequently, any detected ARs will be associated with substantially higher IVT values compared to those detected in the analysis.
In Figs. 8b and S14, it is evident that M24-identified ARs consistently generate substantial, statistically significant positive LWD anomalies in the Arctic. In winter, including only the most extreme AR events results in larger LWD anomalies over the central Arctic Ocean (73.4 W m−2, in contrast to 45.1 W m−2 in the results presented in the previous section), extending to both the Eurasian and the North American continents compared to the results in Fig. 2b. These anomalies coincide with the lowest AR occurrence frequency in Fig. 8a, averaging 1.3 %, with maximum values exceeding 100 W m−2. Similarly to the analysis in Fig. 2b, there are localized stronger AR-induced LWD anomalies over the sea ice margins of the central Arctic Ocean, particularly from the Greenland Sea to the Barents–Kara seas in winter. The M24 results also show larger AR LWD anomalies in spring (41–62 W m−2 for all 4 regions in Table S3), compared to Fig. 2b (33–44 W m−2 for all 4 regions in Table 1) but similar anomalies in summer and fall, suggesting that the stricter AR detection threshold does not make much difference in these two seasons when the climatological value of IVT is larger.
Although M24-identified ARs have larger absolute magnitudes in AR-related LWD anomalies in winter and spring, their relative contributions to the mean LWD climatology (Fig. 8c) and net SEB (Fig. 8d) are smaller, due to the lower AR frequency of occurrence (Fig. 8a). In fact, the relative contribution of AR-related LWD anomalies is consistently less using the M24 AR index, compared to the results shown in Fig. 2c–d in all seasons, although the spatial patterns of the AR contribution are similar for both AR detection methods. Using the M24 index, the AR-induced total LWD anomaly relative to climatology remains minimal throughout the year (<1 % in Table S3), with slightly higher values over sub-polar oceans in winter, averaging 1.1 %. The largest contribution from M24 remains in spring, but their magnitudes are much smaller, with an average of 7 % over the Arctic Ocean (in contrast to 45 % in Table 1), 40 % over sub-polar oceans (in contrast to 69 % in Table 1), and 79 % and >300 % over continents and Greenland (in contrast to >200 % and >4000 % in Table 1). Central Arctic regions receive minimal AR-induced LWD contributions to the mean SEB, ranging from 7 % in spring (45 % in Table 1) to 1 %–2 % in summer, fall, and winter (2 %–10 % in Table 1).
The use of a 100 kg m−1 s−1 threshold is a common practice in Arctic AR studies (Fearon et al., 2021; Guan and Waliser, 2015, 2019; Ma et al., 2020; Zhang et al., 2023b; and others), originally chosen to distinguish AR-like features in polar regions and to align with the AR detection results for East Antarctica by Gorodetskaya et al. (2014), which captured extreme precipitation events. Results from the M24 index indicate that using a 100 kg m−1 s−1 threshold detects much fewer AR occurrences and yields minimal contributions to the mean SEB over the central Arctic Ocean in winter, despite the presence of larger absolute LWD anomalies. Even in the Barents–Kara seas, where ARs have been recently examined for significant LWD anomalies, the maximum contribution of AR-related total LWD anomalies is less than 4 %, even lower than the corresponding AR frequency of less than 5 % in winter. Contrary to the findings in Sect. 4.1.1, the M24 index indicates that over the entire 40-year period, AR-related total LWD anomalies contribute minimally to the mean SEB and have a limited impact on delaying sea ice refreeze in winter. This suggests that the use of restrictive criteria for AR detection emphasizes impacts for individual cases but results in minimizing the contributions by the ARs to the overall climatology of the SEB due to their very low frequency of occurrence. The initial comparison of two AR detection methods presented here underscores the need to assess various Arctic AR detection tools and establish a comprehensive Arctic AR intercomparison project, which will significantly contribute to advancing our knowledge of Arctic ARs and their effects, including SEB effects. Ultimately, such efforts will help address the uncertainties regarding AR impacts due to the use of different AR detection methods.
6.2 Arctic AR and cyclone interactions in surface energy budgets
Arctic ARs are closely linked with Arctic cyclones, which strongly influence surface heat fluxes, particularly TH (Blanchard-Wrigglesworth et al., 2022), subsequently impacting the net SEB. Moreover, studies suggest that large-SEB-anomaly events in the Arctic are often associated with an increased frequency of cyclone occurrence (Murto et al., 2023). Additionally, cyclones affect snowfall accumulation on sea ice, thereby influencing SEB due to the high albedo of snow (Webster et al., 2019). Our findings indicate that surfaces with varying albedos exhibit distinct responses to AR SEB impacts, particularly AR-related SWN impacts. Further research is warranted to comprehensively investigate the relationship between Arctic ARs and Arctic cyclones and their synergistic role in surface SEB impacts, with a particular focus on cyclone-induced snow on ice. Additionally, it is crucial to compare these findings with the results obtained from ARs in this study.
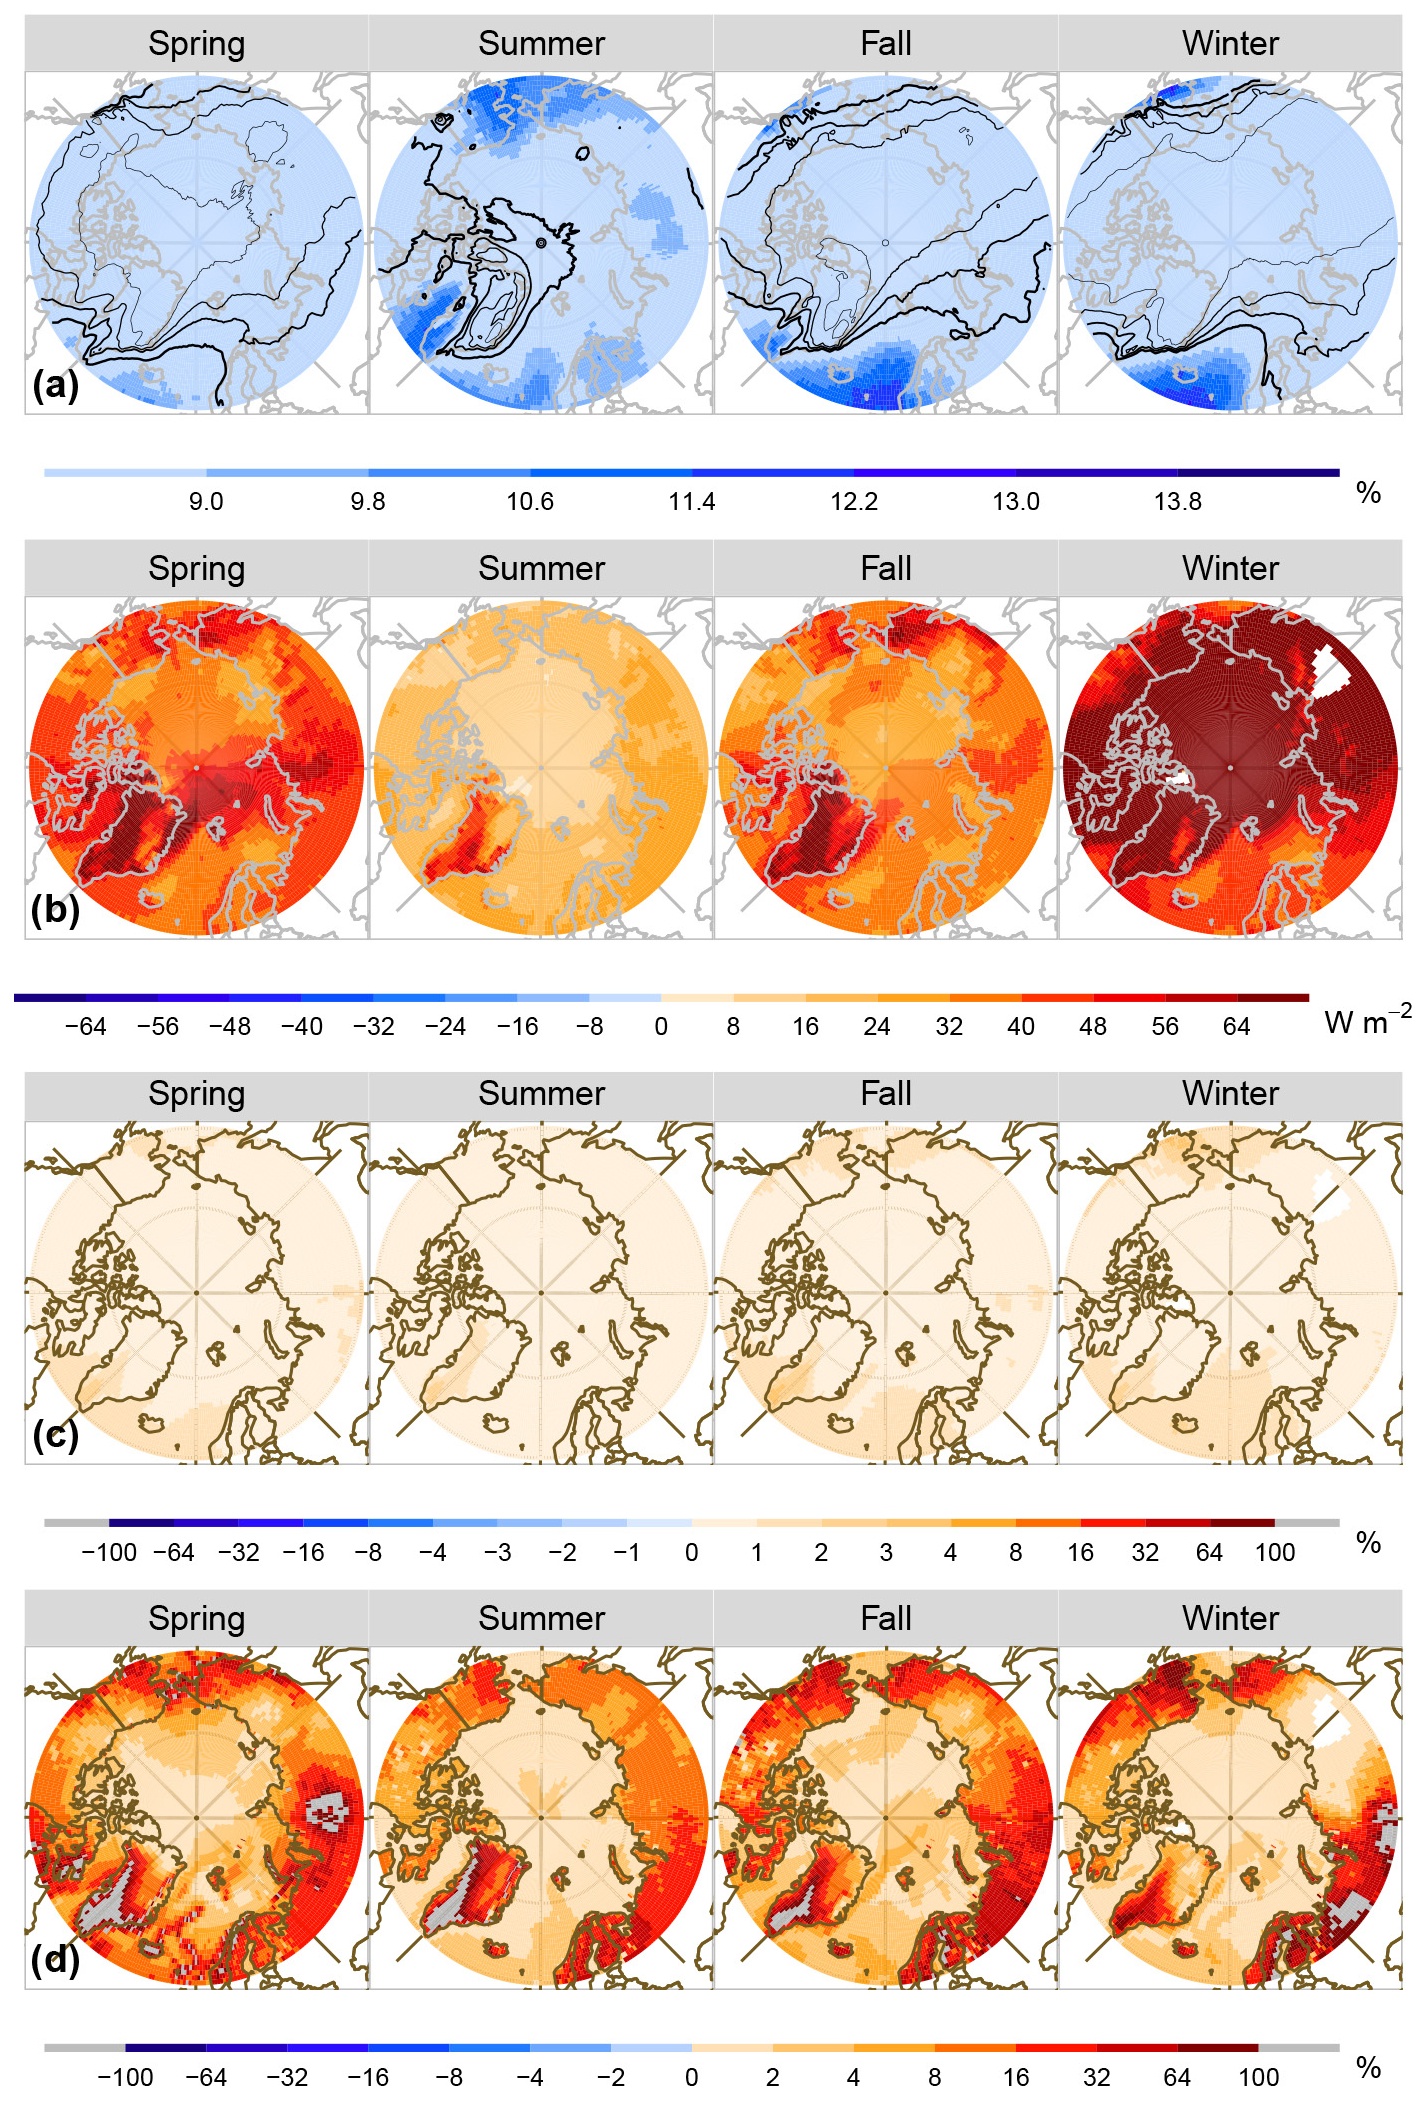
Figure 8According to the M24 AR index, spatial distributions of (a) the 40-year AR occurrence frequency (percentage of AR occurrence frequency) in each of the four seasons – spring (March–May), summer (June–August), fall (September–November) and winter (December–February) – from 1980 to 2019. The black lines, ranging from thin to thick, represent AR frequencies at 1 %, 3 %, 5 %, and 7 %, respectively. (b) The 40-year mean LWD anomalies (unit: W m−2) during the presence of AR events in each of the four seasons. Positive values indicate downwards. (c) The fraction of 40-year AR contribution (unit: %) from the total LWD anomalies to the LWD climatology. (d) The fraction of the 40-year AR contribution (unit: %) from the total LWD anomalies to the absolute values of 40-year average net SEB during each of the four seasons. The percentage results greater than 100 % are shaded in grey for clarity. The blank areas in the figures correspond to areas with zero AR occurrence frequency. Panels (a), (b), (c), and (d) are similar to Figs. 1 and 2b, c, and d, respectively, but for the results according to M24 AR detection index.
6.3 Limitations of the reanalysis data
The results presented here rely on reanalysis data, used due to constraints from the limited Arctic observations compared to observations in the mid-latitudes. While ERA5 exhibits superior performance among reanalysis datasets in the Arctic (Graham et al., 2019b), it remains dependent on climate models and data assimilation skills, potentially deviating from actual conditions. Notably, ECMWF does not directly assimilate tropospheric water vapor, except for radio occultation, resulting in a lack of actual measurements for detecting ARs. Furthermore, ERA5 shows biases in T2m during winter and spring, leading to poorly represented surface inversions and turbulent heat fluxes over sea ice (Graham et al., 2019a; Herrmannsdörfer et al., 2023). Further case studies examining Arctic AR events and their SEB impacts should compare different reanalyses as well as utilize observational data, such as from the MOSAiC expedition (Shupe et al., 2022), which can not only validate the ERA5 reanalysis but also contribute to a more accurate and comprehensive understanding of AR impacts in the Arctic region.
6.4 Limitations of the analysis
This study is based on seasonal-mean composites from 1980 to 2019, which inherently mask the interannual and intraseasonal variability in AR-induced SEB anomalies. While the analysis discusses the potential seasonal climatological impacts of ARs, their actual impact on sea ice and glacier melt is likely modulated by the background climate state. For example, in warmer recent decades or in late spring when surface snow and ice are more susceptible, the same AR-induced energy anomalies may exert stronger melt impacts than in earlier colder periods. Furthermore, seasonal averaging may obscure temporal biases within the season – if ARs tend to occur in early spring, their potential to affect surface melt could be diminished despite large seasonal-mean anomalies. Another limitation stems from the composite approach itself: AR-induced anomalies reflect short-lived perturbations associated with limited AR occurrences (10 %–12 % or ∼10 d per season). Our results suggest the potential cumulative impact of these short events, but they should not be interpreted as sustained seasonal effects. The actual influence depends on the persistence and timing of the anomalies, which we do not resolve in this analysis. Future work using event-based or lagged analyses is needed to evaluate the duration and full impact of ARs on sea ice and glacier melt.
In this study, we focus on Arctic AR events identified using IVT exceeding the 85th climatological percentile in 3-hourly ERA5 reanalysis data from January 1980 to December 2019. We conduct a comprehensive analysis of the SEB components during AR events by examining their absolute average anomalies (panel b in Figs. 2–4, 6–7), overall AR contribution to seasonal means of the individual SEB component climatology (panel c in Figs. 2–4, 6–7), and AR contribution to seasonal means of absolute net SEB across the Arctic region (panel d in Figs. 2–4, 6–7). Our findings reveal substantial variations in SEB components and net SEB during AR events, characterized by distinct seasonality and pronounced land–sea–sea ice contrast patterns.
Over the sea-ice-covered central Arctic Ocean, ARs produce substantial, statistically significant positive LWD anomalies (Fig. 2b), especially in cold seasons (29–45 W m−2), with the most notable effects over marginal sea ice areas. The enhanced LWD induces moderate surface warming and corresponding moderate LWU anomalies, resulting in smaller LWN anomalies (16–22 W m−2) than the LWD anomalies. When combined with similar magnitudes of the TH anomalies (15–21 W m−2) and weak negative SWN anomalies, large positive net SEB impacts (26–39 W m−2) are observed. These short-term increases in the SEB potentially hinder sea ice refreezing in fall and winter (Zhang et al., 2023b) and may trigger sea ice melt in spring (Huang et al., 2019a, b). Nonetheless, the impact of these anomalies on initiating sea ice melt is contingent upon regional snow and ice conditions, with the most pronounced regions characterized by warm sea surface temperatures. In summer, more pronounced AR SWN anomalies (−22 W m−2) largely counteract the LWN anomalies (14 W m−2) and TH anomalies (17 W m−2), resulting in a weak positive net SEB impact (9 W m−2), though local maxima along sea ice margins may still accelerate sea ice melt (Fig. 3b). Despite large AR-induced LWD anomalies, their contribution to total LWD climatology remains moderate (Fig. 2c) due to the less frequent AR occurrences in this area – reaching a maximum of 2.5 % in winter and only 0.5 % in summer, with transitional values in spring (1.6 %) and fall (1.3 %). In spring, the combination of large AR-induced LWD anomalies and a smaller net SEB climatology results in a substantial relative contribution to the climatological net SEB. This suggests that AR-driven SEB anomalies play an important role in modifying the climatological SEB, potentially supporting early-state melt in spring, particularly of snow over sea ice, and influencing the minimum sea ice extent in fall (Huang et al., 2019a).
Over sub-polar oceans, ARs exert the most significant absolute positive impact on net SEB in cold seasons (40–91 W m−2), which is primarily attributed to substantial positive TH anomalies (42–62 W m−2) and, to a lesser extent, positive LWN anomalies (27–31 W m−2) associated with a weak surface temperature response. However, when normalized by the corresponding TH and LWN climatology, the total contribution of ARs is not as prominent as the absolute anomalies suggest, due to the large cooling in TH and LWN climatology over sub-polar oceans, which averages −8 % to −11 % for TH and −7 % for LWN. While relative contributions to the seasonal-mean SEB appear enhanced, particularly in spring, this is largely due to the smaller climatological net SEB values. In summer, strong negative SWN anomalies dominate (−52 W m−2) due to the low albedo over the oceans, leading to overall negative net SEB anomalies (−8 W m−2) and associated weak negative effects on the mean SEB (−1 %).
ARs generate large LWD anomalies over continental regions (24–46 W m−2), with the strongest anomalies occurring in spring, fall, and winter. These large anomalies are partially offset by increased LWU due to AR-induced surface warming, leading to moderate LWN, and relatively small net SEB anomalies (3–16 W m−2). The large LWD anomalies contribute 2 %–3 % of the seasonal LWD climatology in spring, fall, and winter and about 1 % in summer. While relative contributions to the mean net SEB can appear extremely high (e.g., >200 % in spring), this is primarily driven by the extremely small net SEB climatology over continental land (Fig. 3a), rather than by the magnitude of AR-induced anomalies themselves. As such, these high percentage values should be interpreted with caution. Nonetheless, even moderate AR-driven SEB perturbations might have significant impacts on Arctic continental environments, potentially accelerating permafrost thaw, altering snowpack evolution, or affecting surface hydrology and ultimately shaping land-surface processes.
Greenland, particularly western Greenland, exhibits noteworthy AR-related LWD absolute anomalies (34–47 W m−2), and these anomalies contribute 2 %–4 % to their LWD climatology. These substantial AR LWD anomalies largely drive the net SEB anomalies (10–28 W m−2). While the relative contributions of ARs to mean net SEB exceeds 100 %, this reflects a combination of both strong AR-induced LWD anomalies and the extremely small seasonal net SEB climatology, especially in spring. Nevertheless, in summer, AR-related total net SEB anomalies contribute to 62.5 % of the mean SEB, a 6-fold increase compared to the corresponding AR occurrence frequency (11.1 %). The amplified contribution suggests the potential to trigger melt over the Greenland ice sheet (Mattingly et al., 2018, 2020, 2023; Neff, 2018; Neff et al., 2014).
In summary, our work underscores the crucial role of ARs in influencing absolute SEB anomalies across the Arctic, especially during non-summer seasons, particularly winter, which has traditionally received the greatest attention in AR research. However, when considering AR occurrence frequency, we find that the most significant contribution to the mean net SEB occurs during spring. While relative contributions provide valuable context, they must be interpreted with caution due to their relatively small seasonal net SEB climatology. We recommend considering both absolute anomalies and relative contributions, both to climatological means and to net SEB, to gain a more complete understanding of AR impacts on the SEB. In particular, AR-induced SEB anomalies and relative contributions are particularly notable over the sea-ice-covered central Arctic Ocean and may have profound implications for sea ice thermodynamics in marginal and pack ice regions. Our research enhances our understanding of Arctic warming and sea ice decline within the context of ongoing Arctic amplification. Furthermore, these findings hold the potential to enhance climate models, leading to more accurate predictions of future Arctic climate changes and informed decision-making to mitigate the impacts of Arctic amplification at regional and global scales.
ERA5 data were acquired from the Copernicus Climate Change Service (C3S) Climate Data Store (https://doi.org/10.24381/cds.adbb2d47, Hersbach et al., 2023).
The AR index crucial for supporting our conclusions is openly accessible at the following URL: https://doi.org/10.4231/EHZ2-DP09 (Tung et al., 2023). The M24 AR index and all code necessary to replicate the presented results will be made available upon request from the corresponding author, Chen Zhang (chen.zhang-3@colorado.edu).
The supplement related to this article is available online at https://doi.org/10.5194/tc-19-4671-2025-supplement.
CZ, JJC, and MWS conceived the study and devised the methods. CZ curated the data, conducted the analysis, visualized the results, and wrote the original manuscript, all under the supervision and support of JJC and MWS. CZ, WT, HW, and WM facilitated access to the atmospheric river detection algorithm. All authors actively contributed to the discussion and participated in reviewing and editing the manuscript.
The contact author has declared that none of the authors has any competing interests.
The findings and conclusions expressed herein do not necessarily reflect the views of the NSF or the U.S. Government.
Publisher's note: Copernicus Publications remains neutral with regard to jurisdictional claims made in the text, published maps, institutional affiliations, or any other geographical representation in this paper. While Copernicus Publications makes every effort to include appropriate place names, the final responsibility lies with the authors.
We acknowledge Purdue Information Technology at the Purdue (ITAP) Rosen Center for Advanced Computing (RCAC) for their generous assistance with data-intensive high-performance computing. Part of this research used resources of the National Energy Research Scientific Computing Center (NERSC), a U.S. DOE Office of Science User Facility located at Lawrence Berkeley National Laboratory, operated under Contract No. DE-AC02-05CH11231, using NERSC award m1199. We express our gratitude to Ola Persson, Matthew Shupe, Mark Serreze, and Patrick Taylor for their insightful comments and engaging discussions, which significantly contributed to enhancing the quality of our presentation. Additionally, we thank Qinqin Kong for facilitating access to the ERA5 data, as well as Jeff Ridley, Jonathan Wille, and the two anonymous reviewers for their insightful comments.
This research has been supported by the Cooperative Institute for Research in Environmental Sciences (CIRES) Visiting Fellows Program (funded by National Oceanic and Atmospheric Administration Cooperative Agreement NA22OAR4320151) and by the Regional and Global Model Analysis (RGMA) component of the Earth and Environmental System Modeling (EESM) program of the U.S. Department of Energy's Office of Science, as a contribution to the HiLAT-RASM project. The Pacific Northwest National Laboratory is operated for DOE by Battelle Memorial Institute under contract DEAC05-76RL01830.
This paper was edited by Ed Blockley and reviewed by Jeff Ridley, Jonathan Wille, and two anonymous referees.
Abbot, D. S., Walker, C. C., and Tziperman, E.: Can a convective cloud feedback help to eliminate winter sea ice at high CO2 concentrations?, J. Climate, 22, 5719–5731, https://doi.org/10.1175/2009JCLI2854.1, 2009.
Alexeev, V. A., Langen, P. L., and Bates, J. R.: Polar amplification of surface warming on an aquaplanet in “ghost forcing” experiments without sea ice feedbacks, Clim. Dynam., 24, 655–666, https://doi.org/10.1007/s00382-005-0018-3, 2005.
Baggett, C., Lee, S., and Feldstein, S.: An investigation of the presence of atmospheric rivers over the North Pacific during planetary-scale wave life cycles and their role in Arctic warming, J. Atmos. Sci., 73, 4329–4347, https://doi.org/10.1175/JAS-D-16-0033.1, 2016.
Bao, J. W., Michelson, S. A., Neiman, P. J., Ralph, F. M., and Wilczak, J. M.: Interpretation of enhanced integrated water vapor bands associated with extratropical cyclones: Their formation and connection to tropical moisture, Mon. Weather Rev., 134, 1063–1080, https://doi.org/10.1175/MWR3123.1, 2006.
Blanchard-Wrigglesworth, E., Webster, M., Boisvert, L., Parker, C., and Horvat, C.: Record Arctic Cyclone of January 2022: Characteristics, Impacts, and Predictability, J. Geophys. Res.-Atmos., 127, e2022JD037161, https://doi.org/10.1029/2022JD037161, 2022.
Boisvert, L. N., Petty, A. A., and Stroeve, J. C.: The impact of the extreme winter 2015/16 arctic cyclone on the Barents-Kara Seas, Mon. Weather Rev., 144, 4279–4287, https://doi.org/10.1175/MWR-D-16-0234.1, 2016.
Bourassa, M. A., Gille, S. T., Bitz, C., Carlson, D., Cerovecki, I., Clayson, C. A., Cronin, M. F., Drennan, W. M., Fairall, C. W., Hoffman, R. N., Magnusdottir, G., Pinker, R. T., Renfrew, I. A., Serreze, M., Speer, K., Talley, L. D., and Wick, G. A.: High-latitude ocean and sea ice surface fluxes: Challenges for climate research, B. Am. Meteorol. Soc., 94, 403–423, https://doi.org/10.1175/BAMS-D-11-00244.1, 2013.
Chen, Y., Aires, F., Francis, J. A., and Miller, J. R.: Observed relationships between Arctic longwave cloud forcing and cloud parameters using a neural network, Journal of climate, 19, 4087–4104, https://doi.org/10.1175/JCLI3839.1, 2006.
Cleveland, W. S. and Hafen, R.: Divide and recombine (D and R): Data science for large complex data, Stat. Anal. Data Min., 7, 425–433, https://doi.org/10.1002/sam.11242, 2014.
Cohen, J., Screen, J. A., Furtado, J. C., Barlow, M., Whittleston, D., Coumou, D., Francis, J., Dethloff, K., Entekhabi, D., Overland, J., and Jones, J.: Recent Arctic amplification and extreme mid-latitude weather, Nat. Geosci., 7, 627–637, https://doi.org/10.1038/ngeo2234, 2014.
Cox, C. J., Uttal, T., Long, C. N., Stone, R. S., Shupe, M. D., and Starkweather, S.: The role of springtime arctic clouds in determining autumn sea ice extent, J. Climate, 29, 6581–6596, https://doi.org/10.1175/JCLI-D-16-0136.1, 2016.
Cullather, R. I., Lim, Y. K., Boisvert, L. N., Brucker, L., Lee, J. N., and Nowicki, S. M. J.: Analysis of the warmest Arctic winter, 2015–2016, Geophys. Res. Lett., 43, 10808–10816, https://doi.org/10.1002/2016GL071228, 2016.
Curry, J. A. and Ebert, E. E.: Annual cycle of radiation fluxes over the Arctic Ocean: sensitivity to cloud optical properties, J. Climate, 5, https://doi.org/10.1175/1520-0442(1992)005<1267:ACORFO>2.0.CO;2, 1992.
Dacre, H. F., Clark, P. A., Martinez-Alvarado, O., Stringer, M. A., and Lavers, D. A.: How do atmospheric rivers form?, B. Am. Meteorol. Soc., 96, 1243–1255, https://doi.org/10.1175/BAMS-D-14-00031.1, 2015.
Eiras-Barca, J., Ramos, A. M., Pinto, J. G., Trigo, R. M., Liberato, M. L. R., and Miguez-Macho, G.: The concurrence of atmospheric rivers and explosive cyclogenesis in the North Atlantic and North Pacific basins, Earth Syst. Dynam., 9, 91–102, https://doi.org/10.5194/esd-9-91-2018, 2018.
Fearon, M. G., Doyle, J. D., Ryglicki, D. R., Finocchio, P. M., and Sprenger, M.: The Role of Cyclones in Moisture Transport into the Arctic, Geophys. Res. Lett., 48, e2020GL090353, https://doi.org/10.1029/2020GL090353, 2021.
Gelaro, R., McCarty, W., Suárez, M. J., Todling, R., Molod, A., Takacs, L., Randles, C. A., Darmenov, A., Bosilovich, M. G., Reichle, R., Wargan, K., Coy, L., Cullather, R., Draper, C., Akella, S., Buchard, V., Conaty, A., da Silva, A. M., Gu, W., Kim, G. K., Koster, R., Lucchesi, R., Merkova, D., Nielsen, J. E., Partyka, G., Pawson, S., Putman, W., Rienecker, M., Schubert, S. D., Sienkiewicz, M., and Zhao, B.: The modern-era retrospective analysis for research and applications, version 2 (MERRA-2), J. Climate, 30, 5419–5454, https://doi.org/10.1175/JCLI-D-16-0758.1, 2017.
Goldenson, N., Leung, L. R., Bitz, C. M., and Blanchard-Wrigglesworth, E.: Influence of atmospheric rivers on mountain snowpack in the western United States, J. Climate, 31, 9921–9940, https://doi.org/10.1175/JCLI-D-18-0268.1, 2018.
Gong, T. and Luo, D.: Ural blocking as an amplifier of the Arctic sea ice decline in winter, J. Climate, 30, 2639–2654, https://doi.org/10.1175/JCLI-D-16-0548.1, 2017.
Gorodetskaya, I. V., Tsukernik, M., Claes, K., Ralph, M. F., Neff, W. D., and Van Lipzig, N. P. M.: The role of atmospheric rivers in anomalous snow accumulation in East Antarctica, Geophys. Res. Lett., 41, 6199–6206, https://doi.org/10.1002/2014GL060881, 2014.
Graham, R. M., Cohen, L., Ritzhaupt, N., Segger, B., Graversen, R. G., Rinke, A., Walden, V. P., Granskog, M. A., and Hudson, S. R.: Evaluation of six atmospheric reanalyses over Arctic sea ice from winter to early summer, J. Climate, 32, 4121–4143, https://doi.org/10.1175/JCLI-D-18-0643.1, 2019a.
Graham, R. M., Hudson, S. R., and Maturilli, M.: Improved Performance of ERA5 in Arctic Gateway Relative to Four Global Atmospheric Reanalyses, Geophys. Res. Lett., 46, 6138–6147, https://doi.org/10.1029/2019GL082781, 2019b.
Graversen, R. G. and Wang, M.: Polar amplification in a coupled climate model with locked albedo, Clim. Dynam., 33, 629–643, https://doi.org/10.1007/s00382-009-0535-6, 2009.
Graversen, R. G., Mauritsen, T., Tjernström, M., Källén, E., and Svensson, G.: Vertical structure of recent Arctic warming, Nature, 451, 53–56, https://doi.org/10.1038/nature06502, 2008.
Guan, B. and Waliser, D. E.: Detection of atmospheric rivers: Evaluation and application of an algorithm for global studies, J. Geophys. Res., 120, 12514–12535, https://doi.org/10.1002/2015JD024257, 2015.
Guan, B. and Waliser, D. E.: Tracking Atmospheric Rivers Globally: Spatial Distributions and Temporal Evolution of Life Cycle Characteristics, J. Geophys. Res.-Atmos., 124, 12523–12552, https://doi.org/10.1029/2019JD031205, 2019.
Guan, B., Waliser, D. E., Ralph, F. M., Fetzer, E. J., and Neiman, P. J.: Hydrometeorological characteristics of rain-on-snow events associated with atmospheric rivers, Geophys. Res. Lett., 43, 2964–2973, https://doi.org/10.1002/2016GL067978, 2016.
Guo, Y., Shinoda, T., Guan, B., Waliser, D. E., and Chang, E. K. M.: Statistical relationship between atmospheric rivers and extratropical cyclones and anticyclones, J. Climate, 33, 7817–7834, https://doi.org/10.1175/JCLI-D-19-0126.1, 2020.
Hall, A.: The role of surface albedo feedback in climate, J. Climate, 17, 1550–1568, https://doi.org/10.1175/1520-0442(2004)017<1550:TROSAF>2.0.CO;2, 2004.
Hastie, T. and Stuetzle, W.: Principal curves, J. Am. Stat. A., 84, 502–516, https://doi.org/10.1080/01621459.1989.10478797, 1989.
Hegyi, B. M. and Taylor, P. C.: The unprecedented 2016–2017 Arctic sea ice growth season: the crucial role of atmospheric rivers and longwave fluxes, Geophys. Res. Lett., 45, 5204–5212, 2018.
Herrmannsdörfer, L., Müller, M., Shupe, M. D., and Rostosky, P.: Surface temperature comparison of the Arctic winter MOSAiC observations, ERA5 reanalysis, and MODIS satellite retrieval, Elementa, 11, 00085, https://doi.org/10.1525/elementa.2022.00085, 2023.
Hersbach, H., Bell, B., Berrisford, P., Hirahara, S., Horányi, A., Muñoz-Sabater, J., Nicolas, J., Peubey, C., Radu, R., Schepers, D., Simmons, A., Soci, C., Abdalla, S., Abellan, X., Balsamo, G., Bechtold, P., Biavati, G., Bidlot, J., Bonavita, M., De Chiara, G., Dahlgren, P., Dee, D., Diamantakis, M., Dragani, R., Flemming, J., Forbes, R., Fuentes, M., Geer, A., Haimberger, L., Healy, S., Hogan, R. J., Hólm, E., Janisková, M., Keeley, S., Laloyaux, P., Lopez, P., Lupu, C., Radnoti, G., de Rosnay, P., Rozum, I., Vamborg, F., Villaume, S., and Thépaut, J. N.: The ERA5 global reanalysis, Q. J. Roy. Meteor. Soc., 146, 1999–2049, https://doi.org/10.1002/qj.3803, 2020.
Hersbach, H., Bell, B., Berrisford, P., Biavati, G., Horányi, A., Muñoz Sabater, J., Nicolas, J., Peubey, C., Radu, R., Rozum, I., Schepers, D., Simmons, A., Soci, C., Dee, D., and Thépaut, J.-N.: ERA5 hourly data on single levels from 1940 to present, Copernicus Climate Change Service (C3S) Climate Data Store (CDS) [data set], https://doi.org/10.24381/cds.adbb2d47, 2023.
Huang, Y., Dong, X., Bailey, D. A., Holland, M. M., Xi, B., DuVivier, A. K., Kay, J. E., Landrum, L. L., and Deng, Y.: Thicker Clouds and Accelerated Arctic Sea Ice Decline: The Atmosphere-Sea Ice Interactions in Spring, Geophys. Res. Lett., 46, 6980–6989, https://doi.org/10.1029/2019GL082791, 2019a.
Huang, Y., Dong, X., Xi, B., and Deng, Y.: A survey of the atmospheric physical processes key to the onset of Arctic sea ice melt in spring, Clim. Dynam., 52, 4907–4922, https://doi.org/10.1007/s00382-018-4422-x, 2019b.
Kim, B. M., Hong, J. Y., Jun, S. Y., Zhang, X., Kwon, H., Kim, S. J., Kim, J. H., Kim, S. W., and Kim, H. K.: Major cause of unprecedented Arctic warming in January 2016: Critical role of an Atlantic windstorm, Sci. Rep., 7, 40051, https://doi.org/10.1038/srep40051, 2017.
Lee, S., Gong, T., Feldstein, S. B., Screen, J. A., and Simmonds, I.: Revisiting the Cause of the 1989–2009 Arctic Surface Warming Using the Surface Energy Budget: Downward Infrared Radiation Dominates the Surface Fluxes, Geophys. Res. Lett., 44, 10654–10661, https://doi.org/10.1002/2017GL075375, 2017.
Ma, W., Chen, G., and Guan, B.: Poleward Shift of Atmospheric Rivers in the Southern Hemisphere in Recent Decades, Geophys. Res. Lett., 47, e2020GL089934, https://doi.org/10.1029/2020GL089934, 2020.
Ma, W., Chen, G., Peings, Y., and Alviz, N.: Atmospheric River Response to Arctic Sea Ice Loss in the Polar Amplification Model Intercomparison Project, Geophys. Res. Lett., 48, e2021GL094883, https://doi.org/10.1029/2021GL094883, 2021.
Ma, W., Wang, H., Chen, G., Qian, Y., Baxter, I., Huo, Y., and Seefeldt, M. W.: Wintertime extreme warming events in the high Arctic: characteristics, drivers, trends, and the role of atmospheric rivers, Atmos. Chem. Phys., 24, 4451–4472, https://doi.org/10.5194/acp-24-4451-2024, 2024.
Mattingly, K. S., Mote, T. L., and Fettweis, X.: Atmospheric River Impacts on Greenland Ice Sheet Surface Mass Balance, J. Geophys. Res.-Atmos., 123, 8538–8560, https://doi.org/10.1029/2018JD028714, 2018.
Mattingly, K. S., Mote, T. L., Fettweis, X., As, D. V. A. N., Tricht, K. V. A. N., Lhermitte, S., Pettersen, C., and Fausto, R. S.: Strong summer atmospheric rivers trigger Greenland ice sheet melt through spatially varying surface energy balance and cloud regimes, J. Climate, 33, 6809–6832, https://doi.org/10.1175/JCLI-D-19-0835.1, 2020.
Mattingly, K. S., Turton, J. V., Wille, J. D., Noël, B., Fettweis, X., Rennermalm, Å. K., and Mote, T. L.: Increasing extreme melt in northeast Greenland linked to foehn winds and atmospheric rivers, Nat. Commun., 14, 1743, https://doi.org/10.1038/s41467-023-37434-8, 2023.
Miller, N. B., Shupe, M. D., Cox, C. J., Walden, V. P., Turner, D. D., and Steffen, K.: Cloud radiative forcing at Summit, Greenland, J. Climate, 28, 6267–6280, https://doi.org/10.1175/JCLI-D-15-0076.1, 2015.
Mortin, J., Svensson, G., Graversen, R. G., Kapsch, M. L., Stroeve, J. C., and Boisvert, L. N.: Melt onset over Arctic sea ice controlled by atmospheric moisture transport, Geophys. Res. Lett., 43, 6636–6642, https://doi.org/10.1002/2016GL069330, 2016.
Murto, S., Papritz, L., Messori, G., Caballero, R., Svensson, G., and Wernli, H.: Extreme Surface Energy Budget Anomalies in the High Arctic in Winter, J. Climate, 36, 3591–3609, https://doi.org/10.1175/JCLI-D-22-0209.1, 2023.
Nash, D., Waliser, D., Guan, B., Ye, H., and Ralph, F. M.: The Role of Atmospheric Rivers in Extratropical and Polar Hydroclimate, J. Geophys. Res.-Atmos., 123, 6804–6821, https://doi.org/10.1029/2017JD028130, 2018.
Neff, W.: Atmospheric rivers melt Greenland, Nat. Clim. Chang., 8, 857–858, 2018.
Neff, W., Compo, G. P., Ralph, F. M., and Shupe, M. D.: Continental heat anomalies and the extreme melting of the Greenland ice surface in 2012 and 1889, J. Geophys. Res., 119, 6520–6536, https://doi.org/10.1002/2014JD021470, 2014.
Neiman, P. J., Ralph, F. M., Wick, G. A., Lundquist, J. D., and Dettinger, M. D.: Meteorological characteristics and overland precipitation impacts of atmospheric rivers affecting the West coast of North America based on eight years of SSM/I satellite observations, J. Hydrometeorol., 9, 22–47, https://doi.org/10.1175/2007JHM855.1, 2008.
Papritz, L., Murto, S., Röthlisberger, M., Caballero, R., Messori, G., Svensson, G., and Wernli, H.: The Role of Local and Remote Processes for Wintertime Surface Energy Budget Extremes over Arctic Sea Ice, J. Climate, 36, 7657–7674, https://doi.org/10.1175/JCLI-D-22-0883.1, 2023.
Park, D.-S. R., Lee, S., and Feldstein, S. B.: Attribution of the Recent Winter Sea Ice Decline over the Atlantic Sector of the Arctic Ocean, J. Climate, 28, 4027–4033, https://doi.org/10.1175/jcli-d-15-0042.1, 2015a.
Park, H. S., Lee, S., Son, S. W., Feldstein, S. B., and Kosaka, Y.: The impact of poleward moisture and sensible heat flux on arctic winter sea ice variability, J. Climate, 28, 5030–5040, https://doi.org/10.1175/JCLI-D-15-0074.1, 2015b.
Persson, P. O. G., Shupe, M. D., Perovich, D., and Solomon, A.: Linking atmospheric synoptic transport, cloud phase, surface energy fluxes, and sea-ice growth: observations of midwinter SHEBA conditions, Clim. Dynam., 49, 1341–1364, https://doi.org/10.1007/s00382-016-3383-1, 2017.
Pithan, F. and Mauritsen, T.: Arctic amplification dominated by temperature feedbacks in contemporary climate models, Nat. Geosci., 7, 181–184, https://doi.org/10.1038/ngeo2071, 2014.
Polyakov, I. V., Alekseev, G. V., Bekryaev, R. V., Bhatt, U., Colony, R. L., Johnson, M. A., Karklin, V. P., Makshtas, A. P., Walsh, D., and Yulin, A. V.: Observationally based assessment of polar amplification of global warming, Geophys. Res. Lett., 29, 25-1–25-4, https://doi.org/10.1029/2001GL011111, 2002.
Ralph, F. M., Neiman, P. J., and Wick, G. A.: Satellite and CALJET aircraft observations of atmospheric rivers over the Eastern North Pacific Ocean during the winter of 1997/98, Mon. Weather Rev., 132, 1721–1745, https://doi.org/10.1175/1520-0493(2004)132<1721:SACAOO>2.0.CO;2, 2004.
Ralph, F. M., Neiman, P. J., Wick, G. A., Gutman, S. I., Dettinger, M. D., Cayan, D. R., and White, A. B.: Flooding on California's Russian River: Role of atmospheric rivers, Geophys. Res. Lett., 33, https://doi.org/10.1029/2006GL026689, 2006.
Ralph, F. M., Dettinger, M. C. L. D., Cairns, M. M., Galarneau, T. J., and Eylander, J.: Defining “Atmospheric river”: How the glossary of meteorology helped resolve a debate, B. Am. Meteorol. Soc., 99, 837–839, https://doi.org/10.1175/BAMS-D-17-0157.1, 2018.
Screen, J. A. and Simmonds, I.: The central role of diminishing sea ice in recent Arctic temperature amplification, Nature, 464, 1334–1337, https://doi.org/10.1038/nature09051, 2010.
Serreze, M. C. and Barry, R. G.: Processes and impacts of Arctic amplification: A research synthesis, Glob. Planet. Change, 77, 85–96, https://doi.org/10.1016/j.gloplacha.2011.03.004, 2011.
Serreze, M. C. and Francis, J. A.: The arctic amplification debate, Clim. Change, 76, 241–264, https://doi.org/10.1007/s10584-005-9017-y, 2006.
Serreze, M. C., Barrett, A. P., Slater, A. G., Steele, M., Zhang, J., and Trenberth, K. E.: The large-scale energy budget of the Arctic, J. Geophys. Res.-Atmos., 112, D11122, https://doi.org/10.1029/2006JD008230, 2007.
Serreze, M. C., Barrett, A. P., Stroeve, J. C., Kindig, D. N., and Holland, M. M.: The emergence of surface-based Arctic amplification, The Cryosphere, 3, 11–19, https://doi.org/10.5194/tc-3-11-2009, 2009.
Shields, C. A., Rutz, J. J., Leung, L.-Y., Ralph, F. M., Wehner, M., Kawzenuk, B., Lora, J. M., McClenny, E., Osborne, T., Payne, A. E., Ullrich, P., Gershunov, A., Goldenson, N., Guan, B., Qian, Y., Ramos, A. M., Sarangi, C., Sellars, S., Gorodetskaya, I., Kashinath, K., Kurlin, V., Mahoney, K., Muszynski, G., Pierce, R., Subramanian, A. C., Tome, R., Waliser, D., Walton, D., Wick, G., Wilson, A., Lavers, D., Prabhat, Collow, A., Krishnan, H., Magnusdottir, G., and Nguyen, P.: Atmospheric River Tracking Method Intercomparison Project (ARTMIP): project goals and experimental design, Geosci. Model Dev., 11, 2455–2474, https://doi.org/10.5194/gmd-11-2455-2018, 2018.
Shields, C. A., Wille, J. D., Marquardt Collow, A. B., Maclennan, M., and Gorodetskaya, I. V.: Evaluating Uncertainty and Modes of Variability for Antarctic Atmospheric Rivers, Geophys. Res. Lett., 49, e2022GL099577, https://doi.org/10.1029/2022GL099577, 2022.
Shindell, D. and Faluvegi, G.: Climate response to regional radiative forcing during the twentieth century, Nat. Geosci., 2, 294–300, https://doi.org/10.1038/ngeo473, 2009.
Shupe, M. D. and Intrieri, J. M.: Cloud radiative forcing of the Arctic surface: The influence of cloud properties, surface albedo, and solar zenith angle, J. Climate, 17, 616–628, https://doi.org/10.1175/1520-0442(2004)017<0616:CRFOTA>2.0.CO;2, 2004.
Shupe, M. D., Rex, M., Blomquist, B., Persson, P. O. G., Schmale, J., Uttal, T., Althausen, D., Angot, H., Archer, S., Bariteau, L., Beck, I., Bilberry, J., Bucci, S., Buck, C., Boyer, M., Brasseur, Z., Brooks, I. M., Calmer, R., Cassano, J., Castro, V., Chu, D., Costa, D., Cox, C. J., Creamean, J., Crewell, S., Dahlke, S., Damm, E., Boer, G. de, Deckelmann, H., Dethloff, K., Dütsch, M., Ebell, K., Ehrlich, A., Ellis, J., Engelmann, R., Fong, A. A., Frey, M. M., Gallagher, M. R., Ganzeveld, L., Gradinger, R., Graeser, J., Greenamyer, V., Griesche, H., Griffiths, S., Hamilton, J., Heinemann, G., Helmig, D., Herber, A., Heuzé, C., Hofer, J., Houchens, T., Howard, D., Inoue, J., Jacobi, H.-W., Jaiser, R., Jokinen, T., Jourdan, O., Jozef, G., King, W., Kirchgaessner, A., Klingebiel, M., Krassovski, M., Krumpen, T., Lampert, A., Landing, W., Laurila, T., Lawrence, D., Lonardi, M., Loose, B., Lüpkes, C., Maahn, M., Macke, A., Maslowski, W., Marsay, C., Maturilli, M., Mech, M., Morris, S., Moser, M., Nicolaus, M., Ortega, P., Osborn, J., Pätzold, F., Perovich, D. K., Petäjä, T., Pilz, C., Pirazzini, R., Posman, K., Powers, H., Pratt, K. A., Preußer, A., Quéléver, L., Radenz, M., Rabe, B., Rinke, A., Sachs, T., Schulz, A., Siebert, H., Silva, T., Solomon, A., Sommerfeld, A., Spreen, G., Stephens, M., Stohl, A., Svensson, G., Uin, J., Viegas, J., Voigt, C., von der Gathen, P., Wehner, B., Welker, J. M., Wendisch, M., Werner, M., Xie, Z., and Yue, F.: Overview of the MOSAiC expedition, Atmosphere, 10, 00060, https://doi.org/10.1525/elementa.2021.00060, 2022.
Taylor, P. C., Boeke, R. C., Boisvert, L. N., Feldl, N., Henry, M., Huang, Y., Langen, P. L., Liu, W., Pithan, F., Sejas, S. A., and Tan, I.: Process Drivers, Inter-Model Spread, and the Path Forward: A Review of Amplified Arctic Warming, Front. Earth Sci., 9, https://doi.org/10.3389/feart.2021.758361, 2022.
Tung, W., Barthur, A., Bowers, M. C., Song, Y., Gerth, J., and Cleveland, W. S.: Divide and recombine (D&R) data science projects for deep analysis of big data and high computational complexity, Japanese Journal of Statistics and Data Science, 1, 139–156, https://doi.org/10.1007/s42081-018-0008-4, 2018.
Tung, W., Zhang, C., and Cleveland, W. S.: Arctic Atmospheric River Labels and Climatology Based on 3-hourly ERA5 and MERRA-2 From 1980 to 2019, Purdue University Research Repository [data set], https://doi.org/10.4231/EHZ2-DP09, 2023.
Valkonen, E., Cassano, J., and Cassano, E.: Arctic Cyclones and Their Interactions With the Declining Sea Ice: A Recent Climatology, J. Geophys. Res.-Atmos., 126, e2020JD034366, https://doi.org/10.1029/2020JD034366, 2021.
Villamil-Otero, G. A., Zhang, J., He, J., and Zhang, X.: Role of extratropical cyclones in the recently observed increase in poleward moisture transport into the Arctic Ocean, Adv. Atmos. Sci., 35, 85–94, https://doi.org/10.1007/s00376-017-7116-0, 2018.
Webster, M. A., Parker, C., Boisvert, L., and Kwok, R.: The role of cyclone activity in snow accumulation on Arctic sea ice, Nat. Commun., 10, https://doi.org/10.1038/s41467-019-13299-8, 2019.
Wille, J. D., Favier, V., Dufour, A., Gorodetskaya, I. V., Turner, J., Agosta, C., and Codron, F.: West Antarctic surface melt triggered by atmospheric rivers, Nat Geosci, 12, 5285, https://doi.org/10.1038/s41561-019-0460-1, 2019.
Wille, J. D., Favier, V., Gorodetskaya, I. V., Agosta, C., Kittel, C., Beeman, J. C., Jourdain, N. C., Lenaerts, J. T. M., and Codron, F.: Antarctic Atmospheric River Climatology and Precipitation Impacts, J. Geophys. Res.-Atmos., 126, e2020JD033788, https://doi.org/10.1029/2020JD033788, 2021.
Wille, J. D., Alexander, S. P., Amory, C., Baiman, R., Barthélemy, L., Bergstrom, D. M., Berne, A., Binder, H., Blanchet, J., Bozkurt, D., Bracegirdle, T. J., Casado, M., Choi, T., Clem, K. R., Codron, F., Datta, R., Di Battista, S., Favier, V., Francis, D., Fraser, A. D., Fourré, E., Garreaud, R. D., Genthon, C., Gorodetskaya, I. V., González-Herrero, S., Heinrich, V. J., Hubert, G., Joos, H., Kim, S. J., King, J. C., Kittel, C., Landais, A., Lazzara, M., Leonard, G. H., Lieser, J. L., Maclennan, M., Mikolajczyk, D., Neff, P., Ollivier, I., Picard, G., Pohl, B., Ralph, F. M., Rowe, P., Schlosser, E., Shields, C. A., Smith, I. J., Sprenger, M., Trusel, L., Udy, D., Vance, T., Vignon, É., Walker, C., Wever, N., and Zou, X.: The Extraordinary March 2022 East Antarctica “Heat” Wave. Part I: Observations and Meteorological Drivers, J. Climate, 37, 757–778, https://doi.org/10.1175/JCLI-D-23-0175.1, 2024a.
Wille, J. D., Alexander, S. P., Amory, C., Baiman, R., Barthélemy, L., Bergstrom, D. M., Berne, A., Binder, H., Blanchet, J., Bozkurt, D., Bracegirdle, T. J., Casado, M., Choi, T., Clem, K. R., Codron, F., Datta, R., Di Battista, S., Favier, V., Francis, D., Fraser, A. D., Fourré, E., Garreaud, R. D., Genthon, C., Gorodetskaya, I. V., González-Herrero, S., Heinrich, V. J., Hubert, G., Joos, H., Kim, S. J., King, J. C., Kittel, C., Landais, A., Lazzara, M., Leonard, G. H., Lieser, J. L., Maclennan, M., Mikolajczyk, D., Neff, P., Ollivier, I., Picard, G., Pohl, B., Ralph, F. M., Rowe, P., Schlosser, E., Shields, C. A., Smith, I. J., Sprenger, M., Trusel, L., Udy, D., Vance, T., Vignon, É., Walker, C., Wever, N., and Zou, X.: The Extraordinary March 2022 East Antarctica “Heat” Wave. Part II: Impacts on the Antarctic Ice Sheet, J. Climate, 37, 779–799, https://doi.org/10.1175/JCLI-D-23-0176.1, 2024b.
Woods, C. and Caballero, R.: The role of moist intrusions in winter Arctic warming and sea ice decline, J. Climate, 29, 4473–4485, 2016.
Woods, C., Caballero, R., and Svensson, G.: Large-scale circulation associated with moisture intrusions into the Arctic during winter, Geophys. Res. Lett., 40, 4717–4721, https://doi.org/10.1002/grl.50912, 2013.
Zhang, C., Tung, W. W., and Cleveland, W. S.: In Search of the Optimal Atmospheric River Index for US Precipitation: A Multifactorial Analysis, J. Geophys. Res.-Atmos., 126, e2020JD033667, https://doi.org/10.1029/2020JD033667, 2021a.
Zhang, C., Tung, W., and Cleveland, W. S.: Climatology and decadal changes of Arctic atmospheric rivers based on ERA5 and MERRA-2, Environ. Res.-Climate, 2, 035005, https://doi.org/10.1088/2752-5295/acdf0f, 2023a.
Zhang, P., Chen, G., Ting, M., Ruby Leung, L., Guan, B., and Li, L.: More frequent atmospheric rivers slow the seasonal recovery of Arctic sea ice, Nat. Clim. Chang., 13, 266–273, 2023b.
Zhang, R., Wang, H., Fu, Q., Pendergrass, A. G., Wang, M., Yang, Y., Ma, P. L., and Rasch, P. J.: Local Radiative Feedbacks Over the Arctic Based on Observed Short-Term Climate Variations, Geophys. Res. Lett., 45, 5761–5770, https://doi.org/10.1029/2018GL077852, 2018.
Zhang, R., Wang, H., Fu, Q., Rasch, P. J., Wu, M., and Maslowski, W.: Understanding the Cold Season Arctic Surface Warming Trend in Recent Decades, Geophys. Res. Lett., 48, e2021GL094878, https://doi.org/10.1029/2021GL094878, 2021b.
Zhang, Z., Ralph, F. M., and Zheng, M.: The Relationship Between Extratropical Cyclone Strength and Atmospheric River Intensity and Position, Geophys. Res. Lett., 46, 1814–1823, https://doi.org/10.1029/2018GL079071, 2019.
- Abstract
- Introduction
- Data and methods
- AR occurrence frequency
- ARs' influence on the surface energy budget components of the Arctic
- ARs' surface impacts
- Uncertainties and limitations
- Conclusions
- Code and data availability
- Author contributions
- Competing interests
- Disclaimer
- Acknowledgements
- Financial support
- Review statement
- References
- Supplement