the Creative Commons Attribution 4.0 License.
the Creative Commons Attribution 4.0 License.
 | 10 Oct 2025
Exploring the Greenland Ice Sheet’s response to future atmospheric warming-threshold scenarios over 200 years
Alison Delhasse
Christoph Kittel
Johanna Beckmann
The Greenland Ice Sheet (GrIS) plays a crucial role in sea level rise (SLR). We investigate its response to warming thresholds over two centuries using a coupled regional-atmospheric ice sheet model (MAR-PISM, respectively run at 25 and 4.5 km resolutions). We explore responses to global atmospheric temperature increases from +0.6 to +5.8 °C since the pre-industrial period and assess GrIS recovery if the climate reverts to present conditions, while prescribing unchanged ocean conditions. Our study focuses exclusively on evaluating the effect of atmospheric changes on the Greenland Ice Sheet without considering oceanic warming. Moderate atmospheric warmings (+0.6 to +1.4 °C) yield steady and similar SLR contributions (from +8.35 to +9.55 cm in 2200), close to levels already committed under the present climate. Global temperature increases beyond +1.4 °C mark a critical threshold, triggering non-linear mass loss due to feedback mechanisms like the melt–albedo effect and firn saturation. The SLR increase between the +1.4 and +2.3 °C experiments is larger (+7.56 cm), highlighting an accelerating mass loss. This trend is further reinforced by the even greater increase of 15.51 cm between +4.4 and +5.2 °C, underscoring the amplified impact of higher warming levels. Reversing the climate after surpassing +2.3 °C demonstrates the potential for a substantial slowdown in GrIS mass loss, indicating a trend toward stabilization at a reduced state (approximately 4 % smaller). These findings underscore the impact of thresholds and time spent above them, highlighting the importance of limiting anthropogenic warming to mitigate GrIS mass loss and the long-term SLR associated with it.
- Article
(2607 KB) - Full-text XML
-
Supplement
(1989 KB) - BibTeX
- EndNote


Melting of large land ice areas, such as the Greenland Ice Sheet (GrIS), is having a significant impact on sea levels. Recent higher temperatures – amplified by Arctic amplification (Fettweis et al., 2017; Bevis et al., 2019) – along with reduced cloud cover (Hofer et al., 2017) and persistent atmospheric blocking events (Seo et al., 2015; Hanna et al., 2018; Tedesco and Fettweis, 2020; Hahn et al., 2020), have led to an around 7-fold increase in GrIS mass loss when comparing rates from the 1980s to those observed between 2010 and 2020 (Mouginot et al., 2019; Otosaka et al., 2023). Mass loss projections for the end of the 21st century suggest a strong dependence on future warming scenarios (Goelzer et al., 2020), while large uncertainties remain regarding persistent blocking atmospheric conditions (Delhasse et al., 2021) and their potential impact on increased mass loss (Beckmann and Winkelmann, 2023). In the longer term, and under scenarios of even higher temperatures, ice losses could become irreversible or cause the ice sheet's disappearance (Aschwanden et al., 2019; Greve and Chambers, 2022).
The future of the GrIS is uncertain in the context of global warming. Various studies have attempted to determine the temperature threshold at which mass loss becomes irreversible or whether it is possible to reach new stable states. On thousand-year timescales, a rise in global temperatures between +1.5 and +2.3 °C since the pre-industrial period could already lead to irreversible mass loss (Pattyn et al., 2018; Zeitz et al., 2022; Bochow et al., 2023). However, broader thresholds have been suggested, ranging from +1.5 to +3.0 °C (McKay et al., 2022), with higher thresholds such as +3.4 °C identified in a more recent study (Petrini et al., 2025). Despite the existence of positive feedbacks such as the melt–elevation feedback, where melt thins the ice sheet, exposing it to higher air temperature and thus leading to enhanced melt, the complete disappearance of the ice sheet would require several (possibly tens of) millennia (Robinson et al., 2012). Furthermore, due to the inertia of the GrIS (Applegate et al., 2015; Gregory et al., 2020), it could be possible to exceed the maximum threshold temperature, provided that the climate cools quickly again (Ridley et al., 2010). This challenges the notion of a single threshold value, as the timescale of exposure to this threshold plays a crucial role in determining the ice sheet response.
Previous studies have a variety of shortcomings. Some studies (Zeitz et al., 2022; Bochow et al., 2023) employ standalone ice sheet models, ignoring, i.e., temperature and precipitation feedbacks between the ice sheet and the atmosphere (Le clec'h et al., 2019). Other studies use Earth system models with interactive ice sheets (e.g., Vizcaino et al., 2015; Muntjewerf et al., 2020); while these models capture crucial feedbacks, their resolution of the atmosphere is often too coarse to accurately resolve precipitation patterns associated with complex high-elevation topography (Fettweis et al., 2020). Polar-oriented regional climate models, by contrast, employ much higher resolutions than Earth system models, allowing for a more accurate representation of the ice sheet slope and its influence on precipitation or winds influencing surface melt (Delhasse et al., 2024a). They also incorporate advanced surface schemes that simulate snow and ice evolution more precisely, resulting in improved simulation of surface properties (Lenaerts et al., 2019; Fettweis et al., 2020). However, they lack the capability to simulate ice sheet dynamics, a limitation that can be addressed when coupled with an ice sheet model.
In this study, we therefore use a fully coupled regional-atmospheric ice sheet model to evaluate the response of the GrIS to several atmospheric warming scenarios. We also investigate the ice sheet's response to an idealized reversion to the current climate after exceeding a high level of atmospheric warming to assess the inertia capacity of the system. Although using this fully coupled model limits our experiments to a 2-century timescale, it allows for insightful analysis over this shorter, yet policy-relevant and closer to climate change mitigation, time frame.
To evaluate the response of the GrIS to climate change and define its irreversible melting temperature threshold, we perform several experiments using the polar-oriented regional-atmospheric model Atmosphérique Régional Modèle (MAR v3.11.5, Fettweis et al., 2021; Delhasse et al., 2024a) coupled with the Parallel Ice Sheet Model (PISM; Khrulev et al., 2023). Using MAR to downscale coarse atmospheric forcing, combined with its sophisticated surface energy balance model, comes at a higher computational cost but results in a more realistic reproduction of surface mass balance (SMB) estimations (Fettweis et al., 2020). Previous similar studies (e.g., Pattyn et al., 2018; Noël et al., 2021) neglect fundamental processes, such as the melt–albedo and melt–elevation feedbacks or the effects of changing slopes on precipitation. The coupling between MAR and PISM enables the representation of these processes but is computationally more expensive. The coupling consists of updating the surface topography and ice mask calculated by PISM in MAR and updating the SMB and the surface temperature calculated by MAR in PISM each year with an internal time step of 180 s for the atmospheric model and an adaptive time step for the ice sheet model to ensure numerical stability. We initiated the PISM experiments in 1961, applying 30 years of constant MAR forcing prior to the start of coupling in 1991. All coupling-specific details and the description of both models can be found in Delhasse et al. (2024a). The spatial resolutions of the models are the same (25 km for MAR and 4.5 km for PISM), as well as the model configurations described in this paper. We used a 4.5 km resolution, which reasonably captures atmosphere–ice interactions while balancing computational efficiency, as higher resolutions primarily benefit ice–ocean interaction studies (Beckmann et al., 2019; Rückamp et al., 2020) not considered here (constant ocean conditions). Note that calving is represented using the von Mises calving law (Morlighem et al., 2016) enabling the ice front to retreat if the stress is larger than the von Mises threshold of 1×10⁶ Pa (Delhasse et al., 2024a). We do not account for glacial isostatic adjustment, which is justified by the 200-year timescale considered here (Zeitz et al., 2022).
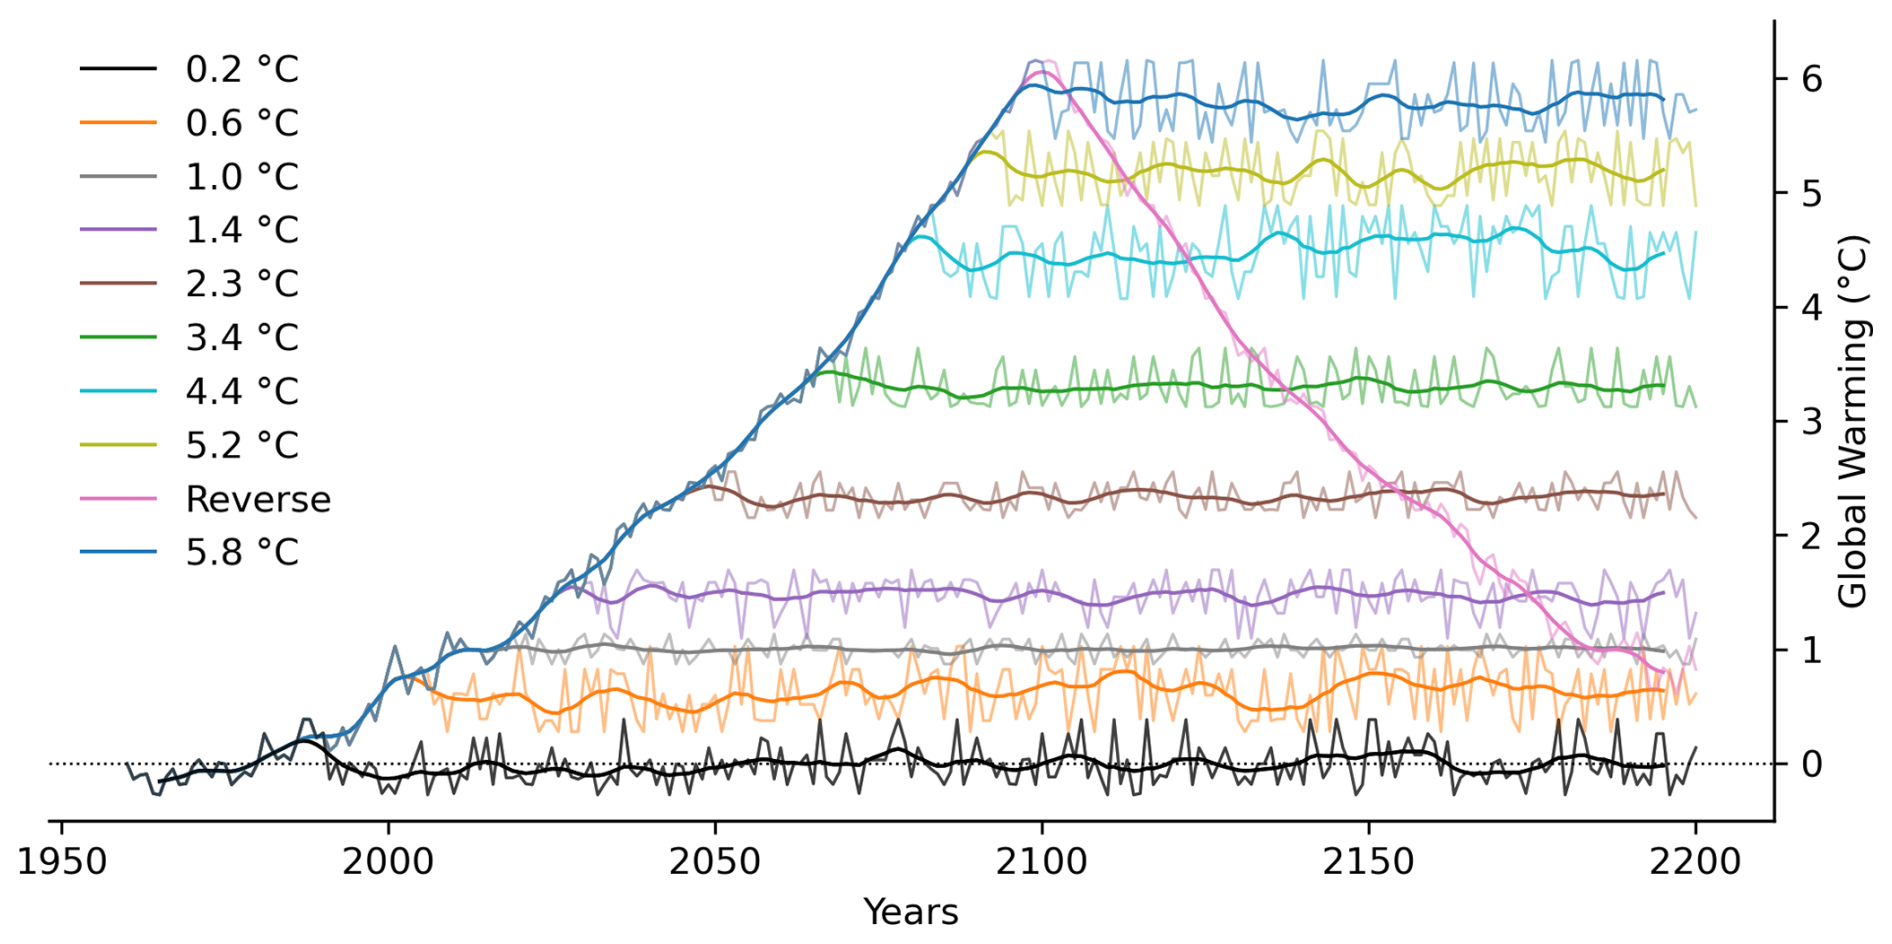
Figure 1CESM2 global near-surface (2 m temperature) warming (°C) compared to 1850–1950 (pre-industrial temperatures) for the 10 experiments of MAR-PISM coupling until 2200. Bold lines are 11-year running means.
The experiments rely on stabilized warming at nine atmospheric temperature thresholds, ranging from +0.2 to +5.8 °C relative to pre-industrial levels (1850–1950), each defined based on a 10-year running mean of global temperature (Fig. 1). The climate and different warming rates are derived from a Community Earth System Model version 2 (CESM2; Danabasoglu et al., 2020) simulation under the SSP5-8.5 scenario until 2100. We selected CESM2 due to its high climate sensitivity, making it one of the most responsive models within the sixth phase of the Coupled Model Intercomparison Project (the equilibrium climate sensitivity of CESM2 is +5.2 °C compared to the ensemble mean of +3.2 °C; Meehl et al., 2020). This choice makes it possible to explore an extreme (very warm) future scenario for the GrIS by 2100. To extend the projections to 2200, we randomly sampled individual years from the 10-year period used to define each warming threshold, thereby maintaining a constant mean warming while preserving year-to-year climate variability. The 10-year periods, the exact resulting mean temperature, and the corresponding near-surface regional warming around Greenland are described in the Supplement (Table S1). The +5.8 °C experiment corresponds to the 2-way coupled experiment analyzed in Delhasse et al. (2024a). We added a last experiment by reversing the large-scale climate forcing from 2100 to 2000 branching from the +5.8 °C experiment in 2100 (hereafter the “reverse” experiment, in pink in Fig. 1). The year 2101 in our study aligns with the CESM2 forcing from 2099, while 2102 corresponds to 2098, and so on. Consequently, the reverse year 2200 corresponds to climate conditions back in 2000. We considered the +0.2 °C experiment as a control run, as it corresponds to the reference climate (1961–1990) randomly sampled until 2200. We did not subtract the sea level rise (SLR) contribution from the control run, meaning that the ice sheet model drift (+5.75 cm by 2200, as shown in the +0.2 °C experiment) is included in the SLR estimates for all experiments.
Finally, we integrated the surface mass balance components over the ice sheet surface area of each experiment (meaning that the mask varies) because this represents the exact area where the ice sheet can accumulate or lose mass. Using a common mask (the smallest extension of the ice sheet in all our experiments) would remove part of the ablation area, artificially increasing the SMB for the low-warming simulations.
Since the pre-industrial era, global mean air temperatures have already reached our threshold of 1.4 °C (McCulloch et al., 2024), resulting in significant observed ice mass loss (Otosaka et al., 2023). Based on our results, global warming levels between +0.2 and +1.4 °C above pre-industrial temperatures correspond to a committed SLR of 8.35 to 9.55 cm in 2200 (Fig. 2a). For comparison, extrapolating the observed mass loss rate of the GrIS from 1980–2020 (169 ± 9 Gt yr−1; Otosaka et al., 2023) yields an equivalent sea level rise of 9.77 ± 0.52 cm by 2200, aligning with our results.
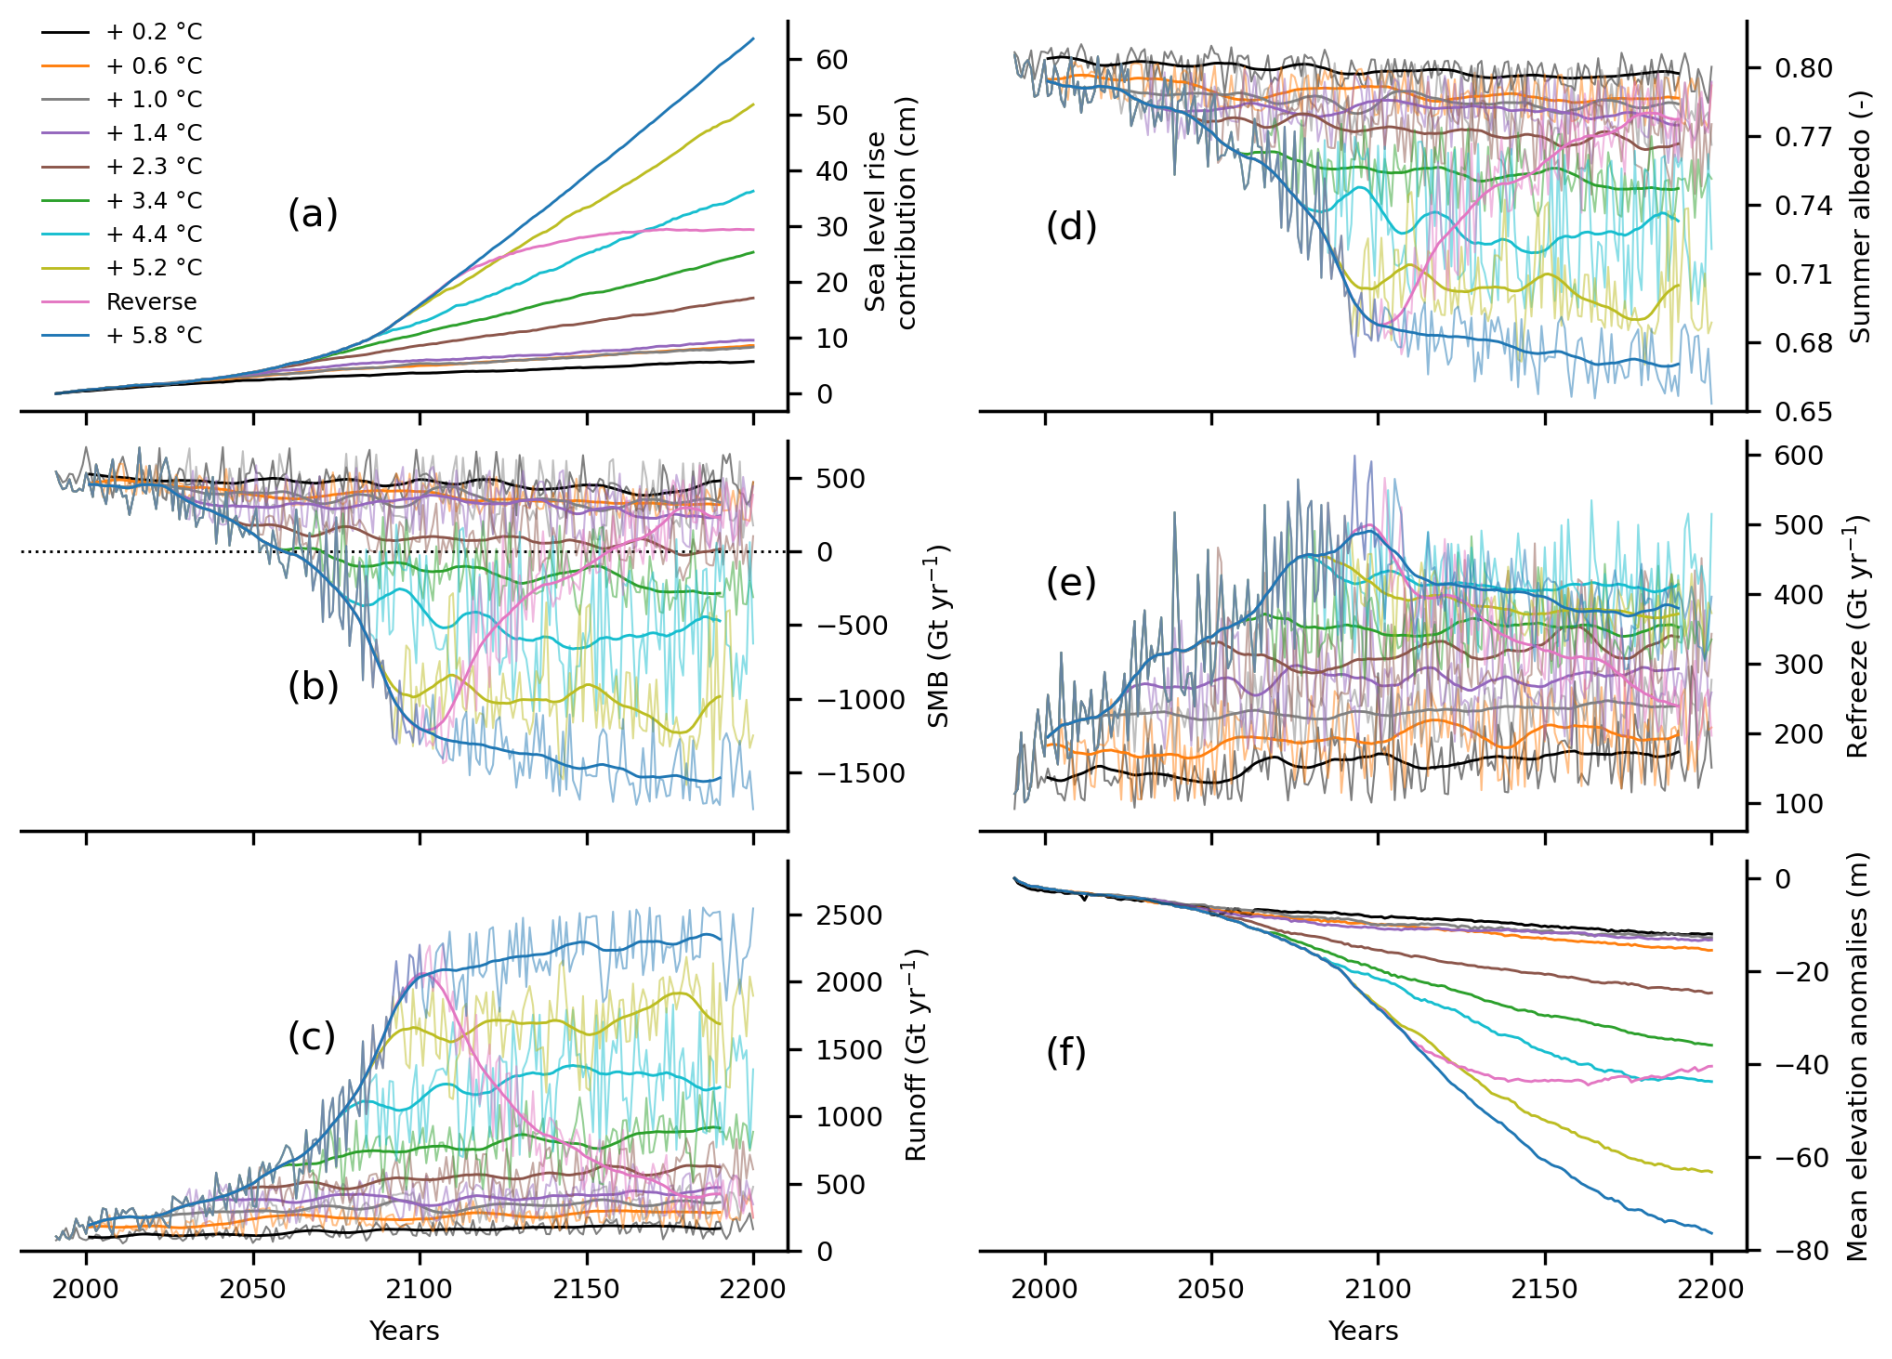
Figure 2Projected (a) contributions to sea level rise (cm), (b) SMB (Gt yr−1), (c) runoff (Gt yr−1), (d) summer albedo (–), (e) refreeze (Gt yr−1, melt + rainfall − runoff), and (f) mean elevation anomalies (m) compared to 1991, as simulated by MAR-PISM driven by different climate warmings of CESM2 by 2200. The thick lines represent the 21-year running mean (b–e).
Ice mass loss increases associated with +2.3 °C and warmer experiments present a non-linear answer to the stabilized level of temperature increase (Figs. 2a and S4). A regional increase of 1 °C in warming over Greenland, corresponding to global warming scenarios of +1.4 to +2.3 °C, leads to an additional 7.8 cm of sea level rise by 2200. In contrast, the same regional warming of 1 °C, occurring between the +4.4 and +5.2 °C global warming scenarios (representing less than 1 °C of global warming difference), results in a more substantial sea level rise of 15.5 cm by 2200.
The reverse experiment also depicts a positive contribution in 2200 (Fig. 2a). However, unlike other warming thresholds, reversing the climate projected by CESM2 over 100 years mitigates the GrIS mass loss near a stabilized contribution at the end of our projection. After branching in 2100, mass balance is negative for 60 years (i.e., positive sea level contribution, SLC) and positive afterward, with a slightly negative SLC (Fig. S1 in the Supplement). Although overshooting +2.3 °C can result in significant ice loss, our results suggest that further loss may be halted if this threshold is not exceeded for too many decades. The GrIS appears to approach a state of near-balance with reduced ice thickness and surface area. However, this smaller configuration implies that ice mass loss – and the resulting SLR – is irreversible, at least within policy-relevant timescales.
As warming intensifies, the mass balance increasingly depends on SMB, with a progressively smaller contribution from ice discharge through the grounding line. Over the present climate, the ice discharge is greater than the SMB in absolute terms, leading to a negative mass balance (Fig. S1). In all experiments, the ice discharge decreases significantly, especially for experiments warmer than +4.4 °C, where it becomes negligible compared to the surface-mass-balance-induced mass loss. The mass balance then roughly equals the SMB. Ice discharge is reduced due to the decrease in driving stress at the margins, which results from the stronger effect of margin thinning compared to the increase in slope, and the gradual inland retreat. Even in the reverse experiment, in which mass loss approaches stabilization, the SMB still dominates the mass balance, as the ice sheet does not re-expand. Additionally, we prescribe constant ocean forcings in all our experiments and do not simulate the effects of ocean warming on the ice dynamics, although the ice front can retreat following the von Mises law. Because this study focuses on the interaction between the atmosphere and the ice sheet, we will analyze SMB and atmosphere–ice sheet feedbacks in more detail to explain the GrIS response, first for the threshold experiments and then for the reverse experiment.
3.1 Overshoot experiments
The SMB decreases non-linearly until 2100, with noticeable accelerations around 2025 and 2050 (Fig. 2a). After the climate stabilizes, the SMB continues to decline but at a slower rate. Limiting the warming to 1.4 °C strongly reduces the mass loss and keeps the GrIS in relative stability from now until 2200. The +0.6, +1, and +1.4 °C experiments project a low decrease in SMB (from 120 to 210 Gt yr−1 compared to 1991) due to a limited increase in runoff, resulting in a relatively stable (yet positive) SLC. Up to +1.4 °C, the SMB, its components, and the ice sheet geometry (Fig. S2) are similar in 2200 to their branching state before 2050 (Figs. 2c and 3). A temperature increase above +2.3 °C leads to a greater increase in runoff, further reducing the SMB and resulting in significantly smaller ice geometries by 2200 compared to those projected under a +1.4 °C warming scenario. At the climate stabilization around +2.3 °C, the SMB is still positive (118 Gt yr−1) but eventually declines to 0 before 2200. The transition between +1.4 and +2.3 °C is then an important threshold, as at the ice sheet scale, losses through runoff will exceed snowfall accumulation, leading to severe mass loss. Previous studies have identified either a timing – between 2046 and 2058 (Hofer et al., 2020; Noël et al., 2021) – or a threshold temperature (around +2.7 °C; Noël et al., 2021) at which the SMB becomes negative, marking the onset of irreversible ice sheet decline. Beyond these thresholds, mass loss intensifies, driven by surface ablation exceeding snowfall accumulation, further exacerbated by dynamic losses through ice discharge. However, these studies do not account for ice sheet dynamics or surface feedbacks such as the melt–elevation feedback. Our findings (also supported by Robinson et al., 2012; Petrini et al., 2025) indicate that, when considering both factors, the temperature threshold is likely to occur at lower levels of warming than previously suggested – implying that the onset of sustained mass loss could also occur earlier in time.
A warmer stabilized climate does not result in a steady SMB for three main reasons: the melt–elevation feedback, the melt–albedo feedback, and the gradual saturation by liquid water of the firn. Ice melt thins the ice sheet, increases melt due to higher temperature associated with lower elevation, and strengthens again the ice sheet thinning. More melt also causes the albedo to decrease from bright snow to darker bare ice. This combines with the elevation feedback to strengthen melt. Finally, more melting saturates the firn, limiting the possibility of refreezing and leading to an increase in runoff, decreasing the SMB. Our projections highlight when these processes are triggered and suggest that they remain relatively weak for global temperature increases below +1.4 °C. Until this threshold, the decrease in SMB stays comparable to the committed change in SMB under the present climate. Once global temperature crosses the threshold, the non-linear response of the ice sheet to a regional warming of 1 °C over Greenland suggests strengthening of such feedbacks. These three potential feedback mechanisms and processes will be analyzed in the following paragraphs.
The mean albedo during summer exhibits an evolution similar to that of the SMB when stabilization of warming is applied: the albedo continues to decrease even under stable temperatures (Fig. 2d). As runoff continues to increase, more bare ice areas with water at the surface are exposed, leading to a darkening of the global surface. For the experiments with +0.6 to +2.3 °C, the albedo decreases by only 0.01 per 1 °C of regional warming, whereas for the +3.4 °C experiment (a 1 °C increase in regional Greenland warming compared to the +2.3 °C scenario), the albedo decreases by more than 0.02. This larger decline in albedo is projected to occur between 2050 and 2075 if warming is not stopped before 2100 (experiment +5.8 °C), amplifying the contrasts in albedo between the +3.4, +4.4, and +5.2 °C experiments. The +4.4 °C experiment also exhibits a significant interannual variability, likely driven by large fluctuations in the melt extent. As warming increases, the 0 °C isotherm rises to higher elevations where the ice sheet surface becomes flatter, resulting in larger interannual fluctuations in melt area. Because the minimum albedo for bare ice with liquid water at the surface in MAR is fixed at 0.45, none of our experiments have reached the point at which this feedback would cease during summer.
The response of refreezing differs across the various warming scenarios (Fig. 2e). For lower global warming levels (from +0.6 to +3.4 °C), when the regional temperature over Greenland rises by 1 °C, refreezing increases consistently across the first five experiments. However, for the +4.4 and +5.2 °C experiments, refreezing stops increasing when the warming is stabilized. This suggests that the firn capacity is approaching saturation, as refreezing does not increase (or even begins to decrease) further despite an ongoing rise in meltwater production (Fig. S3). For the +5.8 °C experiment, the refreeze presents a clear peak around 2100, indicating that the firn has reached its capacity threshold. After this peak, refreezing declines rapidly before stabilizing, as described in Noël et al. (2022). The refreezing capacity of the ice sheet firn mitigates the fast increase in runoff. However, once runoff exceeds a critical threshold and the firn maximum capacity is reached, this mitigation effect is lost. In our experiments, the refreezing peak likely occurs between +4.4 and +5.2 °C, where the refreeze starts to decrease under a stable climate while meltwater production is still increasing. If the firn was not saturated, the refreeze should continue to increase as projected for lower warming levels.
Finally, the melt–elevation feedback begins to play a more prominent role around 2100. The average thickness of the ice sheet decreases across all our experiments, with an initial acceleration observed around 2050 (coinciding with the branching of the +2.3 °C experiment) and a much more pronounced acceleration occurring around 2090, between the +4.4 and +5.2 °C experiments (Fig. 2f). However, the duration of our experiments (200 years) may not be sufficient to significantly melt the ice sheet and lower its altitude enough to enhance this feedback. In our warmest experiment, this feedback contributes to 10 % of the total mass balance by 2200, as discussed in Delhasse et al. (2024a) (their Fig. 4). This might suggest a stronger influence of the melt–albedo feedback and the progressive saturation of the firn (reduction in the mitigating effect on the increase in runoff) to explain the persistent decrease in SMB and mass in warmer but stable climates by 2200.
3.2 Reverse experiment
As for the other experiments, the mass balance in the reverse experiments is directly linked to the SMB evolution. SMB becomes positive again around 2160, and the mass balance, around 2180, due to the ice discharge (Fig. S1). Ice discharge stabilizes around 2120 at about −230 Gt yr−1, causing the lag between the SMB and mass balance to turn positive.
Reversing the climate results in a new equilibrium SMB for the GrIS, different from the one at the start of the 21st century. As highlighted by Figs. 2 and 3, the SMB becomes positive again around 2160 and remains lower at the end of the experiment (see hereafter for the SMB hysteresis). Compared to 2000, when the climate forcing is the same, the runoff is higher in 2200 (403 Gt yr−1 over 2190–2200 vs 215 Gt yr−1 over 2000–2010). We found the reverse experiment runoff in 2200 to be higher than the +0.6 °C experiment runoff, whereas melt can be compared with the melt rates from +1 and +1.4 °C. The ice thickness decreases as long as the climate warms until 2100, but it is even lower with the reverse climate in 2200 than at the branching date in 2100 of this experiment, as the mass balance is negative over most of the period (Fig. S2).
The thinning of the ice sheet and the time spent over the +2.3 °C threshold are key to explaining the new near-balance state in 2200. First, a thinner ice sheet leads to higher air temperatures in the reverse experiment, which explains the increased runoff due to the higher surface melt as well as the greater amount of rainfall originating from snowfall that melts in the atmosphere due to warmer air temperatures. The 2200 reverse ice sheet is thinner than in the +3.4 °C experiment but thicker than in the +4.4 °C experiment. Compared to the +3.4 °C experiment, the warmer climate during ∼90 years in the reverse experiment leads to more melt, potentially strengthening the melt–elevation feedback and thus also increasing melt. Compared to 2000–2010, the melt is increased by 209 Gt yr−1 at the end of the reverse experiment.
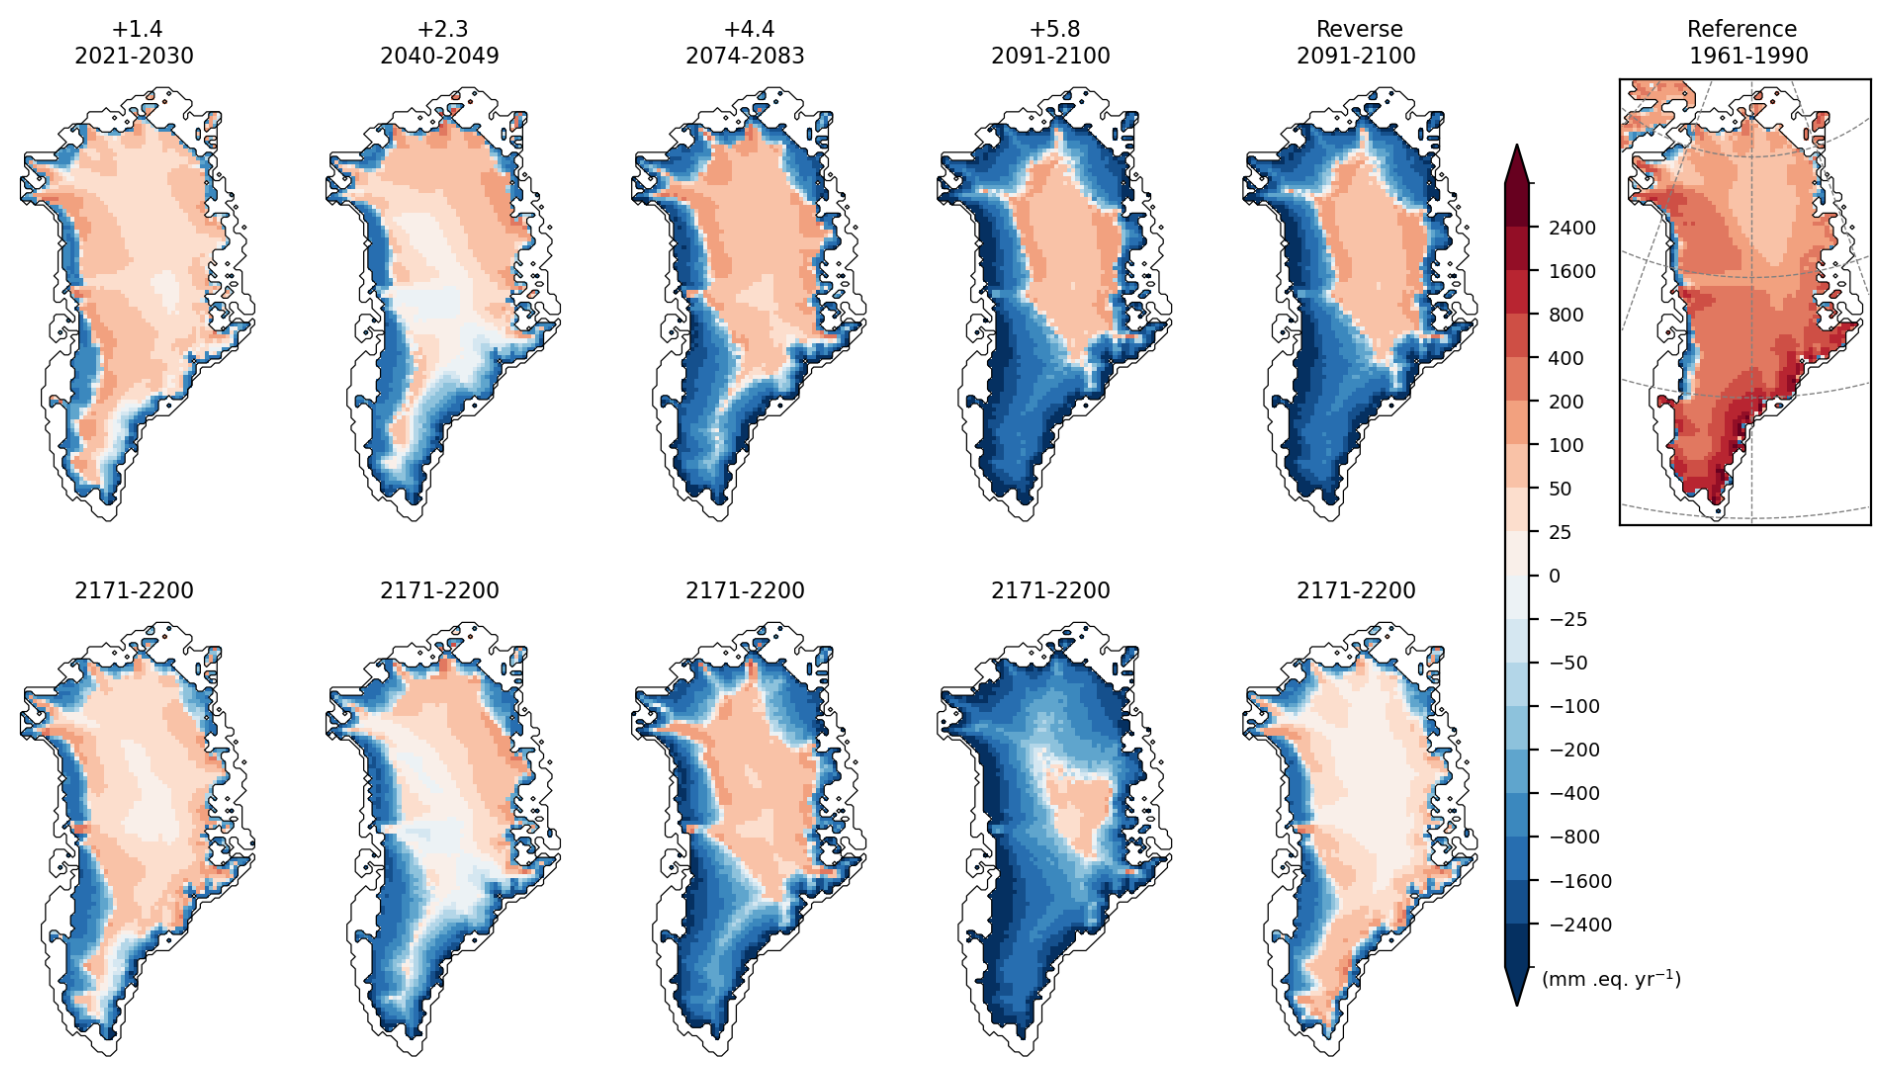
Figure 3SMB anomalies compared to the reference period (1961–1990) on their respective evolutive ice masks. The first row exhibits anomalies of the 10 years selected to be repeated until 2200 with the climate of +1.4, +2.3, +4.4, and +5.8 °C, as well as the last 10 years before reversing the climate for the reverse experiment. The second row exhibits anomalies of the last 10 years of the same experiments (2171–2200). The right panel is the SMB of the reference period (1961–1990).
However, our results underline the inertia of the system. The time spent above the +2.3 °C threshold (around 110 years) coupled with the warmer atmosphere, and the fixed ocean conditions, is not long and warm enough to destabilize the ice sheet. Spending around 125 years at +4.4 °C leads to larger ice mass loss than warming the climate until +5.8 °C in 2100 before returning to the climate from 2000 (Fig. 2a). Even if the reverse experiment has larger mass loss in 2200 than the +2.3 and +3.4 °C experiments, its SMB in 2200 is higher, suggesting a lower SLC on timescales longer than considered here. Even with a thinner ice sheet, the return to cooler conditions in the reverse experiment overrides the elevation feedback. The ice sheet has not thinned enough to continue to melt strongly under present climate conditions. In terms of irreversible mass loss over a short time range, the time spent over the temperature threshold seems then to be much more important than the amplitude of the imbalance. This again underlines the existence of stable overshoots. Although our simulations are relatively short (220 years) and the climate is still evolving, the GrIS appears to be approaching a stabilized state (at least in terms of SMB), as suggested by the absence of a statistically significant trend after 2150 (p<0.05). This aligns with the findings of a previous study (Bochow et al., 2023), which demonstrated that the GrIS can achieve stability within 80 years. Therefore, a warming of the atmosphere only up to +5.8 °C in 100 years, followed by a return to the original atmospheric conditions in 100 years, can be seen as a stable overshoot.
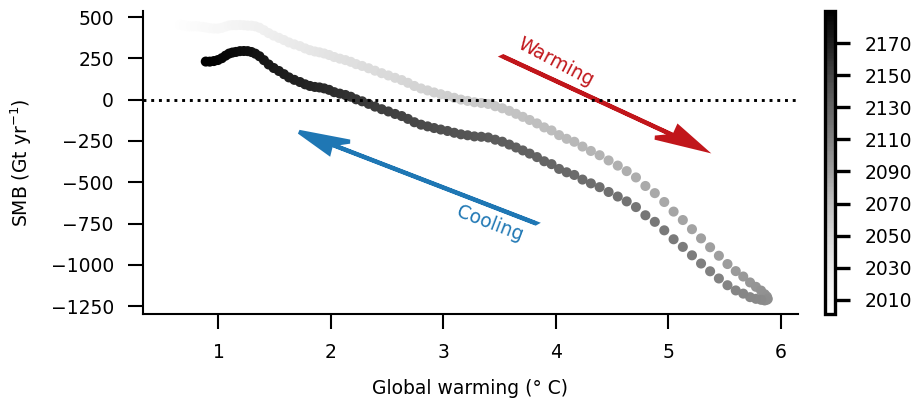
Figure 4Projected SMB (Gt yr−1) by MAR-PISM driven by CESM2 in the reverse experiment compared to the projected global warming of CESM2, colored by year. A 21-year running mean is applied to the data. Red and blue arrows indicate, respectively, the direction of warming and cooling of the experiment.
The GrIS mass balance almost turns positive in 2200, despite the SMB being lower (231 Gt yr−1) compared to 2000–2010 (453 Gt yr−1). While the SMB appears variable near the end of the reverse experiment, this reflects interannual variability rather than a sustained decline. However, changes in firn and surface snow properties, such as reduced refreezing capacity due to saturation of the firn, lower albedo, and decreased surface elevation, lead to increased runoff potential during warm years, even under the present atmospheric conditions. Ice discharge has decreased by 417 Gt yr−1 compared to the present-day value due to the long-term thinning of the ice sheet. This compensation between reduced ice discharge and enhanced runoff suggests that, under identical atmospheric conditions, the future GrIS in the reverse experiment may tend to a near-balance state, whereas the present-day GrIS is losing mass under the same forcing.
The Greenland SMB has a hysteresis behavior linked to the ice sheet thickness and area. Figure 4 shows that the SMB does not react the same way to warming and cooling in the reverse experiment. During the warming phase, the SMB decreases when the warming is higher than +1.5 °C until the maximum atmospheric warming of +5.8 °C, reaching a value of −1250 Gt yr−1. In the cooling phase, the SMB increases again in a similar way but with lower values (shifted by around −250 Gt yr−1) and without returning back to the values of the 1990s. The majority of new areas with negative SMB anomalies in 2100 show again positive anomalies 100 years later in a colder climate. While the SMB becomes negative around +3.4 °C in 2055, it turns positive again only when the climate warms by only +2.3 °C. The lack of symmetry results from the lower albedo (Fig. 2d), higher saturation of the firn (lower refreezing potential; Fig. 2e), thinned ice sheet (Fig. 2f and Fig. S2) leading to higher melt and runoff, and reduced ice sheet areas (Fig. S2).
The experiments in this work highlight the impact of different rates of atmospheric warming as well as a gradual re-cooling after a period of warming on the ice–atmosphere interface of the GrIS. However, the seemingly near-balance state and reduced mass loss of the GrIS for the reverse experiment and, in general, all our results are likely conditioned by the absence of ocean warming until 2100 and the coarse resolution of the ice sheet model.
The ocean response to the different warming rates applied here should increase calving that would hence amplify mass loss, but the extent of this amplification remains uncertain (Fürst et al., 2015; Aschwanden et al., 2019; Choi et al., 2021). Such an increase might be self-limiting due to the thinning and retreat of ice sheet margins, particularly because thinning enhances the melt–elevation feedback and reinforces the predominance of SMB processes (Fürst et al., 2015; Aschwanden et al., 2019). In the long term, retreat could enable the ocean to access deeper bedrock below sea level, potentially reactivating oceanic feedback processes. However, this effect is counterbalanced by glacial isostatic adjustment, which is not represented in our coupled model (Aschwanden et al., 2019). Several studies (Gillet-Chaulet et al., 2012; Goelzer et al., 2013; Fürst et al., 2015) support the notion of a self-limiting increase in calving or highlight the greater contribution of surface processes (atmosphere and SMB) compared to ocean-driven changes (Aschwanden et al., 2019). In contrast, Choi et al. (2021) suggests a more significant role for calving in future ice loss. This divergence suggests that different outcomes are possible, with the potential for destabilization because the ice sheet might lose more mass by 2100 before returning to present-day climate conditions in the reverse experiment.
Furthermore, the 4.5 km resolution of the ice sheet model in our experiments is likely too coarse to fully capture the dynamics of outlet glaciers (Beckmann et al., 2019; Rückamp et al., 2020). However, even high resolutions (higher than 1 km), while leading to greater projected mass losses, may not be sufficient to represent the full complexity of ocean–ice interactions. The absence of an imposed retreat mask associated with a coarser resolution in our study could compensate for the coarse resolution (Rückamp et al., 2020). Finally, the coarse resolution of 4.5 km of the ice sheet model in this study reflects a balance between computational constraints and minimizes interpolation errors between the atmospheric and ice sheet model grids. The interpolation relies on gradients that are computed on the low-resolution atmospheric grid and applied to the higher-resolution grid of the ice sheet model. It assumes that these elevation gradients remain true even on the ice sheet model grid, which might not be true. Although higher resolutions for the ice sheet could improve the representation of certain ocean feedbacks, our setup reasonably captures the relevant dynamics to analyze large-scale interactions between the ice sheet and the atmosphere. Ice–atmosphere interactions, such as melt–elevation and melt–albedo feedbacks, might lead to larger mass losses than better capturing the ice–ocean interaction using a higher resolution: between +10 % and 13 % (this study and Zeitz et al., 2022) and between +12 % and 47 % for the melt–albedo feedback (Zeitz et al., 2022) compared to 5 % for a higher resolution in the ice sheet model (Rückamp et al., 2020). These comparisons underscore the importance of prioritizing the representation of ice–atmosphere interactions in our study.
Although our results are likely influenced by using MAR and PISM, our results agree with other studies finding stable GrIS up to +1.5–+2 °C (e.g., Bochow et al., 2023; Höning et al., 2023). The coupling between these two models enables a better representation of the interactions between the atmosphere and the ice sheet dynamics through the representation of the firn evolution and positive feedbacks such as melt elevation and melt albedo. However, our simulations may be near the upper end of estimates of contributions for atmospheric–ice sheet feedbacks, relative to oceanic and dynamic ice losses. Glaude et al. (2024) showed that MAR projects nearly twice the annual surface mass loss of another regional climate model (RACMO) by 2100 (−1735 Gt yr−1 vs. −964 Gt yr−1), using the same CESM2 atmospheric forcing. This difference stems from stronger melt–albedo feedbacks and a more pronounced expansion of the ablation zone in MAR. Uncertainties in SMB forcing are therefore expected to propagate almost directly into SLR projections (Goelzer et al., 2020). While regional climate models like MAR offer improved SMB representation over coarser models (Fettweis et al., 2020), future work should aim to quantify the influence of model choice on projections.
To assess the response of the GrIS to varying levels of warming, we performed coupled experiments with MAR and PISM, analyzing their impacts over periods of up to 200 years, timescales more relevant to human decision-making than to the millennial-scale response of the ice sheet. Until 2200, global warming not exceeding +1.4 °C since the industrial revolution keeps the GrIS in relative stability, while climates warmer than +2.3 °C would lead to substantial loss.
Determining a warming threshold for the disappearance of the GrIS based solely on the point at which the SMB becomes 0 is insufficient, as our results show that a positive SMB under +2.3 °C warming can later turn negative, leading to a sharp rise in sea level and the potential long-term loss of the GrIS. The sustained GrIS ice loss is then likely to occur at a lower warming, particularly if we consider longer timescales (Robinson et al., 2012). This underlines the importance of the combined effect of the length of time above the temperature threshold and the magnitude of the warming applied (Ritchie et al., 2021), the response of the GrIS being determined by both and not just one of the two elements.
The exact determination of the warming threshold for sustained GrIS ice loss would require more short and long experiments with several warmer climates (including warmer ocean conditions), as well as several ice sheet and climate models to not depend on their climate sensitivity (as is the case in our study, where we only used MAR and PISM coupled together). Furthermore, different climate forcings should also be taken into account, as some atmospheric circulation patterns favor greater increases in melting and could be simulated only by a few models (Delhasse et al., 2018, 2021). Further studies should continue to analyze the importance of feedback mechanisms at various warming thresholds, as well as improve the representation of ice–ocean interactions, particularly by enhancing the resolution of the ice sheet model.
Finally, our study underlines the importance of remaining in climates colder than +2.3 °C (in line with the objective of the Paris agreements). Limiting the warming to +2.3 °C without returning to a colder climate will not stabilize the GrIS and would even result in long-term mass loss. However, we demonstrate that it is also possible to exceed this temperature threshold and, by subsequently cooling the climate at a rate comparable to the preceding warming from 2100 onward, still achieve a trend toward stabilization of the GrIS at a reduced state.
The data used for this study as well as both the MAR and PISM models used to generate the data can be found in https://doi.org/10.5281/zenodo.10066185 (Delhasse, 2023) and https://doi.org/10.5281/zenodo.13987041 (Delhasse et al., 2024b).
The supplement related to this article is available online at https://doi.org/10.5194/tc-19-4459-2025-supplement.
AD and CK conceived the study. AD and JB performed the simulations. AD post-processed all the outputs and created all the figures. CK and AD wrote the paper. All co-authors discussed the results, made revisions, and contributed to the editing of the paper.
The contact author has declared that none of the authors has any competing interests.
Publisher’s note: Copernicus Publications remains neutral with regard to jurisdictional claims made in the text, published maps, institutional affiliations, or any other geographical representation in this paper. While Copernicus Publications makes every effort to include appropriate place names, the final responsibility lies with the authors.
Christoph Kittel is a Postdoctoral Researcher of the Fonds de la Recherche Scientifique – FNRS. Computational resources have been provided by the Consortium des Équipements de Calcul Intensif (CÉCI). We would like to sincerely thank the editor, Gong Cheng, as well as the reviewers, Andy Aschwanden, Yuzhe Wang, and Tong Zhang, for their time and effort – in some cases reviewing previous versions of the paper twice. Their careful reading and constructive feedback were instrumental in improving the clarity and overall quality of the final paper.
This research has been supported by the Fonds De La Recherche Scientifique – FNRS. CÉCI is funded by the Fonds de la Recherche Scientifique de Belgique (F.R.S.–FNRS, grant no. 2.5020.11).
This paper was edited by Gong Cheng and reviewed by Yuzhe Wang, Tong Zhang, and Andy Aschwanden.
Applegate, P. J., Parizek, B. R., Nicholas, R. E., Alley, R. B., and Keller, K.: Increasing temperature forcing reduces the Greenland Ice Sheet’s response time scale, Clim. Dynam., 45, 2001–2011, 2015. a
Aschwanden, A., Fahnestock, M. A., Truffer, M., Brinkerhoff, D. J., Hock, R., Khroulev, C., and Khan, S. A.: Contribution of the Greenland Ice Sheet to sea level over the next millennium, Sci. Adv., 5, eaav9396, https://doi.org/10.1126/sciadv.aav9396, 2019. a, b, c, d, e
Beckmann, J. and Winkelmann, R.: Effects of extreme melt events on ice flow and sea level rise of the Greenland Ice Sheet, The Cryosphere, 17, 3083–3099, https://doi.org/10.5194/tc-17-3083-2023, 2023. a
Beckmann, J., Perrette, M., Beyer, S., Calov, R., Willeit, M., and Ganopolski, A.: Modeling the response of Greenland outlet glaciers to global warming using a coupled flow line–plume model, The Cryosphere, 13, 2281–2301, https://doi.org/10.5194/tc-13-2281-2019, 2019. a, b
Bevis, M., Harig, C., Khan, S. A., Brown, A., Simons, F. J., Willis, M., and Nylen, T.: Accelerating changes in ice mass within Greenland, and the ice sheet’s sensitivity to atmospheric forcing, P. Natl. Acad. Sci. USA, 116, 1934–1939, 2019. a
Bochow, N., Poltronieri, A., Robinson, A., Montoya, M., Rypdal, M., and Boers, N.: Overshooting the critical threshold for the Greenland ice sheet, Nature, 622, 528–536, 2023. a, b, c, d
Choi, Y., Morlighem, M., Rignot, E., and Wood, M.: Ice dynamics will remain a primary driver of Greenland Ice Sheet mass loss over the next century, Commun. Earth Environ., 2, 26, https://doi.org/10.1038/s43247-021-00092-z, 2021. a, b
Danabasoglu, G., Lamarque, J.-F., Bacmeister, J., Bailey, D. A., DuVivier, A. K., Edwards, J., Emmons, L. K., Fasullo, J., Garcia, R., Gettelman, A., Hannay, C., Holland, M. M., Large, W. G., Lauritzen, P. H., Lawrence, D. M., Lenaerts, J. T. M., Lindsay, K., Lipscomb, W. H., Mills, M. J., Neale, R., Oleson, K. W., Otto-Bliesner, B., Phillips, A. S., Sacks, W., Tilmes, S., van Kampenhout, L., Vertenstein, M., Bertini, A., Dennis, J., Deser, C., Fischer, C., Fox-Kemper, B., Kay, J. E., Kinnison, D., Kushner, P. J., Larson, V. E., Long, M. C., Mickelson, S., Moore, J. K., Nienhouse, E., Polvani, L., Rasch, P. J., and Strand, W. G.: The Community Earth System Model Version 2 (CESM2), J. Adv. Model. Earth Sy., 12, e2019MS001916, https://doi.org/10.1029/2019MS001916, 2020. a
Delhasse, A.: Main output data used in “Coupling the regional climate MAR model with the ice sheet model PISM mitigates the melt-elevation positive feedback” (Delhasse et al., 2024), Zenodo [data set], https://doi.org/10.5281/zenodo.10066185, 2023. a
Delhasse, A., Fettweis, X., Kittel, C., Amory, C., and Agosta, C.: Brief communication: Impact of the recent atmospheric circulation change in summer on the future surface mass balance of the Greenland Ice Sheet, The Cryosphere, 12, 3409–3418, https://doi.org/10.5194/tc-12-3409-2018, 2018. a
Delhasse, A., Hanna, E., Kittel, C., and Fettweis, X.: Brief communication: CMIP6 does not suggest any atmospheric blocking increase in summer over Greenland by 2100, Int. J. Climatol., https://doi.org/10.1002/joc.6977, 2021. a, b
Delhasse, A., Beckmann, J., Kittel, C., and Fettweis, X.: Coupling MAR (Modèle Atmosphérique Régional) with PISM (Parallel Ice Sheet Model) mitigates the positive melt–elevation feedback, The Cryosphere, 18, 633–651, https://doi.org/10.5194/tc-18-633-2024, 2024a. a, b, c, d, e, f
Delhasse, A., Kittel, C., and Beckmann, J.: Main output data used in “Exploring the Greenland Ice Sheet's response to future atmospheric warming-threshold scenarios over 200 years” (Delhasse et al., 2024), Zenodo [data set], https://doi.org/10.5281/zenodo.13987041, 2024b. a
Fettweis, X., Box, J. E., Agosta, C., Amory, C., Kittel, C., Lang, C., van As, D., Machguth, H., and Gallée, H.: Reconstructions of the 1900–2015 Greenland ice sheet surface mass balance using the regional climate MAR model, The Cryosphere, 11, 1015–1033, https://doi.org/10.5194/tc-11-1015-2017, 2017. a
Fettweis, X., Hofer, S., Krebs-Kanzow, U., Amory, C., Aoki, T., Berends, C. J., Born, A., Box, J. E., Delhasse, A., Fujita, K., Gierz, P., Goelzer, H., Hanna, E., Hashimoto, A., Huybrechts, P., Kapsch, M.-L., King, M. D., Kittel, C., Lang, C., Langen, P. L., Lenaerts, J. T. M., Liston, G. E., Lohmann, G., Mernild, S. H., Mikolajewicz, U., Modali, K., Mottram, R. H., Niwano, M., Noël, B., Ryan, J. C., Smith, A., Streffing, J., Tedesco, M., van de Berg, W. J., van den Broeke, M., van de Wal, R. S. W., van Kampenhout, L., Wilton, D., Wouters, B., Ziemen, F., and Zolles, T.: GrSMBMIP: intercomparison of the modelled 1980–2012 surface mass balance over the Greenland Ice Sheet, The Cryosphere, 14, 3935–3958, https://doi.org/10.5194/tc-14-3935-2020, 2020. a, b, c, d
Fettweis, X., Hofer, S., Séférian, R., Amory, C., Delhasse, A., Doutreloup, S., Kittel, C., Lang, C., Van Bever, J., Veillon, F., and Irvine, P.: Brief communication: Reduction in the future Greenland ice sheet surface melt with the help of solar geoengineering, The Cryosphere, 15, 3013–3019, https://doi.org/10.5194/tc-15-3013-2021, 2021. a
Fürst, J. J., Goelzer, H., and Huybrechts, P.: Ice-dynamic projections of the Greenland ice sheet in response to atmospheric and oceanic warming, The Cryosphere, 9, 1039–1062, https://doi.org/10.5194/tc-9-1039-2015, 2015. a, b, c
Gillet-Chaulet, F., Gagliardini, O., Seddik, H., Nodet, M., Durand, G., Ritz, C., Zwinger, T., Greve, R., and Vaughan, D. G.: Greenland ice sheet contribution to sea-level rise from a new-generation ice-sheet model, The Cryosphere, 6, 1561–1576, https://doi.org/10.5194/tc-6-1561-2012, 2012. a
Glaude, Q., Noel, B., Olesen, M., Van den Broeke, M., van de Berg, W. J., Mottram, R., Hansen, N., Delhasse, A., Amory, C., Kittel, C., Goelzer, H., and Fettweis, X.: A Factor Two Difference in 21st-Century Greenland Ice Sheet Surface Mass Balance Projections From Three Regional Climate Models Under a Strong Warming Scenario (SSP5-8.5), Geophys. Res. Lett., 51, e2024GL111902, https://doi.org/10.1029/2024GL111902, 2024. a
Goelzer, H., Huybrechts, P., Fürst, J., Nick, F., Andersen, M., Edwards, T., Fettweis, X., Payne, A., and Shannon, S.: Sensitivity of Greenland Ice Sheet Projections to Model Formulations, J. Glaciol., 59, 733–749, https://doi.org/10.3189/2013JoG12J182, 2013. a
Goelzer, H., Nowicki, S., Payne, A., Larour, E., Seroussi, H., Lipscomb, W. H., Gregory, J., Abe-Ouchi, A., Shepherd, A., Simon, E., Agosta, C., Alexander, P., Aschwanden, A., Barthel, A., Calov, R., Chambers, C., Choi, Y., Cuzzone, J., Dumas, C., Edwards, T., Felikson, D., Fettweis, X., Golledge, N. R., Greve, R., Humbert, A., Huybrechts, P., Le clec'h, S., Lee, V., Leguy, G., Little, C., Lowry, D. P., Morlighem, M., Nias, I., Quiquet, A., Rückamp, M., Schlegel, N.-J., Slater, D. A., Smith, R. S., Straneo, F., Tarasov, L., van de Wal, R., and van den Broeke, M.: The future sea-level contribution of the Greenland ice sheet: a multi-model ensemble study of ISMIP6, The Cryosphere, 14, 3071–3096, https://doi.org/10.5194/tc-14-3071-2020, 2020. a, b
Gregory, J. M., George, S. E., and Smith, R. S.: Large and irreversible future decline of the Greenland ice sheet, The Cryosphere, 14, 4299–4322, https://doi.org/10.5194/tc-14-4299-2020, 2020. a
Greve, R. and Chambers, C.: Mass loss of the Greenland ice sheet until the year 3000 under a sustained late-21st-century climate, J. Glaciol., 68, 618–624, 2022. a
Hahn, L. C., Storelvmo, T., Hofer, S., Parfitt, R., and Ummenhofer, C. C.: Importance of orography for Greenland cloud and melt response to atmospheric blocking, J. Climate, 33, 4187–4206, https://doi.org/10.1175/JCLI-D-19-0527.1, 2020. a
Hanna, E., Fettweis, X., and Hall, R. J.: Brief communication: Recent changes in summer Greenland blocking captured by none of the CMIP5 models, The Cryosphere, 12, 3287–3292, https://doi.org/10.5194/tc-12-3287-2018, 2018. a
Hofer, S., Tedstone, A. J., Fettweis, X., and Bamber, J. L.: Decreasing cloud cover drives the recent mass loss on the Greenland Ice Sheet, Sci. Adv., 3, e1700584, https://doi.org/10.1126/sciadv.1700584, 2017. a
Hofer, S., Lang, C., Amory, C., Kittel, C., Delhasse, A., Tedstone, A., and Fettweis, X.: Greater Greenland Ice Sheet contribution to global sea level rise in CMIP6, Nat. Commun., 11, 6289, https://doi.org/10.1038/s41467-020-20011-8, 2020. a
Höning, D., Willeit, M., Calov, R., Klemann, V., Bagge, M., and Ganopolski, A.: Multistability and transient response of the Greenland ice sheet to anthropogenic CO2 emissions, Geophys. Res. Lett., 50, e2022GL101827, https://doi.org/10.1029/2022GL101827, 2023. a
Khrulev, C., Aschwanden, A., Bueler, E., Brown, J., Maxwell, D., Albrecht, T., Reese, R., Mengel, M., Martin, M., Winkelmann, R., Zeitz, M., Levermann, A., Feldmann, J., Garbe, J., Haseloff, M., Seguinot, J., Hinck, S., Kleiner, T., Fischer, E., Damsgaard, A., Lingle, C., van Pelt, W., Ziemen, F., Shemonski, N., Mankoff, K., Kennedy, J., Blum, K., Habermann, M., DellaGiustina, D., Hock, R., Kreuzer, M., Degregori, E., and Schoell, S.: Parallel Ice Sheet Model (PISM), Zenodo [code], https://doi.org/10.5281/zenodo.10202029, 2023. a
Le clec'h, S., Charbit, S., Quiquet, A., Fettweis, X., Dumas, C., Kageyama, M., Wyard, C., and Ritz, C.: Assessment of the Greenland ice sheet–atmosphere feedbacks for the next century with a regional atmospheric model coupled to an ice sheet model, The Cryosphere, 13, 373–395, https://doi.org/10.5194/tc-13-373-2019, 2019. a
Lenaerts, J. T. M., Medley, B., van den Broeke, M. R., and Wouters, B.: Observing and Modeling Ice Sheet Surface Mass Balance, Rev. Geophys., 57, 376–420, https://doi.org/10.1029/2018RG000622, 2019. a
McCulloch, M. T., Winter, A., Sherman, C. E., and Trotter, J. A.: 300 years of sclerosponge thermometry shows global warming has exceeded 1.5 C, Nat. Clima. Change, 14, 171–177, 2024. a
McKay, D. A., Staal, A., Abrams, J. F., Winkelmann, R., Sakschewski, B., Loriani, S., Fetzer, I., Cornell, S. E., Rockström, J., and Lenton, T. M.: Exceeding 1.5∘C global warming could trigger multiple climate tipping points, Science, 377, eabn7950, https://doi.org/10.1126/science.abn7950, 2022. a
Meehl, G. A., Senior, C. A., Eyring, V., Flato, G., Lamarque, J.-F., Stouffer, R. J., and Taylor, K. E.: Climate sensitivity and climate response of the CESM2 Earth system model, J. Adv. Model. Earth Sy., 12, e2020MS002127, https://doi.org/10.1029/2020MS002127, 2020. a
Morlighem, M., Bondzio, J., Seroussi, H., Rignot, E., Larour, E., Humbert, A., and Rebuffi, S.: Modeling of Store Gletscher's calving dynamics, West Greenland, in response to ocean thermal forcing, Geophys. Res. Lett., 43, 2659–2666, 2016. a
Mouginot, J., Rignot, E., Bjørk, A. A., van den Broeke, M., Millan, R., Morlighem, M., Noël, B., Scheuchl, B., and Wood, M.: Forty-six years of Greenland Ice Sheet mass balance from 1972 to 2018, P. Natl. Acad. Sci., 116, 9239–9244, https://doi.org/10.1073/pnas.1904242116, 2019. a
Muntjewerf, L., Petrini, M., Vizcaino, M., Ernani da Silva, C., Sellevold, R., Scherrenberg, M. D. W., Thayer-Calder, K., Bradley, S. L., Lenaerts, J. T. M., Lipscomb, W. H., and Lofverstrom, M.: Greenland Ice Sheet Contribution to 21st Century Sea Level Rise as Simulated by the Coupled CESM2.1-CISM2.1, Geophys. Res. Lett., 47, https://doi.org/10.1029/2019GL086836, 2020. a
Noël, B., van Kampenhout, L., Lenaerts, J. T. M., van de Berg, W. J., and van den Broeke, M. R.: A 21st century warming threshold for sustained Greenland ice sheet mass loss, Geophys. Res. Lett., 48, e2020GL090471, https://doi.org/10.1029/2020GL090471, 2021. a, b, c
Noël, B., Lenaerts, J. T., Lipscomb, W. H., Thayer-Calder, K., and van den Broeke, M. R.: Peak refreezing in the Greenland firn layer under future warming scenarios, Nat. Commun., 13, 6870, https://doi.org/10.1038/s41467-022-34524-x, 2022. a
Otosaka, I. N., Shepherd, A., Ivins, E. R., Schlegel, N.-J., Amory, C., van den Broeke, M. R., Horwath, M., Joughin, I., King, M. D., Krinner, G., Nowicki, S., Payne, A. J., Rignot, E., Scambos, T., Simon, K. M., Smith, B. E., Sørensen, L. S., Velicogna, I., Whitehouse, P. L., A, G., Agosta, C., Ahlstrøm, A. P., Blazquez, A., Colgan, W., Engdahl, M. E., Fettweis, X., Forsberg, R., Gallée, H., Gardner, A., Gilbert, L., Gourmelen, N., Groh, A., Gunter, B. C., Harig, C., Helm, V., Khan, S. A., Kittel, C., Konrad, H., Langen, P. L., Lecavalier, B. S., Liang, C.-C., Loomis, B. D., McMillan, M., Melini, D., Mernild, S. H., Mottram, R., Mouginot, J., Nilsson, J., Noël, B., Pattle, M. E., Peltier, W. R., Pie, N., Roca, M., Sasgen, I., Save, H. V., Seo, K.-W., Scheuchl, B., Schrama, E. J. O., Schröder, L., Simonsen, S. B., Slater, T., Spada, G., Sutterley, T. C., Vishwakarma, B. D., van Wessem, J. M., Wiese, D., van der Wal, W., and Wouters, B.: Mass balance of the Greenland and Antarctic ice sheets from 1992 to 2020, Earth Syst. Sci. Data, 15, 1597–1616, https://doi.org/10.5194/essd-15-1597-2023, 2023. a, b, c
Pattyn, F., Ritz, C., Hanna, E., Asay-Davis, X., DeConto, R., Durand, G., and Van den Broeke, M.: The Greenland and Antarctic ice sheets under 1.5 C global warming, Nat. Clim. Change, 8, 1053–1061, 2018. a, b
Petrini, M., Scherrenberg, M. D. W., Muntjewerf, L., Vizcaino, M., Sellevold, R., Leguy, G. R., Lipscomb, W. H., and Goelzer, H.: A topographically controlled tipping point for complete Greenland ice sheet melt, The Cryosphere, 19, 63–81, https://doi.org/10.5194/tc-19-63-2025, 2025. a, b
Ridley, J., Gregory, J. M., Huybrechts, P., and Lowe, J.: Thresholds for irreversible decline of the Greenland ice sheet, Clim. Dynam., 35, 1049–1057, 2010. a
Ritchie, P. D., Clarke, J. J., Cox, P. M., and Huntingford, C.: Overshooting tipping point thresholds in a changing climate, Nature, 592, 517–523, 2021. a
Robinson, A., Calov, R., and Ganopolski, A.: Multistability and critical thresholds of the Greenland ice sheet, Nat. Clim. Change, 2, 429–432, 2012. a, b, c
Rückamp, M., Goelzer, H., and Humbert, A.: Sensitivity of Greenland ice sheet projections to spatial resolution in higher-order simulations: the Alfred Wegener Institute (AWI) contribution to ISMIP6 Greenland using the Ice-sheet and Sea-level System Model (ISSM), The Cryosphere, 14, 3309–3327, https://doi.org/10.5194/tc-14-3309-2020, 2020. a, b, c, d
Seo, K.-W., Waliser, D. E., Lee, C.-K., Tian, B., Scambos, T., Kim, B.-M., and van den Broeke, M. R.: Accelerated mass loss from Greenland ice sheet: Links to atmospheric circulation in the North Atlantic, Global Planet. Chang., 128, 61–71, 2015. a
Tedesco, M. and Fettweis, X.: Unprecedented atmospheric conditions (1948–2019) drive the 2019 exceptional melting season over the Greenland ice sheet, The Cryosphere, 14, 1209–1223, https://doi.org/10.5194/tc-14-1209-2020, 2020. a
Vizcaino, M., Mikolajewicz, U., Ziemen, F., Rodehacke, C. B., Greve, R., and van den Broeke, M. R.: Coupled simulations of Greenland Ice Sheet and climate change up to AD 2300, Geophys. Res. Lett., 42, 3927–3935, 2015. a
Zeitz, M., Haacker, J. M., Donges, J. F., Albrecht, T., and Winkelmann, R.: Dynamic regimes of the Greenland Ice Sheet emerging from interacting melt–elevation and glacial isostatic adjustment feedbacks, Earth Syst. Dynam., 13, 1077–1096, https://doi.org/10.5194/esd-13-1077-2022, 2022. a, b, c, d, e