the Creative Commons Attribution 4.0 License.
the Creative Commons Attribution 4.0 License.
 | 07 Oct 2025
Damage intensity increases ice mass loss from Thwaites Glacier, Antarctica
Violaine Coulon
Javier Blasco
Gang Qiao
Qinghua Yang
Frank Pattyn
Ice damage, which results from the formation and development of crevasses on glaciers, plays a critical role in ice-shelf stability, grounding-line retreat, and subsequent sea-level rise. Yet, few ice-sheet models explicitly account for ice damage or its effects on glacier dynamics. Here, we incorporate ice damage processes into an ice-sheet model and apply it to the Thwaites Glacier basin to assess the sensitivity of mass loss to ice damage intensity. Our results indicate that, when accounting for ice damage mechanics, the ice-sheet model captures the observed ice geometry and mass balance of Thwaites Glacier during the historical period (1990–2020). On multidecadal–centennial timescales, ice damage facilitates the collapse of Thwaites Glacier, significantly increasing ice mass loss. When extending simulations to the year 2300, we show that accounting for ice damage results in more than twice the ice mass loss compared to simulations that neglect ice damage mechanics. This study highlights the necessity of explicitly representing ice damage processes in ice-sheet models to improve projections of future ice loss and sea-level rise.
- Article
(6587 KB) - Full-text XML
-
Supplement
(727 KB) - BibTeX
- EndNote


The weakening of ice due to the formation of large-scale crevasses and rifts, known as damage, is gaining attention due to its impact on glacier and ice-sheet evolution in a warming climate. These fractures primarily form in fast-flowing regions such as near the grounding line or along shear margins and are transported by ice flow, creating elongated fracture bands visible in satellite imagery (Albrecht and Levermann, 2012). Since the viscosity of these fracture bands is exceptionally low, they significantly influence the dynamics of the entire ice shelf (Khazendar et al., 2007; Borstad et al., 2012). Studies revealed that such damage could initiate a feedback loop, promoting the further formation and propagation of rifts and crevasses. This destabilizes ice shelves by enhancing shearing, weakening their structural integrity, and ultimately leading to additional damage and retreat of the grounding line (Sun et al., 2017; Lhermitte et al., 2020; Izeboud and Lhermitte, 2023). Moreover, the ability of ice shelves to restrain the ice flow weakens, leading to an acceleration of grounded ice mass loss and subsequent sea-level rise. Large-scale damage on glaciers could be a precursor of ice-shelf disintegration, which may affect both the timing and magnitude of grounded ice loss, as well as the overall contribution of Antarctic glaciers to sea-level rise (Lhermitte et al., 2020; van de Wal et al., 2022; Izeboud and Lhermitte, 2023).
Several studies have investigated the influence of damage on the behavior of the Antarctic Ice Sheet (AIS). Borstad et al. (2012) applied a large-scale ice dynamical model to invert for damage on the Larsen B Ice Shelf prior to its collapse in 2002. They concluded that calving was triggered by the loss of load-bearing surface area due to fracturing. Albrecht and Levermann (2014) investigated the role of damage in softening ice across several Antarctic ice shelves using a fracture density field derived from observations. Gerli et al. (2023) demonstrated that the vertical propagation of crevasses within ice shelves can instantaneously increase the flux of upstream glaciers. Huth et al. (2021, 2023) integrated a creep damage model into a large-scale shallow-shelf ice flow model to simulate rift propagation leading to the formation of iceberg A68 from the Larsen C Ice Shelf. Damage is facilitated through hydrofracturing, and the combined effect of non-linear viscous rheology and damage processes within ice at water-filled crevasse tips can influence calving dynamics (Duddu et al., 2020). Sun and Gudmundsson (2023) conducted a series of numerical perturbation experiments to show that damage evolution significantly affects ice-shelf velocities and must be accounted for to accurately replicate observed velocity patterns. These studies reveal the interaction between damage processes and observed ice flow dynamics. Several of them (e.g., Borstad et al., 2012; Albrecht and Levermann, 2014; Gerli et al., 2023; Sun and Gudmundsson, 2023) have one critical limitation, i.e., being diagnostic, which means that they investigate the instantaneous effect of damage on ice dynamics but not the evolution of damage when ice thickness is allowed to evolve according to the applied changes. They therefore fail to predict future ice-sheet behavior or feedbacks induced by external changes, such as fracture enhancement due to atmospheric or oceanic forcing. In contrast, more recent studies have integrated damage evolution into ice flow models to investigate fracture processes and their influence on ice dynamics, including the effects of ice thickness evolution (e.g., Duddu et al., 2020; Huth et al., 2021, 2023). These efforts primarily focus on relatively short timescales (months to years), during which ice thickness changes have limited influence on ice flow. As a result, while they shed light on instantaneous responses such as rifting or crevasse propagation, their ability to simulate long-term ice-sheet feedbacks under sustained climate forcing remains limited.
Prognostic modeling enables the assessment of ice-sheet and ice-shelf evolution in response to fracture dynamics. However, most existing studies focus on idealized ice-sheet geometries. Sun et al. (2017) coupled a continuum damage mechanics (CDM) model with an ice-sheet model based on the zero-stress Nye approach (Nye, 1957). Applying this model to an idealized ice-sheet geometry (MISMIP+; Cornford et al., 2020), they found that ice damage leads to greater grounding-line retreat compared to simulations without damage. Using the same model, Lhermitte et al. (2020) showed that intensifying damage at a specific location within shear zones triggers widespread propagation and amplification of damage, supporting the hypothesis of a positive feedback mechanism. By integrating a continuum damage mechanics model with necking instability into an ice-sheet model, Kachuck et al. (2022) simulated the evolution of the damage field and accurately predicted steady-state extents for a series of idealized, isothermal ice tongues and ice shelves. Similarly, Ranganathan et al. (2025) developed a damage evolution model coupled with a marine-terminating glacier flowline model and showed that damage can enhance mass loss from both grounded and floating ice. However, the results obtained from idealized geometries may not fully translate to the real world conditions, and studies investigating the effects of ice damage on the dynamics of actual glaciers, such as Antarctic glaciers and ice shelves, remain limited.
Extensive ice damage has been observed on Thwaites Glacier (TG), the largest ice stream in West Antarctica (2.1×10⁵ km2) and one of the fastest mass-losing outlet glaciers of the AIS (Rignot et al., 2019; Lhermitte et al., 2020; Surawy-Stepney et al., 2023). Recent satellite images show an increase in ice-shelf damage across TG's floating ice shelf – both the Thwaites Eastern Ice Shelf (TEIS) and the Thwaites Western Glacier Tongue (TWGT) – with open rifts and dense crevasses also present in their shear zones (Lhermitte et al., 2020). Episodic dynamic changes in TWGT, such as acceleration, have been linked to this damage. Miles et al. (2020) found that rapid acceleration phases observed between 2006–2012 and 2016–2018 coincided with structural weakening. Similarly, Surawy-Stepney et al. (2023) confirmed that the formation and evolution of crevasses along TWTG's shear margin from June 2017 to December 2018 and in early 2020 aligned with periods of increased ice flow. As a marine glacier (i.e., grounded below sea level; Fig. 1a) on a retrograde bed slope, TG is susceptible to marine ice-sheet instability (MISI) (Schoof, 2007; Pattyn, 2018). Ice damage may facilitate grounding-line retreat by compromising ice-shelf integrity and reducing their buttressing effect on upstream glaciers. However, Gudmundsson et al. (2023) found that the floating ice shelves of TG provide limited buttressing and that the loss of these ice shelves would have a minimal impact on overall ice-sheet stability.
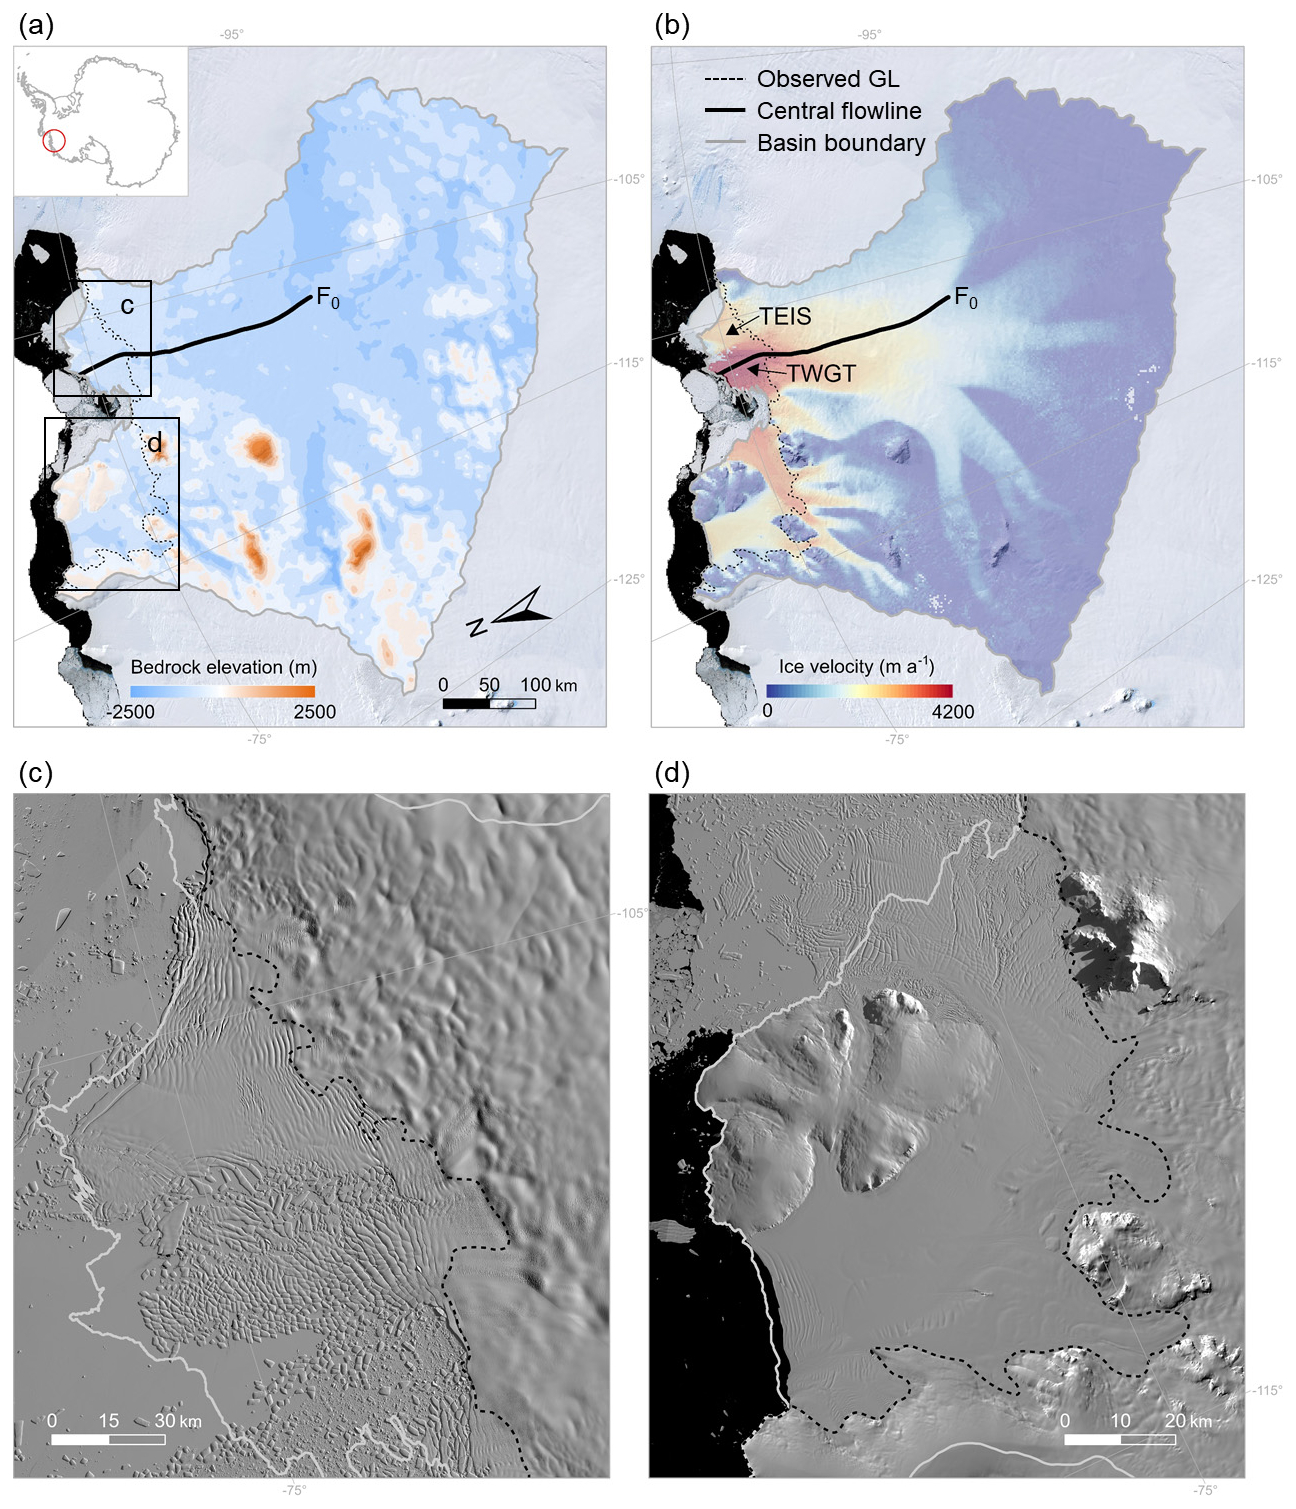
Figure 1Bedrock elevation and ice velocity in the TG basin. (a) Observed bedrock elevation of the TG basin based on BedMachine v2 data (Morlighem et al., 2020) and (b) observed ice velocity of the TG basin based on Making Earth System Data Records for Use in Research Environments (MEaSUREs) InSAR-Based Antarctica Ice Velocity Map, Version 2 (Rignot et al., 2017) overlaid on the Landsat Image Mosaic of Antarctica (LIMA; Bindschadler et al., 2008). The solid black curve is the central flowline profile stemming from the Antarctic surface flowline dataset developed by Liu et al. (2015), which spans 340 km from the inland grounded ice (F0) to the calving front. The dashed black line shows the position of the observed grounding line (Gardner et al., 2018). The inset in panel (a) shows the location of the TG basin in Antarctica. TEIS represents the Thwaites Eastern Ice Shelf and TWGT represents the Thwaites Western Glacier Tongue. The black rectangular insets in panel (a) are panels (c) and (d), which show the crevasse distributions across the ice-shelf regions in the TG basin, based on Landsat-8 satellite images acquired in December 2020. The gray line is the basin boundary of the TG basin derived from Zwally et al. (2015). The black–gray bar in panel (a) and white–gray bars in panels (c) and (d) are scale bars of the corresponding maps.
In this study, the numerical ice-sheet model Kori-ULB (Pattyn, 2017; Coulon et al., 2024), modified to explicitly represent continuum damage mechanics (Sun et al., 2017), is used to investigate the impact of ice damage on the present and near-future evolution of the TG basin. We aim to (i) evaluate and calibrate the model using satellite-based observations of present-day mass-change rates and (ii) explore the sensitivity of glacier retreat and mass loss in the TG basin to increased damage intensity. We run an ensemble of simulations in which two key parameters controlling ice damage intensity are systematically perturbed and compare the results to two baseline experiments that neglect ice damage feedbacks.
2.1 Ice-sheet and damage model
The Kori-ULB ice-sheet model (Pattyn, 2017; Coulon et al., 2024) is a vertically integrated, thermomechanical finite difference model that combines shallow-ice approximation with shallow-shelf approximation (so-called hybrid model; Winkelmann et al., 2011). The Kori-ULB ice-sheet model has been used for large-scale simulation of the AIS (Seroussi et al., 2020; Coulon et al., 2024), as well as small drainage basins with different ice geometries, such as MISMIP3d (Pattyn et al., 2013) and MISMIP+ (Cornford et al., 2020) experiments, and real-world drainage basins (e.g., Thwaites Glacier basin; Kazmierczak et al., 2024).
To investigate the dynamical response of the TG basin to ice damage and damage parametric perturbations, we couple the ice-sheet model with the continuum damage mechanics (CDM) model developed by Sun et al. (2017). This model establishes a direct link between the amount of damage and ice viscosity: the propagation of damage reduces the ice viscosity through Glen's flow law, leading to faster ice.
Following Sun et al. (2017), we represent damage using a scalar variable D, which takes values from 0 (undamaged ice) to 1 (ice entirely fractured by surface and basal crevasses). The vertically averaged damage field is defined as , which is the closest analogue to the usual D, where represents the vertical integral of D. Damage is incorporated into the stress balance equation through a modification to Glen's constitutive flow law. In Kori-ULB, the relationship between the deviatoric stress τ and the strain rate is described by Glen's constitutive flow law:
where A is Glen's flow law factor, dependent on the ice temperature, and n is the flow rate exponent, with n=3. And the damage feedback is described by the integration of a damage factor D in Eq. (1):
To determine the relationship between ice damage and the first principal stress, the CDM framework is based on two key components: a local source of damage term (d1) that accounts for the local formation of damage and an advection term (dtr) that accounts for the transport of damage during ice flow.
In the absence of advection, ice damage is expressed as the normalized depth of the crevasses, i.e., the sum of surface crevasses ds and basal crevasses db (Nick et al., 2011, 2013; Cook et al., 2014; Sun et al., 2017). Those can be calculated by the zero-stress assumption (Nye, 1957; Nick et al., 2011):
where dw is the water depth in the surface crevasse (here we only consider dry crevasses, so dw is equal to 0); Hab is the thickness above floatation; is the gravitational acceleration; is the ice density; and ρmw and ρsw are the densities of meltwater in the surface crevasses and seawater in the basal crevasses, respectively (both set to 1028 kg m−3 in this study). The first principal stress τ1 is defined as the product of the first principal strain () and the effective ice viscosity (μ):
The local source of damage term d1(τ1) is then expressed as
where C1 is a parameter ranging from 0 to 1 that sets an upper limit to d1(τ1) as a fraction of the ice thickness. This constraint prevents an overestimation of crevasse depth in the gridded domain.
In addition, damage fields are advected by ice flow. In this context, dtr represents the evolution of the vertically integrated damage field caused by advection, stretching, and mass loss or accumulation at the glacier's upper and lower surfaces. The transported crevasses depth dtr can be solved by the following damage transport equation (Sun et al., 2017):
where u is the two-dimensional horizontal velocity. The left-hand side of Eq. (7) represents the conservation of vertically integrated damage, which includes the advection of crevasses with the ice flow and the effect of stretching and compression. On the right-hand side, damage reduction is modeled through two processes: an increase in undamaged ice thickness due to surface accumulation () and erosion of the crevassed ice bottom by basal melting ().
Overall, at any given time and position (), there exist two damage fields: the locally generated crevasse depth , as calculated above, and the advected crevasses depth . Assuming that crevasse surfaces do not bond together during closure, at least on the timescale relevant to crevasse closure (Sun et al., 2017), the final expression of damage is given by
where Ctr is a parameter that limits D as a fraction of the ice thickness, with C1≤Ctr. This implies that regions of the ice shelf subjected to lower stress inherit damage from the upstream areas that are experiencing higher stress.
2.2 Simulation protocol
Simulations are spun up to a state representative of 1990, which then serve as the starting point for a 30-year historical run under constant present-day conditions. Surface mass balance (SMB) and air temperature are taken from the polar regional climate model MARv3.11 (Kittel et al., 2021), while ocean temperature and salinity are based on the data from Schmidtko et al. (2014). Basal melting underneath the floating ice shelves is estimated with the PICO model (Reese et al., 2018). Beyond the historical period (1990–2020), simulations are extended to 2300 under constant present-day atmospheric and oceanic conditions, allowing us to assess the effects of ice damage and the sensitivity of TG evolution over longer timescales. All simulations are performed at a spatial resolution of 2 km.
Two types of experiments are conducted (Table 1). First, we run an ensemble of simulations to investigate the impact of ice damage on the TG basin. To this end, we produce a perturbed parameter ensemble by systematically varying C1 and Ctr (Eqs. 6 and 8), two key parameters governing damage feedback processes. We initially designed a 100-member ensemble, with C1 and Ctr sampled within the range [0,1] using a Latin hypercube method. The ensemble was then reduced to 43 members to satisfy the requirement that C1≤Ctr. The final 43-member ensemble is used to quantify the sensitivity of TG evolution to ice damage intensity.
Table 1Summary of the damage sensitivity experiments and two control experiments performed for the TG basin.
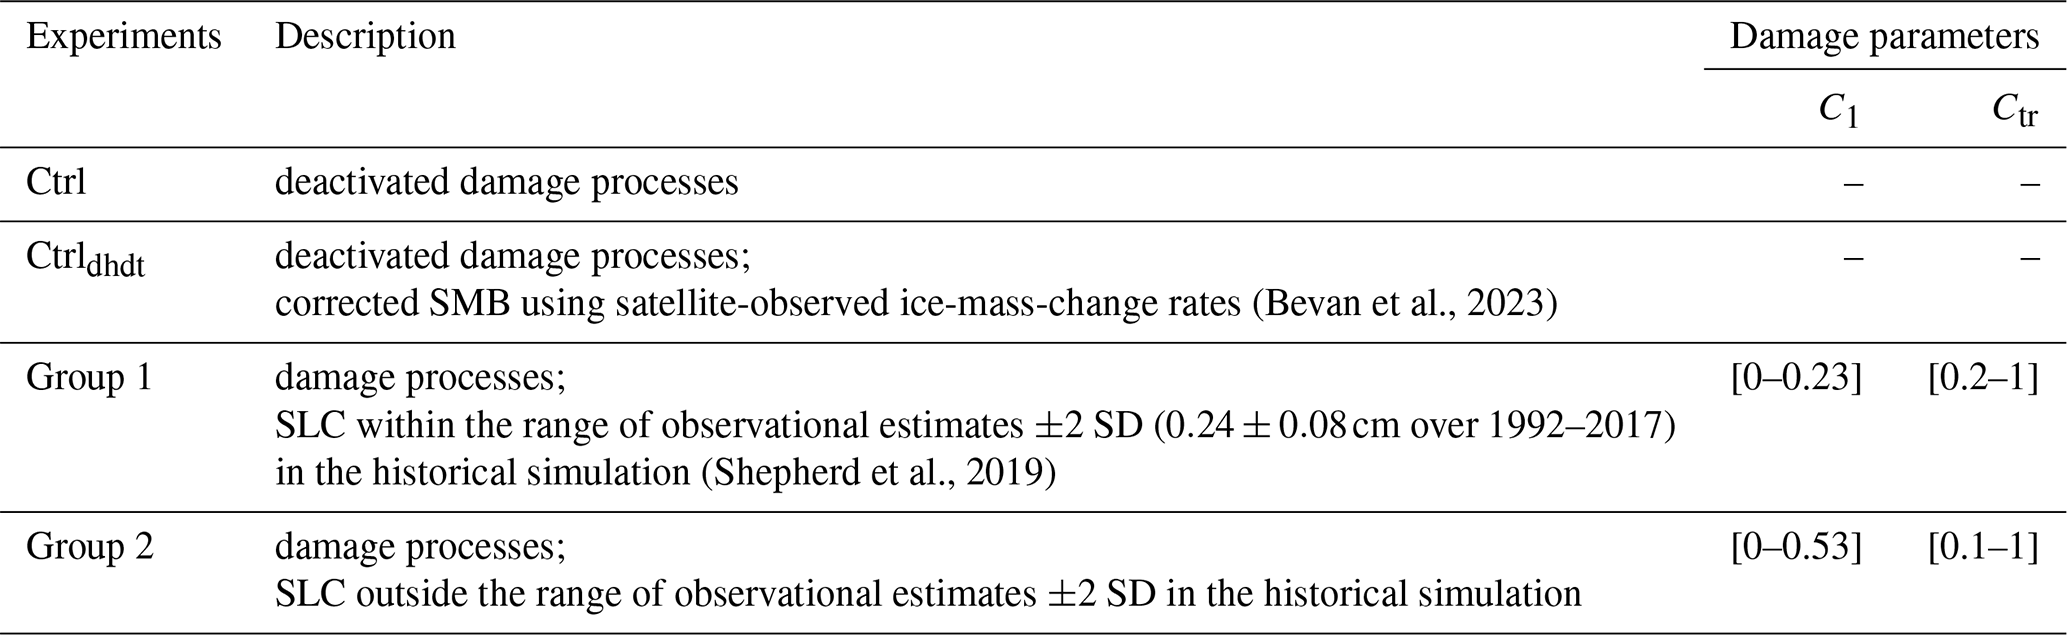
Based on their performance during the historical simulations, ensemble members are categorized into two subgroups according to their ability to match satellite-based estimates of ice mass change in the TG basin (Shepherd et al., 2019). Simulations where the modeled ice mass change (i.e., the contribution to sea level, SLC) falls within the satellite-derived mean estimate ± 2 times the observed standard deviation (SD) are classified as Group 1 (G1). Those that significantly over- or underestimate this range ( SD) are classified as Group 2 (G2).
In addition, two control simulations without damage serve as baselines for comparison: one designed to reproduce observed mass-change rates (Ctrldhdt) and another without this constraint (Ctrl).
2.3 Model initialization
The initial conditions for both the 43-member damage ensemble and the Ctrl experiment are obtained by an inverse simulation nudging towards present-day ice-sheet geometry (Pollard and DeConto, 2012; Bernales et al., 2017; Coulon et al., 2024), using present-day ice-sheet surface and bed geometry from BedMachine v2 (Morlighem et al., 2020) and present-day surface mass balance and air temperature from the polar regional climate model MARv3.11 (Kittel et al., 2021). Calving at the ice front is determined by the combined penetration depths of surface and basal crevasses relative to ice thickness, with crevasse depths parameterized as functions of ice velocity divergence, accumulated strain, ice thickness, and (optionally) surface liquid water availability, similar to Pollard et al. (2015) and DeConto and Pollard (2016). A detailed description of the initialization procedure is provided in Appendix A of Coulon et al. (2024). The initial state for the Ctrl experiment is identical to that of the 43-member damage ensemble, ensuring that all start from the same ice-sheet geometry. In the damage sensitivity experiments, ice damage is activated from the first time step of the historical simulation, meaning that the ice sheet is considered undamaged at the start of 1990. Given that this assumption is somewhat idealized, the simulated damage can be interpreted as relative to the initial state.
To reproduce the dynamic disequilibrium observed during the historical period, we apply the initialization method of van den Akker et al. (2025). Specifically, the initial state of the Ctrldhdt experiment is obtained by adding a “correction term” – equal to minus the observed mass-change rates (taken from Bevan et al., 2023) – to the present-day surface mass balance (Kittel et al., 2021) during the transient nudging procedure. This ensures that, by the time the nudging procedure has achieved a steady geometry, the model has been trained to produce ice fluxes that closely match observations. In other words, the ice-sheet model is “trained” to equilibrate toward a state that implicitly accounts for observed mass-change rates. As a result, it is important to note that the Ctrldhdt experiment starts from a slightly different initial state than the Ctrl and damage experiments (see Figs. S1 and S2 in the Supplement).
To evaluate the modeled initial conditions, we compute the root mean square error (RMSE) and the relative RMSE (rRMSE) between simulated and observed ice velocity (Rignot et al., 2017) and ice thickness (Morlighem et al., 2020):
where n is the number of grid points; simi and obsi are the simulated and observed ice velocity (Rignot et al., 2017) or thickness (Morlighem et al., 2020), respectively; and is the mean observed ice velocity or thickness. In addition, we estimate the mean distance between the modeled and observed grounding-line position using the “open-ended box” approach of Moon and Joughin (2008).
Following the standard initialization procedure (used in the Ctrl and damage experiments), the RMSE (rRMSE) values between simulated and observed ice velocity and thickness are 201 m a−1 (1.66) and 28 m (0.01) for the whole basin and 786 m a−1 (0.98) and 28 m (0.1) for floating ice only (Fig. S1). The modeled grounding-line position of the TG basin is in good agreement with observations (Gardner et al., 2018), with an average offset of 1.3 km. For the initial state of the Ctrldhdt experiment, the RMSE (rRMSE) values of ice velocity and thickness are 172 m a−1 (1.42) and 27 m (0.01) for the whole basin and 659 m a−1 (0.83) and 54 m (0.13) for floating ice only (Fig. S2). The modeled grounding-line position also closely aligns with observations, with an average offset of 2.3 km.
3.1 Effects of ice damage on the simulated historical evolution of Thwaites Glacier (1990–2020)
The 43-member ensemble of simulations over 1990–2020 in the TG basin shows a strong sensitivity to ice damage (Fig. 2), resulting in a wide spread of mass-change estimates. The simulated ice mass loss ranges from 0.03 to 1.42 cm sea-level equivalent (SLE). Among the 43 parameter sets for C1 and Ctr, 16 are classified into Group 1 (Table 1, Table S1 in the Supplement, and light-green lines in Fig. 2), while the remaining 27 fall into Group 2 (light-red lines in Fig. 2). In Group 1, the simulated ice mass change in the TG basin ranges from 0.16 to 0.31 cm SLE, with a mean change of 0.24±0.04 cm SLE. In comparison, the mean of Group 2 is 0.62±0.36 cm SLE, that is 2.5 times larger.
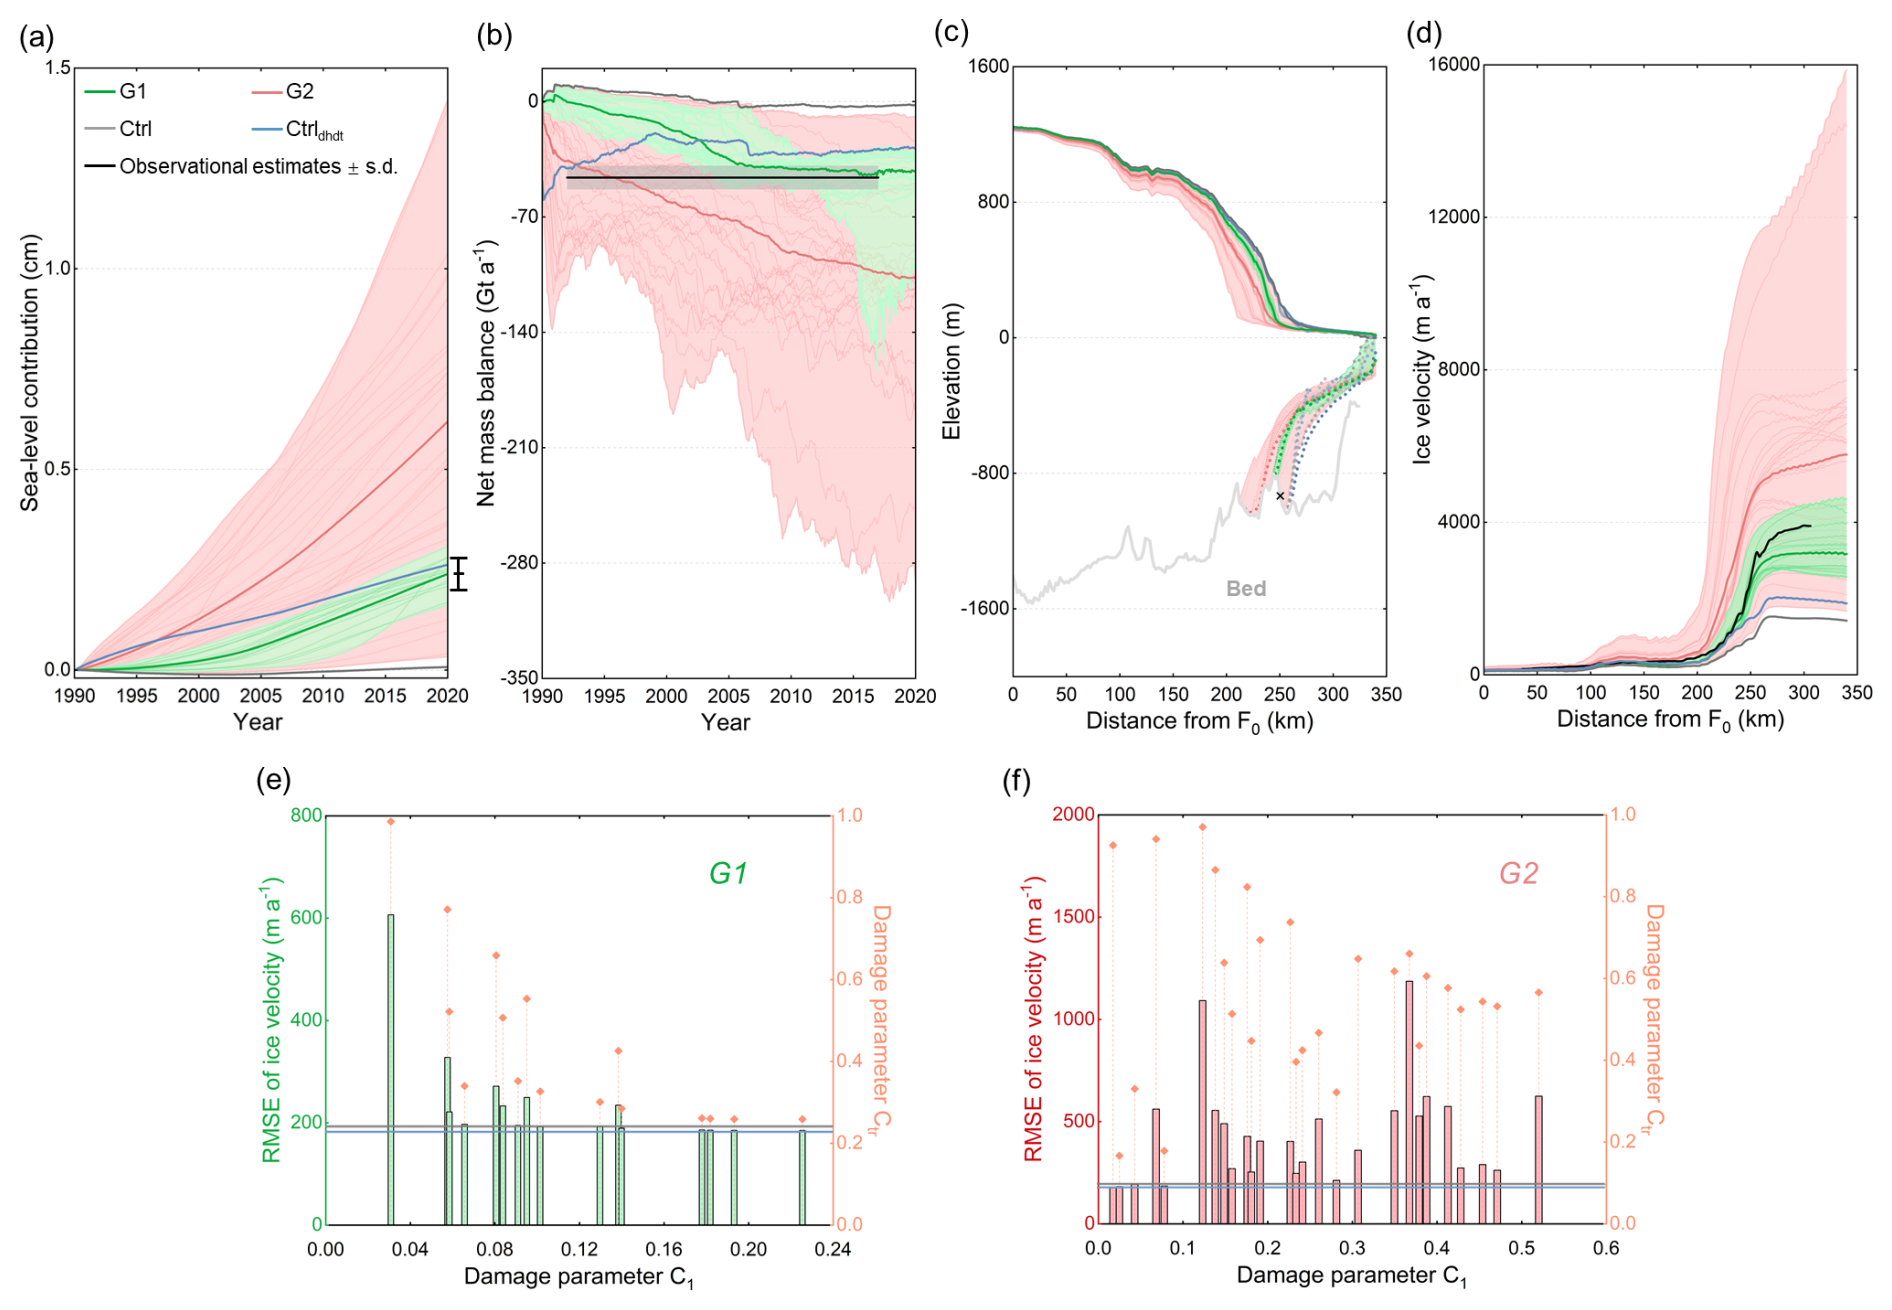
Figure 2Simulated change trends of ice mass balance and grounding-line position in the TG basin under different damage intensities over the period 1990–2020. (a) The simulated contribution of ice mass loss in the TG basin to sea level; (b) the net mass balance (considering volume above flotation only, i.e., the rate of mass change contributing to sea-level rise) in the TG basin; (c) the geometry profiles along the central flowline profile (solid black line in Fig. 1) and the simulated (dashed red and green lines) grounding-line positions; and (d) the simulated ice velocity along the central flowline profile. RMSEs between the simulated and observed ice velocity under different parameter combinations of C1 and Ctr in (e) Group 1 and (f) Group 2. The dark-red and green lines in panels (a)–(d) represent the mean, and the hatched area represents the ensemble range, i.e., spread between maximum/minimum values. The vertical black lines on the right side of panel (a) represent the observed mean value ±1 standard deviation (Shepherd et al., 2019). The black line and shaded area in panel (b) represent the observed mean value ±1 standard deviation (Shepherd et al., 2019). The gray line represents the simulation result of the model that ignored ice damage processes and did not integrate satellite-based observations of present-day mass-change rates to constrain the model initialization (Ctrl experiment), and the blue line represents the simulation result of the model that ignored ice damage processes but integrated satellite-based observations to constrain the model initialization (Ctrldhdt experiment). In panel (c), the dashed light-gray and blue lines represent the initial grounding-line positions for the Ctrl/damage experiments and the Ctrldhdt experiment, and the black cross marks the location of the observed grounding-line position (Gardner et al., 2018).
The explicit representation of ice damage processes better captures the observed ice mass change in the TG basin compared to the default model without damage (Ctrl experiment in Fig. 2). For the period 1990–2020, the simulated mean net mass balance for Group 1 (with damage) is , which is comparable to satellite-derived observations ( over 1992–2017; mean ±1 SD). In contrast, neglecting ice damage underestimates ice mass change by more than an order of magnitude, with the Ctrl experiment simulating only 1.2 Gt a−1. The Ctrldhdt experiment, which also ignores ice damage but applies an artificial correction to the ice-mass-change rate, yields a simulated net mass balance of over 1990–2020, comparable to estimates from Group 1.
By 2020, the simulated grounding lines from Group 1 (dashed green lines in Fig. 2c) have retreated 6–14 km inland along the central flowline compared to their initial position (dashed light-gray line in Fig. 2c). This corresponds to a retreat rate of 0.2–0.5 km a−1 over 1990–2020 along the central flowline profile (green lines in Fig. 3), similar in magnitude to observations, which indicate a mean annual retreat rate of 0.7 km a−1 over 1992–2011 (Rignot et al., 2014) and of 0.3–0.6 km a−1 over 2011–2017 (Milillo et al., 2019). In contrast, the simulated grounding lines of Group 2 retreat at rates of up to 1.5 km a−1 along the central flowline profile, resulting in a total retreat of up to 44 km upstream the initial grounding-line position by 2020 (Fig. 2c and red line in Fig. 3). While both control experiments show reduced retreat along the central flowline profile during the historical simulation period (Fig. 2c), the grounding-line retreat in the eastern section of TG in the Ctrldhdt experiment is comparable to that of Group 1 (Fig. 3). In contrast, the retreat in the Ctrl experiment remains relatively minor.
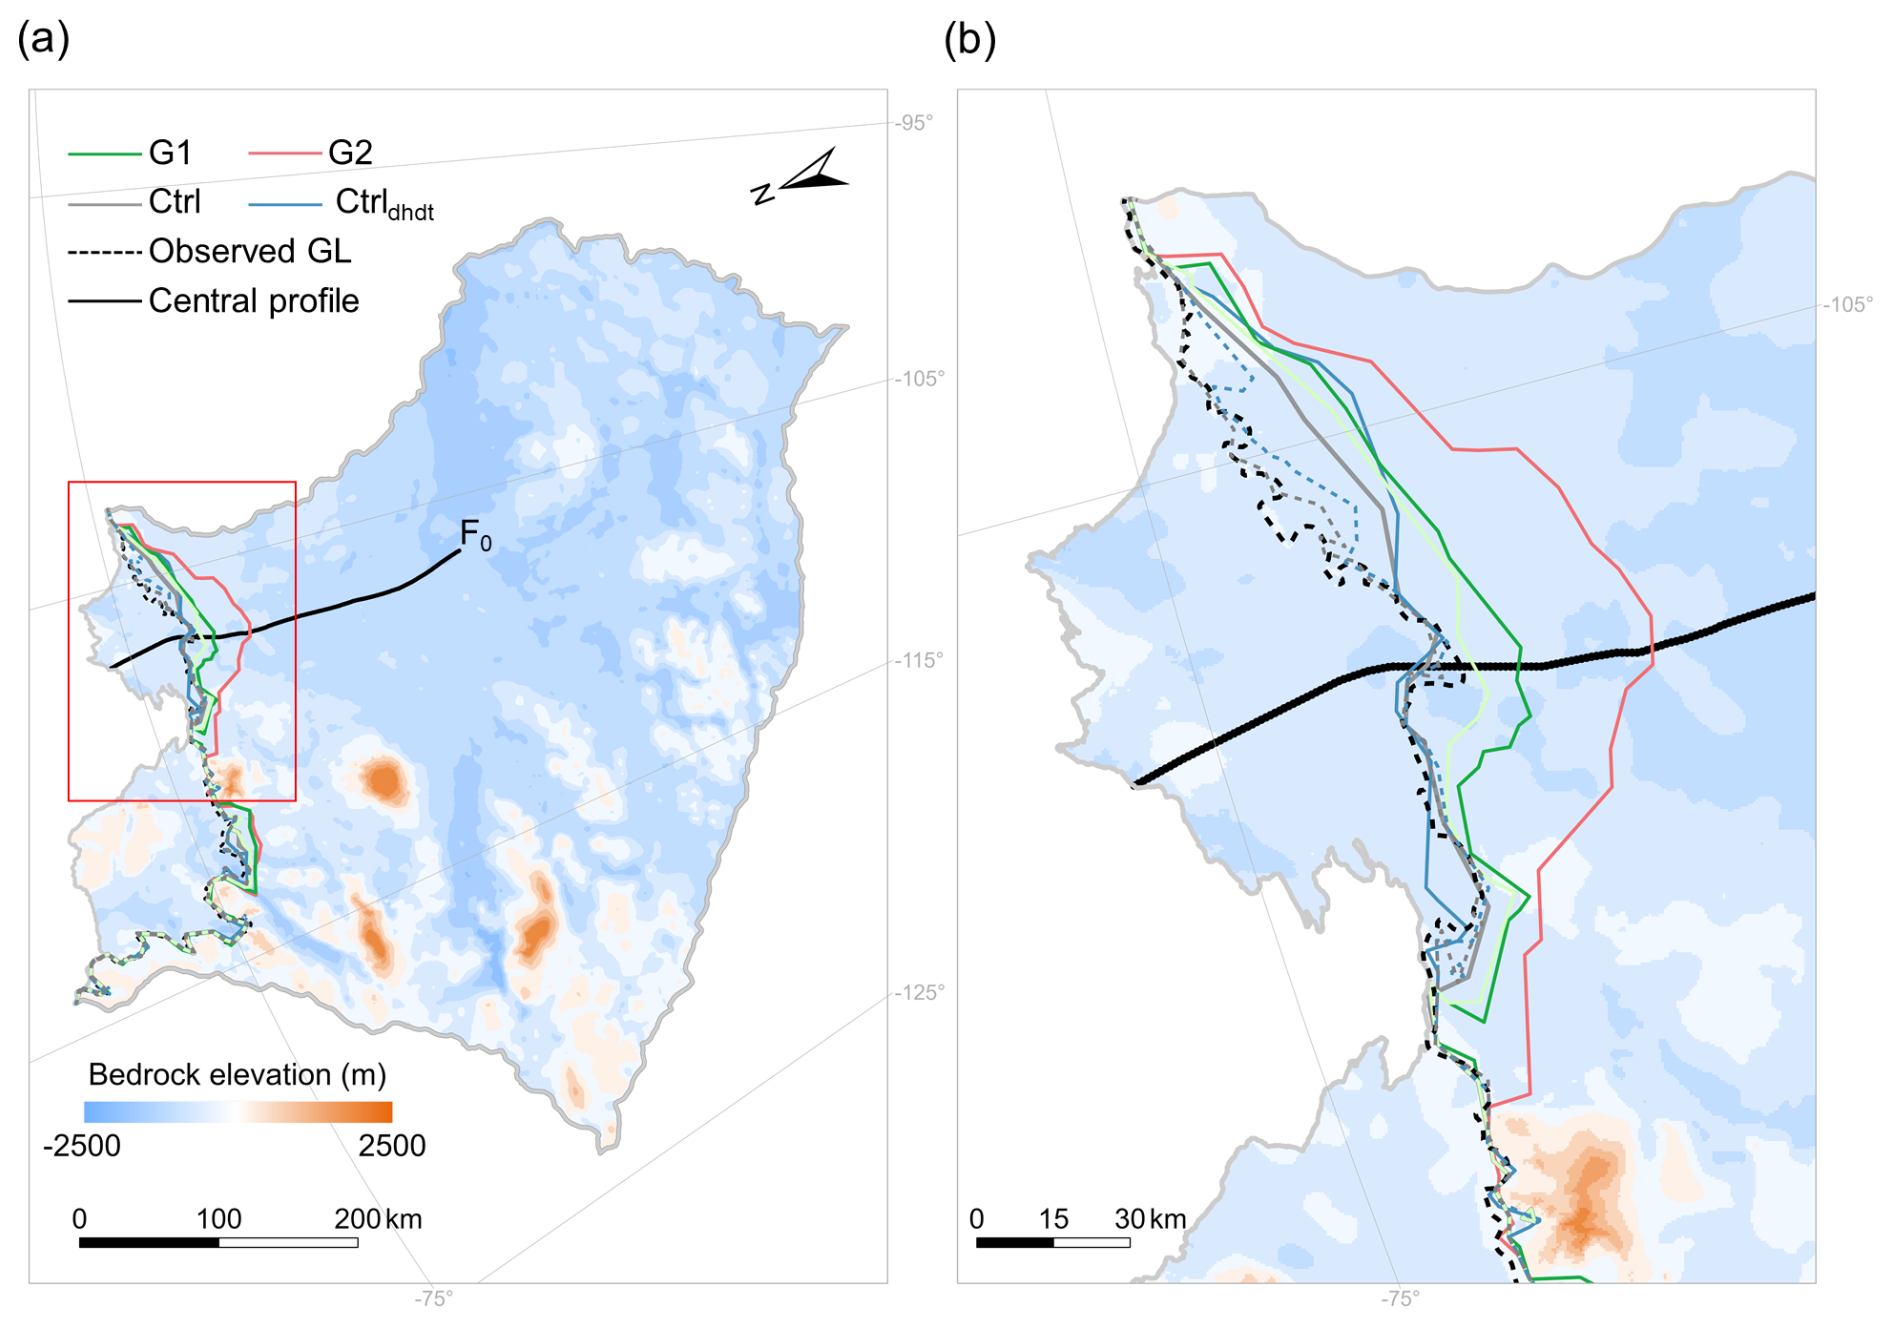
Figure 3Spatial pattern of the grounding-line positions in the TG basin over the historical period 1990–2020 under different damage intensities. (a) Evolution of the grounding-line positions within the TG basin and (b) an enlarged view of the red box in (a). The light-green and dark-green lines represent the experiments with the least and the most grounding-line retreat in Group 1, and also correspond to the experiments with the lowest and highest damage intensity in Group 1. The red line represents the experiment with the most grounding-line retreat in Group 2 and also corresponds to the experiment with the highest damage intensity in Group 2 over the historical period 1990–2020. The dashed black line presents the observed grounding-line position (Gardner et al., 2018). The solid blue and gray lines present simulated grounding-line positions of the Ctrldhdt and Ctrl experiments in 2020, respectively. The background image in panel (a) is the observed bedrock elevation of the TG basin derived from BedMachine v2 data (Morlighem et al., 2020), while the solid black curve indicates the central flowline profile stemming from the Antarctic surface flowline dataset developed by Liu et al. (2015), spanning 340 km from the inland grounded ice (F0) to the calving front. The solid light-gray line delineates the TG basin boundary based on Zwally et al. (2015). The dashed gray and blue lines are the initial grounding-line positions of the Ctrl/damage experiments and the Ctrldhdt experiment, respectively.
The incorporation of ice damage induces a notable increase in simulated ice velocity over the historical period (Figs. 2d–f and 4). By 2020, the mean RMSEs (rRMSEs) of simulated ice velocities in Group 1 and Group 2 simulations are (1.6) and (1.9) for the whole basin and (1.2) and (1.5) for floating ice only. For comparison, the RMSEs (rRMSEs) between observed and simulated ice velocities in the Ctrldhdt and Ctrl experiments are 181 m a−1 (1.5) and 191 m a−1 (1.58) for the whole basin and 753 m a−1 (0.97) and 745 m a−1 (0.92) for floating ice only. This suggests that the parameter values enabling a reasonable reproduction of the observed ice mass loss in the TG basin (i.e., the ensemble of Group 1) also allow for a reasonable representation of ice velocity, whereas those in Group 2 lead to significantly larger discrepancies (Fig. 2d). Among all Group 1 simulations, the lowest RMSE between observed and simulated ice velocity occurs when C1 and Ctr are set to 0.23 and 0.26, respectively (Fig. 4a–d). Along the central flowline, ignoring damage largely underestimates the ice flow speeds that are currently observed (Fig. 2d).
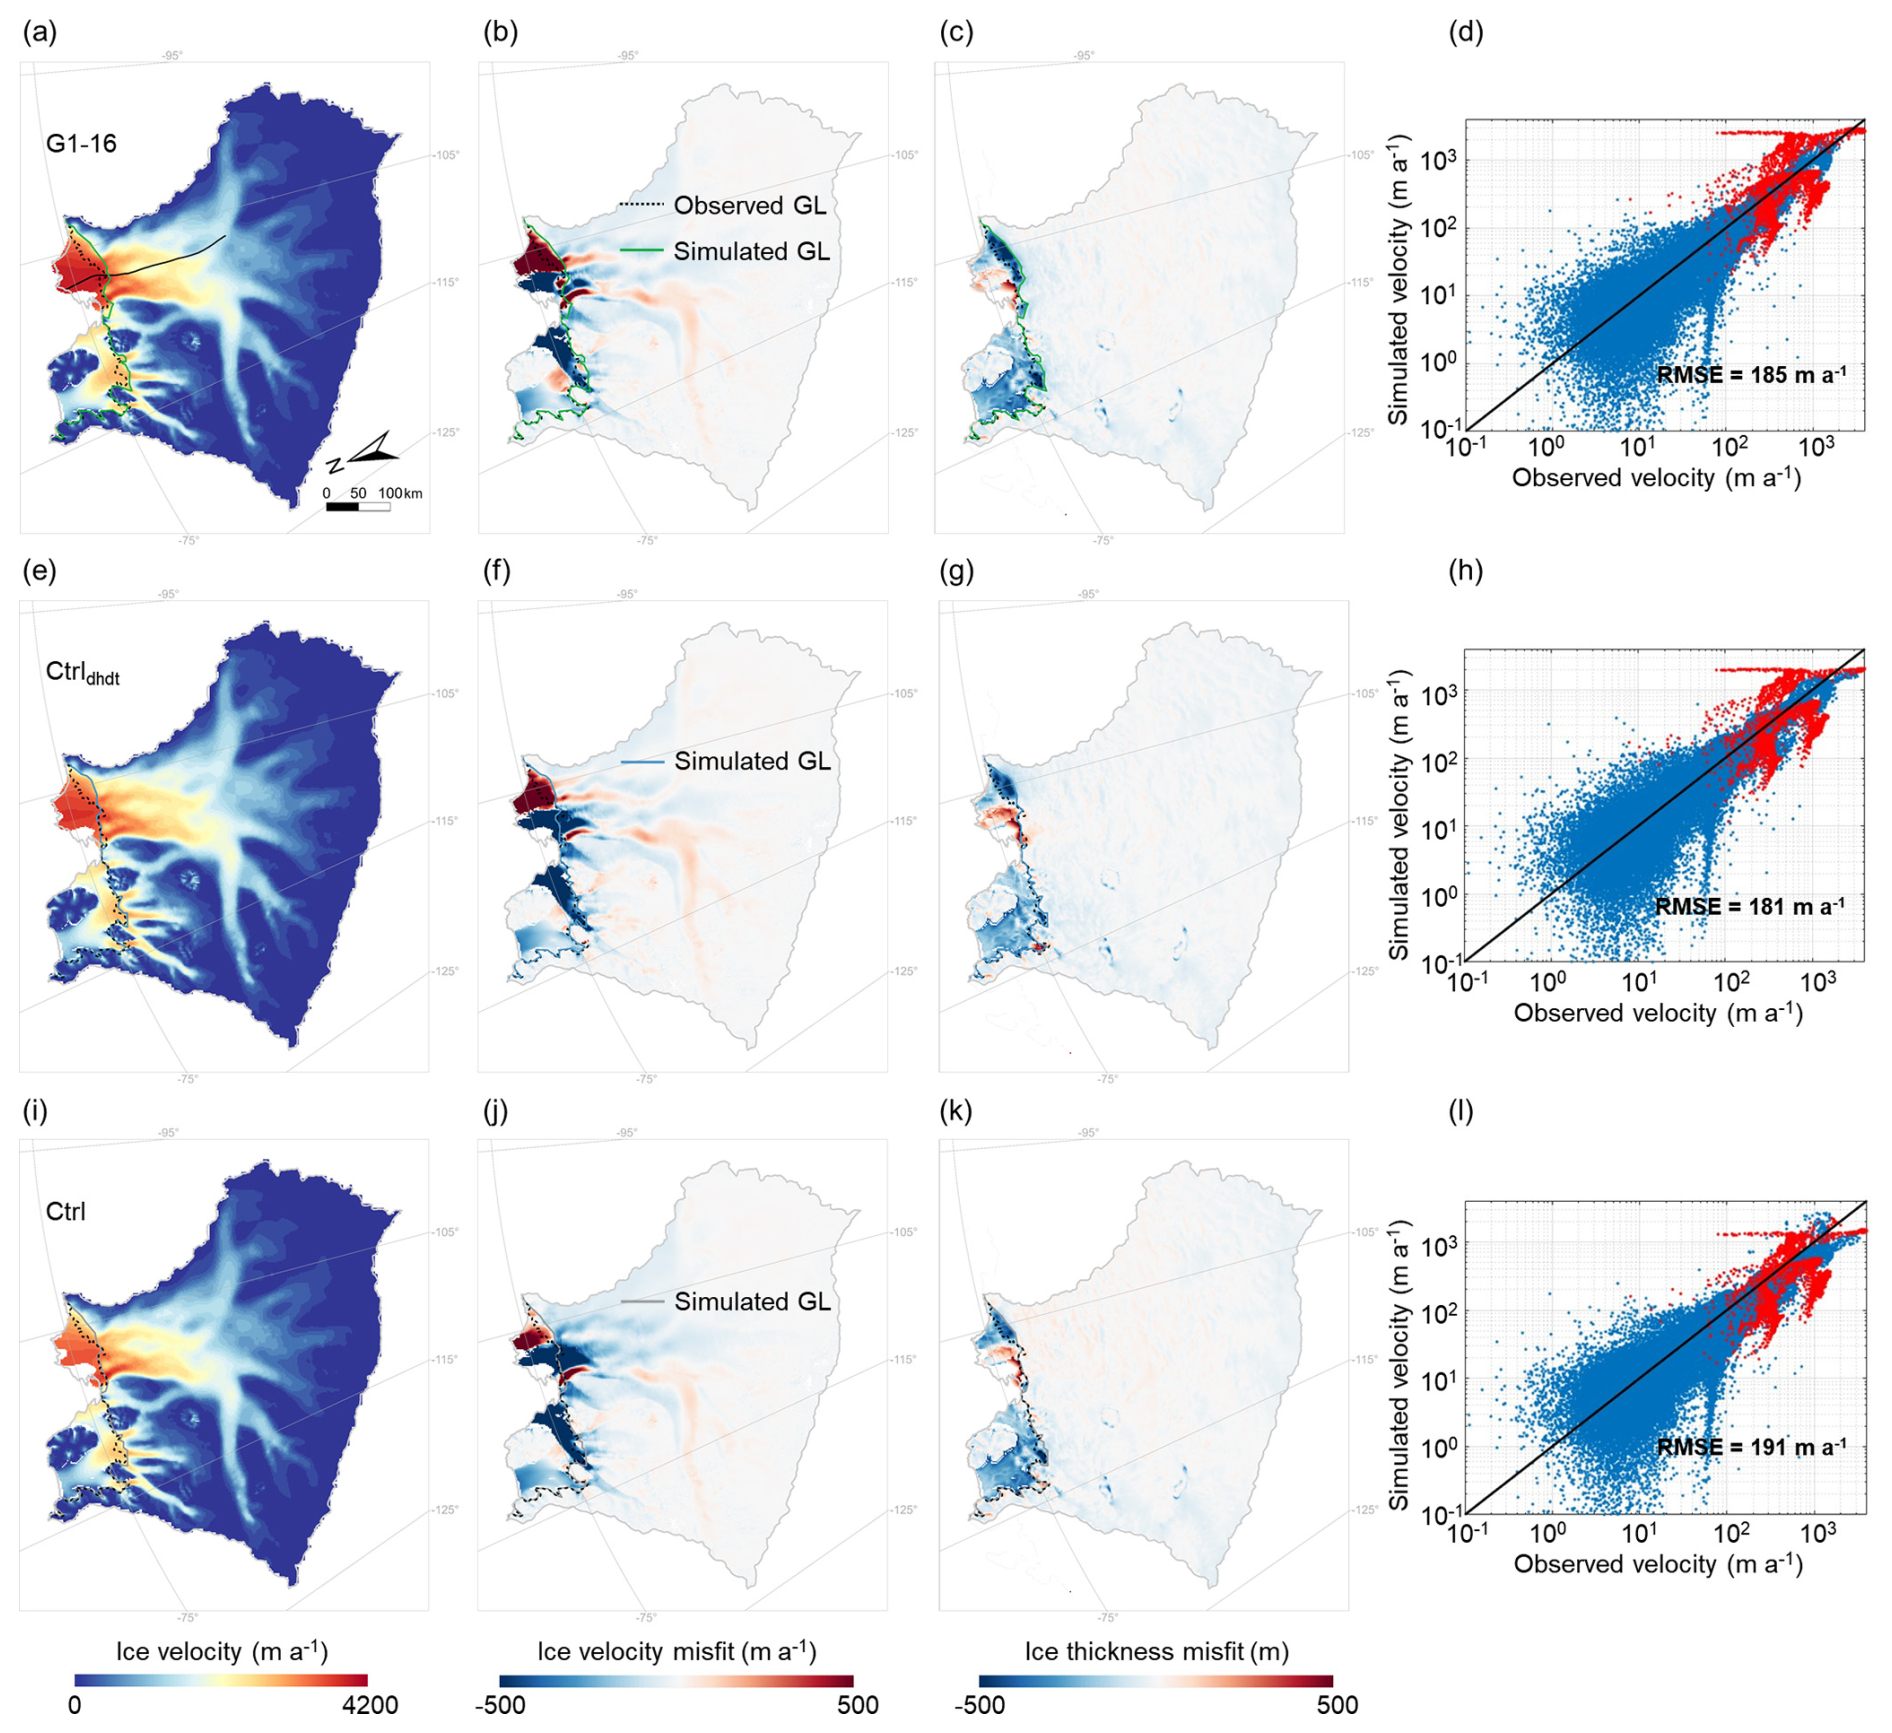
Figure 4Simulated ice velocity and ice thickness under different simulation experiments over the historical period 1990–2020. G1-16 denotes the simulation experiment in the ensemble of Group 1 (C1=0.23, Ctr=0.26) that gives the most accurate (lowest RMSE) ice velocity simulation results. The Ctrldhdt and Ctrl are the two simulation experiments of the model with deactivated damage processes (see Sect. 2 for details). Panels (a), (e), and (i) show the spatial distribution of simulated ice velocity in the TG basin of different simulation experiments. Panels (b), (f), and (j) show the difference between simulated and observed ice velocities. Panels (c), (g), and (k) show the difference between simulated and observed ice thickness. Panels (d), (h) and (l) show the comparison between simulated and observed ice velocities at each grid cell in the TG basin, with blue and red dots representing the grid cells of grounded ice and floating ice, respectively. In all maps, the dashed black lines are the observed grounding line (Gardner et al., 2018), the solid lines are the simulated grounding lines, and the light-gray line is the basin boundary of the TG basin derived from Zwally et al. (2015). The solid black curve in (a) is the central flowline profile stemming from the Antarctic surface flowline dataset developed by Liu et al. (2015).
The evolution of the vertically averaged ice damage pattern for different ensemble members is shown in Fig. 5. Overall, we reproduce a widespread distribution of damage within the ice shelves of the TG basin, with lower values close to the grounding line (e.g., ranging from 0.07 for lower damage intensity to 0.24 for higher damage intensity by 2020, Fig. 5e–g) and in confined regions of the shelf. The damage fraction increases towards the ice-shelf front (Fig. 5), reflecting the formation of fractures in the upstream regions – such as near the grounding line and shear margins – and their subsequent advection with ice flow. On grounded ice, damage remains low, with values generally below 0.01 across most regions. This can be attributed to the combined effects of low viscous stress and ice overburden counteracting basal crevasse formation (Sun et al., 2017). For comparison, Fig. 5a presents the distribution of crevasses observed across the ice shelves of the TG basin, derived from Landsat-8 satellite images taken in December 2020. Our vertically averaged ice damage patterns tend to overestimate damage on the Dotson ice shelf, suggesting the need for a threshold stress parameter to better capture damage initiation. In contrast, ice fracture is underestimated in the Thwaites Western Glacier Tongue, likely due to the stabilizing influence of the northwest pinning point (Surawy-Stepney et al., 2023).
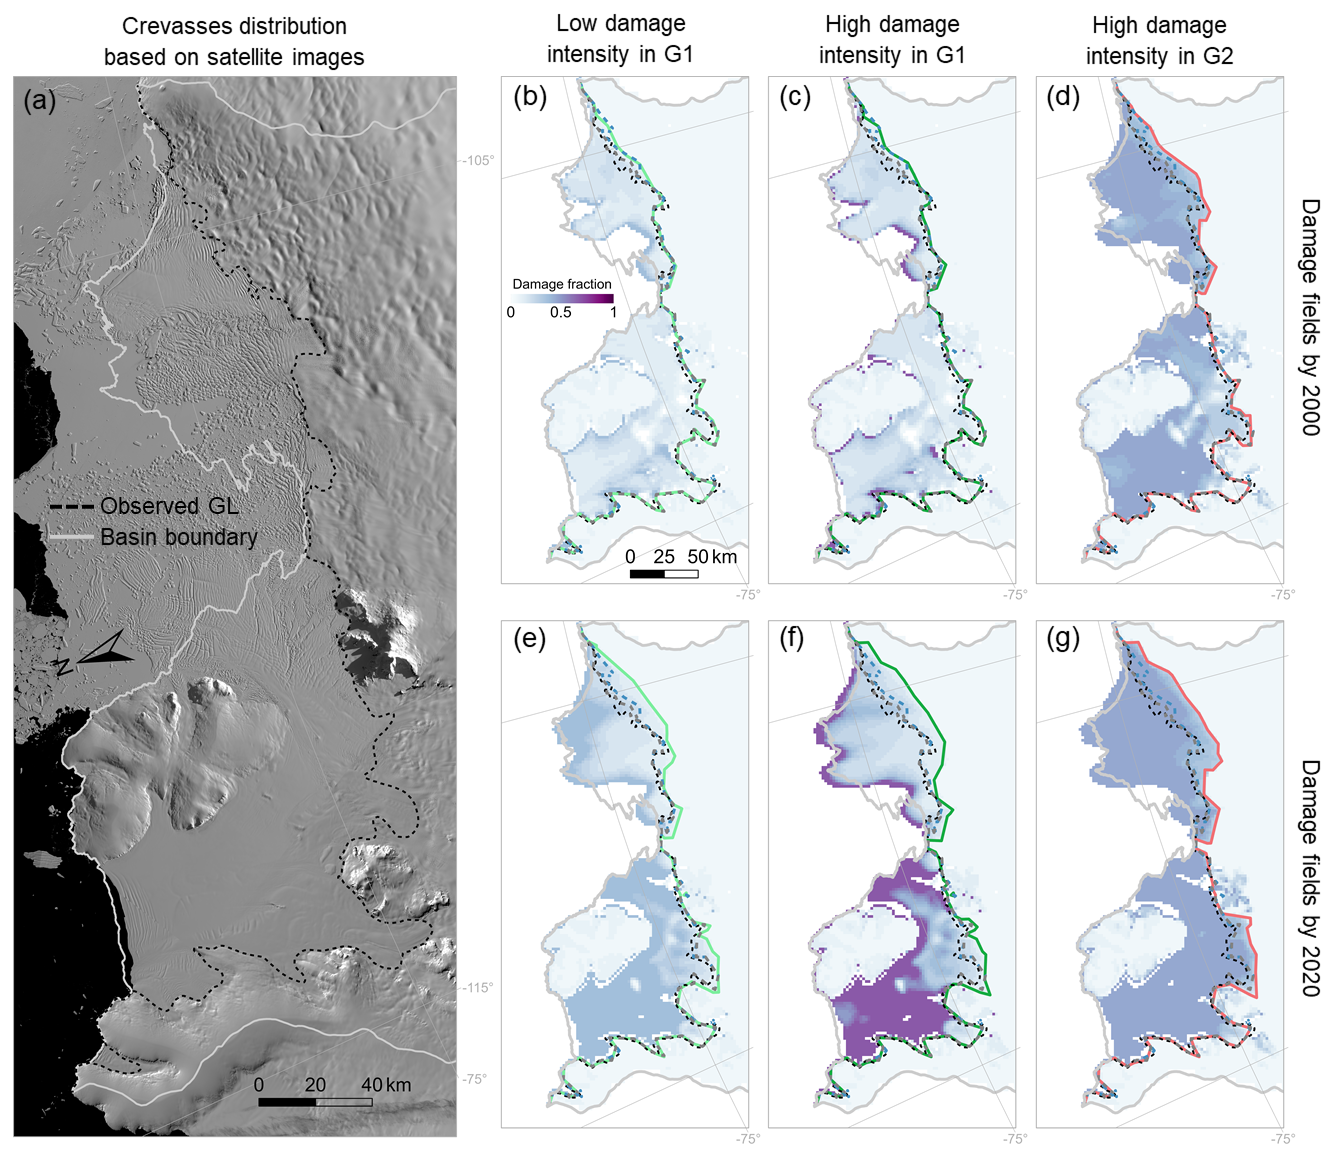
Figure 5Damage distribution in the TG basin. (a) Observed crevasse distributions across the ice shelves of the TG basin, based on Landsat-8 satellite images acquired in December 2020. Vertically averaged damage fields (i.e., ) in the year 2000 and 2020 of the low damage intensity of Group 1 (G1) are shown in (b) and (e), the high damage intensity of G1 in (c) and (f), and the high damage intensity of Group 2 (G2) in (d) and (g). The dashed black line is the observed grounding line (Gardner et al., 2018). The light-gray line is the basin boundary of the TG basin derived from Zwally et al. (2015). The dashed gray and blue lines present the initial grounding-line positions of the Ctrl/damage experiments and the Ctrldhdt experiment, respectively.
3.2 Effects of ice damage on the future evolution of Thwaites Glacier
Extending simulations to the year 2300 under constant present-day climate conditions reveals that accounting for ice damage leads to higher ice velocity, reduced upstream ice thickness, accelerated grounding-line retreat, and greater ice mass loss compared to simulations that neglect damage processes (Figs. 6 and 7). While both G1 simulations and the Ctrldhdt experiment reproduce historical mass-change trends consistent with observations, they begin to diverge after approximately 15 years, around 2035. The increasing mass loss in G1 simulations suggests a positive feedback between damage processes and ice-shelf weakening in the TG basin. Ice-shelf thinning and weakening, reproduced in both experiments over the historical period (Fig. 4c and g), lead to increased ice velocity and decreased upstream ice thickness. In G1 simulations, this further stimulates damage formation and propagation, amplifying mass loss. Although reduced ice thickness could decrease the driving stress, potentially limiting damage formation, our model damage primarily depends on strain rates, which increase in thinning ice shelves as buttressing is reduced.
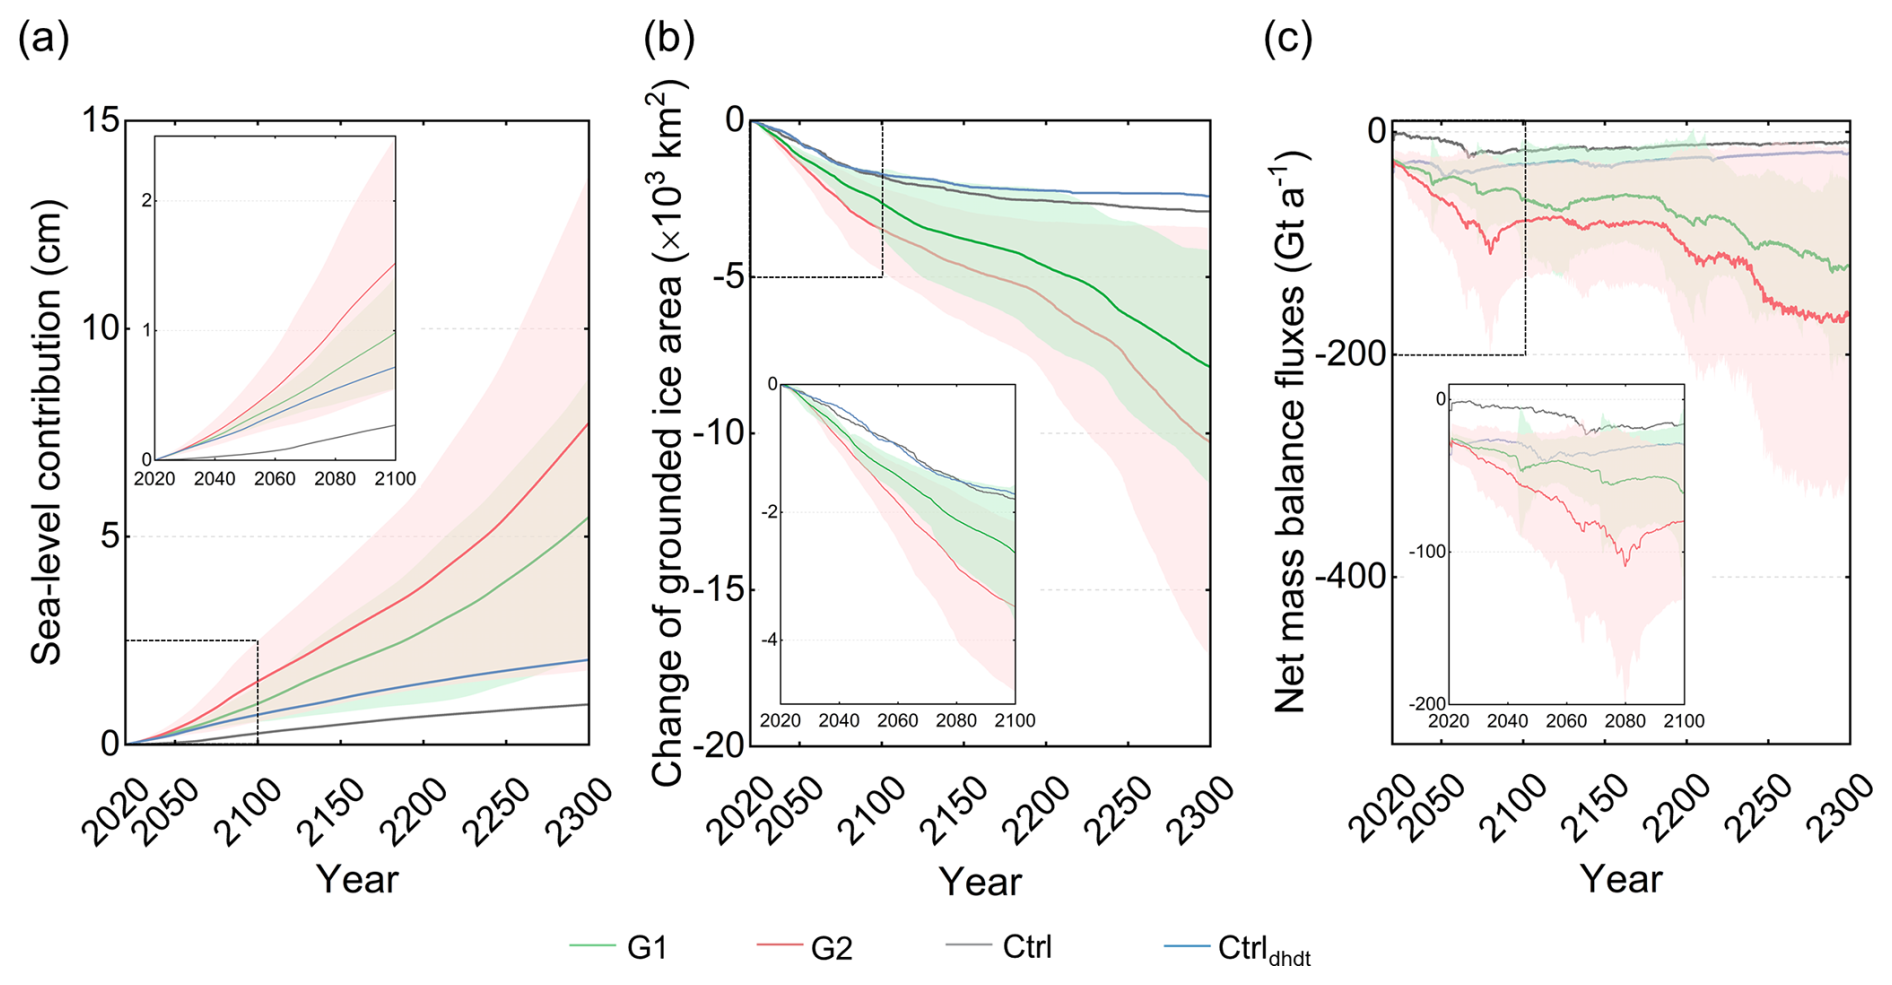
Figure 6Evolution of (a) the simulated contribution to sea level, (b) the change in grounded ice area, and (c) the net mass balance of the TG basin over the projection period 2020–2300 under constant present-day conditions. Note that the net mass balance does not correspond to the sum of all mass balance components (i.e., surface mass balance, sub-shelf melt, and calving fluxes); instead, it accounts for changes in the volume above flotation, which can be interpreted as the rate of mass change contributing to sea-level rise. In all panels, the solid line represents the mean, and the hatched area represents the ensemble standard deviation. The dashed black rectangular insets in each panel show the evolution of the simulation results with a focus on the period 2020–2100.
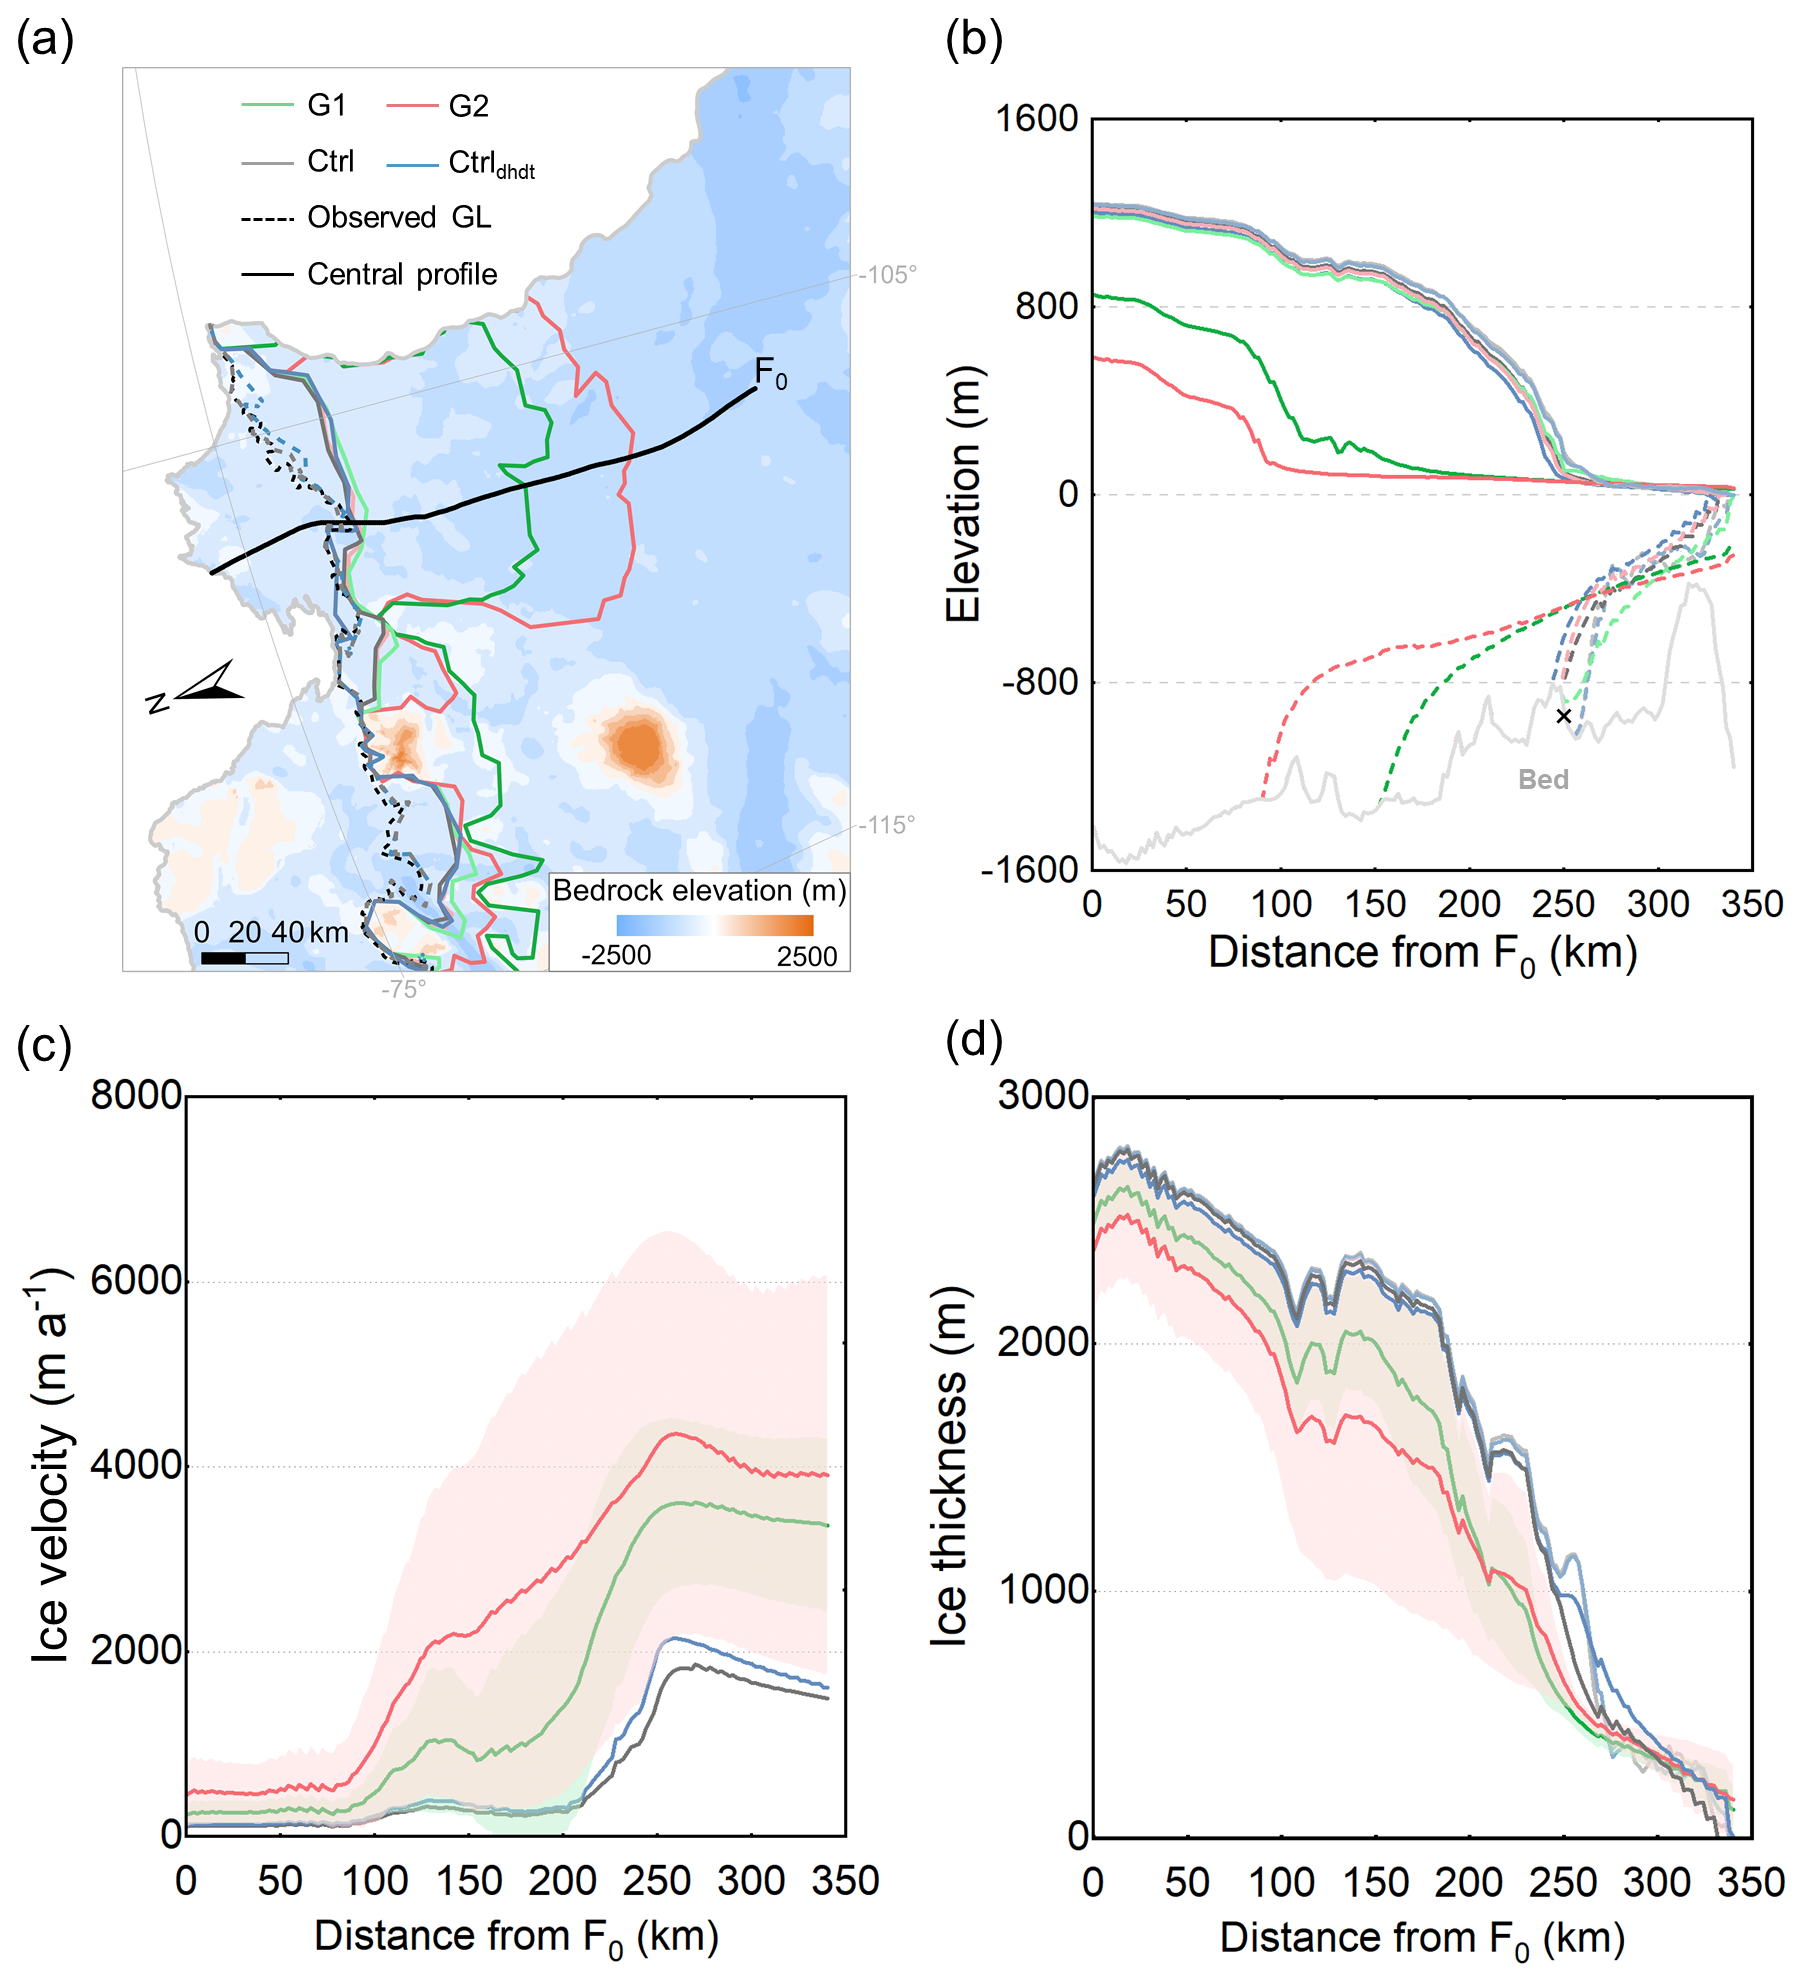
Figure 7(a) Spatial evolution of grounding-line position. Evolution of (b) ice geometry, (c) ice velocity, and (d) ice thickness along the central flowline profile (black curve in a) in TG by 2300. The light-green (red) and dark-green (red) lines in panels (a) and (b) represent the experiments with the least and the most retreat of the grounding line in Group 1 (Group 2), respectively, which also correspond to the experiments with the lowest and highest damage intensity in Group 1 (Group 2). The background image in panel (a) is the observed bedrock elevation of the TG basin derived from BedMachine v2 data (Morlighem et al., 2020), and the basin boundary is derived from Zwally et al. (2015). In panel (b), the dashed light-gray and blue lines are the initial grounding-line positions of the Ctrl/damage experiments and the Ctrldhdt experiment, and the black cross marks the location of the observed grounding-line position (Gardner et al., 2018). In panels (c) and (d), the solid line represents the mean, and the hatched area represents the ensemble standard deviation. The light-gray and blue lines in panel (d) are the initial ice thickness along the central flowline profile of the Ctrl/damage experiments and the Ctrldhdt experiment, respectively.
By 2300, the simulated mean ice mass loss in Group 1 reaches 5.5±3.3 cm sea-level equivalent – 5 times higher than in the Ctrl simulations (1 cm) and more than twice that of the Ctrldhdt (2 cm) experiments (Fig. 6a). Along the central flowline profile of TG (black line in Figs. 1 and 7a), the mean ice velocity in Group 1 increases from for the grounded ice sheet (F0) to at the ice front, where it is more than twice the control simulations (Fig. 7c). Compared to the simulated initial ice thickness (light-gray line in Fig. 7d), the average thinning along the central flowline profile in Group 1 is approximately 267 m, more than 5 times greater than the control simulations (Fig. 7d). As a result, the grounding line retreats further inland along a retrograde-slope bed (Fig. 7a and b), suggesting that the retreat may be driven by marine ice-sheet instability mechanisms once the ice shelf becomes weak enough. In the case of a G1 ensemble member with high damage intensity, the grounding line retreats up to about 102 km along the central flowline profile (dark-green lines in Fig. 7a and b), compared to the simulated initial grounding line (dashed light-gray line in Fig. 7b). In contrast, in the control simulations, the grounding line remains on a bedrock ridge, limiting sustained retreat and thus enhancing stability. Ensemble members with lower damage intensities (light-red and green lines in Fig. 7a and b) also show less retreat compared to the initial grounding-line position. However, even these cases exhibit noticeable retreat across the TG basin, particularly in the upstream glacier area of TEIS.
In Group 2 (high damage intensity members, Table 1), 18 out of 27 simulations resulted in model failure before 2300 (dashed dark-red lines in Fig. 8a). Since the Thwaites Glacier drainage basin boundaries remain fixed, the model encounters numerical instability and eventually stops when the grounding line approaches these boundaries. This numerical failure is thus linked to basin collapse and arises from both numerical and physical instabilities. These 18 members are labeled G2ext (Fig. 8 and Table S1). Trends shown for G2 in Figs. 6 and 7 are hence based only on the remaining 9 members. For these 9 members, the simulated mean ice mass loss reaches 1.5 cm sea-level equivalent by 2100 and 7.7 cm by 2300. In comparison, the 18 members from G2ext show an average ice mass loss of 7.1±2.8 cm by 2100 (dark-red line and hatched area in Fig. 8b), which is 7 times higher than the Group 1 mean. In the most extreme case, the grounding line retreats 128 km inland from its 2020 position along the central flowline profile within just 80 years (dark-red line in Fig. 9), with an annual retreat rate 3 times higher than the most extreme case in Group 2 (light-red line in Fig. 9) and 5 times higher than that in Group 1 (dark-green line in Fig. 7a and b). By 2100, it reaches a retrograde-slope bed along the central flowline, suggesting a high potential for further inland retreat driven by marine ice-sheet instability mechanisms.
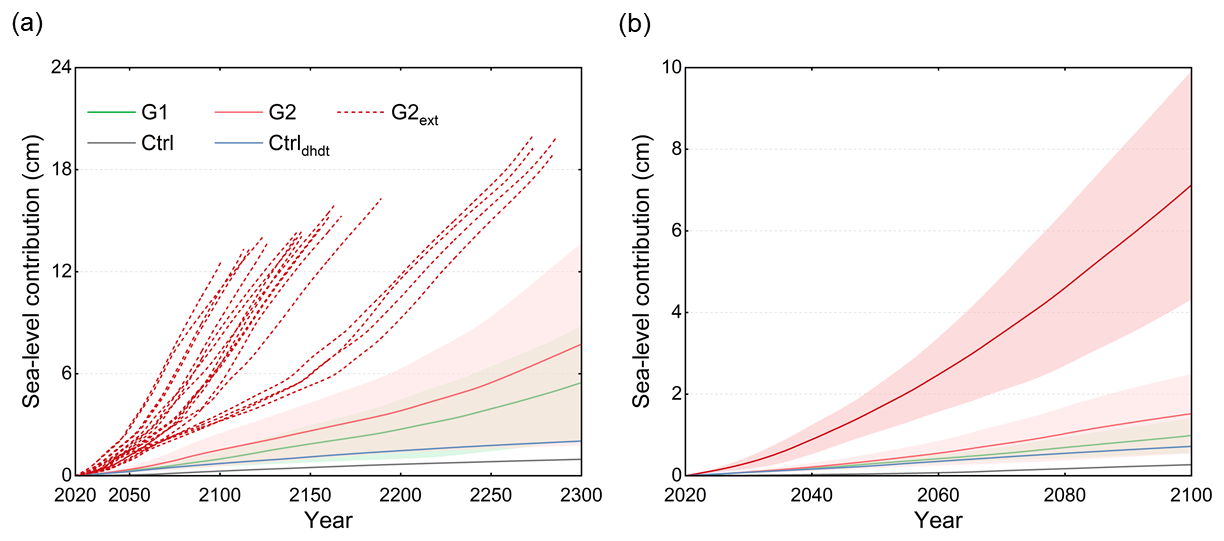
Figure 8Evolution of the contribution of ice mass loss to sea level of the TG basin over (a) the projection period 2020–2300 and (b) with a focus on the period 2020–2100 under constant present-day conditions. The dashed red lines in panel (a) represent experiments with higher damage intensities that led to a model failure before 2300 and were grouped into Group 2 extreme experiments (G2ext). The solid line represents the mean, and the hatched area represents the ensemble standard deviation.
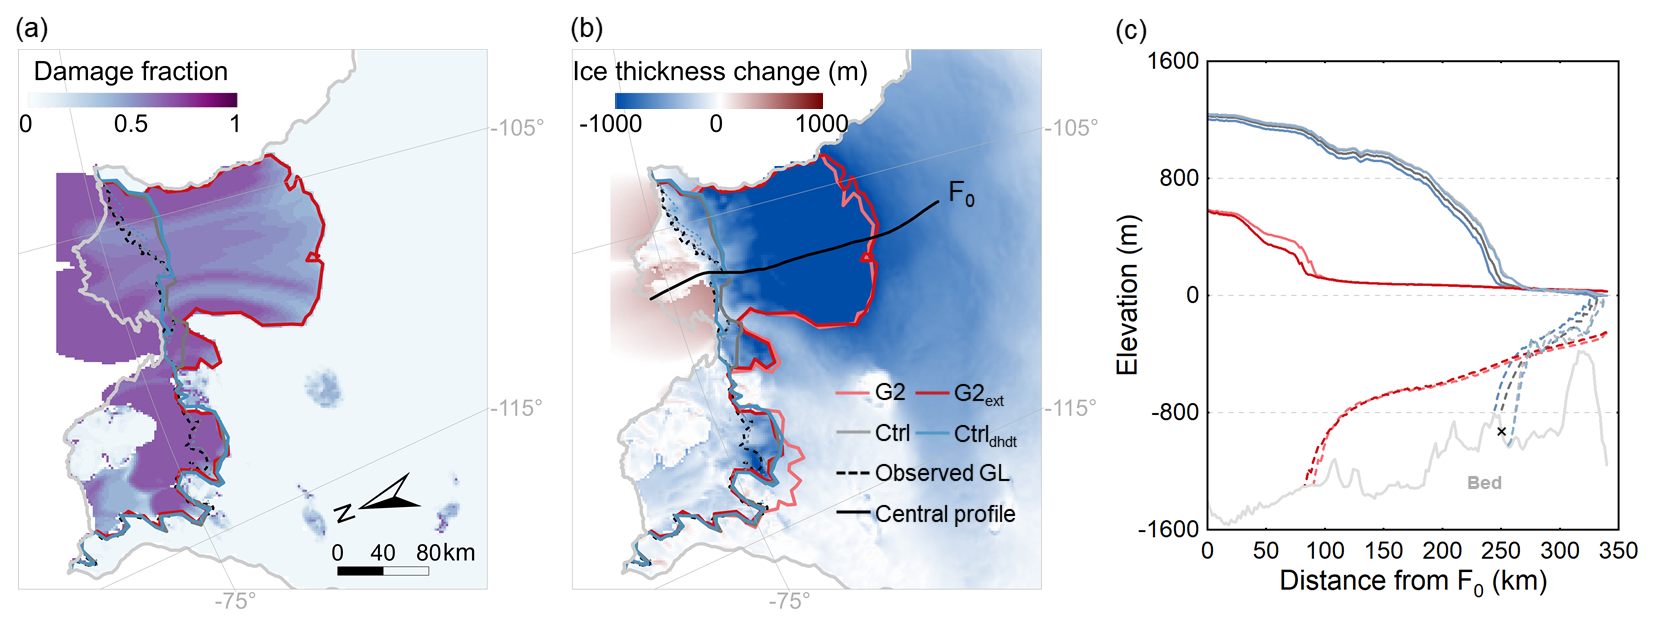
Figure 9(a) Damage field, (b) ice thickness change, and (c) ice geometry along the central flowline profile of the simulation with the highest damage intensity in G2ext in the year 2100. The solid dark-red (light-red) lines represent the spatial pattern of the simulated grounding-line position and the ice geometry along the central flowline profile of the simulation with the highest damage intensity in G2ext (G2) in the year 2100 (2300). In panels (a) and (b), the dashed black line presents the observed grounding-line position (Gardner et al., 2018); the solid blue and gray lines present simulated grounding-line positions of the Ctrldhdt and Ctrl experiments in 2300; the dashed gray and blue lines are the initial grounding-line positions of the Ctrl/damage experiments and the Ctrldhdt experiment; and the solid light-gray line is the TG basin boundary derived from Zwally et al. (2015). In panel (c), the dashed light-gray and blue lines are the initial grounding-line positions of the Ctrl/damage experiments and the Ctrldhdt experiment, and the black cross marks the location of the observed grounding-line position (Gardner et al., 2018).
Figure 10 shows the evolution of ice damage fields over time. Similar to the historical period (Fig. 5), the vertically averaged damage () fields in the ice-shelf region of the Thwaites Glacier follow a pattern of increase from the grounded glacier toward the front of the ice shelf (Fig. 10). Near the grounding line, the damage fraction remains relatively low, ranging from 0.07 in lower-damage simulations to 0.3 in higher-damage simulations. As ice flows toward the front, damage increases due to the combined effects of advection and local damage nucleation driven by increased strain rates. Damage fractions range from 0.3 in lower-damage cases to 0.7 in higher-damage cases, with particularly high damage concentrated in the shear zone. In the simulation with the highest damage intensity in G2ext, the damage fraction increased from 0.4 at the grounding-line position to 0.7 at the ice front and shear margin of the TG basin in the year 2100 (Fig. 9a). For almost all simulations, the high damage reproduced in the Dotson–Crosson area during the historical period (Fig. 5) seems to have contributed to a collapse of these ice shelves. Overall, while the buttressing effect of Thwaites Glacier's ice shelf on the upstream grounded ice may be limited (Gudmundsson et al., 2023), our results suggest that damage formation – primarily confined to the floating ice shelf – significantly affects the upstream grounded ice and has the potential to trigger substantial grounding-line retreat in the future.
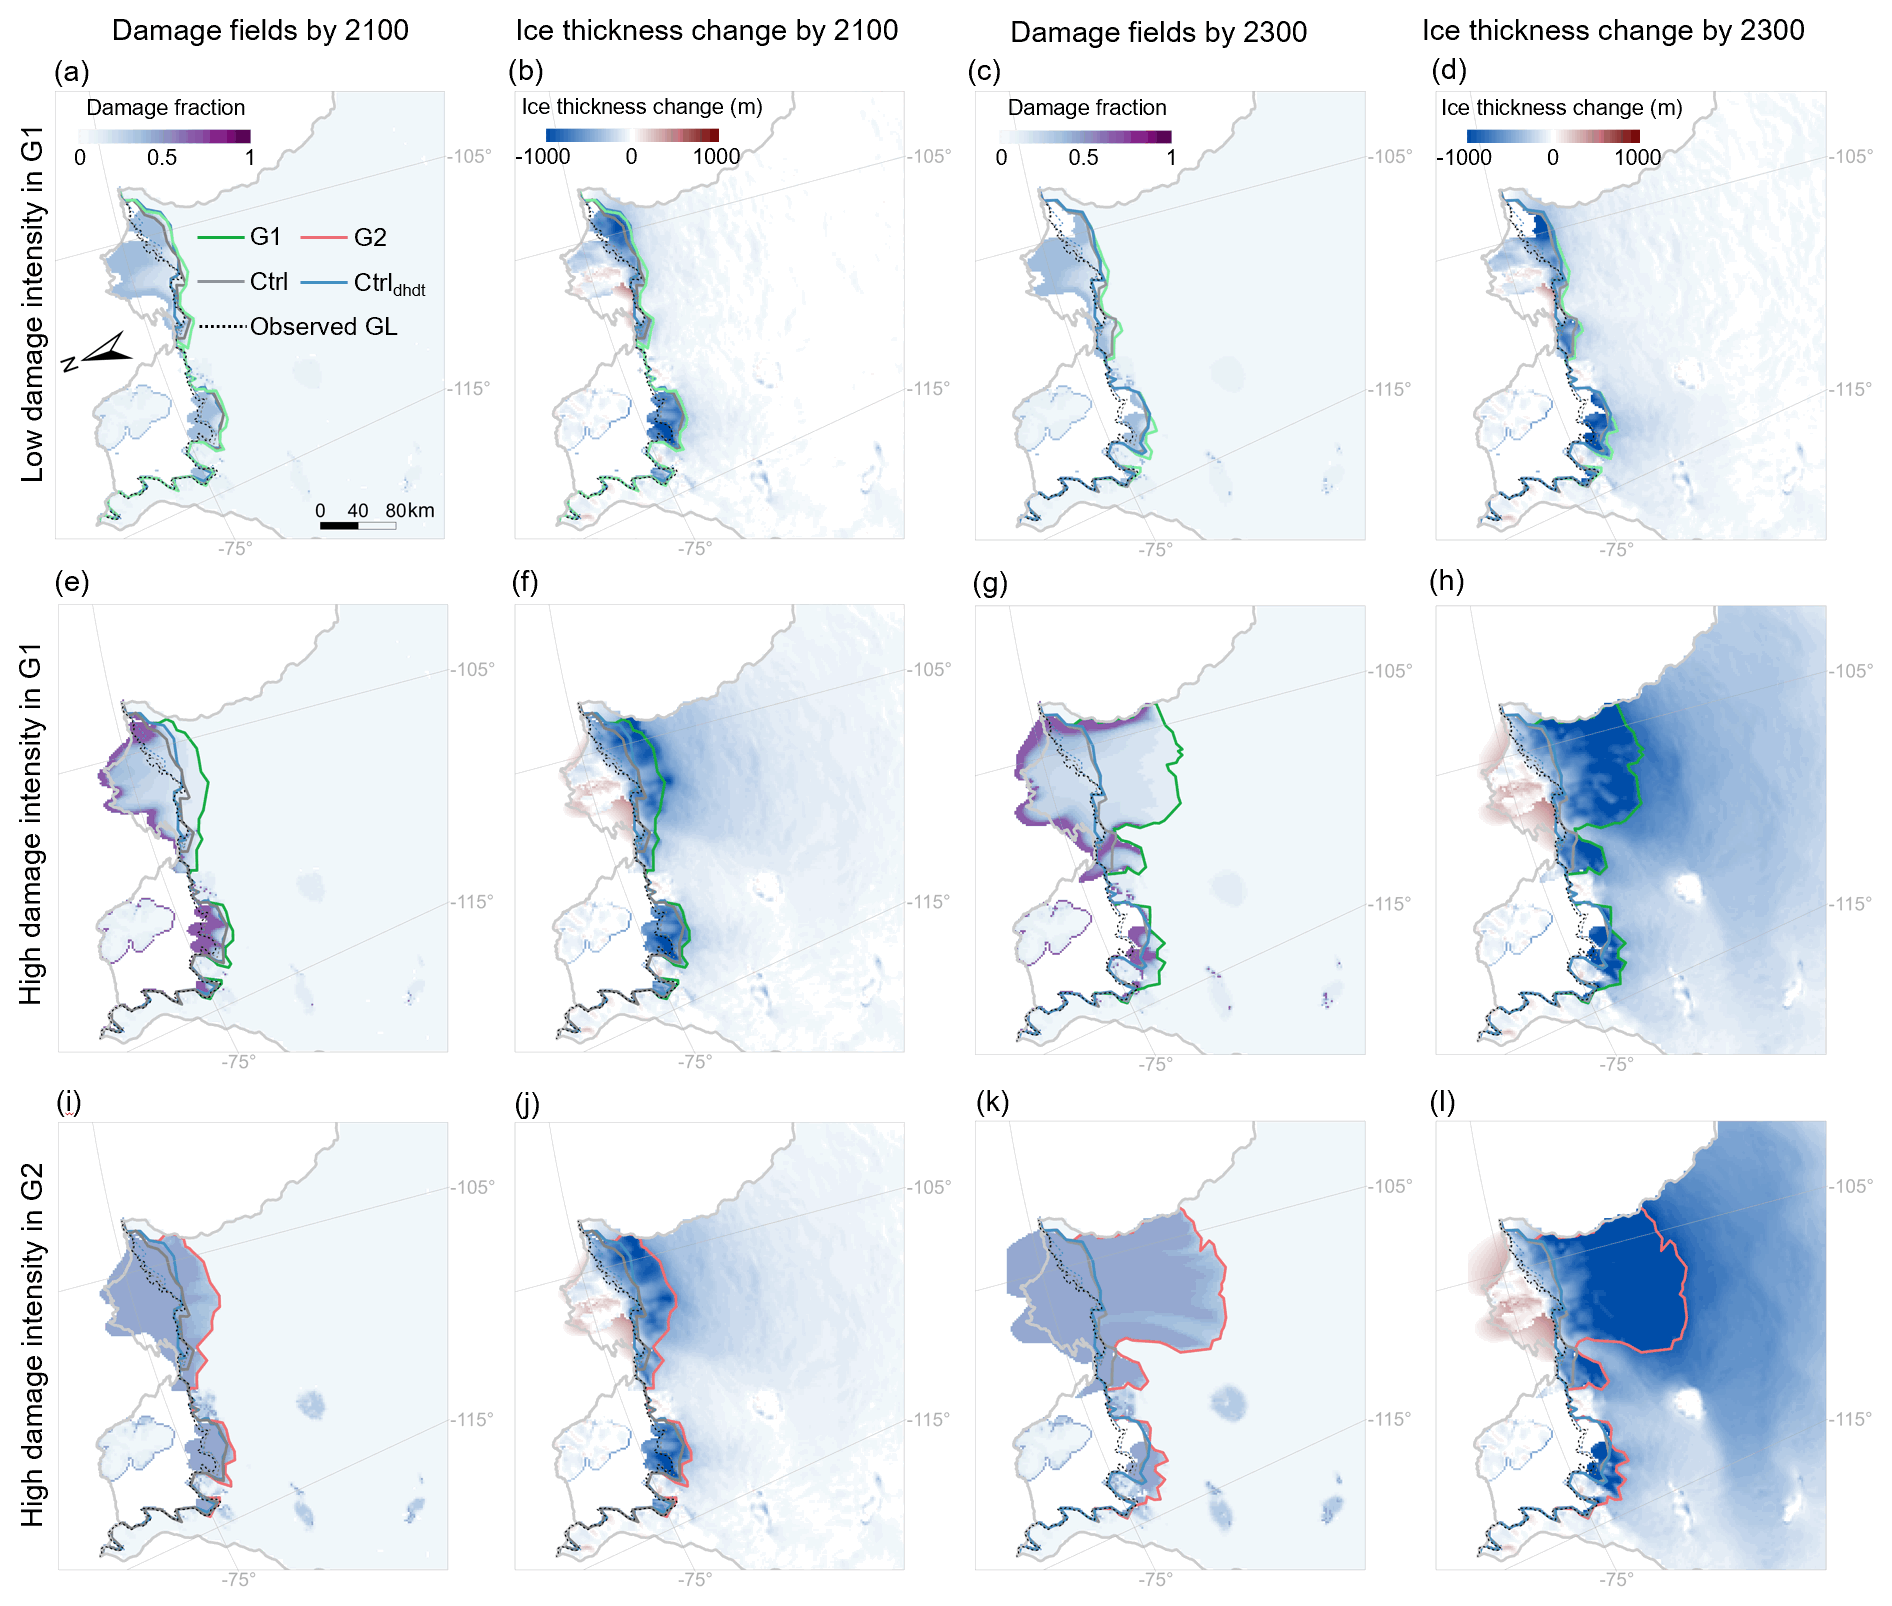
Figure 10Vertically averaged damage fields in the year 2100 and 2300 under varying damage intensities and the resulting ice thickness change. Simulation results of the low damage intensity of Group 1 (G1) are shown in panels (a)–(d); the high damage intensity of G1 in panels (e)–(h); and the high damage intensity of Group 2 (G2) in panels (i)–(l). The dashed black lines present the observed grounding-line position (Gardner et al., 2018). The solid blue and gray lines present simulated grounding-line positions of the Ctrldhdt and the Ctrl experiments in 2300. The dashed gray and blue lines are the initial grounding-line positions of the Ctrl/damage experiments and the Ctrldhdt experiment. The solid light-gray line is the TG basin boundary derived from Zwally et al. (2015). The positive thickness change observed ahead of the ice shelves is caused by the advance of the calving front, which results from increased ice velocity under higher-damage scenarios.
Previous prognostic applications of damage models have been limited to idealized geometries, such as MISMIP+. Here, we couple the Kori-ULB ice flow model with a continuum damage mechanics framework (Sun et al., 2017) and apply it to the Thwaites Glacier basin under constant present-day climate conditions. We perform a 43-member ensemble of simulations with varying ice damage intensities and compare the results to simulations that neglect ice damage processes. When calibrated against historical satellite-derived estimates of ice mass loss from the basin, a subset of 16 ensemble members (Group 1) successfully reproduces observed ice mass loss within twice the observational uncertainty. In contrast, the control simulation without ice damage processes significantly underestimates past ice mass change. This bias can be compensated for by artificially adjusting the initial state to match observed ice-mass-change rates. In this adjusted experiment (Ctrldhdt), the non-damage model reproduces the observed 2020 ice geometry, mass loss, and ice velocity comparably to the damage-inclusive model. However, mass loss projections for 2020–2300 in the Ctrldhdt experiment diverge significantly from those that explicitly represent ice damage processes. Specifically, simulations accounting for ice damage predict more than twice the ice mass loss, higher mean ice velocity along the central flowline profile, and greater inland retreat of the grounding line (Figs. 6 and 7). This suggests a positive feedback between damage processes and ice-shelf weakening in the TG basin. Overall, our results show that increasing damage intensity leads to higher ice velocities, accelerated glacier retreat, and greater ice mass loss, underlining the importance of accounting for damage feedbacks in ice-sheet projections.
However, it is important to acknowledge that the application of prognostic modeling to assess the impact of ice damage on the dynamic evolution of ice shelves remains very preliminary. Comparison between simulated vertically integrated damage fields over the historical period and observed crevasse distributions shows inconsistencies, with damage projections not consistently matching observed patterns (Fig. 5). Our approach has the benefit of using a physical approach to infer crevasse formation. However, direct comparison with observation remains challenging, since the damage field is highly variable and corresponds to a particular time moment. Our results are highly dependent on the forcing and model uncertainties, which makes a direct comparison unfeasible. Moreover, modeled damage patterns are highly variable across ensemble members. These discrepancies may be explained by the limitations of the damage model. For example, our approach does not account for all mechanisms of damage healing, which may result in an overestimation of damage (Sun et al., 2017). In reality, crevasse healing can occur when shear stress along the flow path decreases notably (Wesche et al., 2013; Benn and Åström, 2018), and dense crevasses near the grounding zone may heal during their advection towards the calving front. However, studies on the process of ice healing are still scarce due to the challenges of monitoring and quantifying this process (Albrecht and Levermann, 2012). Additionally, a vertically integrated model may not be appropriate for accurately representing crevasse formation mechanisms. The application of threshold stress for damage initiation as well as mechanisms of crevasse healing, such as the accretion of marine ice within basal crevasses, should be explored (Sun et al., 2017). The lack of representation of plastic necking (Bassis and Ma, 2015) also introduces uncertainties in our results. While the comparison of modeled, vertically integrated damage fields with snapshots of surface crevasses is not straightforward, these discrepancies underline the need for further validation and calibration of the damage model. Instead of solely relying on ice-sheet mass loss data, future efforts should incorporate observational datasets of crevasse distributions. A critical limitation remains the lack of direct observations of basal crevasses and the uncertainty in quantifying firn layer structure, both of which hinder accurate representation of damage processes. Recent studies suggest that basal crevasses may play a dominant role in damage evolution, particularly in the absence of surface hydrofracture (Huth et al., 2023), while firn properties can also influence crevasse penetration depth in ice shelves (Clayton et al., 2024). Therefore, future efforts should also prioritize high-resolution, basin- or ice-shelf-scale process modeling – such as phase-field fracture models – to better understand and represent the evolution of basal crevasses.
This study focuses specifically on damage and its influence on ice-sheet stability but ignores the potential effects of hydrofracturing and marine ice-cliff instability (MICI). Previous studies have shown that hydrofracturing resulting from surface melting plays a crucial role in ice-shelf disintegration (Bassis and Walker, 2012; DeConto and Pollard, 2016; Bassis et al., 2021; Laffin et al., 2022). Pollard et al. (2015) found that the combined mechanisms of MISI, hydrofracturing, and MICI can drastically accelerate the collapse of the West Antarctic Ice Sheet, potentially within decades, under a Pliocene-like warming scenario. Similar to Sun et al. (2017), the CDM framework used in the present study only considers dry crevasses and hence ignores hydrofracturing. This may result in an underestimation of ice velocity and ice mass loss from the TG basin in our simulations. However, recent studies suggest that Thwaites Glacier may be less vulnerable to MICI than previously thought. Instead, the intrusion of warm seawater or ice-sheet surface melt could substantially enhance the response of marine ice sheets to climate change by increasing melting and slipperiness (Morlighem et al., 2024; Robel, 2024). This increased melting can, in turn, lead to substantial ice damage. Our results suggest that ice damage could be a key driver of Thwaites Glacier's ice loss, offering an alternative explanation to previous hypotheses.
Our study focuses exclusively on the sensitivity of ice dynamics (e.g., grounding-line retreat, ice velocity, and ice thickness) and ice mass change in the TG basin to damage intensity. It should be noted that these findings may not hold true in other basins in Antarctica. Further simulations across various glaciers and ice shelves are needed to assess the robustness of ice-sheet models incorporating ice damage processes. It is also important to investigate the impact of ice damage on the evolution of the AIS under different climate change scenarios (Seroussi et al., 2020). In our forward simulations, present-day atmospheric and oceanic forcing are applied, rather than projections based on future climate scenarios. Our results show that, under extreme damage scenarios, the sea-level contribution (SLC) from Thwaites Glacier increases from 1 cm (without damage) to approximately 18 cm by 2200 (Fig. 8a), indicating that damage alone can substantially accelerate mass loss, leading to collapse. This suggests that the combined effects of ice damage and future climate changes could further enhance mass loss from Thwaites Glacier, reinforcing its potential role as a major contributor to future sea-level rise. A comprehensive understanding of these processes is key for improving projections of the future evolution of the AIS and its contribution to global sea-level rise under climate change.
In this study, we performed a comprehensive analysis of the response of the Thwaites Glacier to varying intensities of ice damage using the Kori-ULB ice-sheet model coupled with a continuum damage mechanics model. By calibrating our simulations with satellite-based observations, we show that explicitly representing ice damage processes improves the model's ability to capture the observed ice mass change in the TG basin compared to the default model without damage. Even when starting from a present-day state artificially adjusted to match observed ice-mass-change rates, projections of Thwaites Glacier that neglect ice damage diverge significantly from those that include it, suggesting a positive feedback between damage processes and ice-shelf weakening in the TG basin. Overall, our results demonstrate that an increase in damage intensity results in higher ice velocities, accelerated glacier retreat, and greater ice mass loss, emphasizing the importance of accounting for damage feedbacks in ice-sheet projections. This study highlights the need for further research on ice damage processes (e.g., to improve understanding and representation of basal crevasse evolution) to improve projections of the future evolution of the Antarctic ice sheet under climate change.
The code and reference manual of the Kori-ULB ice-sheet model are publicly available on GitHub via https://github.com/FrankPat/Kori-dev (last access: 9 September 2024). The model version and simulation results used in this study are available on Zenodo (https://doi.org/10.5281/zenodo.15114549, Li et al., 2025). All datasets used in this study are freely accessible through their original references. The MAR outputs used in this study are available on Zenodo (https://doi.org/10.5281/zenodo.4459259, Kittel, 2021; Kittel et al., 2021).
The supplement related to this article is available online at https://doi.org/10.5194/tc-19-4373-2025-supplement.
YL conceived the study in collaboration with VC, JB, GQ, QY and FP. YL and VC developed the experimental setup and design, with contributions from JB and FP. YL set up the ice-sheet model and performed all model simulations. YL performed the data analysis, produced the figures, and wrote the original manuscript draft. All authors contributed to designing the simulations and provided feedback on the analysis and input to the manuscript.
The contact author has declared that none of the authors has any competing interests.
Publisher's note: Copernicus Publications remains neutral with regard to jurisdictional claims made in the text, published maps, institutional affiliations, or any other geographical representation in this paper. While Copernicus Publications makes every effort to include appropriate place names, the final responsibility lies with the authors.
We acknowledge computational resources provided by the Consortium des Équipements de Calcul Intensif (CÉCI), funded by the Fonds de la Recherche Scientifique de Belgique (F.R.S.-FNRS) under grant no. 2.5020.11 and by the Walloon Region.
This research was supported by the Southern Marine Science and Engineering Guangdong Laboratory (Zhuhai) (no. SML2022SP401), the National Natural Science Fund of China (nos. 42406242, 42276249, and 42394131), and the Fundamental Research Funds for the Central Universities, Sun Yat-sen University (no. 24qnpy013). This research was also supported by Ocean Cryosphere Exchanges in ANtarctica: Impacts on Climate and the Earth system, OCEAN ICE, which is funded by the European Union, Horizon Europe Funding Programme for research and innovation, under grant agreement no. 101060452, OCEAN ICE contribution number 40, and the HiRISE (NWP GROOT, Netherlands, under grant agreement no. OCENW.GROOT.2019.091). Violaine Coulon also acknowledges funding by the Fonds de la Recherche Scientifique de Belgique (F.R.S.-FNRS) with an F.R.S.-FNRS Postdoctoral Researcher Fellowship.
This paper was edited by Josefin Ahlkrona and reviewed by Tong Zhang and Ravindra Duddu.
Albrecht, T. and Levermann, A.: Fracture field for large-scale ice dynamics, Journal of Glaciology, 58, 165–176, https://doi.org/10.3189/2012JoG11J191, 2012.
Albrecht, T. and Levermann, A.: Fracture-induced softening for large-scale ice dynamics, The Cryosphere, 8, 587–605, https://doi.org/10.5194/tc-8-587-2014, 2014.
Bassis, J. N. and Ma, Y.: Evolution of basal crevasses links ice shelf stability to ocean forcing, Earth and Planetary Science Letters, 409, 203–211, https://doi.org/10.1016/j.epsl.2014.11.003, 2015.
Bassis, J. N. and Walker, C. C.: Upper and lower limits on the stability of calving glaciers from the yield strength envelope of ice, Proceedings of the Royal Society A: Mathematical, Physical and Engineering Sciences, 468, 913–931, https://doi.org/10.1098/rspa.2011.0422, 2012.
Bassis, J. N., Berg, B., Crawford, A. J., and Benn, D. I.: Transition to marine ice cliff instability controlled by ice thickness gradients and velocity, Science, 372, 1342–1344, https://doi.org/10.1126/science.abf6271, 2021.
Benn, D. I. and Åström, J. A.: Calving glaciers and ice shelves, Advances in Physics: X, 3, 1513819, https://doi.org/10.1080/23746149.2018.1513819, 2018.
Bernales, J., Rogozhina, I., and Thomas, M.: Melting and freezing under Antarctic ice shelves from a combination of ice-sheet modelling and observations, Journal of Glaciology, 63, 731–744, https://doi.org/10.1017/jog.2017.42, 2017.
Bevan, S., Cornford, S., Gilbert, L., Otosaka, I., Martin, D., and Surawy-Stepney, T.: Amundsen Sea Embayment ice-sheet mass-loss predictions to 2050 calibrated using observations of velocity and elevation change, Journal of Glaciology, 69, 1729–1739, https://doi.org/10.1017/jog.2023.57, 2023.
Bindschadler, R., Vornberger, P., Fleming, A., Fox, A., Mullins, J., Binnie, D., Paulsen, S. J., Granneman, B., and Gorodetzky, D.: The Landsat image mosaic of Antarctica, Remote Sensing of Environment, 112, 4214–4226, https://doi.org/10.1016/j.rse.2008.07.006, 2008.
Borstad, C., Khazendar, A., Larour, E., Morlighem, M., Rignot, E., Schodlok, M. P., and Seroussi, H.: A damage mechanics assessment of the Larsen B ice shelf prior to collapse: Toward a physically-based calving law, Geophysical Research Letters, 39, https://doi.org/10.1029/2012GL053317, 2012.
Clayton, T., Duddu, R., Hageman, T., and Martínez-Pañeda, E.: The influence of firn layer material properties on surface crevasse propagation in glaciers and ice shelves, The Cryosphere, 18, 5573–5593, https://doi.org/10.5194/tc-18-5573-2024, 2024.
Cook, S., Rutt, I. C., Murray, T., Luckman, A., Zwinger, T., Selmes, N., Goldsack, A., and James, T. D.: Modelling environmental influences on calving at Helheim Glacier in eastern Greenland, The Cryosphere, 8, 827–841, https://doi.org/10.5194/tc-8-827-2014, 2014.
Cornford, S. L., Seroussi, H., Asay-Davis, X. S., Gudmundsson, G. H., Arthern, R., Borstad, C., Christmann, J., Dias dos Santos, T., Feldmann, J., Goldberg, D., Hoffman, M. J., Humbert, A., Kleiner, T., Leguy, G., Lipscomb, W. H., Merino, N., Durand, G., Morlighem, M., Pollard, D., Rückamp, M., Williams, C. R., and Yu, H.: Results of the third Marine Ice Sheet Model Intercomparison Project (MISMIP+), The Cryosphere, 14, 2283–2301, https://doi.org/10.5194/tc-14-2283-2020, 2020.
Coulon, V., Klose, A. K., Kittel, C., Edwards, T., Turner, F., Winkelmann, R., and Pattyn, F.: Disentangling the drivers of future Antarctic ice loss with a historically calibrated ice-sheet model, The Cryosphere, 18, 653–681, https://doi.org/10.5194/tc-18-653-2024, 2024.
DeConto. R. M. and Pollard, D.: Contribution of Antarctica to past and future sea-level rise, Nature, 531, 591–597, https://doi.org/10.1038/nature17145, 2016.
Duddu, R., Jiménez, S., and Bassis, J.: A non-local continuum poro-damage mechanics model for hydrofracturing of surface crevasses in grounded glaciers, Journal of Glaciology, 66, 415–429, https://doi.org/10.1017/jog.2020.16, 2020.
Gardner, A. S., Moholdt, G., Scambos, T., Fahnstock, M., Ligtenberg, S., van den Broeke, M., and Nilsson, J.: Grounding Line for Antarctic Discharge (GLAD) point files for flux estimates, ftp://ftp.nsidc.org/pub/DATASETS/nsidc0732_landsat_antarctic_ice_velocities_v01/GardnerEtAl_2018_SupData/GLAD_flux_gates/ (last access: 9 July 2024), 2018.
Gerli, C., Rosier, S., and Gudmundsson, G. H.: Activation of existing surface crevasses has limited impact on grounding line flux of Antarctic ice streams, Geophysical Research Letters, 50, e2022GL101687, https://doi.org/10.1029/2022GL101687, 2023.
Gudmundsson, G. H., Barnes, J. M., Goldberg, D. N., and Morlighem, M.: Limited Impact of Thwaites Ice Shelf on Future Ice Loss from Antarctica, Geophysical Research Letters, 50, e2023GL102880, https://doi.org/10.1029/2023GL102880, 2023.
Huth, A., Duddu, R., and Smith, B.: A generalized interpolation material point method for shallow ice shelves. 2: Anisotropic nonlocal damage mechanics and rift propagation, Journal of Advances in Modeling Earth Systems, 13, e2020MS002292, https://doi.org/10.1029/2020MS002292, 2021.
Huth, A., Duddu, R., Smith, B., and Sergienko, O.: Simulating the processes controlling ice-shelf rift paths using damage mechanics, Journal of Glaciology, 69, 1915–1928, https://doi.org/10.1017/jog.2023.71, 2023.
Izeboud, M. and Lhermitte, S.: Damage detection on Antarctic ice shelves using the normalised radon transform, Remote Sensing of Environment, 284, 113359, https://doi.org/10.1016/j.rse.2022.113359, 2023.
Kachuck, S. B., Whitcomb, M., Bassis, J. N., Martin, D. F., and Price, S. F.: Simulating ice-shelf extent using damage mechanics, Journal of Glaciology, 68, 987–998, https://doi.org/10.1017/jog.2022.12, 2022.
Kazmierczak, E., Gregov, T., Coulon, V., and Pattyn, F.: A fast and simplified subglacial hydrological model for the Antarctic Ice Sheet and outlet glaciers, The Cryosphere, 18, 5887–5911, https://doi.org/10.5194/tc-18-5887-2024, 2024.
Khazendar, A., Rignot, E., and Larour, E.: Larsen B Ice Shelf rheology preceding its disintegration inferred by a control method, Geophysical Research Letters, 34, L19503, https://doi.org/10.1029/2007GL030980, 2007.
Kittel, C.: Kittel et al. (2021), The Cryosphere: MAR and ESMs data, Zenodo [data set], https://doi.org/10.5281/zenodo.4459259, 2021.
Kittel, C., Amory, C., Agosta, C., Jourdain, N. C., Hofer, S., Delhasse, A., Doutreloup, S., Huot, P.-V., Lang, C., Fichefet, T., and Fettweis, X.: Diverging future surface mass balance between the Antarctic ice shelves and grounded ice sheet, The Cryosphere, 15, 1215–1236, https://doi.org/10.5194/tc-15-1215-2021, 2021.
Laffin, M. K., Zender, C. S., van Wessem, M., and Marinsek, S.: The role of föhn winds in eastern Antarctic Peninsula rapid ice shelf collapse, The Cryosphere, 16, 1369–1381, https://doi.org/10.5194/tc-16-1369-2022, 2022.
Lhermitte, S., Sun, S., Shuman, C., Wouters, B., Pattyn, F., Wuite, J., Berthier, E., and Nagler, T.: Damage accelerates ice shelf instability and mass loss in Amundsen Sea Embayment, Proceedings of the National Academy of Sciences, 117, 24735–24741, https://doi.org/10.1073/pnas.1912890117, 2020.
Li, Y., Coulon, V., Blasco Navarro, J., Qiao, G., Yang, Q., and Pattyn, F.: Damage intensity increases ice mass loss from Thwaites Glacier, Antarctica, Zenodo [data set], https://doi.org/10.5281/zenodo.15114549, 2025.
Liu, Y., Moore, J. C., Cheng, X., Gladstone, R. M., Bassis, J. N., Liu, H., Wen, J., and Hui, F.: Ocean-driven thinning enhances iceberg calving and retreat of Antarctic ice shelves, Proceedings of the National Academy of Sciences, 112, 3263–3268, https://doi.org/10.1073/pnas.1415137112, 2015.
Miles, B. W. J., Stokes, C. R., Jenkins, A., Jordan, J. R., Jamieson, S. S. R., and Gudmundsson, G. H.: Intermittent structural weakening and acceleration of the Thwaites Glacier Tongue between 2000 and 2018, Journal of Glaciology, 66, 485–495, https://doi.org/10.1017/jog.2020.20, 2020.
Milillo, P., Rignot, E., Rizzoli, P., Scheuchl, B., Mouginot, J., Bueso-Bello, J., and Prats-Iraola, P.: Heterogeneous retreat and ice melt of Thwaites Glacier, West Antarctica, Science Advances, 5, eaau3433, https://doi.org/10.1126/sciadv.aau3433, 2019.
Moon, T. and Joughin, I.: Changes in ice front position on Greenland's outlet glaciers from 1992 to 2007, Journal of Geophysical Research: Earth Surface, 113, https://doi.org/10.1029/2007JF000927, 2008.
Morlighem, M., Rignot, E., Binder, T., Blankenship, D., Drews, R., Eagles, G., Eisen, O., Ferraccioli, F., Forsberg, R., Fretwell, P., Goel, V., Greenbaum, J. S., Gudmundsson, H., Guo, J., Helm, V., Hofstede, C., Howat, I., Humbert, A., Jokat, W., Karlsson, N. B., Lee, W. S., Matsuoka, K., Millan, R., Mouginot, J., Paden, J., Pattyn, F., Roberts, J., Rosier, S., Ruppel, A., Seroussi, H., Smith, E. C., Steinhage, D., Sun, B., van den Broeke, M. R., van Ommen, T. D., van Wessem, M., and Young, D. A.: Deep glacial troughs and stabilizing ridges unveiled beneath the margins of the Antarctic ice sheet, Nature Geoscience, 13, 132–137, https://doi.org/10.1038/s41561-019-0510-8, 2020.
Morlighem, M., Goldberg, D., Barnes, J. M., Bassis, J. N., Benn, D. I., Crawford, A. J., Gudmundsson, G. H., and Seroussi, H.: The West Antarctic Ice Sheet may not be vulnerable to marine ice cliff instability during the 21st century, Science Advances, 10, eado7794, https://doi.org/10.1126/sciadv.ado7794, 2024.
Nick, F. M., van der Veen, C., Vieli, A., and Benn, D.: A physically based calving model applied to marine outlet glaciers and implications for the glacier dynamics, Journal of Glaciology, 56, 781–794, https://doi.org/10.3189/002214310794457344, 2011.
Nick, F. M., Vieli, A., Andersen, M. L., Joughin, I., Payne, A., Edwards, T. L., Pattyn, F., and van de Wal, R. S. W.: Future sea-level rise from Greenland's main outlet glaciers in a warming climate, Nature, 497, 235–238, https://doi.org/10.1038/nature12068, 2013.
Nye, J. F.: The distribution of stress and velocity in glaciers and ice-sheets, Proceedings of the Royal Society of London, Series A. Mathematical and Physical Sciences, 239, 113–133, https://doi.org/10.1098/rspa.1957.0026, 1957.
Pattyn, F.: Sea-level response to melting of Antarctic ice shelves on multi-centennial timescales with the fast Elementary Thermomechanical Ice Sheet model (f.ETISh v1.0), The Cryosphere, 11, 1851–1878, https://doi.org/10.5194/tc-11-1851-2017, 2017.
Pattyn, F.: The paradigm shift in Antarctic ice sheet modelling, Nature Communications, 9, 2728, https://doi.org/10.1038/s41467-018-05003-z, 2018.
Pattyn, F., Perichon, L., Durand, G., Favier, L., Gagliardini, O., Hindmarsh, R. C., Zwinger, T., Albrecht, T., Cornford, S., Docquier, D., F”urst, J. J., Goldberg, D., Gudmundsson, G. H., Humbert, A., H”utten, M., Huybrechts, P., Jouvet, G., Kleiner, T., Larour, E., Martin, D., Morlighem, M., Payne, A. J., Pollard, D., R”uckamp, M., Rybak, O., Seroussi, H., Thoma, M., and Wilkens, N.: Grounding-line migration in plan-view marine ice-sheet models: results of the ice2sea MISMIP3d intercomparison, Journal of Glaciology, 59, 410–422, https://doi.org/10.3189/2013JoG12J129, 2013.
Pollard, D. and DeConto, R. M.: A simple inverse method for the distribution of basal sliding coefficients under ice sheets, applied to Antarctica, The Cryosphere, 6, 953–971, https://doi.org/10.5194/tc-6-953-2012, 2012.
Pollard, D., DeConto, R. M., and Alley, R. B.: Potential Antarctic Ice Sheet retreat driven by hydrofracturing and ice cliff failure, Earth and Planetary Science Letters, 412, 112–121, https://doi.org/10.1016/j.epsl.2014.12.035, 2015.
Ranganathan, M., Robel, A. A., Huth, A., and Duddu, R.: Glacier damage evolution over ice flow timescales, The Cryosphere, 19, 1599–1619, https://doi.org/10.5194/tc-19-1599-2025, 2025.
Reese, R., Albrecht, T., Mengel, M., Asay-Davis, X., and Winkelmann, R.: Antarctic sub-shelf melt rates via PICO, The Cryosphere, 12, 1969–1985, https://doi.org/10.5194/tc-12-1969-2018, 2018.
Rignot, E., Mouginot, J., Morlighem, M., Seroussi, H., and Scheuchl, B.: Widespread, rapid grounding line retreat of Pine Island, Thwaites, Smith, and Kohler glaciers, West Antarctica, from 1992 to 2011, Geophysical Research Letters, 41, 3502–3509, https://doi.org/10.1002/2014GL060140, 2014.
Rignot, E., Mouginot, J., and Scheuchl, B.: MEaSUREs InSAR-Based Antarctica Ice Velocity Map, Version 2, Boulder, Colorado USA, NASA National Snow and Ice Data Center Distributed Active Archive Center, https://doi.org/10.5067/D7GK8F5J8M8R, 2017.
Rignot, E., Mouginot, J., Scheuchl, B., van den Broeke, M., van Wessem, M. J., and Morlighem, M.: Four decades of Antarctic Ice Sheet mass balance from 1979–2017, Proceedings of the National Academy of Sciences, 116, 1095–1103, https://doi.org/10.1073/pnas.1812883116, 2019.
Robel, A. A.: Antarctica's ice cliff conundrum, Science Advances, 10, eadr5921, https://doi.org/10.1126/sciadv.adr5921, 2024.
Schmidtko, S., Heywood, K. J., Thompson, A. F., and Aoki, S.: Multidecadal warming of Antarctic waters, Science, 346, 1227–1231, https://doi.org/10.1126/science.1256117, 2014.
Schoof, C.: Ice sheet grounding line dynamics: Steady states, stability, and hysteresis, Journal of Geophysical Research: Earth Surface, 112, https://doi.org/10.1029/2006JF000664, 2007.
Seroussi, H., Nowicki, S., Payne, A. J., Goelzer, H., Lipscomb, W. H., Abe-Ouchi, A., Agosta, C., Albrecht, T., Asay-Davis, X., Barthel, A., Calov, R., Cullather, R., Dumas, C., Galton-Fenzi, B. K., Gladstone, R., Golledge, N. R., Gregory, J. M., Greve, R., Hattermann, T., Hoffman, M. J., Humbert, A., Huybrechts, P., Jourdain, N. C., Kleiner, T., Larour, E., Leguy, G. R., Lowry, D. P., Little, C. M., Morlighem, M., Pattyn, F., Pelle, T., Price, S. F., Quiquet, A., Reese, R., Schlegel, N.-J., Shepherd, A., Simon, E., Smith, R. S., Straneo, F., Sun, S., Trusel, L. D., Van Breedam, J., van de Wal, R. S. W., Winkelmann, R., Zhao, C., Zhang, T., and Zwinger, T.: ISMIP6 Antarctica: a multi-model ensemble of the Antarctic ice sheet evolution over the 21st century, The Cryosphere, 14, 3033–3070, https://doi.org/10.5194/tc-14-3033-2020, 2020.
Shepherd, A., Gilbert, L., Muir, A. S., Konrad, H., McMillan, M., Slater, T., Briggs, K. H., Sundal, A. V., Hogg, A. E., and Engdahl, M. E.: Trends in Antarctic Ice Sheet Elevation and Mass, Geophysical Research Letters, 46, 8174–8183, https://doi.org/10.1029/2019GL082182, 2019.
Sun, S. and Gudmundsson, G. H.: The speedup of Pine Island Ice Shelf between 2017 and 2020: revaluating the importance of ice damage, Journal of Glaciology, 1–9, https://doi.org/10.1017/jog.2023.76, 2023.
Sun, S., Cornford, S. L., Moore, J. C., Gladstone, R., and Zhao, L.: Ice shelf fracture parameterization in an ice sheet model, The Cryosphere, 11, 2543–2554, https://doi.org/10.5194/tc-11-2543-2017, 2017.
Surawy-Stepney, T., Hogg, A. E., Cornford, S. L., and Davison, B. J.: Episodic dynamic change linked to damage on the Thwaites Glacier Ice Tongue, Nature Geoscience, 16, 37–43, https://doi.org/10.1038/s41561-022-01097-9, 2023.
van de Wal, R. S. W., Nicholls, R. J., Behar, D., McInnes, K., Stammer, D., Lowe, J. A., Church, J. A., DeConto, R., Fettweis, X., Goelzer, H., Haasnoot, M., Haigh, I. D., Hinkel, J., Horton, B. P., James, T. S., Jenkins, A., LeCozannet, G., Levermann, A., Lipscomb, W. H., Marzeion, B., Pattyn, F., Payne, A. J., Pfeffer, W. T., Price, S. F., Seroussi, H., Sun, S., Veatch, W., and White, K.: A High-End Estimate of Sea Level Rise for Practitioners, Earth's Future, 10, e2022EF002751, https://doi.org/10.1029/2022EF002751, 2022.
van den Akker, T., Lipscomb, W. H., Leguy, G. R., Bernales, J., Berends, C. J., van de Berg, W. J., and van de Wal, R. S. W.: Present-day mass loss rates are a precursor for West Antarctic Ice Sheet collapse, The Cryosphere, 19, 283–301, https://doi.org/10.5194/tc-19-283-2025, 2025.
Wesche, C., Jansen, D., and Dierking, W.: Calving Fronts of Antarctica: Mapping and Classification, Remote Sensing, 5, 6305–6322, https://doi.org/10.3390/rs5126305, 2013.
Winkelmann, R., Martin, M. A., Haseloff, M., Albrecht, T., Bueler, E., Khroulev, C., and Levermann, A.: The Potsdam Parallel Ice Sheet Model (PISM-PIK) – Part 1: Model description, The Cryosphere, 5, 715–726, https://doi.org/10.5194/tc-5-715-2011, 2011.
Zwally, H. J., Li, J., Robbins, J. W., Saba, J. L., Yi, D., and Brenner, A. C.: Mass gains of the Antarctic ice sheet exceed losses, Journal of Glaciology, 61, 1019–1036, https://doi.org/10.3189/2015JoG15J071, 2015.