the Creative Commons Attribution 4.0 License.
the Creative Commons Attribution 4.0 License.
 | 06 Oct 2025
Ice shelf calving due to shear stresses: observing the response of Brunt Ice Shelf and Halloween Crack to iceberg calving using ICESat-2 laser altimetry, satellite imagery, and ice flow models
Ashley Morris
Bradley P. Lipovsky
Catherine C. Walker
Oliver J. Marsh
Full-thickness ice shelf fractures, known as rifts, create tabular icebergs that can reduce ice shelf extent and thereby jeopardize overall marine ice sheet stability. Low confidence in the scientific understanding of ice shelf calving processes results in uncertainties in ice sheet evolution. Here, we investigate rift evolution and calving on the Brunt Ice Shelf, East Antarctica, using ICESat-2 laser altimetry, on-ice Global Navigation Satellite System receivers, satellite imagery, and ice flow models. We find that shear stresses played a decisive role in rift propagation, widening, calving, and stabilization during the period surrounding the calving of Iceberg A-74 from the North Rift on the Brunt Ice Shelf. The North Rift propagated along a fracture path that was optimally oriented to maximize shear stresses. Following the calving of A-74, reduced contact with local pinning points at the McDonald Ice Rumples reduced shear stresses and the opening rate of the Halloween Crack. We use historical observations and satellite imagery to investigate the calving cycle and demonstrate that the calving of Iceberg A-74 closely mimics previous calving events. Shear stresses likely play a role in tabular iceberg calving events on other ice shelves. Yet horizontal shear stresses are in the null space of most ice shelf calving laws. We propose modifications to widely used calving laws that improve their sensitivity to the shearing mode of fracture.
- Article
(8583 KB) - Full-text XML
-
Supplement
(20996 KB) - BibTeX
- EndNote


The Antarctic Ice Sheet gains mass through the accumulation of snowfall and loses mass primarily where it comes into contact with the ocean. Floating ice shelves fringe 75 % of the ice sheet margin (Rignot et al., 2013), buttressing the flow of ice streams inland (Dupont and Alley, 2005; Fürst et al., 2016) due to flow resistance at lateral boundaries, ice rises, and ice rumples (Matsuoka et al., 2015). Ice shelves gain mass through the flow of ice across the grounding zone, snowfall, and potentially basal accretion and lose mass through basal melting and iceberg calving. These mass loss processes occur in roughly equal proportions at the continental scale but vary strongly regionally (Rignot et al., 2013; Depoorter et al., 2013; Greene et al., 2022). Where mass losses exceed mass gains, ice shelves retreat and/or thin, with modeling suggesting that these processes have resulted in similar reductions in ice shelf buttressing (Greene et al., 2022). If the ice lost was providing buttressing the flow speed of grounded ice will increase (Fürst et al., 2016; Reese et al., 2018; Rott et al., 2011; Joughin et al., 2021; MacGregor et al., 2012; Pritchard et al., 2012; Mouginot et al., 2014; Gudmundsson et al., 2019). Ice shelves thus exert a key control on Antarctic Ice Sheet mass balance and global sea level variations (Fox-Kemper et al., 2021). Radar altimetry satellites have been used to map ice shelf topography and monitor thickness changes (Paolo et al., 2015; Zwally et al., 2005; Paolo et al., 2023); however, their coarse spatial resolution has restricted their use for examining processes occurring at smaller scales. Only with the launch of the first Ice, Cloud, and Land Elevation Satellite (ICESat) laser altimeter was satellite altimetry applied to the study of the rifting and iceberg calving process (Fricker et al., 2005a).
Rifts are full-thickness fractures through ice shelves which often form in ice shelf margins, at the grounding zone, at the ice front, or near ice rises and ice rumples (Benn et al., 2007). A range of factors influencing rift propagation have been identified, including glaciological stresses (Walker et al., 2013; Joughin and MacAyeal, 2005; Hulbe et al., 2010; Bassis et al., 2005, 2007, 2008; Heeszel et al., 2014; Lipovsky, 2020; Olinger et al., 2022), the thickness and mechanical strength of ice mélange within rifts (Fricker et al., 2005b; Larour et al., 2004, 2021; MacAyeal et al., 1998; Rignot and MacAyeal, 1998), heterogeneity of ice properties and the presence of marine ice (Borstad et al., 2017; McGrath et al., 2014; Kulessa et al., 2014), sea surface slopes driven by large-scale atmospheric conditions (Francis et al., 2021, 2022; Christie et al., 2022) or tides (Olinger et al., 2019), ocean waves and the concentration of protective sea ice (Massom et al., 2018; Christie et al., 2022; Cathles IV et al., 2009; Aster et al., 2021; Bromirski et al., 2010; Bromirski and Stephen, 2012; MacAyeal et al., 2006; Banwell et al., 2017; Lipovsky, 2018), and tsunami-generated swell (Walker et al., 2015, 2013; Brunt et al., 2011).
Walker et al. (2013) used moderate-resolution satellite imagery to observe 78 rifts around the Antarctic continent between 2002 and 2012, finding a spectrum of decadal behavior from complete dormancy, through intermittent or sudden bursts of extension, to continuous activity. Detailed in situ and remote sensing studies of individual rifts or small numbers of rifts suggest that propagation occurs as episodic short bursts lasting seconds (Banwell et al., 2017; Olinger et al., 2024) to hours (Bassis et al., 2005, 2007), with opening widths increasing steadily (Joughin and MacAyeal, 2005). Propagation is often arrested or slowed at suture zones, where fracture toughness can be higher (Borstad et al., 2017; Hulbe et al., 2010; Bassis et al., 2007). Once rifts propagate sufficiently to intersect the ice shelf front or other rifts, tabular iceberg calving occurs. Ice shelves typically exhibit “calving cycles”, with long periods of advance separating sequential large calving events (Fricker et al., 2002; Wang et al., 2022; Cheng et al., 2021a; Giles, 2017). Although the calving cycle is commonly envisioned as a steady-state process on decadal timescales (Greene et al., 2022), recent studies have examined the degradation of regular calving cycles and the associated loss of grounded ice mass (Joughin et al., 2021).
Launched in 2018, NASA's Ice, Cloud, and Land Elevation Satellite-2 (ICESat-2) carries the Advanced Topographic Laser Altimeter System (ATLAS), a photon counting laser altimeter (see Sect. 3.1) which provides both extensive spatial coverage and fine spatial resolution (Markus et al., 2017; Abdalati et al., 2010). ICESat-2 is able to measure rift width and other parameters in the vertical dimension such as ice mélange thickness, rift flank topography (Walker et al., 2021; Fricker et al., 2005a), and the offset between rift flank height on opposite sides of the rift resulting from asymmetric buoyancy forces on a rift deviating by 1–5° from vertical (i.e., “seaward–landward offset”, Walker and Gardner, 2019).
In this paper we describe the measurement of a time series of rift widths using ICESat-2 laser altimetry and validation using other remote sensing and field-based datasets using “Halloween Crack” (HC) on Brunt Ice Shelf (BIS), East Antarctica, as a case study (Fig. 1). We place contemporary changes in a long-term perspective by examining the calving cycle at BIS using historical remote sensing data and published observations. We observe changes in the ice shelf flow field and changes in rift behavior following calving from “North Rift” (NR), which we investigate using remote sensing data and a finite-element ice flow model. Based on the findings of our model analysis, we propose modifications to widely used calving laws to improve their sensitivity to the shearing mode of fracture.
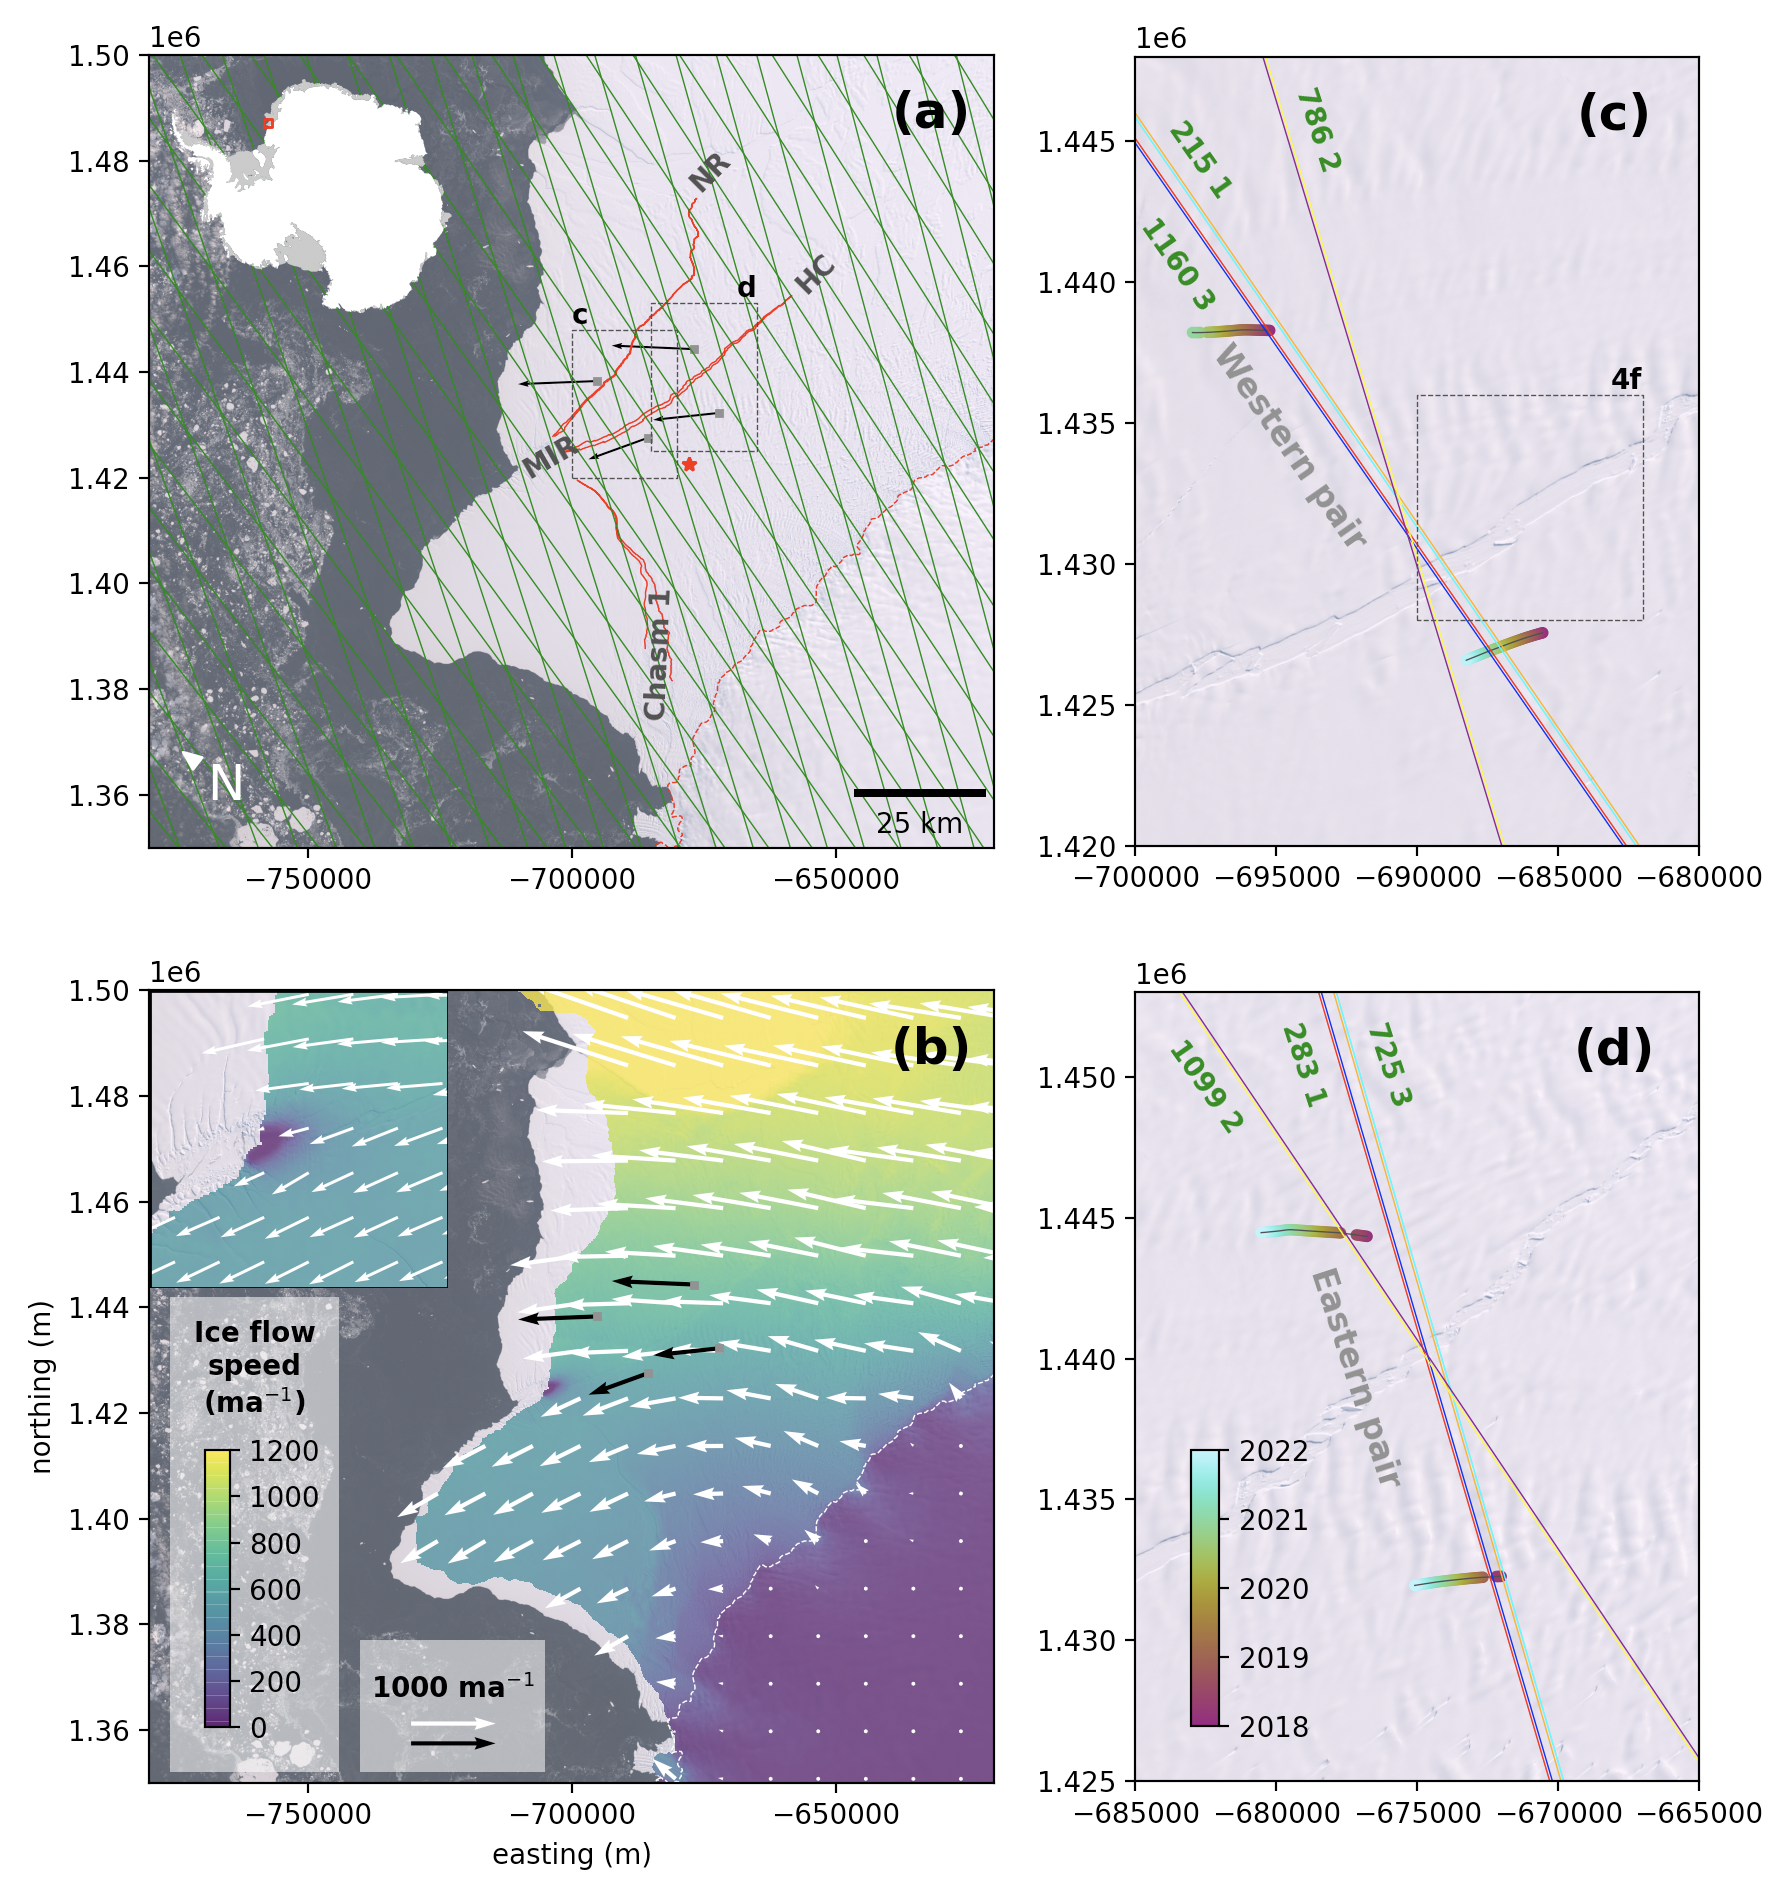
Figure 1Key glaciological features of Brunt Ice Shelf, instrument locations, and ICESat-2 ground tracks. (a) Landsat-8 image from 20 February 2020 showing Chasm 1, Halloween Crack (HC), and North Rift (NR) in solid red lines; McDonald Ice Rumples (MIR); the grounding zone (Bindschadler et al., 2011) with a dashed red line; Halley VI station with a red star; GNSS receivers (Marsh and De Rydt, 2025) with gray squares and flow direction and magnitude with arrows; extent of (c) and (d) with dashed boxes; and the ICESat-2 reference ground tracks (RGTs) with green lines. The inset shows the location of Brunt Ice Shelf in East Antarctica (data from the SCAR Antarctic Digital Database). (b) Composite surface flow speed field (Gardner et al., 2018, 2020). Note the impact on the flow field of the pinning point at McDonald Ice Rumples (enlarged in inset). (c) Section of the ice shelf near the western end of HC, showing the location of the six beams (three pairs) of ICESat-2 passes along RGT 215, RGT 1160, and RGT 786. The dashed box shows the extent of Fig. 4f. (d) Section of the ice shelf near the eastern end of HC, showing ICESat-2 passes along RGT 283, RGT 725, and RGT 1099. Beam colors in (c) and (d) correspond to graphs in Figs. 5, 6, and 7. Colored points show the movement of the GNSS receivers through the deployment. The projection is Antarctic polar stereographic (EPSG: 3031). Landsat-8 imagery courtesy of the US Geological Survey.
The Brunt Ice Shelf (BIS; 75.3 to 75.8° S, 24.0 to 27.0° W) drains ice from Coats Land, East Antarctica, into the Weddell Sea (Fig. 1). Ice blocks which detach in the steeply sloping grounding zone are bound together by sea ice channels which become increasingly filled by snow and firn as the ice advects through the shelf (King et al., 2018; Fretwell et al., 2013). Ice blocks from grounding zone troughs are thicker and more closely packed than from adjacent shallower, slower-flowing areas (King et al., 2018). There is a prominent bathymetric high point called McDonald Ice Rumples (MIR) located at 75.44° S, 26.3° W. This exerts a strong control on the spatial pattern of present ice flow (Figs. 1 and S1), past and ongoing ice flow variability (Gudmundsson et al., 2017; De Rydt et al., 2018, 2019; Marsh et al., 2024), and stresses within the ice shelf (De Rydt et al., 2019).
The earliest observations of BIS date back to the 1914/15 voyage of HMS Endurance, thus capturing the entire calving cycle (Figs. 2 and 3), albeit with low temporal resolution prior to the satellite period (the earliest satellite image used in this study is from 1973). In 1971 BIS calved back to a number of large rifts which had formed in 1968 (Thomas, 1973; Gudmundsson et al., 2017). Measurements from across BIS show almost a doubling in ice flow velocity in the 1970s, which was sustained through the 1980s and 1990s (Gudmundsson et al., 2017). More recent GPS measurements show the velocity decreasing through the 2000s, reaching pre-1970s levels by ∼ 2010, with a further period of acceleration starting in 2012 (Simmons and Rouse, 1984; Gudmundsson et al., 2017). Gudmundsson et al. (2017) modeled the ice flow response to the opening of a rift between BIS and adjacent Stancomb–Wills Ice Tongue (SWIT), the opening of the dormant Chasm 1 rift which had formed in the grounding zone in the 1970s (De Rydt et al., 2018, 2019), and the loss of contact with MIR following the 1971 calving. The closest match to the observed magnitude and pattern of velocity increase resulted from the simulated loss of mechanical contact between BIS and the pinning point at MIR. Over the next 3 decades the ice shelf gradually re-advanced, and by ∼ 1997 buttressing from MIR was sufficient for velocities to begin to decrease (Gudmundsson et al., 2017; De Rydt et al., 2018). The reorganization of internal stresses resulting from the increase in buttressing from MIR resulted in the reactivation of the Chasm 1 rift, potentially explaining the increase in velocity after 2012 (Gudmundsson et al., 2017).
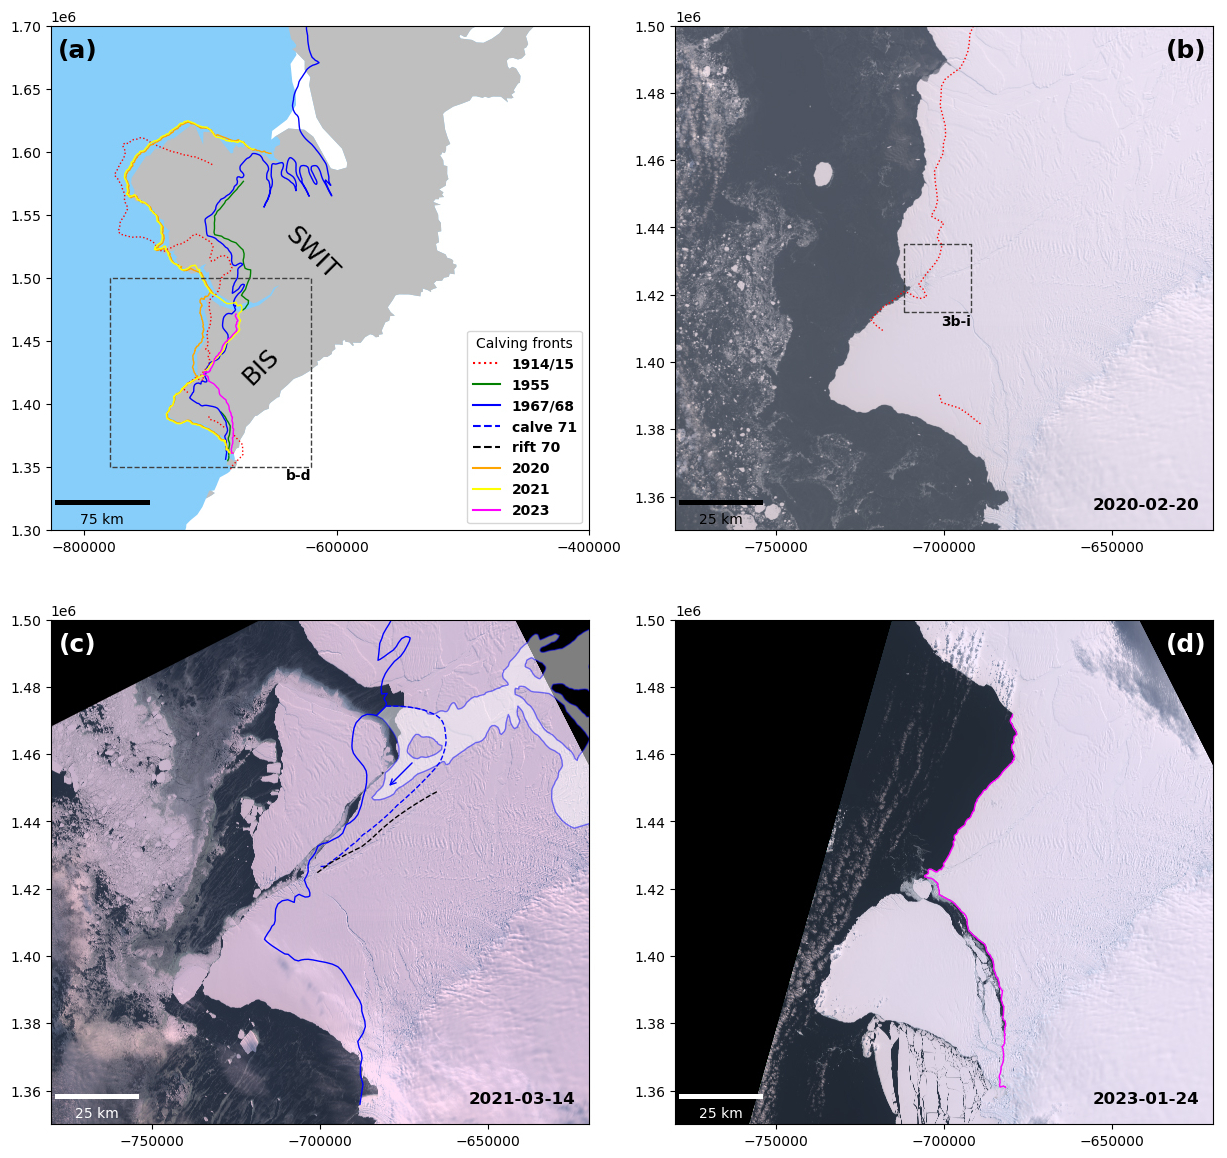
Figure 2(a) Ice front position of BIS and SWIT between 1914/15 and 2023 from satellite imagery and Thomas (1973). (b) The 2020 front (Landsat-8 image courtesy of the US Geological Survey) compared to the 1914/15 (red) position from HMS Endurance (digitized from Thomas, 1973). The dashed box shows the location of imagery subsets in Fig. 3b–i. (c) Iceberg calving (A-74) from the NR and HC positions in February 2021 (contains modified Copernicus Sentinel-2 data 2021) compared to the 1967/68 front (blue), rift (dashed black), and area which calved in 1971 (dashed blue) (all digitized from Thomas, 1973)). The white area shows parts of the 1967/68 shelf composed of sea ice. The blue arrow shows a potential partial rift. (d) Iceberg calving (A-81) from Chasm 1 on 22 January 2023 (contains modified Copernicus Sentinel-2 data 2023).
Here, we focus on three active rifts that have resulted in three tabular iceberg calving events. The first major rift is the Chasm 1 rift, described above. A second major rift, Halloween Crack (HC), formed in October 2016, in a similar location to the rift from which the 1971 iceberg calved (Thomas, 1973; De Rydt et al., 2018). HC initiated from a point approximately 15 km east of MIR and propagated in both a westerly direction toward MIR and an easterly direction towards SWIT, slowing where it encountered thicker ice originating from the grounding zone troughs (De Rydt et al., 2018; King et al., 2018). A third major rift, North Rift (NR), seaward of HC, was observed to be propagating in November 2020 (British Antarctic Survey Press Office, 2021), resulting in the calving of a ∼ 1270 km2 iceberg (A-74) on 26 February 2021 (Francis et al., 2022; Libert et al., 2022; Cheng et al., 2021b; British Antarctic Survey Press Office, 2021). A further ∼ 1500 km2 iceberg (A-81) calved from Chasm 1 on 22 January 2023 (Marsh et al., 2024; British Antarctic Survey Press Office, 2023; U.S. National Ice Center, 2023), resulting in a reduction in buttressing at MIR and a rapid acceleration in flow speed (Marsh et al., 2024). HC would ultimately calve a ∼ 380 km2 iceberg (A-83) on 20 May 2024 (British Antarctic Survey Press Office, 2024; U.S. National Ice Center, 2024). BIS has thus exhibited a cycle of rifting and calving, accompanied by dynamic changes related to the degree of buttressing provided by MIR (Gudmundsson et al., 2017; De Rydt et al., 2019; Marsh et al., 2024). The future of BIS may now be dependent on whether the remainder of the ice shelf can re-establish contact with the bathymetric high point at MIR (Marsh et al., 2024; Hodgson et al., 2019).
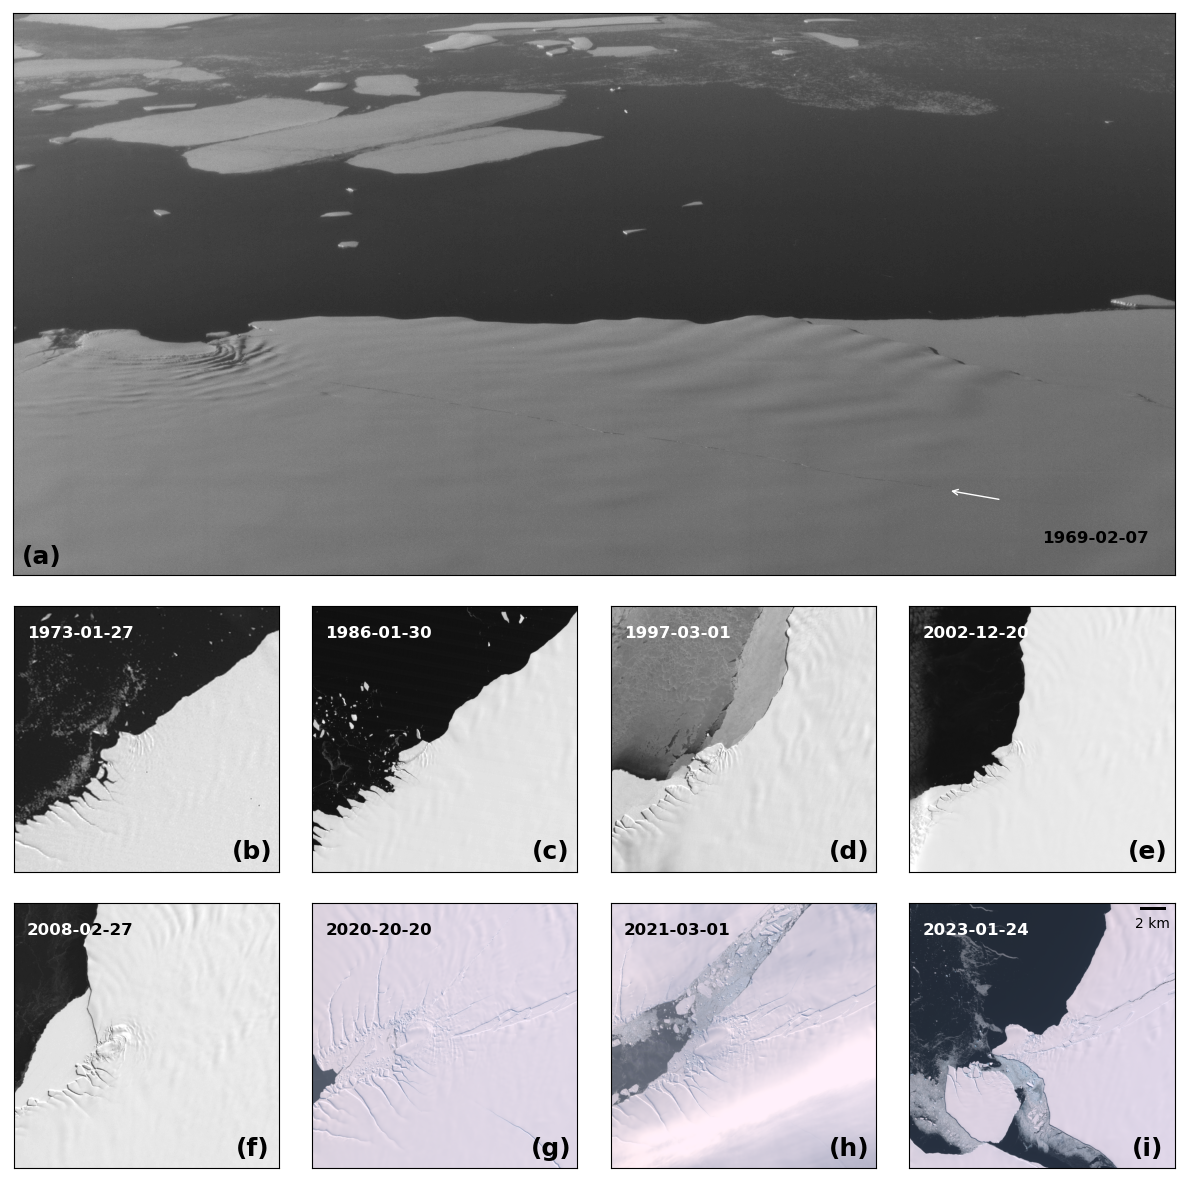
Figure 3Time series of BIS geometry in the vicinity of MIR between 1969 and 2023 from aerial and satellite imagery. (a) Part of an aerial photograph from 1969 looking north towards MIR, showing the rift which calved in 1971. (b–i) Landsat-1 to Landsat-9 and Sentinel-2 imagery of BIS in the vicinity of MIR between 1973 and 2023, showing the re-advance east of MIR and subsequent calving. Aerial photograph and Landsat imagery courtesy of the US Geological Survey; contains modified Copernicus Sentinel-2 data 2023.
3.1 ICESat-2 data and rift catalog
ICESat-2 is a photon counting laser altimetry satellite with an orbital inclination of 92° (allowing data collection to 88° S and full coverage of Antarctic ice shelves) and an orbital repeat cycle of 91 d. The transmitted 532 nm laser pulses are split into three beam pairs. Each beam pair consists of a strong beam and weak beam separated by 90 m. One beam pair is at satellite nadir, and the other pairs are 3.3 km to each side. The platform pointing is maintained such that one beam in each pair is on either side of a “reference ground track” (RGT) (Markus et al., 2017). The ATL06 land ice elevation product takes 40 m along-track segments of photon detections (ATL03), spaced 20 m apart, fits a surface, and calculates the segment elevation (Smith et al., 2019; Neumann et al., 2019). ICESat-2 data can supplement optical satellite imagery to provide year-round and ice-sheet-wide observations of the ice surface limited only by the presence of cloud cover. For example, it has been used previously to study crevassing, rifting, and calving (Li et al., 2021; Walker et al., 2021; Wang et al., 2021; Becker et al., 2021), with the ATL06 product maintaining sufficient detail for rift detection and measurement (Fig. 1c of Wang et al., 2021).
The cataloging of rifts is a two-step process: firstly identifying potential rifts and secondly measuring various characteristics such as width (Fig. 4), ice mélange thickness, seaward–landward offset (Walker and Gardner, 2019), and rift flank topography (Walker et al., 2021; Fricker et al., 2005a). Before beginning this process, we first subsetted ATL06 data to BIS using the BedMachine Antarctica floating ice mask (Morlighem, 2020; Morlighem et al., 2020). We found the ATL06 quality flags incompatible with our methodology, as (apparently) valid height measurements in the area of the rift were often flagged as low quality. Whilst we used the quality flags to filter out beam sections containing a large proportion of low-quality data points and to place confidence intervals of our rift detections, we developed a tailored filtering algorithm. We experimented with different algorithms and found that filtering each beam of each satellite pass by discarding any ∼ 4 km section with > 20 % of measurements flagged as low quality, discarding unrealistic elevations (> 100 m), and skipping the beam section entirely if > 3 % of along-track gaps between elevation measurements exceeded 25 m produced satisfactory results.
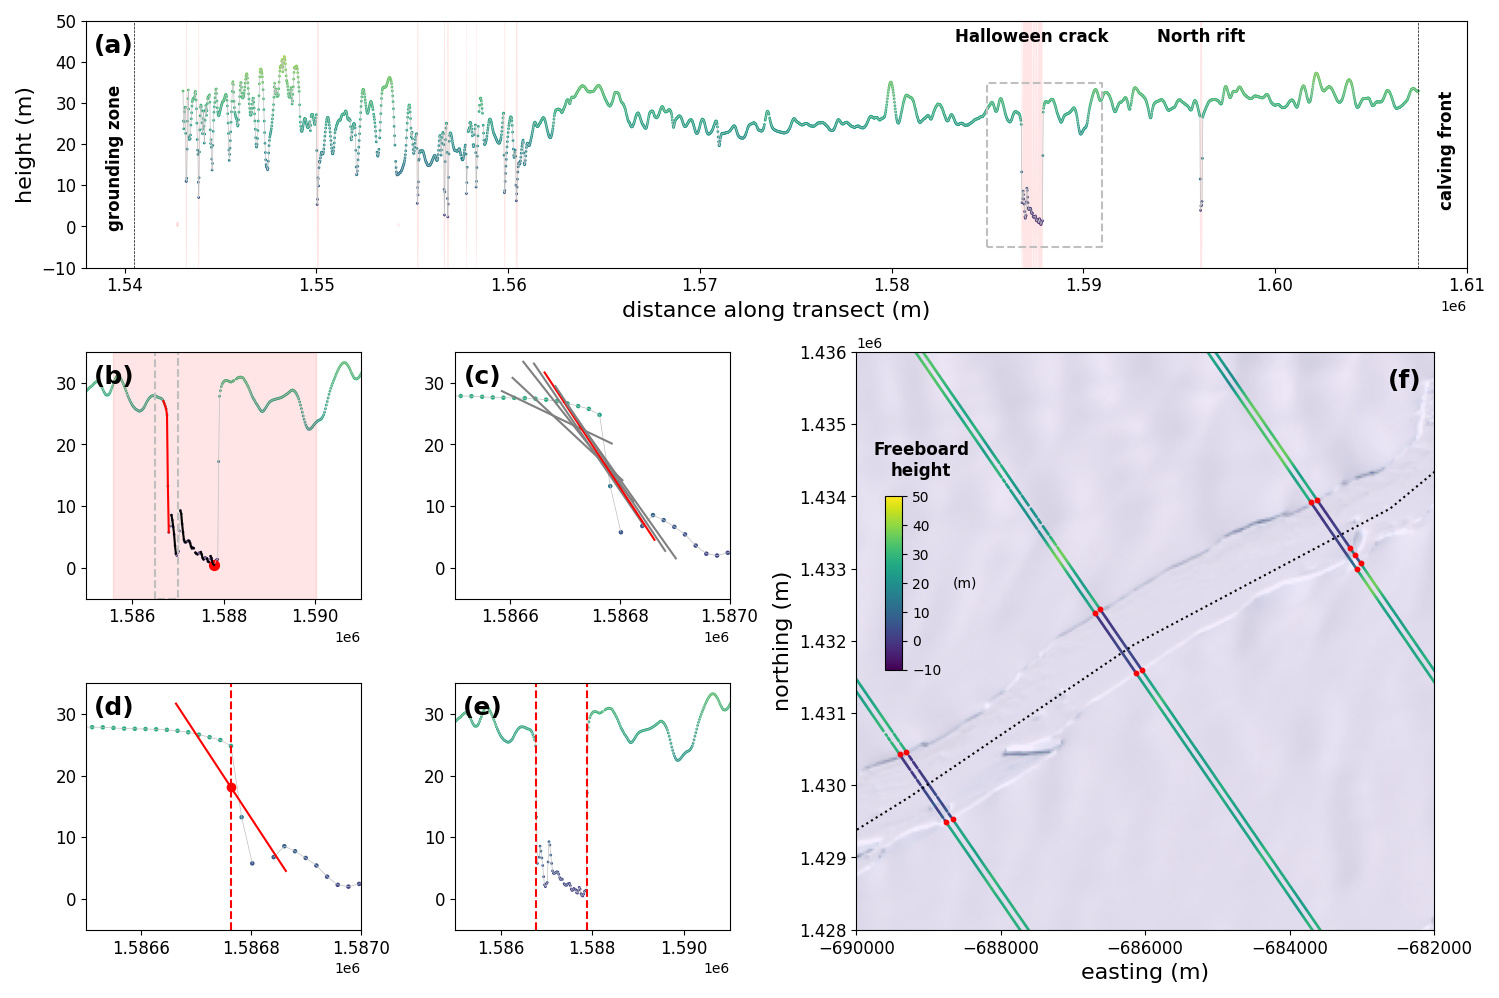
Figure 4Example rift detection and measurement along RGT 215 1L on 7 January 2021. (a) ICESat-2 ATL06 transect with potential rifts shown as light red bars. The dashed box around HC shows the extent of (b) and (e). (b) Expanded search area (light red box) centered on the lowest point in the rift (red circle). The mostly likely rift wall (red) is selected from the possibilities (black). The dashed box shows the extent of (c) and (d). (c) The steepest section of the rift wall (red line) is selected from measurements of slope along 200 m sections (gray lines). (d) The location of the rift wall (dashed red line) is defined as the average location of points in the steepest section (red line). (e) The process is repeated for the opposite rift wall. (f) Rift detections (red circles) along the six beams of RGT 215 overlaid on a Landsat-8 image from the same day (Landsat-8 image courtesy of the US Geological Survey). The dashed line traces the manually defined large-scale rift axis, which does not follow all small-scale variability in the rift and is used to convert oblique measurements of apparent width in ICESat-2 RGT geometry to estimated rift width perpendicular to the large-scale rift axis. The same elevation color bar is used throughout.
Potential rifts were identified by applying a 10 km running mean to the ATL06 data, creating a smoothed ice shelf surface. The running mean elevations were very similar to the measured elevations across flat portions of the ice shelf but differed where the running mean smoothed out rifts. Any ATL06 elevation that was less than 50 % of the corresponding running mean elevation was identified as potentially being within a rift. For each potential rift, defined as contiguous points below the 50 % threshold, an expanded search area was defined (light red box in Fig. 4b) centered on the point with the lowest elevation (red circle in Fig. 4b). Working outwards in both directions from this point (toward the seaward and landward rift walls), upward-sloping regions (groups of ATL06 points of continuously increasing elevations with increasing distance from the lowest elevation point, black lines in Fig. 4b) were identified. The probable rift walls (red line for landward wall in Fig. 4b) were identified as the upward-sloping regions closest to the lowest point which met one of two criteria: 50 % of rift depth (relative to the running mean surface) or the upward-sloping region with the largest elevation change within the search region if none exceeded 50 %.
We measured rift width using the following workflow. First, the slope was calculated for ∼ 200 m sections centered on each ATL06 measurement along the probable rift wall (Fig. 4c), with the average location of ATL06 points making up the steepest slope taken to be representative of wall location (Fig. 4d). The apparent rift width is the distance between the two rift walls (Fig. 4e); this was converted to actual width according to the angular offset between the ground track and a plane perpendicular to the manually defined large-scale rift axis (Fig. 4f). Large icebergs or semi-detached ice blocks held in place by ice mélange occur at several locations along HC, originating from the initiation of rifting (Supplement Fig. S6). If an ICESat-2 beam passes over one of these in situ blocks, the rift will be divided into two closely spaced troughs (Figs. S8a–f, S10d–k, S11d–f, S12a–i, S13a–c). As a validation of the workflow, ICESat-2-derived widths and opening rates were compared with measurements from digitized optical satellite imagery and the separation of Global Navigation Satellite System (GNSS) receivers. To do so it is necessary to combine the measured widths of the two troughs where the rift is bisected by a block. In this case, we catalog both the “opening width”, the sum of the two troughs of the bisected rift, equal to the distance the rift has opened and hence appropriate for comparison with the separation of GNSS receivers, and the “wall-to-wall” width, the total distance from the most landward wall to the most seaward wall of the rift (Fig. S5).
3.2 Satellite imagery
We examined Landsat-8, Landsat-9 (Landsat imagery courtesy of the US Geological Survey), and MAXAR WorldView-1-3 optical satellite imagery of HC during cloud-free days in austral summer. A total of 49 Landsat-8 and Landsat-9 images covered the entirety of HC (Table S5), 20 WorldView-1-3 images covered western HC (Table S1), and 18 covered eastern HC (Table S2). Relevant ICESat-2 RGTs were overlain on the satellite imagery in QGIS, and rift width was measured using the “measure” tool. Opening widths were calculated and apparent widths converted to actual widths in the same way as the ICESat-2 measurements. Digitization error was assumed to be two pixels (60 m for Landsat, 1 m for WorldView) for each wall, meaning a greater error where the rift is bisected by a block.
We also used Landsat-1, Landsat-5, Landsat-7, Landsat-8, Landsat-9, and Sentinel-2 satellite imagery spanning half a century, combined with historical aerial photographs (Landsat imagery and aerial photography courtesy of the US Geological Survey; Copernicus Sentinel-2 data from 2021 to 2023) and digitized ice front and rift positions from Thomas (1973) to provide context for recent rifting events and to investigate the long-term behavior of BIS, updating the record of Anderson et al. (2014). The three oldest ice front positions (all from Thomas, 1973) are from 1914/15 (red dotted line in Fig. 2a and b; from Shackleton's HMS Endurance expedition), 1955 (green line in Fig. 2a; from Argentine icebreaker General San Martín), and 1967/68 (blue line in Fig. 2a and c; combined ship and field data). We supplement these with ice front positions from 2020, 2021, and 2023 (orange, yellow, and magenta lines, respectively, in Fig. 2a; from Landsat-8 and Sentinel-2 imagery), book-ending the calving of a ∼ 1270 km2 iceberg from NR in February 2021 (Francis et al., 2022; Libert et al., 2022; Cheng et al., 2021b; British Antarctic Survey Press Office, 2021), and a ∼ 1500 km2 iceberg from Chasm 1 in January 2023 (Marsh et al., 2024; British Antarctic Survey Press Office, 2023; U.S. National Ice Center, 2023).
3.3 Global Navigation Satellite System
The British Antarctic Survey operated a network of Leica GS-10 GNSS receivers (Marsh and De Rydt, 2025) both landward and seaward of HC to monitor its growth between 2017 and 2024 (Figs. 1, S3, and S4). These recorded at 30 s intervals for 2 h each day between 14:00 and 16:00 UTC. Daily averaged positions were calculated using precise point positioning. Receivers tt05 and hh00 (hereafter the “western pair”) form a baseline approximately perpendicular to the rift axis and aligned with RGT 215 1LR and RGT 1160 3LR. RGT 786 2LR measures the same area of the rift but is oblique to the rift-perpendicular plane (Fig. 1c). Likewise, the baseline between receivers tt04 and ss00 (the “eastern pair”) is approximately aligned with RGT 283 1LR and RGT 725 3LR and oblique to RGT 1099 2LR (Fig. 1d), with all being somewhat oblique to the rift-perpendicular plane. This configuration provides an excellent dataset for validation of the workflow for measurement of apparent rift width and conversion to actual width.
Polar stereographic coordinates representative of the positions of each GNSS receiver on the 15th of each month were calculated by linear regression of points in any month with > 15 daily positions. Time series of monthly GNSS separation were then calculated for each GNSS pair, and the angle of the monthly baseline was used to calculate the rift-perpendicular component. Finally, an estimate for the rate of rift-perpendicular ice divergence was calculated by extracting the velocity components at the mean locations of the GNSS receivers from a pre-HC initiation (2015) velocity map (Gardner et al., 2018, 2020) and subtracted from the rift-perpendicular separation time series. This has the effect of removing residual horizontal strain within the intact ice shelf adjacent to the rift. This then provides a better approximation of the rift opening rate that would be measured by GNSS receivers placed close to the rift walls. This correction is, however, subject to any error in the underlying velocity product caused by, for example, the projection of tracked velocity down the steepest slope of the digital elevation model (DEM) used during processing.
3.4 Velocity and ice thickness maps
We produced velocity fields using Sentinel-1 image pairs (Copernicus Sentinel-1 data from 2020 to 2021), assuming a constant velocity error of 5 m a−1 in the x and y directions. We produced a new thickness map from ICESat-2 and smoothed it in icepack. We used the co-registration and offset tracking functions of the SeNtinel Application Platform (SNAP) (European Space Agency, 2020) to produce velocity fields from 12 d repeat Sentinel-1 SAR image pairs, then applied a 15-by-15 pixel averaging filter to suppress noise. The platform did not provide an error map; therefore, we used error maps with uniform integer-valued errors in the x and y directions across a range of plausible values to test for model convergence before proceeding with the central value tested, a uniform 5 m a−1 error in the x and y directions. The thickness map was produced using ICESat-2 SlideRule (Swinski et al., 2022) data and smoothed in icepack (Shapero et al., 2021) to ensure sensible estimation of driving stress by minimizing a function which penalizes large deviations from the unfiltered thickness map and sharp oscillations over a distance of 2 km (see Supplement Sect. S4).
3.5 Ice flow model
We conducted ice flow model runs (Morris and Lipovsky, 2025) intended to capture the behavior of the BIS during three unique snapshots in time: approximately 1 year prior to calving (“pre-calving”), 1 month surrounding calving (“propagation”), and 9 months post-calving (“post-calving”). The exact time windows for these periods are listed in Table S8. For each time period, we determine the ice fluidity field using an inverse approach that takes as input the unique ice front position, rift geometry, and velocity field during that time period. We then used the inferred fluidity fields to examine a suite of model runs aimed at investigating the relative importance of various factors controlling rift opening rates.
We modeled ice flow using icepack, an open-source finite-element implementation of the shallow shelf approximation (SSA) built in the Firedrake ecosystem (MacAyeal, 1989; Shapero et al., 2021; Rathgeber et al., 2016). The model domains were bound by the grounding line, MIR, ice fronts east and west of MIR, and a divide between BIS and SWIT defined by the extent of the observed velocity fields. We digitized the extent of HC, the narrow ∼ 13 km-long beginning of NR when present, and other smaller fractures in the vicinity of MIR using contemporaneous optical satellite imagery. These rifts were treated as holes in the mesh with Neumann-type boundary conditions. Chasm 1, which consisted of multiple smaller fractures and a large area of damaged ice and mélange, was not specifically delineated and was hence modeled as an area of high fluidity. Ice flows into the domain across the grounding line, the grounding line of MIR, and the BIS/SWIT divide, where Dirichlet boundary conditions are applied.
We use icepack to carry out a parameter inversion to estimate the fluidity coefficient A in Glen's flow law (Glen, 1955):
where n=3, and τij are the strain rate and deviatoric stress tensors, and is the effective deviatoric stress. During inversion, the fluidity field was iteratively refined until it produced a velocity field that matched the input within given tolerances (Shapero et al., 2021). We resampled the modeled velocity and fluidity fields onto regular grids. This allowed fields to be used interchangeably regardless of the advection of rifts with ice flow or changes in calving front position between the three model periods. We used the fill tool in QGIS to interpolate across rifts and extrapolate beyond the calving front. We used the fluidity field from the pre-calving inverse model run to test the impact of resampling and interpolation (Diagnostic1 in Table S9).
The rate of HC opening was calculated as the difference in the rift-perpendicular components of velocity extracted from locations within the modeled velocity fields along the baselines between the two GNSS pairs and 100 m from the rift walls. We also examined the changes in the wider ice shelf flow field resulting from the calving event and calculated and analyzed the principal stress fields (see Sect. S5), updating the stress field records of De Rydt et al. (2019) beyond the calving from NR.
We carried out a set of experiments that only changed the ice shelf geometry (Diagnostic2 to Diagnostic5 in Table S9). These experiments captured the change to the ice shelf geometry due to the calving of iceberg A-74 while not allowing the fluidity field or boundary velocities to react to calving. We also carried out separate experiments where the growth of rifts was included or excluded from the ice shelf geometry in order to isolate effects from this process. Similarly, we also carried out a set of experiments that updated the boundary velocities through the three stages but held the fluidity field fixed (Diagnostic6 to Diagnostic9 in Table S9). Finally, we ran each experiment (Diagnostic1 to Diagnostic9 in Table S9) twice, once each with a different initial-guess ice rheology field based entirely on spatially uniform ice temperatures of 253 and 260 K. This was done in order to quantify the nonuniqueness of the inversion.
4.1 Historical behavior of Brunt Ice Shelf
We analyzed satellite imagery spanning half a century and digitized maps from Thomas (1973) to examine long-term rifting and calving behavior and resultant ice front positions. We discuss changes in three areas: SWIT, BIS east of MIR (area of HC and NR), and BIS west of MIR (area of Chasm 1). The SWIT ice front was similarly advanced in 1914/15 and 2020/21 and ∼ 70 km landward in 1955 and 1967/68 (Fig. 2a). One or more large calving events from SWIT must have occurred between 1914/15 and 1955, and with the 2020/21 ice front close to the 1914/15 position, another may be expected in the coming decades. Between SWIT and MIR the 1914/15 BIS ice front is not as advanced as the 2020 ice front (Fig. 2b) and in the vicinity of MIR is more comparable to the ice front in ∼ 2000 (e.g., Fig. 3d–e). The 1967/68 and 2021 ice fronts are largely the same, barring an area to the east where a small part of the shelf was partially detached along a short fracture (blue arrow in Fig. 2c). There is a gap in the 1955 ice front in this area, but Anderson et al. (2014) present a 1958 ice front and suggest that no large calving events occurred between 1958 and 1967/68. In 1968 a rift formed in largely the same location as HC (white arrow in Fig. 3a and black dashed line in Fig. 2c, note HC visible in the satellite imagery). This calved in 1971 (Thomas, 1973), resulting in the most retreated ice front position observed (blue dashed line in Fig. 2c) until the calving of iceberg A-83 from HC in May 2024 (British Antarctic Survey Press Office, 2024; U.S. National Ice Center, 2024; Marsh et al., 2024), which resulted in a similarly retreated ice front position. To the west of MIR the 1914/15 ice front was more advanced than the 1967/68 ice front, indicating a calving event sometime during this interval (Fig. 2a). The 2020/21 ice front was considerably more advanced than either of the previous observations, and the reactivation of Chasm 1 around 2012 (De Rydt et al., 2018, 2019) suggested calving was imminent. Chasm 1 and a smaller rift initiating from the damaged ice front immediately downstream of MIR propagated and widened through the early 2020s until a ∼ 1500 km2 iceberg (A-81) calved on 22 January 2023 (Figs. 2d and S2).
4.2 Rift measurement algorithm performance and comparison
4.2.1 Rift measurement algorithm performance
Our rift measurement algorithm produced 380 measurements of HC width along 17 RGTs (Table 1, Fig. S3), 375 of which were successful. Five measurements were underestimated by ∼ 100 m as a result of a block dividing the rift into two troughs and all ATL06 measurements within the narrower trough being flagged as low quality. This occurs where the ICESat-2 beam passes close to the location where a semi-detached ice block maintains limited connection to the rift wall or where part of a rotated iceberg is very close to the rift wall from which it has detached. This is compared to the 440 times that HC could be identified manually in the ICESat-2 data (86 %). The percentage is higher at the center of HC, where the rift is widest, and decreases towards the rift tips (Table 1). The 60 times HC was not recorded were times the segment of the beam was not processed due to poor data quality, or elevation measurements along one or both rift walls did not satisfy a number of confidence criteria. Rift wall identifications were discarded if they contained fewer than three elevation measurements, if more than 25 % of measurements were flagged as low quality, or if the measurement density was low (defined as the average along-track separation exceeding 50 m).
Table 1The number of times HC could be manually identified in ICESat-2 ATL06 data spanning 14 October 2018 to 15 July 2021 compared to the number of times it was found and measured by the rift detection and measurement algorithm. RGTs are listed from the western (“McDonald Ice Rumples”) tip of HC to the eastern (“Stancomb–Wills Ice Tongue”) tip (Fig. S3). The RGTs highlighted in bold are the RGTs used in the validation of the rift measurement algorithm (RGTs for which two of the six beams intersect HC in the area between the western and eastern GNSS pairs; Figs. 5–7). The five errors were rift width underestimations caused by semi-detached ice blocks bisecting the rift, resulting in a pair of troughs in the ATL06 data and all points within the narrower trough being flagged as low quality.
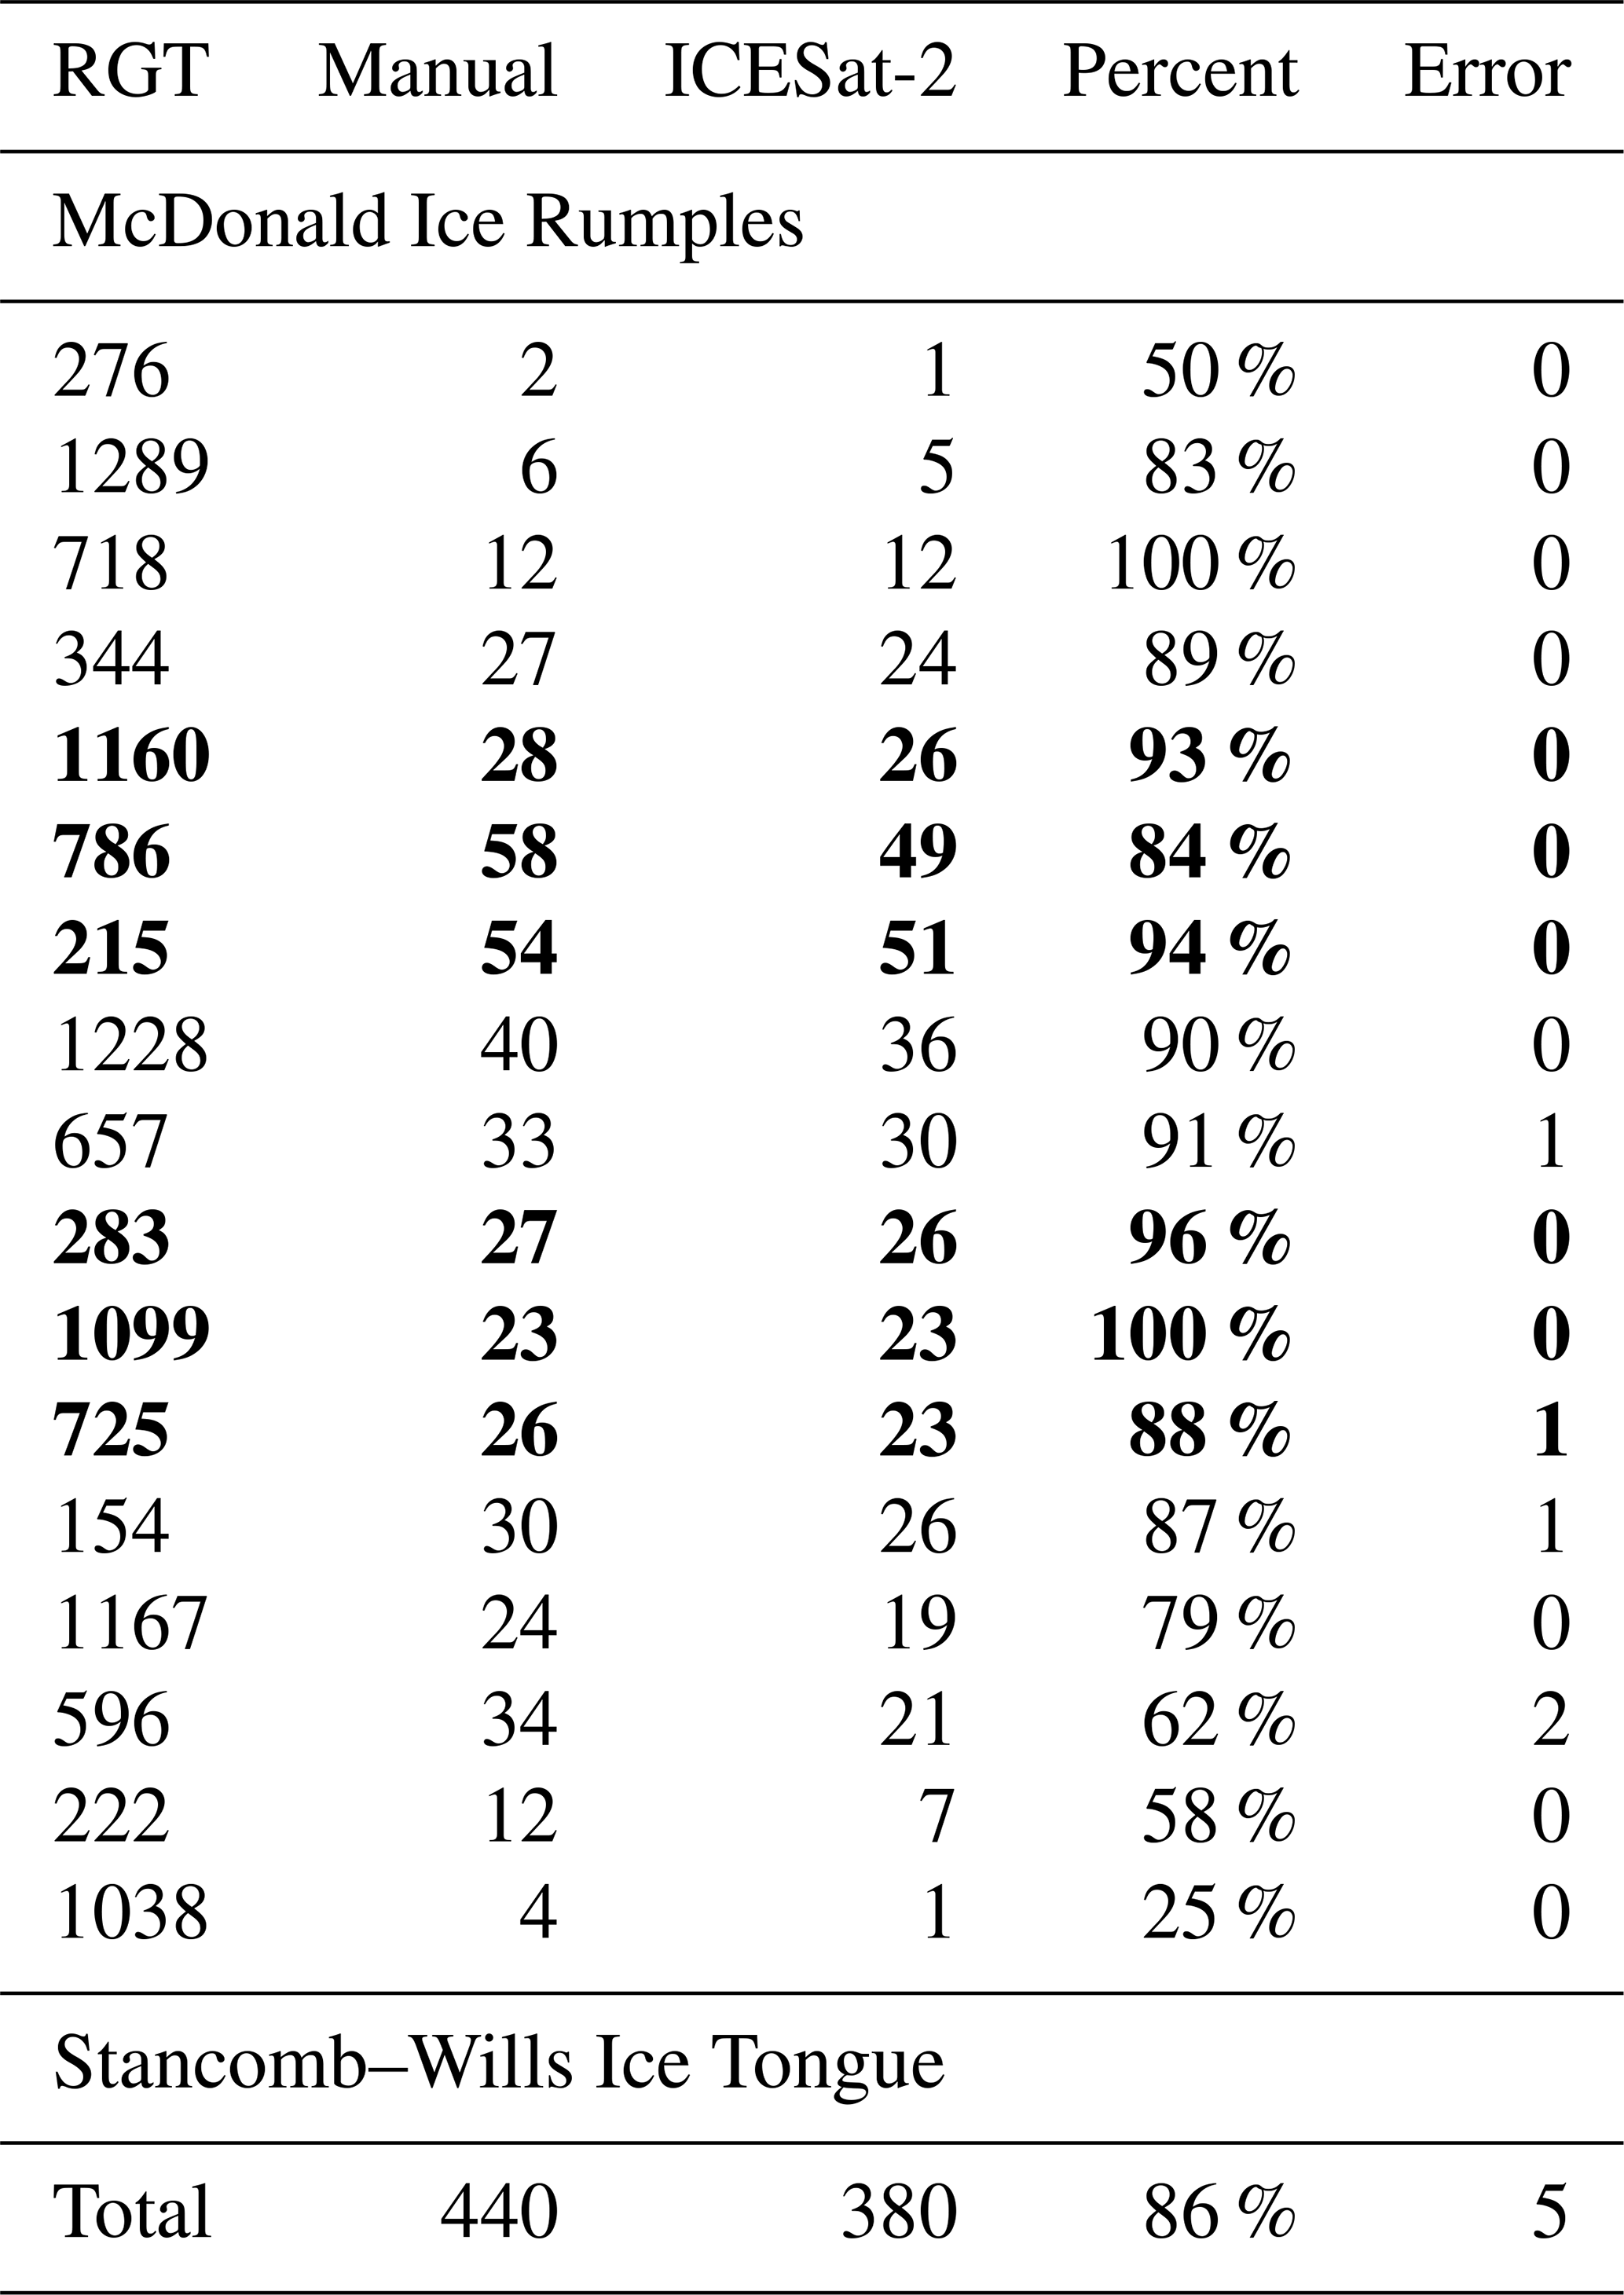
Five of the six RGTs used for validation exceed the average measurement success percentage (RGT 215, RGT 1160, RGT 283, RGT 725, and RGT 1099; Table 1), with RGT 786 2 % below average. However, this includes beam pairs which are not used, and the corresponding measurement success percentages for the individual beam pairs were RGT 215 1LR 94 %, RGT 1160 3LR 100 %, RGT 786 2LR 83 %, RGT 283 1LR 100 %, RGT 725 3LR 73 %, and RGT 1099 2LR 100 %. Removing width measurements affected by satellite pointing errors early in the ICESat-2 mission leaves between three and eight width measurements per beam (mean: 4.6, median: 4). This allows us to validate HC width estimates from ICESat-2 with independent estimates from satellite imagery and field-based measurements on a beam-by-beam basis (Figs. 5 and 6), but to ensure a sufficient number of points for robust estimation of rift opening rate it was necessary to combine all width measurements for each GNSS pair (Fig. 7).
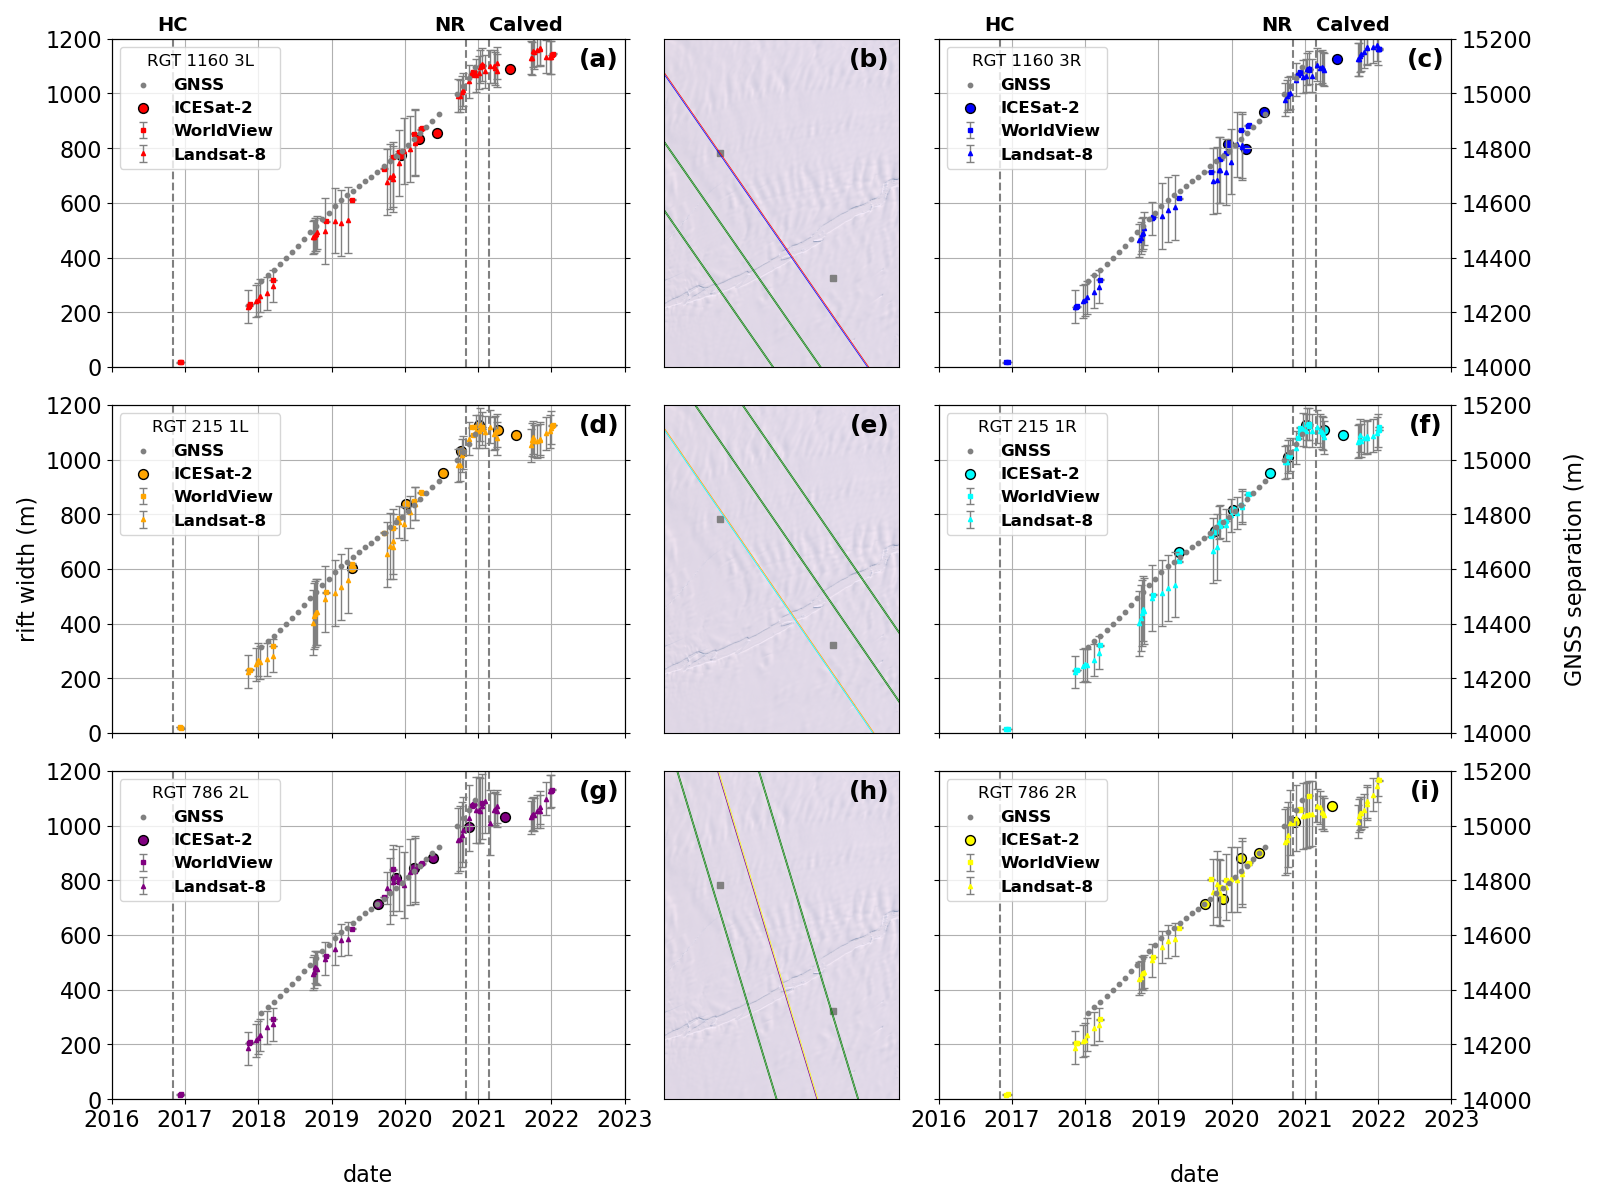
Figure 5Time series of HC actual widths from the application of the rift measurement algorithm to ICESat-2 ATL06 data (circles), digitization on WorldView-1-3 (squares), and Landsat-8 (triangles) satellite imagery, as well as the component of the separation of the western pair of GNSS receivers (Fig. 1c) perpendicular to the local rift axis and corrected for divergence (gray circles) for (a)–(c) RGT 1160 3LR, (d)–(f) RGT 215 1LR, and (g)–(i) RGT 786 2LR. Colors correspond to the beam colors in Fig. 1c. Error bars on WorldView-1-3 and Landsat-8 points denote a two-pixel margin for digitization error and are therefore twice as large where an ice block bisects the rift. Dashed lines denote the timing of the first observation of Halloween Crack (HC), the observation of North Rift propagation (NR), and the calving of an iceberg from North Rift (Calved). ICESat-2-derived widths from passes with large satellite pointing errors were excluded from this analysis. Landsat imagery courtesy of the US Geological Survey.
4.2.2 Comparison with satellite imagery and GNSS observations
We compare the western GNSS receivers to RGT 215 1LR, RGT 1060 3LR, and RGT 786 2LR. The western GNSS receivers move apart at an almost constant rate, with no apparent seasonal variability. (We present detailed rift opening rate calculations in the next subsection.) Rift initiation (“HC”) precedes the first GNSS measurements by about a year, but the trend suggests a similar rate of opening through this first year. The seaward GNSS receiver (hh00, Fig. S3) was located seaward of NR, which began propagating in late 2020 (Fig. 1a), and was removed just prior to calving in February 2021. As a result, the HC width time series calculated from the separation of the western GNSS pair ends at the end of 2020. Throughout the period between the initiation of HC and calving from NR, estimates of HC width from ICESat-2 and digitized satellite imagery were generally consistent with the GNSS estimates, with some variability around the trend line. Measurements from ICESat-2 and digitized satellite imagery continue after the calving from NR and show that rift opening stagnated temporarily in the period immediately following the calving (Fig. 5d and f).
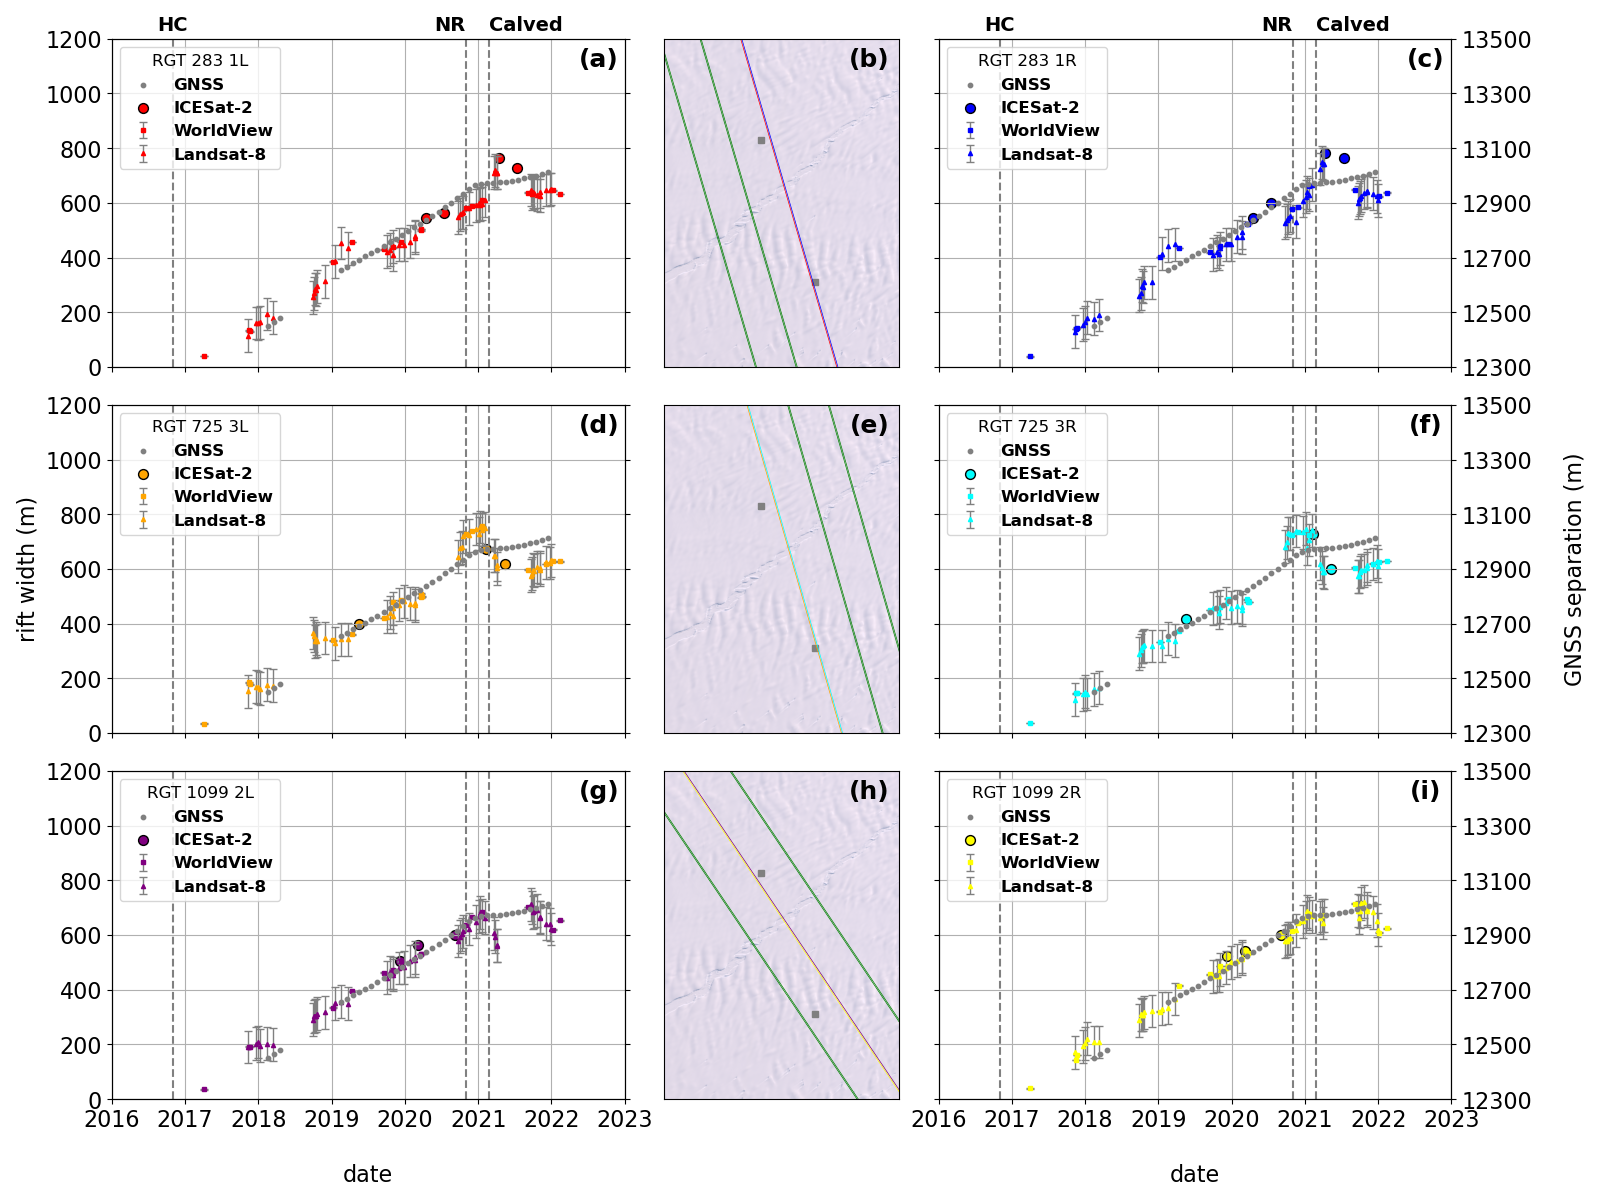
We compare the eastern GNSS receivers with RGT 283 1LR, RGT 725 3LR, and RGT 1099 2LR. The seaward GNSS of the eastern pair was located between HC and NR (Fig. 1a), and therefore the GNSS record continues after the calving from NR (Fig. 6), clearly showing the considerable reduction in HC opening rate following NR calving, then a gradual increase remaining below the pre-calving rate for the remainder of the study period. Close examination of the eastern GNSS pair record suggests this reduction in HC opening rate occurred between the timing of NR propagation and eventual calving (we use 1 January 2021 as the threshold between before and after calving opening rates in Fig. 7 and Table 2). The individual HC width estimates from ICESat-2 and digitized satellite imagery again generally follow the trend line, although individual ICESat-2 measurements and groups of satellite-imagery-derived measurements exhibit larger offsets from the width reconstructed from GNSS receiver separation (e.g., along RGT 283 1LR immediately following calving from the NR).
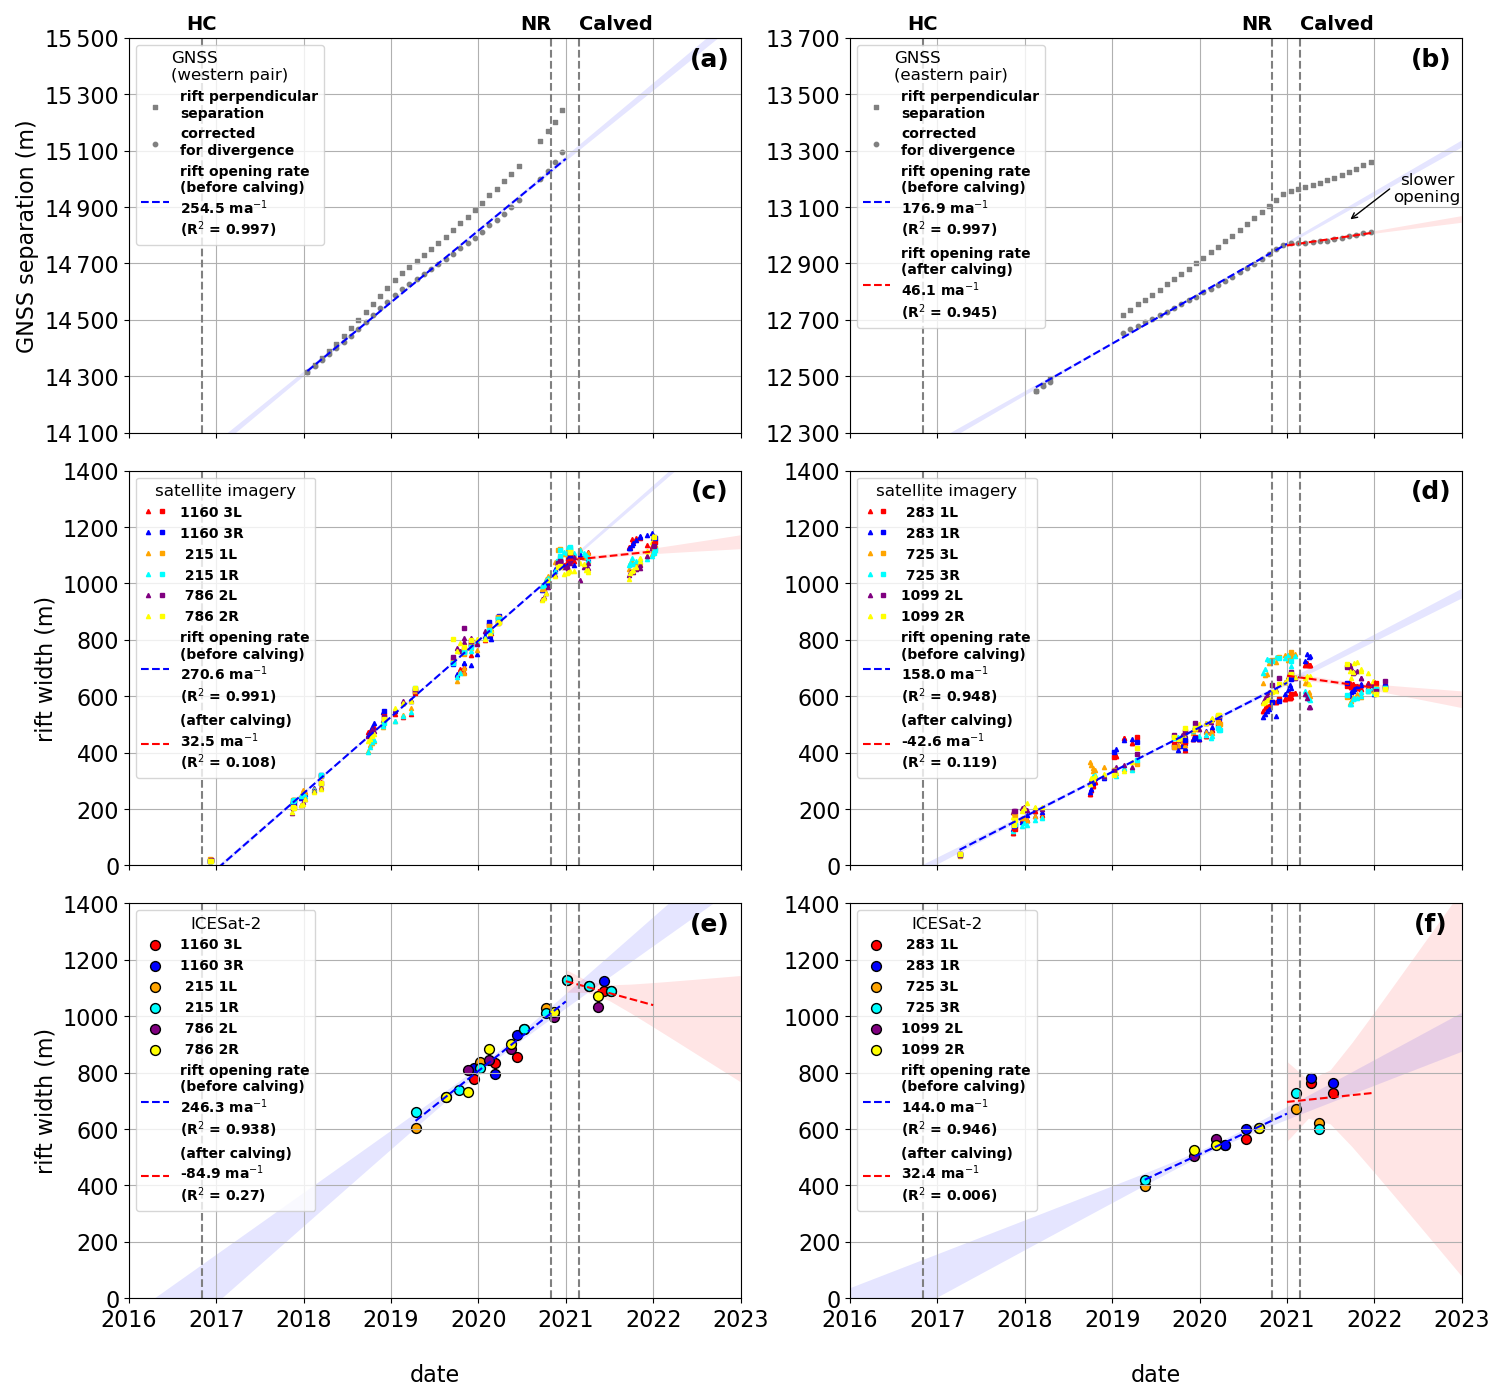
Figure 7Independent estimates from the three datasets of the rates of HC opening in the vicinity of the GNSS pairs before and after calving from NR. (a, b) Time series of the component of the separation of the pairs of GNSS receivers perpendicular to the local rift axis (gray squares) and corrected for divergence (gray circles). (c) Combined time series of HC width from WorldView-1-3 (squares) and Landsat-8 (triangles) for RGT 215 1LR, RGT 1160 3LR, and RGT 786 2LR. (d) As (c) for RGT 283 1LR, RGT 725 3LR, and RGT 1099 2LR. (e) Combined time series of HC width from ICESat-2 (circles) for RGT 215 1LR, RGT 1160 3LR, and RGT 786 2LR. (f) As (e) for RGT 283 1LR, RGT 725 3LR, and RGT 1099 2LR. Point colors in (c) and (e) correspond to Figs. 1c and 5, and point colors in (d) and (f) correspond to Figs. 1d and 6. Dashed lines show rates of HC opening before (blue) and after (red) 1 January 2021 using a linear fit. Light blue and red regions show corresponding 95 % confidence intervals.
4.3 Observed rift opening rates
Averaged over the entire HC rift, the pre-calving opening rate was 158.2±107.9 m a−1 and the post-calving opening rate was m a−1. The corresponding minimum/maximum rift opening rates for these two periods were and m a−1, respectively. Whilst this suggests a reversal in the sense of opening of HC from widening during the pre-calving period to closing during the post-calving period, we note that the eastern GNSS pair exhibits more gradual opening in the post-calving period, including possible stagnation in the immediate post-calving period (Fig. 7b). The opening rates from satellite imagery and ICESat-2 are influenced by rift meanders (Fig. S7) and advection. We therefore refer to the post-calving period as a period of greatly reduced opening, possibly to the point of stagnation.
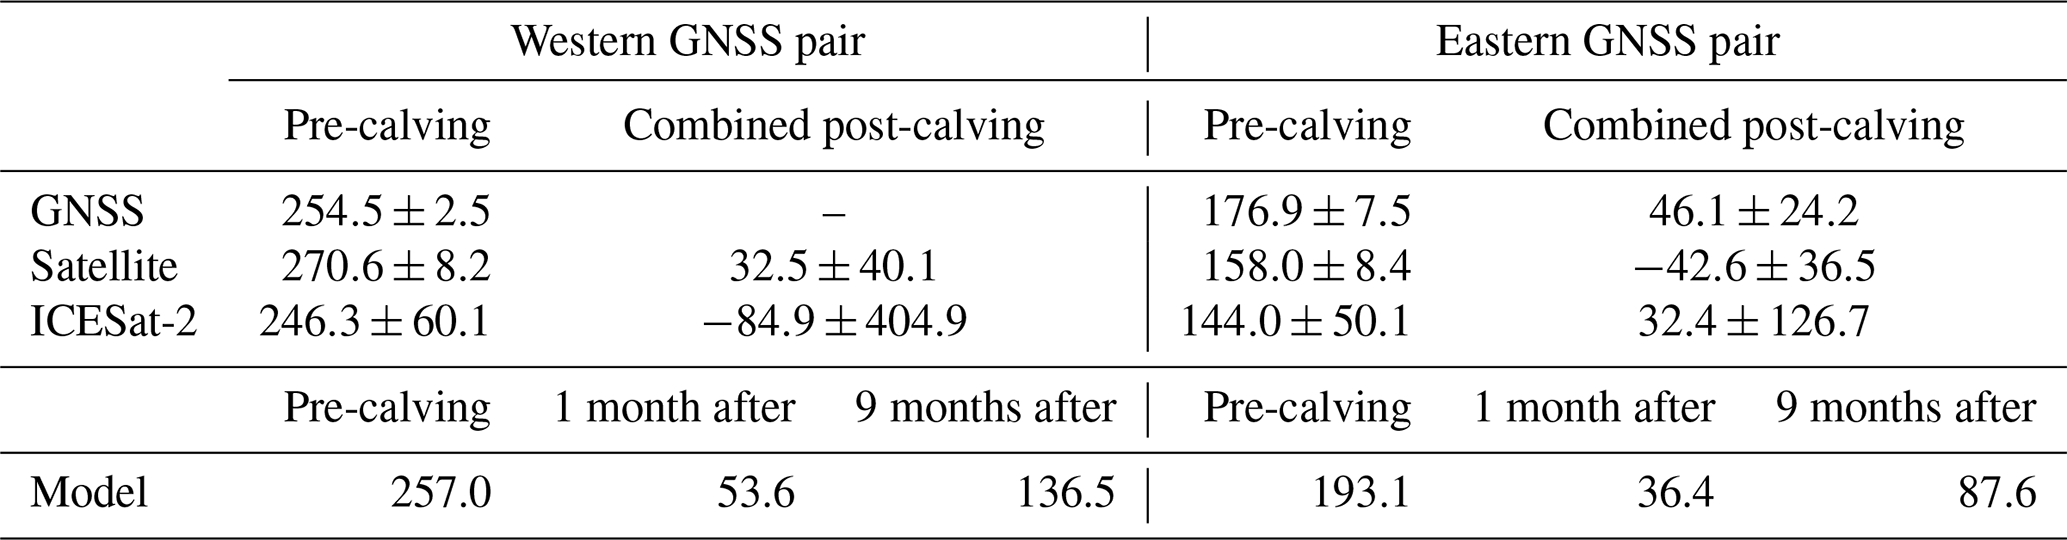
Figure 7 shows opening rates measured using ICESat-2, satellite imagery, and GNSS. GNSS rates were converted to an Eulerian reference frame (Sect. 5.5 and Fig. S16). We calculate opening rates for the periods before and after calving from NR. The pre-calving rates calculated from ICESat-2 and satellite imagery agreed to within ∼ 25 m a−1 (246.3; 270.6 m a−1) for western HC and to within ∼ 15 m a−1 (144.0; 158.0 m a−1) for eastern HC. The rates were also consistent with the estimated rift opening rate from the GNSS separations within ∼ 30 m a−1 (254.5 m a−1 for the western pair, 176.9 m a−1 for the eastern pair). The northernmost GNSS of the western pair was removed prior to calving, leaving only the eastern pair. This measured a post-calving opening rate of 46.1 m a−1, with an acceleration in opening rate (from 23.3 to 66.9 m a−1) apparent if the post-calving record is split at 30 June 2021. This is the only reliable post-calving opening rate; those from ICESat-2 and satellite imagery vary between −84.9 and 32.5 m a−1, though with low R2 values and in the case of ICESat-2 low confidence in the calculated opening rates indicated by the wide 95 % confidence intervals resulting from short time series with high spread, as well as few ICESat-2 measurements. Taken together, the three datasets are evidence of a reduction in the rate of HC opening following calving from NR, including possible short-lived stagnation.
Table 2Multi-observation Halloween Crack (HC) opening rates and 1 standard deviation confidence intervals (m a−1). Confidence intervals are interpreted to dominantly reflect spatiotemporal variability rather than measurement uncertainty (see Sect. 5.5). For ICESat-2 and satellite measurements, results from three RGTs are combined (RGT 215 1LR, RGT 1160 3LR, and RGT 786 2LR for the western GNSS pair; RGT 283 1LR, RGT 725 3LR, and RGT 1099 2LR for the eastern GNSS pair). The seaward GNSS receiver of the western pair was removed prior to calving from NR in February 2021.
4.4 Modeled opening rates, stresses, and velocities
Our model results generally follow a pattern of rapid opening followed by stagnation and concluding with slow opening during the pre-calving, rift propagation, and post-calving stages. The inverse-modeled opening rates during these time periods were 257.0, 53.6, and 136.5 m a−1 for the western GNSS pair and 193.1, 36.4, and 87.6 m a−1 for the eastern GNSS pair. When the ice rheology was held fixed at pre-calving values, the propagation opening rate increased from 36.4 to 55.8 m a−1. Similarly, holding the ice rheology fixed resulted in post-calving rates increasing from 87.6 to 154.8 m a−1. These stated values are for the eastern GNSS pair. For the western GNSS pair, the equivalent values are 53.6 to 66.7 and 136.5 to 181.5 m a−1, respectively. The results of additional experiments that checked for inversion, interpolation, and other artifacts are given in Table S9.
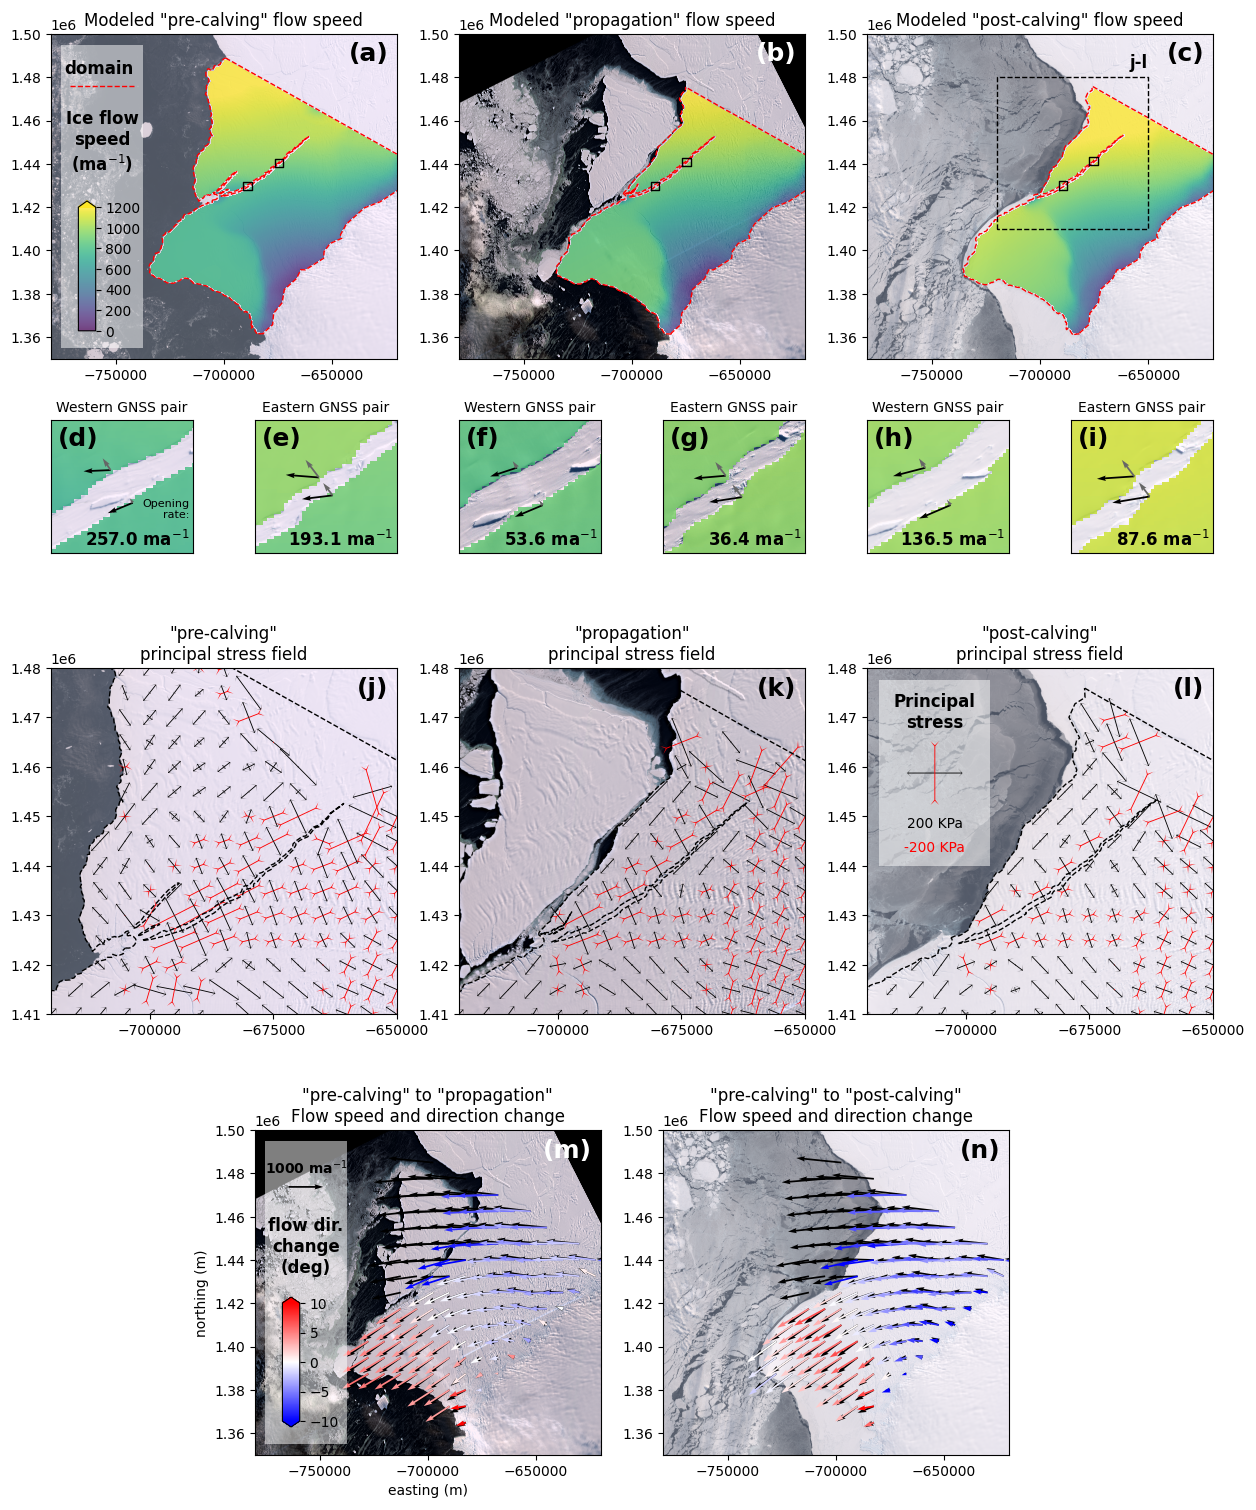
Figure 8Results of icepack inverse modeling of HC opening rates for “pre-calving”, “propagation”, and “post-calving” periods. (a–c) Modeled ice flow speed within the model domain (dashed red line). (d–i) Modeled ice velocity (black arrow) and rift-perpendicular component (gray arrow) on either side of HC from which the opening rate is calculated for the western and eastern GNSS pairs. Solid black boxes in (a)–(c) show the locations of (d)–(i). (j–l) Principal stresses inferred from modeling. (m, n) Modeled ice flow direction and magnitude change. Colored arrows show the angular change in flow direction for the “propagation” and “post-calving” periods compared to the “pre-calving” period (black arrows). Landsat imagery courtesy of the US Geological Survey.
The modeled principal stress fields show regions of uniaxial compression in the vicinity upstream of the MIR (Fig. 8j–l). Prior to calving, NR was oriented approximately 45° to the principal axes, which, as we discuss in Sect. 5.1, is the angle that resolves the maximum shear stress on the rift. HC, in contrast, shows two orientations to the principal axes: it is oriented approximately orthogonal to the direction of maximum tension in the west and is oriented 45° to the principal axes in the east. Following calving, stresses in the nascent iceberg become dominated by a state of biaxial extension. Relatively little rotation of the principal axes occurred, with most changes through the post-calving stages reflecting changes in the principal stress amplitude and sign.
Modeled ice flow speeds (and by extension feature tracked ice flow speeds) increased following calving (Fig. 8m, n). Following calving the ice flow also became more convergent toward the MIR. This convergence was accommodated through rotation of the flow towards the MIR. Specifically, ice seaward of Chasm 1 rotated clockwise toward MIR (red arrows in Fig. 8m, n) as iceberg A-81 pivoted about the remaining connection to the ice shelf, and much of the east of the ice shelf rotated counterclockwise toward the MIR (blue arrows). The ice flow direction in the central portion of the shelf remained largely unchanged. We do not observe large changes in ice thickness which could have significantly altered the force balance at the ice front (Figs. S20–S23).
5.1 Rift propagation and calving due to shear stresses
We observe rift propagation and calving consistent with the dynamics of shearing-mode cracks. Shear stresses were generated in BIS as ice flowed into MIR. As the ice was decelerated at this ice shelf pinning point, a cross-stream gradient in streamwise velocities was generated. Rift propagation on NR began in November 2020 and ultimately led to the calving of a ∼ 1270 km2 iceberg in February 2021. We analyze this propagation in terms of the shear stress resolved on a plane in an arbitrary stress field (Mase et al., 2009),
where θ is the angle between the plane and the principal stress axes, and σ1 and σ2 are the principal stresses. The shear stress is therefore maximized at a diagonal 45∘ orientation to the axes, where the shear stress takes the value
NR propagated along a path that was optimally oriented for shear, i.e., at approximately 45° to the principal axes (Fig. 8j). This observation supports the view that NR was a shearing-mode (Mode II) fracture. As NR propagated northward, it made two large steps to the left (at approximately 1445 and 1459 km grid north). These two steps correlate with previously described pre-existing weaknesses in the ice shelf (King et al., 2018). The gradual arc formed by the rift parallels the gradual rotation of the principal axes across the ice shelf. The stress state captured in our model runs likely captures the propagation of NR by about 20 km between 18 November 2020 and 22 December 2020. Near the middle of our modeled domain, our model predicts lower stress amplitudes, likely explaining the pause in rift propagation that occurred until 12 January 2021, when NR grew by an additional 8 km.
These patterns in the stress field can be understood in terms of the ice flow itself. Prior to calving, ice flowed head-on into MIR, resulting in shear strain, ice rumples, and damage in the form of fractures visible up- and down-glacier. Ice bifurcated, flowing to the north and south of MIR. This behavior has been ongoing since ∼ 2000 (Fig. 2). Shear occurred as the ice was decelerated at the ice rumples, creating a gradient in velocities orthogonal to the flow direction. Following calving, ice flow was almost entirely to the south of MIR, contact between the ice shelf and the pinning point was reduced, and the stresses generated upstream were relieved. Ice flow across much of the east of the shelf and nascent iceberg rotated counterclockwise (Fig. 8m, n), resulting in a reduction in the rift perpendicular component of ice flow seaward of HC, contributing to the reduced opening rate.
Outside of our study period, we expect that similar processes to those observed for NR led to the final propagation of HC and to the creation of iceberg A-83 on 20 May 2024. The final detachment of A-83 occurred as the HC took a 90° turn seaward (British Antarctic Survey Press Office, 2024; U.S. National Ice Center, 2024). This rift path is optimally oriented to maximize shear stresses in our post-calving (i.e., post-A-74 calving) stress state (Fig. 8k). The observed calving behavior of A-83 is therefore consistent with progressive regrounding of the BIS on the MIR, gradually increasing the amplitude of these stresses without causing significant principal axis rotations.
5.2 Calving parameterizations that include shear
The importance of horizontal shear stresses at our study site suggests an ingredient that may be missing from parameterizations of ice shelf calving. We now discuss the degree to which several widely used calving parameterizations capture or do not capture horizontal shear stresses. The eigencalving (Levermann et al., 2012), von Mises (Morlighem et al., 2016), and crevasse depth (Pollard et al., 2015) calving laws are respectively given by the following.
In these equations, c is the calving rate, and and are the principal strain rates. In the crevasse depth law d is the crevasse depth. The eigencalving and von Mises laws prescribe a rate of front retreat, whereas the crevasse depth law requires tracking basal and surface crevasse depths, both of which follow a rule of the form in Eq. (6), and then removing ice when basal and surface crevasses connect. Note that the distinction between stresses and strains is not particularly important here given that the first two equations are heuristic and could equally well have been formulated in terms of stresses. None of the above calving laws are sensitive to horizontal shear stress. Shear stresses fundamentally occur because of the differential stress σ1−σ2, and this quantity is in the null space of the above calving laws.
We propose an extension of these laws that preserves their useful features while adding additional sensitivity to shear stress. Our observations suggest that calving laws should depend on τmax. Mechanically, a dependence on τmax reflects the view that shear fractures will form in whatever plane is optimally oriented in a given stress field (King et al., 1994). One simple way that this could be done would be to model the calving rate or crevasse depth from opening and from shear additively. For example,
where kI and kII are tuning parameters, and cI and cII are the contributions to the calving rate from Mode I (opening) and Mode II (shearing). The opening-mode contribution cI could be taken to be the calving rate predicted from Eq. (4) or (5). The shearing-mode contribution to calving could be taken as proportional to the absolute value of the maximum resolved shear stress,
where the absolute value is used so that the calving rate is the same for left-lateral and right-lateral shearing. In Eq. (7), the condition σ1>0 is used to require at least uniaxial tension, similar to the von Mises calving law; the additional condition that σ2>0 could also be used, which would be similar to the eigencalving law. Intercomparison using models (e.g., Choi et al., 2018; Wilner et al., 2023) and observations (e.g., Enderlin and Bartholomaus, 2020) will be valuable to assess the practical utility of shear-resolving calving laws.
5.3 Post-calving rift stabilization
Our results demonstrate a clear change in the opening rate of HC following calving from NR in February 2021. Whilst some of our results appear to show closing of HC, this may be an artifact of a short post-calving time series and the meandering of the rift, cautioning against the over-interpretation of short records with low-magnitude signals. The most reliable time series, that from the eastern GNSS pair, shows a pronounced reduction in the rate of HC opening to the point of short-lived stagnation. Prior to calving, rift widening occurred on HC as the state of uniaxial compression created by contact with the MIR resulted in tensile stresses resolved onto the HC (Fig. 8j). Following calving, BIS contact with MIR was reduced, resulting in a simultaneous acceleration of the ice shelf and a reduction of the ice shelf shear stresses. These reduced shear stresses corresponded to the removal of normal stress resolved on HC, thereby causing rift stagnation.
Our ice flow model runs are able to qualitatively capture the observed reduction/stagnation in rift opening, with some also predicting small rift closure rates (−7.4 m a−1; Table S9). The model run that produces these closing rates does not update the rheology field through time and instead holds the ice rheology fixed to that from the pre-calving period (Diagnostic8), consistent with previous work that found geometry to be the dominant control on rift propagation on Brunt (De Rydt et al., 2019). It also suggests that widespread fracturing did not affect the ice rheology during rift propagation (Borstad et al., 2017).
5.4 Historical context of the observed changes on the Brunt Ice Shelf
Our analysis of Landsat imagery and digitized maps allows us to investigate the calving cycle at BIS (Sect. 4.1). It is possible that the BIS ice front east of MIR advanced after 1914/15, reaching a position similar to that in the 2010s, with a significant area of ice north of MIR. One or more calving events, possibly an event similar to the 2021 calving, must have occurred sometime between 1914/15 and 1955. The position of the 1914/15 front in the vicinity of MIR is similar to that in ∼ 2000 (Fig. 3d–e; ∼ 20 years before the 2021 calving event), likely favoring the middle to latter part of this interval. An alternative interpretation could be repeating smaller calving events between 1914/15 and 1955 from similarly placed rifts. It is notable that the area between the 1967/68 and 1971 fronts is similar to the area between the 2021 front/NR and HC (Fig. 2c). A hypothesized repeating pattern of dual rift formation and twin calving events, with the smaller event (1971 calving from the 1968 rift and 2024 calving from HC) delayed relative to the larger event (hypothesized 1914/15–1955 calving and 2021 calving from NR), is therefore consistent with the available data. However, the timing of rift initiation would be different, with the 1968 rift forming decades after the hypothesized calving between 1914/15 and 1955, whereas HC and NR formed close together in time and in the opposite order (HC in 2016 and NR in 2020). Figure 3a shows a more significant area of ice to the north of MIR than in 2021 following calving from NR (Fig. 3h), possibly suggesting considerable advance since the previous calving event. Regardless of the sequence of events, the importance of MIR and local ice geometry to rift initiation is apparent.
To the west of MIR, a ∼ 1500 km2 iceberg (A-81) calved from Chasm 1 in January 2023 (Marsh et al., 2024; British Antarctic Survey Press Office, 2023; U.S. National Ice Center, 2023). This did not immediately reduce the degree of contact between MIR and BIS, which amounted to ∼ 2350 m, ∼ 1500 m of which was with ice between HC and the new ice front following calving from NR, and ∼ 850 m was with the remainder of the shelf (Fig. S2d). However, damage accumulated within the nascent iceberg ∼ 3 km upstream of MIR (Fig. S2a–d), allowing the resumption of opening of the bulk of the rift, ultimately breaking through (Fig. S2e). Further, the western tip of HC was advected along the east and south of MIR, intersecting the new western ice front of BIS (former Chasm 1 inland rift wall) following a small calving event in June 2023 (Marsh et al., 2024).
Focusing on MIR (Fig. 3a–i), we show that BIS maintained contact following the 1971 calving event, with visible pressure ridges and damage to the ice downstream demonstrating that it was providing some buttressing to the ice shelf throughout. However, ice flow is largely parallel to the 1973, 1986, and 1997 ice fronts in the vicinity of MIR (Figs. 3b–d and 1b inset), so in the 3 decades following the 1971 calving event MIR was a source of lateral drag. By ∼ 2000 (Fig. 3d–e) the ice front east of MIR had re-advanced sufficiently to flow “head-on” into MIR. This results in divergent and ultimately bifurcating ice flow and generates tensile stresses upstream to the east of MIR, which are ultimately responsible for the initiation and opening of HC and NR rifts (and previously the 1968 rift). Gudmundsson et al. (2017) observed a gradual decrease in BIS flow velocities (which had doubled following the 1971 calving) after ∼ 2000 as a result of the increased flow resistance. These observations suggest that the flow velocity could more than double should there be a complete loss of contact between BIS and MIR, consistent with the observed rapid accelerations since the calving of iceberg A-81 from Chasm 1 and a smaller calving event (Marsh et al., 2024), which resulted in HC intersecting the new western ice front.
5.5 Opening rate consistency between independent observations
We use optical imagery and GNSS as validation datasets for our ICESat-2 Halloween Crack (HC) opening rate measurements. These independent measurements show excellent agreement at the western pair site (Fig. 5). In the vicinity of the western pair, the rift is largely straight-sided, with only occasional small-scale topography leading to minor biases between the three datasets. Larger biases are apparent for the eastern GNSS pair (Fig. 6), though the individual detections of apparent width appear to be robust (Figs. S13 to S15). The biases are the result of small-scale meanders in HC formed as it propagated between meteoric ice blocks and deviated from the large-scale rift axis (De Rydt et al., 2018; King et al., 2018), leading to increases in measured width (Fig. S7).
HC opening rates from ICESat-2, optical imagery, and GNSS show good agreement prior to calving from NR (Fig. 7 and Table 2). This agreement validates our rift measurement workflow and demonstrates robustness to varying temporal ranges, rift wall topography, and uncertainty in the divergence correction to the GNSS measurements. The close agreement also indicates that rift widening, at least in the case of HC, is dominated by rift wall divergence rather than calving along the rift walls. Large-scale calving occurs primarily along fractures originating from the initial stages of rift formation, while small-scale collapses of material from the rift walls are very localized.
HC opening rates exhibit small-scale differences between the different measurements. An important contributor to these differences is errors from the ice flow divergence calculation caused by any lateral offset of the GNSS receivers from the rift-perpendicular axis in the vicinity of the ICESat-2 ground tracks. It is also possible that differences arise as a result of the differing reference frames; the ICESat-2 RGTs along which ICESat-2 and satellite imagery width were measured are fixed in space (Eulerian reference frame), whereas the rift and the GNSS receivers move with ice flow (Lagrangian reference frame). The rift-parallel component of ice flow near the GNSS pairs (∼ 700–1000 m a−1) is much smaller than the length of HC (∼ 50 km), so the resulting uncertainty in rift opening rate due to differing reference frames is < 10 m a−1 (Fig. S16), within the assumed divergence correction uncertainty. However, we acknowledge that this may be an underestimate for the meandering eastern part of HC and may not be the case for other rifts, for example where ice flow is fast (and not aligned with the ICESat-2 RGT), the rift is broader wall to wall but shorter tip to tip, or the timescale of measurement is longer.
HC opening rates were reduced or even stagnated in the months following calving. The most complete record from the eastern GNSS pair suggests this reduced opening rate was transient, with the rate of HC opening gradually increasing through to the end of the record, approximately 1 year after calving. Challenges in interpreting the detailed patterns of rift opening occur due to the obfuscation of representative, large-scale opening rates by small-scale heterogeneity such as a meandering rift wall topography and also from uncertainty associated with the divergence correction. From a validation point of view, the variability in opening rate measurements after calving caution against over-interpretation of temporally short records or those with near-zero opening rates, where uncertainties resulting from rift wall topography, rift advection, and random measurement errors could be greater than the signal. For example, in Fig. 7c-d the large number of satellite measurements leads to small uncertainties in the opening rates (narrow 95 % confidence intervals), but the west and east show contrasting behavior. We attribute this to the effect of meandering rift wall topography in the east. In Fig. 7e–f the small number of ICESat-2 measurements, high spread, and short record result in a lack of consistency between neighboring ICESat-2 tracks. Taken together, the three independent measurements of HC opening rate consistently describe a reduced rate of HC opening following calving.
Our main conclusion is that shear stresses played an essential role in the evolution of the system of rifts on BIS. Shear stresses at the MIR, a pinning point of BIS, were responsible for the nucleation and propagation of NR. The calving of iceberg A-74 in February 2021 reduced the pinning of BIS at MIR. Although the ice shelf accelerated during this time, the simultaneous reduction of shear stresses led to the reduced widening of HC.
These conclusions were strengthened by ICESat-2 observations. We have shown that ICESat-2 can complement optical imagery for the spaceborne monitoring of ice shelf rifts. As a laser altimeter, ICESat-2 has the advantage of year-round observations limited by the presence of cloud cover. We have presented and validated an algorithm for the measurement of ice shelf rift widths and opening rates from ICESat-2 ATL06 data that, when combined with a validated rift detection algorithm, is scalable to the entire Antarctic Ice Sheet. Making a continent-wide rift catalog through the duration of the lifetime of ICESat-2 will facilitate further study of ice shelf fracture and calving processes and thus contribute to better constraint of the likely future mass balance of the Antarctic Ice Sheet.
Our main conclusion about the importance of shear stress in tabular iceberg calving extends beyond the time period of our modeling study (2020–2021). Our analysis of historical observations demonstrates the remarkable similarity in the locations of HC and a rift that calved in 1971, as well as the NR/post-calving ice front and the 1967/68 ice front (Thomas, 1973). Our conclusions are also more broadly applicable to other ice shelves. Pinning points, ice rises, and ice rumples are prevalent across Antarctica (Matsuoka et al., 2015; Miles and Bingham, 2024) and their importance in ice shelf stability has been documented (Wild et al., 2022). We have taken a first step toward incorporating shear stresses into calving law parameterizations by highlighting observational and theoretical reasons why the shear stress on optimally oriented fractures, τmax, should be incorporated into calving laws. We conclude that shear stresses play an important role in the tabular iceberg calving process and that their incorporation into ice-sheet-scale parameterizations will therefore enable a more accurate representation of ice sheet evolution.
| Abbreviation | Definition |
| ATLAS | Advanced Topographic Laser Altimeter System |
| ATL02 | ICESat-2 photon time of flight, spacecraft positioning, and pointing data |
| ATL03 | ICESat-2 global geolocated photon data |
| ATL06 | ICESat-2 land ice elevation product |
| BIS | Brunt Ice Shelf |
| GNSS | Global Navigation Satellite System |
| HC | Halloween Crack |
| ICESat | Ice, Cloud, and Land Elevation Satellite |
| ICESat-2 | Ice, Cloud, and Land Elevation Satellite 2 |
| MIR | McDonald Ice Rumples |
| NASA | National Aeronautics and Space Administration |
| NR | North Rift |
| RGT | ICESat-2 reference ground track |
| RGT 215 1LR | Reference ground track 215 beam pair 1 |
| RGT 1160 3LR | Reference ground track 1160 beam pair 3 |
| RGT 786 2LR | Reference ground track 786 beam pair 2 |
| RGT 283 1LR | Reference ground track 283 beam pair 1 |
| RGT 725 3LR | Reference ground track 725 beam pair 3 |
| RGT 1099 2LR | Reference ground track 1099 beam pair 2 |
| SNAP | SeNtinel Application Platform |
| SWIT | Stancomb–Wills Ice Tongue |
Scripts used to detect and measure rifts as part of the Antarctic Rift Catalog project are available at https://doi.org/10.5281/zenodo.7839138 (last access: 6 September 2025, Morris et al., 2023). These scripts will be updated as the project progresses. The icepack package is an open-source ice flow modeling package available at https://github.com/icepack/icepack (last access: 6 September 2025). The icepack model runs detailed here are available at https://doi.org/10.5281/zenodo.15336311 (last access: 6 September 2025, Morris and Lipovsky, 2025). The Global Navigation Satellite System data are available from the NERC EDS UK Polar Data Centre at https://doi.org/10.5285/6244cca4-8eaa-41a0-a9c1-d89167b02b85 (last access: 6 September 2025, Marsh and De Rydt, 2025).
The supplement related to this article is available online at https://doi.org/10.5194/tc-19-4303-2025-supplement.
AM led the research. AM and BPL led the writing of the paper, with contributions from all of the authors. BPL and CCW designed the Antarctic Rift Catalog project and supervised the research. BPL contributed to code development. OJM processed GNSS data from Brunt Ice Shelf.
The contact author has declared that none of the authors has any competing interests.
Publisher’s note: Copernicus Publications remains neutral with regard to jurisdictional claims made in the text, published maps, institutional affiliations, or any other geographical representation in this paper. While Copernicus Publications makes every effort to include appropriate place names, the final responsibility lies with the authors.
ICESat-2 ATL06 data (Smith et al., 2021) were downloaded from the National Snow & Ice Data Center (https://nsidc.org/data/atl06, last access: 6 September 2025). Aerial photographs and Landsat-1 MSS, Landsat-5 TM, Landsat-7 ETM+, Landsat-8 OLI, and Landsat-9 OLI+ imagery used throughout are courtesy of the US Geological Survey (https://earthexplorer.usgs.gov, last access: 6 September 2025). Copernicus Sentinel-1 and Sentinel-2 data from 2021 are provided by the European Space Agency. WorldView-1-3 (2016–2022) imagery from MAXAR was provided by the Polar Geospatial Center. Geospatial support for this work was provided by the Polar Geospatial Center under NSF-OPP awards 1043681 and 1559691. Satellite imagery was digitized using QGIS. Figure 1 inset data are from the SCAR Antarctic Digital Database, accessed 2023 (Gerrish et al., 2022). Figure 1b and Fig. S1 velocity data were generated using auto-RIFT (Gardner et al., 2018) and provided by the NASA MEaSUREs ITS_LIVE project (Gardner et al., 2020). We thank Daniel R. Shapero for assistance with the icepack package. We thank the reviewers for their constructive reviews, which significantly improved the paper, as well as the editorial team. The scientific color map “hawaii” is used in this study to prevent visual distortion of the data and exclusion of readers with color-vision deficiencies (Crameri et al., 2020).
This research has been supported by the National Aeronautics and Space Administration, Science Mission Directorate (grant no. 80NSSC0960), and Oliver J. Marsh was supported by the RIFT-TIP project of the Natural Environment Research Council (grant no. NE/X014991/1).
This paper was edited by Louise Sandberg Sørensen and reviewed by William Colgan and one anonymous referee.
Abdalati, W., Zwally, H. J., Bindschadler, R., Csathó, B., Farrell, S. L., Fricker, H. A., Harding, D., Kwok, R., Lefsky, M., Markus, T., Marshak, A., Neumann, T., Palm, S., Schutz, B., Smith, B., Spinhirne, J., and Webb, C.: The ICESat-2 Laser Altimetry Mission, Proc. IEEE, 98, 735–751, https://doi.org/10.1109/JPROC.2009.2034765, 2010. a
Anderson, R., Jones, D. H., and Gudmundsson, G. H.: Halley Research Station, Antarctica: calving risks and monitoring strategies, Nat. Hazards Earth Syst. Sci., 14, 917–927, https://doi.org/10.5194/nhess-14-917-2014, 2014. a, b
Aster, R. C., Lipovsky, B. P., Cole, H. M., Bromirski, P. D., Gerstoft, P., Nyblade, A., Wiens, D. A., and Stephen, R.: Swell-triggered seismicity at the near-front damage zone of the Ross Ice Shelf, Seismol. Soc. Am., 92, 2768–2792, https://doi.org/10.1785/0220200478, 2021. a
Banwell, A. F., Willis, I. C., Macdonald, G. J., Goodsell, B., Mayer, D. P., Powell, A., and MacAyeal, D. R.: Calving and rifting on the McMurdo Ice Shelf, Antarctica, Ann. Glaciol., 58, 78–87, https://doi.org/10.1017/aog.2017.12, 2017. a, b
Bassis, J. N., Coleman, R., Fricker, H. A., and Minster, J. B.: Episodic propagation of a rift on the Amery Ice Shelf, East Antarctica, Geophys. Res. Lett., 32, L06502, https://doi.org/10.1029/2004GL022048, 2005. a, b
Bassis, J. N., Fricker, H. A., Coleman, R., Bock, Y., Behrens, J., Darnell, D., Okal, M., and Minster, J.-B.: Seismicity and deformation associated with ice-shelf rift propagation, J. Glaciol., 53, 523–536, https://doi.org/10.3189/002214307784409207, 2007. a, b, c
Bassis, J. N., Fricker, H. A., Coleman, R., and Minster, J.-B.: An investigation into the forces that drive ice-shelf rift propagation on the Amery Ice Shelf, East Antarctica, J. Glaciol., 54, 17–27, https://doi.org/10.3189/002214308784409116, 2008. a
Becker, M. K., Howard, S. L., Fricker, H. A., Padman, L., Mosbeux, C., and Siegfried, M. R.: Buoyancy-Driven Flexure at the Front of Ross Ice Shelf, Antarctica, Observed With ICESat-2 Laser Altimetry, Geophys. Res. Lett., 48, e2020GL091207, https://doi.org/10.1029/2020GL091207, 2021. a
Benn, D. I., Warren, C. R., and Mottram, R. H.: Calving processes and the dynamics of calving glaciers, Earth-Sci. Rev., 82, 143–179, https://doi.org/10.1016/j.earscirev.2007.02.002, 2007. a
Bindschadler, R., Choi, H., Wichlacz, A., Bingham, R., Bohlander, J., Brunt, K., Corr, H., Drews, R., Fricker, H., Hall, M., Hindmarsh, R., Kohler, J., Padman, L., Rack, W., Rotschky, G., Urbini, S., Vornberger, P., and Young, N.: Getting around Antarctica: new high-resolution mappings of the grounded and freely-floating boundaries of the Antarctic ice sheet created for the International Polar Year, The Cryosphere, 5, 569–588, https://doi.org/10.5194/tc-5-569-2011, 2011. a
Borstad, C., McGrath, D., and Pope, A.: Fracture propagation and stability of ice shelves governed by ice shelf heterogeneity, Geophys. Res. Lett., 44, 4186–4194, https://doi.org/10.1002/2017GL072648, 2017. a, b, c
British Antarctic Survey Press Office: Brunt Ice Shelf in Antarctica calves, https://www.bas.ac.uk/media-post/brunt-ice-shelf-in-antarctica-calves/ (last access: 1 March 2023), 2021. a, b, c
British Antarctic Survey Press Office: Brunt Ice Shelf in Antarctica calves giant iceberg, https://www.bas.ac.uk/media-post/brunt-ice-shelf-in-antarctica-calves-giant-iceberg/ (last access: 1 March 2023), 2023. a, b, c
British Antarctic Survey Press Office: Brunt Ice Shelf in Antarctica calves new iceberg, https://www.bas.ac.uk/media-post/brunt-ice-shelf-in-antarctica-calves-new-iceberg/ (last access: 6 August 2024), 2024. a, b, c
Bromirski, P. D. and Stephen, R. A.: Response of the Ross Ice Shelf, Antarctica, to ocean gravity-wave forcing, Ann. Glaciol., 53, 163–172, https://doi.org/10.3189/2012AoG60A058, 2012. a
Bromirski, P. D., Sergienko, O. V., and MacAyeal, D. R.: Transoceanic infragravity waves impacting Antarctic ice shelves, Geophys. Res. Lett., 37, L02502, https://doi.org/10.1029/2009GL041488, 2010. a
Brunt, K. M., Okal, E. A., and MacAyeal, D. R.: Antarctic ice-shelf calving triggered by the Honshu (Japan) earthquake and tsunami, March 2011, J. Glaciol., 57, 785–788, https://doi.org/10.3189/002214311798043681, 2011. a
Cathles IV, L. M., Okal, E. A., and MacAyeal, D. R.: Seismic observations of sea swell on the floating Ross Ice Shelf, Antarctica, J. Geophys. Res.-Earth, 114, F02015, https://doi.org/10.1029/2007JF000934, 2009. a
Cheng, Y., Xia, M., Qiao, G., Li, Y., Hai, G., and Lv, D.: Calving cycle of Ninnis Glacier over the last 60 years, Int. J. Appl. Earth Obs., 105, 102612, https://doi.org/10.1016/j.jag.2021.102612, 2021a. a
Cheng, Y., Xia, M., Qiao, G., Lv, D., Li, Y., and Hai, G.: Imminent calving accelerated by increased instability of the Brunt Ice Shelf, in response to climate warming, Earth Planet. Sc. Lett., 572, 117132, https://doi.org/10.1016/j.epsl.2021.117132, 2021b. a, b
Choi, Y., Morlighem, M., Wood, M., and Bondzio, J. H.: Comparison of four calving laws to model Greenland outlet glaciers, The Cryosphere, 12, 3735–3746, https://doi.org/10.5194/tc-12-3735-2018, 2018. a
Christie, F. D. W., Benham, T. J., Batchelor, C. L., Rack, W., Montelli, A., and Dowdeswell, J. A.: Antarctic ice-shelf advance driven by anomalous atmospheric and sea-ice circulation, Nat. Geosci., 15, 356–362, https://doi.org/10.1038/s41561-022-00938-x, 2022. a, b
Crameri, F., Shephard, G. E., and Heron, P. J.: The misuse of colour in science communication, Nat. Commun., 11, 5444, https://doi.org/10.1038/s41467-020-19160-7, 2020. a
De Rydt, J., Gudmundsson, G. H., Nagler, T., Wuite, J., and King, E. C.: Recent rift formation and impact on the structural integrity of the Brunt Ice Shelf, East Antarctica, The Cryosphere, 12, 505–520, https://doi.org/10.5194/tc-12-505-2018, 2018. a, b, c, d, e, f, g
De Rydt, J., Gudmundsson, G. H., Nagler, T., and Wuite, J.: Calving cycle of the Brunt Ice Shelf, Antarctica, driven by changes in ice shelf geometry, The Cryosphere, 13, 2771–2787, https://doi.org/10.5194/tc-13-2771-2019, 2019. a, b, c, d, e, f, g
Depoorter, M. A., Bamber, J. L., Griggs, J. A., Lenaerts, J. T. M., Ligtenberg, S. R., van den Broeke, M. R., and Moholdt, G.: Calving fluxes and basal melt rates of Antarctic ice shelves, Nature, 502, 89–92, https://doi.org/10.1038/nature12567, 2013. a
Dupont, T. K. and Alley, R. B.: Assessment of the importance of ice-shelf buttressing to ice-sheet flow, Geophys. Res. Lett., 32, L04503, https://doi.org/10.1029/2004GL022024, 2005. a
Enderlin, E. M. and Bartholomaus, T. C.: Sharp contrasts in observed and modeled crevasse patterns at Greenland's marine terminating glaciers, The Cryosphere, 14, 4121–4133, https://doi.org/10.5194/tc-14-4121-2020, 2020. a
European Space Agency: SNAP – ESA Sentinel Application Platform v8.0, https://step.esa.int (last access: 6 September 2025), 2020. a
Fox-Kemper, B., Hewitt, T. H., Xiao, C., Adalgeirsdóttir, G., Drijfhout, S. S., Edwards, T. L., Golledge, N. R., Hemer, M., Kopp, R. E., Krinner, G., Mix, A., Notz, D., Nowicki, S., Nurhati, I. S., Ruiz, L., Sallée, J.-B., Slangen, A. B. A., and Yu, Y.: Chapter 9: Ocean, Cryosphere and Sea Level Change, in: Climate Change 2021: The Physical Science Basis, Contribution of Working Group I to the Sixth Assessment Report of the Intergovernmental Panel on Climate Change, edited by: Masson-Delmotte, V., Zhai, P., Pirani, A., Connors, S. L., Péan, C., Berger, S., Caud, N., Chen, Y., Goldfarb, L., Gomis, M. I., Huang, M., Leitzell, K., Lonnoy, E., Matthews, J. B. R., Maycock, T. K., Waterfield, T., Yelekçi, O., Yu, R., and Zhou, B., Cambridge University Press, United Kingdom and New York, NY, USA, 1211–1362, https://doi.org/10.1017/9781009157896.011, 2021. a
Francis, D., Mattingly, K. S., Lhermitte, S., Temimi, M., and Heil, P.: Atmospheric extremes caused high oceanward sea surface slope triggering the biggest calving event in more than 50 years at the Amery Ice Shelf, The Cryosphere, 15, 2147–2165, https://doi.org/10.5194/tc-15-2147-2021, 2021. a
Francis, D., Fonseca, R., Mattingly, K. S., Marsh, O. J., Lhermitte, S., and Cherif, C.: Atmospheric triggers of the Brunt Ice Shelf calving in February 2021, J. Geophys. Res.-Atmos., 127, e2021JD036424, https://doi.org/10.1029/2021JD036424, 2022. a, b, c
Fretwell, P., Pritchard, H. D., Vaughan, D. G., Bamber, J. L., Barrand, N. E., Bell, R., Bianchi, C., Bingham, R. G., Blankenship, D. D., Casassa, G., Catania, G., Callens, D., Conway, H., Cook, A. J., Corr, H. F. J., Damaske, D., Damm, V., Ferraccioli, F., Forsberg, R., Fujita, S., Gim, Y., Gogineni, P., Griggs, J. A., Hindmarsh, R. C. A., Holmlund, P., Holt, J. W., Jacobel, R. W., Jenkins, A., Jokat, W., Jordan, T., King, E. C., Kohler, J., Krabill, W., Riger-Kusk, M., Langley, K. A., Leitchenkov, G., Leuschen, C., Luyendyk, B. P., Matsuoka, K., Mouginot, J., Nitsche, F. O., Nogi, Y., Nost, O. A., Popov, S. V., Rignot, E., Rippin, D. M., Rivera, A., Roberts, J., Ross, N., Siegert, M. J., Smith, A. M., Steinhage, D., Studinger, M., Sun, B., Tinto, B. K., Welch, B. C., Wilson, D., Young, D. A., Xiangbin, C., and Zirizzotti, A.: Bedmap2: improved ice bed, surface and thickness datasets for Antarctica, The Cryosphere, 7, 375–393, https://doi.org/10.5194/tc-7-375-2013, 2013. a
Fricker, H. A., Young, N. W., Allison, I., and Coleman, R.: Iceberg calving from the Amery Ice Shelf, East Antarctica, Ann. Glaciol., 34, 241–246, https://doi.org/10.3189/172756402781817581, 2002. a
Fricker, H. A., Bassis, J. N., Minster, B., and MacAyeal, D. R.: ICESat's new perspective on ice shelf rifts: The vertical dimension, Geophys. Res. Lett., 32, L23S08, https://doi.org/10.1029/2005GL025070, 2005a. a, b, c
Fricker, H. A., Young, N. W., Coleman, R., Bassis, J. N., and Minster, J.-B.: Multi-year monitoring of rift propagation on the Amery Ice Shelf, East Antarctica, Geophys. Res. Lett., 32, L02502, https://doi.org/10.1029/2004GL021036, 2005b. a
Fürst, J. J., Durand, G., Gillet-Chaulet, F., Tavard, L., Rankl, M., Braun, M., and Gagliardini, O.: The safety band of Antarctic ice shelves, Nat. Clim. Change, 6, 479–482, https://doi.org/10.1038/nclimate2912, 2016. a, b
Gardner, A. S., Moholdt, G., Scambos, T., Fahnstock, M., Ligtenberg, S., van den Broeke, M., and Nilsson, J.: Increased West Antarctic and unchanged East Antarctic ice discharge over the last 7 years, The Cryosphere, 12, 521–547, https://doi.org/10.5194/tc-12-521-2018, 2018. a, b, c
Gardner, A. S., Fahnstock, M., and Scambos, T.: ITS_LIVE Regional Glacier and Ice Sheet Surface Velocities, National Snow and Ice Data Center [data set], https://doi.org/10.5067/6II6VW8LLWJ7, 2020. a, b, c
Gerrish, L., Fretwell, P., and Cooper, P.: Medium resolution vector polygons of the Antarctic coastline, UK Polar Data Centre, Natural Environment Research Council, UK Research & Innovation [data set], https://doi.org/10.5285/b5eaca58-2fce-4a68-bea5-fbafd7c90fa2, 2022. a
Giles, A. B.: The Mertz Glacier Tongue, East Antarctica. Changes in the past 100 years and its cyclic nature – Past, present and future, Remote Sens. Environ., 191, 30–37, https://doi.org/10.1016/j.rse.2017.01.003, 2017. a
Glen, J. W.: The creep of polycrystalline ice, P. Roy. Soc. Lond. A Mat., 228, 519–538, https://doi.org/10.1098/rspa.1955.0066, 1955. a
Greene, C. A., Gardner, A. S., Schlegel, N.-J., and Fraser, A. D.: Antarctic calving loss rivals ice-shelf thinning, Nature, 609, 948–953, https://doi.org/10.1038/s41586-022-05037-w, 2022. a, b, c
Gudmundsson, G. H., De Rydt, J., and Nagler, T.: Five decades of strong temporal variability in the flow of Brunt Ice Shelf, Antarctica, J. Glaciol., 63, 164–175, https://doi.org/10.1017/jog.2016.132, 2017. a, b, c, d, e, f, g, h, i
Gudmundsson, G. H., Paolo, F. S., Adusumilli, S., and Fricker, H. A.: Instantaneous Antarctic Ice Sheet mass loss driven by thinning ice shelves, Geophys. Res. Lett., 46, 13903–13909, https://doi.org/10.1029/2019GL085027, 2019. a
Heeszel, D. S., Fricker, H. A., Bassis, J. N., O'Neel, S., and Walter, F.: Seismicity within a propagating ice shelf rift: The relationship between icequake locations and ice shelf structure, J. Geophys. Res.-Earth, 119, 731–744, https://doi.org/10.1002/2013JF002849, 2014. a
Hodgson, D. A., Jordan, T. A., De Rydt, J., Fretwell, P. T., Seddon, S. A., Becker, D., Hogan, K. A., Smith, A. M., and Vaughan, D. G.: Past and future dynamics of the Brunt Ice Shelf from seabed bathymetry and ice shelf geometry, The Cryosphere, 13, 545–556, https://doi.org/10.5194/tc-13-545-2019, 2019. a
Hulbe, C. L., LeDoux, C., and Cruikshank, K.: Propagation of long fractures in the Ronne Ice Shelf, Antarctica, investigated using a numerical model of fracture propagation, J. Glaciol., 56, 459–472, https://doi.org/10.3189/002214310792447743, 2010. a, b
Joughin, I. and MacAyeal, D. R.: Calving of large tabular icebergs from ice shelf rift systems, Geophys. Res. Lett., 32, L02501, https://doi.org/10.1029/2004GL020978, 2005. a, b
Joughin, I., Shapero, D., Smith, B., Dutrieux, P., and Barham, M.: Ice-shelf retreat drives recent Pine Island Glacier speedup, Science Advances, 7, eabg3080, https://doi.org/10.1126/sciadv.abg3080, 2021. a, b
King, E. C., De Rydt, J., and Gudmundsson, G. H.: The internal structure of the Brunt Ice Shelf from ice-penetrating radar analysis and implications for ice shelf fracture, The Cryosphere, 12, 3361–3372, https://doi.org/10.5194/tc-12-3361-2018, 2018. a, b, c, d, e
King, G. C., Stein, R. S., and Lin, J.: Static stress changes and the triggering of earthquakes, B. Seismol. Soc. Am., 84, 935–953, https://doi.org/10.1785/BSSA0840030935, 1994. a
Kulessa, B., Jansen, D., Luckman, A. J., King, E. C., and Sammonds, P. R.: Marine ice regulates the future stability of a large Antarctic ice shelf, Nat. Commun., 5, 3707, https://doi.org/10.1038/ncomms4707, 2014. a
Larour, E., Rignot, E., and Aubry, D.: Modelling of rift propagation on Ronne Ice Shelf, Antarctica, and sensitivity to climate change, Geophys. Res. Lett., 31, L16404, https://doi.org/10.1029/2004GL020077, 2004. a
Larour, E., Rignot, E., Poinelli, M., and Scheuchl, B.: Physical processes controlling the rifting of Larsen C Ice Shelf, Antarctica, prior to the calving of iceberg A68, P. Natl. Acad. Sci. USA, 118, e2105080118, https://doi.org/10.1073/pnas.2105080118, 2021. a
Levermann, A., Albrecht, T., Winkelmann, R., Martin, M. A., Haseloff, M., and Joughin, I.: Kinematic first-order calving law implies potential for abrupt ice-shelf retreat, The Cryosphere, 6, 273–286, https://doi.org/10.5194/tc-6-273-2012, 2012. a
Li, G., Guo, J., Pei, L., Zhang, S., Tang, X., and Yao, J.: Extraction and Analysis of the Three-Dimensional Features of Crevasses in the Amery Ice Shelf Based on ICESat-2 ATL06 Data, IEEE J. Sel. Top. Appl., 14, 5796–5806, https://doi.org/10.1109/JSTARS.2021.3085302, 2021. a
Libert, L., Wuite, J., and Nagler, T.: Automatic delineation of cracks with Sentinel-1 interferometry for monitoring ice shelf damage and calving, The Cryosphere, 16, 1523–1542, https://doi.org/10.5194/tc-16-1523-2022, 2022. a, b
Lipovsky, B. P.: Ice Shelf Rift Propagation and the Mechanics of Wave-Induced Fracture, J. Geophys. Res.-Oceans, 123, 4014–4033, https://doi.org/10.1029/2017JC013664, 2018. a
Lipovsky, B. P.: Ice shelf rift propagation: stability, three-dimensional effects, and the role of marginal weakening, The Cryosphere, 14, 1673–1683, https://doi.org/10.5194/tc-14-1673-2020, 2020. a
MacAyeal, D. R.: Large-scale ice flow over a viscous basal sediment: Theory and application to ice stream B, Antarctica, J. Geophys. Res.-Sol. Ea., 94, 4071–4087, https://doi.org/10.1029/JB094iB04p04071, 1989. a
MacAyeal, D. R., Rignot, E., and Hulbe, C. L.: Ice-shelf dynamics near the front of the Filchner-Ronne Ice Shelf, Antarctica, revealed by SAR interferometry: model/interferogram comparison, J. Glaciol., 44, 419–428, https://doi.org/10.3189/S0022143000002744, 1998. a
MacAyeal, D. R., Okal, E. A., Aster, R. C., Bassis, J. N., Brunt, K. M., Cathles, L. M., Drucker, R., Fricker, H. A., Kim, Y.-J., Martin, S., Okal, M. H., Sergienko, O. V., Sponsler, M. P., and Thom, J. E.: Transoceanic wave propagation links iceberg calving margins of Antarctica with storms in tropics and Northern Hemisphere, Geophys. Res. Lett., 33, L17502, https://doi.org/10.1029/2006GL027235, 2006. a
MacGregor, J. A., Catania, G. A., Markowski, M. S., and Andrews, A. G.: Widespread rifting and retreat of ice-shelf margins in the eastern Amundsen Sea Embayment between 1972 and 2011, J. Glaciol., 58, 458–466, https://doi.org/10.3189/2012JoG11J262, 2012. a
Markus, T., Neumann, T., Martino, A., Abdalati, W., Brunt, K., Csathó, B., Farrell, S., Fricker, H., Gardner, A., Harding, D., Jasinski, M., Kwok, R., Magruder, L., Lubin, D., Luthcke, S., Morison, J., Nelson, R., Neuenschwander, A., Palm, S., Popescu, S., Shum, C., Schutz, B. E., Smith, B., Yang, Y., and Zwally, J.: The Ice, Cloud, and Land Elevation Satellite-2 (ICESat-2): Science requirements, concept, and implementation, Remote Sens. Environ., 190, 260–273, https://doi.org/10.1016/j.rse.2016.12.029, 2017. a, b
Marsh, O. and De Rydt, J.: GPS data relating to the growth of Halloween Crack, Brunt Ice Shelf from 2016 to 2023 (Version 1.0), NERC EDS UK Polar Data Centre [data set], https://doi.org/10.5285/6244cca4-8eaa-41a0-a9c1-d89167b02b85, 2025. a, b, c
Marsh, O. J., Luckman, A. J., and Hodgson, D. A.: Brief communication: Rapid acceleration of the Brunt Ice Shelf after calving of iceberg A-81, The Cryosphere, 18, 705–710, https://doi.org/10.5194/tc-18-705-2024, 2024. a, b, c, d, e, f, g, h, i, j
Mase, G. T., Smelser, R. E., and Mase, G. E.: Continuum mechanics for engineers, CRC Press, ISBN-10: 1420085387 and ISBN-13: 978-1420085389, 2009. a
Massom, R. A., Scambos, T. A., Bennetts, L. G., Reid, P., Squire, V. A., and Stammerjohn, S. E.: Antarctic ice shelf disintegration triggered by sea ice loss and ocean swell, Nature, 558, 383–389, https://doi.org/10.1038/s41586-018-0212-1, 2018. a
Matsuoka, K., Hindmarsh, R. C. A., Moholdt, G., Bentley, M. J., Pritchard, H. D., Brown, J., Conway, H., Drews, R., Durand, G., Goldberg, D., Hattermann, T., Kingslake, J., Lenaerts, J. T. M., Martín, C., Mulvaney, R., Nicholls, K. W., Pattyn, F., Ross, N., Scambos, T., and Whitehouse, P. L.: Antarctic ice rises and rumples: Their properties and significance for ice-sheet dynamics and evolution, Earth-Sci. Rev., 150, 724–745, https://doi.org/10.1016/j.earscirev.2015.09.004, 2015. a, b
McGrath, D., Steffen, K., Holland, P. R., Scambos, T., Rajaram, H., Abdalati, W., and Rignot, E.: The structure and effect of suture zones in the Larsen C Ice Shelf, Antarctica, J. Geophys. Res.-Earth, 119, 588–602, https://doi.org/10.1002/2013JF002935, 2014. a
Miles, B. W. and Bingham, R. G.: Progressive unanchoring of Antarctic ice shelves since 1973, Nature, 626, 785–791, https://doi.org/10.1038/s41586-024-07049-0, 2024. a
Morlighem, M.: MEaSUREs BedMachine Antarctica, Version 2. [floating ice mask, firn air content], Boulder, Colorado USA, NASA National Snow and Ice Data Center Distributed Active Archive Center [data set], https://doi.org/10.5067/E1QL9HFQ7A8M, 2020. a
Morlighem, M., Bondzio, J., Seroussi, H., Rignot, E., Larour, E., Humbert, A., and Rebuffi, S.: Modeling of Store Gletscher's calving dynamics, West Greenland, in response to ocean thermal forcing, Geophys. Res. Lett., 43, 2659–2666, https://doi.org/10.1002/2016GL067695, 2016. a
Morlighem, M., Rignot, E., Binder, T., Blankenship, D., Drews, R., Eagles, G., Eisen, O., Ferraccioli, F., Forsberg, R., Fretwell, P., Goel, V., Greenbaum, J. S., Gudmundsson, H., Guo, J., Helm, V., Hofstede, C., Howat, I., Humbert, A., Jokat, W., Karlsson, N. B., Lee, W. S., Matsuoka, K., Millan, R., Mouginot, J., Paden, J., Pattyn, F., Roberts, J., Rosier, S., Ruppel, A., Seroussi, H., Smith, E. C., Steinhage, D., Sun, B., van den Broeke, M. R., van Ommen, T. D., van Wessem, M., and Young, D. A.: Deep glacial troughs and stabilizing ridges unveiled beneath the margins of the Antarctic Ice Sheet, Nat. Geosci., 13, 132–137, https://doi.org/10.1038/s41561-019-0510-8, 2020. a
Morris, A. and Lipovsky, B. P.: icepack modeling of Brunt Ice Shelf flow field and Halloween Crack opening rate for “pre-calving”, “calving” and “post-calving” periods, Zenodo [code], https://doi.org/10.5281/zenodo.15336311, 2025. a, b
Morris, A., Lipovsky, B. P., and Walker, C. C.: Antarctic Rift Catalog: Antarctic Rift Measurement Algoithm v1.0, Zenodo [code], https://doi.org/10.5281/zenodo.7839138, 2023. a
Mouginot, J., Rignot, E., and Scheuchl, B.: Sustained increase in ice discharge from the Amundsen Sea Embayment, West Antarctica, from 1973 to 2013, Geophys. Res. Lett., 41, 1576–1584, https://doi.org/10.1002/2013GL059069, 2014. a
Neumann, T. A., Martino, A. J., Markus, T., Bae, S., Bock, M. R., Brenner, A. C., Brunt, K. M., Cavanaugh, J., Fernandes, S. T., Hancock, D. W., Harbeck, K., Lee, J., Kurtz, N. T., Luers, P. J., Luthcke, S. B., Magruder, L., Pennington, T. A., Ramos-Izquierdo, L., Rebold, T., Skoog, J., and Thomas, T. C.: The Ice, Cloud, and Land Elevation Satellite – 2 mission: A global geolocated photon product derived from the Advanced Topographic Laser Altimeter System, Remote Sens. Environ., 233, 111325, https://doi.org/10.1016/j.rse.2019.111325, 2019. a
Olinger, S. D., Lipovsky, B. P., Wiens, D. A., Aster, R. C., Bromirski, P. D., Chen, Z., Gerstoft, P., Nyblade, A. A., and Stephen, R. A.: Tidal and thermal stresses drive seismicity along a major Ross Ice Shelf rift, Geophys. Res. Lett., 46, 6644–6652, https://doi.org/10.1029/2019GL082842, 2019. a
Olinger, S. D., Lipovsky, B. P., Denolle, M. A., and Crowell, B. W.: Tracking the Cracking: a Holistic Analysis of Rapid Ice Shelf Fracture Using Seismology, Geodesy, and Satellite Imagery on the Pine Island Glacier Ice Shelf, West Antarctica, Geophys. Res. Lett., 49, e2021GL097604, https://doi.org/10.1029/2021GL097604, 2022. a
Olinger, S. D., Lipovsky, B. P., and Denolle, M. A.: Ocean coupling limits rupture velocity of fastest observed ice shelf rift propagation event, AGU Advances, 5, e2023AV001023, https://doi.org/10.1029/2023AV001023, 2024. a
Paolo, F. S., Fricker, H. A., and Padman, L.: Volume loss from Antarctic ice shelves is accelerating, Science, 348, 327–331, https://doi.org/10.1126/science.aaa0940, 2015. a
Paolo, F. S., Gardner, A. S., Greene, C. A., Nilsson, J., Schodlok, M. P., Schlegel, N.-J., and Fricker, H. A.: Widespread slowdown in thinning rates of West Antarctic ice shelves, The Cryosphere, 17, 3409–3433, https://doi.org/10.5194/tc-17-3409-2023, 2023. a
Pollard, D., DeConto, R. M., and Alley, R. B.: Potential Antarctic Ice Sheet retreat driven by hydrofracturing and ice cliff failure, Earth Planet. Sc. Lett., 412, 112–121, https://doi.org/10.1016/j.epsl.2014.12.035, 2015. a
Pritchard, H. D., Ligtenberg, S. R. M., Fricker, H. A., Vaughan, D. G., van den Broeke, M. R., and Padman, L.: Antarctic Ice-Sheet loss driven by basal melting of ice shelves, Nature, 484, 502–505, https://doi.org/10.1038/nature10968, 2012. a
Rathgeber, F., Ham, D. A., Mitchell, L., Lange, M., Luporini, F., McRae, A. T. T., Bercea, G.-T., Markall, G. R., and Kelly, P. H. J.: Firedrake: automating the finite element method by composing abstractions, ACM T. Math. Software, 43, 1–27, https://doi.org/10.1145/2998441, 2016. a
Reese, R., Gudmundsson, G. H., Levermann, A., and Winkelmann, R.: The far reach of ice-shelf thinning in Antarctica, Nat. Clim. Change, 8, 53–57, https://doi.org/10.1038/s41558-017-0020-x, 2018. a
Rignot, E. and MacAyeal, D. R.: Ice-shelf dynamics near the front of the Filchner—Ronne Ice Shelf, Antarctica, revealed by SAR interferometry, J. Glaciol., 44, 405–418, https://doi.org/10.3189/S0022143000002732, 1998. a
Rignot, E., Jacobs, S., Mouginot, J., and Scheuchl, B.: Ice-shelf melting around Antarctica, Science, 341, 266–270, https://doi.org/10.1126/science.1235798, 2013. a, b
Rott, H., Müller, F., Nagler, T., and Floricioiu, D.: The imbalance of glaciers after disintegration of Larsen-B ice shelf, Antarctic Peninsula, The Cryosphere, 5, 125–134, https://doi.org/10.5194/tc-5-125-2011, 2011. a
Shapero, D. R., Badgeley, J. A., Hoffman, A. O., and Joughin, I. R.: icepack: a new glacier flow modeling package in Python, version 1.0, Geosci. Model Dev., 14, 4593–4616, https://doi.org/10.5194/gmd-14-4593-2021, 2021. a, b, c
Simmons, D. A. and Rouse, J. R.: Accelerating flow of the Brunt Ice Shelf, Antarctica, J. Glaciol., 30, 377–380, https://doi.org/10.3189/S0022143000006262, 1984. a
Smith, B., Fricker, H. A., Holschuh, N., Gardner, A. S., Adusumilli, S., Brunt, K. M., Csathó, B., Harbeck, K., Huth, A., Neumann, T., Nilsson, J., and Siegfried, M. R.: Land ice height-retrieval algorithm for NASA's ICESat-2 photon-counting laser altimeter, Remote Sens. Environ., 233, 111352, https://doi.org/10.1016/j.rse.2019.111352, 2019. a
Smith, B., Adusumilli, S., Csathó, B. M., Felikson, D., Fricker, H. A., Gardner, A., Holschuh, N., Lee, J., Nilsson, J., Paolo, F. S., Siegfried, M. R., Sutterley, T., and the ICESat-2 Science Team: ATLAS/ICESat-2 L3A Land Ice Height, Version 5, [September 2018 to August 2021. 65° S to 88° S], Boulder, Colorado USA, NASA National Snow and Ice Data Center Distributed Active Archive Center [data set], https://doi.org/10.5067/ATLAS/ATL06.005, 2021. a
Swinski, J. P., Shean, D., and Sutterley, T.: ICESat2-SlideRule/sliderule-icesat2: v1.4.3, Zenodo [code], https://doi.org/10.5281/zenodo.6600555, 2022. a
Thomas, R. H.: The dynamics of the Brunt Ice Shelf, Coats Land, Antarctica, vol. 79, British Antarctic Survey, ISBN: 0856650196, 1973. a, b, c, d, e, f, g, h, i, j
U.S. National Ice Center: Iceberg A-81 Calved from the Brunt Ice Shelf in the Weddell Sea, https://usicecenter.gov/PressRelease/Iceberga81 (last access: 1 March 2023), 2023. a, b, c
U.S. National Ice Center: Iceberg A-83 has Calved from the Brunt Ice Shelf, https://usicecenter.gov/PressRelease/IcebergA83 (last access: 6 August 2024), 2024. a, b, c
Walker, C. C. and Gardner, A. S.: Evolution of ice shelf rifts: Implications for formation mechanics and morphological controls, Earth Planet. Sc. Lett., 526, 115764, https://doi.org/10.1016/j.epsl.2019.115764, 2019. a, b
Walker, C. C., Bassis, J. N., Fricker, H. A., and Czerwinski, R. J.: Structural and environmental controls on Antarctic ice shelf rift propagation inferred from satellite monitoring, J. Geophys. Res.-Earth, 118, 2354–2364, https://doi.org/10.1002/2013JF002742, 2013. a, b, c
Walker, C. C., Bassis, J. N., Fricker, H. A., and Czerwinski, R. J.: Observations of interannual and spatial variability in rift propagation in the Amery Ice Shelf, Antarctica, 2002–14, J. Glaciol., 61, 243–252, https://doi.org/10.3189/2015JoG14J151, 2015. a
Walker, C. C., Becker, M. K., and Fricker, H. A.: A High Resolution, Three-Dimensional View of the D-28 Calving Event From Amery Ice Shelf With ICESat-2 and Satellite Imagery, Geophys. Res. Lett., 48, e2020GL091200, https://doi.org/10.1029/2020GL091200, 2021. a, b, c
Wang, S., Alexander, P., Wu, Q., Tedesco, M., and Shu, S.: Characterization of ice shelf fracture features using ICESat-2 – A case study over the Amery Ice Shelf, Remote Sens. Environ., 255, 112266, https://doi.org/10.1016/j.rse.2020.112266, 2021. a, b
Wang, S., Liu, H., Jezek, K., Alley, R. B., Wang, L., Alexander, P., and Huang, Y.: Controls on Larsen C Ice Shelf Retreat From a 60-Year Satellite Data Record, J. Geophys. Res.-Earth, 127, e2021JF006346, https://doi.org/10.1029/2021JF006346, 2022. a
Wild, C. T., Alley, K. E., Muto, A., Truffer, M., Scambos, T. A., and Pettit, E. C.: Weakening of the pinning point buttressing Thwaites Glacier, West Antarctica, The Cryosphere, 16, 397–417, https://doi.org/10.5194/tc-16-397-2022, 2022. a
Wilner, J. A., Morlighem, M., and Cheng, G.: Evaluation of four calving laws for Antarctic ice shelves, The Cryosphere, 17, 4889–4901, https://doi.org/10.5194/tc-17-4889-2023, 2023. a
Zwally, H. J., Giovinetto, M. B., Li, J., Cornejo, H. G., Beckley, M. A., Brenner, A. C., Saba, J. L., and Yi, D.: Mass changes of the Greenland and Antarctic ice sheets and shelves and contributions to sea-level rise: 1992–2002, J. Glaciol., 51, 509–527, https://doi.org/10.3189/172756505781829007, 2005. a