the Creative Commons Attribution 4.0 License.
the Creative Commons Attribution 4.0 License.
 | 02 Oct 2025
The thermal state of permafrost under climate change on the Qinghai–Tibet Plateau (1980–2022): a case study of the West Kunlun
Jianting Zhao
Zhe Sun
Guojie Hu
Minxuan Xiao
Guangyue Liu
Qiangqiang Pang
Erji Du
Zhibin Li
Xiaodong Wu
Yao Xiao
Lingxiao Wang
Wenxin Zhang
The thermal regime is a key indicator of permafrost evolution and thaw trajectories in response to climate change but remains poorly represented in global models. In this study, we applied the Moving-Grid Permafrost Model (MGPM), an efficient numerical model, to simulate the permafrost thermal regime in West Kunlun (WKL), a 55 669 km2 region on the remote northwestern Qinghai–Tibet Plateau characterized by extreme cold arid conditions. To improve computational efficiency, we used clustering methods and parallel computing. The model was forced with remote-sensing-based land surface temperature (LST) data from 1980 onward (1 km × 1 km spatial, monthly temporal resolution), reconstructed using machine learning techniques that integrated field observations, satellite imagery, and reanalysis products. The MGPM demonstrated high stability throughout the simulation period, achieving high accuracy (±0.25 °C for ground temperature and ±0.25 m for active-layer thickness), outperforming previously reported results. From 1980 to 2022, LST increased by an average of 0.40 °C per decade. The responses of the permafrost regime to climate warming were closely related to the original thermal conditions shaped by historical climatic evolution. These responses exhibited a distinct altitude-dependent spatial variation and differed according to soil stratigraphic types. Despite ongoing thermal shifts, the spatial extent of permafrost in WKL has remained relatively stable over the last 43 years, reflecting the delayed response of deep permafrost to surface warming. These results offer valuable insights into permafrost thaw trajectories and support improved projections of future permafrost degradation in data-scarce, high-altitude regions.
- Article
(13683 KB) - Full-text XML
- BibTeX
- EndNote


Permafrost covers approximately 46 % of the Qinghai–Tibet Plateau (QTP), making it the largest high-elevation permafrost region in the mid- to high-latitudes, with an average elevation exceeding 4000 m a.s.l. (Zou et al., 2017; Zhao et al., 2024). Ground temperature observations show clear evidence that permafrost warming has already led to thaw subsidence and widespread near-surface degradation across the QTP (Zhao et al., 2020, 2024; Biskaborn et al., 2019; Wang et al., 2023; Smith et al., 2022). These changes may trigger climate feedbacks at both regional and global scales, with significant consequences for ecosystems, infrastructure, and local communities (Schuur et al., 2015; Walvoord and Kurylyk, 2016; Lafrenière and Lamoureux, 2019; Cheng et al., 2019; O'Neill et al., 2020; Jin et al., 2021; Miner et al., 2021; Hjort et al., 2022). Therefore, accurately assessing and understanding current permafrost dynamics in response to climate variability is critical for evaluating, predicting, and mitigating the impacts of climate change (Smith et al., 2022; IPCC, 2019, 2021).
Over the past few decades, numerous field investigations have been carried out, and a monitoring network has been established on the QTP to observe changes in permafrost thermal conditions (Zhao et al., 2010a, b, 2017, 2019a, 2021a). Many of these monitoring sites include borehole sensor arrays that measure ground profile temperatures at depths of 50 m or more (Zhao and Sheng, 2019b; Zhao et al., 2021a). However, these observations are spatially limited, with most sites being concentrated in accessible areas such as along the Qinghai–Tibet Highway (QTH) and the Qinghai–Tibet Railway (QTR), leaving vast, remote regions of the QTP largely unmonitored. To address this gap, detailed process-based models have been widely developed to simulate hydrothermal processes of permafrost areas associated with rapid changes in climate and environment. Despite these efforts, most models still struggle to accurately represent the thermal state of permafrost, leading to huge errors in projections of permafrost change (Zhao et al., 2024). These inaccuracies are largely due to simplified representations of soil properties and thermal dynamics in deep permafrost, driven by limited subsurface data, particularly insufficient long-term in situ ground temperature monitoring (Sun et al., 2019; Zhao et al., 2020, 2024). Moreover, most models focus primarily on near-surface hydrothermal processes, typically constrained to the active layer within the upper 2–3 m. This limitation is particularly pronounced in large-scale regional modeling at a high spatial resolution, where computational costs make it challenging to apply numerical models across broad areas and deeper layers (Smith et al., 2022). As a result, simulations with only shallow soil layers may inadequately capture thermal dynamics in regions with thicker and colder permafrost, whereas deeper simulations more effectively represent the long-term thermal response to climate warming (Sun et al., 2019; Zhao et al., 2020). In addition, uncertainties in the model forcing datasets further contribute to biases in simulating hydrothermal processes in frozen ground (Yi et al., 2018; Guo et al., 2017; Hu et al., 2023a). Previous studies have shown that soil temperature projections based on outputs from Earth system models (ESMs) participating in the Coupled Model Intercomparison Project Phase 5 and 6 (CMIP5, CMIP6) tend to overestimate future permafrost degradation (Koven et al., 2013; Lawrence et al., 2012; Slater and Lawrence, 2013; Burke et al., 2020). When air temperature and precipitation inputs into land surface models (LSMs) are improved, the estimated rate of permafrost degradation decreases by approximately 29 % (Lawrence et al., 2012), underscoring the importance of more accurate and high-resolution forcing datasets.
To address deficiencies in existing models, the Moving-Grid Permafrost Model (MGPM; Sun et al., 2019, 2022) was developed to enhance the simulation of subsurface thermal dynamics in permafrost regions. Unlike conventional LSMs that use shallow or fixed soil layers, MGPM adopts a flexible vertical discretization scheme that better captures deep-soil stratification and variability in ground ice content. It improves the simulation of freeze–thaw processes by applying the apparent heat capacity method, which more realistically represents gradual phase transitions, in line with field observations on the QTP. MGPM also explicitly incorporates geothermal heat flux as the lower boundary condition – an important factor often neglected in many LSMs, thereby improving the accuracy of long-term ground temperature simulations. In addition, the model includes a thaw settlement module, which is rarely represented in other permafrost models. This module simulates surface subsidence and landscape change driven by the melting of excess ground ice, processes that are critical to the evolution of permafrost terrain and the development of thermokarst features. These landscape changes have the potential to mobilize large quantities of previously frozen organic carbon from cold, ice-rich lowlands, thus intensifying the global permafrost carbon–climate feedback (Westermann et al., 2016; Nitzbon et al., 2020). Together, these advancements allow the MGPM to more effectively simulate both the attenuation and time lag of thermal signals in deep permafrost, making it well-suited for assessing permafrost thermal regimes under a changing climate. In our previous work, the MGPM was successfully applied to simulate heat transfer processes at multiple borehole sites and regions along the QTH. The model demonstrated strong performance in reproducing both the seasonal dynamics of active-layer thawing and refreezing, as well as long-term ground temperature evolution, when compared with multi-depth soil temperature records and active-layer thickness measurements (Sun et al., 2019, 2022, 2023; Zhao et al., 2022).
The accuracy of permafrost simulation results is closely tied to the spatial resolution and quality of input datasets. Several studies have employed gridded datasets derived from in situ meteorological observations, climate outputs from general circulation models (GCMs) or ESMs, as well as reanalysis and assimilated data, to simulate soil thermal dynamics over large spatial scales across the circum-Arctic permafrost region (Jafarov et al., 2012; Westermann et al., 2013; Zhang et al., 2014; Fiddes et al., 2015). However, substantial uncertainties remain in these climate forcing datasets, especially over the QTP, due to harsh climatic conditions, complex terrain, and sparse observational coverage. These limitations make it difficult to reliably use such datasets to drive the MGPM for accurate simulation of permafrost thermal regimes on the QTP (Hu et al., 2019; Yang et al., 2020). In addition, gridded outputs from ESMs are typically available at coarse spatial resolutions, often half-degree latitude and/or longitude or coarser, which are insufficient to capture the high spatial variability of ground thermal conditions in the heterogeneous permafrost of the QTP (Zhang et al., 2013; Hu et al., 2023a). In contrast, satellite remote sensing offers a powerful tool for regional detection and monitoring of land surface characteristics that influence permafrost thermal dynamics (Langer et al., 2013). High-resolution, satellite-driven numerical modeling provides a promising approach to assess permafrost thermal states with improved spatial and temporal fidelity (Westermann et al., 2015, 2017; Yi et al., 2018). This remote-sensing-based modeling approach has been successfully applied in various permafrost regions, including Alaska (Yi et al., 2018), Siberia (Langer et al., 2013; Westermann et al., 2017) and Canada (Zhang et al., 2013), demonstrating its potential for regional-scale, high-resolution permafrost monitoring. On the QTP, Zou et al. (2017) and Cao et al. (2023) used MODIS land surface temperature (LST) products as inputs into an equilibrium model to map permafrost distribution. Similarly, in our previous work, Zhao et al. (2022) evaluated and validated the performance of the MGPM at a 1 km spatial resolution using time series MODIS LST data for a localized permafrost region (less than 280 km2) on the QTP.
In this study, we aim to enhance and extend the MGPM to enable accurate, large-scale mapping of permafrost thermal regimes and their spatiotemporal changes under recent climate warming. We developed an integrated framework combining numerical modeling, field observations, remote sensing, and reanalysis data to simulate permafrost dynamics at a 1 km × 1 km resolution. Soil properties were parameterized using a geomorphological map and field measurements. To address the computational challenges of large-scale thermal modeling, we employed a clustering approach to group climate and soil thermal types and used parallel computing to simulate tens of thousands of grid cells efficiently. The MGPM scheme was applied over a 43-year period (1980–2022) across West Kunlun (WKL) in the northwestern QTP, where ground temperature and active-layer thickness observations were used for validation. Finally, we analyzed the spatiotemporal patterns of the thermal regime across diverse environmental settings.
The West Kunlun (WKL) permafrost survey area (34.5–36.0° N, 78.8–81.4° E) is located in the northwestern part of the QTP, with elevations ranging from 4200 to 6200 m above sea level (a.s.l.) (see Fig. 1a). It covers an area of approximately 4.37 × 10³ km2 (Chen et al., 2015; Zhao and Sheng, 2019). This region experiences a cold, arid continental climate, as the Pamir–Tian Shan–Kunlun Mountain system acts as an orographic barrier, restricting moisture transport from both the westerlies and monsoons (Cannon et al., 2016; Baldwin and Vecchi, 2016). Meteorological observations from the Tianshuihai (TSH) automatic weather station (AWS) (36.0° N, 81.4° E; 5019 m a.s.l.) from 2015 to 2018 show a mean annual temperature of approximately −6 °C and mean annual precipitation of about 103.5 mm (Zhao et al., 2021a). Over 78 % of this precipitation (∼ 81 mm) falls between May and September, and summer temperatures rise above 0 °C, averaging around 5.8 °C (Zhao et al., 2021a). Glacial and periglacial landforms, such as block fields, stripes, and stone rings, are well developed throughout the region (Wu et al., 2018). Vegetation is sparse, dominated by alpine desert, while much of the land surface is barren due to persistent wind erosion (Li et al., 2012; Wang et al., 2016; Zhao et al., 2019). The topsoil is generally dry and loose, composed mainly of Quaternary eolian deposits (57.68 %; see Table 1), consisting of coarse-grained materials such as gravel and sand (see Fig. 1b). Permafrost is well-developed in the WKL region, comprising both discontinuous and continuous types, and covers approximately 93 % of the total area (Li et al., 2012; Zhao et al., 2019). Continuous ground temperature monitoring at the TSH comprehensive observatory (ZK015; 59 m in depth; 35.36° N, 79.54° E; see Fig. 1b) has revealed notable permafrost warming. Between 2010 and 2017, temperatures at a depth of 15 m increased at a rate of 0.11 °C per decade (Zhao et al., 2021a; Hu et al., 2023b).
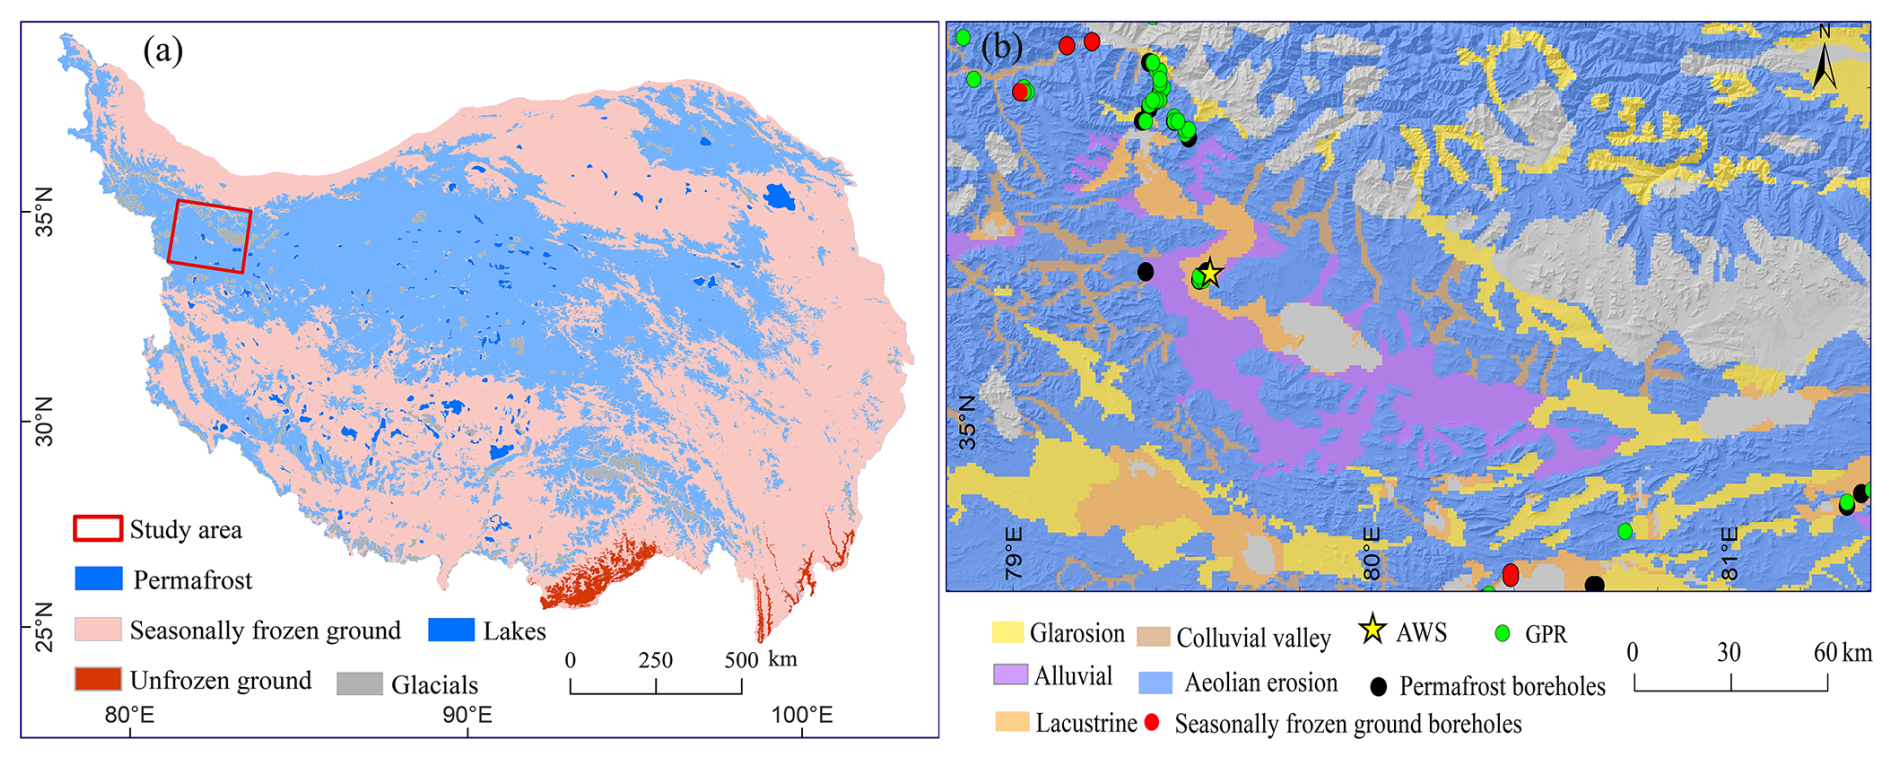
Figure 1(a) Geographical location of the West Kunlun (WKL) permafrost survey area, overlaid on the frozen-ground type distribution map from Zou et al. (2017). (b) The WKL survey area includes five stratigraphic classes used in ground thermal modeling (see Sect. 3.2.2), along with borehole sites containing in situ observations (see Sect. 3.3) used for model calibration and validation. The yellow star marks the location of an automatic weather station (AWS), red dots represent monitoring boreholes in seasonally frozen ground, black dots indicate boreholes located in permafrost, and green dots denote thaw depth measurements derived from ground-penetrating-radar (GPR) surveys. Glaciers and lakes are masked in gray.
3.1 The Moving-Grid Permafrost Model
The Move-Grid Permafrost Model (MGPM) is a numerical framework that combines a moving-grid (Lagrangian) scheme with the heat conduction equation to dynamically track freeze–thaw fronts and to adjust the vertical grid accordingly (Sun et al., 2019, 2022). The MGPM integrates key processes, including unfrozen-water content, variable thermal properties, geothermal heat flux, and excess ice within an efficient moving-grid framework, enabling improved simulation of deep-soil heat transfer not typically represented in most land surface models.
The MGPM includes both a heat conduction module and a settlement module, which are coupled to simulate time series of ground temperature with the land surface as the upper boundary. Its heat conduction physics is comparable to that of widely used models such as GIPL2.0 (Nicolsky et al., 2017) and CryoGrid2.0 (Westermann et al., 2013). The change in ground temperature and internal energy is governed by Fourier's law of heat conduction, accounting for latent heat release or absorption due to phase change within an observed freezing range of −0.3 to 0 °C. Water and vapor movement are not included; thus, soil water content changes only through freezing and thawing. Soil temperature dynamics are solved numerically using the one-dimensional nonlinear heat conduction equation and the finite-difference method (Schiesser, 1991; Westermann et al., 2013; Sun et al., 2019).
3.2 Model operation
3.2.1 Model forcing
Similarly to our previous study (Zhao et al., 2022), a time series of remotely sensed LST was used to drive the MGPM. Specifically, we used a modified MODIS LST product developed by Zou et al. (2014, 2017), which partially accounts for surface influences such as snow cover, vegetation, and cloud presence through a cloud-gap filling algorithm and calibration with three AWS observations from representative permafrost regions with distinct surface types – alpine steppe, alpine meadow, and alpine desert – in the central QTP. Validation showed strong agreement between the modeled and observed LST, with R2 values ranging from 0.91 to 0.93 and RMSE values around 3 °C. Further evaluation at the TSH AWS site in the WKL region during the 2016–2018 observation period confirmed the product's reliability, with an R2 greater than 0.90 and an RMSE of 2.09 °C, demonstrating its effectiveness in capturing spatial variations in LST across the QTP.
In this study, we further refined the Zou et al. (2017) product to reconstruct historical LST data prior to 2003, extending the dataset back to 1980 using machine learning approaches. Three statistical models were employed: least squares linear regression (LR; Xing et al., 2023), random forest regression (RFR; Breiman, 2001), and multiple linear regression (MLR; Jiao et al., 2023). The LR model assumes a long-term linear relationship between air temperature (AT) and LST. For the RFR and MLR models, eight auxiliary variables known to influence LST were incorporated: AT, precipitation (Pre), skin temperature (ST), soil temperature in the top 0–10 cm (ST_1), fractional cloud cover (CFC), surface net radiation budget (SRB), leaf area index (LAI), and digital elevation model (DEM). Detailed descriptions of these variables, including their spatial resolution and data sources, are provided in Table 1. The main steps for reconstructing monthly LST from 1980 to 2022 are as follows.
(1) Pre-processing
All input variables were resampled to a spatial resolution of 1 km × 1 km using the nearest-neighbor method to match the resolution of the LST_Zou dataset. Monthly averages were then computed from the available data, which varied in terms of temporal resolution across sources. Missing values were filled through spatial interpolation using nearby data points. Notably, the latest downscaled AT and Pre data provided by Qin et al. (2022) extend only through 2019. To fill the data gap for 2020–2022, statistical downscaling was applied to AT and Pre from the CN05.1 dataset, following the method described by Su et al. (2016). CN05.1 is a gridded dataset developed by the China Meteorological Administration (CMA), offering daily meteorological variables at a spatial resolution of 0.25°. For more details, refer to Wu and Gao (2013). Additionally, since the earliest available satellite-based LAI data begin in 1982, values for 1980–1981 were filled by assuming no change and using the average LAI from the period 1982–1986.
(2) Model training and test
Data from 2003 to 2019 were used for model training. In the LR model, AT was used as the sole input variable, with LST_Zou as the target output. For the MLR and RFR models, eight auxiliary variables (see Table 1) were used as inputs, with LST_Zou again serving as the output variable. The dataset was randomly partitioned into 10 subsets: 10 % of the samples were reserved for validation, and the remaining 90 % were used for training. This process was repeated 2000 times to ensure robustness. Model performance was evaluated using four metrics: R2, RMSE, MAE, and bias (Zhao et al., 2022). Details are provided in Fig. 2.
Table 1Summary of the data sources used for the linear regression model (LR), random forest regression model (MLR), and multiple linear regression model (RFR) to generate monthly land surface temperature from 1980 to 2022.
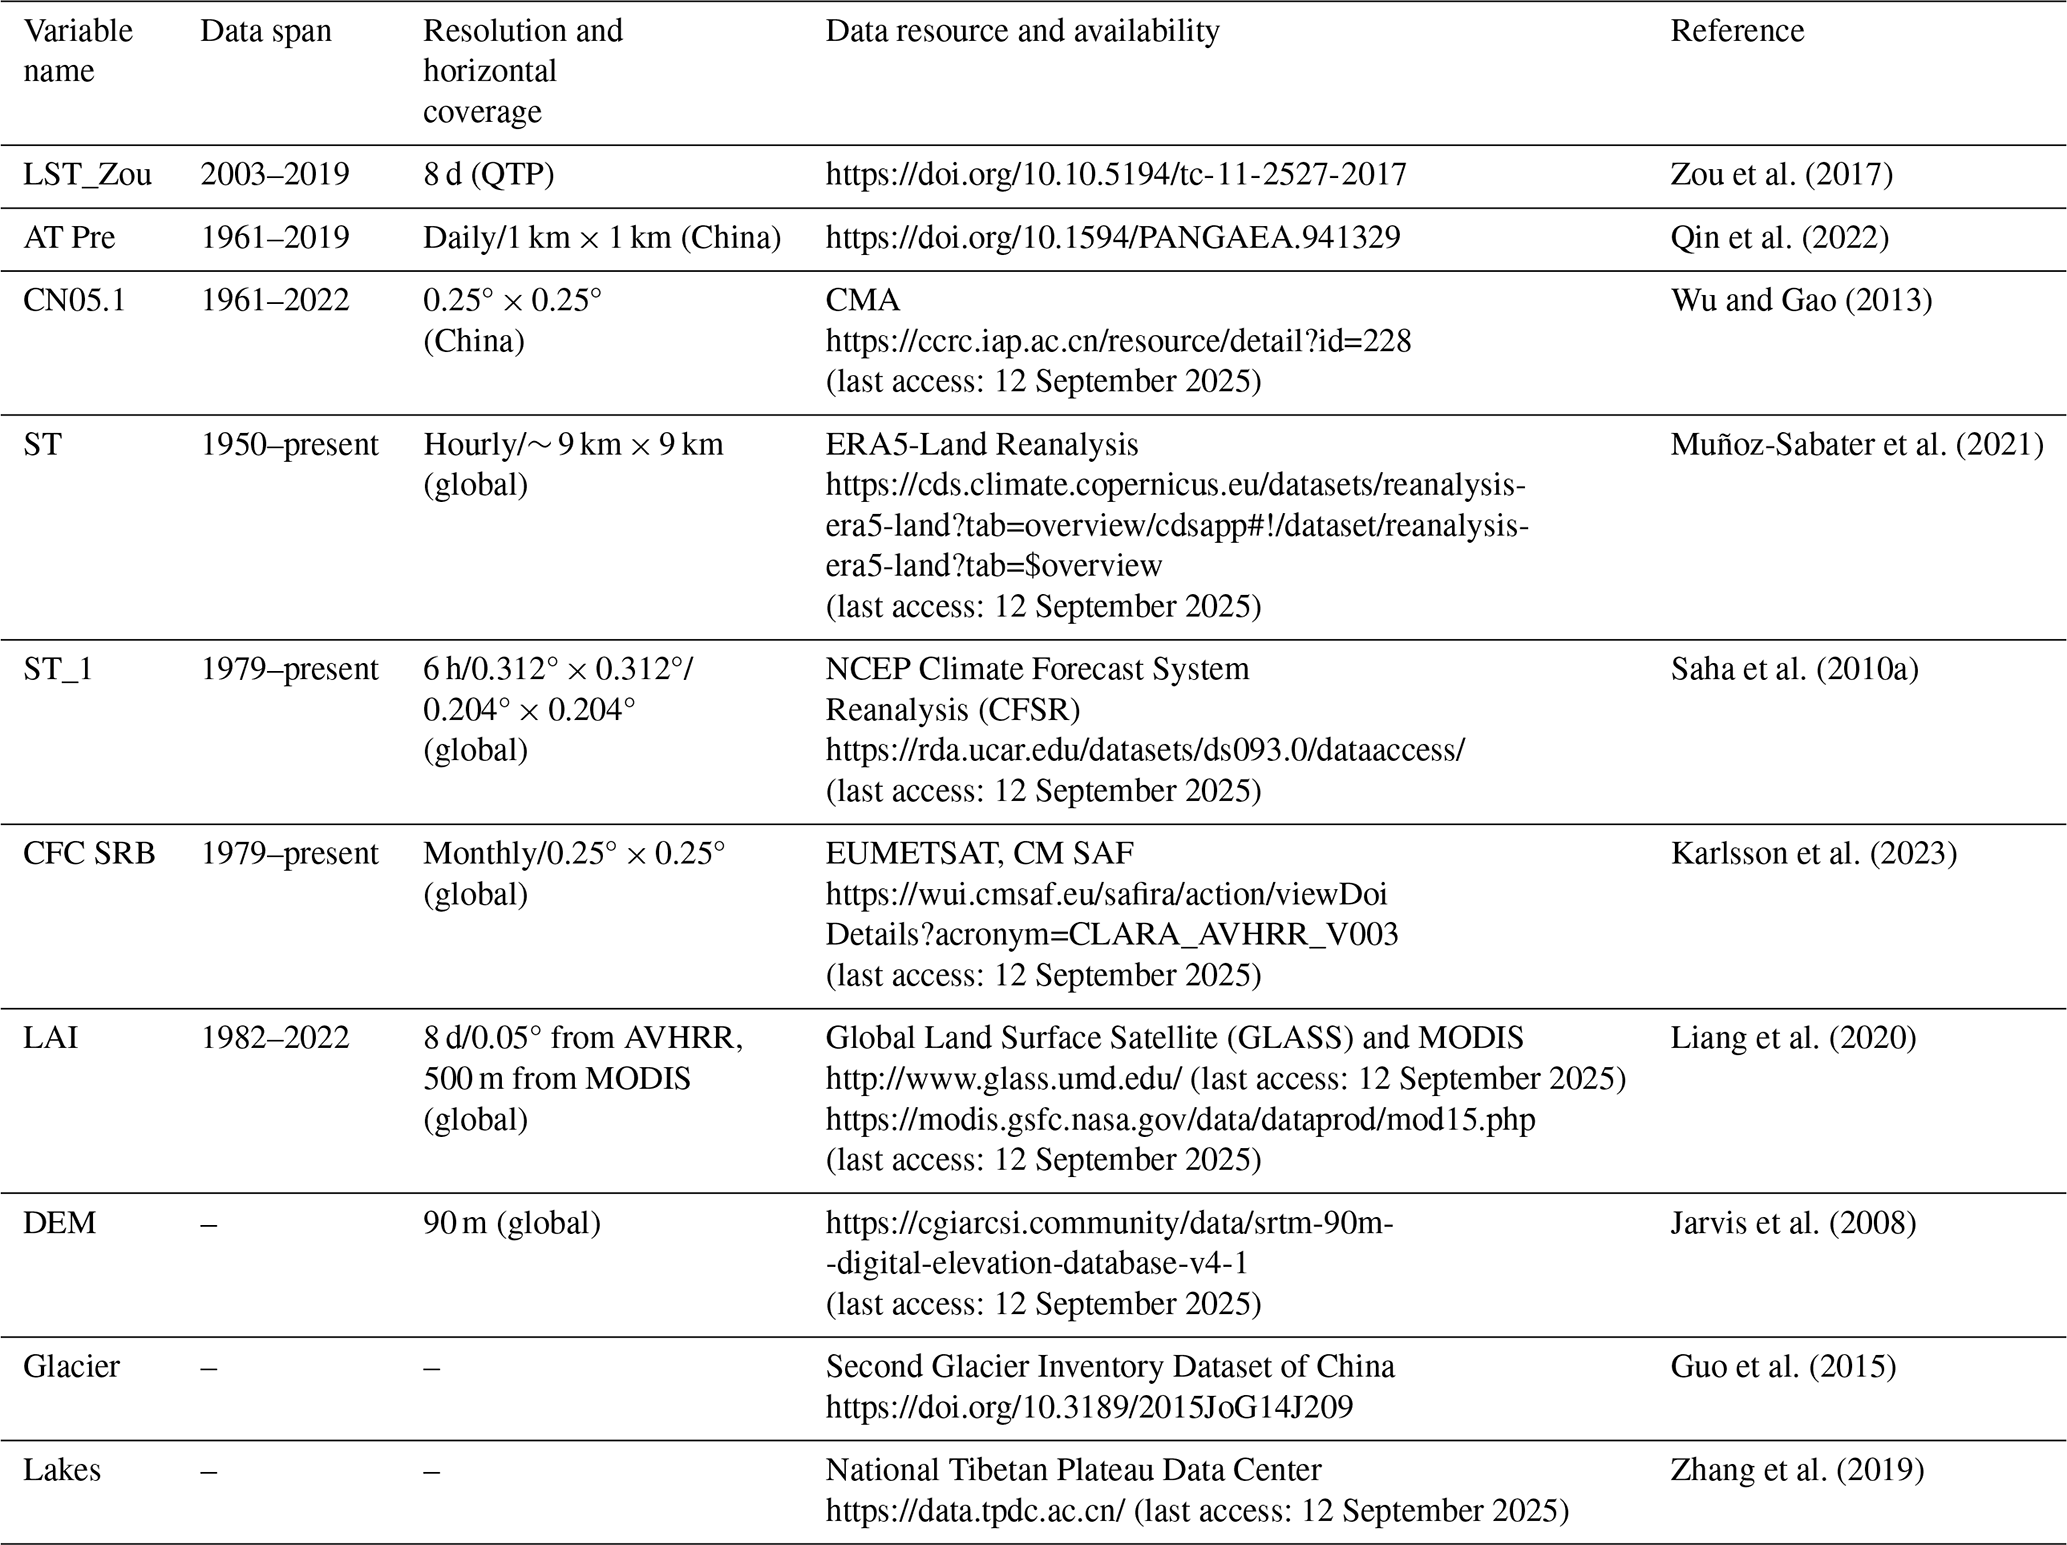
Note that LST_Zou is an enhanced LST product for the QTP permafrost zone, derived from in situ observations and MODIS satellite data. AT refers to air temperature, Pre refers to precipitation, ST refers to skin temperature, ST_1 refers to soil temperature at the top layer (0–10 cm), CFC refers to fractional cloud cover, SRB refers to surface net radiation budget, LAI refers to leaf area index, and DEM refers to digital elevation model data.
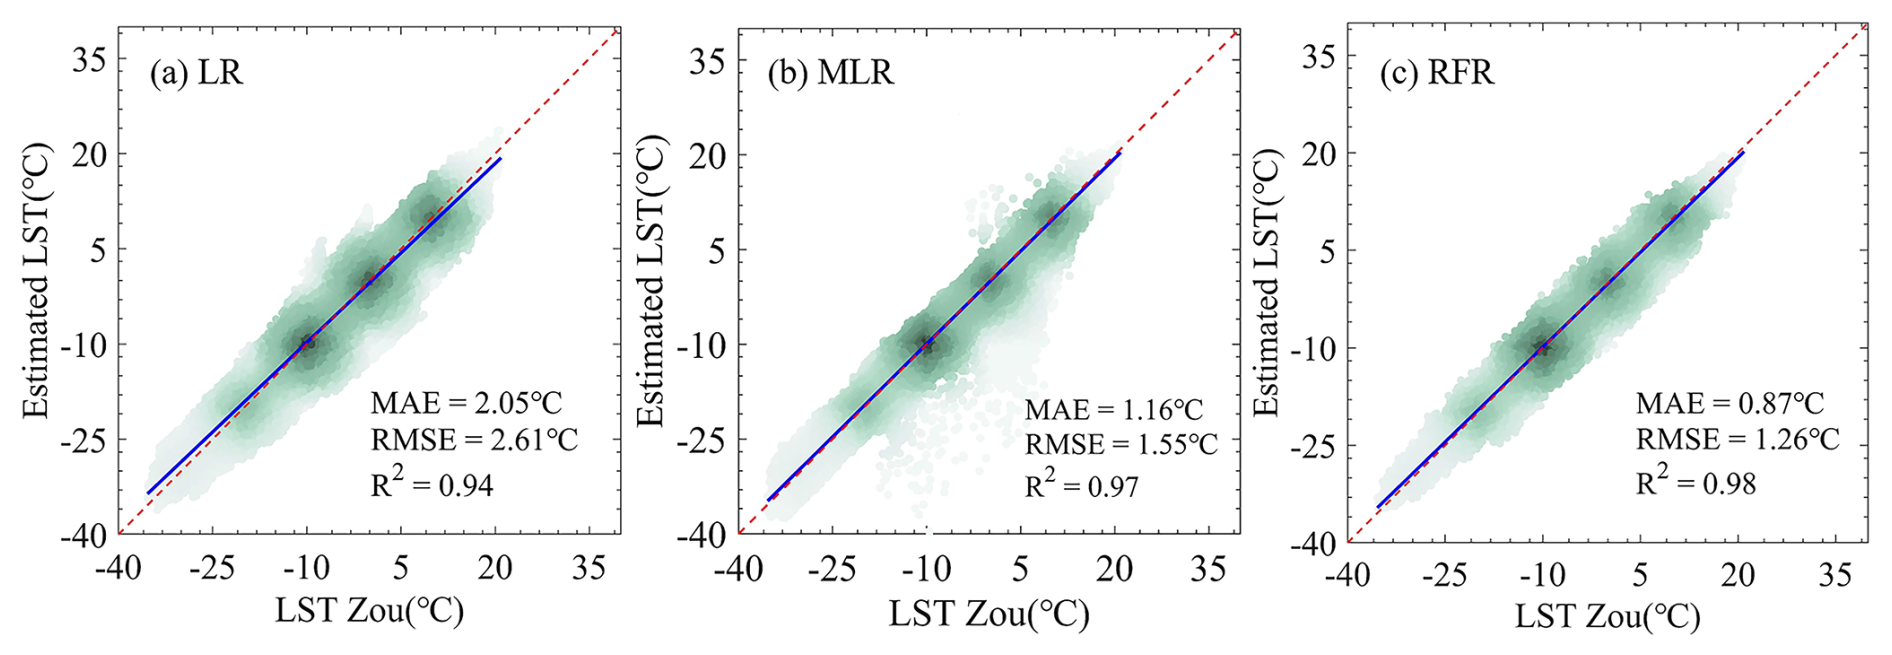
Figure 2Scatterplots of estimated monthly LST using the (a) LR (linear regression model), (b) MLR (multiple linear regression model), and (c) RFR (random forest regression model) during the validation stage (10-fold cross-validation; see details in Sect. 3.2.1). The best linear fits are shown in blue, while the 1:1 line is represented in red. Error metrics are provided in the bottom-right corner of each graph.
(3) Dataset generation
The monthly values of the eight auxiliary variables from 1980 to 2022 (see Table 1) were used as inputs into the trained LR, MLR, and RFR models from step (2). This enabled the generation of a continuous monthly LST time series starting from 1980.
3.2.2 Ground thermal properties
In our modeling framework, we incorporated detailed thermophysical characterization of the subsurface based on measurements from 15 boreholes with observations across the WKL permafrost survey area, with depths ranging from 15 to 59 m. Core samples, field observations, and borehole logs (Li et al., 2012; Zhao and Sheng, 2019) indicate that ground ice content in the WKL region varies between 5 % and 50 %, depending on the type of Quaternary sediment. Higher ice contents are typically found in fine-grained glaciofluvial and lacustrine sediments due to enhanced segregation ice formation, while coarse-grained alluvial and colluvial deposits generally show lower ice content. Vertically, ice-rich layers are consistently observed near the upper boundary of permafrost, typically between 2 and 3 m depth. Ice content tends to increase slightly between 3 and 10 m and remains relatively stable below 10 m (Zhao et al., 2010a; Zhao and Sheng, 2019; Zou et al., 2024).
Depth-specific thermophysical parameters (thermal conductivity and heat capacity) for each stratigraphic class were estimated by calibrating modeled permafrost temperature and thaw depth against borehole observations. Calibration was performed using a numerical inverse modeling approach that minimizes the difference between simulated and observed ground temperatures by adjusting the thermal properties (Marchenko et al., 2024; Nicolsky et al., 2017). This method is detailed in Nicolsky et al. (2007, 2017), with examples of soil thermal property optimization provided in Zhao et al. (2022) and Marchenko et al. (2024).
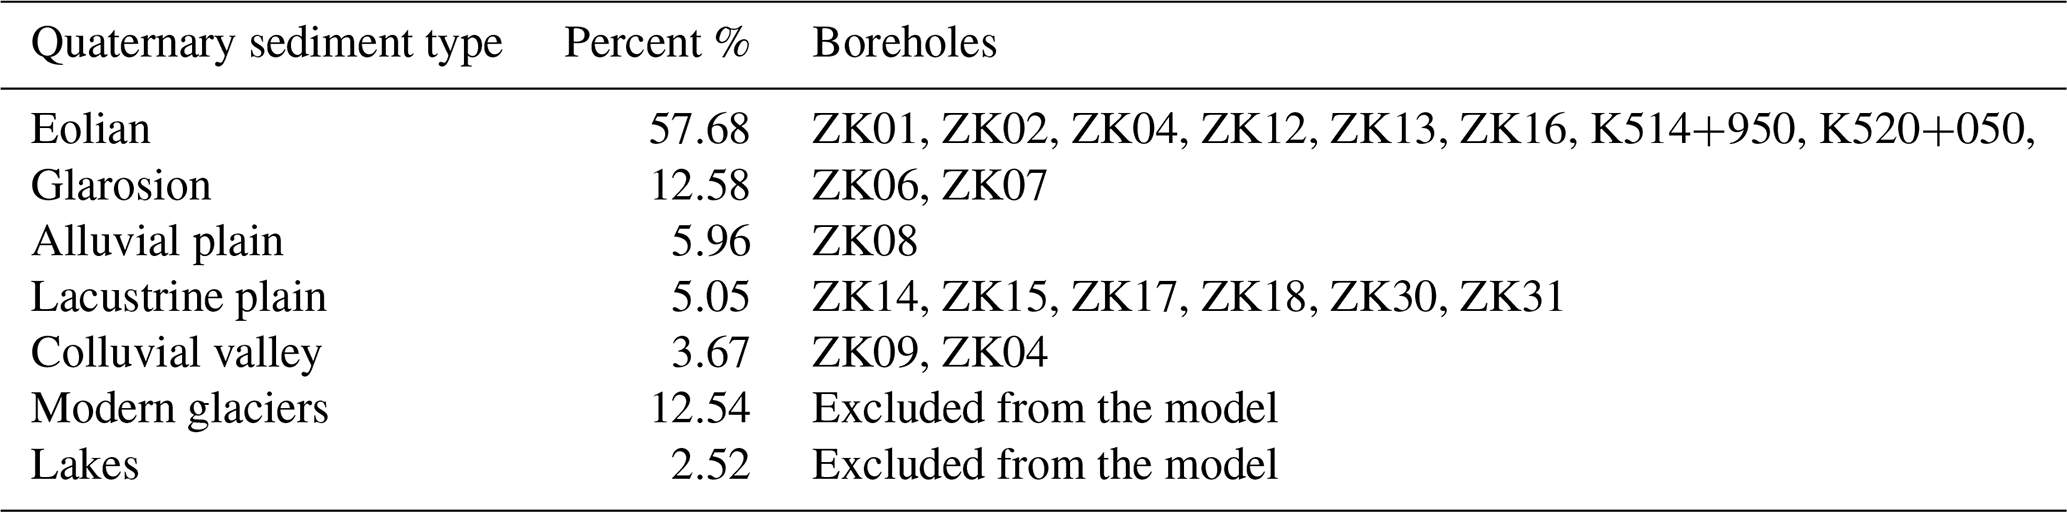
Site-level stratigraphic and thermophysical data were spatially upscaled using vector-based geomorphological classification maps of western China at a 1:1 000 000 scale (Zhou and Cheng, 2019). Five common stratigraphic classes in the WKL region – i.e., glarosional, alluvial plain, eolian, colluvial valley, and lacustrine deposits – were identified. A summary of major Quaternary deposits is provided in Table 2, and their spatial distribution (Fig. 1b) is based on Zhou et al. (2007), gridded at 1 km × 1 km resolution to match our simulation scale.
Table 2Major geological classes and their associated borehole measurement sites. The second column indicates the percentage of the study area covered by each Quaternary sediment type, while the third column lists the corresponding representative boreholes.
3.2.3 Model computational domain, boundary condition, and initialization
The model resolution is determined by the input datasets. The computational domain covers the entire 55 669 km2 WKL permafrost survey area, with a spatial resolution of 1 km × 1 km and a monthly temporal resolution. Following Zhao et al. (2022), each grid cell extends 100 m vertically, divided into 282 layers, with thicknesses ranging from 0.05 m at the top 4 m to 0.5 m at greater depths.
For each modeling grid cell, the ground thermal regime is simulated using site-specific stratigraphy and a time series of LST as the upper boundary condition. At the lower boundary (100 m depth), a Neumann condition is applied to represent geothermal heat flux, set at a constant value of 0.0724 W m−2. This value is derived from measurements obtained from a 700 m deep borehole near the WKL permafrost region (Hu et al., 2000). To estimate a realistic initial soil temperature profile, a model spin-up is conducted using climate forcing from the early simulation years. Steady-state conditions are considered to be achieved when the temperature difference at all soil layers between consecutive annual cycles is less than 0.0001 °C. This equilibrium profile is then adopted as the initial condition for the transient simulation.
3.2.4 Model implementation
After excluding lake and glacier-covered areas, simulations were conducted for 47 284 grid cells. To improve computational efficiency, a spatial clustering approach was adopted following Cable et al. (2016), grouping grid cells based on similarities in climate forcing and soil thermal properties. Instead of simulating each grid cell individually, clusters were used as representative units.
To characterize the upper boundary LST forcing, a harmonic function was used to fit the time series (Sun et al., 2019). The fitted coefficients (initial annual mean temperature, trend, annual amplitude, and phase angle) were used to group climate forcing into distinct clusters. These were then combined with five soil thermal property classes (see Table 1), resulting in 13 248 unique input combinations for the WKL region. This approach reduced the number of simulations to just 28.02 % of the total grid cells, remarkably lowering computational demand. Similar cluster-based methods have been successfully applied in Canada (Zhang et al., 2013, 2014), Alaska (Cable et al., 2016), and the Swiss Alps (Fiddes et al., 2015) permafrost zones.
3.2.5 Simulation result diagnoses
To assess long-term changes in the permafrost thermal regime over the last 43 years, key diagnostics were extracted from the modeled vertical soil temperature profiles down to 50 m. These include the mean annual ground temperature at 15 m depth (MAGT15m), which corresponds to the depth of zero annual amplitude (ZAA) on the QTP (Jin et al., 2008; Zhao et al., 2010b), and the temperature at the top of permafrost (TTOP). Additional depths were also evaluated against available borehole observations.
The active-layer thickness (ALT) was estimated using linear interpolation to locate the maximum depth of the 0 °C isotherm during the annual thawing period (Liu et al., 2020). Following Zhao et al. (2022) and Wu et al. (2018), a grid cell was classified as permafrost if the maximum annual ground temperature at any depth within the upper 50 m remained at or below 0 °C for 2 consecutive years. Cells where the minimum annual ground temperature dropped to ≤ 0 °C within 50 m depth during the same period were identified as seasonally frozen ground. Cells not meeting either condition were classified as unfrozen ground.
3.3 Field investigation and borehole monitoring datasets
Extensive scientific research and long-term monitoring efforts have been conducted in the WKL region over the last 2 decades. A comprehensive permafrost monitoring system has been established by the Cryosphere Research Station of the Chinese Academy of Sciences (CRS-CAS) (Zhao and Sheng, 2015, 2019; Zhao et al., 2021a). These in situ datasets greatly enhance our understanding of permafrost dynamics and provide essential support for model development and validation (Li et al., 2012; Zhao and Sheng, 2017; Zhao et al., 2019, 2021a). Below, we summarize the CRS-CAS datasets used in this study.
3.3.1 The Tianshuihai (TSH) comprehensive observatory
The TSH comprehensive observatory is located in the central–northern part of the WKL permafrost survey area (see Fig. 1a). The Quaternary deposits in this region are primarily lacustrine, consisting of fine-grained sediment from an ancient lake that dried up during the Lower Pleistocene (Li and Li, 1991). Since October 2015, an AWS at TSH has continuously recorded key meteorological variables, including hourly air temperature at 2, 5, and 10 m heights; relative humidity; shortwave and longwave radiation (both upward and downward); wind speed; and precipitation. Additionally, ground temperatures have been recorded automatically since 2010 from a 59 m deep borehole (ZK015; 35.36° N, 79.54° E; see Fig. 1b) at depths of 3, 6, 10, and 20 m (Zhao et al., 2021a). LST at TSH is estimated using continuous radiation measurements (since October 2015) and by applying the Stefan–Boltzmann law (see Hu et al., 2024 for details), providing a robust reference for validating satellite-derived LST and ground thermal modeling (see Sect. 4.1.1).
3.3.2 Borehole in situ datasets
Beyond the TSH observatory, 27 boreholes have been drilled across the WKL region to monitor the ground thermal regime. These boreholes range in depth from 7.5 to 33 m and are distributed across various geomorphic units, soil types, and vegetation zones, covering elevations from 4200 to 5200 m a.s.l. (see Fig. 1b). Detailed descriptions are available in Zhao and Sheng (2019) and Li et al. (2012). A total of 15 of these boreholes are instrumented with thermistor sensors (accuracy ± 0.1 °C) placed at depths of 3, 6, 10, and 20 m (Zhao et al., 2021a), and manual ground temperature measurements have been conducted at 1- to 2-year intervals since 2010 during annual field investigations using a digital multimeter. In this study, data from these 15 boreholes were used for model calibration and validation. The remaining boreholes were used to support the spatial modeling of permafrost distribution, serving as reference points for identifying permafrost presence or absence.
3.3.3 Thaw depth measurement datasets
During field investigation in September 2010, when seasonal thaw depths reach their annual maximum, a ground-penetrating radar (GPR) was used to manually measure thaw depth at 45 sites, most of which were located near boreholes (see Fig. 1b). The methodology and results are comprehensively described in Zhao and Sheng (2019). After removing duplicate measurements within the same 1 km × 1 km grid cells, a total of 25 unique thaw depth measurements were retained for model validation.
3.4 Additional validation datasets
In addition to site-based observations (Sect. 3.3), we further evaluated model performance in simulating regional permafrost distribution by comparing it with four representative permafrost maps developed over different decades: (i) a 1980s permafrost map of the QTP at 1:3 000 000 scale, compiled by the Lanzhou Institute of Glaciology and Geocryology, CAS (Li and Cheng, 1996); (ii) a comprehensive 2000s map of glaciers, permafrost, and deserts in China at 1:4 000 000 scale, produced by the Cold and Arid Regions Environmental and Engineering Research Institute, CAS (Wang et al., 2006); (iii) a 2010 permafrost distribution map of the QTP with 1 km2 resolution (Cao et al., 2023); and (iv) a 2016 permafrost distribution map of the Tibetan Plateau with 1 km2 resolution (Zou et al., 2017).
4.1 Forcing dataset
4.1.1 Comparison to in situ data
We implemented and compared the three algorithms described in Sect. 3.2.1 to identify the optimal model for reconstructing monthly LST data from 1980 onward. The validation results are presented in Fig. 2. Most data points in the scatterplots cluster closely along the 1:1 line, indicating a strong positive correlation (R2 > 0.90) and good agreement between LST_Zou and the estimated LST values. The LR model produced a mean absolute error (MAE) of 2.05 °C and an RMSE of 2.61 °C. The MLR model showed moderate improvement, with lower errors (MAE = 1.16 °C, RMSE = 1.55 °C). However, the RFR model yielded the best performance, achieving the lowest error metrics (MAE = 0.87 °C, RMSE = 1.26 °C).
Figure 3 compares the mean annual cycle of LST estimates from the three statistical models (LR, MLR, and RFR) with ERA5 Land, LST_Zou, and in situ observations from the TSH AWS over the period 2016–2018. All datasets exhibit a similar seasonal cycle consistent with the in situ data. However, both LST_Zou and ERA5-Land LST exhibit a systematic cold bias, particularly during the summer months of July, August, and September. The LST values estimated by all three statistical models help reduce this bias to varying extents, with the RFR model performing best. Despite this improvement, a residual cold bias in LST_Zou remains apparent during the same period. Overall, the RFR model-generated LST time series closely matches in situ observations and demonstrates sufficient accuracy for use in subsequent ground thermal modeling. Therefore, the RFR-derived monthly LST was adopted as the input forcing in the following simulation analyses.
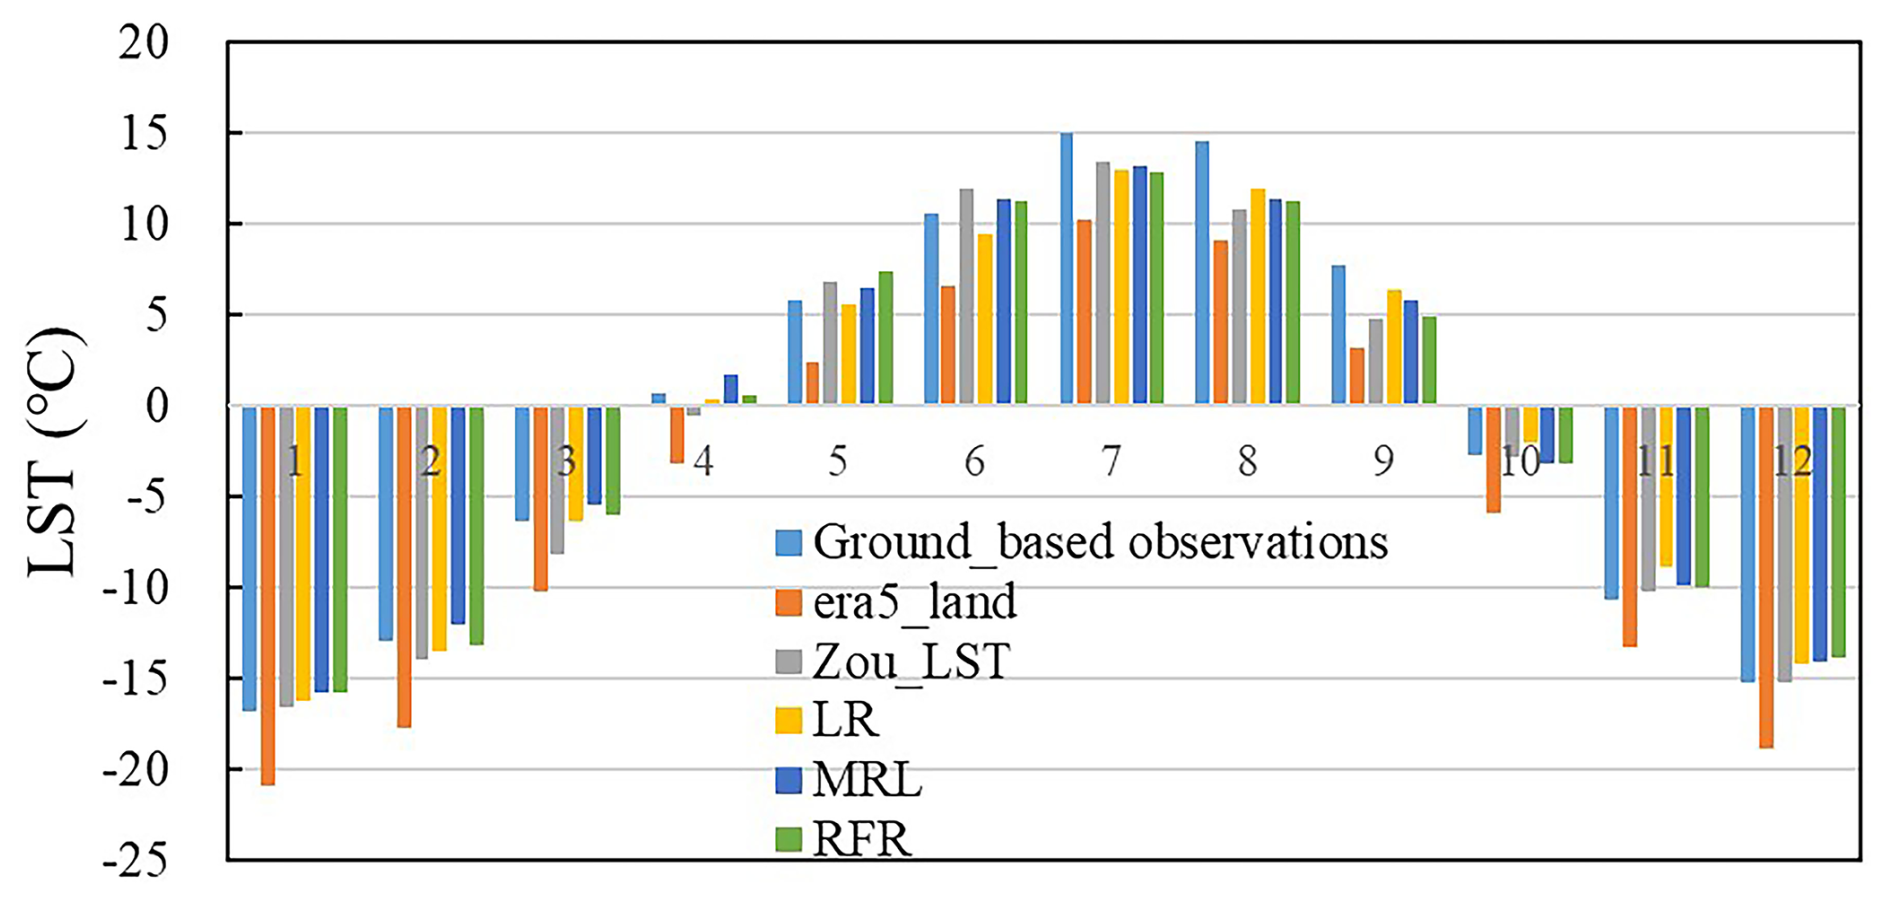
Figure 3Monthly average LST from satellite-derived data (LST_Zou), reanalysis data (ERA5-Land), three algorithm estimates (LR, MLR, and RFR), and in situ measurements from the TSH AWS (see Sect. 3.3.1) were compared for periods with available observations between 2016 and 2018.
4.1.2 Spatiotemporal variability of forcing datasets
Figure 4 shows the regional average of annual LST anomalies relative to the 1980–2022 mean. The results reveal a consistent positive trend of +0.40 °C per decade over the WKL region during this period. Interdecadal analysis highlights a remarkable warming trend in the mid-1980s, which then slowed slightly from the 2000s, during which LST deviations were relatively smaller. In the last decade, only positive anomalies were recorded, with 2016 exhibiting the largest positive deviation (+1.45 °C) compared to the 1980–2022 climate average.
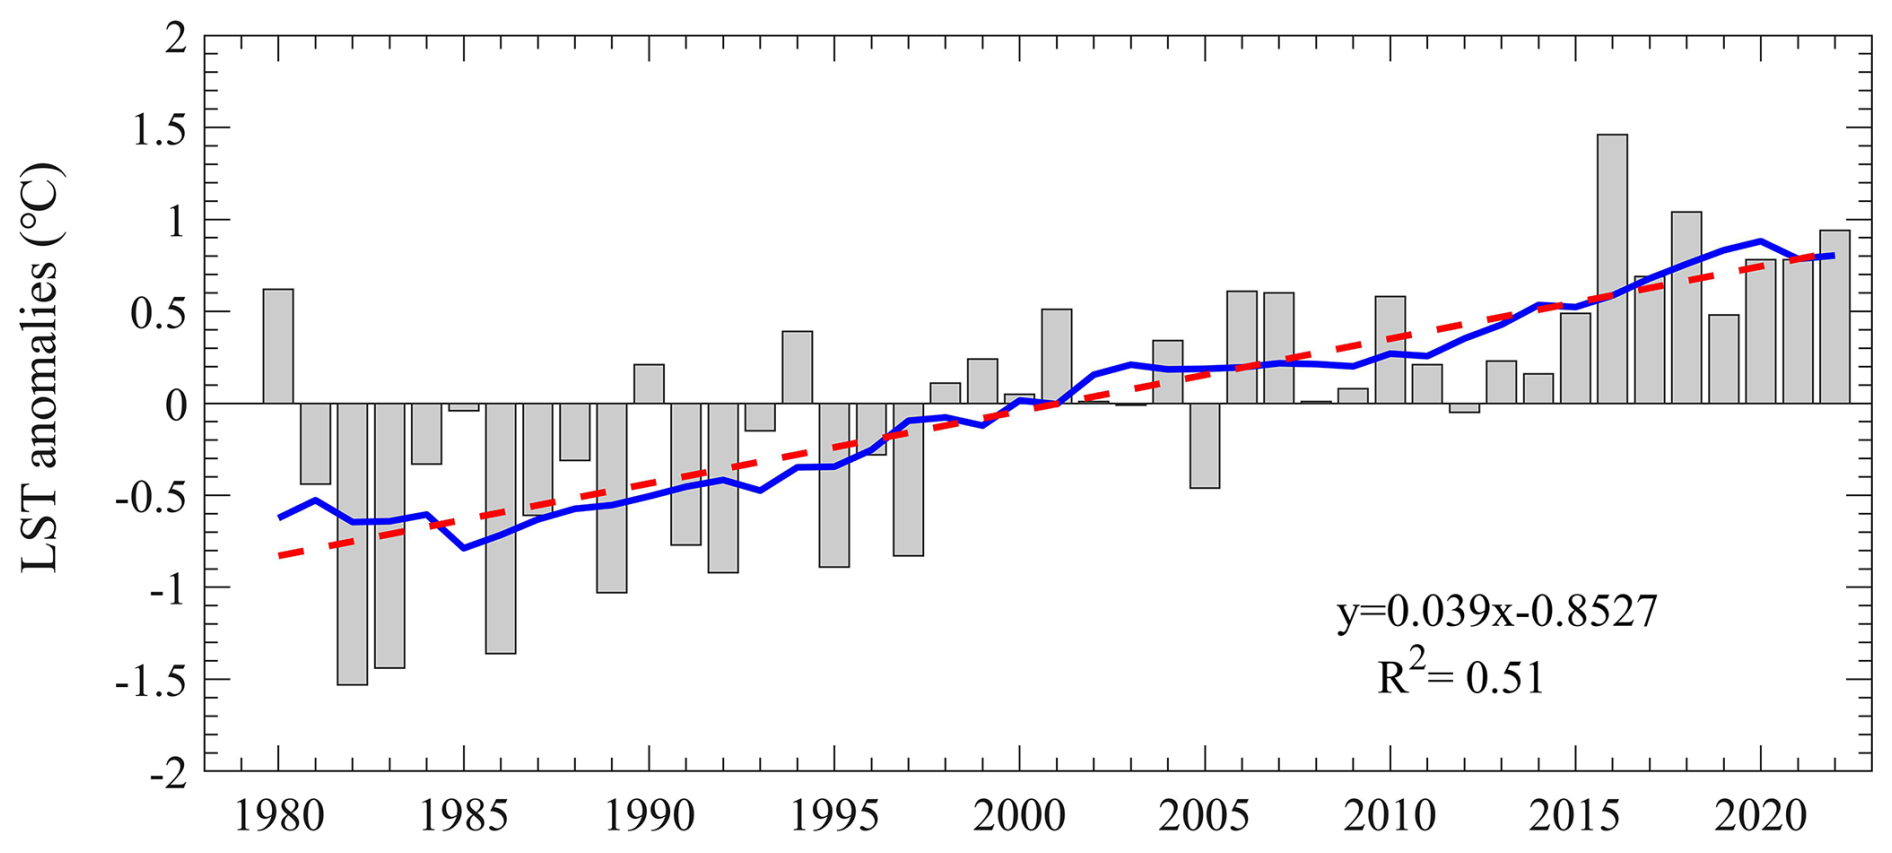
Figure 4Time series of regional average annual LST anomalies in the WKL permafrost survey area from 1980 to 2022. The 9-year moving average is depicted with a blue line, while the linear trend, calculated using standard linear regression (with long-term changes based on the slope of the regression), is shown with a dashed red line. The anomalous LST series are obtained by subtracting the mean LST from 1980 to 2022.
To further assess regional LST anomaly patterns in WKL, Fig. 5 shows decadal deviations from the 1980–2022 mean. In the 1980s, most of the region (63.25 %) exhibited negative anomalies between −1.5 and −0.5 °C, with only 0.46 %, mainly at high elevations, falling below −1.5 °C. The 1990s shown a sharp warming, with 90.95 % of the area shifting to near-normal levels (−0.5 to 0 °C). By the 2000s, warming intensified: 83.78 % of WKL showed positive anomalies (0 to 0.5 °C), and 4.34 % exceeded 0.5 °C. Between 2011 and 2022, warming became more pronounced, with 63.97 % of the region being above 0.5 °C and some high-altitude zones surpassing 1.0 °C.
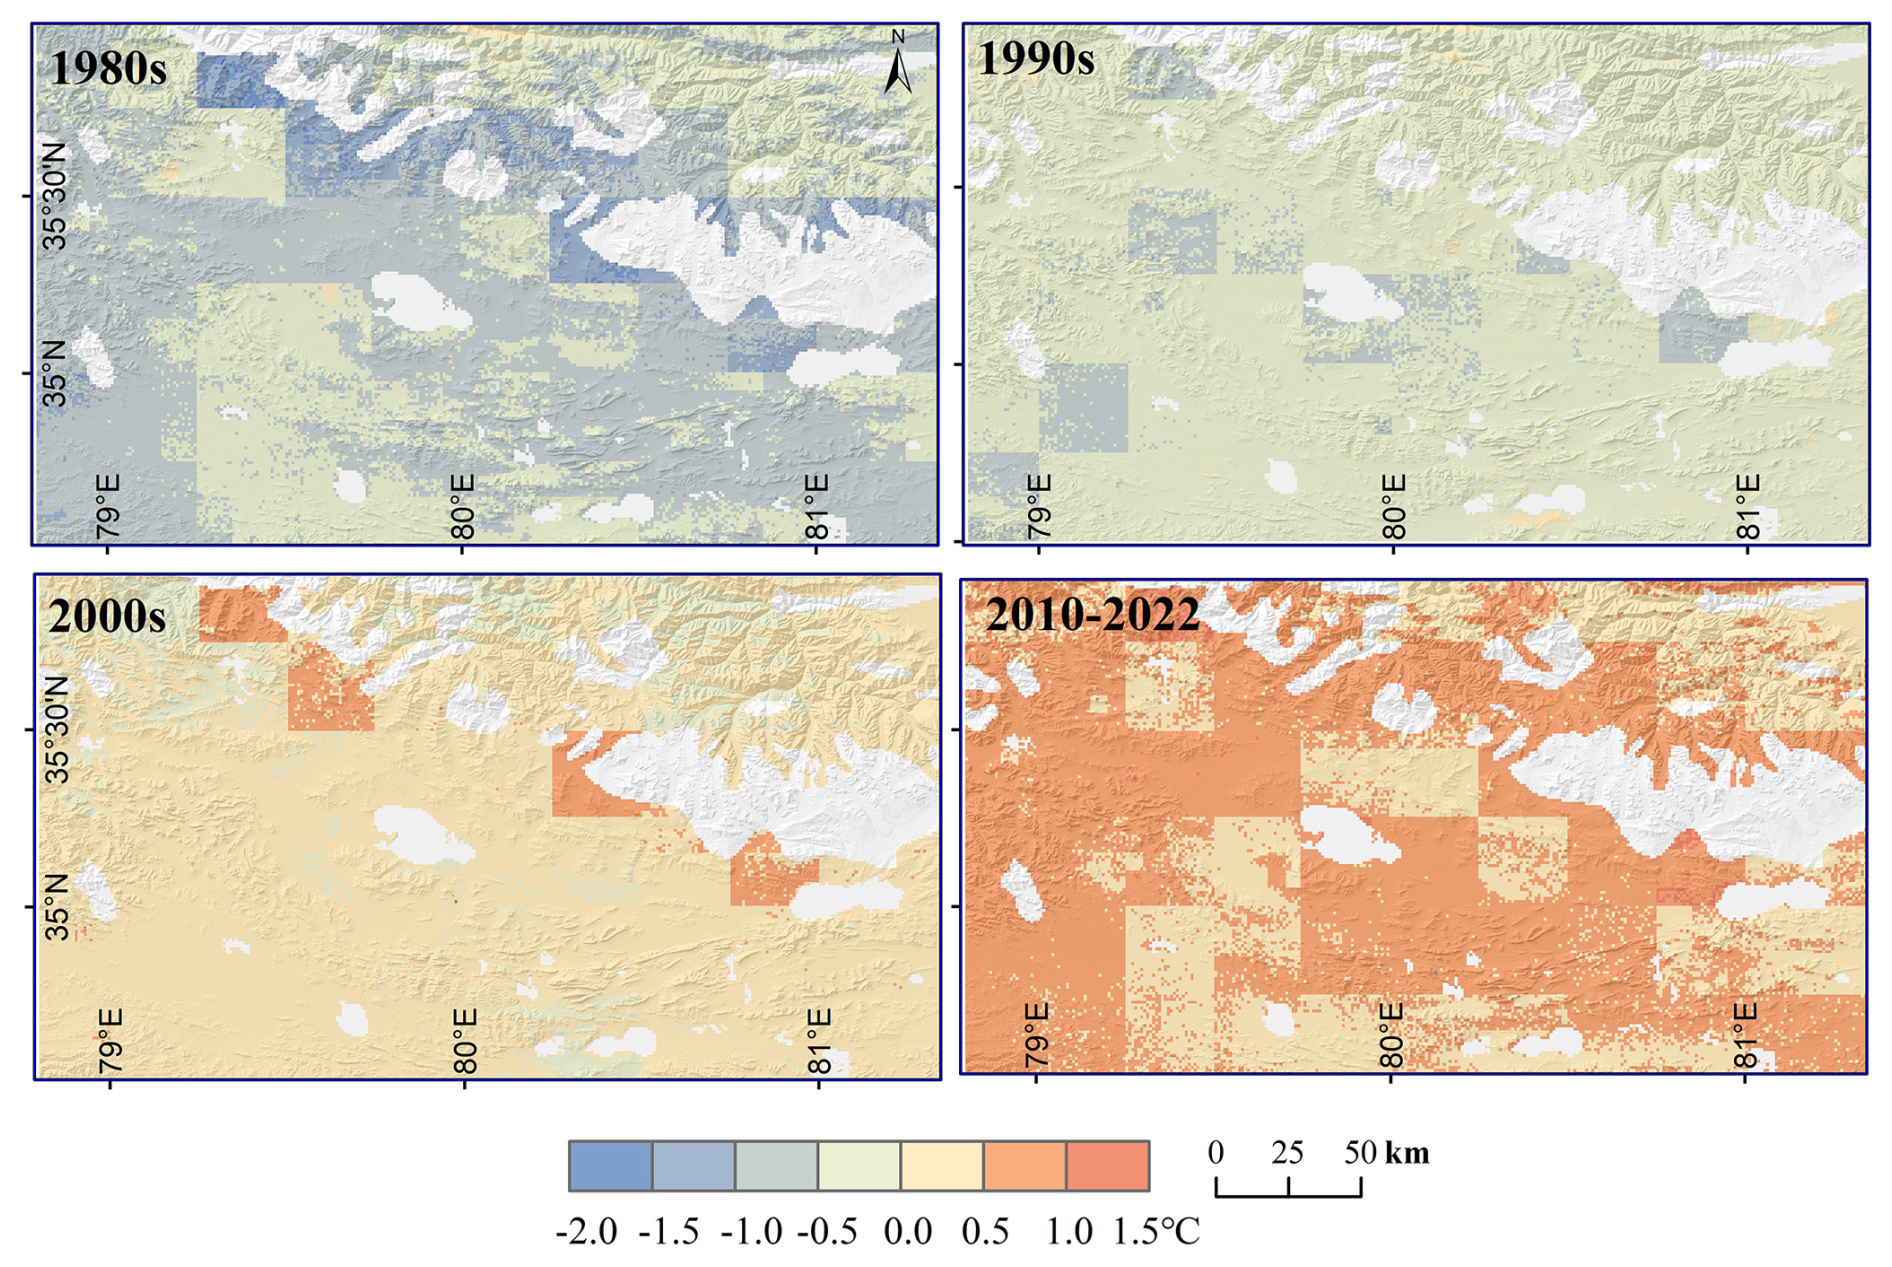
Figure 5Decadal anomalies of LST over the WKL permafrost region for the 1980s, 1990s and 2000s and 2010–2022 relative to the mean LST for the full period (1980–2022). Anomalies are computed by subtracting the 1980–2022 mean LST from each decadal average. Glaciers and lakes are masked in gray.
4.2 Modeling the thermal state of permafrost
4.2.1 Model validation
To validate the model's representation of large-scale ground thermal conditions, simulation outputs were compared with available in situ datasets (Fig. 1; Sect. 3.3), including MAGT10m (MAGT at 10 m) measurements from 15 sites in 2010, ALT data from 11 sites, thaw depth observations from 25 sites, and four historical permafrost distribution maps spanning different periods.
Ground temperatures
The comparison between observed and modeled MAGT10m results at 15 permafrost boreholes shows that 93.3 % (14 out of 15) of the data points cluster closely around the best-fit line, with deviations within ±0.25 °C (Fig. 6a). The analysis indicates strong overall agreement between measured and modeled MAGT10m for temperatures above −1 °C, with errors of 0.10 °C or less. However, for MAGT10m below −2 °C, the model shows a slight cold bias, particularly in areas with lacustrine sediments in the lowland regions of central WKL, where ground temperatures vary drastically due to complex local conditions (Fig. 6b). Despite this, the deviations between observed and simulated temperatures remain within 0.3 °C. Overall, the comparison suggests that the MGPM effectively replicates the measured MAGT10m, capturing the spatial variability in the validation area, with a correlation coefficient of r = 0.98 (p<0.01), and achieving an MAE and RMSE of 0.12 and 0.15 °C, respectively.
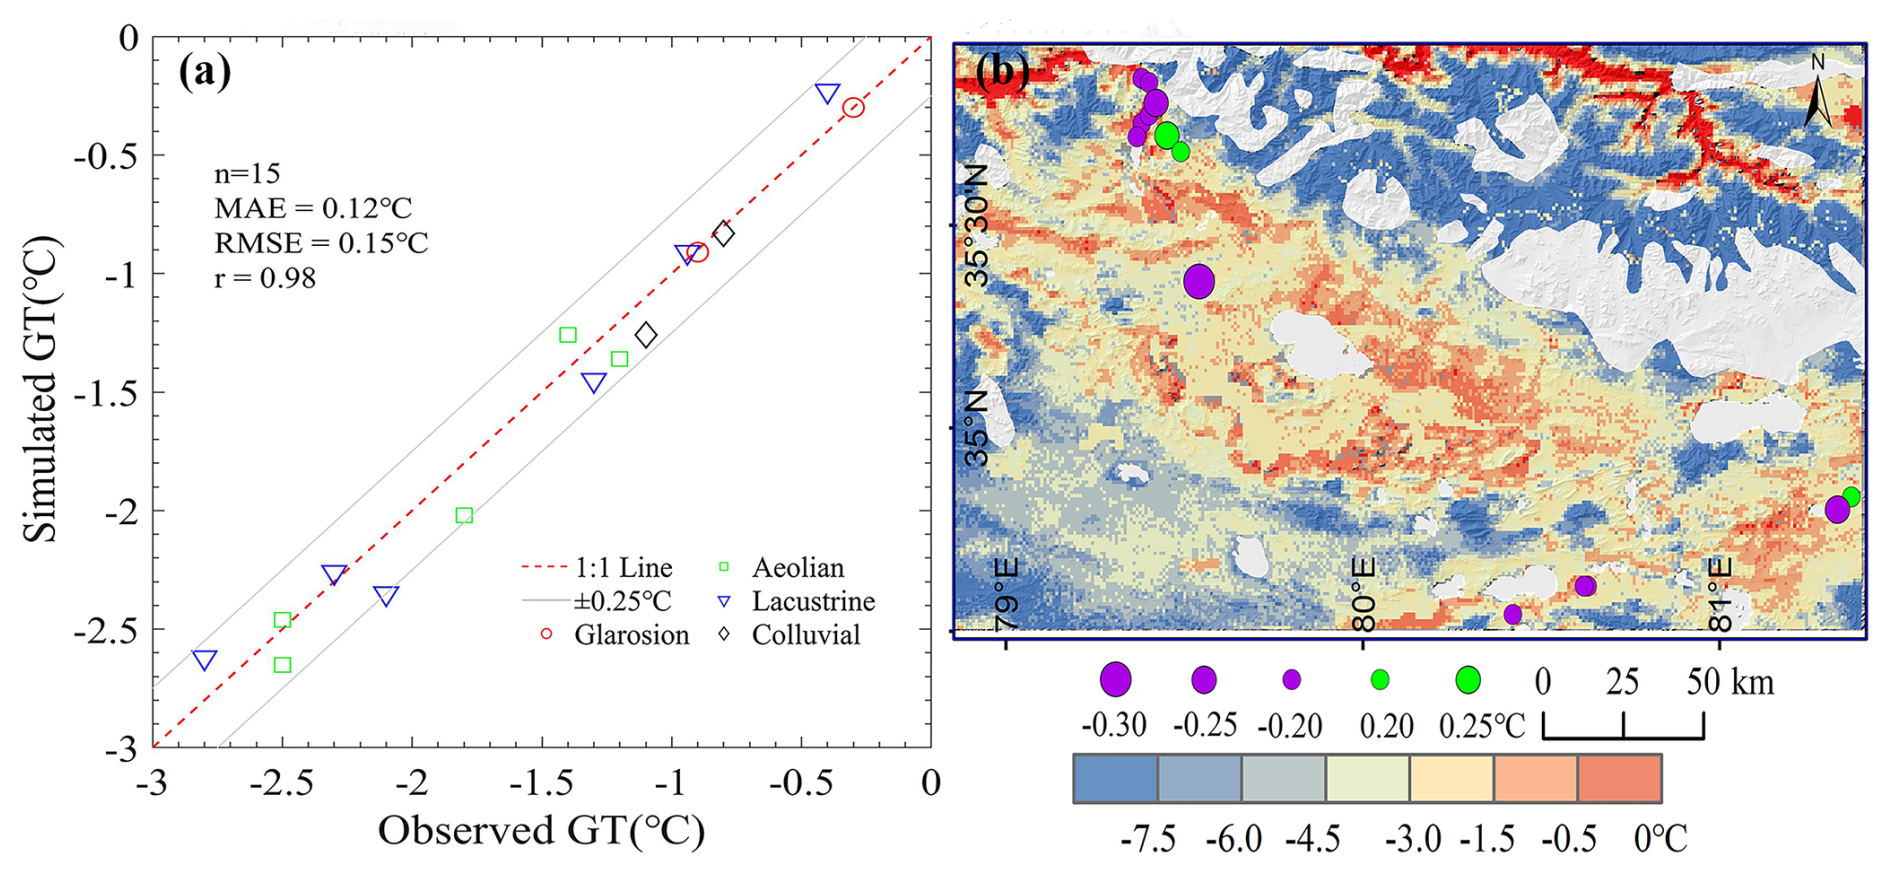
Figure 6(a) Scatterplot comparing observed (Zhao and Sheng, 2019; Li et al., 2012) and modeled MAGT10m for 2010. Different symbols denote soil stratigraphic classes (glarosion, eolian, lacustrine, colluvial). The gray line indicates biases within ±0.25 °C, and the 1:1 reference line is shown in red. (b) Map showing the spatial distribution of modeled MAGT10m in 2010. Circle size and color represent the temperature difference between observed and modeled values at the nearest 1 km × 1 km grid point. Seasonally frozen ground is highlighted in red, while glaciers and lakes are shown in gray.
Active-layer thickness (thaw depths)
The scatterplots and spatial maps comparing measured and modeled ALT at 11 sites and thaw depths at 25 sites are shown in Fig. 7. The comparisons indicate that the model generally captures the range of ALT across the WKL region effectively. At 72.7 % of the sites (8 out of 11), the simulated ALT values closely match the observations, with deviations within ±0.25 m of the measurements (Fig. 7a). Notably, for the eolian sediment class, characterized by relatively shallow ALT around 2 m, the model performs exceptionally well, showing minimal bias (≤ 0.05 m), which suggests that the modeling approach is well suited to these conditions. However, the model underestimates ALT by approximately 0.25 m in lacustrine sediments near lake areas, where measured ALT exceeds 3 m (Fig. 7c).
A similar pattern is modeled for thaw depths: 91.3 % of the modeled values (21 out of 23) fall within ±0.25 m of the observations (Fig. 7b). For thaw depths greater than 3 m, the model tends to underestimate values, with the largest discrepancies of up to 0.5 m occurring in northern marginal permafrost zones (Fig. 7c).
Overall, despite slightly larger biases (> 0.25 m) at a few locations, the model effectively captures the spatial variability of ALT and thaw depth across the major geomorphological units of the WKL region. It yields an r of 0.96 for ALT and 0.94 for thaw depth, with corresponding MAE and RMSE values of 0.13 m and 0.16 m for ALT and 0.16 m and 0.18 m for thaw depth.
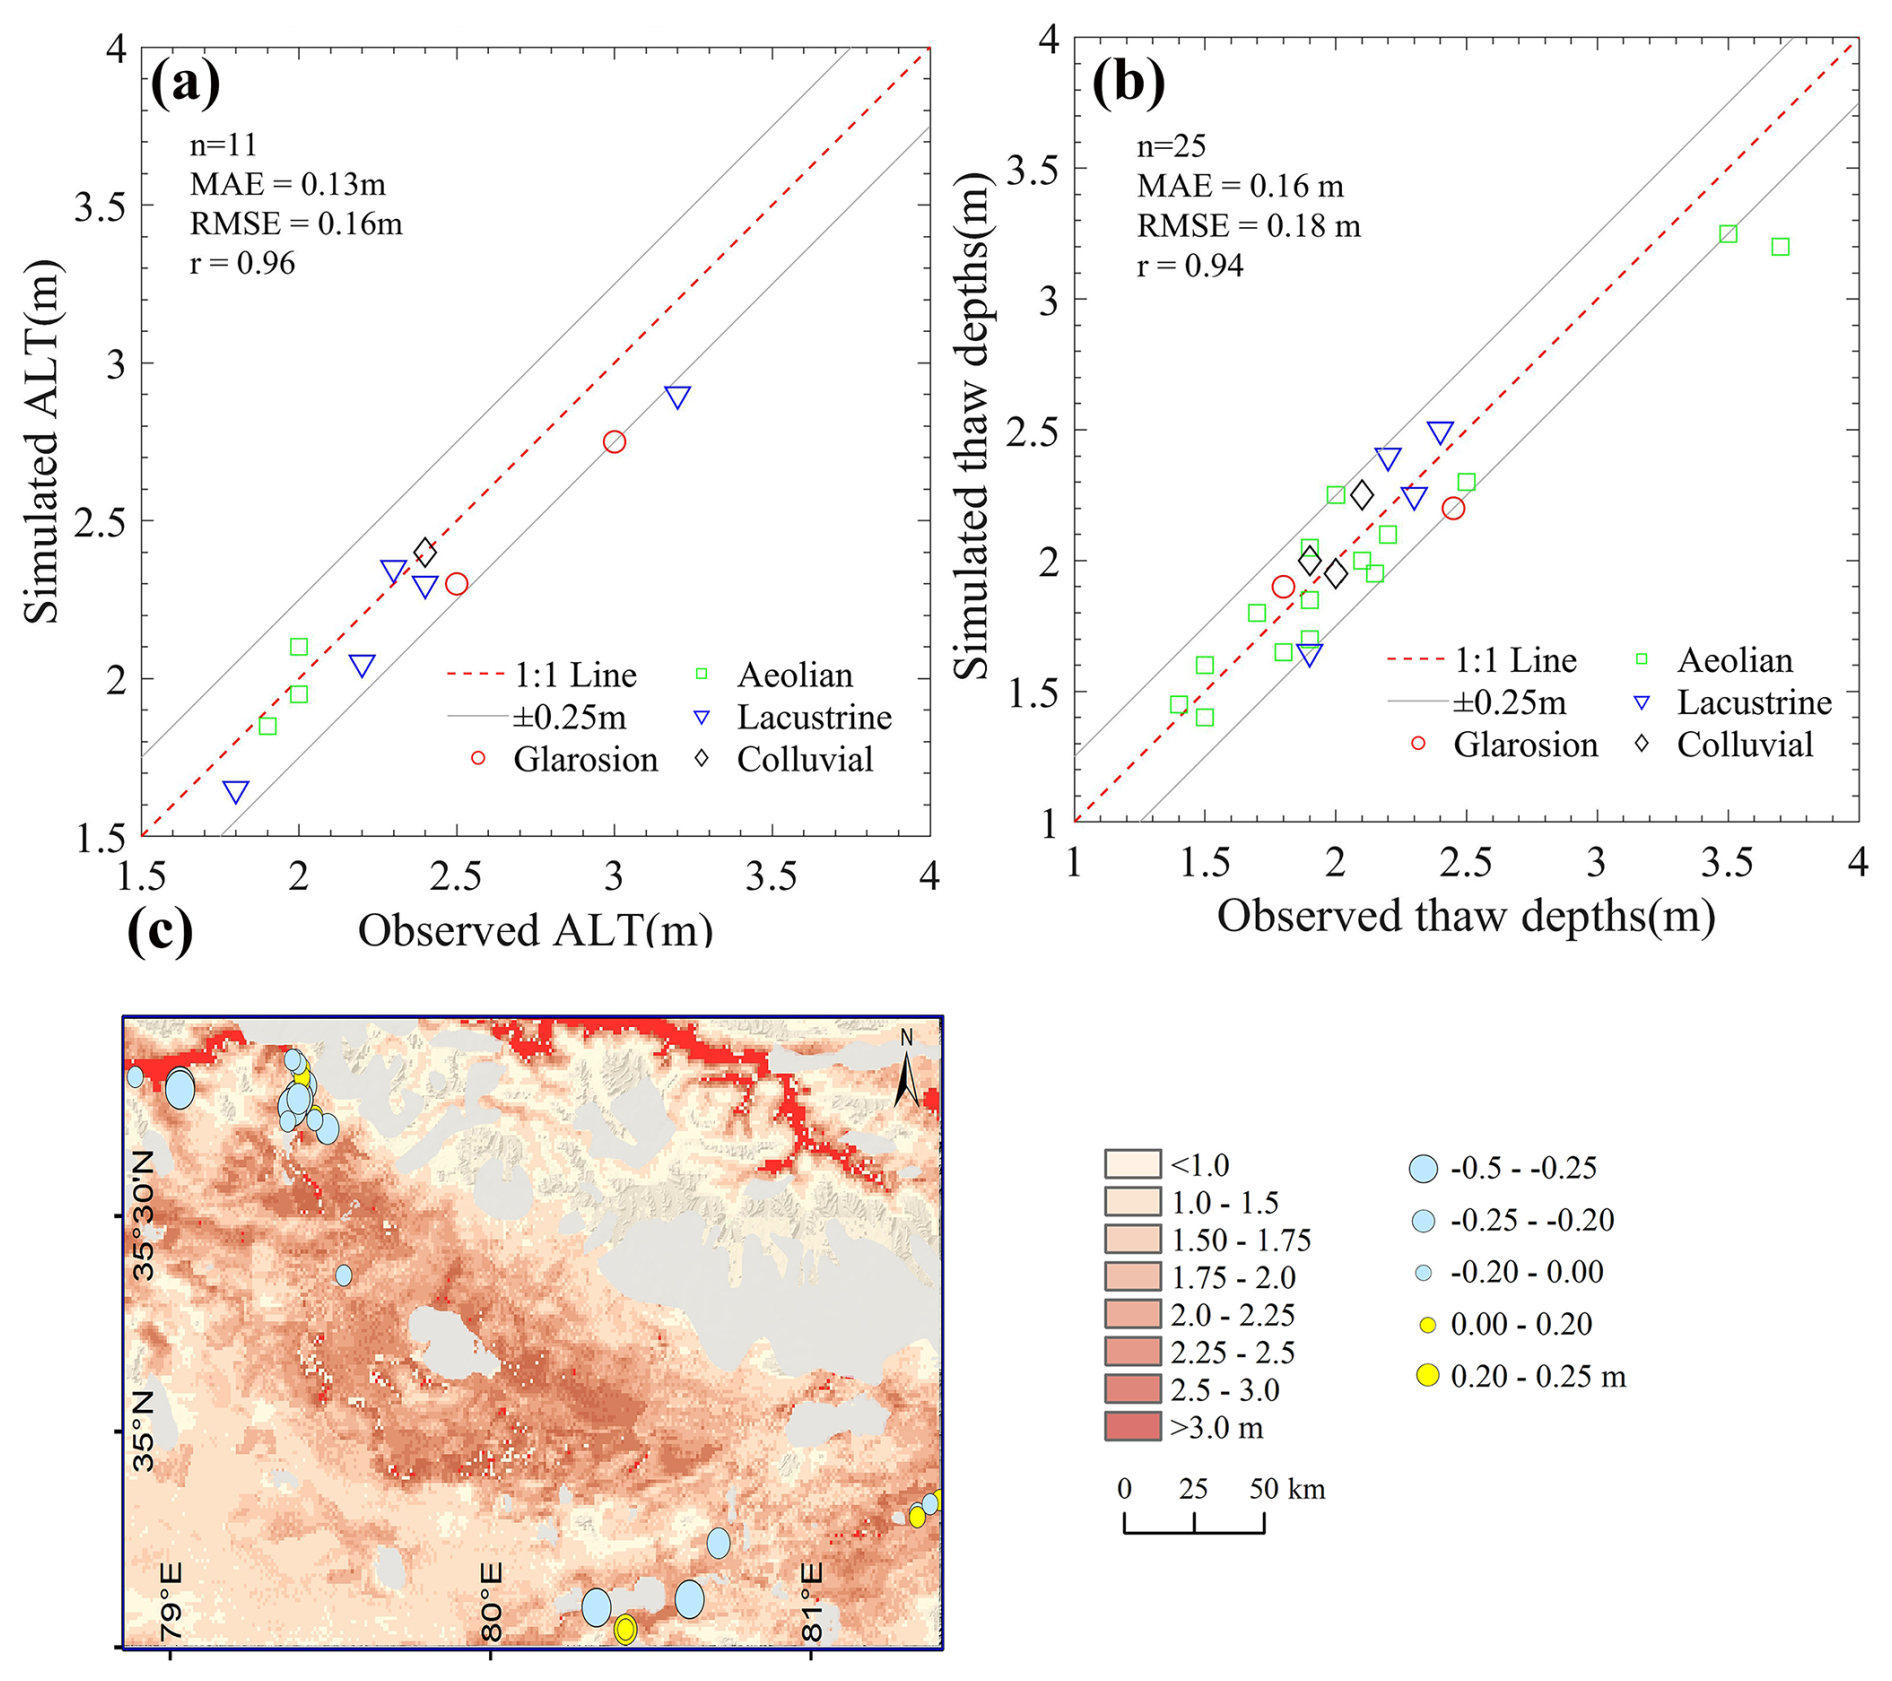
Figure 7(a) Scatterplot comparing borehole-observed ALT in 2010 (Zhao and Sheng, 2019; Li et al., 2012) with modeled values. (b) Same as (a) but for thaw depths (Zhao et al., 2019). Gray line indicates deviations within ±0.25 m, and the 1:1 reference line is shown in red. (c) Modeled spatial distribution of ALT and thaw depths for 2010. Circle size and color represent the differences between borehole (or GPR) observations and modeled values at the nearest 1 km × 1 km grid point. Seasonally frozen ground is marked in red, while glaciers and lakes are shown in gray.
Permafrost distribution
Figure 8 compares four representative frozen-soil type maps of the WKL region with the corresponding outputs from MGPM simulation outputs. In this analysis, 28 boreholes (see details in Fig. 1 and Sect. 3.3) are used as reference points to evaluate the accuracy of permafrost and seasonally-frozen-ground distributions. The results show that, while the maps by Li and Cheng (1996) and Wang et al. (2006) capture the general presence of permafrost across WKL, they fail to accurately delineate areas of seasonally frozen ground (Fig. 8a–c). Notably, these two maps show remarkable discrepancies in northeastern WKL, where they indicate continuous permafrost, while our simulation identifies seasonally frozen ground (Fig. 8i–j).
In contrast, the maps by Cao et al. (2023) and Zou et al. (2017), along with our simulation results, display a more accurate spatial pattern of frozen-ground types, correctly identifying nearly all permafrost and seasonally-frozen-ground locations, except for a single site near lakes in the southern WKL (Fig. 8c–d, g–h). However, small mismatches remain: compared to our simulations, Cao et al. (2023) and Zou et al. (2017) overestimate the extent of seasonally frozen ground by 1.84 % and 1.61 %, respectively, designating certain areas as seasonally frozen where our model indicates permafrost (Fig. 8k–l). Additionally, our simulation identifies about 0.61 % (Cao) and 0.58 % (Zou) of the central lowland region as seasonally frozen ground, whereas both maps categorize these areas as permafrost (Fig. 8k–l).
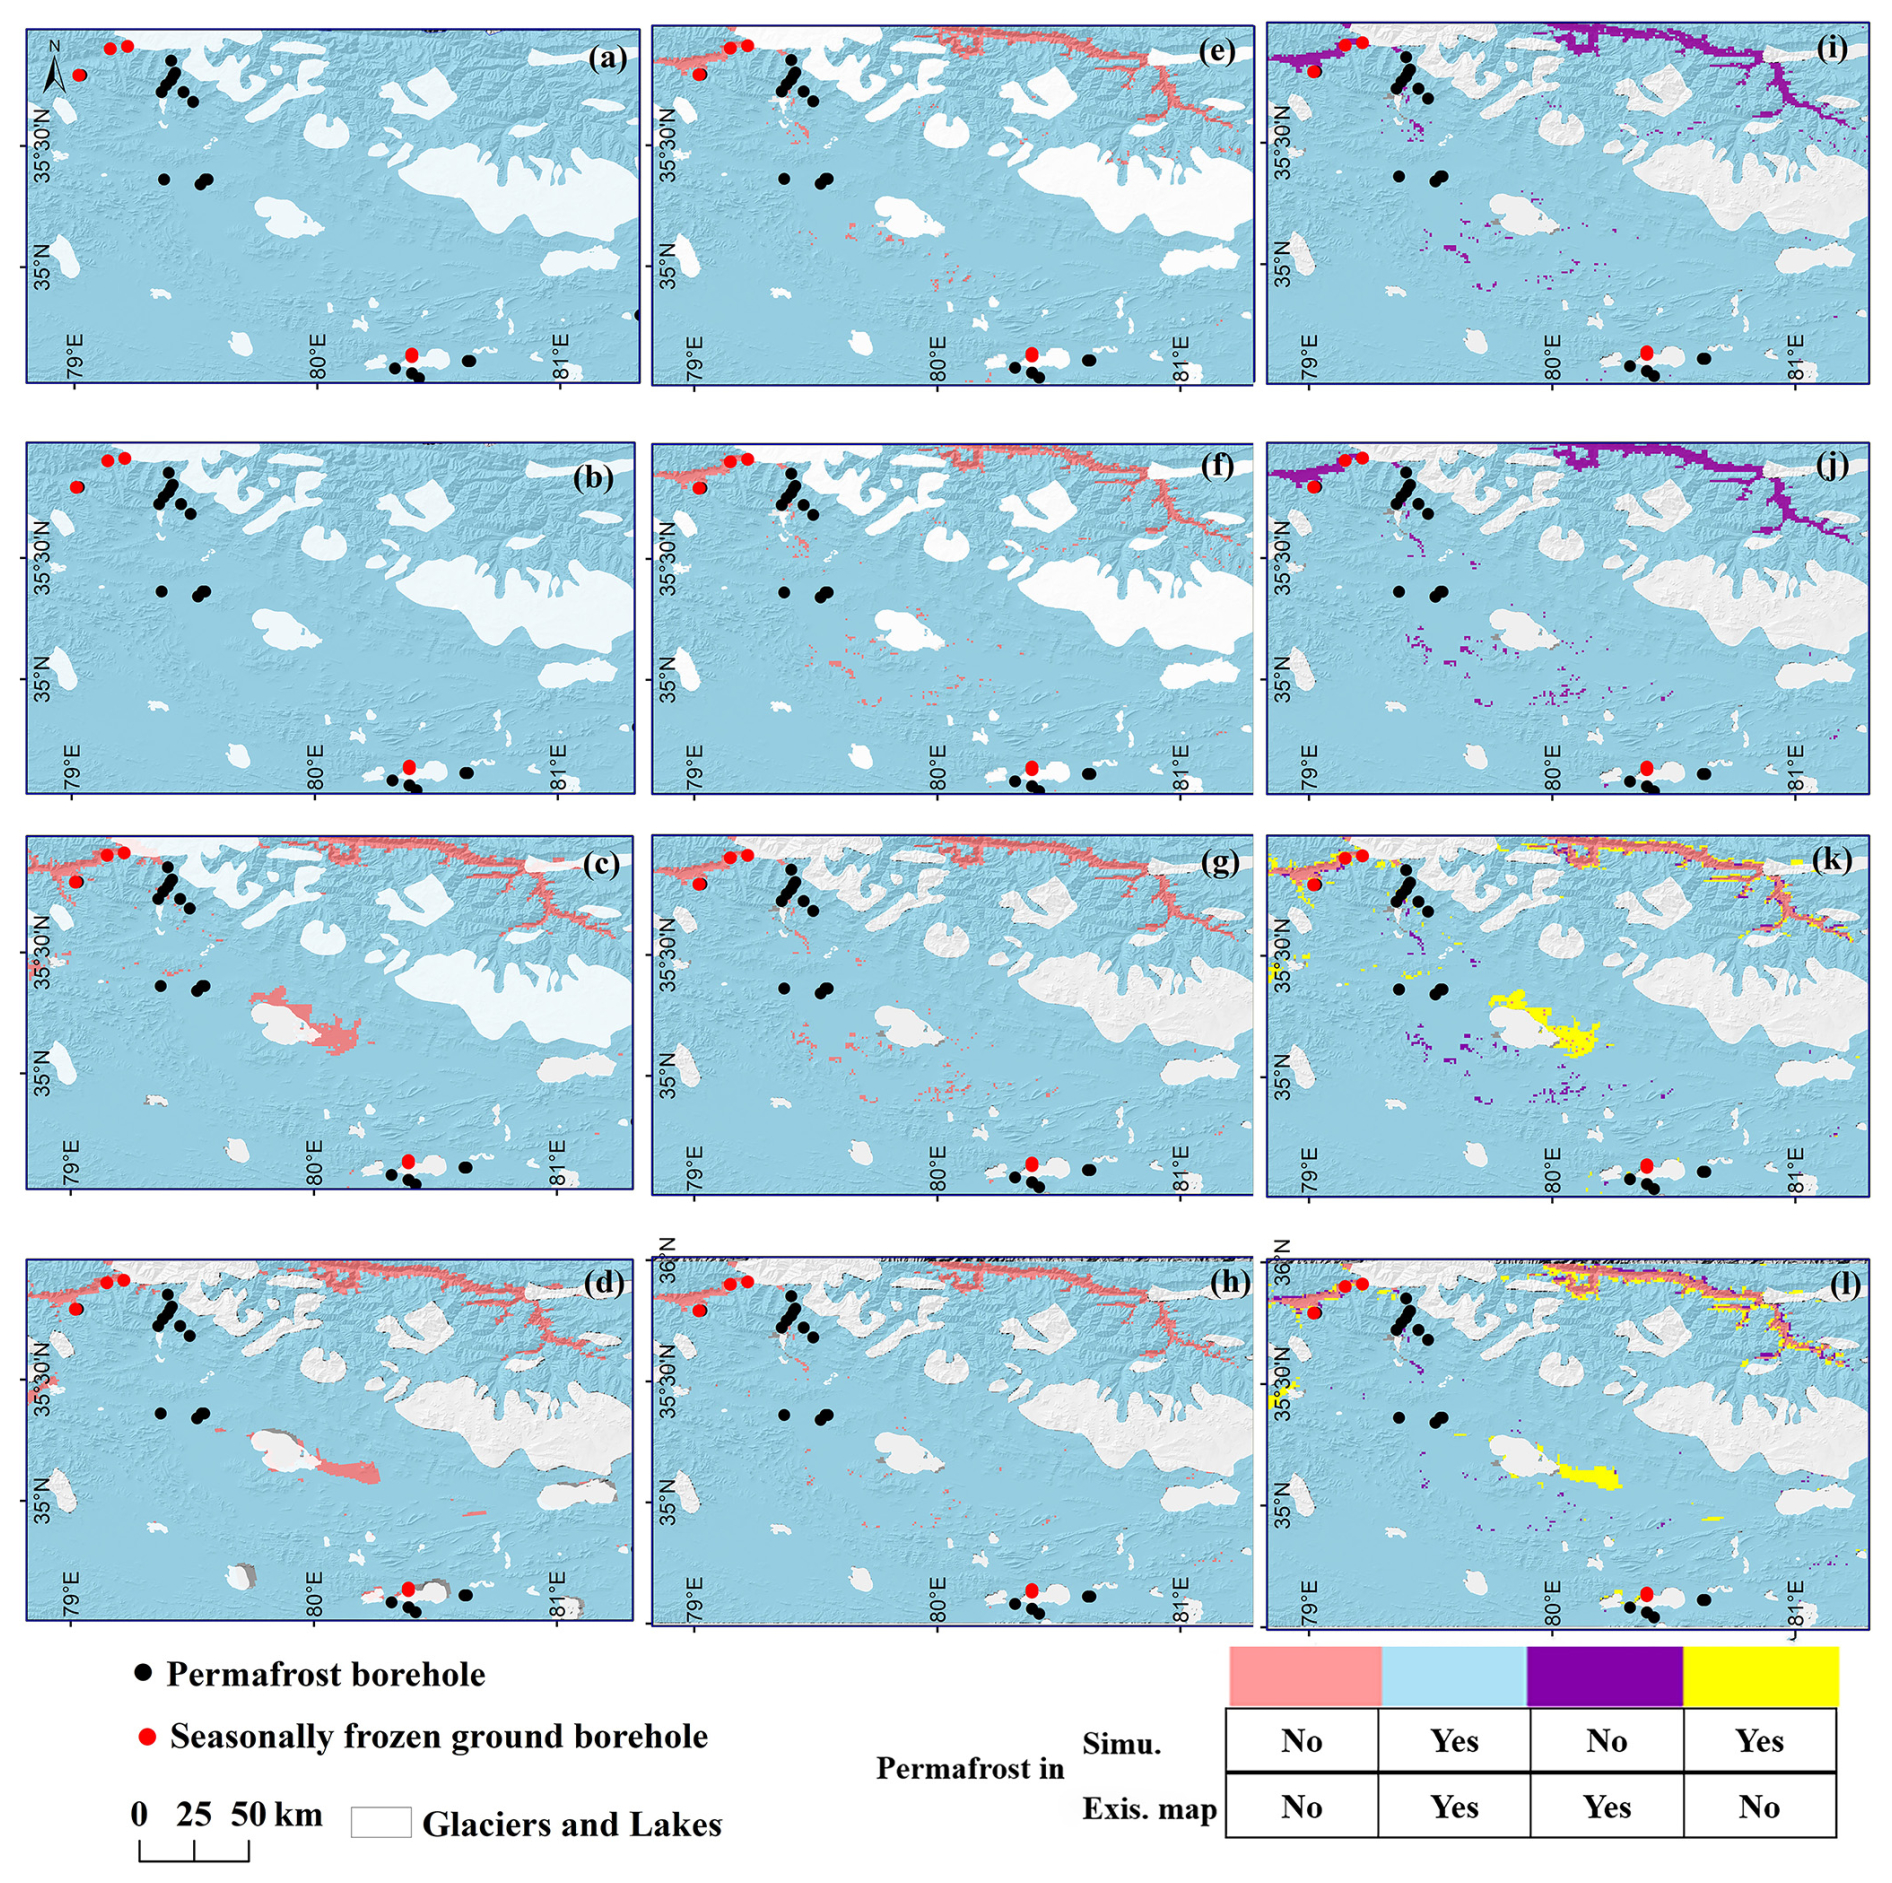
Figure 8Spatial distribution of frozen-ground types in the WKL permafrost survey area, as represented by four historical maps: (a) the 1980s (Li and Cheng, 1996), (b) the 2000s (Wang et al., 2006), (c) 2010 (Cao et al., 2023), and (d) after 2010 (Zou et al., 2017) (left column). The corresponding MGPM simulations are shown in the middle column (e–h), and spatial discrepancies between each historical map and the MGPM outputs are highlighted in the right column (i–l).
4.2.2 Initial thermal status of permafrost condition
To investigate how the thermal state of permafrost evolves under ongoing climate change, it is first necessary to understand its initial conditions. Fig. 9 presents the modeled baseline distribution of MAGT15m, TTOP, and ALT for the year 1980. The results reveal pronounced spatial variability in the ground thermal regime across the WKL permafrost survey area. MAGT15m decreases dramatically with elevation, with the warmest average values of around 0.5 °C being simulated in the central low-elevation zones (below 4800 m a.s.l.) and the coldest, below −10 °C, being found in high-elevation areas (around 6000 m a.s.l.). Moderate variations in MAGT15m are also modeled across different soil stratigraphic classes. The coldest average MAGT15m, approximately −3.5 °C, occurs in eolian sediments, while the warmest, about −1 °C, is found in alluvial plain deposits.
A similar spatial pattern is evident in the modeled TTOP, although TTOP values are generally slightly lower than those of MAGT15m across the region (Fig. 9d–f). Likewise, ALT shows a strong elevation dependency. In lower-elevation areas (below 5400 m a.s.l.), ALT typically ranges from 2.5 to 3.0 m, with some localized zones exceeding 3.0 m. At higher elevations, ALT decreases progressively, dropping below 1.0 m, and approaches 0 m in areas above 6000 m a.s.l., where perennially frozen conditions prevail. ALT also varies markedly across stratigraphic classes: the alluvial class exhibits the greatest average ALT, while the glarosion class shows the shallowest (Fig. 9i).
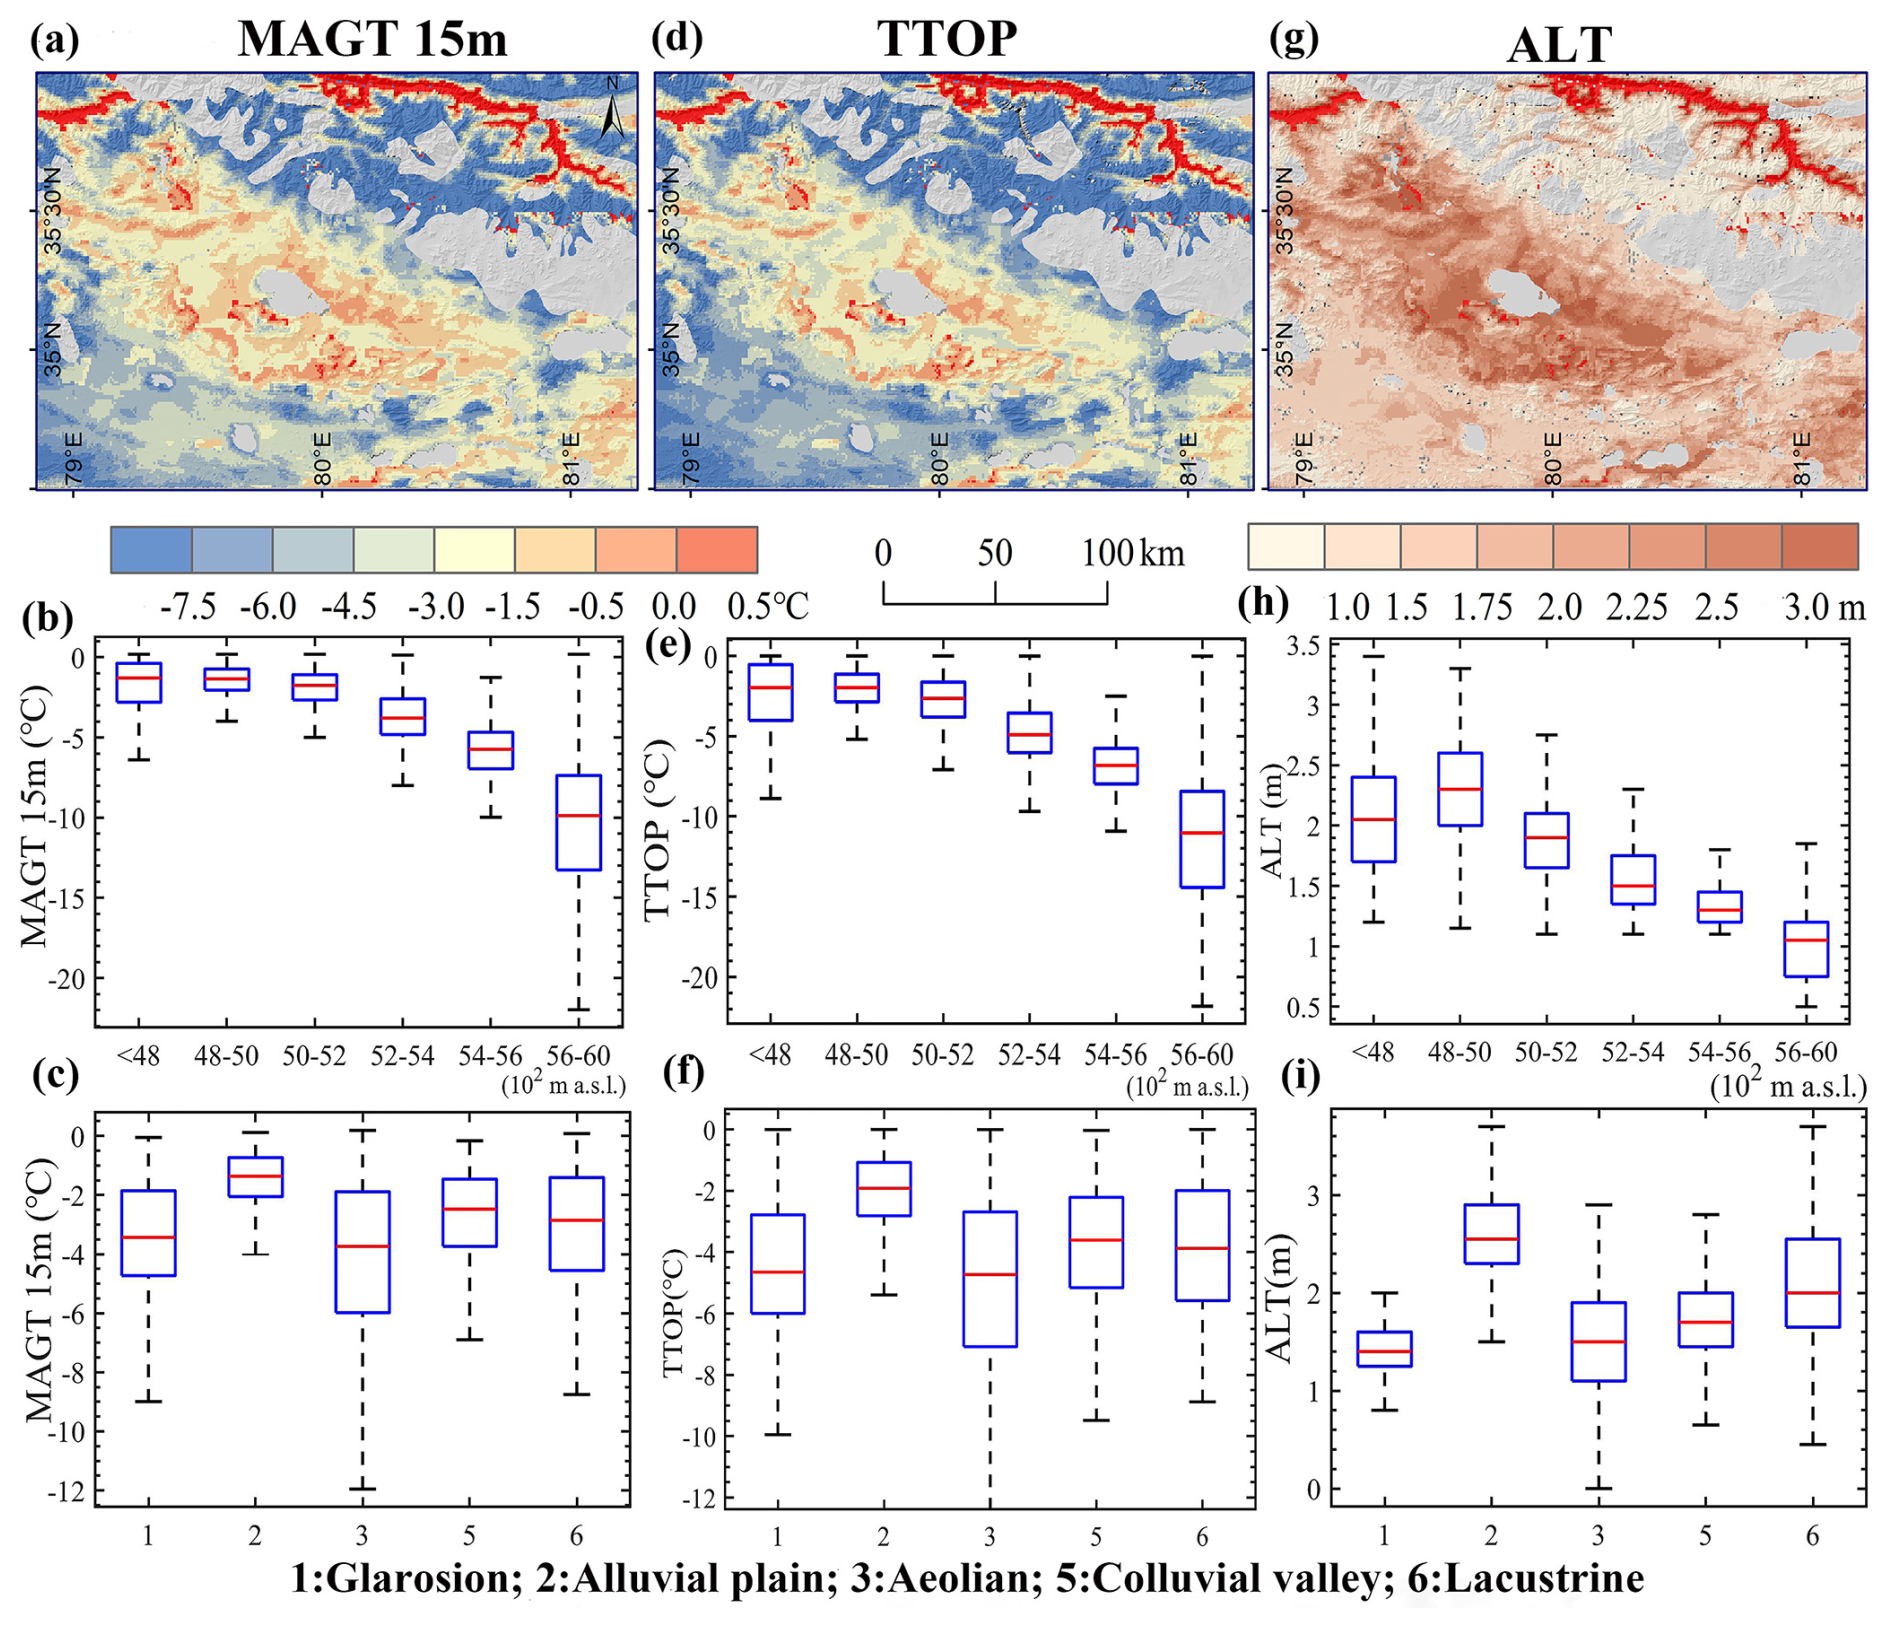
Figure 9Spatial distribution of simulated MAGT15m (first column, a–c), TTOP (second column, d–f), and ALT (third column, g–i) from the initial model output for the year 1980. Seasonally frozen ground is shown in red, and glaciers and lakes are in gray (top row). The middle row displays boxplots of MAGT15m, TTOP, and ALT grouped by elevation bands ranging from 4300 to 6000 m a.s.l. (excluding specific areas). The bottom row shows boxplots categorized by soil stratigraphic classes: glarosion, alluvial plain, eolian, colluvial valley, and lacustrine. In each boxplot, the box bounds represent the 25th and 75th percentiles, the whiskers extend to 1.5 times the interquartile range, and the horizontal line inside the box indicates the median.
4.2.3 Evolution of permafrost thermal conditions
Figure 10 shows the simulated interdecadal changes in MAGT15m, TTOP, and ALT across the WKL permafrost region from 1980 to 2022. From the 1980s to 1990s, MAGT15m remained relatively stable in 62.4 % of the region (±0.3 °C; Fig. 10a). A clear warming trend emerged from the 1990s to 2000s, with MAGT15m rising in 67.2 % of the area and localized increases exceeding 1.8 °C (Fig. 10b). From the 2000s to 2010–2022, warming became more variable, and 47.1 % of the region experienced cooling, with decreases of up to −1.8 °C (Fig. 10c). Overall, from 1980 to 2022, 58.6 % of the region warmed (up to +1.8 °C), while 25.5 %, mainly in central WKL, cooled, with decreases below −1.8 °C (Fig. 10d).
TTOP followed a similar trend. The largest increase occurred between the 1990s and 2000s, when 86.7 % of the region warmed, and 16.4 % showed increases above 0.8 °C (Fig. 10e). From the 2000s to 2010–2022, 70.5 % of the region continued to warm (up to +1.8 °C; Fig. 10f–g). Over the full period, 81.7 % of the region experienced a TTOP increase, with 17.2 % warming by over 1.3 °C. However, a small central area (∼ 7.4 %) showed declines ranging from −0.3 to −1.3 °C (Fig. 10h).
ALT increased most significantly between the 1980s and the 1990s, with 74.2 % of the region showing growth of 0.1–1.5 m and with some areas exceeding 1.5 m (Fig. 10i). From the 1990s to 2000s, 58 % of the region continued to increase, although 7.6 % modeled a decrease of −0.3 to −1.0 m (Fig. 10j). From the 2000s to 2010–2022, 59 % of the area experienced ALT increases, while 0.97 % showed sharp declines beyond −0.8 m (Fig. 10k). Overall, ALT increased by an average of 0.17 m across WKL from 1980 to 2022, with 83.1 % of the region warming and 16.9 %, mainly central, cooling, in some places by more than −0.8 m (Fig. 10l).
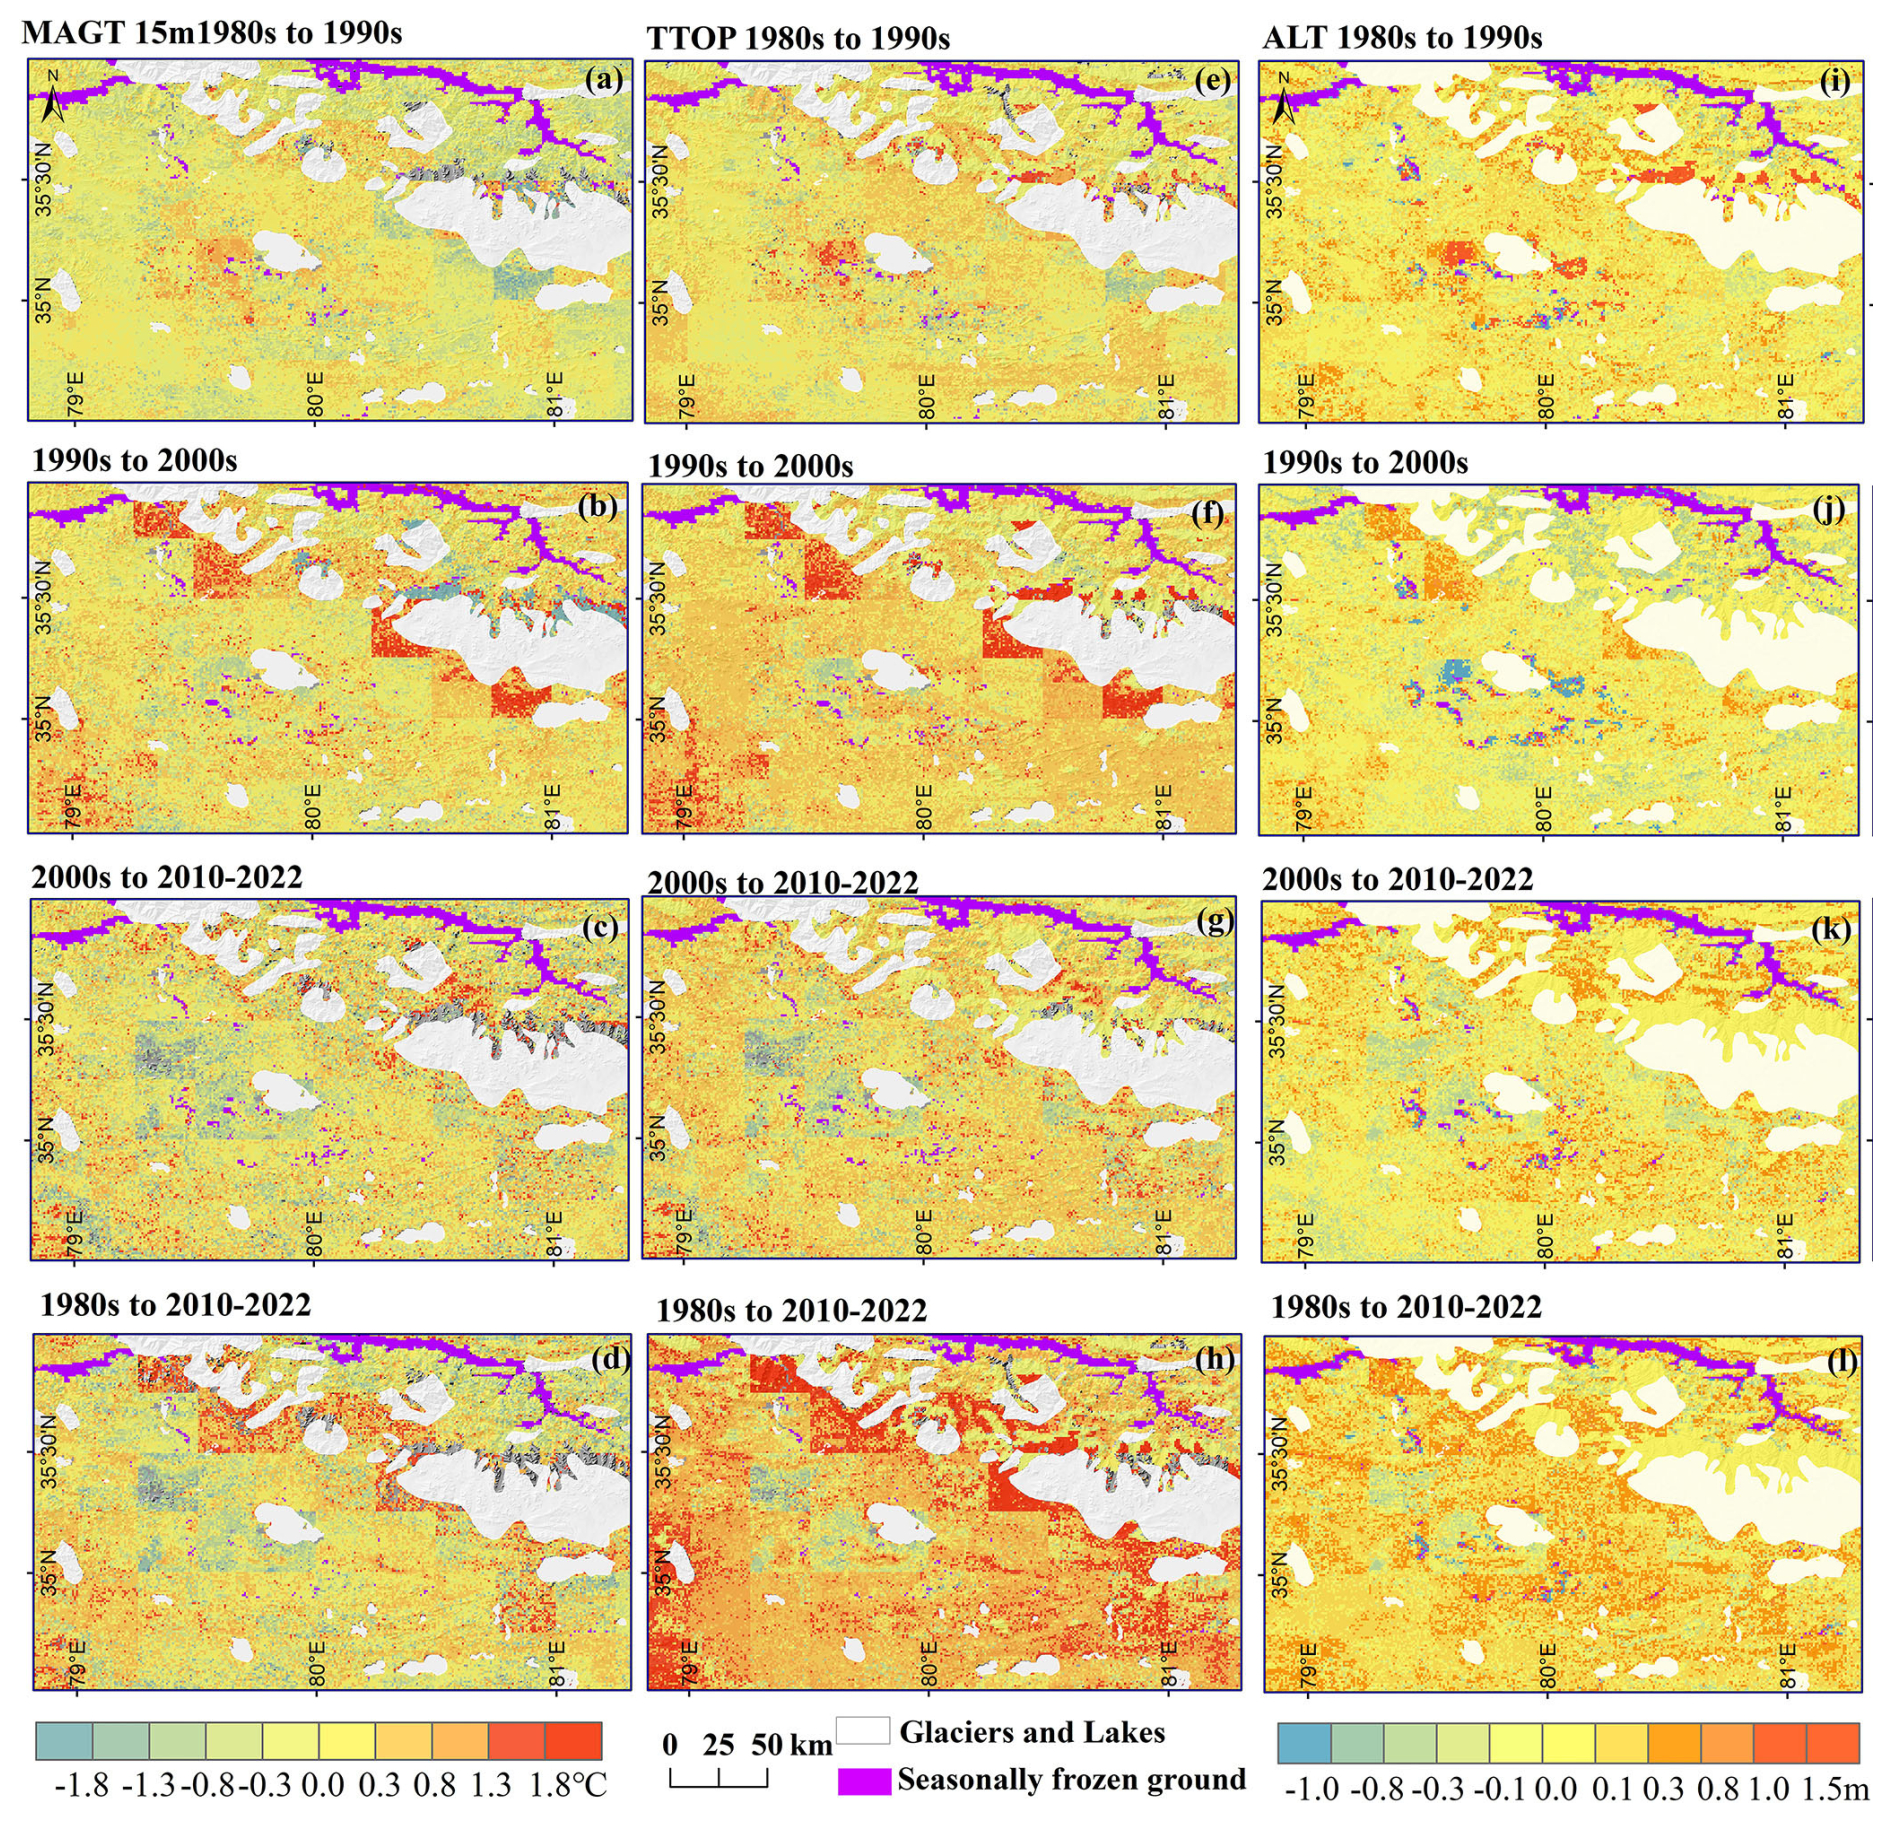
Figure 10Spatial distribution of relative changes in modeled MAGT15m (left column: a–d), TTOP (middle column: e–h), and ALT (right column: i–l) for the 1980s, 1990s and 2000s and 2010–2022. Seasonally frozen ground is shown in purple, and glaciers and lakes are in gray.
Figure 11 illustrates the interdecadal variations of MAGT15m, TTOP, and ALT across different elevation zones and soil stratigraphic classes. Overall, the modeled MAGT15m showed minor fluctuations and a slight upward trend from the 1980s to 2010–2022. The most noticeable increase occurred at the highest elevations (5600–6000 m a.s.l.), though changes remained less pronounced than those in TTOP (Fig. 11a–b). MAGT15m showed no remarkable differences across soil classes (Fig. 11d). In contrast, TTOP exhibited a clear warming trend across most soil classes, except in alluvial sediments. ALT increased remarkably with elevation from the 1980s to 2000s (Fig. 11c) and showed substantial variability among soil classes. The largest ALT increase (> 0.17 m) occurred in alluvial and lacustrine sediments, while the smallest (0.11 m) was in glarosion sediments (Fig. 11f).
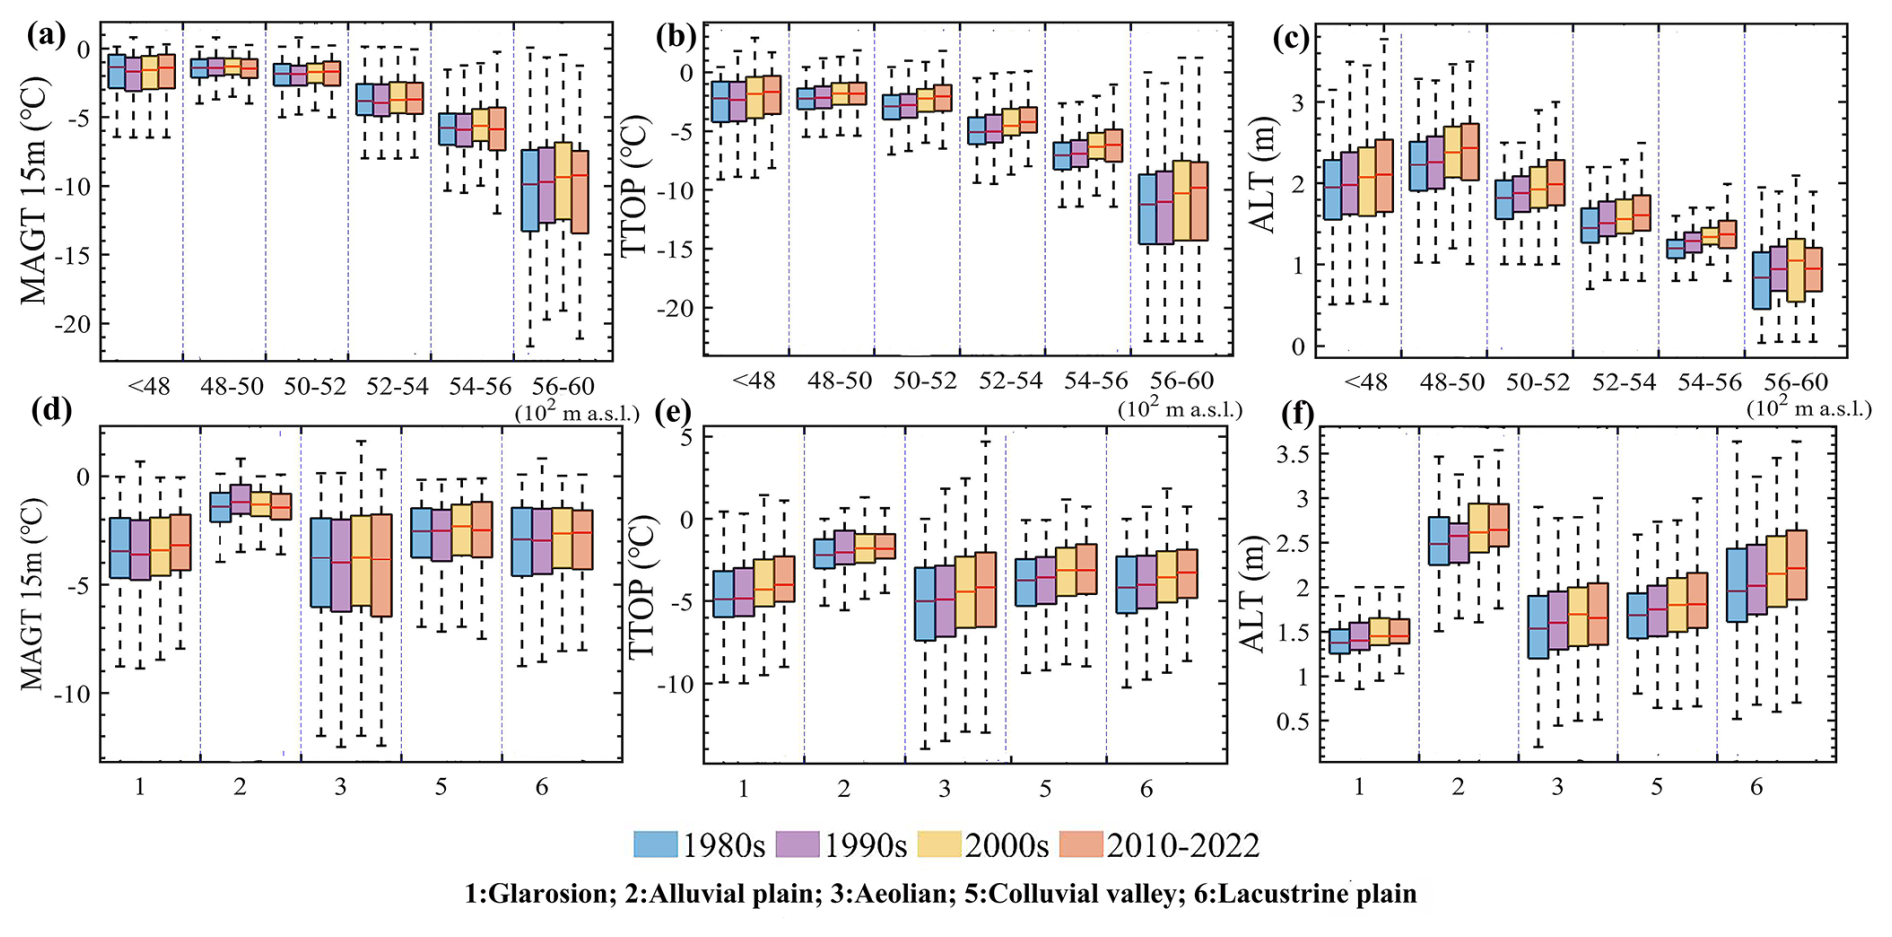
Figure 11Boxplot maps of modeled MAGT15m (first column: a, d), TTOP (middle column: b, e), and ALT (right column: c, f) for four periods (1980s, 1990s and 2000s and 2010–2022), shown in differently colored boxes. The first row categorizes the data by elevation (ranging from 4300 to 6000 m a.s.l.), while the bottom row categorizes it by soil stratigraphy (glarosion, alluvial plain, eolian, colluvial valley, and lacustrine). The top and bottom lines of the boxplots represent the 75th and 25th percentiles, respectively, with the whiskers extending to the highest and lowest values within 1.5 times the interquartile range. The middle line of each boxplot indicates the median.
4.2.4 Evolution of permafrost extent
Table 3 shows permafrost aggradation and degradation in response to climate variability across the WKL permafrost area from 1980 to 2022. Based on the initial simulation for the 1980s, approximately 82.27 % of the WKL area was underlain by permafrost, with 55.58 % occurring in eolian stratigraphy and 67.9 % occurring at elevations between 4800 and 5600 m a.s.l.
Permafrost extent remained unchanged from the 1980s to 1990s. A slight decline of 0.15 % was simulated between the 1990s and 2000s, followed by a 0.44 % increase from the 2000s to 2010–2022. These changes were primarily concentrated in low-elevation areas below 4800 m a.s.l. and in regions with alluvial plain sediments (Table 3). Overall, the simulations indicate that permafrost extent in WKL has remained relatively stable over the last 43 years.
Table 3Changes in the areal extent of frozen-ground types in the WKL permafrost region from 1980 to 2022, categorized by elevation and soil stratigraphic class.
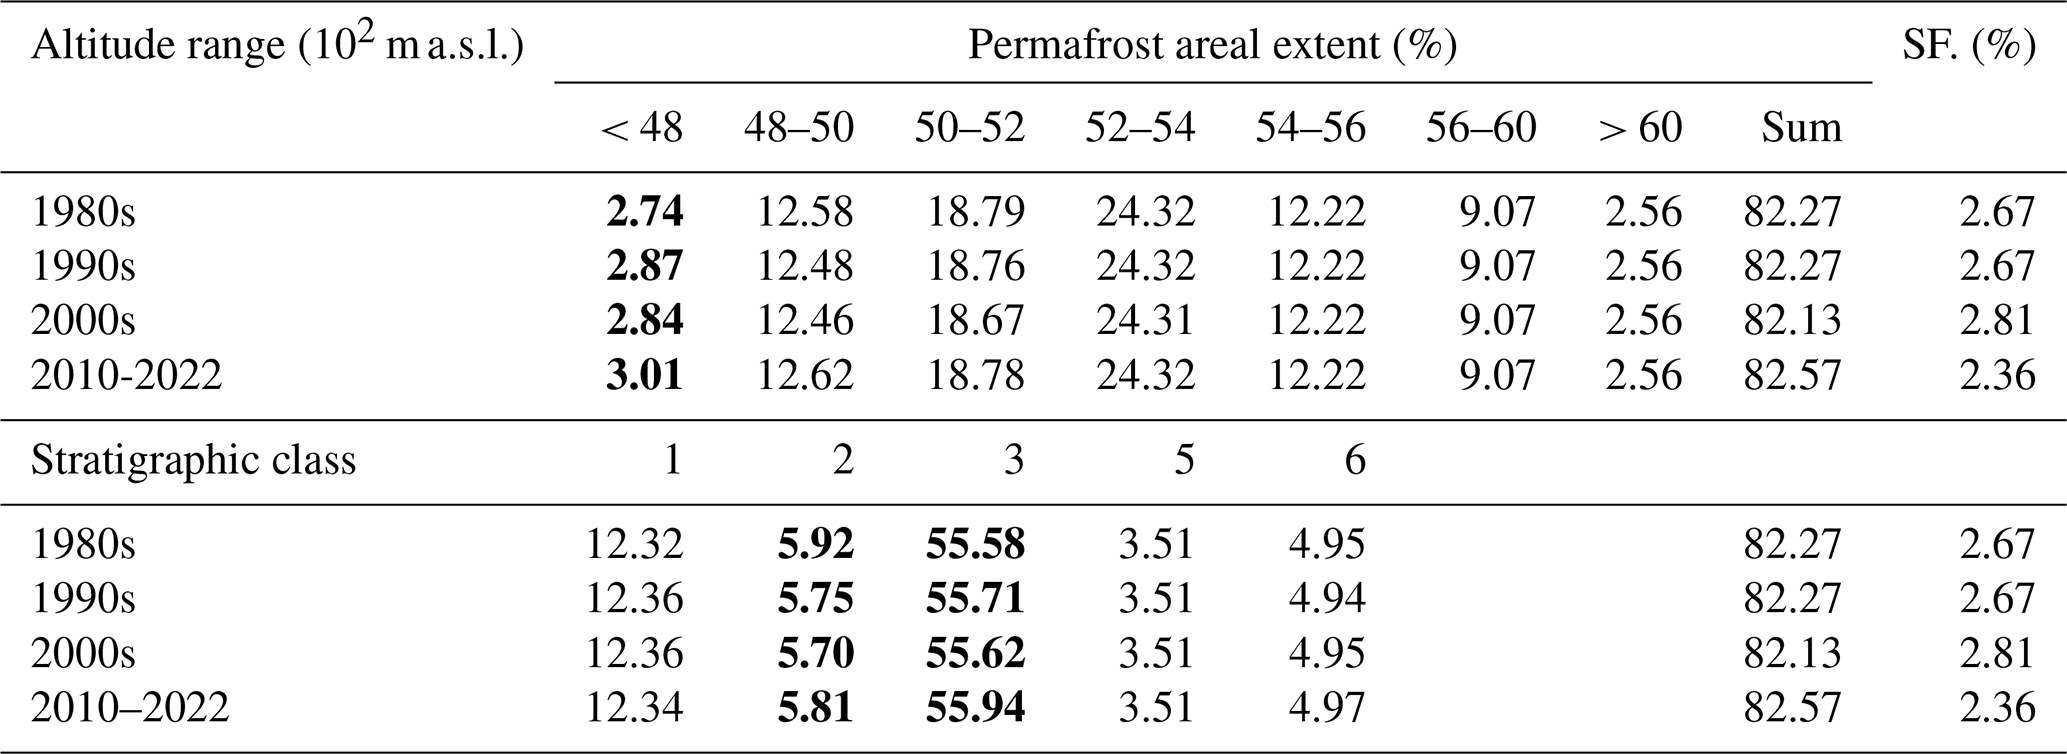
Note that SF. indicates seasonally frozen ground. The numbers for soil stratigraphy correspond to the following sediment classes: (1) glarosion; (2) alluvial plain; (3) eolian, (5) colluvial valley, and (6) lacustrine. The glacier and lake area, accounting for 15.06 %, was excluded from this statistic. The main changes in permafrost extent are highlighted in bold.
5.1 Applicability of the forcing data
Previous studies have shown that coarse-resolution soil temperature products from atmospheric reanalysis datasets, such as ERA-Interim (0.125° × 0.125°) and ERA5-Land (0.1° × 0.1°), as well as assimilated products like the CMA forcing dataset CLDAS (0.0625° × 0.0625°), exhibit substantial uncertainties when applied to the QTP, particularly in permafrost regions (Hu et al., 2019; Yang et al., 2020; Hu et al., 2024). Moreover, at these spatial scales, the forcing data often fail to capture the complex heterogeneity in surface cover and soil moisture that drives spatial variability in ground temperature and ALT across the QTP (Hu et al., 2023a). These limitations contribute to large uncertainties in simulating permafrost thaw depth and often result in degradation rates that deviate from observed trends (Lawrence et al., 2012; Zhao et al., 2024).
In contrast, satellite remote sensing products such as MODIS LST offer a higher spatial resolution and larger regional coverage and, potentially, can better capture surface heterogeneity, thereby reducing modeling uncertainties. However, MODIS LST has several limitations for permafrost modeling applications: it measures the skin temperature rather than the true ground surface temperature, often reflecting the surface temperature of vegetation canopies or snow. Additionally, snow cover introduces thermal insulation effects, cloud cover leads to data gaps, and only clear-sky conditions are captured.
To address these challenges, we used a modified LST product developed by Zou et al. (2017), which incorporates cloud gap filling and calibration with ground-based AWS observations to better account for surface heterogeneity. Validation at three typical permafrost sites in the central permafrost zone and the WKL region demonstrated strong performance. In our study, this product was further improved using a machine learning approach to reconstruct pre-2003 LST by integrating multiple data sources. The reconstructed LST outperformed the original product slightly (R2 > 0.95, MAE = 1.29–1.50 °C, RMSE = 1.62–1.91 °C) and showed significant improvement over ERA5-Land LST.
Direct validation of pre-2003 LST is not possible due to the lack of satellite or ground observations in the WKL region. Thus, we employed an indirect validation approach: the reconstructed LST was used to force the MGPM to simulate permafrost thermal dynamics from 1980 onward. The simulation results were evaluated against existing permafrost monitoring data and previously published permafrost distribution maps from various periods, i.e., the 1980s (Li and Cheng, 1996), the 2000s (Wang et al., 2006), 2010 (Cao et al., 2023), and post-2010 (Zou et al., 2017). The strong agreement between the MGPM outputs and these independent sources supports the reliability of the pre-2003 LST reconstruction. Moreover, our analysis reveals pronounced LST warming in the WKL survey area since the mid-1980s, with accelerated warming over the last decade. This trend aligns with recent documented warming across the QTP (Jin et al., 2011; Yao et al., 2019; You et al., 2021; Li et al., 2024), providing further indirect validation of the reconstructed LST. Collectively, this multi-faceted validation approach provides reasonable confidence in our LST dataset despite the lack of direct early-period observations. While we acknowledge this limitation, we believe our methodology offers a robust solution given the data constraints of this remote and observationally challenging region.
The above comparisons show that the reconstructed LST closely aligns with in situ data and is suitable for ground thermal modeling. However, a seasonal cold bias remains, especially in July–September of Zou_LST (Fig. 3), leading to a slight underestimation of shallow-soil temperatures, resulting in a cold bias in ALT. Such a bias is likely to be due to the sensitivity of near-surface ground temperature to seasonal forcing. Similarly, Westermann et al. (2015) found that an LST uncertainty of ±2 °C can lead to a ±3 cm uncertainty in simulated thaw depth. ERA5-Land skin temperature exhibits a notable winter cold bias over the QTP, likely due to overestimated snow cover persistence and excessive snowfall in the ERA5-Land snow reanalysis product. These factors enhance surface albedo, leading to exaggerated surface cooling – a bias well documented by Cao et al. (2020) and Orsolini et al. (2019). We conducted a sensitivity analysis (Fig. 12) to evaluate the impact of uncertainties in model forcing (e.g., LST) on simulation results, and the findings confirm the model's robustness in relation to LST biases. Moreover, since thermal signals attenuate with depth and because ground temperatures at the ZAA level reflect long-term trends (Jin et al., 2011; Dobiński and Kasprzak, 2022), the observed cold bias appears to be seasonal and has a limited influence on long-term permafrost dynamics.
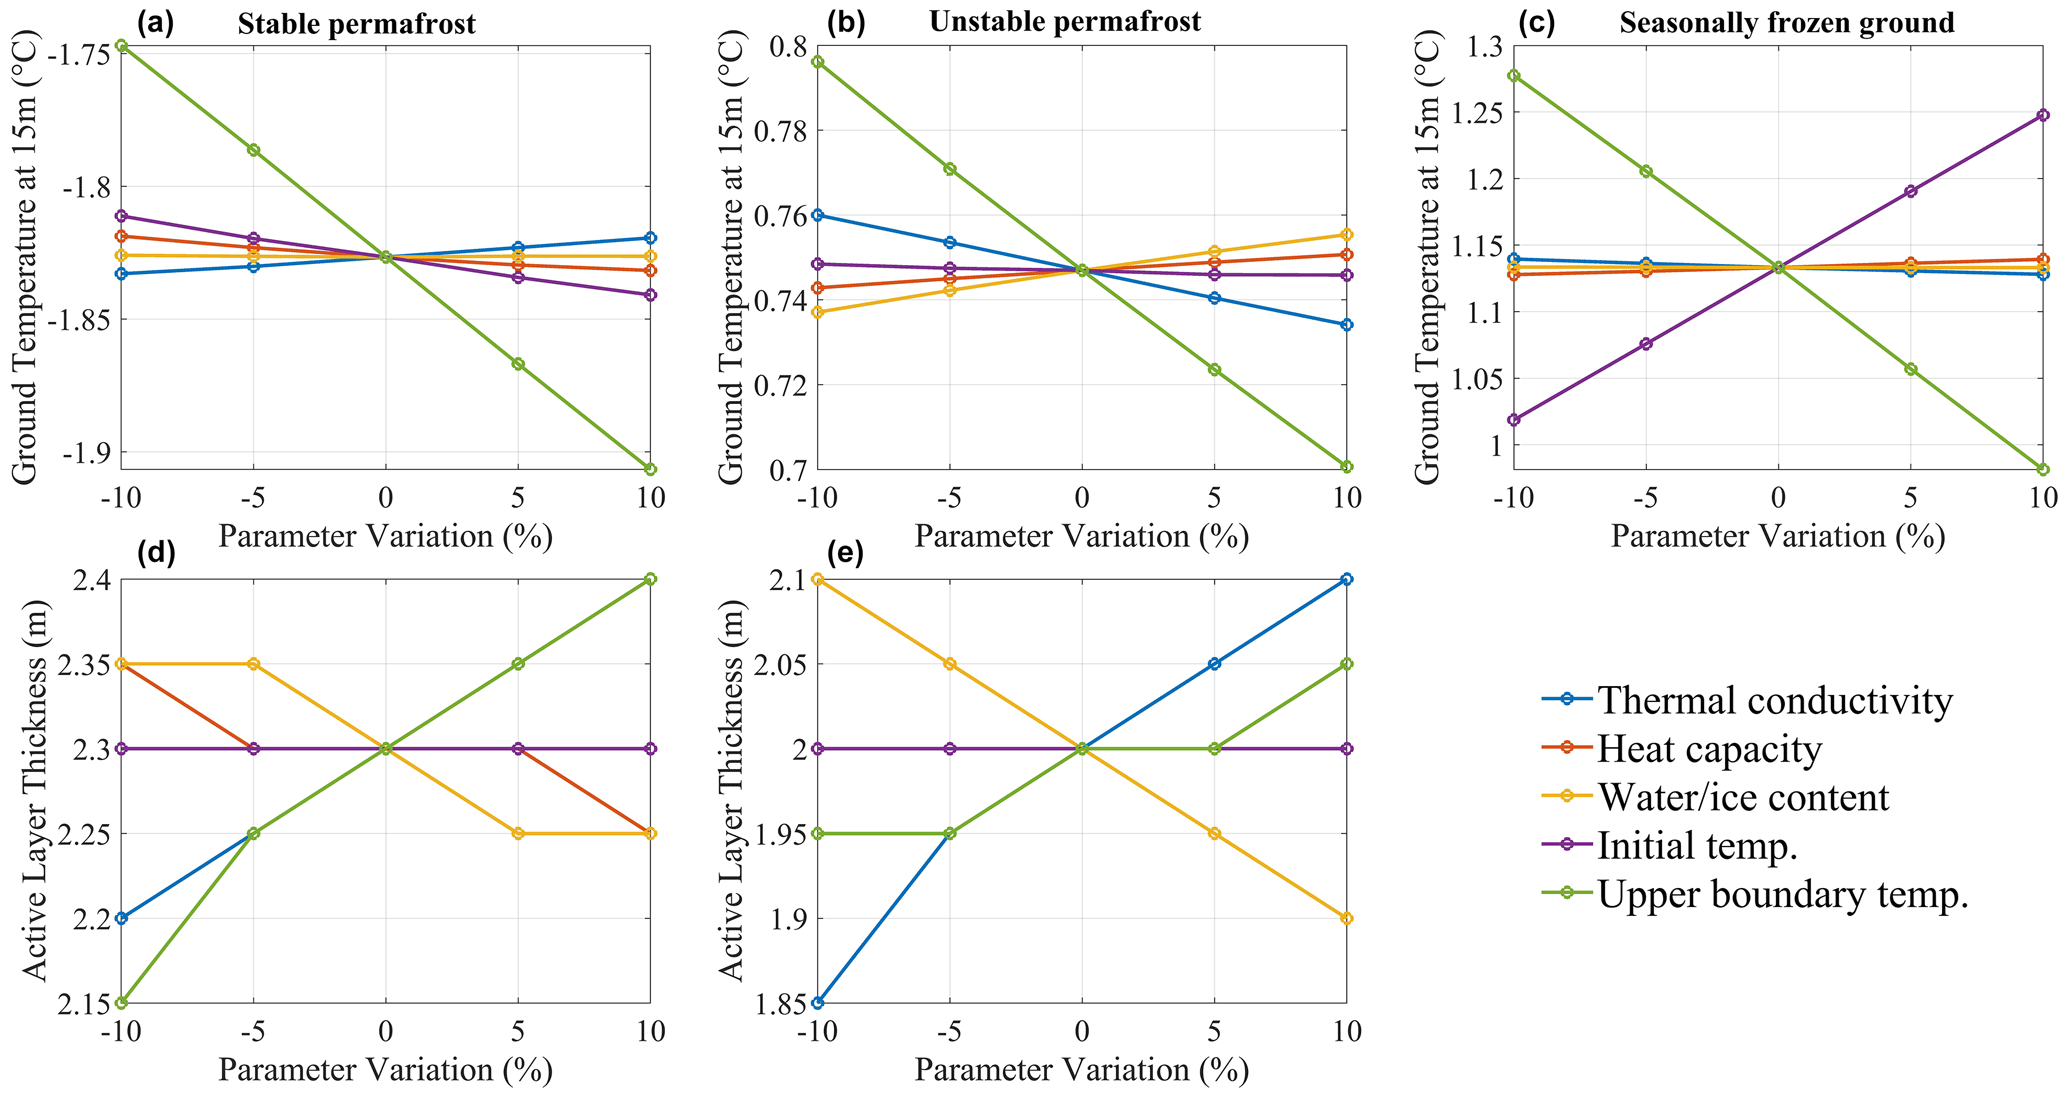
Figure 12One-at-a-time sensitivity analysis showing the effects of ±10 % variation in individual model parameters, e.g., soil thermal conductivity, heat capacity, water and/or ice content, initial temperature, and upper boundary temperature, on (a, b, c) MAGT15m and (d, e) ALT across three ground conditions: stable permafrost (a, d), unstable permafrost (b, e), and seasonally frozen ground (c).
Nonetheless, in complex mountainous terrain, a 1 km × 1 km grid cell is insufficient to capture micro-topographic features such as slope, aspect, and wind-driven snow redistribution – factors that strongly influence local permafrost hydrothermal dynamics. Therefore, our modeling scheme should be considered to be a first-order approximation of permafrost thermal distribution rather than a tool for detailed slope-scale assessments in these areas. In addition, resampling coarse-resolution input datasets to match the model resolution introduces uncertainties into the LST reconstruction process. Despite these limitations, the model successfully reproduces regional permafrost thermal patterns in the WKL area, as confirmed by in situ observations and existing permafrost maps. Although constrained by the spatial resolution of satellite-derived LST, the approach performs well in simulating the thermal state and ALT of permafrost, providing valuable insights for remote, data-scarce regions of the western QTP. Future improvements will require the integration of higher-resolution datasets and enhanced representation of sub-grid variability.
5.2 Permafrost thermal stability and warming trends
Permafrost thermal degradation is a complex and lagged response to climate warming, further modulated by local environmental factors such as soil type, ground ice content, geothermal heat flux, and the initial thermal state of the ground (Zhao et al., 2020, 2024; Hu et al., 2023a). In response to climate change, permafrost does not degrade instantaneously but undergoes a gradual adjustment of its thermal regime over various timescales – ranging from years to centuries or even millennia.
On the QTP, this response is particularly nuanced. Wu et al. (2010) proposed a classification of permafrost degradation stages based on ground temperature profiles, including the warming stage, the zero-geothermal-gradient stage, the talik development stage, and eventual disappearance. These thermal states reflect degradation processes that have been ongoing since the Last Glacial Maximum (LGM), shaped by both climate history and local ground conditions.
Compared to high-latitude permafrost regions in the Arctic and sub-Arctic, permafrost on the QTP is generally warmer and occurs under a relatively higher geothermal gradient. This distinct thermal setting leads to a slower increase in ground temperature and prolongs the degradation response time despite pronounced atmospheric warming (Jin et al., 2011; Zou et al., 2017; Biskaborn et al., 2019). In contrast, Arctic permafrost tends to be colder and more sensitive to warming, resulting in faster thermal responses. These regional differences highlight the importance of accounting for regionally specific thermal regimes when assessing the vulnerability of permafrost to climate change.
Our study investigated the spatiotemporal dynamics of the permafrost thermal regime in the WKL region of the northwestern QTP from 1980 to 2022. The most pronounced warming in MAGT15m and TTOP occurred between the 1990s and 2000s, whereas ALT changes aligned more closely with LST fluctuations, peaking between the 1980s and 1990s. Furthermore, TTOP showed a faster and more intense response to surface warming than the deeper MAGT15m. Furthermore, our simulation results found that approximately 70.98 % of permafrost in the region is currently in a warming phase, characterized by initial MAGT values below −2.0 °C and ALT of less than 1.5 m, predominantly occurring at elevations above 4800 m a.s.l. and experiencing the most pronounced warming. An additional 17.58 % is transitioning toward the zero-geothermal-gradient stage, while only 11.44 % has reached or is progressing toward talik development. These latter zones are typically found at lower elevations (below 4800 m a.s.l.) and are associated with relatively high MAGT15m (above −1 °C), indicating active degradation, where even modest temperature increases.
Permafrost forms when long-term ground surface heat loss exceeds incoming heat under persistently cold climate conditions (Wu et al., 2010). In a warming climate, sustained increases in surface temperature disturb the previous thermal equilibrium, leading to excess heat accumulation in the active layer. This causes progressive ground warming from the surface downward and reduces the vertical thermal gradient within the permafrost. Notably, during the early stages of warming, permafrost temperatures rise more quickly than thaw occurs as much of the energy is used to warm the frozen soil to its thaw point. This explains why the overall areal extent of permafrost distribution in the WKL remained relatively stable during the simulation period despite a pronounced warming trend. Interestingly, while regional average LST showed a steady increase from 1980 to 2022, considerable interannual and spatial variability was simulated. We hypothesize that intermittent cooling episodes may have triggered the formation or re-expansion of permafrost in certain areas through delayed responses, a view supported by our simulation, which showed a slight increase in permafrost extent between 2010 and 2022 despite continued warming.
Looking ahead, under continued climate warming, MAGT is project to increase further. As heat penetrates deeper into the ground, the thermal gradient at the base of the permafrost eventually drops below the geothermal gradient, causing heat to flow upward from the unfrozen substrate. This initiates basal thaw, leading to a gradual upward retreat of the permafrost base and overall thinning of the permafrost layer. Due to its relatively high geothermal gradient, the QTP shows a slower thermal response to atmospheric warming than Arctic and sub-Arctic regions (Jin et al., 2011), resulting in lower rates of ground temperature increase (Zou et al., 2017).
As permafrost temperatures approach 0 °C, ground ice near the permafrost table begins to melt, absorbing large amounts of latent heat, a process known as the “zero-curtain effect”. This effect notably slows or temporarily halts further warming, dampening seasonal temperature fluctuations in the shallow permafrost. At the same time, geothermal heat from below is primarily consumed by bottom-up thawing. The zero geothermal gradient stage marks a critical transitional phase during which nearly all incoming heat is used for ice melt. As a result, permafrost warming during this stage is slower, smaller in magnitude, and less responsive to climate forcing. Once seasonal freezing no longer reaches the permafrost table, a talik – an unfrozen zone within the permafrost – forms and begins to expand. Numerical simulations by Sun et al. (2019) demonstrate that talik development marks a tipping point, triggering accelerated thaw and irreversible permafrost degradation until complete loss.
However, the overall process of permafrost degradation tends to be slow and delayed, particularly in deep permafrost, as confirmed by previous studies showing that permafrost loss, particularly in terms of areal extent, does not follow a linear trajectory and that permafrost thermal responses to climate warming occur more gradually than suggested by many earlier assessments (Guo et al., 2012; Ni et al., 2021). Even under the extreme RCP8.5 scenario, simulations project only gradual deepening of the permafrost table. For example, by 2050, permafrost is still expected to persist at a depth of 40 m at Wudaoliang and Tanggula – two borehole sites in the continuous permafrost zone, where ground temperatures are cold and permafrost layers are thick. In contrast, at Xidatan, located near the lower boundary of the permafrost zone with a warmer, thinner (∼ 32 m) permafrost layer, the permafrost base is projected to retreat more significantly. Nevertheless, simulations suggest that permafrost will still exist at this site through 2100 based on trends in deep-ground temperature, ice content, and thermal gradients. Similar results have been reported for the northern margin of the QTP permafrost zone. MGPM-based modeling (Zhao et al., 2022) indicates that MAGT will continue to rise under gradual warming. Warming rates are projected to be slightly higher under CMIP6 Shared Socioeconomic Pathways (e.g., 0.064 °C yr−1 for SSP5-8.5) compared to CMIP5 Representative Concentration Pathways (e.g., 0.060 °C yr−1 for RCP8.5), but little difference is projected in areal permafrost extent. These findings suggest that, while permafrost temperatures are increasing, spatial loss remains relatively slow – an important consideration for modeling permafrost carbon feedback and related hydrological processes.
It is also important to recognize that the thermal response of permafrost to warming may vary considerably in ice-rich zones, particularly those with excess ground ice. In such areas, thawing of massive ground ice and associated water dynamics significantly shape degradation trajectories, often leading to landscape changes such as surface subsidence and thermokarst pond formation (Westermann et al., 2016). These hydrological feedbacks can either slow or accelerate thaw. Efficient drainage of meltwater delays talik development and surface collapse (Westermann et al., 2016), while surface water accumulation promotes heat transfer and deeper thawing (Nitzbon et al., 2020). These processes increase the potential release of vast stores of frozen organic carbon – particularly CO2 and CH4 – trapped in cold, ice-rich lowlands. Therefore, thermokarst-driven permafrost degradation under continued warming could greatly amplify the global permafrost carbon–climate feedback (Schuur et al., 2015).
5.3 Comparison with previous studies
Global warming has markedly affected permafrost thermal regimes worldwide, yet the mechanisms, rates, and spatial patterns of permafrost responses to climate variability remain poorly understood (Smith et al., 2022; Hu et al., 2023a; Zhao et al., 2024). This is partly due to the limited representation of permafrost thermal dynamics in global models, especially in complex terrains like the QTP, leading to large uncertainties in simulated permafrost change and related climate feedbacks.
In this study, we employed the MGPM framework to simulate permafrost thermal regimes in the WKL region from 1980 to 2022. We quantified spatial changes in both permafrost and seasonally frozen ground and compared our results with four published permafrost distribution maps (see Fig. 9). Overall, our simulated permafrost extent aligns well with existing maps, though discrepancies are notable in areas classified as seasonally frozen ground. Similar inconsistencies were also reported in Zhao et al. (2022) for the Xidatan region of QTP, likely due to differences in model inputs, structures, spatial resolution, study periods, and local environmental factors (Zhao et al., 2022; Zou et al., 2017).
Maps by Li and Cheng (1996) and Wang et al. (2006), derived from field data, aerial photos, and satellite imagery, used coarse-scale topographic maps (1:3 000 000 to 1:4 000 000) and manual delineation based on air temperature or MAGT isotherms. These low-resolution methods introduce substantial uncertainties and are inadequate for capturing fine-scale ground thermal variability or for validating model outputs. In contrast, the maps by Cao et al. (2023) and Zou et al. (2017) and from our simulations utilize enhanced remote sensing LST data at 1 km × 1 km resolution, offering improved accuracy in identifying both permafrost and seasonally frozen ground. These remote-sensing-based approaches also better match borehole observations, highlighting their advantage for regional permafrost mapping on the QTP, as previously noted by Zhao et al. (2022).
However, the equilibrium assumptions underlying the Cao et al. (2023) and Zou et al. (2017) maps – based on climate averages from 2005–2010 and 2003–2012, respectively – do not reflect the current nonequilibrium thermal state of permafrost. Their models typically extend to depths of less than 3 m and fail to capture deeper permafrost dynamics. In areas with supra-permafrost taliks, the TTOP criterion may underestimate permafrost extent. Consequently, these maps likely underestimate permafrost area compared to our transient simulation results (Zhao et al., 2022).
Unlike equilibrium-based models, our approach captures transient responses of permafrost to evolving climate conditions. Results show that permafrost extent in the WKL region remained relatively stable from 1980 to 2022, with less than 0.5 % experiencing degradation or aggradation. This agrees with borehole data (Jin et al., 2011), which indicate greater thermal stability in the QTP's continental interior, particularly in the west and north, where westerlies dominate.
Some studies report more rapid permafrost degradation (Guo et al., 2012; Guo and Wang, 2016; Ni et al., 2021), likely due to model configurations that overlook the lag between atmospheric warming and deep-ground response in regions with thick permafrost. This discrepancy is often due to sparse observations and incomplete understanding of permafrost processes on the QTP (Sun et al., 2019; Hu et al., 2023a). Many models focus on shallow soil layers and neglect coupled heat–moisture dynamics, limiting their ability to simulate long-term changes accurately.
Permafrost on the QTP developed over millennia under cold paleoclimates, resulting in deeply frozen ground rich in ice (Jin et al., 2011; Zhao et al., 2020). Present-day ground temperatures reflect cumulative effects of past climate variability, especially at depths of tens to hundreds of meters (Lachenbruch and Marshall, 1986; Allen et al., 1988; Buteau et al., 2004; Langer et al., 2024). Accurately modeling permafrost therefore requires realistic initial conditions that consider this legacy. However, many models neglect deep legacy effects below 1 m ground ice and oversimplify geothermal heat flux by applying zero-flux or constant-temperature boundaries (Wu et al., 2010; Xiao et al., 2013; Zhao et al., 2022), introducing major uncertainties into both present and future projections.
To improve long-term permafrost simulations in ESMs, we recommend the following key developments: (i) enhance bottom boundary conditions by extending soil profiles to 50–100 m and incorporating realistic geothermal heat fluxes to better capture deep-ground thermal dynamics; (ii) improve vertical resolution and initialization, including high-resolution soil layering, longer spin-up periods, and calibration using in situ data to better capture the thermal memory of deep permafrost; (iii) advance the representation of ground ice processes, including sub-grid variability, the formation and melt of excess and segregated ice, and thaw-induced surface changes such as thermokarst; (iv) improve the accuracy and resolution of climate forcing data; and (v) leverage MGPM outputs to calibrate LSMs, using high-resolution, observation-constrained simulations and remote sensing data to optimize parameters and reduce uncertainties.
5.4 Current model shortcoming and future improvements
5.4.1 Representation of soil stratigraphy
Accurate representation of soil properties is critical for modeling water and heat transport in frozen soils at both global and regional scales (Dai et al., 2019; Lawrence et al., 2008; Harp et al., 2016; Hu et al., 2023a). However, most soil datasets used in models are based on data from seasonally frozen regions, and there remains a notable lack of coverage in the permafrost areas of the QTP, particularly for deeper soil layers (Hengl et al., 2017; Li et al., 2014, 2015; Shangguan et al., 2013). Westermann et al. (2017) addressed similar limitations in the Siberian permafrost region by using geomorphological classification maps to parameterize large-scale patterns of ground thermal properties such as sediment type, ground ice content, and surface characteristics.
In this study, we adopted a comparable approach by applying an existing stratigraphic classification map, gridded at 1 km × 1 km resolution, to represent the spatial distribution of sediment types, ground ice, and surface properties in the WKL region. These classifications were then used to parameterize subsurface properties in our model. However, small-scale heterogeneity in ground conditions may introduce considerable variability into the ground thermal regime, which cannot be resolved at the 1 km × 1 km resolution. Moreover, variability within each sediment class (Table 1) can result in biased model outputs.
To quantify the aforementioned model parameter uncertainty, we conducted a one-at-a-time sensitivity analysis (Fig. 12) using three representative boreholes located in stable permafrost, unstable permafrost, and seasonally frozen ground (see Table 4). Key model parameters were perturbed by ±10 % to evaluate their effects on permafrost thermal regime (MAGT15m and ALT). The results show that, among all parameters, upper boundary temperature (i.e., surface forcing) exerted the strongest influence on MAGT15m, though the absolute impact was modest, around ±0.15 °C in seasonally frozen ground and 0.1 °C in permafrost areas. ALT showed similarly limited sensitivity, varying by ∼ ±0.1 m in stable permafrost and ±0.05 m in unstable zones. Soil thermal conductivity and water and/or ice content had a more pronounced effect on ALT, particularly in unstable permafrost, where a 10 % change could lead to a ±0.10–±0.15 m variation. In contrast, soil heat capacity had minimal influence on both MAGT15m and ALT.
Table 4Description of three representative borehole sites used for one-at-a-time sensitivity analysis.
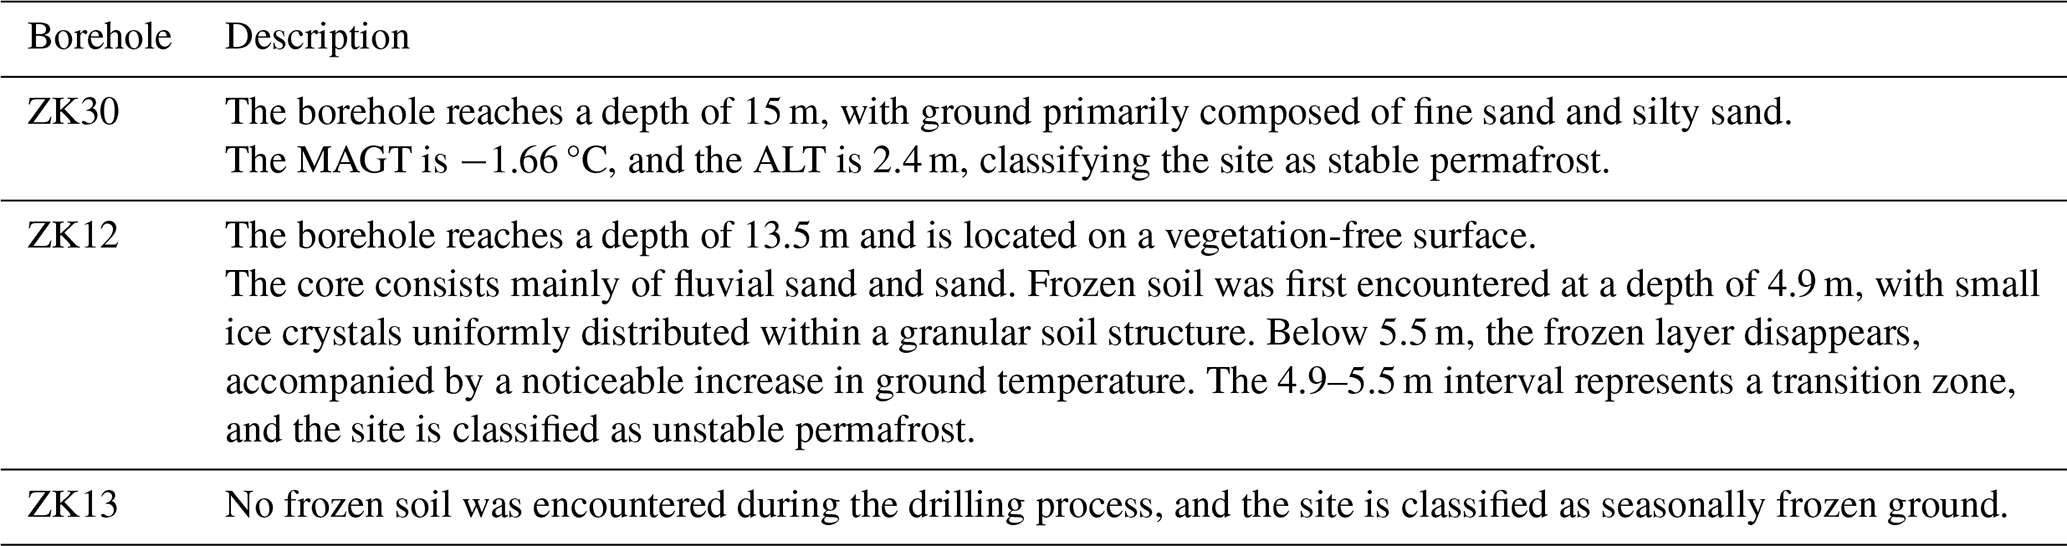
Note that this information is compiled from Li et al. (2012) and Zhao et al. (2019).
The above analysis indicates that the model demonstrates robustness in relation to parameterization uncertainties and that uncertainties associated with stratigraphy have a limited effect on overall performance. Although stratigraphic classification and spatial variability inevitably introduce some degree of uncertainty, our approach is well supported by field measurements and observed thermal properties. Despite these limitations, we are confident that the model accurately represents the key thermal characteristics of each sediment class – key factors for simulating permafrost dynamics. Continued improvements in subsurface datasets, particularly in permafrost regions, will be essential for improving model performance in future applications.
5.4.2 Model initialization
The model assumes equilibrium initial conditions based on the first year's climate forcing, implying a stable land–atmosphere heat exchange prior to 1980. While this setup does not capture transient ground temperature states at that time, its influence diminishes over time. Sensitivity analysis also shows that initial conditions have a limited impact (e.g., moderate in seasonally frozen ground (∼ ±0.12 °C) and negligible in permafrost areas). Moreover, simulated permafrost temperatures, ALT, and thaw depth align well with observations and benchmark maps, suggesting that initialization uncertainties have minimal impact on long-term results.
5.4.3 Model physics
The current MGPM configuration does not include some processes such as soil water convection or lateral heat and water fluxes, which can significantly affect ground thermal regimes, especially near taliks, waterbodies, and permafrost margins (Boike et al., 2015; Bense et al., 2012; Sjöberg et al., 2016; Kurylyk et al., 2016). As a result, the model may not fully capture thermal dynamics in areas with strong lateral fluxes, such as sharp mountain ridges or zones near lakes. Nevertheless, the model performs well in simulating ground temperature and ALT in the WKL region, suggesting that one-dimensional heat conduction captures the dominant thermal processes in this area.
In addition, the subsurface thermal model that is the MGPM uses satellite-derived LST as the upper boundary condition, which does not explicitly account for snow and vegetation canopy effects, potentially introducing uncertainties in densely vegetated areas. However, in the permafrost regions of the QTP, snow cover is typically thin (∼ 3 cm) and short-lived (lasting less than a day per event), and vegetation is sparse, with less than 10 % cover in the west (Wu and Zhang, 2008; Che et al., 2008; Wang et al., 2016; Zou et al., 2017; Orsolini et al., 2019; Yan et al., 2022). Under these conditions, the thermal offset between ground surface temperature (GST) and LST is minimal (Hachem et al., 2012). While thin snow cover may briefly cool the surface due to high albedo and rapid melt (Zhang, 2005), it contributes little thermal insulation, and its effect is likely to be negligible over the decadal timescale of our study. Still, the model's limitations highlight the need for further validation, especially regarding hydrogeological influences on permafrost thermal regimes and improved representation of surface heterogeneity in future developments.
The thermal state of permafrost is vital for understanding climate, ecology, hydrology, and infrastructure stability on the QTP. In this study, we quantitatively assessed the spatiotemporal dynamics of permafrost thermal regimes from 1980 to 2020 in the remote WKL region of the northwestern QTP using the enhanced numerical MGPM. The key conclusions drawn from this study are summarized below:
-
Compared to conventional climate forcing, the reconstructed model forcing enables higher-resolution and more accurate simulations of permafrost thermal states. The MGPM remains stable under model parameter uncertainties, reproducing 10 m ground temperatures within ±0.25 °C and ALT within ±0.25 m throughout the simulation period.
-
Approximately 80 % of permafrost in the WKL region has initial MAGT15m between −7.5 and −1.5 °C. Warmer ground temperatures (∼ −0.5 °C) and deeper ALT (2.5–3.0 m) occur in low-elevation areas (< 4800 m), while colder temperatures (< −10 °C) and shallower ALT (< 1 m) are found at elevations above 5600 m a.s.l. Among soil types, alluvial plains show the deepest ALT (∼ 2.5 m), and glarosion sediments show the shallowest (∼ 1.5 m).
-
From 1980 to 2022, the WKL permafrost region experienced a notable warming trend in LST, averaging 0.40 °C per decade. In response, the most notable increases in MAGT15m occurred between the 1990s and 2000s, while the maximum ALT variations align more closely with LST peaks during the 1980s–1990s.
-
During the same period, about 71 % of permafrost showed signs of warming, mainly at elevations above 4800 m a.s.l. Another 17.6 % is transitioning toward the zero-geothermal-gradient stage, while 11.4 % – mostly in lower areas below 4800 m – has entered or is progressing toward talik formation, indicating potential degradation. Despite these changes, the overall permafrost extent in WKL remained relatively stable, with less than 0.5 % showing signs of recovery or loss over the study period.
In situ monitoring data from field observation sites, provided by the Cryosphere Research Station on the Qinghai–Xizang Plateau of the Chinese Academy of Sciences (CAS), are available at the National Tibetan Plateau Data Center: https://doi.org/10.11888/Geocry.tpdc.271107 (Zhao et al., 2021b) and from Zhao et al. (2021a), as well as in Zhao and Sheng (2019) (Permafrost and environment changes on the Qinghai-Tibetan Plateau, Beijing, China: Science Press).
Enhanced MODIS LST data since 2003 were obtained from Zou et al. (2017).
Daily air temperature and precipitation data from 1961 to 2019 were provided by Qin et al. (2022): https://doi.org/10.1594/PANGAEA.941329 (Qin and Zhang, 2022).
The CN05.1 dataset is available on request from https://ccrc.iap.ac.cn/resource/detail?id=228 (last access: 12 December 2024).
Additional datasets used in this study include the following:
-
skin temperature – ERA5-Land, European Centre for Medium-Range Weather Forecasts (ECMWF): https://doi.org/10.24381/cds.e2161bac (Copernicus Climate Change Service, 2019);
-
soil temperature – NCEP Climate Forecast System Reanalysis (CFSR): https://doi.org/10.5065/D69K487J (Saha et al., 2010b);
-
fractional cloud cover and surface radiation budget – EUMETSAT CM SAF, CLARA_AvHRR_V003: https://doi.org/10.5676/EUM_SAF_CM/CLARA_AVHRR/V003 (Karlsson et al., 2023);
-
leaf area index (LAI): Global Land Surface Satellite (GLASS) and MODIS: https://modis.gsfc.nasa.gov/data/dataprod/mod15.php (last access: 12 December 2024);
-
topography – Shuttle Radar Topography Mission (SRTM), 1 arcsec (∼ 30 m) DEM from CIAT: http://srtm.csi.cgiar.org (last access: 13 July 2025; Jarvis et al., 2008);
-
Tibetan Plateau boundary – Zhang (2019), available from National Tibetan Plateau Data Center (TPDC) (http://data.tpdc.ac.cn/zh-hans/, last access: 12 December 2024);
-
geological sediment classification and lakes: https://doi.org/10.11888/Geogra.tpdc.270104 (Zhou and Cheng, 2019), available from TPDC: http://data.tpdc.ac.cn/zh-hans/ (last access: 12 December 2024);
-
glacier inventory – Second Glacier Inventory Dataset of China (Guo et al., 2015);
-
permafrost distribution maps – Li and Cheng (1996), Wang et al. (2006), Zou et al. (2017), and Cao et al. (2023), all available via TPDC.
The permafrost model source code developed for this study is available upon request from the following co-authors: Jianting Zhao (first author) (jt.zhao@nuist.edu.cn), Lin Zhao (corresponding author) (lzhao@nuist.edu.cn), and Zhe Sun (sunzhe@lzb.ac.cn).
LZ conceived and conceptualized the idea. JZ and ZS developed the methodology. LZ, ZS, GH, and WZ supervised the study. JZ performed the data processing and analyses. LZ, ZS, and GH acquired the funding and provided the resources. DZ, GL, QP, ED, ZL, XW, and YX participated in the fieldwork and maintained the observation sites. JZ wrote the paper, and LZ, ZS, GH, MX, LW, and WZ reviewed and edited the writing.
The contact author has declared that none of the authors has any competing interests.
Publisher’s note: Copernicus Publications remains neutral with regard to jurisdictional claims made in the text, published maps, institutional affiliations, or any other geographical representation in this paper. While Copernicus Publications makes every effort to include appropriate place names, the final responsibility lies with the authors.
Warm thanks are given to all of the scientists, engineers, and students who participated in the field investigations and measurements and helped maintain the observation network for data collection.
Financial support for this research was provided by the National Natural Science Foundation of China (grant nos. 41931180, 42322608, and 42401149); the Second Tibetan Plateau Scientific Expedition and Research (STEP) Program, China (grant no. 2019QZKK0201); the China Postdoctoral Science Foundation funded project (grant no. 2022M721670); and the Guangxi Natural Science Foundation (grant no. 2024GXNSFBA010295). Jianting Zhao was sponsored by the China Scholarship Council (grant no. 202309040044).
This paper was edited by Christian Hauck and reviewed by Rui Chen and Joel Fiddes.
Allen, D. M., Michel, F. A., and Judge, A. S.: The permafrost regime in the Mackenzie Delta, Beaufort Sea region, N.W.T. and its significance to the reconstruction of the paleoclimatic history, J. Quaternary Sci., 3, 3–13, https://doi.org/10.1002/jqs.3390030103, 1988.
Baldwin, J. and Vecchi, G.: Influence of the Tian Shan on arid extratropical Asia, J. Climate, 29, 5741–5762, https://doi.org/10.1175/JCLI-D-15-0490.1, 2016.
Bense, V. F., Kooi, H., Ferguson, G., and Read, T.: Permafrost degradation as a control on hydrogeological regime shifts in a warming climate, J. Geophys. Res.-Earth, 117, F03026, https://doi.org/10.1029/2011JF002143, 2012.
Biskaborn, B. K., Smith, S. L., Noetzli, J., Matthes, H., Vieira, G., Streletskiy, D. A., Schoeneich, P., Romanovsky, V. E., Lewkowicz, A. G., Abramov, A., Allard, M., Boike, J., Cable, W. L., Christiansen, H. H., Delaloye, R., Diekmann, B., Drozdov, D., Etzelmüller, B., Grosse, G., Guglielmin, M., Ingeman-Nielsen, T., Isaksen, K., Ishikawa, M., Johansson, M., Johannsson, H., Joo, A., Kaverin, D., Kholodov, A., Konstantinov, P., Kröger, T., Lambiel, C., Lanckman, J.-P., Luo, D., Malkova, G., Meiklejohn, I., Moskalenko, N., Oliva, M., Phillips, M., Ramos, M., Sannel, A. B. K., Sergeev, D., Seybold, C., Skryabin, P., Vasiliev, A., Wu, Q., Yoshikawa, K., Zheleznyak, M., and Lantuit, H.: Permafrost is warming at a global scale, Nat. Commun., 10, 264, https://doi.org/10.1038/s41467-018-08240-4, 2019.
Boike, J., Georgi, C., Kirilin, G., Muster, S., Abramova, K., Fedorova, I., Chetverova, A., Grigoriev, M., Bornemann, N., and Langer, M.: Thermal processes of thermokarst lakes in the continuous permafrost zone of northern Siberia – observations and modeling (Lena River Delta, Siberia), Biogeosciences, 12, 5941–5965, https://doi.org/10.5194/bg-12-5941-2015, 2015.
Breiman, L.: Random forests, Mach. Learn., 45, 5–32, https://doi.org/10.1023/A:1010933404324, 2001.
Burke, E. J., Zhang, Y., and Krinner, G.: Evaluating permafrost physics in the Coupled Model Intercomparison Project 6 (CMIP6) models and their sensitivity to climate change, The Cryosphere, 14, 3155–3174, https://doi.org/10.5194/tc-14-3155-2020, 2020.
Buteau, S., Fortier, R., Delisle, G., and Allard, M.: Numerical simulation of the impacts of climate warming on a permafrost mound, Permafrost Periglac., 15, 41–57, https://doi.org/10.1002/ppp.474, 2004.
Cable, W. L., Romanovsky, V. E., and Jorgenson, M. T.: Scaling-up permafrost thermal measurements in western Alaska using an ecotype approach, The Cryosphere, 10, 2517–2532, https://doi.org/10.5194/tc-10-2517-2016, 2016.
Cannon, F., Carvalho, L. M. V., Jones, C., and Norris, J.: Winter westerly disturbance dynamics and precipitation in the Western Himalaya and Karakoram: A wave-tracking approach, Theor. Appl. Climatol., 125, 27–44, https://doi.org/10.1007/s00704-015-1489-8, 2016.
Cao, Z., Nan, Z., Hu, J., Chen, Y., and Zhang, Y.: A new 2010 permafrost distribution map over the Qinghai–Tibet Plateau based on subregion survey maps: a benchmark for regional permafrost modeling, Earth Syst. Sci. Data, 15, 3905–3930, https://doi.org/10.5194/essd-15-3905-2023, 2023.
Cao, B., Gruber, S., Zheng, D., and Li, X.: The ERA5-Land soil temperature bias in permafrost regions, The Cryosphere, 14, 2581–2595, https://doi.org/10.5194/tc-14-2581-2020, 2020.
Che, T., Xin, L., Jin, R., Armstrong, R., and Zhang, T.: Snow depth derived from passive microwave remote-sensing data in China, Ann. Glaciol., 49, 145–154, https://doi.org/10.3189/172756408787814690, 2008.
Chen, H., Nan, Z., Zhao, L., Ding, Y., Chen, J., and Pang, Q.: Noah modelling of the permafrost distribution and characteristics in the West Kunlun area, Qinghai–Tibet Plateau, China, Permafrost Periglac., 26, 160–174, https://doi.org/10.1002/ppp.1841, 2015.
Cheng, G., Zhao, L., Li, R., Wu, X., Sheng, Y., Hu, G., Zou, D., Jin, H., Li, X., and Wu, Q.: Characteristic, changes and impacts of permafrost on Qinghai–Tibet Plateau, Chin. Sci. Bull., 64, 2783–2795, https://doi.org/10.1360/TB-2019-0191, 2019 (in Chinese with English abstract).
Copernicus Climate Change Service (C3S): ERA5-Land hourly data from 1950 to present, Copernicus Climate Change Service (C3S) Climate Data Store (CDS) [data set], https://doi.org/10.24381/cds.e2161bac, 2019.
Dai, Y., Shangguan, W., Wei, N., Xin, Q., Yuan, H., Zhang, S., Liu, S., Lu, X., Wang, D., and Yan, F.: A review of the global soil property maps for Earth system models, SOIL, 5, 137–158, https://doi.org/10.5194/soil-5-137-2019, 2019.
Dobiński, W. and Kasprzak, M.: Permafrost Base Degradation: Characteristics and Unknown Thread with Specific Example from Hornsund, Svalbard, Front. Earth Sci., 10, 802157, https://doi.org/10.3389/feart.2022.802157, 2022.
Fiddes, J., Endrizzi, S., and Gruber, S.: Large-area land surface simulations in heterogeneous terrain driven by global data sets: application to mountain permafrost, The Cryosphere, 9, 411–426, https://doi.org/10.5194/tc-9-411-2015, 2015.
Guo, D. and Wang, H.: CMIP5 permafrost degradation projection: a comparison among different regions, J. Geophys. Res.-Atmos., 121, 4499–4517, https://doi.org/10.1002/2015JD024108, 2016.
Guo, D., Wang, H., and Li, D.: A projection of permafrost degradation on the Tibetan Plateau during the 21st century, J. Geophys. Res.-Atmos., 117, D05106, https://doi.org/10.1029/2011JD016545, 2012.
Guo, D., Wang, H., and Wang, A.: Sensitivity of historical simulation of the permafrost to different atmospheric forcing data sets from 1979 to 2009, J. Geophys. Res.-Atmos., 122, 12269–12286, https://doi.org/10.1002/2017JD027477, 2017.
Guo, W., Liu, S., Xu, J., Wu, L., Shangguan, D., Yao, X., Wei, J., Bao, W., Yu, P., and Liu, Q.: The second Chinese glacier inventory: data, methods and results, J. Glaciol., 61, 357–372, 2015.
Hachem, S., Duguay, C. R., and Allard, M.: Comparison of MODIS-derived land surface temperatures with ground surface and air temperature measurements in continuous permafrost terrain, The Cryosphere, 6, 51–69, https://doi.org/10.5194/tc-6-51-2012, 2012.
Harp, D. R., Atchley, A. L., Painter, S. L., Coon, E. T., Wilson, C. J., Romanovsky, V. E., and Rowland, J. C.: Effect of soil property uncertainties on permafrost thaw projections: a calibration-constrained analysis, The Cryosphere, 10, 341–358, https://doi.org/10.5194/tc-10-341-2016, 2016.
Hengl, T., Mendes de Jesus, J., Heuvelink, G. B., Ruiperez Gonzalez, M., Kilibarda, M., Blagotić, Shangguan, W., Wright, M. N., Geng, X., Marschallinger, B. B., Guevara, M., Vargas, R., MacMillan, R. A., Batjes, N. H., Leenaars, J. Ribeiro, E., Wheeler, I., Mantel, S., and Kempen, B.: SoilGrids250m: Global gridded soil information based on machine learning, PLoS One, 12, e0169748, https://doi.org/10.1371/journal.pone.0169748, 2017.
Hjort, J., Streletskiy, D., Doré, G., Wu, Q., Bjella, K., and Luoto, M.: Impacts of permafrost degradation on infrastructure, Nat. Rev. Earth Environ., 3, 24–38, https://doi.org/10.1038/s43017-021-00247-8, 2022.
Hu, G., Zhao, L., Li, R., Wu, X., Wu, T., Xie, C., Zhu, X., and Su, Y.: Variations in soil temperature from 1980 to 2015 in permafrost regions on the Qinghai-Tibetan Plateau based on observed and reanalysis products, Geoderma, 337, 893–905, https://doi.org/10.1016/j.geoderma.2018.10.044, 2019.
Hu, G., Zhao, L., Li, R., Park, H., Wu, X., Su, Y., Guggenberger, G., Wu, T., Zou, D., Zhu, X., Zhang, W., Wu, Y., and Hao, J: Water and heat coupling processes and its simulation in frozen soils: Current status and future research directions, Catena, 222, 106844, https://doi.org/10.1016/j.catena.2022.106844, 2023a.
Hu, J., Zhao, L., Wang, C., Hu, G., Zou, D., Xing, Z., Jiao, M., Qiao, Y., Liu, G., and Du, E.: Applicability evaluation and correction of CLDAS surface temperature products in permafrost region of Qinghai-Tibet Plateau, Climate Change Research, 20, 10-2-5, https://doi.org/10.12006/j.issn.1673-1719.2023.033, 2024 (in Chinese with English abstract).
Hu, S., He, L., and Wang, J.: Heat flow in the continental area of China: a new data set, Earth Planet. Sc. Lett., 179, 407–419, https://doi.org/10.1016/S0012-821X(00)00126-6, 2000.
Hu, Y., Liu, L., Huang, L., Zhao, L., Wu, T., Wang, X., and Cai, J.: Mapping and characterizing rock glaciers in the arid Western Kunlun Mountains supported by InSAR and deep learning, J. Geophys. Res.-Earth, 128, e2023JF007206, https://doi.org/10.1029/2023JF007206, 2023b.
IPCC: Climate change 2021: the physical science basis, https://www.ipcc.ch/report/ar6/wg1/downloads/report/IPCC_AR6_WGI_Full_Report.pdf (last access: 12 September 2025), 2021.
IPCC: Special report on the ocean and cryosphere in a changing climate, https://www.ipcc.ch/srocc/ (last access: 12 September 2025), 2019.
Jafarov, E. E., Marchenko, S. S., and Romanovsky, V. E.: Numerical modeling of permafrost dynamics in Alaska using a high spatial resolution dataset, The Cryosphere, 6, 613–624, https://doi.org/10.5194/tc-6-613-2012, 2012.
Jarvis, A., Reuter, H., Nelson, A., and Guevara, E.: Hole-filled seamless SRTM data V4, Tech. rep., International Centre for Tropical Agriculture (CIAT), Cali, Colombia, https://srtm.csi.cgiar.org/ (last access: 20 May 2025), 2008.
Jiao, M., Zhao, L., Wang, C., Hu, G., Li, Y., Zhao, J., Zou, D., Xing, Z., Qiao, Y., Liu, G., Du, E., Xiao, M., and Hou, Y.: Spatiotemporal variations of soil temperature at 10 and 50 cm depths in permafrost regions along the Qinghai-Tibet engineering corridor, Remote Sens., 15, 455, https://doi.org/10.3390/rs15020455, 2023.
Jin, H., Yu, Q., Wang, S., and Lü, L.: Changes in permafrost environments along the Qinghai–Tibet engineering corridor induced by anthropogenic activities and climate warming, Cold Reg. Sci. Technol., 53, 317–333, https://doi.org/10.1016/j.coldregions.2007.07.005, 2008.
Jin, H., Luo, D., Wang, S., Lü, L., and Wu, J.: Spatiotemporal variability of permafrost degradation on the Qinghai-Tibet Plateau, Sci. Cold Arid Reg., 3, 281–305, https://doi.org/10.3724/SP.J.1226.2011.00281, 2011.
Jin, H., Wu, Q., and Romanovsky, V.: E. Degrading permafrost and its impacts, Adv. Clim. Chang. Res., 12, 1–5, https://doi.org/10.1016/j.accre.2021.01.007, 2021.
Karlsson, K.-G., Riihelä, A., Trentmann, J., Stengel, M., Solodovnik, I., Meirink, J. F., Devasthale, A., Jääskeläinen, E., Kallio-Myers, V., Eliasson, S., Benas, N., Johansson, E., Stein, D., Finkensieper, S., Håkansson, N., Akkermans, T., Clerbaux, N., Selbach, N., Schröder, M., and Hollmann, R.: CLARA-A3: CM SAF cLoud, Albedo and surface RAdiation dataset from AVHRR data – Edition 3, Satellite Application Facility on Climate Monitoring [data set], https://doi.org/10.5676/EUM_SAF_CM/CLARA_AVHRR/V003, 2023.
Koven, C., William J., and Alex S.: Analysis of Permafrost Thermal Dynamics and Response to Climate Change in the CMIP5 Earth System Models, J. Climate, 26, 1877–1900, https://doi.org/10.1175/JCLI-D-12-00228.1, 2013.
Kurylyk, B. L., Hayashi, M., Quinton, W. L., McKenzie, J. M., and Voss, C. I. Influence of vertical and lateral heat transfer on permafrost thaw, peatland landscape transition, and groundwater flow, Water Resour. Res., 52, 1286–1305, https://doi.org/10.1002/2015WR018057, 2016.
Lachenbruch, A. H. and Marshall, B. V.: Changing Climate: Geothermal Evidence from Permafrost in the Alaskan Arctic, Science, 234, 689–696, https://doi.org/10.1126/science.234.4777.689, 1986.
Lafrenière, M. and Lamoureux, S.: Effects of changing permafrost conditions on hydrological processes and fluvial fluxes, Earth-Sci. Rev., 191, 212–223, https://doi.org/10.1016/j.earscirev.2019.02.018, 2019.
Langer, M., Westermann, S., Heikenfeld, M., Dorn, W., and Boike, J.: Satellite-based modeling of permafrost temperatures in a tundra lowland landscape, Remote Sens. Environ., 135, 12–24, https://doi.org/10.1016/j.rse.2013.03.011, 2013.
Langer, M., Nitzbon, J., Groenke, B., Assmann, L.-M., Schneider von Deimling, T., Stuenzi, S. M., and Westermann, S.: The evolution of Arctic permafrost over the last 3 centuries from ensemble simulations with the CryoGridLite permafrost model, The Cryosphere, 18, 363–385, https://doi.org/10.5194/tc-18-363-2024, 2024.
Lawrence, D. M., Slater, A. G., Romanovsky, V. E., and Nicolsky, D. J.: Sensitivity of a model projection of near-surface permafrost degradation to soil column depth and representation of soil organic matter, J. Geophys. Res.-Earth Surface, 113, https://doi.org/10.1029/2007JF000883, 2008.
Lawrence, D. M., Slater, A. G., and Swenson, S. C.: Simulation of Present-Day and Future Permafrost and Seasonally Frozen Ground Conditions in CCSM4, J. Climate, 25, 2207–2225, https://doi.org/10.1175/JCLI-D-11-00334.1, 2012.
Li, S. and Cheng, G.: Map of Frozen Ground on Qinghai-Xizang Plateau, Gansu Culture Press, Lanzhou, 1996.
Li, S. and Li, S.: Significance and research on the two boreholes of Tianshuihai in the west Kunlun Mountains, J. Glaciol. Geocryol., 13, 133–137, 1991 (in Chinese with English abstract).
Li, K., Chen, J., Zhao, L., Zhang, X., Pang, Q., Fang, H., and Liu, G.: Permafrost distribution in a typical area of the western Kunlun Mountains derived from a comprehensive survey, J. Glaciol. Geocryol., 34, 1325–1332, 2012 (in Chinese with English abstract).
Li, N., Cuo, L., Zhang, Y., and Ding, J.: The synthesis of potential factors contributing to the asynchronous warming between air and shallow ground since the 2000s on the Tibetan Plateau, Geoderma, 441, 116753, https://doi.org/10.1016/j.geoderma.2023.116753, 2024.
Li, W., Zhao, L., Wu, X., Wang, S., Nan, Z., Fang, H., and Shi, W.: Distribution of Soils and Landform Relationships in Permafrost Regions of the Western Qinghai-Xizang (Tibetan) Plateau, China, Soil. Sci., 179, 348–357, https://doi.org/10.1097/SS.0000000000000075, 2014.
Li, W., Zhao, L., Wu, X., Zhao, Y., Fang, H., and Shi, W.: Distribution of soils and landform relationships in the permafrost regions of Qinghai-Xizang (Tibetan) Plateau, Chinese Sci. Bull., 60, 2216–2226, https://doi.org/10.1360/N972014-01206, 2015.
Liu, G., Xie, C., Zhao, L., Xiao, Y., Wu, T., Wang, W., and Liu, W.: Permafrost warming near the northern limit of permafrost on the Qinghai–Tibetan Plateau during the period from 2005 to 2017, A case study in the Xidatan area, Permafrost Periglac., 32, 323–334, https://doi.org/10.1002/ppp.2089, 2020.
Liang, S., Cheng, C., Jia, K., Jiang, B., Liu, Q., Xiao, Z., Yao, Y., Yuan, W., Zhang, X., Zhao, X., and Zhou, J.: The Global LAnd Surface Satellite (GLASS) products suite, B. Am. Meteorol. Soc., https://doi.org/10.1175/BAMS-D-18-0341.1, 2020.
Marchenko, S. S., Bjella, K., Nicolsky, D. J., and Romanovsky, V. E.: Modeling Dynamics of Permafrost Degradation and their Impact on Ecosystems Across Entire Alaska: Arctic and Subarctic Engineering Design Tool (Part-1), Preprints, 2024030927, https://doi.org/10.20944/preprints202403.0927.v2, 2024.
Miner, K., D'Andrilli, J., Mackelprang, R., Edwards, A., Malaska, M., Waldrop, M., and Miller, C.: Emergent biogeochemical risks from Arctic permafrost degradation. Nat. Clim. Change, 11, 809–819, https://doi.org/10.1038/s41558-021-01162-y, 2021.
Muñoz-Sabater, J., Dutra, E., Agustí-Panareda, A., Albergel, C., Arduini, G., Balsamo, G., Boussetta, S., Choulga, M., Harrigan, S., Hersbach, H., Martens, B., Miralles, D. G., Piles, M., Rodríguez-Fernández, N. J., Zsoter, E., Buontempo, C., and Thépaut, J.-N.: ERA5-Land: a state-of-the-art global reanalysis dataset for land applications, Earth Syst. Sci. Data, 13, 4349–4383, https://doi.org/10.5194/essd-13-4349-2021, 2021.
Ni, J., Wu, T., Zhu, X., Hu, G., Zou, D., Wu, X., Li, R., Xie, C., Qiao, Y., Pang, Q., Hao, J., and Yang, C.: Simulation of the present and future projection of permafrost on the Qinghai-Tibet Plateau with statistical and machine learning models, J. Geophys. Res.-Atmos, 126, e2020JD033402, https://doi.org/10.1029/2020JD033402, 2021
Nicolsky, D. J., Romanovsky, V. E., and Tipenko, G. S.: Using in-situ temperature measurements to estimate saturated soil thermal properties by solving a sequence of optimization problems, The Cryosphere, 1, 41–58, https://doi.org/10.5194/tc-1-41-2007, 2007.
Nicolsky, D. J., Romanovsky, V. E., Panda, S. K., Marchenko, S. S., and Muskett, R. R.: Applicability of the ecosystem type approach to model permafrost dynamics across the Alaska North Slope, J. Geophys. Res.-Earth, 122, 50–75, https://doi.org/10.1002/2016JF003852, 2017.
Nitzbon, J., Westermann, S., Langer, M., Martin, L., Strauss, L., Laboor, S., and Boike, J.: Fast response of cold ice-rich permafrost in northeast Siberia to a warming climate, Nat. Commun., 11, 2201, https://doi.org/10.1038/s41467-020-15725-8, 2020.
O'Neill, H., Burn, C., Allard, M., Arenson, L., Bunn, M., Connon, R., Kokelj, S., LeBlanc, A., Morse, P., and Smith, S.: Permafrost thaw and northern development, Nat. Clim. Change, 10, 722–723, https://doi.org/10.1038/s41558-020-0862-5, 2020.
Orsolini, Y., Wegmann, M., Dutra, E., Liu, B., Balsamo, G., Yang, K., de Rosnay, P., Zhu, C., Wang, W., Senan, R., and Arduini, G.: Evaluation of snow depth and snow cover over the Tibetan Plateau in global reanalyses using in situ and satellite remote sensing observations, The Cryosphere, 13, 2221–2239, https://doi.org/10.5194/tc-13-2221-2019, 2019.
Qin, R. and Zhang, F.: HRLT: A high-resolution (1 day, 1 km) and long-term (1961–2019) gridded dataset for temperature and precipitation across China, PANGAEA [data set], https://doi.org/10.1594/PANGAEA.941329, 2022.
Qin, R., Zhao, Z., Xu, J., Ye, J.-S., Li, F.-M., and Zhang, F.: HRLT: a high-resolution (1 d, 1 km) and long-term (1961–2019) gridded dataset for surface temperature and precipitation across China, Earth Syst. Sci. Data, 14, 4793–4810, https://doi.org/10.5194/essd-14-4793-2022, 2022.
Schiesser, W.: The Numerical Method of Lines: Integration of Partial Differential Equations, Academic Press, San Diego, USA, Vol. 212, ISBN 0-12-624130-9, 1991.
Schuur, E., McGuire, A., Schadel, C., Grosse, G., Harden, J., Hayes, D., Hugelius, G., Koven, C., Kuhry, P., Lawrence, D., Natali, S., Olefeldt, D., Romanovsky, V., Schaefer, K., Turetsky, M., Treat, C., and Vonk, J.: Climate change and the permafrost carbon feedback, Nature, 520, 171–179, https://doi.org/10.1038/nature14338, 2015.
Shangguan, W., Dai, Y., Liu, B., Zhu., A., Duan, Q., Wu, L., Ji, D., Ye, A., Yuan, H., Zhang, Q., Chen, D., Chen, M., Chu, J., Dou, Y., Guo, J., Li, H., Li, J., Liang, L., Liang, X., Liu, H., Liu, S., Miao, C., and Zhang, Y.: A China data set of soil properties for land surface modeling, J. Adv. Model. Earth Sy., 5, 212–224, https://doi.org/10.1002/jame.20026, 2013.
Sjöberg, Y., Coon, E., Sannel, A., Pannetier, R., Harp, D., Frampton, A., Painter, S., and Lyon, S. W.: Thermal effects of groundwater flow through subarctic fens: a case study based on field observations and numerical modeling, Water Resour. Res., 52, 1591–1606, https://doi.org/10.1002/2015WR017571, 2016.
Saha, S., Moorthi, S., Pan, H.-L., Wu, X., Wang, J., Nadiga, S., Tripp, P., Kistler, R., Woollen, J., Behringer, D., Liu, H., Stokes, D., Grumbine, R., Gayno, G., Wang, J., Hou, Y.-T., Chuang, H.-Y., Juang, H.-M. H., Sela, J., Iredell, M., Treadon, R., Kleist, D., Van Delst, P., Keyser, D., Derber, J., Ek, M., Meng, J., Wei, H., Yang, R., Lord, S., van den Dool, H., Kumar, A., Wang, W., Long, C., Chelliah, M., Xue, Y., Huang, B., Schemm, J.-K., Ebisuzaki, W., Lin, R., Xie, P., Chen, M., Zhou, S., Higgins, W., Zou, C.-Z., Liu, Q., Chen, Y., Han, Y., Cucurull, L., Reynolds, R. W., Rutledge, G., and Goldberg, M.: The NCEP Climate Forecast System Reanalysis, B. Am. Meteorol. Soc., 91, 1015–1058, https://doi.org/10.1175/2010BAMS3001.1, 2010a.
Saha, S., et al.: NCEP Climate Forecast System Reanalysis (CFSR) 6-hourly Products, January 1979 to December 2010. Research Data Archive at the National Center for Atmospheric Research, Computational and Information Systems Laboratory [data set], https://doi.org/10.5065/D69K487J, 2010b.
Slater, A. G. and Lawrence, D. M.: Diagnosing present and future permafrost from climate models, J. Climate, 26, 5608e5623, https://doi.org/10.1175/jcli-d-12-00341.1, 2013
Smith, S., O'Neill, H., Isaksen, K., Noetzli, J., and Romanovsky, V.: The changing thermal state of permafrost, Nat. Rev. Earth Environ., 3, 10–23, https://doi.org/10.1038/s43017-021-00240-1, 2022.
Su, B., Huang, J., Gemmer, M., Jian, D., Tao, H., Jiang, T., and Zhao, C.: Statistical downscaling of CMIP5 multi-model ensemble for projected changes of climate in the Indus River Basin, Atmos. Res., 178, 138–149, https://doi.org/10.1016/j.atmosres.2016.03.023 ,2016.
Sun, Z., Zhao, L., Hu, G., Qiao, Y., Du, E., Zou, D., and Xie, C.: Modeling permafrost changes on the Qinghai-Tibetan plateau from 1966 to 2100: a case study from two boreholes along the Qinghai-Tibet engineering corridor, Permafrost Periglac., 32, 156–171, https://doi.org/10.1002/ppp.2022, 2019.
Sun, Z., Zhao, L., Hu, G., Zhou, H., Liu, S., Qiao, Y., Du, E., Zou, D., and Xie, C.: Numerical simulation of thaw settlement and permafrost changes at three sites along the Qinghai-Tibet Engineering Corridor in a warming climate, Geophys. Res. Lett., 49, e2021GL097334, https://doi.org/10.1029/2021GL097334, 2022.
Sun, Z., Zhao, L., Hu, G., Zhou, H., Liu, S., Qiao, Y., Du, E., Zou, D., and Xie, C.: Effects of Ground Subsidence on Permafrost Simulation Related to Climate Warming, Atmosphere, 15, 12, https://doi.org/10.3390/atmos15010012, 2023.
Walvoord, M. and Kurylyk, B.: Hydrologic Impacts of Thawing Permafrost – A Review, Vadose Zone J., 15, vzj2016.01.0010, https://doi.org/10.2136/vzj2016.01.0010, 2016.
Wang, L., Zhao, L., Zhou, H., Liu, S., Hu, G., Li, Z., Wang, C., and Zhao, J.: Evidence of ground ice melting detected by InSAR and in situ monitoring over permafrost terrain on the Qinghai-Xizang (Tibet) Plateau, Permafrost Periglac., 34, 52–67, https://doi.org/10.1002/ppp.2171, 2023.
Wang, T., Wang, N., and Li, S.: Map of the glaciers, frozen ground and desert in China, 1:4000000, Chinese Map Press, Beijing, China, SSN 7503139889, 2006.
Wang, W., Rinke, A., Moore, J. C., Cui, X., Ji, D., Li, Q., Zhang, N., Wang, C., Zhang, S., Lawrence, D. M., McGuire, A. D., Zhang, W., Delire, C., Koven, C., Saito, K., MacDougall, A., Burke, E., and Decharme, B.: Diagnostic and model dependent uncertainty of simulated Tibetan permafrost area, The Cryosphere, 10, 287–306, https://doi.org/10.5194/tc-10-287-2016, 2016.
Wang, Z., Wang, Q., Zhao, L., Wu, X., Yue, G., Zou, D., Nan, Z., Liu, G., Pang, Q., Fang, H., Wu, T., Shi, J., Jiao, K., Zhao, Y., and Zhang, L.: Mapping the vegetation distribution of the permafrost zone on the Qinghai-Tibet Plateau, J. Mt. Sci., 13, 1035–1046, 2016.
Westermann, S., Schuler, T. V., Gisnås, K., and Etzelmüller, B.: Transient thermal modeling of permafrost conditions in Southern Norway, The Cryosphere, 7, 719–739, https://doi.org/10.5194/tc-7-719-2013, 2013.
Westermann, S., Østby, T. I., Gisnås, K., Schuler, T. V., and Etzelmüller, B.: A ground temperature map of the North Atlantic permafrost region based on remote sensing and reanalysis data, The Cryosphere, 9, 1303–1319, https://doi.org/10.5194/tc-9-1303-2015, 2015.
Westermann, S., Langer, M., Boike, J., Heikenfeld, M., Peter, M., Etzelmüller, B., and Krinner, G.: Simulating the thermal regime and thaw processes of ice-rich permafrost ground with the land-surface model CryoGrid 3, Geosci. Model Dev., 9, 523–546, https://doi.org/10.5194/gmd-9-523-2016, 2016.
Westermann, S., Peter, M., Langer, M., Schwamborn, G., Schirrmeister, L., Etzelmüller, B., and Boike, J.: Transient modeling of the ground thermal conditions using satellite data in the Lena River delta, Siberia, The Cryosphere, 11, 1441–1463, https://doi.org/10.5194/tc-11-1441-2017, 2017.
Wu, J. and Gao, X. J.: A gridded daily observation dataset over China region and comparison with other datasets, Chinese Journal of Geophysics, 56, 1102–1111, https://doi.org/10.6038/cjg20130406, 2013 (in Chinese with English abstract).
Wu, J., Sheng, Y., Wu, Q., and Wen, Z.: Processes and modes of permafrost degradation on the Qinghai-Tibet Plateau, Sci. China Ser. D-Earth Sci., 53, 150–158, https://doi.org/10.1007/s11430-009-0198-5, 2010.
Wu, Q. and Zhang, T.: Recent permafrost warming on the Qinghai-Tibetan Plateau, J. Geophys. Res., 113, 1–22, 2008.
Wu, X., Nan, Z., Zhao, S., Zhao, L., and Cheng, G.: Spatial modeling of permafrost distribution and properties on the Qinghai-Tibet Plateau, Permafrost Periglac., 29, 86–99, https://doi.org/10.1002/ppp.1971, 2018.
Xiao, Y., Zhao, L., Dai, Y., Li, R., Pang, Q., and Yao, J.: Representing permafrost properties in CoLM for the Qinghai–Xizang (Tibetan) plateau, Cold Reg. Sci. Technol., 87, 68–77, https://doi.org/10.1016/j.coldregions.2012.12.004, 2013.
Xing, Z., Zhao, L., Fan, L., Hu, G., Zou, D., Wang, C., Liu, S., Du, E., Xiao, Y., Li, R., Liu, G., Qiao, Y., and Shi, J.: Changes in the ground surface temperature in permafrost regions along the Qinghai–Tibet engineering corridor from 1900 to 2014: a modified assessment of CMIP6, Adv. Clim. Chang. Res., 14, 85–96, https://doi.org/10.1016/j.accre.2023.01.007, 2023.
Yang, S., Li, R., Wu, T., Hu, G., Xiao, Y., Du, Y., Zhu, X., Ni, J., Ma, J., Zhang, Y., and Shi, J.: Evaluation of reanalysis soil temperature and soil moisture products in permafrost regions on the Qinghai Tibetan Plateau, Geoderma, 377, 114583, https://doi.org/10.1016/j.geoderma.2020.114583, 2020.
Yao, T., Xue, Y., Chen, D., Chen, F., Thompson, L., Cui, P., Koike, T., Lau, W. K., Lettenmaier, D., Mosbrugger, V., Zhang, R., Xu, B., Dozier, J., Gillespie, T., Gu, Y., Kang, S., Piao, S., Sugimoto, S., Ueno, K., Wang, L., Wang, W., Zhang, F., Sheng, Y., Guo, W., Yang, X., Ma, Y., Shen, S. S. P., Su, Z., Chen, F., Liang, S., Liu, Y., Singh, V. P., Yang, K., Yang, D., Zhao, X., Qian, Y., Zhang, Y., and Li, Q.: Recent Third Pole's Rapid Warming Accompanies Cryospheric Melt and Water Cycle Intensification and Interactions between Monsoon and Environment: Multidisciplinary Approach with Observations, Modeling, and Analysis, B. Am. Meteorol. Soc., 100, 423–444, https://doi.org/10.1175/BAMS-D-17-0057.1, 2019.
Yan, D., Ma, N., and Zhang, Y.: Development of a fine-resolution snow depth product based on the snow cover probability for the Tibetan Plateau: Validation and spatial–temporal analyses, J. Hydrol., 604, 127027, https://doi.org/10.1016/j.jhydrol.2021.127027, 2022.
Yi, Y., Kimball, J. S., Chen, R. H., Moghaddam, M., Reichle, R. H., Mishra, U., Zona, D., and Oechel, W. C.: Characterizing permafrost active layer dynamics and sensitivity to landscape spatial heterogeneity in Alaska, The Cryosphere, 12, 145–161, https://doi.org/10.5194/tc-12-145-2018, 2018.
You, Q., Cai, Z., Pepin, N., Chen, D., Ahrens, B., Jiang, Z., Wu, F., Kang, S., Zhang, R., Wu, T., Wang, P., Li, M., Zou, Z., Gao, Y., Zhai, P., and Zhang, Y.: Warming amplification over the Arctic Pole and Third Pole: Trends, mechanisms and consequences, Earth Sci. Rev., 217, 103625, https://doi.org/10.1016/j.earscirev.2021.103625, 2021.
Zhang, G., Chen, W., and Xie, H.: Tibetan Plateau's Lake level and volume changes from NASA's ICESat/ICESat-2 and Landsat missions, Geophys. Res. Lett., 46, 13107–13118, https://doi.org/10.1029/2019GL084912, 2019.
Zhang, T.: Influence of the seasonal snow cover on the ground thermal regime: An overview, Rev. Geophys., 43, RG4002, https://doi.org/10.1029/2004RG000157, 2005.
Zhang, Y., Wang, X., Fraser, R., Olthof, I., Chen, W., Mclennan, D., Ponomarenko, S., and Wu, W.: Modelling and mapping climate change impacts on permafrost at high spatial resolution for an Arctic region with complex terrain, The Cryosphere, 7, 1121–1137, https://doi.org/10.5194/tc-7-1121-2013, 2013.
Zhang, Y., Olthof, I., Fraser, R., and Wolfe, S. A.: A new approach to mapping permafrost and change incorporating uncertainties in ground conditions and climate projections, The Cryosphere, 8, 2177–2194, https://doi.org/10.5194/tc-8-2177-2014, 2014.
Zhao, J., Zhao, L., Sun, Z., Niu, F., Hu, G., Zou, D., Liu, G., Du, E., Wang, C., Wang, L., Qiao, Y., Shi, J., Zhang, Y., Gao, J., Wang, Y., Li, Y., Yu, W., Zhou, H., Xing, Z., Xiao, M., Yin, L., and Wang, S.: Simulating the current and future northern limit of permafrost on the Qinghai–Tibet Plateau, The Cryosphere, 16, 4823–4846, https://doi.org/10.5194/tc-16-4823-2022, 2022.
Zhao, L. and Sheng, Y.: Permafrost survey manual, Science Press, Beijing, 13–14, ISBN 9787030581334, 2015.
Zhao, L. and Sheng, Y.: Permafrost and environment changes on the Qinghai-Tibetan Plateau, Beijing, China: Science Press, ISBN 9787030581334, 2019.
Zhao, L., Ding, Y., Liu, G., Wang, S., and Jin, H.: Estimates of the reserves of ground ice in permafrost regions on the Tibetan plateau, J. Glaciol. Geocryol., 32, 1–9, 2010a.
Zhao, L., Wu, Q., Marchenko, S., and Sharkhuu, N.: Thermal state of permafrost and active layer in Central Asia during the international polar year, Permafrost Periglac., 21, 198–207, https://doi.org/10.1002/ppp.688, 2010b.
Zhao, L., Wu, T., Xie, C., Li, R., Wu, X., Yao, J., Yue, G., and Xiao, Y.: Support geoscience research, environmental management, and engineering construction with investigation and monitoring on permafrost in the Qinghai-Tibet plateau, China, Bull. Chin. Acad. Sci. 32, 1159–1168, https://doi.org/10.16418/j.issn.1000-3045.2017.10.015, 2017 (in Chinese with English abstract).
Zhao, L., Hu, G., Zou, D., Wu, X., Ma, L., Sun, Z., Yuan, L., Zhou, H., and Liu, S.: Permafrost Changes and Its Effects on Hydrological Processes on Qinghai-Tibet Plateau, Bull. Chin. Acad. Sci., 34, 1233–1246, https://doi.org/10.16418/j.issn.1000-3045.2019.11.006, 2019.
Zhao, L., Zou, D. Hu, G., Du, E., Pang, Q., Xiao, Y., Li, R., Sheng, Y., Wu, X., Sun, Z., Wang, L., Wang, C., Ma, L., Zhou, H., and Liu, S.: Changing climate and the permafrost environment on the Qinghai-Tibet (Xizang) Plateau, Permafrost Periglac., 31, 396–405, https://doi.org/10.1002/ppp.2056, 2020.
Zhao, L., Zou, D., Hu, G., Wu, T., Du, E., Liu, G., Xiao, Y., Li, R., Pang, Q., Qiao, Y., Wu, X., Sun, Z., Xing, Z., Sheng, Y., Zhao, Y., Shi, J., Xie, C., Wang, L., Wang, C., and Cheng, G.: A synthesis dataset of permafrost thermal state for the Qinghai–Tibet (Xizang) Plateau, China, Earth Syst. Sci. Data, 13, 4207–4218, https://doi.org/10.5194/essd-13-4207-2021, 2021a.
Zhao, L., Hu, G., Zou, D., Wu, T., Du, E., Liu, G., Xiao, Y., Li, R., Pang, Q., Qiao, Y., Wu, X., Sun, Z., Xing, Z., Zhao, Y., Shi, J., Xie, C., Wang, L., Wang, C., and Cheng, G.: A synthesis dataset of permafrost for the Qinghai-Xizang (Tibet) Plateau, China (2002–2018), National Tibetan Plateau / Third Pole Environment Data Center [data set], https://doi.org/10.11888/Geocry.tpdc.271107, 2021b.
Zhao, L., Hu, G., Liu, G., Zou, D., Wang, Y., Xiao, Y., Du, E., Wang, C., Xing, Z., Sun, Z., Zhao, Y., Liu, S., Zhang, Y., Wang, L., Zhou, H., and Zhao, J.: Investigation, Monitoring, and Simulation of Permafrost on the Qinghai-Tibet Plateau: A Review, Permafrost Periglac., 35, 412–422, https://doi.org/10.1002/ppp.2227, 2024.
Zhou, C. and Cheng, W.: 1:1,000,000 geomorphological map of Western China, National Tibetan Plateau / Third Pole Environment Data Center [data set], https://doi.org/10.11888/Geogra.tpdc.270104, 2019.
Zou, D., Pang, Q., Zhao, L., Wang, L., Hu, G., Du, E., Liu, G., Liu, S., and Liu, Y.: Estimation of Permafrost Ground Ice to 10 m Depth on the Qinghai-Tibet Plateau, Permafrost Periglac., https://doi.org/10.1002/ppp.2226, 2024.
Zou, D., Zhao, L., Wu, T., Wu, X., Pang, Q., and Wang, Z.: Modeling ground surface temperature by means of remote sensing data in high-altitude areas: test in the central Tibetan Plateau with application of moderate-resolution imaging spectroradiometer Terra/Aqua land surface temperature and ground based infrared radiometer, J. Appl. Remote Sens., 8, 083516, https://doi.org/10.1117/1.JRS.8.083516, 2014.
Zou, D., Zhao, L., Sheng, Y., Chen, J., Hu, G., Wu, T., Wu, J., Xie, C., Wu, X., Pang, Q., Wang, W., Du, E., Li, W., Liu, G., Li, J., Qin, Y., Qiao, Y., Wang, Z., Shi, J., and Cheng, G.: A new map of permafrost distribution on the Tibetan Plateau, The Cryosphere, 11, 2527–2542, https://doi.org/10.5194/tc-11-2527-2017, 2017.