the Creative Commons Attribution 4.0 License.
the Creative Commons Attribution 4.0 License.
 | 21 Jul 2025
The impact of ice structures and ocean warming in Milne Fiord
Bernard E. Laval
Derek Mueller
Yulia Antropova
Andrew K. Hamilton
Arctic tidewater glaciers and ice shelves are undergoing rapid attrition, with warmer ocean temperatures playing an important role. However, the relationship between ocean temperature and ice structure retreat is complex and may change as the ocean warms and as the ice structure geometry evolves. In order to explore ice–ocean interactions and the impact of retreating ice structures in a glacial fjord, we use a numerical ocean model of Milne Fiord, which features an ice shelf and a tidewater glacier with a floating glacier tongue (part of which is detached). We model past, present, and potential future ice configurations. Our results reveal that the average submarine melting is negligible across the ice shelf (<2 cm a−1) but can dominate thinning rates (>20 cm a−1) at specific locations where the ice is thick (>50 m) along the seaward edge. Our simulations also indicate that the temperature of water reaching the grounding line does not vary significantly when the ice shelf and glacier tongue are removed. In addition, we carry out a series of simulations with increasing ocean temperature which reveal a quasi-linear relationship between ocean temperature and submarine melting at the grounding line. Using this relationship and ocean temperature predictions for different greenhouse gas emission scenarios (2020 to 2100), we estimate that Milne Glacier will continue to retreat for at least 50 years, solely in response to ocean forcing. This study highlights the vulnerability of ice structures in the Arctic, even in a region regarded as the Last Ice Area.
- Article
(6472 KB) - Full-text XML
-
Supplement
(1831 KB) - BibTeX
- EndNote


Ice structures, defined here as large submerged glacier ice features, are currently experiencing a global retreat in the Arctic; 85 % of marine-terminating glaciers (hereafter “tidewater glaciers”) in the Northern Hemisphere retreated between 2000 and 2020 (Kochtitzky and Copland, 2022). During this period, many glaciers also lost their ice tongues, including the Jakobshavn (Motyka et al., 2011), Zachariae Isstrøm (Mouginot et al., 2015), and Yelverton glaciers (White and Copland, 2019). A warmer ocean is often considered a major cause of this phenomenon (e.g. Holland et al., 2008; Straneo et al., 2012; Cai et al., 2017; Millan et al., 2022). In the Southern Hemisphere, the intrusion of warm modified Circumpolar Deep Water inside ice shelf cavities has also been identified as a major cause of ice shelf retreat (e.g. Azaneu et al., 2023; Si et al., 2024).
It is an axiom that increased water temperature in contact with ice leads to more melting, but the exact relationship between the temperature of water offshore of glacial fjords or ice shelf cavities and the melting of ice structures is complex. This relationship depends on multiple factors, such as the presence of a sill (Zhao et al., 2019, 2021), the presence of icebergs (Davison et al., 2020; Hager et al., 2024), ice shelf thickness and geometry (De Rydt et al., 2014; Bradley et al., 2022; Steiger et al., 2022), and the amount of subglacial discharge (Cowton et al., 2015; Slater et al., 2019). For instance, for four similar tidewater glaciers in West Greenland, Rignot et al. (2016) found that the dependency of glacier melting on water temperature can vary by more than 50 % (their Table S1). This result suggests that simple parameterizations for ice melting as a function of water temperature derived for a specific site should be used with caution for other glacial fjords or ice shelf cavities, unless validated. Moreover, in addition to the variability between sites, changes at a specific location, such as glacier retreat or a large calving event, can potentially change the derived relationship by altering the ocean circulation and hydrography. This process is important because it could create a positive feedback loop where warmer water leads to enhanced calving, which leads to more warm water intrusion. A retrograde bathymetry, such as that found in Petermann Fjord, is an example of a feature potentially leading to enhanced submarine melting following glacier retreat because of the increasing water temperature with depth (Millan et al., 2022). On the other hand, the emergence of a shallow sill during glacier retreat could obstruct the flow of warmer deep water to the grounding line, as is currently observed with the Ryder and 79N glaciers (Schaffer et al., 2020; Jakobsson et al., 2020). Two recent numerical studies on Antarctic ice shelves indicate that major calving events do not substantially change the overall average submarine melting rate (<15 % change) but can lead to significant melt increases at specific locations (>100 %) (Bradley et al., 2022; Poinelli et al., 2023).
In this study, we evaluate the impact of changing ice structures (ice shelf, glacier tongue) and increasing ocean temperature on ice–ocean interactions in Milne Fiord. Milne Fiord, located on the northern coast of Ellesmere Island in the Canadian Arctic, is an ideal site because it hosts an ice shelf at its mouth in addition to a tidewater glacier at its head (separate ice structures). Moreover, observational efforts in the last 15 years enabled the development and validation of a high-resolution ocean model, which can predict the melting/freezing of the ice structures (Bonneau et al., 2024b). The model is firstly used to evaluate the impact of removing ice structures (calving) on the hydrography and submarine melting. Then, it is employed to evaluate the impact of the forecasted ocean warming in the region on the submarine melting of the glacier.
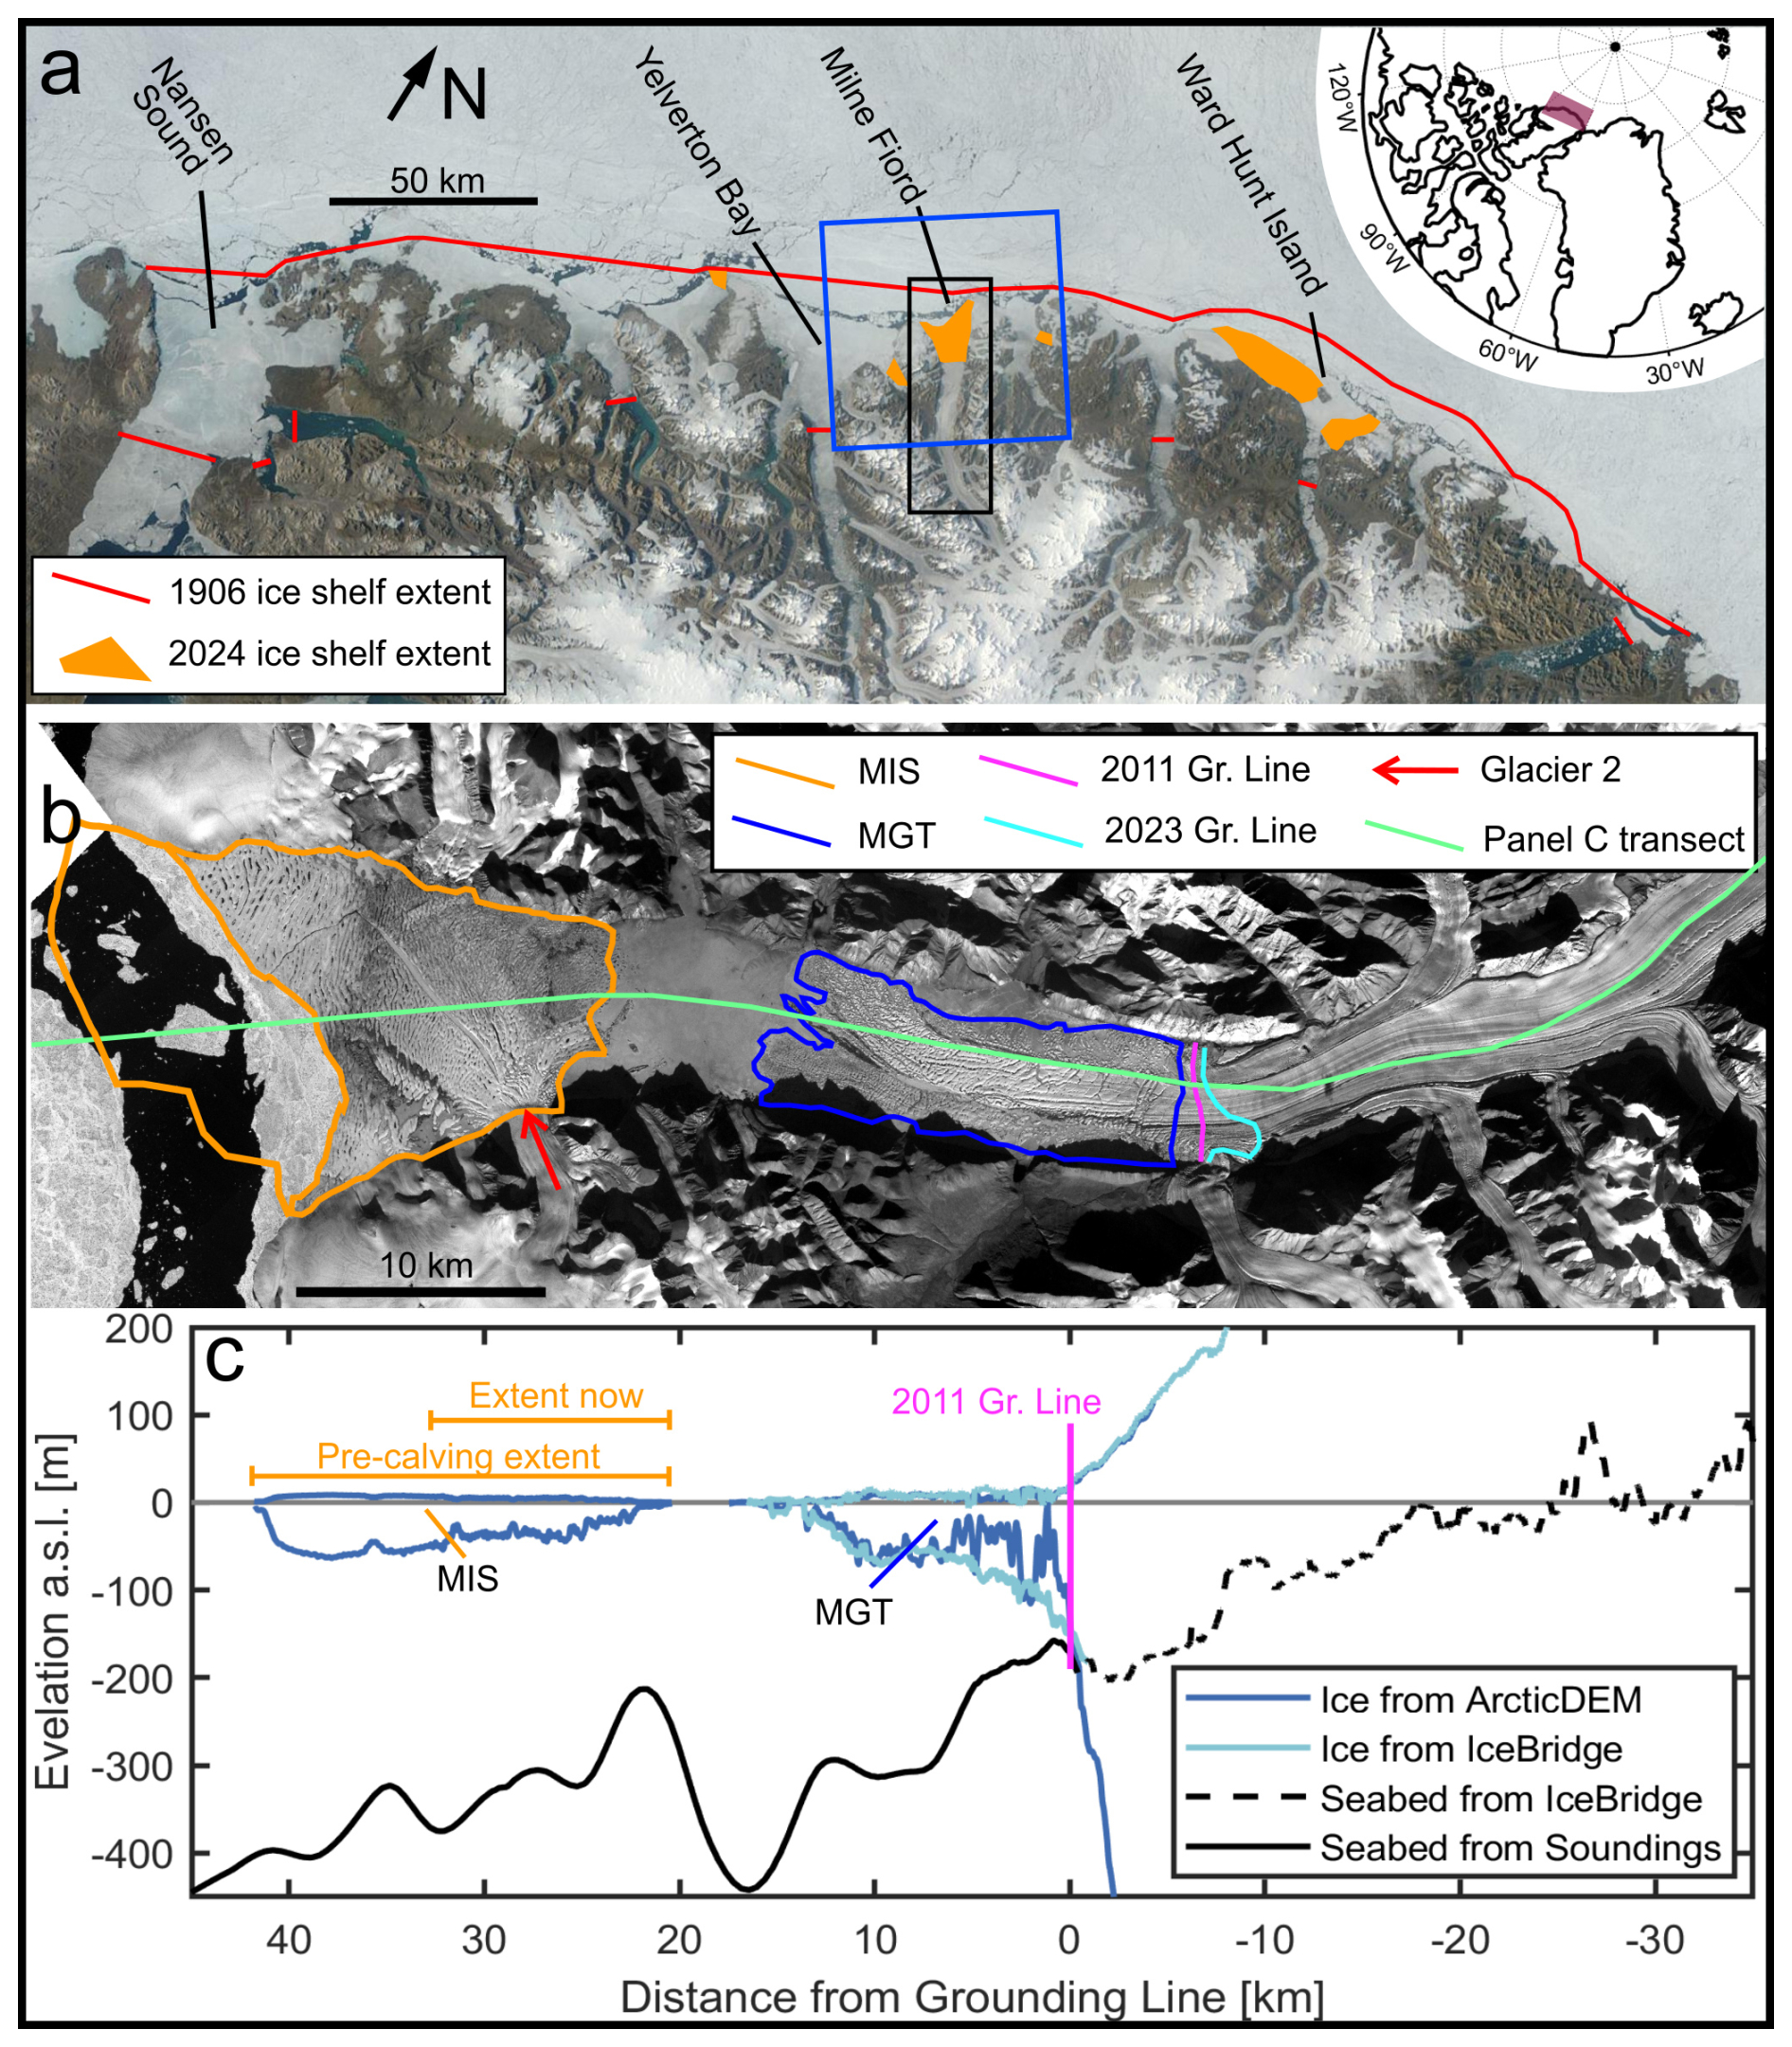
Figure 1Study area. (a) Earthview image of the northern coast of Ellesmere Island taken on 18 August 2024. Ice shelf extent from Mueller et al. (2017). The black box is the extent of panel (b), and the blue box is the extent of the numerical model domain. The top-right inset shows the location of panel (a). (b) PlanetScope near-infrared image of Milne Fiord from 18 August 2024 showing the extent of the Milne Ice Shelf (MIS) and the Milne Glacier tongue (MGT). (c) Along-fjord profile of ice thickness from ArcticDEM (Porter et al., 2018) and IceBridge (Paden et al., 2010) derived using hydrostatic equilibrium (for ArcticDEM data). Seabed elevation under the glacier is from IceBridge, and seabed elevation under the ocean is from manual soundings.
Milne Fiord (82.5° N, −81° W) is situated on the northernmost coast of the Canadian Arctic Archipelago, facing the Arctic Ocean (Fig. 1a). This unique site hosts an ice shelf, a detached glacier tongue, and a tidewater glacier. It is located at the centre of the coastline of Canada's newly designated Tuvaijuittuq Marine Protected Area. Tuvaijuittuq, meaning “the place where the ice never melts” in Inuktut, is projected to be one of the last areas with multiyear sea ice in the Northern Hemisphere (Jahn et al., 2024), thereby serving as a refuge for ice-dependent species (Vincent and Mueller, 2020). However, in spite of the predicted resilience of sea ice in this area, the ice structures (ice shelves, glacier tongues, glaciers) in Tuvaijuittuq are currently experiencing sustained retreat (e.g. Mueller et al., 2017; Kochtitzky and Copland, 2022; White and Copland, 2019).
2.1 Milne Ice Shelf (MIS)
Using explorer reports from expeditions in 1875–1876 and 1906, Vincent et al. (2001) estimated that the north coast of Ellesmere Island was fringed by an ∼8400 km2 ice shelf at the beginning of the 20th century. This “Ellesmere Ice Shelf” (unofficial name) is believed to have formed around 5500 years ago (England et al., 2017). Over the past century, the Ellesmere Ice Shelf has almost completely disintegrated; it had an extent of 535 km2 in 2015 (Mueller et al., 2017). The last relatively stable fragment of the Ellesmere Ice Shelf was in Milne Fiord, until 2020, when the Milne Ice Shelf (MIS) calved and lost 43 % (80 km2) of its area, including its thickest ice (∼90 m thick). Before the calving, the mean thickness of the MIS was ∼44 m (Fig. 1c; Hamilton, 2016). Ice cores and remote sensing have revealed that the MIS is a composite ice shelf, formed by the floating extension of glaciers and the accumulation of sea ice, nourished by basal accretion and snow accumulation (Jeffries, 1992; Mortimer et al., 2012; Richer-McCallum, 2015; White, 2019). Since 2011, the only glacier feeding the MIS is Glacier 2 (Fig. 1b; Mortimer et al., 2012)). Until 2020, the MIS acted as a dam for surface runoff from the watershed, forming a freshwater layer floating above the seawater known as an epishelf lake (Hamilton et al., 2017; Bonneau et al., 2021; Veillette et al., 2011). The Milne Fiord epishelf lake drained through a basal channel under the MIS, where the ice draft was approximately 8 m thick (Bonneau et al., 2021). Although the epishelf lake has dramatically thinned since the 2020 calving event, it is unclear at the moment if it remains perennial or has transitioned to a seasonal feature.
2.2 Milne Glacier
Around 1959, the floating extension of Milne Glacier disconnected from the MIS and retreated up-fjord, creating a gap between the ice shelf and the Milne Glacier tongue (MGT) (Jeffries, 1986). This gap, filled by the epishelf lake and covered by perennial lake ice, has been expanding ever since (Mortimer et al., 2012). Due to the presence of the ice shelf and perennial ice, icebergs do not exit the fjord, resulting in a fractured glacier tongue, similar to the now-disintegrated tongues of the Tracy, Steensby, and C.H. Ostenfeld glaciers (Hill et al., 2017) and to the current Thwaites Western Ice Tongue (e.g. Benn et al., 2022). Between 2009 and 2011, a large rift formed <1 km from the grounding line (Mueller et al., 2017; Antropova et al., 2024), separating the MGT from the glacier. In 2018, the MGT covered ∼66 km2. A recent study combining remote sensing and radar observations from 2011 to 2023 estimated that the grounding line of Milne Glacier retreated between 30 and 124 m a−1, depending on the location across the glacier (Fig. 1b; Antropova et al., 2024). The Milne Glacier grounding line has a maximum depth around 190 m and was located on a retrograde slope in 2011 (Fig. 1c). The estimated ice flux from the glacier varied from 0.03 to 0.14 Gt a−1 between 2011 and 2019. The associated glacier velocities ranged from 20 to 160 m a−1 between 2011 and 2020, with the acceleration of up to ∼160 m yr−1 between 2016 and 2020 (Van Wychen et al., 2016; Millan et al., 2017; Wychen et al., 2020; Antropova et al., 2024).
2.3 Milne Fiord oceanography
The water column in Milne Fiord is composed of different water masses. At the surface is the ∼10 m thick epishelf lake, which is warm (>0 °C) and fresh (<1 g kg−1) (Hamilton et al., 2017; Bonneau et al., 2021). It is ice-covered year round and therefore isolates the fjord's seawater from atmospheric forcing. Below the epishelf lake is an ∼100 m thick layer of polar water near the freezing point. Below the polar water is the warmer (>0 °C) and saltier Atlantic Water. Because of the presence of the MIS, freshwater from surface runoff, subglacial discharge, and submarine melting accumulates in the upper 50 m of the water column (Hamilton et al., 2021). An ∼230 m sill restricts the renewal of deep water, but it has limited impact on water reaching the glacier because it is deeper than the grounding line (Hamilton et al., 2021). The results from a multiyear numerical simulation of the circulation in Milne Fiord, validated with observations, have revealed that the circulation is weak but highly unsteady: three circulation modes with different patterns alternate in response to density variations on the coastal shelf (Bonneau et al., 2024b). The water on the coastal shelf, which flows westward, originates mainly from the Canada Basin (Hamilton et al., 2021; Timmermans and Marshall, 2020). Except for intermittent leads along the coast in July, August, and September (Fig. 1a), the offshore region is covered by multiyear land-fast sea ice.
3.1 Numerical model
This study relies on a numerical ocean circulation model (MITgcm; Marshall et al., 1997) of Milne Fiord developed and evaluated in Bonneau et al. (2024b, a). The model covers the extent of the fjord using a 150 m by 150 m horizontal (Fig. 1a). The numerical domain extends 25 km east, west, and north offshore from the fjord's mouth, with a telescoping grid. In the vertical, the cells are 2 m for the first 50 m and then linearly extend to 30 m at 600 m depth. Vertical eddy viscosity and diffusivity are set to 10−5 and 10 m2 s−1, respectively. Horizontal eddy viscosity is determined using the Smagorinsky method (Smagorinsky, 1963) (coefficient = 2.0), and the horizontal diffusivities are set to 3.0 m2 s−1 (Table 1). To model the heat, salt, and momentum flux at the boundaries with the ice structures, we take advantage of the separation of the glacier tongue from the glacier in 2009–2011. The ice shelf and the glacier tongue are modelled using the ShelfIce package (Losch, 2008) with a drag coefficient (Cd) automatically determined so that u and v are zero at the interface (corresponding to a no-slip boundary condition). At the glacier face, the fluxes are determined with the IcePlume package (Cowton et al., 2015) (Cd=0.01, heat transfer coefficient ΓΘ=0.044, salt transfer coefficient ΓS=0.00124, minimum background velocity vhor=0.035 m s−1), modified for a glacier with a constant overhanging slope of 4:1 (Bonneau et al., 2024b). The employed values for Cd, Γ, and vhor are in line with Jackson et al. (2020) and yield glacier retreat estimates consistent with observations (Sect. 4.2). The amount of subglacial discharge is determined by integrating the negative surface mass balance from RACMO2.3 (Noël et al., 2018). Two subglacial discharge outlets are used (in the IcePlume package), both coincident with depressions in the bathymetry (Sect. 4.2). While the exact number of subglacial discharge outlets is unknown, observations showed one outlet in a bathymetry depression on the west side of the fjord (Hamilton et al., 2021). Another one was therefore added in a depression on the other side of the fjord. Subglacial discharge is released equally in the two outlets. Offshore, the model is forced with temperature, salinity, and velocities from ORAS5 reanalysis (Zuo et al., 2019). To reproduce the epishelf lake, which recharges every summer because of surface runoff, the upper three grid cells were relaxed towards mooring observations (temperature and salinity).
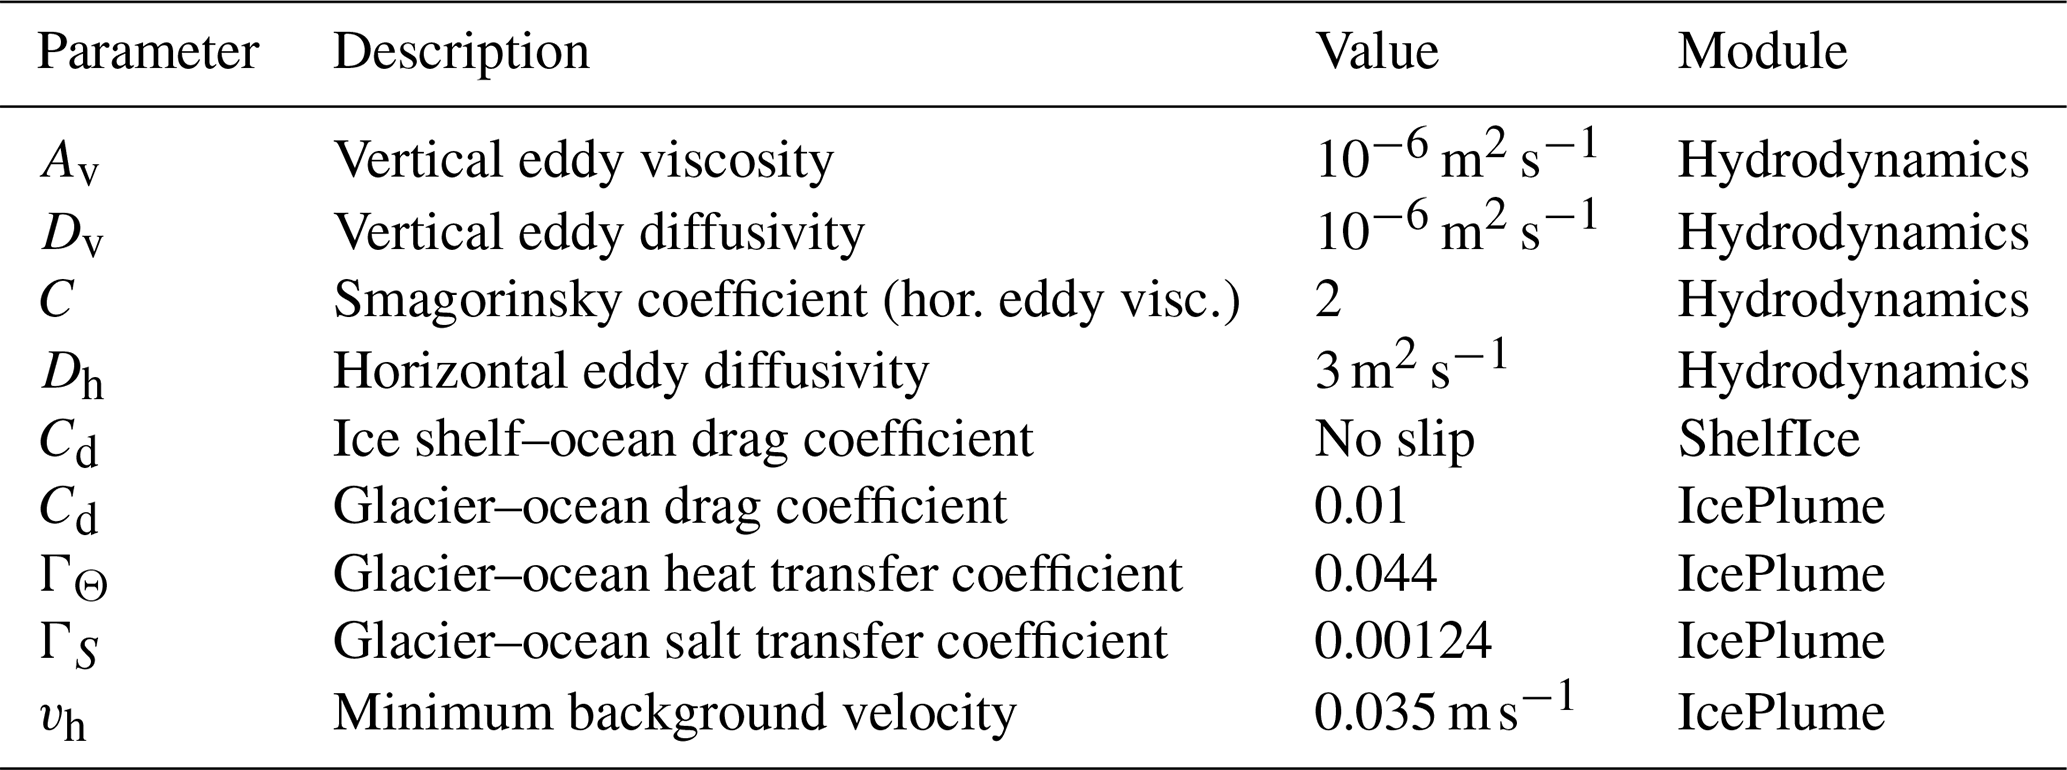
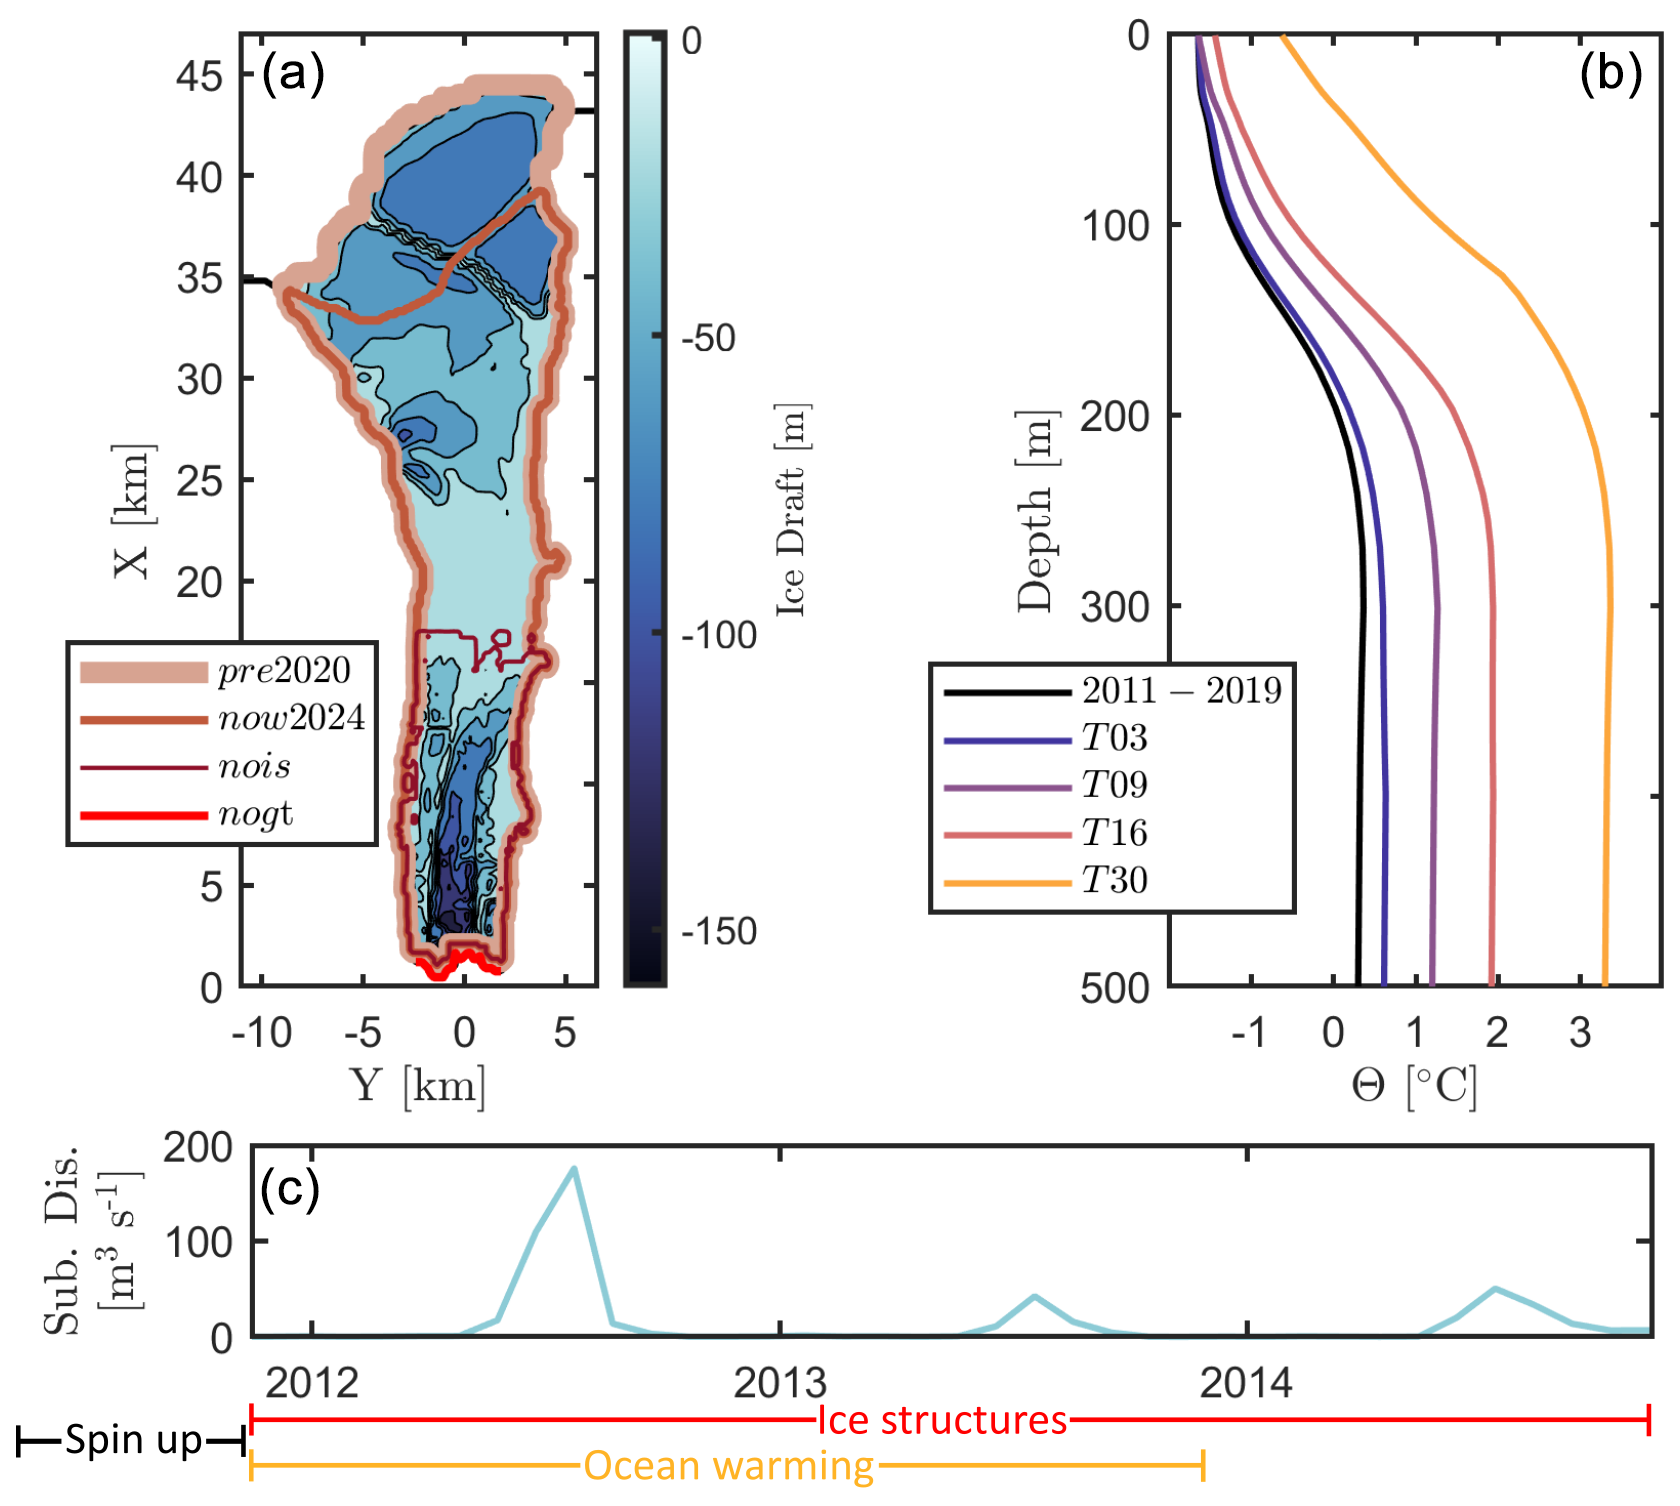
Figure 2Model configuration. (a) Ice draft and ice extent for the different ice structure scenarios. (b) Mean offshore ocean temperature for the different ocean warming scenarios. (c) Time series of amount of subglacial discharge (same for all scenarios).
3.2 Numerical experiments
This study is divided into two main parts. The first part explores the impact of the ice structures in Milne Fiord on water properties and melting/freezing of the remaining ice structures. For this, the numerical model is run with four different ice structure configurations (Fig. 2a). The first ice configuration is the same as in Bonneau et al. (2024b, a) and represents Milne Fiord before the July 2020 MIS calving event; it is denoted “pre2020”. The second part represents the fjord as of 2024; it is denoted “now2024”. The third ice configuration represents the fjord without an ice shelf; it is denoted “nois”. The fourth configuration represents the fjord without an ice shelf and without a glacier tongue; it is denoted “nogt”. nois and nogt are configurations expected to arise in the coming decades, as has happened for other fjords along the northern coast of Ellesmere Island over the last 2 decades (Copland et al., 2007; Mueller et al., 2003; White and Copland, 2019; Mueller et al., 2017). For the nois and nogt runs, there is no temperature and salinity relaxation in the three uppermost grid cells to reproduce the epishelf lake. For each configuration, the model is spun up for 0.5 years starting in May 2011, and the last 3 years (November 2011 to November 2014) are used for analysis. A 3-year simulation is sufficient to obtain accurate (<20 % error) average along-fjord heat and salt fluxes and accurate mean circulation patterns (Bonneau et al., 2024b).
The second part of this study explores the impact of warming ocean temperatures on the melting of the glacier face. For this purpose, the model is run with the nogt ice configuration and with four different temperature increases (added to the baseline nogt ORAS5 offshore forcing). The temperature increases were determined using a multimodel mean from the fifth and sixth Coupled Model Intercomparison Project (CMIP; Taylor et al., 2012; Eyring et al., 2016). The four ocean warming simulations (T03, T09, T16, and T30) are intermediate steps in different greenhouse gas emission scenarios (RCP2.6/SSP126, RCP4.5/SSP245, and RCP8.5/SSP585; S1). The CMIP multimodel mean ocean temperature increase corresponding to a warming of 0.3, 0.9, 1.6, and 3.0 °C at 220 m depth was added to the ORAS5 baseline offshore forcing (nogt). 220 m corresponds to the grid cell just above the sill and just below the grounding line of Milne Glacier. Above 220 m, the temperature increase decreases with height for all scenarios, as CMIP models do not show a temperature increase at the surface, except for extreme scenarios (Fig. 2b). The amount of imposed subglacial discharge at the grounding line of Milne Glacier is the same for all cases (Fig. 2c). For each of the ocean warming simulations, the model is run 2.5 years and the last 2 years are used for analysis. A time of 2 years is sufficient because the melting of the glacier face does not show high interannual variability (Sect. 4.2); therefore this duration is sufficient to obtain an accurate average.
3.3 Water property metrics
To characterize the water properties, the water column inside the fjord is divided into four distinct layers and the water property anomalies, and the differences between the different ice structure configurations in the simulation are analysed. Temperature anomalies are defined as the temperature inside the fjord minus the temperature offshore (Θ−Θoff), and salinity anomalies are defined likewise (S−Soff). We do not consider the depth of the sill here, as the grounding line is shallower than the sill's depth. Unless stated or plotted otherwise, the water properties at the centre (18 km down-fjord from the grounding line) are used for when calculating these anomalies. We also calculate the volume exchange between the coastal shelf and the fjord (Qex), the pycnocline upwelling inside the fjord (Δzρ), the fraction of submarine meltwater (fSM), and the total amount of freshwater (fSM+SD). Qex is calculated using along-fjord velocities (U):
where A is the cross-section at the mouth of the fjord (X=33 km). The upwelling, Δzρ, is calculated as the average depth difference between isopycnals offshore and at the centre of the fjord (X=20 km) for a specific layer. Below the settling depth of the subglacial discharge plume (∼40 m), the fraction of submarine meltwater (fSM) is estimated using the temperature difference between the fjord (Θ) and offshore along isopycnals, such that ice melting produces a cold anomaly represented by the mixing of ambient offshore water (Θoff,ρ) with water at −92.5 °C (ΘSM). The temperature of −92.5 °C accounts for the latent heat of fusion (Hamilton et al., 2021):
where foff,ρ is the fraction of offshore water. Θoff,ρ is taken at the same density level as Θ but offshore. Above the minimal settling depth of the subglacial discharge plume, the combined fraction of submarine meltwater and subglacial discharge water (fSM+SD) is estimated using the fact that both subglacial discharge and submarine melting waters have a negligible salinity ( g kg−1). Therefore, fSM+SD can be determined using the salinity inside the fjord (Sobs):
The offshore salinity (Soff,z) is taken at the same depth as S. Since subglacial discharge entrains saltier deep waters and transport them upwards, Eq. (3) underestimates fSD+SM. Similarly, Eq. (2) also underestimates fSM below 40 m since the neglected subglacial discharge water and associated upwelled deep water result in warm anomalies, offsetting part of the cold anomaly used to determine fSM. Nevertheless, these estimates satisfy the present objective of comparing water properties for the different ice structure configurations. The amount of fSM and fSM+SD is reported in water height (∫fdz). For example, an average fraction of 0.01 over a 10 m layer is 10 cm.
3.4 Glacier face melting parameterization
To compare the results from our model to other modelled glacial fjords, the submarine melting parameterization of Rignot et al. (2016) is employed:
where MGL (in units of m d−1) is the horizontal submarine melting rate at the grounding line (undercutting), h is the thickness of the glacier at the grounding line (200 m), and qsd is the rate of subglacial discharge volume (in units of m3 d−1) divided by the submerged area of the glacier face. TF is the temperature above the local freezing point (Θf), commonly referred to as the thermal forcing (Θ−Θf). In this study, the TF value used in Eq. (4) is the average TF value from the sea surface to the grounding line depth, following Morlighem et al. (2019). Equation (4) is not used in our model but on the output. Using remote sensing observations to calibrate Eq. (4) for five tidewater glaciers in West Greenland, Rignot et al. (2016) arrived at mean values for the coefficients A, α, B, and β of , 0.39, 0.15, and 1.18, respectively. These coefficients have not been evaluated in other glacial fjords, and they differed by up to 50 % between fjords in the Rignot et al. (2016) study. The effects of the fjord and the glacier geometries and of the ocean forcing mechanisms (e.g. tides, coastal trapped waves, buoyancy-driven circulation) are encapsulated in these coefficients. The more vigorous the fjord's circulation and the exchange with the coastal shelf, the higher these coefficients should be. In this study, melting rates presented in metres and cubic metres (m and m3) per unit of time are based on an ice density of 920 kg m−3.
3.5 Glacier retreat
To evaluate our glacier melt estimates and to predict the future retreat of Milne Glacier due to submarine melting, we focus on the grounding line position at the centre of the fjord. A thinning of the glacier at the grounding line (δh, negative for thinning, in m a−1) will result in a retreat (δx, negative for retreat, in m a−1) (Thomas and Bentley, 1978; Rignot, 1998; Wood et al., 2021):
where ρw and ρi are the density of seawater (1030 g kg−1) and glacier ice (920 g kg−1). αb and αs are the slopes at the surface (fixed at −0.02) and at the base (bed) of the glacier at the grounding line (0.02 in 2020, varies along glacier). Both αb and αs are negative when sloping upward up-glacier (Fig. 1c). The thinning at the grounding line (δh, negative for thinning, in m a−1) is a function of the submarine melting at depth (undercutting, MGL, positive), the velocity of the glacier (uG), the slope of the glacier face (4:1 in this case), and the surface mass balance (δhs, negative for ablation, in m a−1):
This leads to an expression for the retreat of the glacier (δx) as a function of submarine melting at the grounding line (MGL):
In this study, MGL is the average melting at 187 m depth (closest grid cell above the grounding line). For a zero surface mass balance, if the undercutting is higher than the glacier velocity, the glacier will thin and the grounding line will retreat, and vice versa.
4.1 Water properties
The impact of removing ice structures on the hydrography varies greatly with depth (Fig. 3). To characterize these differences, the water column is divided into four layers: (1) the epishelf lake (0–10 m), (2) the subglacial discharge accumulation layer (10–40 m), (3) an intermediate layer affected by the ice shelf and glacier tongue (40–90 m), and (4) a deep water layer between the intermediate layer and the sill (90–220 m).
4.1.1 0–10 m: epishelf lake
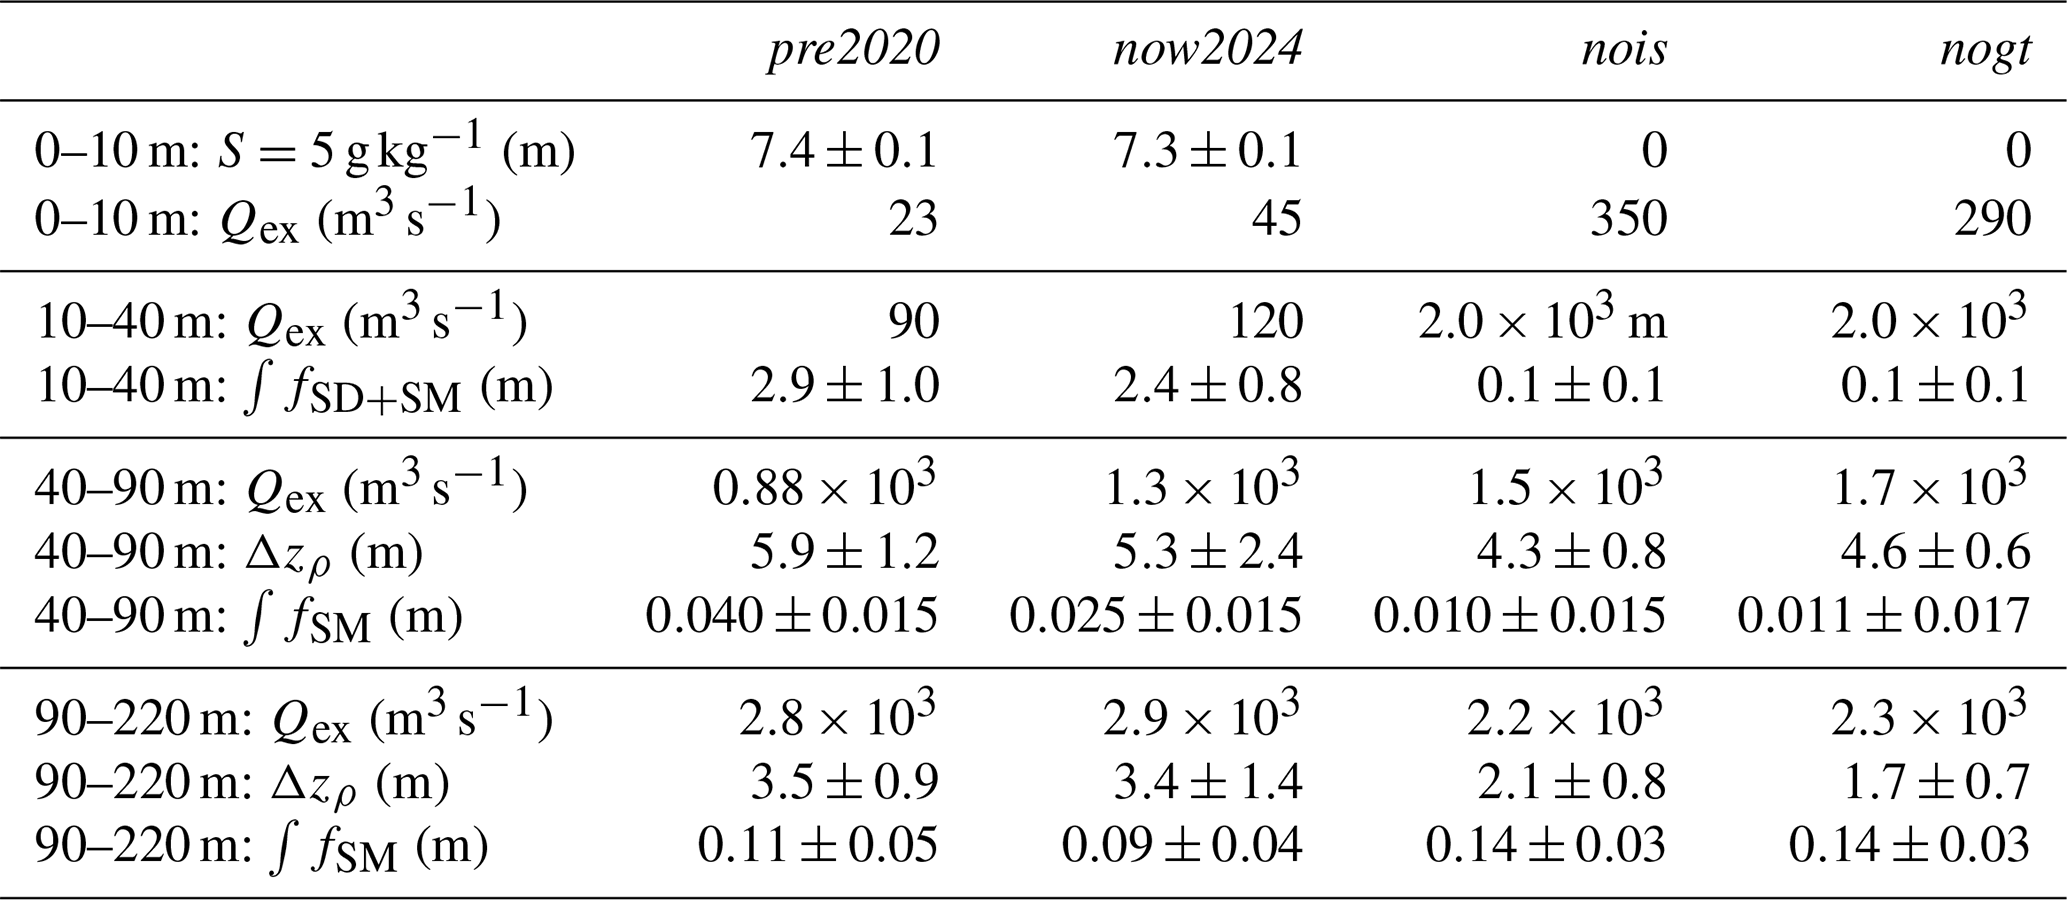
The ∼10 m deep epishelf lake at the top of the water column is an obvious layer with fresh (<10 g kg−1) and warm ( °C) anomalies (Θ−Θoff, S−Soff; Figs. 3 and 4e). The 2020 MIS calving event results in a shorter basal channel, allowing a doubling of the outflow from the epishelf lake (Table 2). This results in a 0.12 m thinning of the epishelf lake accompanied by a 0.5 g kg−1 salinity increase. This small difference is because the increased exchange only occurs below SA=5 g kg−1. When the ice shelf is completely removed, the epishelf lake disappears: salinity in this layer increases abruptly to seawater values (>29 g kg−1), and temperature decreases below −1.3 °C.
4.1.2 10–40 m: subglacial discharge accumulation layer
For the two runs with an ice shelf at the mouth of the fjord (pre2020 and now2024), the subglacial discharge plume in Milne Fiord generally settles between 10 and 40 m. This results in warm and fresh anomalies within this layer (Figs. 3 and 4a, i). The influence of subglacial discharge (0 °C, 0 g kg−1) is noticeable on Θ-S diagrams (Fig. 3e, f) by water properties parallel to the freezing line below 31 g kg−1. Within this layer, the integrated amount of subglacial discharge and submarine melting is 2.9 m for the pre2020 run and 2.4 m for the now2024 run. This decrease in fSD+SM is attributed to enhanced volume exchange of this layer through the basal channel following the 2020 calving event (120 m3 s−1 after vs. 90 m3 s−1 before). The decreased fSD+SM leads to saltier (0.5 g kg−1) water in this layer. The complete removal of the ice shelf (nois, nogt) leads to unrestricted exchange with the coastal shelf resulting in water properties and stratification near offshore values (Fig. 3). The unrestricted exchange leads to minimal amounts of subglacial discharge and submarine melting waters remaining inside the fjord (<20 cm) and an associated salinity increase (>1 g kg−1). The temperature also decreases by more than 0.5 °C following the calving event, indicating that subglacial discharge and deep water entrained in the plume (both warm anomalies), not submarine melting (negative temperature anomaly), dominate the temperature anomaly signal for the pre2020 and now2024 cases.
4.1.3 40–90 m: intermediate layer
Below the subglacial plume settling depth, from 40 to 90 m (maximum MIS thickness before the MIS calving event), the pre2020 run shows a temperature anomaly of −0.08 °C. The temperature in this layer increases as ice structures are removed (Fig. 4a–d), indicating that trapped submarine meltwater is responsible for this cold anomaly. The amount of submarine meltwater at the centre of the fjord is estimated at 4 cm for the pre2020 run. This decreases to 2.5 cm after the 2020 calving event and further decreases to ∼1 cm for the nois and nogt runs, further confirming trapped submarine meltwater is responsible for this anomaly. The removal of the ice shelf and the glacier tongue has the double effect of decreasing the amount of submarine meltwater (less ice available to undergo melting) and increasing the exchange with the coastal shelf, with both acting to decrease the fraction of submarine meltwater, thereby generating the temperature difference between the runs. The positive ∼ 0.2 g kg−1 salinity anomaly (Fig. 4i), on the other hand, cannot be caused by trapped submarine meltwater, which would decrease salinity. Examination of along-fjord isopycnals reveals that the positive salinity anomaly is caused by upwelling. For the pre2020 run, the mean upwelling at the centre of the fjord is 5.9 m. Together with the average vertical salinity gradient of 0.038 , this upwelling yields a salinity anomaly of 0.22 g kg−1, which is consistent with the salinity anomaly observed. The same analysis reveals a decrease in the amount of upwelling with 5.3, 4.3, and 4.6 m for the now2024, nois, and nogt runs, respectively, explaining the freshening observed when ice structures are removed. Upwelling should also result in a temperature increase, but this signal is masked by the accumulation of submarine meltwater (cold anomaly). Consistent with the change in temperature, the reduced upwelling is the consequence of enhanced exchange with the coastal shelf when the ice shelf is removed (Table 2).
4.1.4 90–220 m: deep layer
Between 90 m and the sill, cold temperature anomalies from submarine meltwater are present near the Milne Glacier grounding line for all four configurations (Fig. 4a–d). The presence of submarine meltwater is also evidenced by a temperature depression, which moves the water closer toward the freezing temperature, moving parallel to the melting line on T–S diagrams (Fig. 3e, f). Moving down-fjord, submarine meltwater is diluted with offshore water, increasing the temperature of this layer and allowing the upwelling signal (positive temperature anomaly) to prevail. For example, the submarine meltwater content in this layer decreases from 37 cm 2 km away from the grounding line to 11 cm 18 km away from the grounding line. As the ice structures are removed, the amount of upwelling decreases from 3.5 m (pre2020) to 3.4 m (now2024) to 2.1 m (nois) to 1.7 m (nogt). This decrease results in a cooling (Fig. 4f–h) and freshening (Fig. 4n–p) of the 90–220 m layer.
Table 2Depth of the 5 g kg−1 halocline, Volume exchange (Qex), isopycnal upwelling (Δzρ), subglacial discharge fraction (fSD), and submarine meltwater fraction (fSM) for the four layers and four ice structure configurations. The number following ± indicates 1 standard deviation from the 3-year average.
4.1.5 Comparison to observations and variability in the water properties
Observations from field campaigns carried out in July 2012 to 2019, 2022, and 2023 generally agree well with model values of fSM, fSD+SM, and Δzρ (90–220 m layer) (Fig. S2). On the other hand, observed values for Δzρ (40–90 m layer) are generally lower than modelled values. This difference is in part because the observed subglacial discharge settling depth is ∼15 m lower than simulated. The most significant cause of this discrepancy, however, is likely the high temporal and spatial variability in the observations.
Overall, our modelling reveals that hydrographic changes in Milne Fiord following the 2020 calving event are small (Fig. 3) and well within the range of observed and modelled variability (Figs. S2 and S3). Without the exact same boundary conditions, these differences would be impossible to detect. Accordingly, observations after the MIS calving event do not reveal significant hydrographic changes compared to before (Fig. S3), except at the very surface (the thinning of epishelf lake).
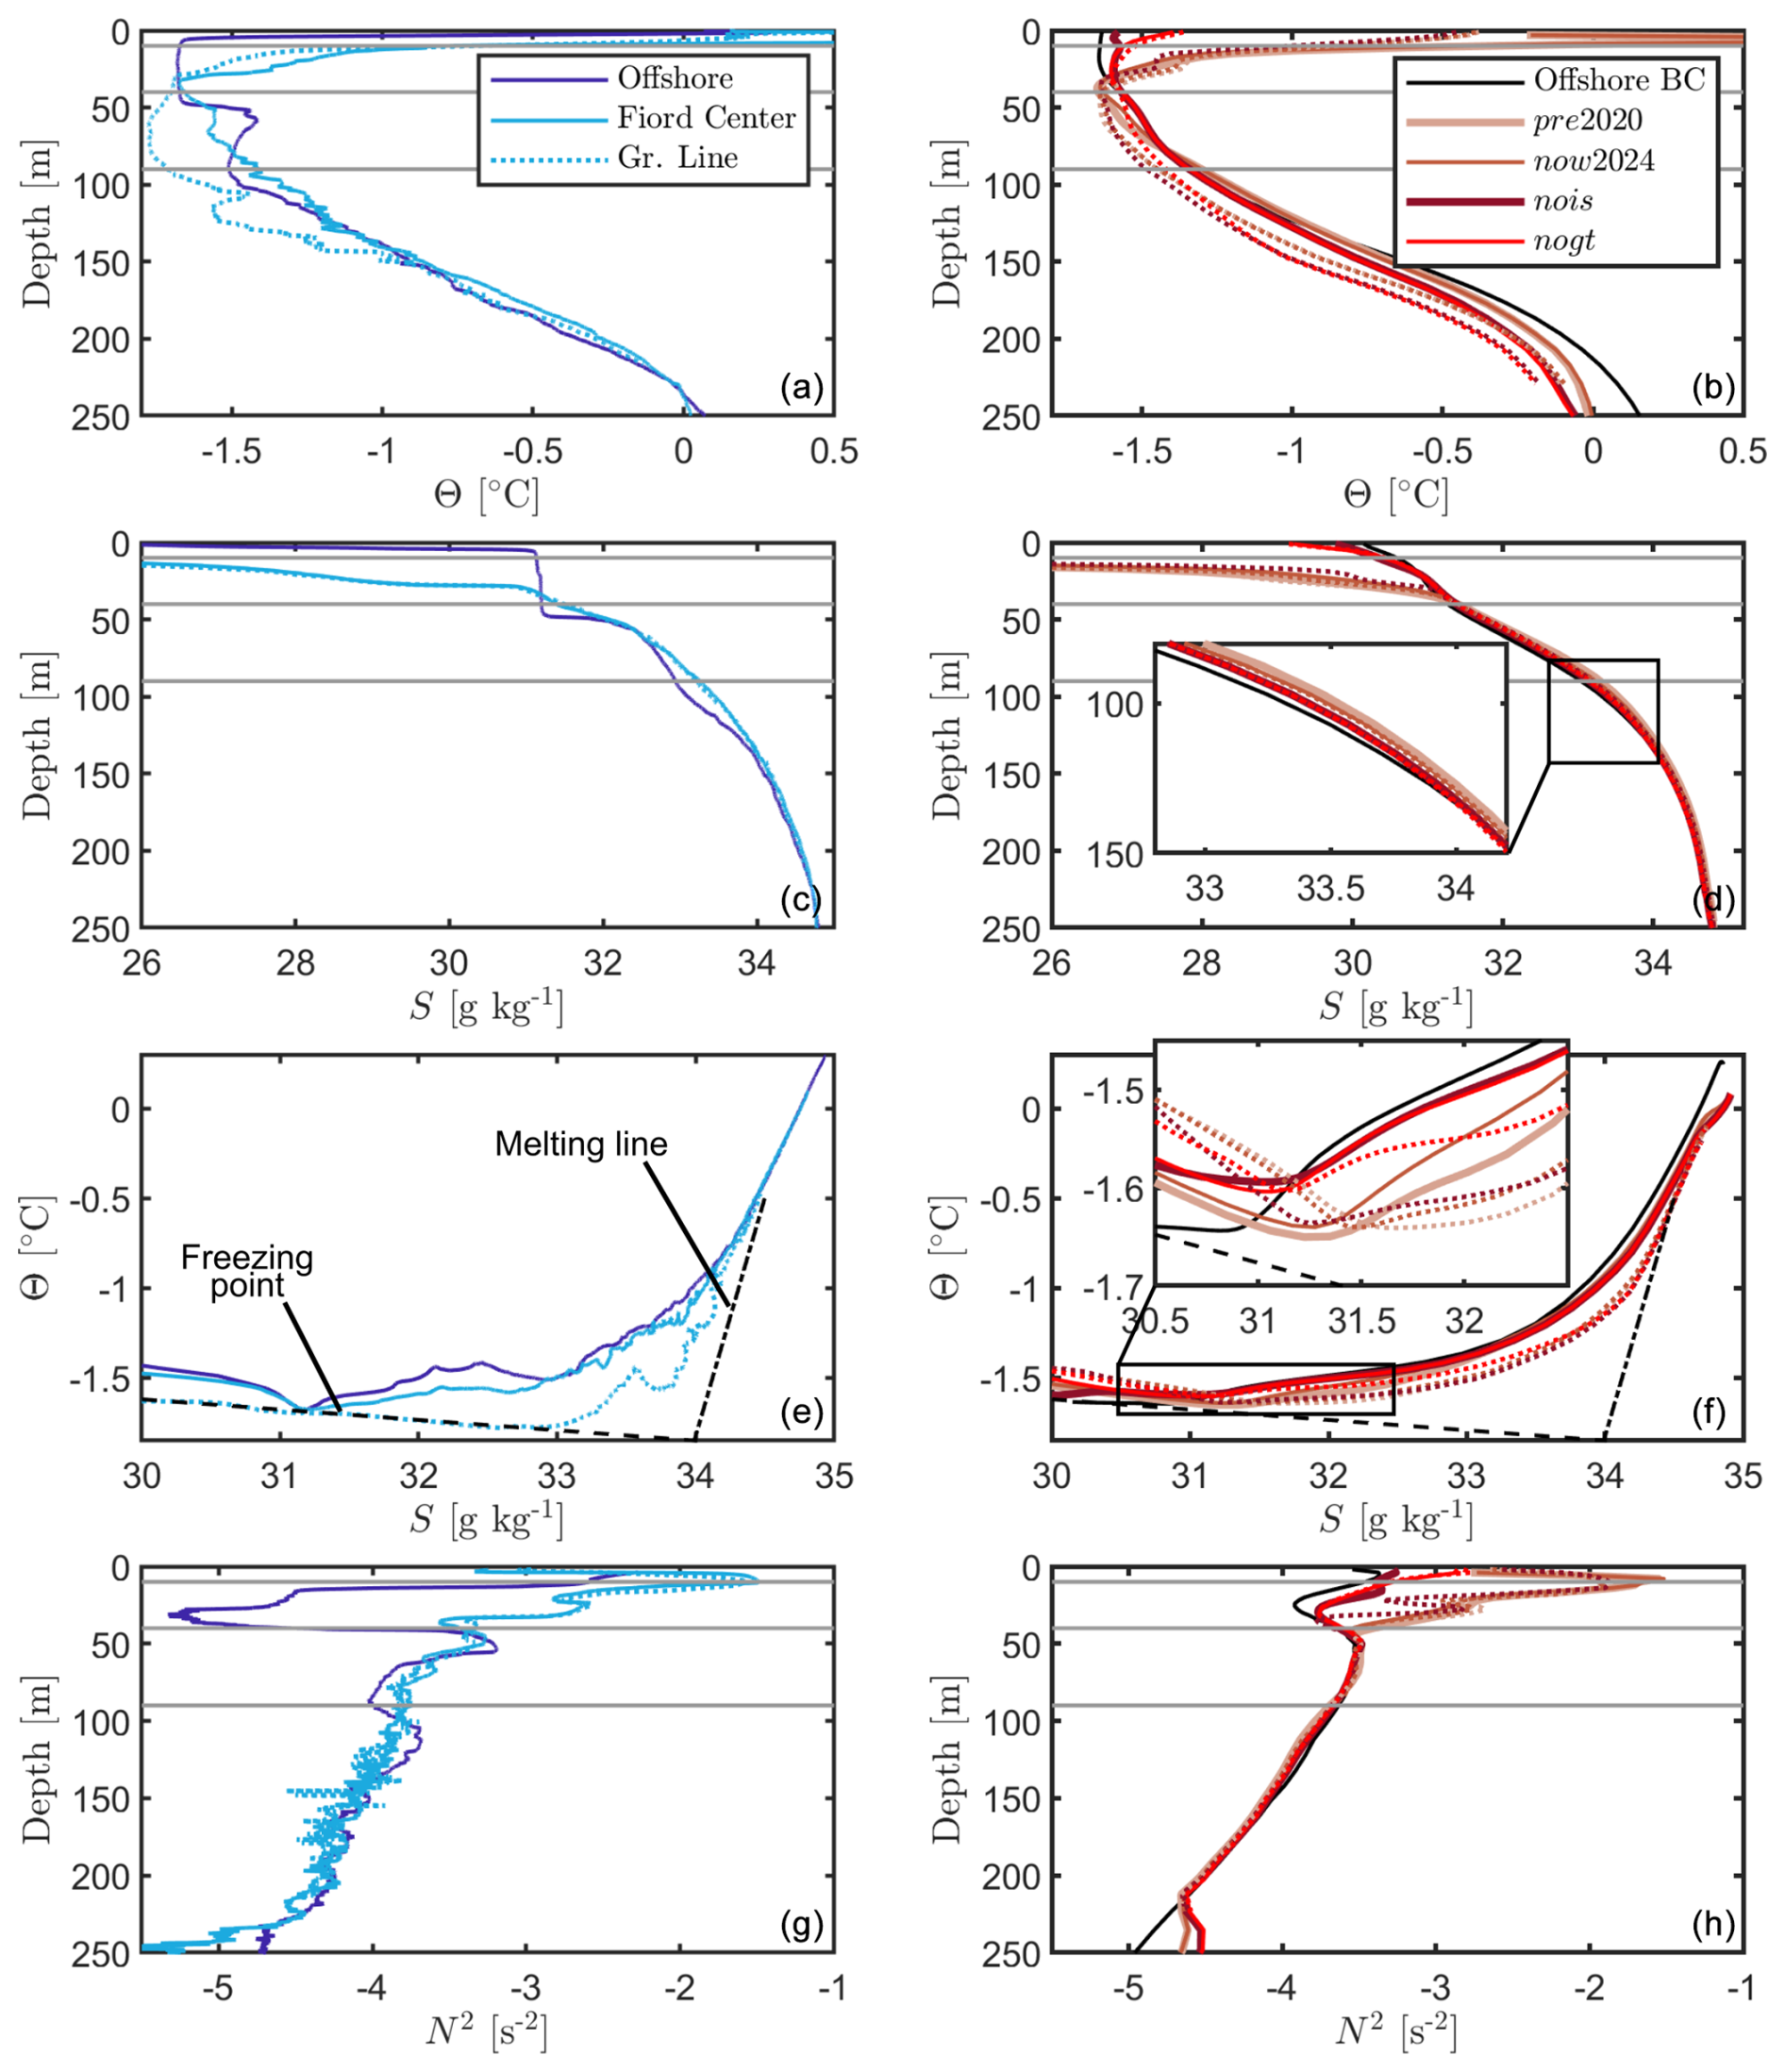
Figure 3Water properties from observations (left column) and model simulations (right column). (a) July 2013 temperature profiles from offshore (dark-blue line), at the centre of Milne Fiord (cyan line), and near the grounding line (dotted cyan line). (b) Modelled 3-year average temperature profiles at the centre of Milne Fiord (solid lines) and near the grounding line (dotted lines) and the average offshore temperature profile (black line). (c) Same as panel (a) but for salinity. (d) Same as panel (b) but for salinity. (e) Temperature–salinity plot from the three profiles in panels (a) and (c). The dot-dashed line is the melting line; water involved in melting ice cools down parallel to this line. The negative slope is the freezing point at the surface. The horizontal grey lines denote the four layers identified in Sect. 4.1. (f) Same as panel (e) but for profiles in panels (b) and (d). (g) Density stratification for the three profiles in panels (a) and (c). (h) Same as panel (g) but for profiles in panels (b) and (d).
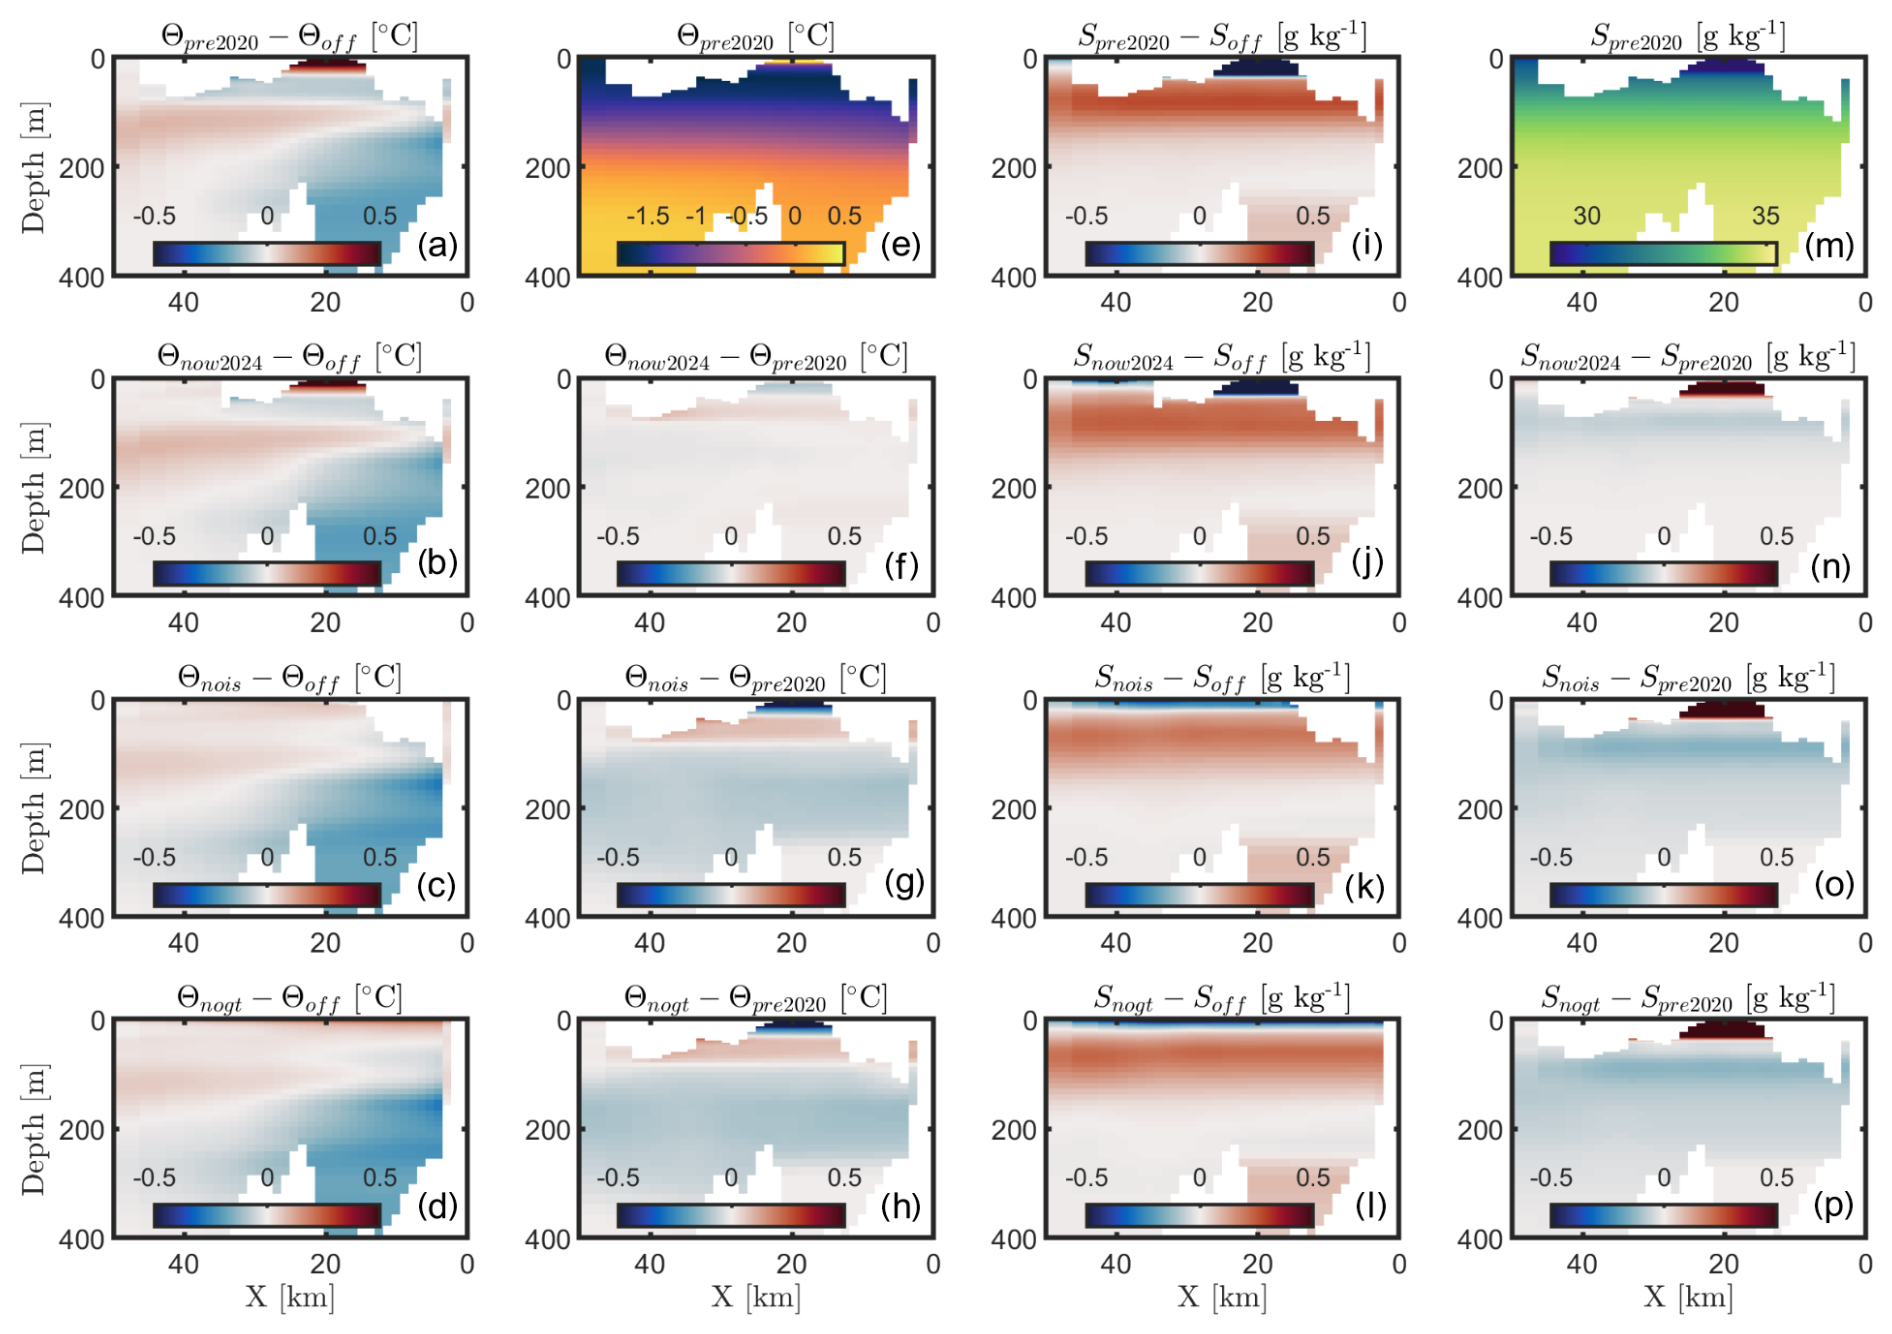
Figure 4Along-fjord temperature and salinity anomalies (relative to offshore) and differences (relative to the pre2020 run). (a–d) Time-averaged temperature anomalies (Θ-Θoff) for the four ice configurations. (e) Time-averaged temperature for the pre2020 run. (f–h) Time-averaged temperature difference between the now2024, nois, and nogt runs and the pre2020 run. (i–l) Time-averaged salinity anomalies (S-Soff) for the four ice configurations. (m) Time-averaged salinity for the pre2020 run. (n–p) Time-averaged salinity difference between the now2024, nois, and nogt runs and the pre2020 run.
4.2 Melting of the ice structures
4.2.1 Milne Ice Shelf (MIS)
The model shows that the MIS experiences both basal melting and freezing before and after the 2020 calving event (Fig. 5a, b). Melting/freezing rates are highly variable in both space (Fig. 5a, b) and time (Fig. 6a); they vary from 15×103 m3 d−1 of freezing (equivalent to an area-average thickening of 0.06 m a−1) to 75×103 m3 d−1 of melting (equivalent to 0.46 m a−1 for the pre2020 run and to 0.80 m a−1 for the now2024 run). Generally, melting occurs over areas where the ice draft is greater than ∼40 m, while freezing occurs in shallower areas. This pattern is consistent with water temperature which tends to be near the freezing point (within 0.1 °C) from 10 to 40 m (Fig. 3).
While depth predominantly controls whether melting or freezing occurs because of the temperature profile, the magnitude of the currents under the MIS (|U|) is responsible for periods of enhanced melt (M) (Fig. 6b; R2 of 0.89 between spatially averaged M and |U|). Consequently, the highest time-averaged melting rates (0.4 m a−1) are found under the thicker seaward areas of the ice shelf where currents are stronger. Conversely, the maximum freezing rates are located on the west side of the ice shelf in thinner areas where water is trapped and is therefore prone to enhanced vertical heat loss through the ice shelf as lateral exchange is not possible. The high temporal variability in melt rates under the MIS driven by currents is consistent with the unsteady circulation described in Bonneau et al. (2024b).
The 2020 calving event results in a marked increase in melting along the new ice shelf front and around the thicker ice on the west side at X=27 km where Glacier 2 feeds the MIS. However, it does not impact areas of freezing (ice draft <40 m; Fig. 5d). This increase in melting is due to stronger currents now reaching the remaining ice shelf (Fig. 6b) and the warming of the 40–90 m layer inside the fjord (Figs. 4f, 6c), suggesting a weak positive feedback where calving leads to more basal melting, thereby further weakening the ice shelf.
The temporal and spatial average melting rate over the ice shelf is 0.01 m a−1 for the pre2020 run and 0.005 m a−1 for the now2024 run. These values are negligible compared to the temporal and spatial average surface mass balance of 0.30 m a−1 from 2008 to 2017 (White, 2019). However, similarly to the basal mass balance, the surface mass balance of the MIS is spatially variable and has a strong along-fjord gradient, with average ablations of 0.16 m a−1 over the down-fjord half of the ice shelf (X>32 km) and 0.55 m a−1 over the up-fjord section (White, 2019). Therefore, basal melting can be an important process where the ice shelf is thick (>50 m). On the down-fjord section of the ice shelf, it can be the dominating thinning mechanism.
The submarine melting/freezing rate estimates from the pre2020 run have a similar spatial pattern to estimates using a simplified two-equation parameterization and hydrographic observations (Hamilton, 2016). However, melt rates in this realistic numerical simulation are, on average, 10 times less than those estimated by Hamilton (2016) and include negative values (not permitted by the Hamilton (2016) model). By combining the surface mass balance gradient from White (2019) with the basal melt rate estimates from the pre2020 run, we obtain an average ice shelf thinning rate of 31 cm a−1, which closely matches the 29 cm a−1 obtained by Mortimer et al. (2012) for the 1981–2009 period (Fig. 5e). This correspondence supports the low rates of submarine melting obtained in this study and suggests that Hamilton (2016) employed drag and transfer coefficients values that were likely too high and overestimated |U|. The currents they employed were 2–8 times higher than those modelled here. Furthermore, the spatial distribution of thinning over the MIS obtained by Mortimer et al. (2012) aligns well with our results (Fig. 5e), providing additional confidence in the modelled basal melt rates.
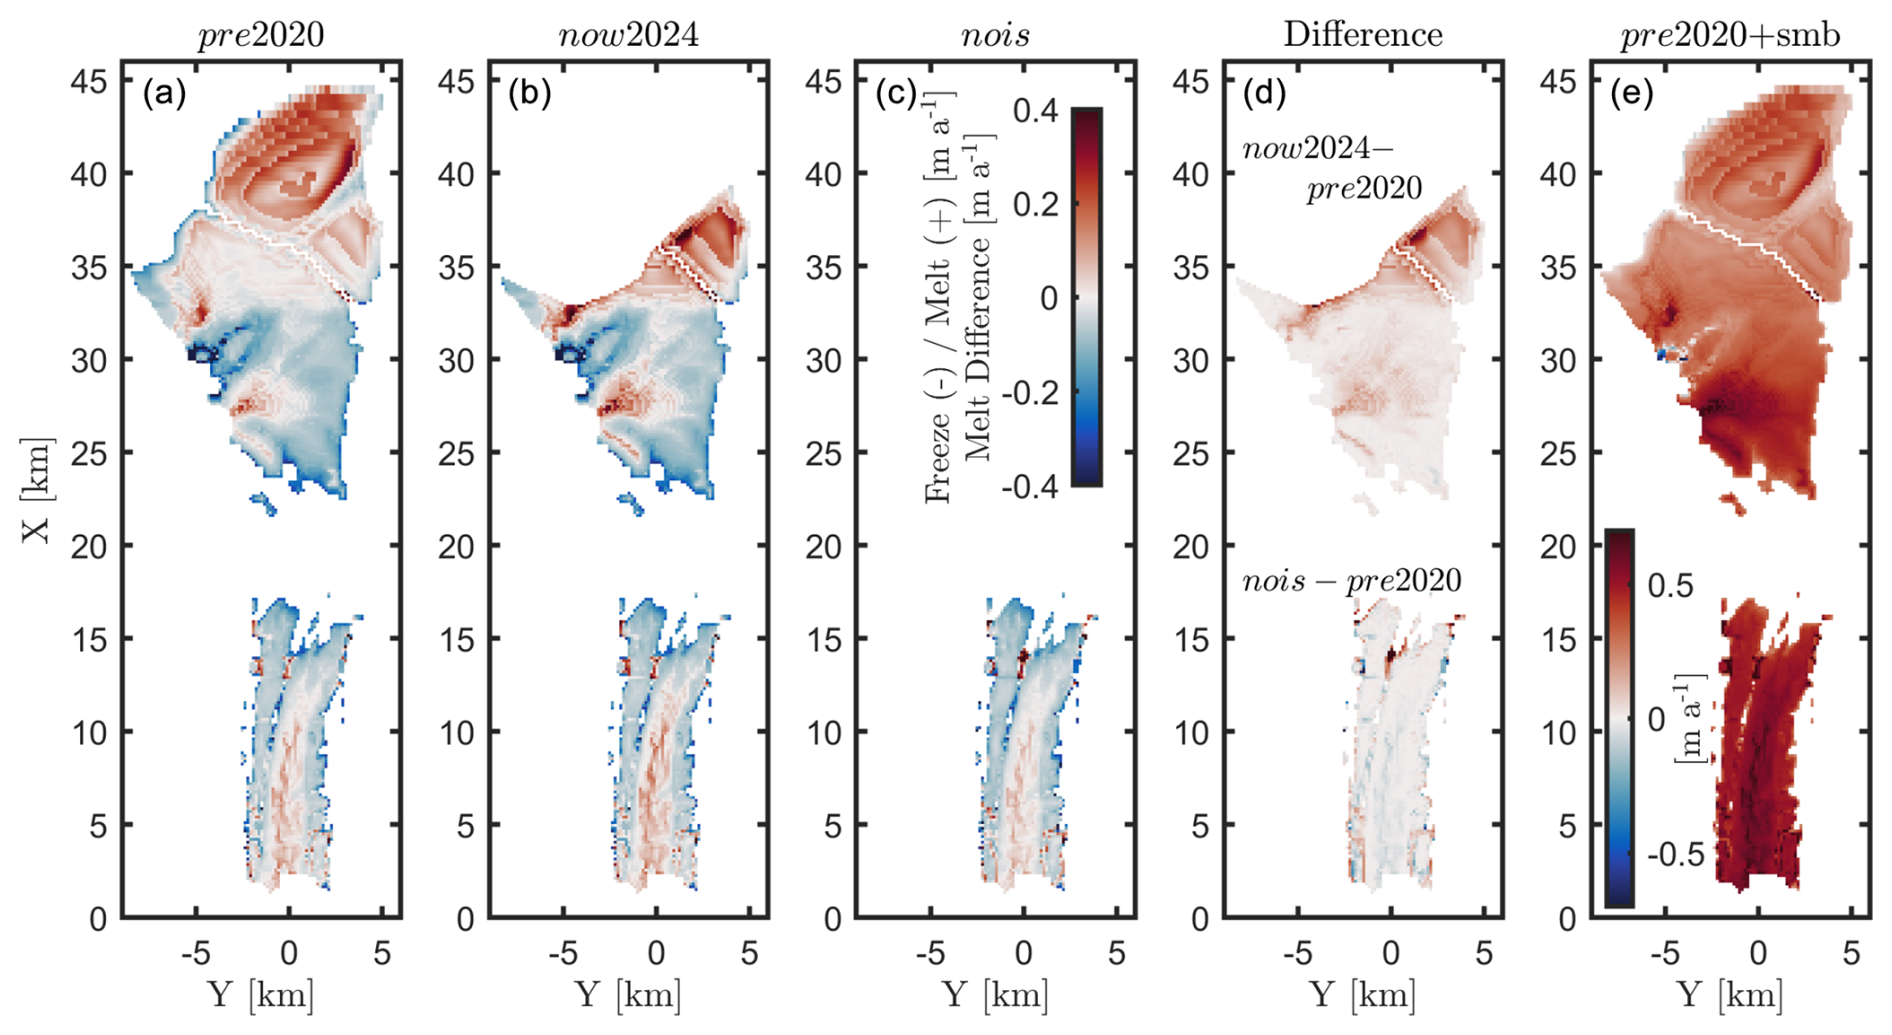
Figure 5Time-averaged basal melting and freezing of the Milne Ice Shelf (MIS) and the Milne Glacier tongue (MGT) from November 2011 to November 2014. (a) Average melting (positive) and freezing (negative) rates for the pre2020 run. Colour scale in panel (c). (b) Same as panel (a) but for the now2024 run. (c) Same as panel (a) but for the nois run. (d) Melt rate difference between the now2024 and pre2020 runs for the MIS and between the nois and pre2020 runs for the MGT. The colour scale is shown in panel (c). (e) Thinning rate for the MIS and MGT using the surface mass balance from White (2019) and submarine melting from the pre2020 run in panel (a). Note the different colour scale for panel (e) (up to 0.6 m a−1).
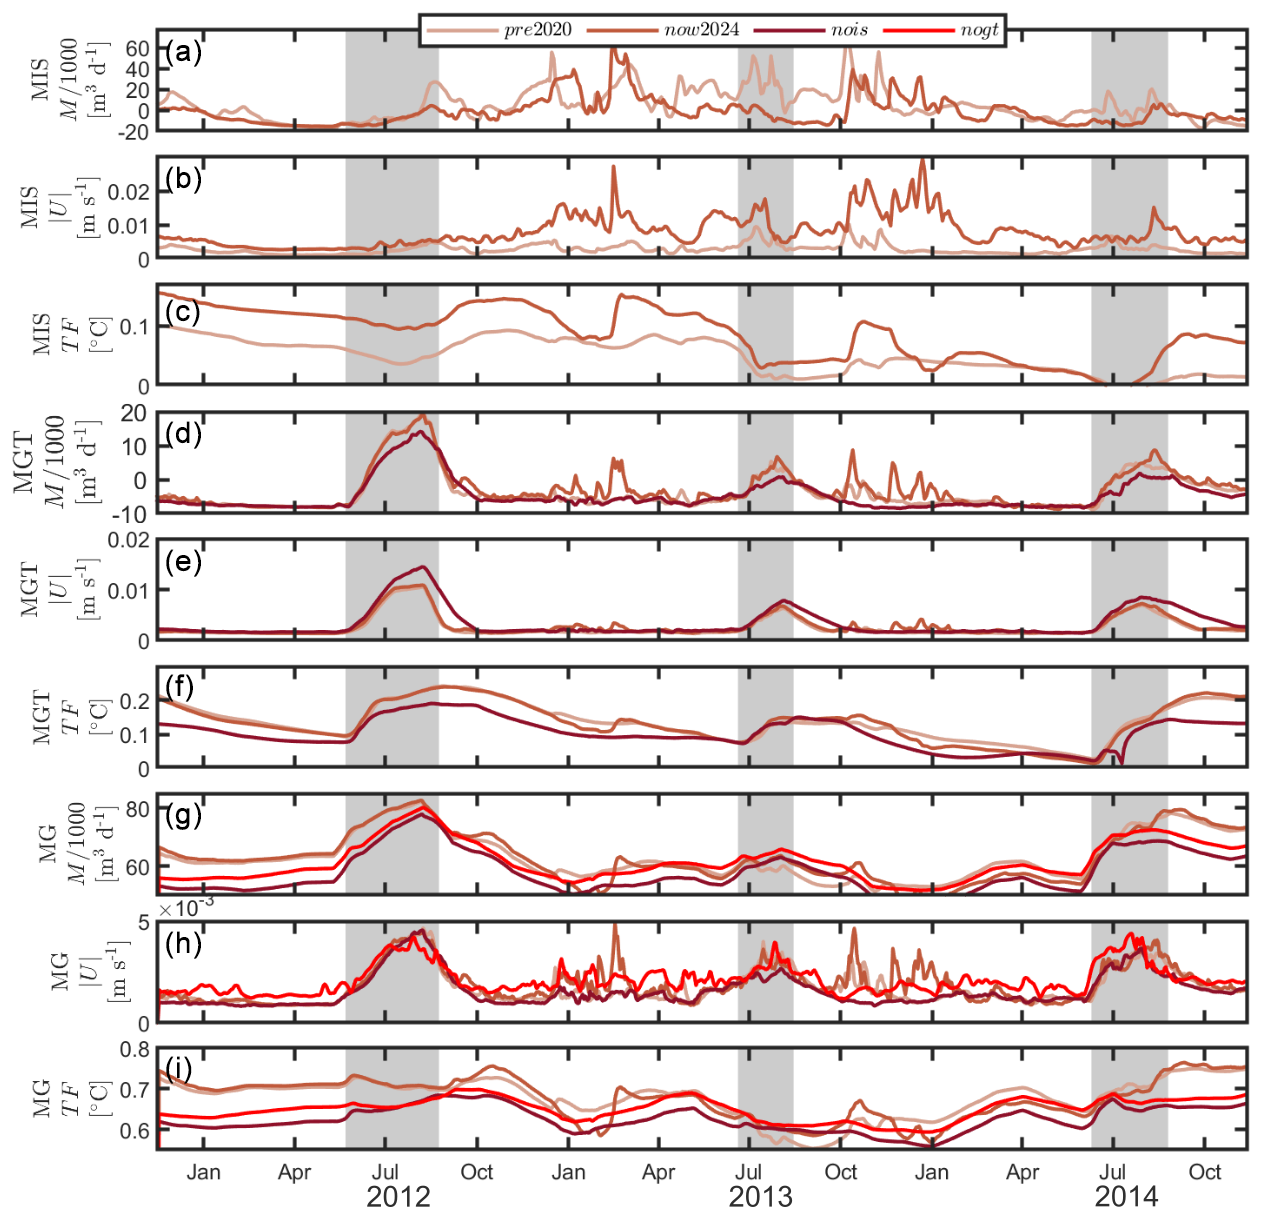
Figure 6Time series of total melt rates (M), spatially averaged current speed (|U|), and spatially averaged thermal forcing (). For the MIS and MGT, |U| and TF are from the cells directly under the ice. For the glacier face, |U| and TF are from an across-fjord cross-section 1 km down-fjord from the glacier. Panels (a)–(c) are for the Milne Ice Shelf (MIS), panels (d)–(f) are for the Milne Glacier tongue (MGT), and panels (g)–(i) are for the Milne Glacier face (MG). The grey shading denotes the periods with subglacial discharge.
4.2.2 Milne Glacier tongue (MGT)
The basal melting of the MGT shows a similar spatial pattern to the MIS, with freezing above an ice draft of 40 m and melting below (Fig. 5a). On the other hand, contrary to the MIS, the melting of the MGT has a clear seasonal pattern, driven by velocity and temperature increase during and following periods of subglacial discharge (Fig. 6d–f). Nonetheless, the melting/freezing rates are very small (−0.1 m a−1 m a−1). The spatially averaged rate for the entire simulation is equivalent to 0.02 m a−1 of freezing for the pre2020 run. This value is negligible compared to the surface mass balance (melting rate of ∼0.55 m a−1; Fig. 5a, e; White, 2019). The negligible basal melting rates obtained over most of the MGT are in agreement with remote sensing estimates from 2011 to 2015 (Hamilton, 2016). However, these melting rates at the bottom of the keel are perhaps too low, likely because of the very low currents there (Fig. 6e) and because ShelfIce does not take into account the ice slopes, which are known to enhance submarine melting (Rosevear et al., 2025).
The partial removal of the ice shelf (now2024) has no significant effect on the basal melting rates of the MGT, current magnitude, and thermal forcing (Fig. 6d–f). The complete removal of the ice shelf (nois) results in an increase in current magnitude by 20 % and a decrease in thermal forcing by 23 % because of stronger exchange with the coastal shelf (Sect. 4.1). The net effect is a 70 % increase of the freezing rates, which overall are still negligible (3 cm a−1).
4.2.3 Glacier face
The melting of the glacier face in the pre2020 run was already discussed in Bonneau et al. (2024a). The main takeaways are that, although melting increases by ∼15 % in summer due to subglacial discharge, most of the melting (∼ 85 %) occurs outside of the subglacial discharge plumes and does not exhibit a strong seasonality. The average melting rate of the glacier face is 33 m a−1, with rates of ∼100 m a−1 at the depth of the grounding line (Fig. 7a).
With a surface slope of −0.02, a basal slope of 0.02 (Fig. 1c), and a grounding line retreat of 53 m a−1 (centreline; Antropova et al., 2024), Eq. (5) yields a thinning rate δh of 0.93 m a−1. Combined with ablation stake measurements closest to the grounding line showing a negative surface mass balance (δhs) of cm a−1(White, 2019) and an undercutting rate (MGL) of 87.2 m a−1, Eq. (6) yields an average glacier velocity of 85.9 m a−1, which compares well with the observed surface velocities (20 to 160 m a−1; Van Wychen et al., 2016; Millan et al., 2017; Wychen et al., 2020; Antropova et al., 2024), supporting the submarine melt rates obtained from this numerical model.
The results from the four model runs with different ice structure configurations show that the presence of the MIS and MGT has a very limited impact on the melting of the Milne Glacier face (Fig. 7). Melting rates from the now2024 run are the same as the melting rates from the pre2020 run (within 0.5 %). The complete removal of the ice shelf (nois run) leads to a 9 % decrease in melting. This decrease is due to the cooling and freshening of the 90–220 m layer (Figs. 3 and 4), which decreases the thermal forcing by ∼0.05 °C. The further loss of the glacier tongue partly offsets this cooling, resulting in an increase in melting rate for the nogt run compared to the nois run, although, in both cases, the melting rate is lower than before the calving event (pre2020 run). A noteworthy change arising from the removal of the glacier tongue is the surfacing of the two subglacial discharge plumes (Fig. 7d). This is due to the lower density stratification in front of the glacier (Fig. 3h) because of the increased exchange with the rest of the fjord (fresher water not trapped behind the glacier tongue; Fig. 3d).
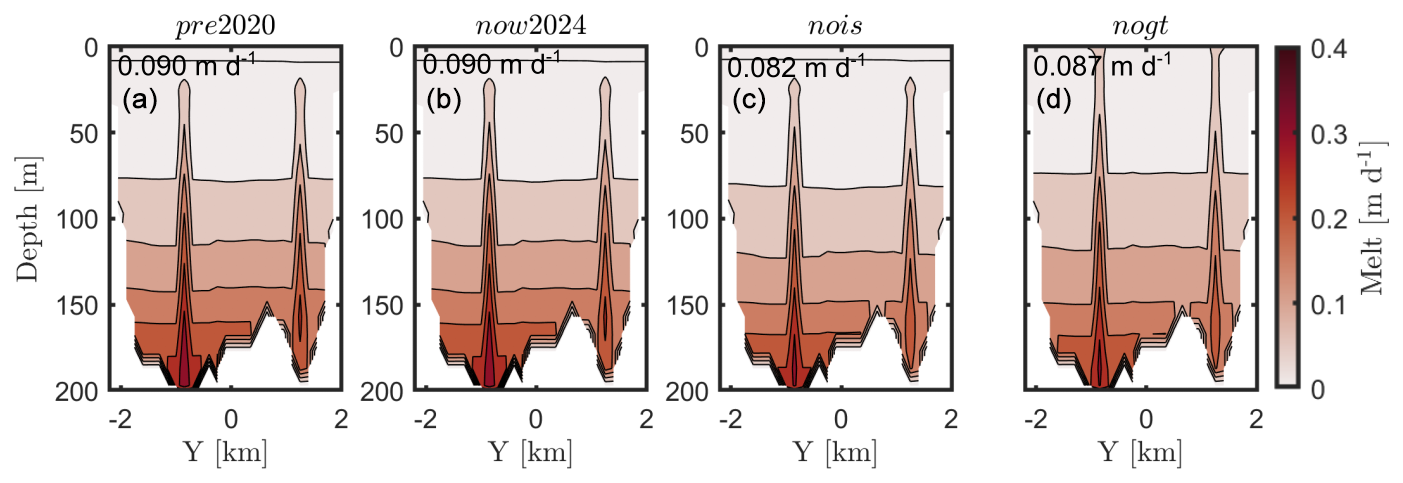
Figure 7Time-averaged melting rates over the glacier face for the pre2020 (a), now2024 (b), nois (c), and nogt (d) simulations.
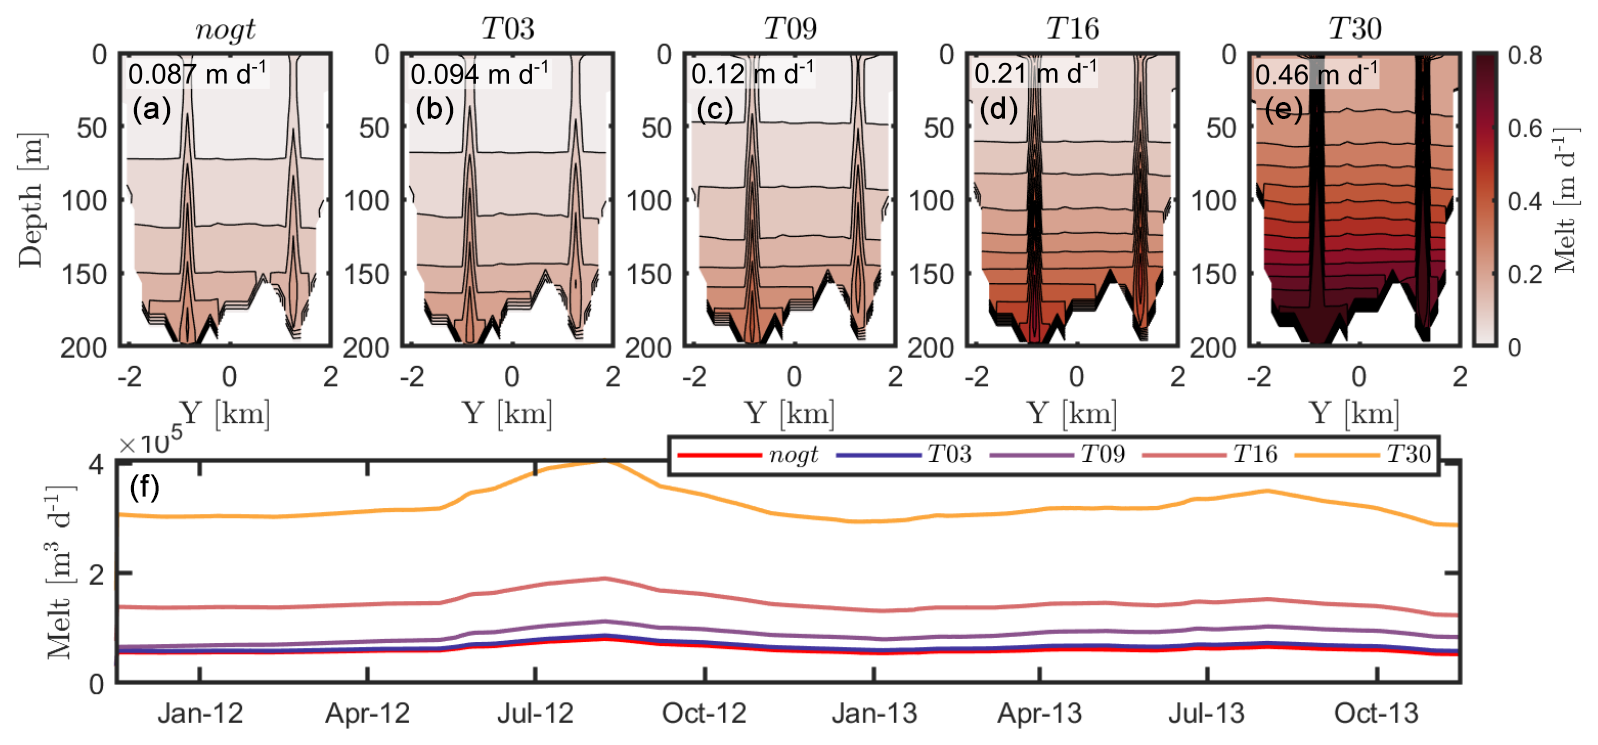
Figure 8Melting rate of the glacier face for the five ocean warming scenarios (a–e; see subpanel title). The spatial and temporal average from November 2011 to November 2013 is in the top-left corner of each panel. (f) Time series of spatially integrated melting over the Milne Glacier face for the different temperature scenarios (see legend).
According to our simulation with different ice structure configurations, the presence of the MIS and MGT has a negligible impact on the melting rate of the glacier face (≤9 %; Fig. 7). Therefore, the results of this study of the impact of ocean warming on the melt rate of Milne Glacier are applicable regardless of the state of the ice shelf and glacier tongue.
The time-averaged TF (Θ−Θf) is 0.76, 0.84, 1.2, 1.5, and 3.1 °C for the nogt T03, T09, T16, and T30 runs, respectively. The results show that a TF increase of 0.08 °C (T03) has limited impact (total melt over the glacier face increases by 8 %) but that further warming has a more substantial impact: 38 % increase for T09, 141 % increase for T16, and 420 % increase for T30 (Fig. 8). For the five simulations, melt rates increase by a similar proportion during summer: up to ∼25 % for summer 2012 and up to 10 % for summer 2013, i.e. linear response to subglacial discharge. We note a possible residual effect of subglacial discharge on melting as elevated values of submarine melting starting at the onset of subglacial discharge persist ∼3 months after subglacial discharge stops.
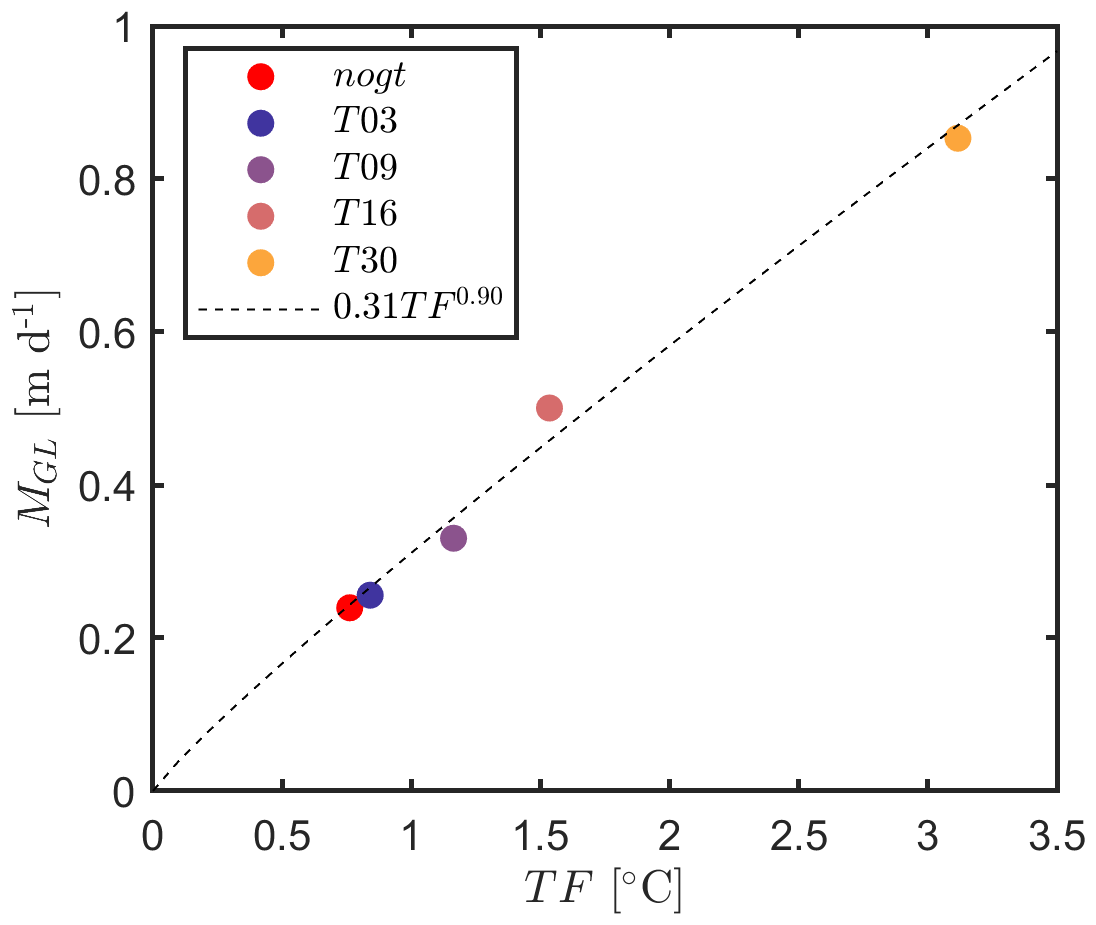
Calculating the submarine melting rate at the grounding line (MGL) as the average melting at 187 m and comparing it to the parameterization of Rignot et al. (2016) Eq. (4) reveals substantial discrepancies between this parameterization and our results (> factor 2; Fig. S4). Therefore, the coefficients of Eq. (4) were determined using the five ocean warming simulations. The expression obtained for MGL for Milne Fiord is
The main difference between our parameterization (Eq. 8) and the one from Rignot et al. (2016) (Eq. 4) is the exclusion of the subglacial discharge term (qsd). This exclusion is justified by our optimization (least-squared method), which yields a better correlation between modelled and parameterized MGL when A is set to 0. This is explained by the negligible increase in undercutting (MGL) during summer (Fig. S4); unlike the total amount of melting over the whole glacier face (e.g. Figs. 6g, 8f), MGL does not exhibit a seasonal cycle. We attribute this major difference in the parameterization proposed by Rignot et al. (2016) to the different numerical setup: Rignot et al. (2016) (using the model from Xu et al., 2013) modelled a 150 m wide glacier with two subglacial discharge outflows, while we modelled a 4000 m wide glacier with two outflows. Therefore, the proportion of the glacier face affected by subglacial discharge plumes at depth is ∼27 times lower in our case, resulting in a negligible dependence of MGL on subglacial discharge when averaged over the width of the glacier.
6.1 Ice cover
This is the first study that we are aware of that examines the impact of ice shelf or glacier tongue calving on water properties and submarine melting rates in a glacial fjord. Our results show that the removal of ice structures in Milne Fiord has a limited impact on water properties in the fjord. The exception is the surface water (above 15 m depth), which becomes considerably saltier following the complete removal of the ice shelf and drainage of the epishelf lake. This drainage will lead to sea ice formation inside the fjord (instead of the formation of lake ice) resulting in occasional ice-free periods in summer, as is seen in neighbouring fjords (e.g. Veillette et al., 2008). For example, since the calving of Ward Hunt Ice Shelf (80 km east; Fig. 1a) in 2001 and the subsequent drainage of its epishelf lake, open water was visible in Disraeli Fiord in 17 out of the 20 following summers. In stark contrast, open water in Milne Fiord has occurred only once during the same period.
6.2 Ice shelf and glacier tongue melting
The low simulated submarine melting rates under the MIS and MGT (space and time average <0.02 m a−1) are consistent with studies which identify atmospheric warming as the main cause for the loss of more than 75 % of the ice shelf extent along Ellesmere Island over the last 60 years (White and Copland, 2019; Copland et al., 2017, 2007; Mueller et al., 2003). Warmer air temperatures are also thought to have played a role in the recent retreat of Hunt Fjord Ice Shelf in northern Greenland (Ochwat et al., 2023). However, the comparison of the spatially varying basal melt rates obtained in this study with surface mass balance estimates reveals that submarine melting can be the dominating thinning mechanism where ice is thick (>50 m) near the mouth of the fjord. At this location, the surface mass balance is also less negative because of lower summer temperature, higher precipitation, and summer fog (White, 2019). We note observations of surface mass balance even closer to equilibrium near the seaward edge of Ward Hunt Ice Shelf (0.07 m a−1 of melting; Braun et al., 2004). According to ORAS5 reanalysis (Copernicus Climate Change Services, 2021), the thermal forcing of the ocean above 100 m in front of Milne Fiord did not change substantially between 1958 and 2019 (Fig. S5). Considering the seaward portion of Ayles Ice Shelf (15 km to the east of Milne Fiord, calved in 2005) was ∼44 m thick (Copland et al., 2007) and that the seaward portion of Ward Hunt is ∼50 m thick (Braun et al., 2004), it appears that the Ellesmere Island Ice Shelf was sufficiently thick for submarine melting to be an important component of the mass balance. Thus, we hypothesize that submarine melting has substantially contributed to the disintegration of the Ellesmere Island Ice Shelf by weakening its seaward edge. Since the ocean along the north coast of Greenland has a similar water column structure than along Ellesmere Island (Johnson et al., 2011; Schaffer et al., 2017), it is not surprising that ocean-induced melting is thought to have played a role in the more recent retreat of ice shelves in northern Greenland (Hill et al., 2017; Millan et al., 2023).
The limited sensitivity of submarine melting rates to past (now2024) and future (nois) calving events in Milne Fiord is similar to the results obtained in a recent numerical study of Pine Island Ice Shelf (Bradley et al., 2022), where it was estimated that the retreat of the ice front by up to 50 km increased the spatial and temporal average ice shelf melt rate by less than 10 %. Similar results were also found for Larsen C Ice Shelf for which numerical simulations indicate that the calving of iceberg A-68 (5800 km2) did not substantially impact the spatial and temporal average ice shelf melt rate (Poinelli et al., 2023). However, similarly to our results from the now2024 run, Poinelli et al. (2023) showed a local increase in melting along the new ice shelf front (Fig. 4b, c). Moreover, even though the spatial and temporal average melt rates did not vary significantly following the calving of A-68, Poinelli et al. (2023) calculated a doubling of melt rates around an important ice shelf pinning point and noted that localized change in submarine melt rates can have an overall destabilizing impact. As the MIS is only grounded on its sides, the pinning points are lateral and the most important one is likely where Glacier 2 (west side, X=27 km; Fig. 1b) feeds the ice shelf. Our results show this is the location where submarine melt rates increase the second most following the 2020 calving event (∼75 % increase), suggesting that enhanced local submarine melting may lead to further structural weakening.
6.3 Glacier face melting
Using two-dimensional numerical simulations of Petermann Glacier, Cai et al. (2017) argued that the melt rates at the grounding line should increase following the removal of the ice shelf, as this would lead to a steeper under-ice slope. We cannot confirm that this would be the case for Milne Glacier, as the slope near the grounding line was kept constant in our numerical experiments. However, as our results show, water reaching the grounding line has similar temperature (within 0.15 °C) and salinity (within 0.1 g kg−1) regardless of the ice structure configurations. Therefore, it is likely that local melt rates will increase if the slope becomes steeper.
Comparing the two northern Greenland fjords where the Petermann and Ryder glaciers terminate, Jakobsson et al. (2020) found warmer water in Petermann fjord because of a deeper sill. This difference is perhaps why the grounding line of Ryder is stable (Holmes et al., 2021), while the grounding line of Petermann is retreating (Millan et al., 2022), highlighting the role of submarine melting at depth. Milne Glacier, which is currently retreating and grounded above the sill, likely shares a similar sensitivity to ocean conditions to Petermann Glacier.
Consistent with our results, numerical simulations of Pine Island Ice Shelf (Bradley et al., 2022) and Larsen C Ice Shelf (Poinelli et al., 2023) with constant ice morphology also suggest that major calving events have limited impact on submarine melting along the grounding line, with more pronounced impacts near the seaward edge or along the main ocean intrusion pathways.
6.4 Future submarine-melting-induced retreat of Milne Glacier
Using the MGL parameterization (Eq. 8), a constant surface mass balance (), and a constant glacier velocity (uG=85.9 m a−1) calibrated with the observed grounding line retreat (53 m a−1), we calculate grounding line retreat for three different greenhouse gas emission scenarios (SSP126, SSP245, and SSP585; S1). For each of these scenarios, the ocean temperature (therefore TF) is determined by using the (time- and depth-varying) multimodel mean temperature increase. For each scenario, MGL is calculated using the time- and depth-varying TF (Eq. 8), then the glacier retreat is calculated for 1 year (Eq. 7). The grounding line position and depth are then updated, and the retreat for the next year is calculated.
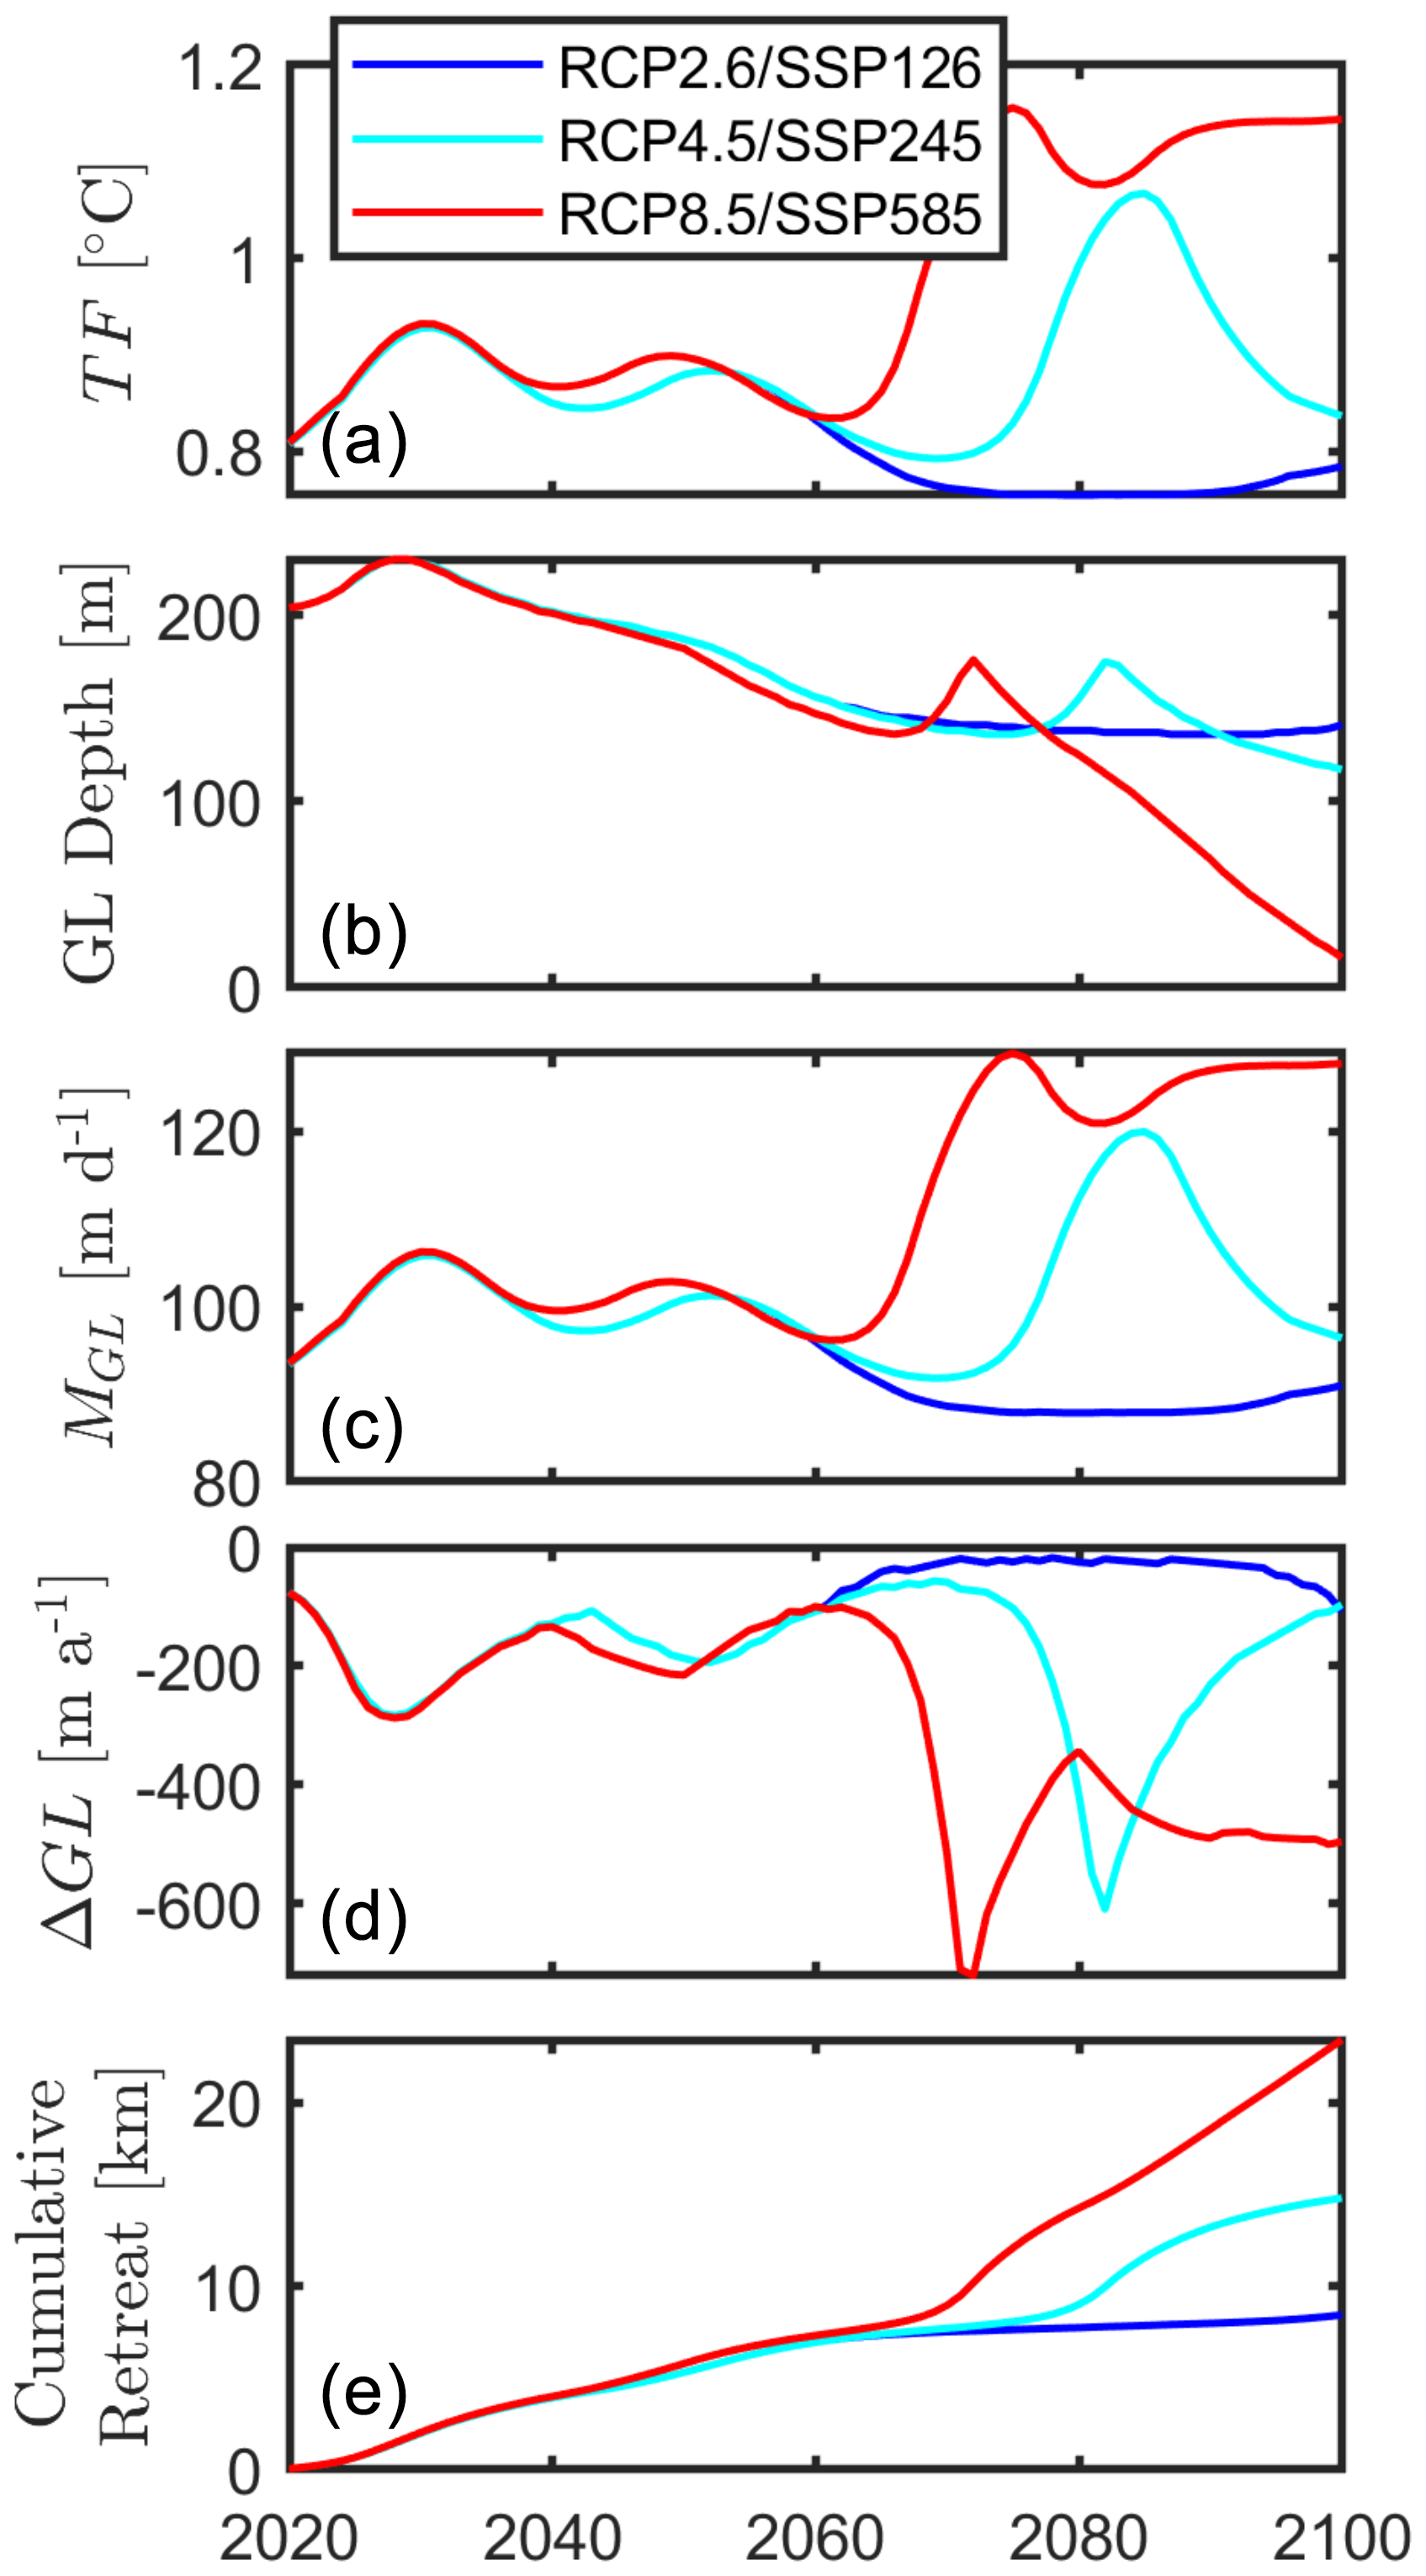
Figure 10Submarine-melting-induced retreat of Milne Glacier according to different carbon emission scenarios (see legend). Time series of (a) thermal forcing, (b) depth of the grounding line, (c) undercutting rate, (d) submarine-melting-induced retreat rate of the grounding line, (e) cumulative retreat of Milne Glacier grounding line.
These estimates suggest that the grounding line of Milne Glacier will experience an accelerated retreat until 2030 and a continual near-constant rate of retreat of ∼200 m a−1 during the following 30 years, regardless of the greenhouse gas emission scenario (Fig. 10). After 2065, the low carbon emission scenario (RCP2.6/SSP126) leads to a stabilization of the glacier, while the moderate and high greenhouse gas emission scenarios result in an uninterrupted retreat. The rate of retreat of 200 m a−1 obtained from 2030 to 2035 is similar to what was observed for Umiamako Isbrae in West Greenland (180 m a−1 from 1989 to 2015; Rignot et al., 2016) and Petermann Glacier in northern Greenland (130–230 m a−1 from 1992–2021; Millan et al., 2022).
Varying the basal slope (αb) and the surface slope (αs) by ±50 % and increasing the surface mass balance (δhs) by a factor of 4 does not significantly alter these results (Fig. S6). However, these estimates do not include glacier dynamics. For instance, the MIS, MGT, and perennial ice likely provided some buttressing to the glacier presently and in the past (Scambos et al., 2004; Mouginot et al., 2015, 2019). The loss of these ice structures could therefore lead to a speed-up of the glacier, resulting in thinning and further grounding line retreat (Joughin et al., 2021; Millan et al., 2022). The MIS, MGT, and perennial ice also protect the glacier from ocean swell and currents (Glasser and Scambos, 2008; Massom et al., 2018). These processes could also lead to faster rates of retreat than what is estimated here. Finally, not accounted for in this study, air temperature will also increase (e.g. Cai et al., 2021), resulting in a more negative surface mass balance and additional subglacial discharge. These two mechanisms will likely lead to additional glacier retreat. Numerical modelling of Milne Glacier would allow the investigation of dynamical ice feedback and enable the validation of the grounding line retreat parameterization.
The calculated and predicted retreat of Milne Glacier is in line with the ongoing retreat of >80 % of marine-terminating glaciers in the Arctic (Kochtitzky and Copland, 2022) and the continual retreat of ice shelves (Hill et al., 2017; Carr et al., 2017; White and Copland, 2019). The retreat of marine-terminating glaciers directly leads to sea level rise (Jakob and Gourmelen, 2023; Greene et al., 2024) but can also transform ecosystems that depend on glacier-induced upwelling for nutrient delivery (Bhatia et al., 2021; White et al., 2025).
In this study, we employed a numerical model evaluated against observations to explore ice–ocean interactions in Milne Fiord. To investigate the rapid changes currently happening in this system, we examined the impact of the loss of ice structures and ocean warming on the hydrography and submarine melting rates. The main results are as follows:
-
Although the spatial and temporal average submarine melt rate under Milne Ice Shelf (<0.02 m a−1) is negligible compared to the surface mass balance (0.3 m a−1), submarine melting is the dominant thinning mechanism locally where the ice shelf is >50 m thick near the ocean.
-
The loss of ice structures impacts the hydrography of Milne Fiord differently with depth. Above 15 m, the removal of the ice shelf results in a strong salinity increase (>15 g kg−1). Below 15 m, the impact of the removal of ice structures is limited to a temperature change of 0.15 °C and salinity change of 0.2 g kg−1, resulting in small changes in spatial and temporal average submarine melting/freezing rates. However, two specific locations now experience enhanced melting following the 2024 MIS calving event: the new ice shelf front and the basal surface of Glacier 2. These localized regions, where melt rates show enhanced sensitivity to change in ice structure configuration, suggest a weak positive feedback loop in which ice shelf calving leads to more melting which could promote more ice shelf calving.
-
The melting of the Milne Glacier face responds quasi-linearly to ocean warming. According to the analysed CMIP5 and CMIP6 predictions, water offshore of Milne Fiord will warm by at least ∼0.2 °C by 2040 regardless of the carbon emission scenario. Predictions based solely on changing submarine melting indicate a retreat of the Milne Glacier grounding line by 8 km by 2065. These predictions also suggest a subsequent stabilization for low greenhouse gas emission scenarios and further grounding line retreating for higher emission scenarios.
Situated at the centre of Tuvaijuittuq's coastline, Milne Fiord is rapidly changing. This study highlights the vulnerability of this newly designated Marine Protected Area: the ice shelf and glacier tongue will disappear, non-perennial sea ice will replace the permanent lake ice, and glacier retreat will likely accelerate in the next decade.
The mooring, CTD, and ADCP data used to validate the model are available in the Polar Data Catalogue (https://doi.org/10.21963/12101, Mueller et al., 2021b; https://doi.org/10.21963/12102, Mueller et al., 2021a; https://doi.org/10.21963/13345, Hamilton et al., 2024; https://doi.org/10.21963/13383, Mueller et al., 2024). The MITgcm inputs to run the simulation and the outputs are available in the Federated Research Data Repository (https://doi.org/10.20383/103.0887, Bonneau et al., 2024c).
The supplement related to this article is available online at https://doi.org/10.5194/tc-19-2615-2025-supplement.
JB built and validated the numerical model, analysed the output, and prepared the article. BEL funded the fieldwork and contributed to drafting the article. DM designed, funded, and participated in the fieldwork and helped draft the article. YA participated in the fieldwork, contributed to drafting the article, and conducted the remote sensing analysis of the glacier used to validate the model and estimate future retreat. AKH designed and participated in the fieldwork and assisted with drafting the article.
The contact author has declared that none of the authors has any competing interests.
Publisher's note: Copernicus Publications remains neutral with regard to jurisdictional claims made in the text, published maps, institutional affiliations, or any other geographical representation in this paper. While Copernicus Publications makes every effort to include appropriate place names, the final responsibility lies with the authors.
The authors thank the Polar Continental Shelf Program and all the individuals who took part in field campaigns from 2011 to 2019. We also acknowledge Tom Cowton and Ken Zhao for providing the IcePlume package and Brice Noël for providing the 1 km RACMO2.3 data.
This project was supported by the following organizations: Killam Foundation (Jérémie Bonneau: UBC Doctorate fellowship 333), The University of British Columbia (Jérémie Bonneau: grant nos. 4YF-6569 and 4YF-6456), Natural Sciences and Engineering Research Council of Canada (Bernard E. Laval: grant nos. NRS-2018-517975 and RGPIN-2018-04843; Derek Mueller: grant nos. NRS-2011-408463, NRS-2016-408463, DG-2011-402314, and DG-2016-06244), the Polar Continental Shelf Program (Derek Mueller: grant nos. 604-12, 626-13, 651-14, 642-15, 636-16, 647-17, 627-18, and 651-19), ArcticNet GO-Ice (Derek Mueller, Jérémie Bonneau, Yulia Antropova), ArcticNet Freshwater Resources of the Eastern Canadian Arctic (Derek Mueller), ArcticNet Impacts of the Changing Global Environment at Nunavut's Northern Frontier (Derek Mueller), Canada Foundation for Innovation (Derek Mueller: grant no. 31410), The Ontario Research Foundation (Derek Mueller: grant no. 31410), Polar Knowledge Canada (Jérémie Bonneau, Yulia Antropova: NSTP), and The Digital Alliance of Canada (Derek Mueller: grant no. 4332-22).
This paper was edited by Christian Haas and reviewed by two anonymous referees.
Antropova, Y. K., Mueller, D., Samsonov, S. V., Komarov, A. S., Bonneau, J., and Crawford, A. J.: Grounding-line retreat of Milne Glacier, Ellesmere Island, Canada over 1966–2023 from satellite, airborne, and ground radar data, Remote Sens. Environ., 315, 114478, https://doi.org/10.1016/j.rse.2024.114478, 2024. a, b, c, d, e
Azaneu, M., Webber, B., Heywood, K. J., Assmann, K. M., Dotto, T. S., and Abrahamsen, E. P.: Influence of shelf break processes on the transport of warm waters onto the eastern Amundsen Sea continental shelf, J. Geophys. Res.-Oceans, 128, e2022JC019535, https://doi.org/10.1029/2022JC019535, 2023. a
Benn, D. I., Luckman, A., Åström, J. A., Crawford, A. J., Cornford, S. L., Bevan, S. L., Zwinger, T., Gladstone, R., Alley, K., Pettit, E., and Bassis, J.: Rapid fragmentation of Thwaites Eastern Ice Shelf, The Cryosphere, 16, 2545–2564, https://doi.org/10.5194/tc-16-2545-2022, 2022. a
Bhatia, M. P., Waterman, S., Burgess, D. O., Williams, P. L., Bundy, R. M., Mellett, T., Roberts, M., and Bertrand, E. M.: Glaciers and nutrients in the Canadian Arctic Archipelago marine system, Global Biogeochem. Cycles, 35, e2021GB006976, https://doi.org/10.1029/2021GB006976, 2021. a
Bonneau, J., Laval, B. E., Mueller, D., Hamilton, A. K., Friedrichs, A. M., and Forrest, A. L.: Winter dynamics in an epishelf lake: quantitative mixing estimates and ice shelf basal channel considerations, J. Geophys. Res.-Oceans, 126, e2021JC017324, https://doi.org/10.1029/2021JC017324, 2021. a, b, c
Bonneau, J., Laval, B. E., Mueller, D., Hamilton, A. K., and Antropova, Y.: Heat fluxes in a glacial fjord: The role of buoyancy-driven circulation and offshore forcing, Geophys. Res. Lett., 51, e2024GL111242, https://doi.org/10.1029/2024GL111242, 2024a. a, b, c
Bonneau, J., Laval, B. E., Mueller, D., Hamilton, A. K., and Forrest, A. L.: Unsteady circulation in a glacial fjord: A multiyear modelling study of Milne Fiord, J. Geophys. Res.-Oceans, 129, e2023JC020140, https://doi.org/10.1029/2023JC020140, 2024b. a, b, c, d, e, f, g
Bonneau, J., Mueller, D., and Laval, B. E.: Numerical Modelling of Milne Fiord 2011–2019, FRDR [data set], https://doi.org/10.20383/103.0887, 2024c. a
Bradley, A., Bett, D., Dutrieux, P., De Rydt, J., and Holland, P. R.: The influence of Pine Island Ice Shelf calving on basal melting, J. Geophys. Res.-Oceans, 127, e2022JC018621, https://doi.org/10.1029/2022JC018621, 2022. a, b, c, d
Braun, C., Hardy, D. R., Bradley, R. S., and Sahanatien, V.: Surface mass balance of the Ward Hunt Ice Rise and Ward Hunt Ice Shelf, Ellesmere Island, Nunavut, Canada, J. Geophys. Res.-Atmos., 109, D22110, https://doi.org/10.1029/2004JD004560, 2004. a, b
Cai, C., Rignot, E., Menemenlis, D., and Nakayama, Y.: Observations and modeling of ocean-induced melt beneath Petermann Glacier Ice Shelf in northwestern Greenland, Geophys. Res. Lett., 44, 8396–8403, 2017. a, b
Cai, Z., You, Q., Wu, F., Chen, H. W., Chen, D., and Cohen, J.: Arctic warming revealed by multiple CMIP6 models: Evaluation of historical simulations and quantification of future projection uncertainties, J. Climate, 34, 4871–4892, 2021. a
Carr, J. R., Stokes, C. R., and Vieli, A.: Threefold increase in marine-terminating outlet glacier retreat rates across the Atlantic Arctic: 1992–2010, Ann. Glaciol., 58, 72–91, 2017. a
Copernicus Climate Change Services, C. D. S.: ORAS5 global ocean reanalysis monthly data from 1958 to present, Copernicus Climate Change Service (C3S) Climate Data Store (CDS) [data set], https://doi.org/10.24381/cds.67e8eeb7, 2021. a
Copland, L., Mueller, D., and Weir, L.: Rapid loss of the Ayles Ice Shelf, Ellesmere Island, Canada, Geophys. Res. Lett., 34, L21501, https://doi.org/10.1029/2007GL031809, 2007. a, b, c
Copland, L., Mortimer, C., White, A., McCallum, M. R., and Mueller, D.: Factors contributing to recent Arctic ice shelf losses, in: Arctic ice shelves and ice islands, edited by: Copland, L. and Mueller, D., 263–285, Springer, 2017. a
Cowton, T., Slater, D. A., Sole, A., Goldberg, D., and Nienow, P.: Modeling the impact of glacial runoff on fjord circulation and submarine melt rate using a new subgrid-scale parameterization for glacial plumes, J. Geophys. Res.-Oceans, 120, 796–812, 2015. a, b
Davison, B., Cowton, T., Cottier, F. R., and Sole, A.: Iceberg melting substantially modifies oceanic heat flux towards a major Greenlandic tidewater glacier, Nat. Commun., 11, 5983, https://doi.org/10.1038/s41467-020-19805-7, 2020. a
De Rydt, J., Holland, P. R., Dutrieux, P., and Jenkins, A.: Geometric and oceanographic controls on melting beneath Pine Island Glacier, J. Geophys. Res.-Oceans, 119, 2420–2438, 2014. a
England, J. H., Evans, D. J., and Lakeman, T. R.: Holocene history of Arctic ice shelves, in: Arctic ice shelves and ice islands, edited by: Copland, L. and Mueller, D., 185–205, Springer, 2017. a
Eyring, V., Bony, S., Meehl, G. A., Senior, C. A., Stevens, B., Stouffer, R. J., and Taylor, K. E.: Overview of the Coupled Model Intercomparison Project Phase 6 (CMIP6) experimental design and organization, Geosci. Model Dev., 9, 1937–1958, https://doi.org/10.5194/gmd-9-1937-2016, 2016. a
Glasser, N. and Scambos, T. A.: A structural glaciological analysis of the 2002 Larsen B ice-shelf collapse, J. Glaciol., 54, 3–16, 2008. a
Greene, C. A., Gardner, A. S., Wood, M., and Cuzzone, J. K.: Ubiquitous acceleration in Greenland Ice Sheet calving from 1985 to 2022, Nature, 625, 523–528, 2024. a
Hager, A. O., Sutherland, D. A., and Slater, D. A.: Local forcing mechanisms challenge parameterizations of ocean thermal forcing for Greenland tidewater glaciers, The Cryosphere, 18, 911–932, https://doi.org/10.5194/tc-18-911-2024, 2024. a
Hamilton, A. K.: Ice-ocean interactions in Milne Fiord, Phd thesis, University of British Columbia, 2016. a, b, c, d, e, f
Hamilton, A. K., Laval, B. E., Mueller, D. R., Vincent, W. F., and Copland, L.: Dynamic response of an Arctic epishelf lake to seasonal and long-term forcing: implications for ice shelf thickness, The Cryosphere, 11, 2189–2211, https://doi.org/10.5194/tc-11-2189-2017, 2017. a, b
Hamilton, A. K., Mueller, D., and Laval, B. E.: Ocean modification and seasonality in a northern Ellesmere Island glacial fjord prior to ice shelf breakup: Milne Fiord, J. Geophys. Res.-Oceans, 126, e2020JC016975, https://doi.org/10.1029/2020JC016975, 2021. a, b, c, d, e
Hamilton, A. K., Mueller, D., Bonneau, J., and Laval, B. E.: Milne Fiord currents from ADCP (Acoustic Doppler Current Profiler), Polar Data Catalogue [data set], https://doi.org/10.21963/13345, 2024. a
Hill, E. A., Carr, J. R., and Stokes, C. R.: A review of recent changes in major marine-terminating outlet glaciers in Northern Greenland, Front. Earth Sci., 4, 111, https://doi.org/10.3389/feart.2016.00111, 2017. a, b, c
Holland, D. M., Thomas, R. H., De Young, B., Ribergaard, M. H., and Lyberth, B.: Acceleration of Jakobshavn Isbræ triggered by warm subsurface ocean waters, Nat. Geosci., 1, 659–664, 2008. a
Holmes, F. A., Kirchner, N., Prakash, A., Stranne, C., Dijkstra, S., and Jakobsson, M.: Calving at Ryder glacier, northern Greenland, J. Geophys. Res.-Earth Surf., 126, e2020JF005872, https://doi.org/10.1029/2020JF005872, 2021. a
Jackson, R. H., Nash, J. D., Kienholz, C., Sutherland, D. A., Amundson, J. M., Motyka, R. J., Winters, D., Skyllingstad, E., and Pettit, E. C.: Meltwater intrusions reveal mechanisms for rapid submarine melt at a tidewater glacier, Geophys. Res. Lett., 47, e2019GL085335, https://doi.org/10.1029/2019GL085335, 2020. a
Jahn, A., Holland, M. M., and Kay, J. E.: Projections of an ice-free Arctic Ocean, Nat. Rev. Earth Environ., 5, 164–176, 2024. a
Jakob, L. and Gourmelen, N.: Glacier mass loss between 2010 and 2020 dominated by atmospheric forcing, Geophys. Res. Lett., 50, e2023GL102954, https://doi.org/10.1029/2023GL102954, 2023. a
Jakobsson, M., Mayer, L. A., Nilsson, J., Stranne, C., Calder, B., O’Regan, M., Farrell, J. W., Cronin, T. M., Brüchert, V., Chawarski, J., Eriksson, B., Jonas, Fredriksson, J., Gemery, L., lueder, A., Holmes, F. A., Jerram, K., Kirchner, N., Mix, A., Muchowski, J., Prakash, A., Reilly, B., Thornton, B., Ulfsbo, A., Weidner, E., Åkesson, H., Handl, T., Ståhl, E., Boze, L.-G., Reed, S., West, G., and Padman, J.: Ryder Glacier in northwest Greenland is shielded from warm Atlantic water by a bathymetric sill, Commun. Earth Environ., 1, 45, https://doi.org/10.1038/s43247-020-00043-0, 2020. a, b
Jeffries, M. O.: Glaciers and the morphology and structure of Milne ice shelf, Ellesmere Island, NWT, Canada, Arct. Alp. Res., 18, 397–405, 1986. a
Jeffries, M. O.: Arctic ice shelves and ice islands: Origin, growth and disintegration, physical characteristics, structural-stratigraphic variability, and dynamics, Rev. Geophys., 30, 245–267, 1992. a
Johnson, H., Münchow, A., Falkner, K., and Melling, H.: Ocean circulation and properties in Petermann Fjord, Greenland, J. Geophys. Res.-Oceans, 116, C01003, https://doi.org/10.1029/2010JC006519, 2011. a
Joughin, I., Shapero, D., Smith, B., Dutrieux, P., and Barham, M.: Ice-shelf retreat drives recent Pine Island Glacier speedup, Sci. Adv., 7, eabg3080, https://doi.org/10.1126/sciadv.abg3080, 2021. a
Kochtitzky, W. and Copland, L.: Retreat of Northern Hemisphere marine-terminating glaciers, 2000–2020, Geophys. Res. Lett., 49, e2021GL096501, https://doi.org/10.1029/2021GL096501, 2022. a, b, c
Losch, M.: Modeling ice shelf cavities in a z coordinate ocean general circulation model, J. Geophys. Res.-Oceans, 113, C08043, https://doi.org/10.1029/2007JC004368, 2008. a
Marshall, J., Adcroft, A., Hill, C., Perelman, L., and Heisey, C.: A finite-volume, incompressible Navier Stokes model for studies of the ocean on parallel computers, J. Geophys. Res.-Oceans, 102, 5753–5766, 1997. a
Massom, R. A., Scambos, T. A., Bennetts, L. G., Reid, P., Squire, V. A., and Stammerjohn, S. E.: Antarctic ice shelf disintegration triggered by sea ice loss and ocean swell, Nature, 558, 383–389, 2018. a
Millan, R., Mouginot, J., and Rignot, E.: Mass budget of the glaciers and ice caps of the Queen Elizabeth Islands, Canada, from 1991 to 2015, Environ. Res. Lett., 12, 024016, https://doi.org/10.1088/1748-9326/aa5b04, 2017. a, b
Millan, R., Mouginot, J., Derkacheva, A., Rignot, E., Milillo, P., Ciraci, E., Dini, L., and Bjørk, A.: Ongoing grounding line retreat and fracturing initiated at the Petermann Glacier ice shelf, Greenland, after 2016, The Cryosphere, 16, 3021–3031, https://doi.org/10.5194/tc-16-3021-2022, 2022. a, b, c, d, e
Millan, R., Jager, E., Mouginot, J., Wood, M., Larsen, S., Mathiot, P., Jourdain, N., and Bjørk, A.: Rapid disintegration and weakening of ice shelves in North Greenland, Nat. Commun., 14, 6914, https://doi.org/10.1038/s41467-023-42198-2, 2023. a
Morlighem, M., Wood, M., Seroussi, H., Choi, Y., and Rignot, E.: Modeling the response of northwest Greenland to enhanced ocean thermal forcing and subglacial discharge, The Cryosphere, 13, 723–734, https://doi.org/10.5194/tc-13-723-2019, 2019. a
Mortimer, C. A., Copland, L., and Mueller, D.: Volume and area changes of the Milne Ice Shelf, Ellesmere Island, Nunavut, Canada, since 1950, J. Geophys. Res.-Earth Surf., 117, F04011, https://doi.org/10.1029/2011JF002074, 2012. a, b, c, d, e
Motyka, R. J., Truffer, M., Fahnestock, M., Mortensen, J., Rysgaard, S., and Howat, I.: Submarine melting of the 1985 Jakobshavn Isbræ floating tongue and the triggering of the current retreat, J. Geophys. Res.-Earth Surf., 116, F01007, https://doi.org/10.1029/2009JF001632, 2011. a
Mouginot, J., Rignot, E., Scheuchl, B., Fenty, I., Khazendar, A., Morlighem, M., Buzzi, A., and Paden, J.: Fast retreat of zachariæ isstrøm, northeast Greenland, Science, 350, 1357–1361, 2015. a, b
Mouginot, J., Rignot, E., Bjørk, A. A., Van den Broeke, M., Millan, R., Morlighem, M., Noël, B., Scheuchl, B., and Wood, M.: Forty-six years of Greenland Ice Sheet mass balance from 1972 to 2018, P. Natl. Acad. Sci. USA, 116, 9239–9244, 2019. a
Mueller, D., Vincent, W. F., and Jeffries, M. O.: Break-up of the largest Arctic ice shelf and associated loss of an epishelf lake, Geophys. Res. Lett., 30, 2031, https://doi.org/10.1029/2003GL017931, 2003. a, b
Mueller, D., Copland, L., and Jeffries, M. O.: Changes in Canadian Arctic ice shelf extent since 1906, in: Arctic Ice Shelves and Ice Islands, edited by: Copland, L. and Mueller, D., 109–148, Springer, 2017. a, b, c, d, e
Mueller, D., Hamilton, A. K., Bonneau, J., Friedrichs, D. M., Rajewicz, J. S., White, A., Copland, L., Garbo, A., Richer-McCallum, M., Antropova, Y., Crocker, G., de Jong, T., Graves, K., Kim, J., Brenner, S., Wilson, N., Wray, P., Xu, K., Mortimer, C., Pope, S., Forrest, A., and Laval, B. E.: Milne Fiord CTD (Conductivity, Temperature, Depth) profiles, 2008–2019, Polar Data Catalogue [data set], https://doi.org/10.21963/12102, 2021a. a
Mueller, D., Hamilton, A. K., Bonneau, J., and Laval, B. E.: Milne Fiord Oceanographic Mooring, 2011–2019, Polar Data Catalogue [data set], https://doi.org/10.21963/12101, 2021b. a
Mueller, D., Bonneau, J., Hamilton, A. K., Antropova, Y., Forrest, A. L., and Laval, B. E.: Milne Fiord CTD (Conductivity, Temperature, Depth) profiles, Polar Data Catalogue [data set], https://doi.org/10.21963/13383, 2024. a
Noël, B., Van De Berg, W. J., Lhermitte, S., Wouters, B., Schaffer, N., and van den Broeke, M. R.: Six decades of glacial mass loss in the Canadian Arctic Archipelago, J. Geophys. Res.-Earth Surf., 123, 1430–1449, 2018. a
Ochwat, N., Scambos, T., Fahnestock, M., and Stammerjohn, S.: Characteristics, recent evolution, and ongoing retreat of Hunt Fjord Ice Shelf, northern Greenland, J. Glaciol., 69, 57–70, 2023. a
Paden, J., Li, J., Leuschen, C., Rodriguez-Morales, F., and Hale, R.: IceBridge MCoRDS L2 Ice Thickness, Version 1, Boulder, Colorado USA, NASA National Snow and Ice Data Center Distributed Active Archive Center [data set], https://doi.org/10.5067/GDQ0CUCVTE2Q, 2010. a
Poinelli, M., Nakayama, Y., Larour, E., Vizcaino, M., and Riva, R.: Ice-Front Retreat Controls on Ocean Dynamics Under Larsen C Ice Shelf, Antarctica, Geophys. Res. Lett., 50, e2023GL104588, https://doi.org/10.1029/2023GL104588, 2023. a, b, c, d, e
Porter, C., Morin, P., Howat, I., Noh, M.-J., Bates, B., Peterman, K., Keesey, S., Schlenk, M., Gardiner, J., Tomko, K., Gardiner, J., Negrete, A., Yadav, B., Klassen, J., Kelleher, C., Cloutier, M., Bakker, J., Enos, J., Arnold, G., Bauer, G., and Morin, P.: ArcticDEM, Harvard Dataverse [data set], 1, 2018–2030, 2018. a
Richer-McCallum, M.: Analysis of ice types along the northern coast of Ellesmere Island, Nunavut, Canada, and their relationship to Synthetic Aperture Radar (SAR) backscatter, Master's thesis, Carleton University, 2015. a
Rignot, E.: Hinge-line migration of Petermann Gletscher, north Greenland, detected using satellite-radar interferometry, J. Glaciol., 44, 469–476, 1998. a
Rignot, E., Xu, Y., Menemenlis, D., Mouginot, J., Scheuchl, B., Li, X., Morlighem, M., Seroussi, H., den Broeke, M. v., Fenty, I., Cai, C., An, L., and de Fleurian, B.: Modeling of ocean-induced ice melt rates of five west Greenland glaciers over the past two decades, Geophys. Res. Lett., 43, 6374–6382, 2016. a, b, c, d, e, f, g, h, i
Rosevear, M. G., Gayen, B., Vreugdenhil, C. A., and Galton-Fenzi, B. K.: How Does the Ocean Melt Antarctic Ice Shelves?, Annu. Rev. Marine Sci., 17, 325–353, 2025. a
Scambos, T. A., Bohlander, J., Shuman, C. A., and Skvarca, P.: Glacier acceleration and thinning after ice shelf collapse in the Larsen B embayment, Antarctica, Geophys. Res. Lett., 31, L18402, https://doi.org/10.1029/2004GL020670, 2004. a
Schaffer, J., von Appen, W.-J., Dodd, P. A., Hofstede, C., Mayer, C., de Steur, L., and Kanzow, T.: Warm water pathways toward Nioghalvfjerdsfjorden Glacier, Northeast Greenland, J. Geophys. Res.-Oceans, 122, 4004–4020, 2017. a
Schaffer, J., Kanzow, T., von Appen, W.-J., von Albedyll, L., Arndt, J. E., and Roberts, D. H.: Bathymetry constrains ocean heat supply to Greenland’s largest glacier tongue, Nat. Geosci., 13, 227–231, 2020. a
Si, Y., Stewart, A. L., Silvano, A., and Naveira Garabato, A. C.: Antarctic Slope Undercurrent and onshore heat transport driven by ice shelf melting, Sci. Adv., 10, eadl0601, https://doi.org/10.1126/sciadv.adl0601, 2024. a
Slater, D. A., Straneo, F., Felikson, D., Little, C. M., Goelzer, H., Fettweis, X., and Holte, J.: Estimating Greenland tidewater glacier retreat driven by submarine melting, The Cryosphere, 13, 2489–2509, https://doi.org/10.5194/tc-13-2489-2019, 2019. a
Smagorinsky, J.: General circulation experiments with the primitive equations: I. The basic experiment, Mon. Weather Rev., 91, 99–164, 1963. a
Steiger, N., Darelius, E., Kimura, S., Patmore, R. D., and Wåhlin, A.: The dynamics of a barotropic current impinging on an ice front, J. Phys. Oceanogr., 52, 2957–2973, 2022. a
Straneo, F., Sutherland, D. A., Holland, D. M., Gladish, C., Hamilton, G. S., Johnson, H. L., Rignot, E., Xu, Y., and Koppes, M.: Characteristics of ocean waters reaching Greenland's glaciers, Ann. Glaciol., 53, 202–210, 2012. a
Taylor, K. E., Stouffer, R. J., and Meehl, G. A.: An overview of CMIP5 and the experiment design, B. Am. Meteorol. Soc., 93, 485–498, 2012. a
Thomas, R. H. and Bentley, C. R.: A model for Holocene retreat of the West Antarctic ice sheet, Quaternary Res., 10, 150–170, 1978. a
Timmermans, M.-L. and Marshall, J.: Understanding Arctic Ocean circulation: A review of ocean dynamics in a changing climate, J. Geophys. Res.-Oceans, 125, e2018JC014378, https://doi.org/10.1029/2018JC014378, 2020. a
Van Wychen, W., Davis, J., Burgess, D. O., Copland, L., Gray, L., Sharp, M., and Mortimer, C.: Characterizing interannual variability of glacier dynamics and dynamic discharge (1999–2015) for the ice masses of Ellesmere and Axel Heiberg Islands, Nunavut, Canada, J. Geophys. Res.-Earth Surf., 121, 39–63, 2016. a, b
Veillette, J., Mueller, D., Antoniades, D., and Vincent, W. F.: Arctic epishelf lakes as sentinel ecosystems: Past, present and future, J. Geophys. Res.-Biogeo., 113, G04014, https://doi.org/10.1029/2008JG000730, 2008. a
Veillette, J., Lovejoy, C., Potvin, M., Harding, T., Jungblut, A. D., Antoniades, D., Chénard, C., Suttle, C. A., and Vincent, W. F.: Milne Fiord epishelf lake: A coastal Arctic ecosystem vulnerable to climate change, Écoscience, 18, 304–316, 2011. a
Vincent, W. F. and Mueller, D.: Witnessing ice habitat collapse in the Arctic, Science, 370, 1031–1032, 2020. a
Vincent, W. F., Gibson, J., and Jeffries, M.: Ice-shelf collapse, climate change, and habitat loss in the Canadian high Arctic, Polar Rec., 37, 133–142, 2001. a
White, A.: Glacier changes across northern Ellesmere Island, Ph.D. thesis, University of Ottawa, 2019. a, b, c, d, e, f, g, h
White, A. and Copland, L.: Loss of floating glacier tongues from the Yelverton Bay region, Ellesmere Island, Canada, J. Glaciol., 65, 376–394, 2019. a, b, c, d, e
White, P. L., Bertrand, E. M., Spence, J. S., Cavaco, M. A., Parrott, C., Waterman, S., Rowland, E., Roberts, M. E., Noah, T., Mellett, T., Hallé, D., Hamilton, A. K., Bundy, R. M., Didier, D., and Bhatia, M. P.: Shifting phytoplankton ecological strategies along a continuum of tidewater glacier retreat, ISME Communications, 5, ycaf045, https://doi.org/10.1093/ismeco/ycaf045, 2025. a
Wood, M., Rignot, E., Fenty, I., An, L., Bjørk, A., van den Broeke, M., Cai, C., Kane, E., Menemenlis, D., Millan, R., Morlighem, M., Mouginot, J., Noël, B., Scheuchl, B., Velicogna, I., Willis, J. K., and Zhang, H.: Ocean forcing drives glacier retreat in Greenland, Sci. Adv., 7, eaba7282, https://doi.org/10.1126/sciadv.aba7282, 2021. a
Wychen, W. V., Burgess, D., Kochtitzky, W., Nikolic, N., Copland, L., and Gray, L.: RADARSAT-2 derived glacier velocities and dynamic discharge estimates for the Canadian High Arctic: 2015–2020, Can. J. Remote Sens., 46, 695–714, 2020. a, b
Xu, Y., Rignot, E., Fenty, I., Menemenlis, D., and Flexas, M. M.: Subaqueous melting of Store Glacier, west Greenland from three-dimensional, high-resolution numerical modeling and ocean observations, Geophys. Res. Lett., 40, 4648–4653, 2013. a
Zhao, K. X., Stewart, A. L., and McWilliams, J. C.: Sill-influenced exchange flows in ice shelf cavities, J. Phys. Oceanogr., 49, 163–191, 2019. a
Zhao, K. X., Stewart, A. L., and McWilliams, J. C.: Geometric constraints on glacial fjord–shelf exchange, J. Phys. Oceanogr., 51, 1223–1246, 2021. a
Zuo, H., Balmaseda, M. A., Tietsche, S., Mogensen, K., and Mayer, M.: The ECMWF operational ensemble reanalysis–analysis system for ocean and sea ice: a description of the system and assessment, Ocean Sci., 15, 779–808, https://doi.org/10.5194/os-15-779-2019, 2019. a
- Abstract
- Introduction
- Background on the region
- Methods
- Results: the impact of ice structures
- Results: consequences of ocean warming
- Discussion
- Conclusion
- Code and data availability
- Author contributions
- Competing interests
- Disclaimer
- Acknowledgements
- Financial support
- Review statement
- References
- Supplement