the Creative Commons Attribution 4.0 License.
the Creative Commons Attribution 4.0 License.
 | 17 Jul 2025
Detection and reconstruction of rock glacier kinematics over 24 years (2000–2024) from Landsat imagery
Diego Cusicanqui
Pascal Lacroix
Xavier Bodin
Benjamin Aubrey Robson
Andreas Kääb
Shelley MacDonell
Rock glacier velocity is now widely acknowledged as an Essential Climate Variable for permafrost. However, representing decadal regional spatiotemporal velocity patterns remains challenging due to the limited availability of high-resolution (<5 m) remote sensing data. In contrast, medium-resolution satellite data (10–15 m) covering several decades are globally available but have not been widely used for rock glacier kinematics. This study presents a robust methodological approach combining pairwise feature-tracking image correlation with medium-resolution Landsat 7/Landsat 8 optical imagery, surface displacement time-series inversion and the automatic detection of persistent moving areas (PMAs). Applied to rock glacier monitoring in the semiarid Andes of South America, this methodology enables the detection and quantification of the surface kinematics of 153 rock glaciers, 124 landslides and 105 unclassified landforms over 24 years across a 2250 km2 area. This is the first time that Landsat images have been used to quantify rock glacier displacement time series. The study estimates an average velocity of 0.30±0.07 m yr−1 for all PMAs, with rock glaciers moving 23 % faster (0.37 m yr−1) over the 24-year period. Some large rock glaciers and debris-frozen landforms exhibit surface velocities exceeding 2 m yr−1. The results align well with high-resolution imagery, recent Global Navigation Satellite System measurements and previous inventories. However, the Landsat 7/Landsat 8 (L7/8) imagery-derived velocities are underestimated by approximately 20 %–30 % on average. High uncertainties between consecutive image pairs limit the reliability of interpreting annual velocity variations. However, decadal velocity changes exceeding the uncertainties were observed in only 2 % of PMAs, with two (one) rock glaciers exhibiting significant acceleration (deceleration) over the past two decades. Our calculations show that decadal velocity changes <0.4 m yr−1 are generally within the uncertainty range when using L7/8 data, with sensitivity depending on the reference period. Despite these limitations, our results highlight the correlation between velocity trends and topographic parameters such as PMA size, orientation, slope and elevation. These relationships suggest that permafrost thaw may influence the occurrence of high-altitude landslides. Overall, this study demonstrates the feasibility of using medium-resolution optical satellite imagery for monitoring rock glacier velocity over several decades.
- Article
(10978 KB) - Full-text XML
-
Supplement
(21244 KB) - BibTeX
- EndNote


Historically, the state of the cryosphere has been assessed using specific variables defined by the Global Climate Observing System (GCOS, 1995), including mass balance for glaciers, snow cover variability and ground temperature for permafrost. Among those variables, glacier mass balance and snow cover variations are relatively well-known at a global scale (Hugonnet et al., 2021; Notarnicola, 2020) compared to changes in mountain permafrost, which is still very incompletely monitored (Bolch et al., 2019).
Permafrost is an important component of the cryosphere occurring at high latitudes (i.e. polar regions) and high elevations (i.e. mountainous areas). As permafrost – ground material remaining at or below 0 °C for at least 2 consecutive years – is a thermal phenomenon, it is thus sensitive to changes in climate forcing (Hock et al., 2019). Worldwide estimation of mountain permafrost warming relies on very few direct borehole observations (Noetzli et al., 2019), distributed mostly in the western Alps and Alaska, leaving many mountainous regions without adequate monitoring data. Mountain permafrost degradation manifests as an increase in ground temperatures and active layer thickness (Etzelmüller et al., 2020), an increase in liquid water content within the frozen terrain (Cicoira et al., 2019), and ground-ice melt (Cusicanqui et al., 2021; Haberkorn et al., 2021). These changes also favour landslides (the downslope movement of soil, rock and organic materials under the force of gravity). For instance, recent warming has induced an increased frequency of landslides in the eastern Pamirs Plateau in China (Pei et al., 2023). However, warming affects mountain permafrost differently according to the terrain type, particularly due to the snow cover influence. Steep rock slopes, where snow is scarce, exhibit a steady warming trend (Magnin et al., 2024), whereas loose rock formations such as rock glaciers show pronounced interannual variations, mostly due to the variable insulating effect of snow (Thibert and Bodin, 2022; Kellerer-Pirklbauer et al., 2024).
In the present paper, we follow the definitions proposed by the IPA Rock Glacier Inventories and Kinematics (RGIK) action group, stating that rock glaciers can be defined as “debris landforms generated by the former or current creep of frozen ground (permafrost), detectable in the landscape with the following morphologies: front, lateral margins and optionally ridge-and-furrow surface topography” (Berthling, 2011; RGIK, 2023). Given the complexity of measuring permafrost warming, rock glacier velocity has been recently accepted by the GCOS to be a complement of the Essential Climate Variable (ECV) permafrost (Hu et al., 2025). The thermally dependent creep of ice-rich frozen ground is inherently sensitive to climatic conditions and fluctuates over different timescales (Delaloye et al., 2010; Kääb et al., 2007; Sorg et al., 2015). Interannual, seasonal and short-term variations in creep velocity primarily reflect weather influences (Kenner et al., 2017; Wirz et al., 2016), while long-term trends – decadal to pluri-decadal – correlate with mean annual air or ground temperatures (Pellet et al., 2022, Kellerer-Pirklbauer et al., 2024).
Since the early 2000s, there has been a growing interest from the international community in monitoring rock glacier velocities. Observations indicate that rock glacier velocities often exhibit similar interannual to long-term trends at a regional scale (Kellerer-Pirklbauer and Kaufmann, 2012; Marcer et al., 2021; Pellet et al., 2022), largely driven by local ground temperature changes (Noetzli et al., 2019). The velocity of rock glaciers is controlled by the landform's intrinsic characteristics, particularly its internal structure (ice/debris proportions, thickness) and the topography (bed slope), while external climatic factors – such as ground temperature, advection, infiltration and internal meltwater production – also play a significant role (Cicoira et al., 2019; Kenner et al., 2020). Thus, the magnitude and variability of the velocity of rock glaciers indicate their current state and possible ongoing changes in the characteristics of the permafrost body. As a consequence, monitoring rock glacier velocity changes provides information about the impact of climate change on mountain permafrost and, indirectly, on its thermal state. Given the observed current warming context of mountain permafrost (Noetzli et al., 2019), the velocity of rock glaciers in cold mountains is expected to increase with ground temperature (Arenson et al., 2015; Kääb et al., 2007; Müller et al., 2016).
Quantifying rock glacier velocity at regional scales was first achieved using satellite radar interferometry (InSAR) data. This method enables the detection of slow slope movement (i.e. rock glacier motion) in the satellite's line of sight (LOS) across large regions and hundreds of individual landforms (Hu et al., 2023). This approach has been used to map rock glacier motion in several regions of the world (Bertone et al., 2022). This data source has served as a base for classifying movement rates of various orders of magnitude (cm d−1, cm per month, dm per month, cm a−1, etc.), recently standardized within the RGIK group (RGIK, 2023). However, even if this technique is well suited for rock glacier mapping (Barboux et al., 2014), it is most effective for relatively slow rock glacier speeds, with the maximum detectable speed of approximately 1–1.5 m yr−1 over short observation periods (6, 12 d). Beyond this threshold, InSAR signals become geometrically decorrelated and thus uninterpretable (Villarroel et al., 2018). In addition, freely available high-temporal-resolution SAR data have been accessible only since the early 21st century (Strozzi et al., 2020), preventing the assessment of climatic timescales (i.e. decadal trends) for rock glacier velocity.
Comparatively, feature tracking applied to repeat and historical optical imagery offers a more robust alternative to derive rock glacier surface displacements and velocity over extended timescales (Cusicanqui et al., 2021; Kääb et al., 2021; Kaufmann et al., 2021). This technique is less suitable for slow velocities due to a low signal-to-noise ratio (unless very high spatial resolution allows tracking the movement) but is well suited for medium to large movements beyond 1–1.5 m yr−1 (Hartl et al., 2023; Marcer et al., 2021). To date, applications have been limited to high-resolution optical imagery (<5 m), often requiring airborne imagery that is prohibitively expensive for larger regions or for more extensive time series. As a consequence, few periglacial regions have been extensively investigated using feature tracking, with a research focus on the European Alps (Cusicanqui et al., 2021; Hartl et al., 2016; Kellerer-Pirklbauer and Kaufmann, 2012) and some isolated regions in the Andes (Vivero et al., 2021; Blöthe et al., 2021, 2025), in northern Tien Shan (Kääb et al., 2021; Wood et al., 2025) and, more recently, the United States (Kääb and Røste, 2024).
Medium-resolution imagery (Landsat 4/Landsat 5/Landsat 7/Landsat 8, SPOT 1-4, ASTER) has provided continuous data for monitoring slow-moving landforms since the 1980s. Recent progress in time-series processing has enabled the development of methods for both detecting and monitoring slow-moving landslides using medium-resolution imagery over the last 40–50 years (Bontemps et al., 2018; Lacroix et al., 2020a). However, these methods have never been applied to rock glaciers due to their slow motions (∼1 m yr−1) and the challenges posed by the presence of snow and shadows in steep mountains. Here, we demonstrate the applicability of the free and open-access, global, medium-resolution satellite datasets Landsat 7/Landsat 8 (called hereafter L7/8) to characterize rock glacier displacements and velocities for the early 21st century in a region of the semiarid Andes (in both Chile and Argentina). We further validate our results at a regional scale using Sentinel-1 wrapped interferograms and at a local scale with very high resolution (called hereafter VHR) datasets, e.g. GeoEye, Pléiades, airborne on the Tapado complex area and recent Global Navigation Satellite System (GNSS) measurements.
Our study area lies within the Coquimbo and San Juan provinces in the semiarid Andes of Chile and Argentina (29°20′ S–31°15′ S; Fig. 1). It covers km2, with altitudes ranging from 3000 to 6300 m above sea level (a.s.l.). The regional climate is characterized by semiarid conditions, influenced mainly by the subtropical South Pacific anticyclone (Montecinos and Aceituno, 2003). The rugged topography from coastal locations to the high-elevation of the Andes mountain range (∼6000 m a.s.l.) strongly affects atmospheric circulation, differentiating the eastern and western climatic regimes (Kalthoff et al., 2002). Schauwecker et al. (2022) shows that precipitation from humid Pacific air masses occurs almost exclusively as snowfall, concentrated in the Austral winter (May/August). Year-to-year precipitation varies notably by the El Niño–Southern Oscillation (ENSO) phenomenon, with above (below) average precipitation during El Niño (La Niña) events (Masiokas et al., 2006, 2010) and recent deficits in precipitations between 20 %–40 % (Garreaud et al., 2020). Meteorological records by three automatic weather stations (AWSs) show mean annual precipitation of ∼170 mm in the last decade (CEAZA, 2023). Recent air temperature studies show a warming trend of 0.2 °C per decade in the central Andes, contributing to decreasing snowfall (Poblete and Minetti, 2017; Réveillet et al., 2020).
According to global permafrost distribution models (Gruber, 2012; Obu, 2021) and a local one (Azócar et al., 2017), heterogeneous/discontinuous permafrost occurs between 3900 and 4500 m a.s.l., becoming widespread above 4500 m a.s.l. (Fig. 1). Several rock glacier inventories exist for the Chilean (DGA, 2022) and Argentinian (IANIGLA, 2018) Andes, alongside detailed/local geomorphological investigations (Monnier and Kinnard, 2015, 2016; Halla et al., 2021; Navarro et al., 2023a; de Pasquale et al., 2022). According to both inventories of Chile and Argentina (both based on geomorphological interpretation of optical satellite imagery), the area has a relatively high number of rock glaciers, with 80 located on the Chilean side and 235 on the Argentinian side (Fig. 1). The study of mountain permafrost in this region of the semiarid Andes has received attention during the last few decades because of the high density and large extension of rock glaciers (Janke et al., 2015). Recent studies highlight the complex interaction between remnants of glaciers, debris-covered glaciers and rock glaciers (Navarro et al., 2023b; Robson et al., 2022), as well as the role of rock glaciers as water storage resources (Azócar and Brenning, 2010; MacDonell et al., 2022; Schaffer et al., 2019; Schaffer and MacDonell, 2022).
Despite growing interest, limited information is available on rock glacier velocities and historical velocity trends. Villarroel et al. (2018) provided a kinematic inventory of the Argentinian Andes (30.5–33.5° S), identifying ∼2100 active rock glaciers using InSAR. On the other hand, Blöthe et al. (2021) provided a regional assessment for the “Cordon del Plata” range (∼300 km south of our study area), quantifying velocity fields of 244 rock glaciers between 2010 and 2017/18 using offset tracking between optical imagery. More recently, Blöthe et al. (2025) provided surface velocity data for 175 rock glaciers between 1968 and 2023 in the Valles Calchaquíes region (24–25° S) in Argentina. However, only two rock glaciers in this region are monitored, i.e. Dos Lenguas rock glacier, which was studied primarily with InSAR (Strozzi et al., 2020) and, more recently, with an uncrewed aerial vehicle (UAV; Stammler et al., 2024), in Argentina and the Tapado complex in Chile (Vivero et al., 2021), which has been monitored since 2009 using GNSS and historical aerial images, providing the longest surface velocity time series since the 1950s. In this sense, a historical perspective on velocity trends remains largely absent in this region. Finally, this region was chosen due to the good coverage of reference datasets, namely, VHR satellite imagery and in situ GNSS measurements on the Tapado rock glacier (DGA, 2010), which serve as validation sources.
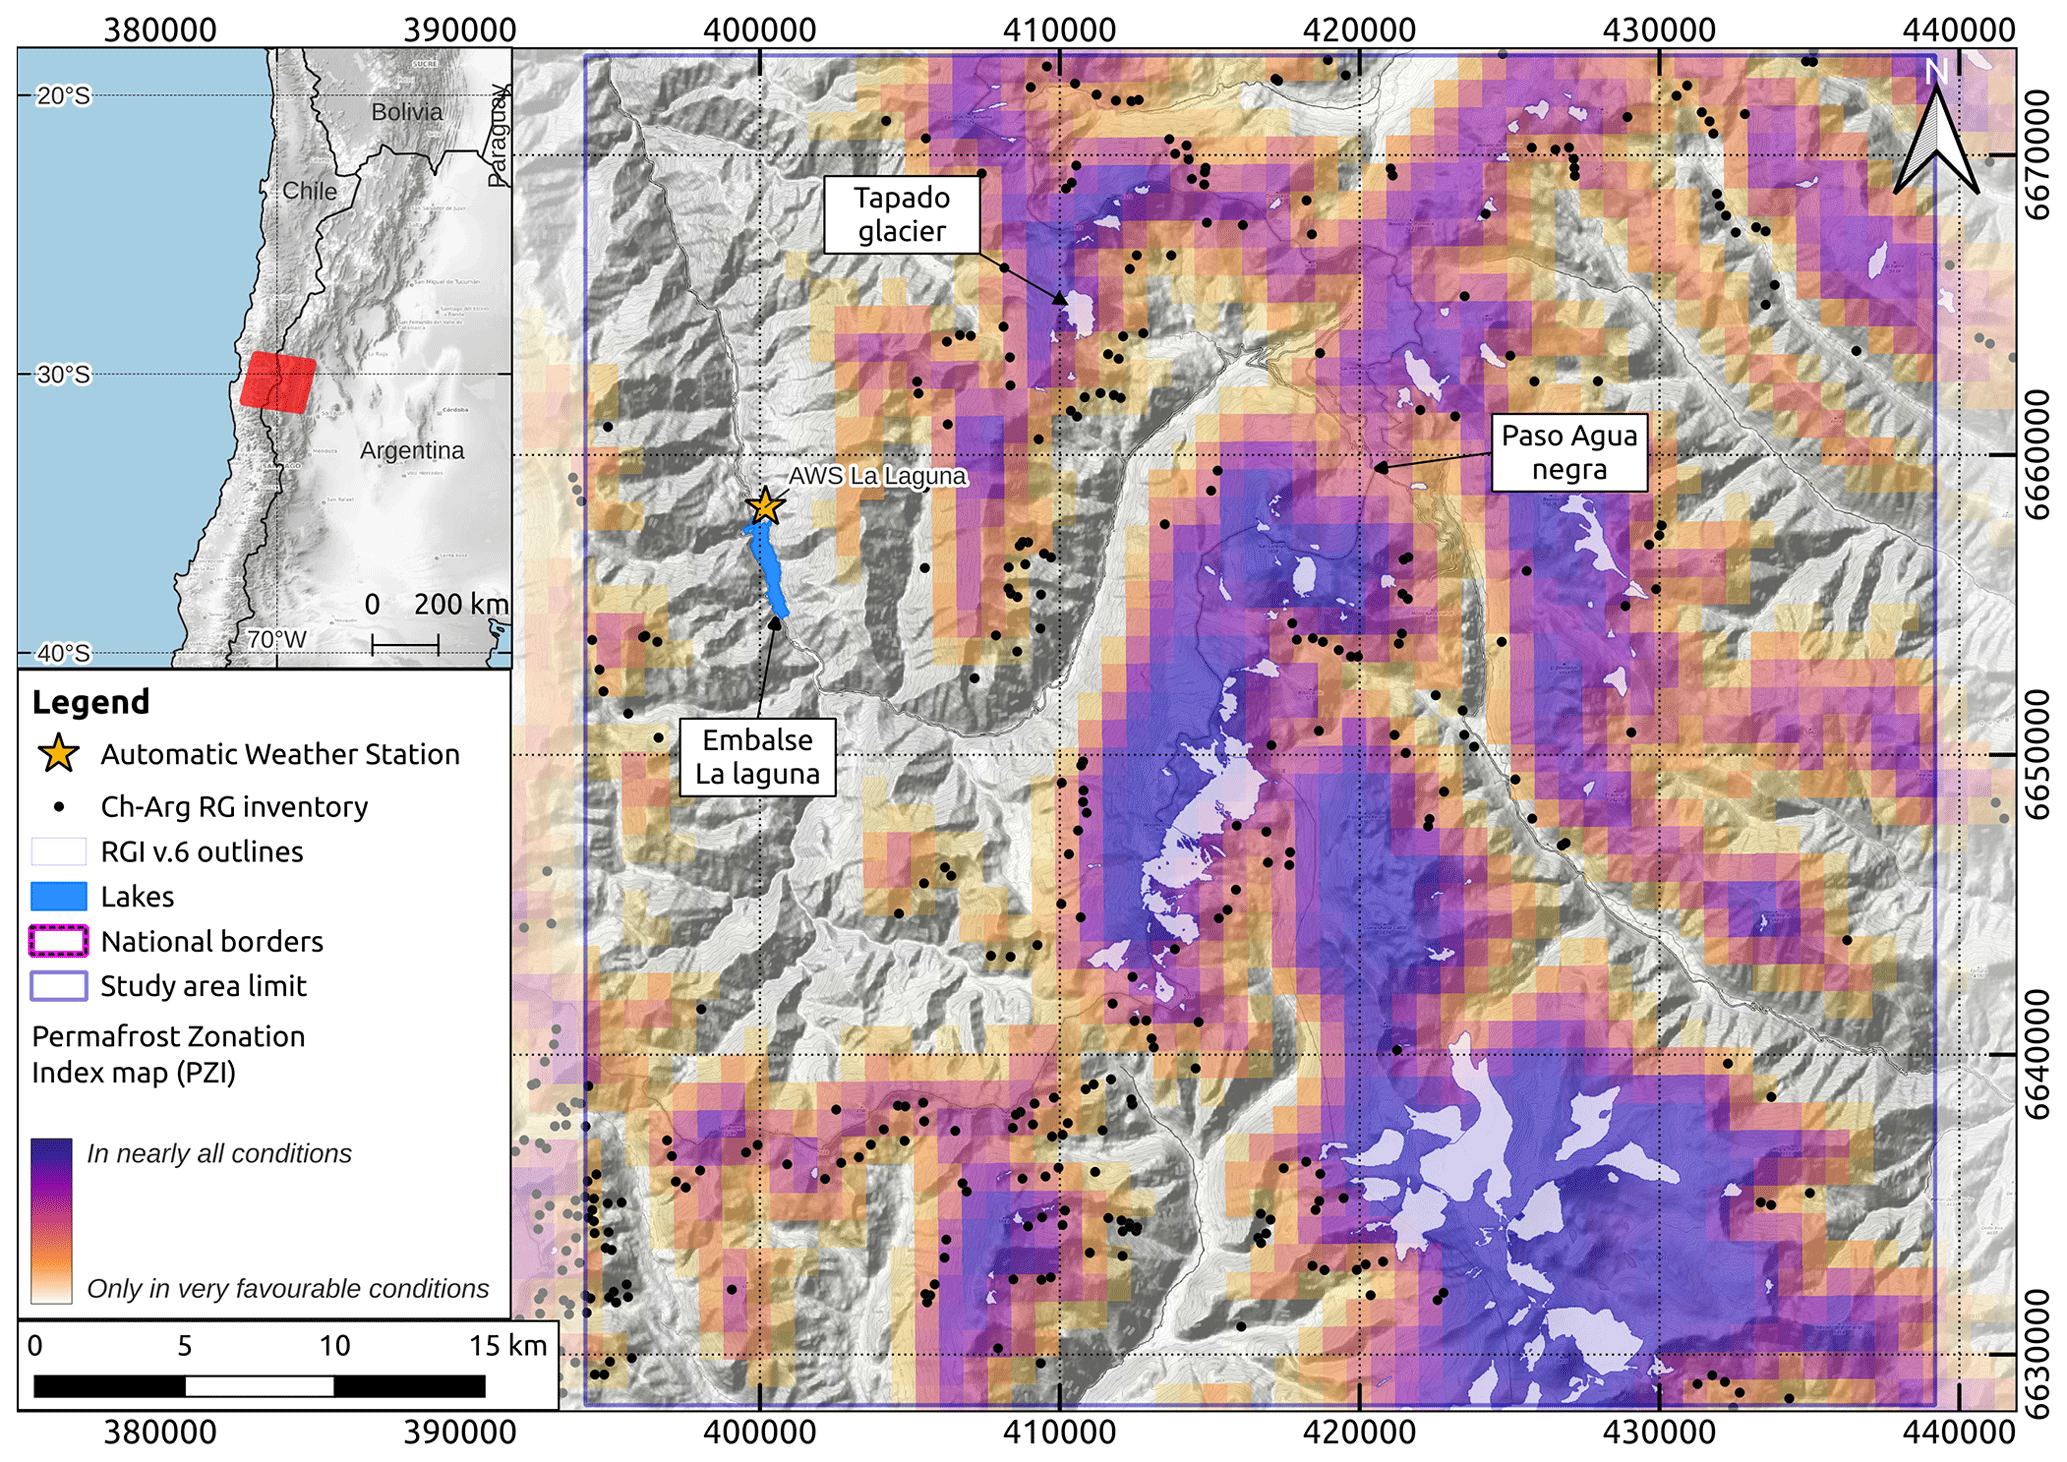
Figure 1Location of the study area in the semiarid Andes (29°20′ S–31°15′ S). The red square in the inner map shows the footprint of the Landsat scenes used in this study. Within the main map, black dots correspond to the rock glacier inventory for Chile (DGA, 2022) and Argentina (IANIGLA, 2018). The orange-to-purple colour bar represents the Permafrost Favorability Index (PFI) from Gruber (2012). A comparison with the more recent PFI from Obu (2021) is shown in Fig. S1. Background map corresponds to © OpenTopoMap.
Three different remote sensing datasets were used in this study: (i) L7/8 images, (ii) VHR images from airborne platforms and satellites, used to validate the L7/8 products temporally, and (iii) Sentinel-1 SAR interferograms, used to validate the L7/8 products spatially. Additionally, GNSS data from a specific rock glacier were used for kinematic validation.
3.1 L7/8 dataset
The L7/8 dataset comprises freely available eight-band multispectral orthorectified satellite images spanning the 2000–2024 period (Fig. 2a and b). Only the panchromatic band (B8) was used, which has the highest spatial resolution (15 m). Due to the Scan Line Corrector failure on the Landsat 7 satellite (2004–2013; Markham et al., 2004), scenes from this period were excluded to avoid data gaps. All images correspond to path/row 233/081. They were cropped to a common grid (3001×3001 pixels) covering 45×45 km2. One image per year was visually selected during the summer months (January to April) to avoid snow and cloud cover (Table S1).
3.2 VHR dataset
The VHR dataset comprises high-resolution satellite orthoimages acquired at irregular intervals between 2000 and 2020 (Fig. 2b). These images comprise data from three different sensors: aerial (0.5 m), GeoEye (0.5 m) and Pléiades (0.7 m). In this dataset, the panchromatic image bands were orthorectified and resampled within the same grid, with a spatial resolution of 1×1 m. Given the variable spatial coverage of the VHR datasets, two sub-areas (i.e. Tapado and Largo rock glacier sub-regions, respectively; Fig. 2) were selected to enure a temporal coverage comparable to the L7/8 dataset.
Most of the VHR images were already orthorectified and used directly by Robson et al. (2022), except for (i) the photogrammetric flight in the 2000s and (ii) the 2014 Pléiades acquisition. Regarding the 2000 photogrammetric flight, data were reprocessed to extend coverage to the Largo rock glacier (4 km north of the Tapado complex area; Fig. 2d) initially omitted in Robson et al. (2022). The photogrammetric processing was based on the method set out by Cusicanqui et al. (2021) using Agisoft Metashape software v. 2.0.3 (Smith, 2011). A total of 16 ground control points (GCPs) were used across both sub-areas, with the 2019 Pléiades DEM serving as a reference for the GCPs (Robson et al., 2022). A coregistration step, based on Nuth and Kääb (2011), corrected small shifts in the 2000s aerial DEM.
For the 2014 Pléiades acquisition, processing was followed by Cusicanqui et al. (2023) to process the stereo pair without GCPs, using only rational polynomial coefficients (RPCs). The 2014 stereo DEM was subsequently coregistered to the 2019 Pléiades DEM, and orthoimages were adjusted accordingly. Finally, VHR images were acquired during the dry season (November to April) over almost two decades (Table S1).
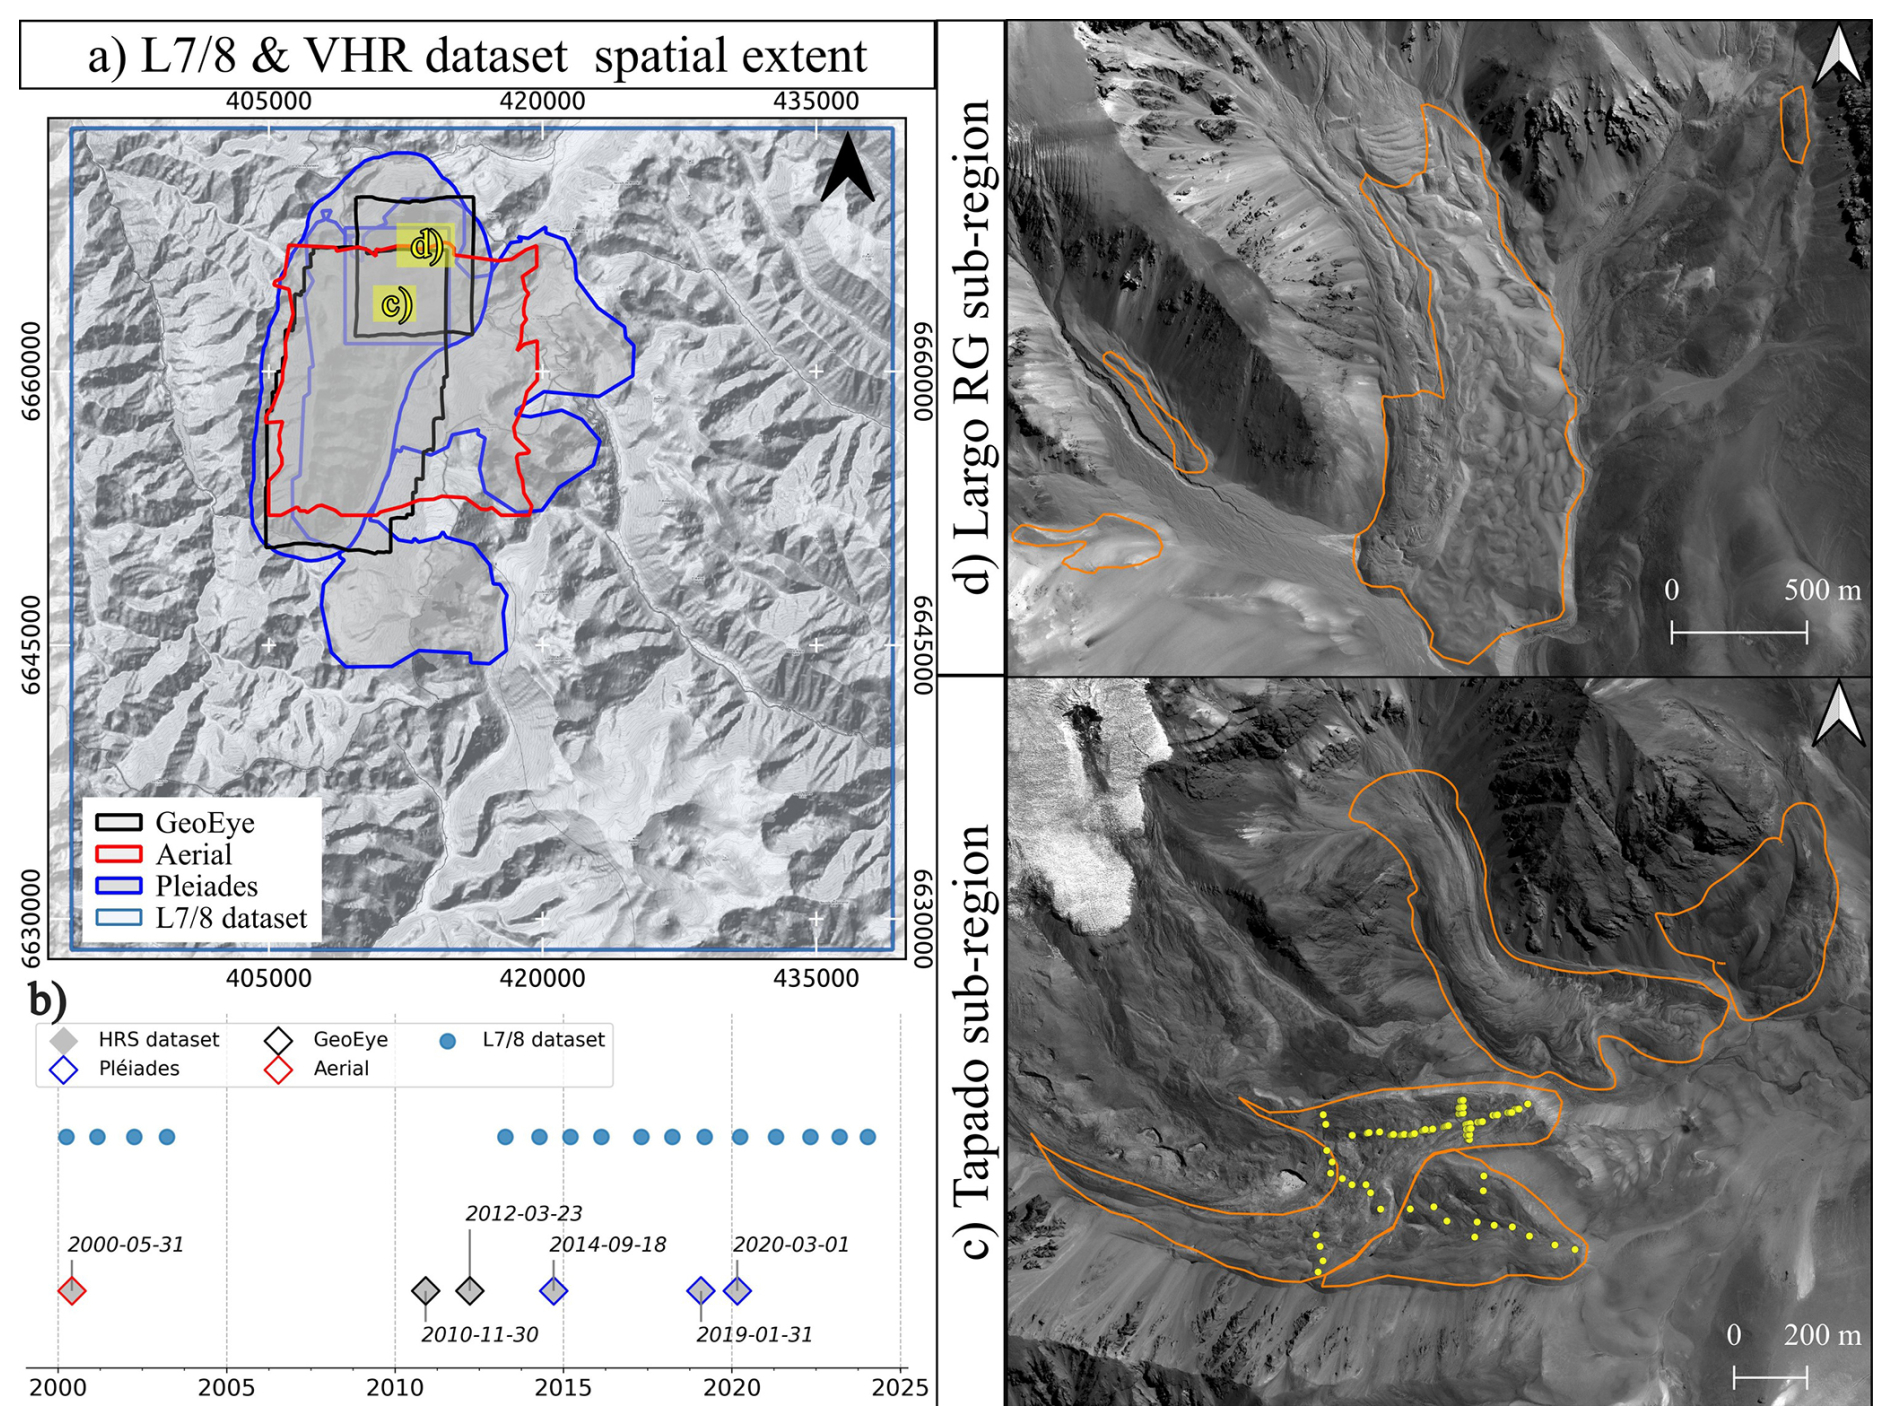
Figure 2(a, b) Spatial extent and temporal distribution of the L7/8 and VHR datasets, respectively. (c, d) Enlarged view of high-resolution sub-regions used for validation. Orange polygons represent the 2013 rock glacier inventory from DGA (2010), and yellow dots represent the GNSS network on the Tapado complex (CEAZA, 2023). Image backgrounds correspond to © OpenTopoMap for (a) and Pléiades 2019 imagery © CNES/AIRBUS for (c) and (d).
3.3 Sentinel-1 interferograms
Due to the limited spatial extent of the VHR dataset, we used raw Sentinel-1 wrapped interferograms to validate the classification of the L7/8 surface displacement products (cf. Sect. 4.3). This analysis involved visual inspection of multiple interferograms covering the entire study area. Sentinel-1 interferograms were processed using the ForM@Ter LArge-scale multi-Temporal Sentinel-1 InterferoMetry processing chain – FLATSIM – service (Thollard et al., 2021) at different temporal baselines (12, 60 and 360 d). This study utilized 40 interferograms from early winter 2022 to late winter 2023 in both ascending and descending orbits (paths 120 and 156, respectively; Table S2). These interferograms were averaged in 2-looks (2 pixels in azimuth, 8 pixels in range) in radar geometry, equivalent to about 30 m in terrain geometry. In brief, the FLATSIM service systematically produces interferograms from Sentinel-1 data and displacement time series over large geographical areas. This service is based on the InSAR “New Small temporal and spatial BASelines” (NSBAS) processing chain, as described in Doin et al. (2011) and Grandin (2015). FLATSIM products were corrected topographically using a Shuttle Radar Topography Mission (SRTM)-DEM and atmospherically corrected using the ERA-5 atmospheric model mapped on the DEM. Full details can be found in Thollard et al. (2021) and the ForM@TER platform.
3.4 GNSS data
The surface kinematics of the Tapado rock glacier have been measured since 2009 over 61 points (DGA, 2010) by the Centro de Estudios Avanzados en Zonas Áridas (CEAZA) using a differential GNSS (dGNSS). According to CEAZA (2012, 2016) and Vivero et al. (2021), the base station coordinates were fixed using the Trimble CenterPoint RTX post-processing service, while differential GNSS data were processed with the Trimble Business Center software (TBC, V.4). The reported average horizontal and vertical precisions (95 %) were 0.02 and 0.04 m, respectively. To address inconsistencies in point locations, i.e. points systematically shifted by a few metres in a north-east direction, 14 points corresponding to the same block and specific dates (11 December 2013, 6 April 2022, 6 December 2010) were removed. The remaining dataset comprises 47 points and was primarily used to validate surface velocity maps derived from both the L7/8 and VHR datasets (cf. Sect. 5.3). Additionally, as no GCPs exist for Largo rock glacier, 13 pseudo-GCPs were manually tracked on representative features clearly identified on the VHR dataset to compare with the L7/8 dataset (cf. Sect. 5.3).
Our methodology relies on the feature-tracking image correlation strategy, analysing a large number of images available for the site. Subsequently, time-series inversion techniques were applied to the correlated images to derive consistent surface displacement fields over time (Sect. 4.1). Then, a medium-resolution DEM was used to identify persistent moving areas (PMAs) along the slope direction (Sect. 4.2). Finally, we validated the final surface velocity fields by comparing them to recent dGNSS measurements and feature tracking of both the L7/8 and VHR datasets in two small sub-regions in the upper La Laguna catchment (i.e. Tapado region).
4.1 Inversion of displacement time series
Horizontal displacement time series were derived from L7/8 and VHR orthorectified images, following a similar approach to that developed by Bontemps et al. (2018) classically applied to slow-moving landslides (e.g. Lacroix et al., 2019). The method used in this study is summarized as follows:
-
Feature-tracking image correlation was performed for all possible pairwise combinations and their permutations (i.e. forward and backward). Two different software were used. Firstly, we used MicMac (Rupnik et al., 2017) through the normalized cross correlation (NCC) algorithm to correlate images within the L7/8 dataset. This software was selected for its ability to handle images with low radiometric contrast and for small objects (Lacroix et al., 2020a). Secondly, the Ames Stereo Pipeline (ASP; Beyer et al., 2018) was employed to correlate image pairs within the VHR dataset. In ASP, the More Global Matching (MGM) implementation (Facciolo et al., 2015) was used to perform image correlation. The MGM algorithm reduces high-frequency spatial artefacts (compared to classic NCC algorithms) in textureless regions and produces smooth surface displacement fields. Image mismatches associated with georeferencing errors are minimized due to the pre-alignment strategy (i.e. automatic identification of image features matched in a pair of images, which are then used as tie-points) before the feature tracking stage. Both software present an adaptive windows matching strategy corresponding to 3×3 for MicMac and 7×7 for ASP as the smallest window size.
-
In both cases, all pixels with low correlation coefficient values (CC <0.6) and displacement magnitudes >120 m were masked. Furthermore, an additional glacier outline masking step was applied to the VHR dataset to avoid noisy displacement values due to glacier retreat. The Randolph Glacier Inventory (RGI v.6) was used as the source of glacier outlines (RGI Consortium, 2017).
-
Additionally, the median surface displacement value was subtracted from both east–west (EW) and north–south (NS) displacement maps for all pairs.
-
For the L7/8 dataset, striping effects from sensor inter-band misalignments (Ayoub et al., 2008; Leprince et al., 2008) were mitigated by subtracting the median value of the stacked profile in the along-stripe direction, considering only stable areas (cf. Sect. 4.3).
-
A least-squares inversion was applied to the redundant displacement pairs for each pixel, separately for the EW and NS components (Bontemps et al., 2018). This process reduced uncertainties by approximately 30 %, as shown in prior applications on SPOT 1–4 images. A weight strategy can be added to the different pairs during the inversion to take into account the surface-cover changes over time. Due to the arid and natural cover of our area of study, this weight is not used here.
4.2 Automatic extraction of PMAs
The cumulative surface displacement time series from the L7/8 images was used to automatically extract PMAs. PMAs consist of connected pixels displaying coherent movement over time and following the downslope direction, as expected for gravity-driven processes (e.g. rock glaciers, landslides) or erosional processes (e.g. shifting rivers, river bank erosion). This methodology, developed by Dehecq et al. (2015), proposes to use the direction coherence of the displacement (called the vector coherence) with time to detect active pixels. A TanDEM-X World DEM with 12 m resolution, smoothed with a 7×7 median filter (approximately 90 m), was used to compute the slope orientation and identify pixels consistent with gravitational movements. Pixels with mean velocity vectors deviating by more than 45° from the downslope direction (calculated over a 200 m kernel size) were removed to account for large-scale topographic undulations. These higher parameter thresholds were selected after multiple trials, considering the lower resolution of the images used compared to Stumpf et al. (2017) and the presence of snow in high mountains that can alter the quality of the displacement fields. Following this pixel-based approach, isolated pixels were removed.
4.3 PMA characterization using InSAR and high-resolution imagery
As mentioned in Sect. 3.3, InSAR-wrapped interferograms were used mainly for the validation and characterization of automatic PMA detection. Rather than create a new inventory of moving areas, we manually checked all polygons resulting from the PMA methodology (Sect. 4.2) against the interferograms. Following Barboux et al. (2014) and RGIK (2023), a combination of all available interferograms (Table S2) with high-resolution Google Earth imagery was used to classify PMAs. A PMA was considered “confirmed” if its polygon overlapped a clear InSAR fringe pattern at any interval (12, 60 and 360 d; Fig. 3). The final classification consisted of two categories: “confirmed” and “not confirmed”. Additionally, a simple geomorphological class based on high-resolution Google Earth imagery was assigned to each polygon. The geomorphological class reflects the landform overlapping the PMA. For instance, a landslide class was assigned when cracks and scarps were present at the surface. The rock glacier class was assigned when typical morphology (i.e. front and lateral margins with a ridge-and-furrow surface topography) was observed. When no clear interpretation of the movement and geomorphic interpretation could be assessed on either InSAR or Google Earth base maps, the “unclassified” class was assigned to those PMAs. These features were often near ridges or valley bottoms (i.e. river bank erosion, road construction, …). Finally, a velocity class was assigned to each PMA based on RGIK (2023) recommendations (Sect. 6.2).
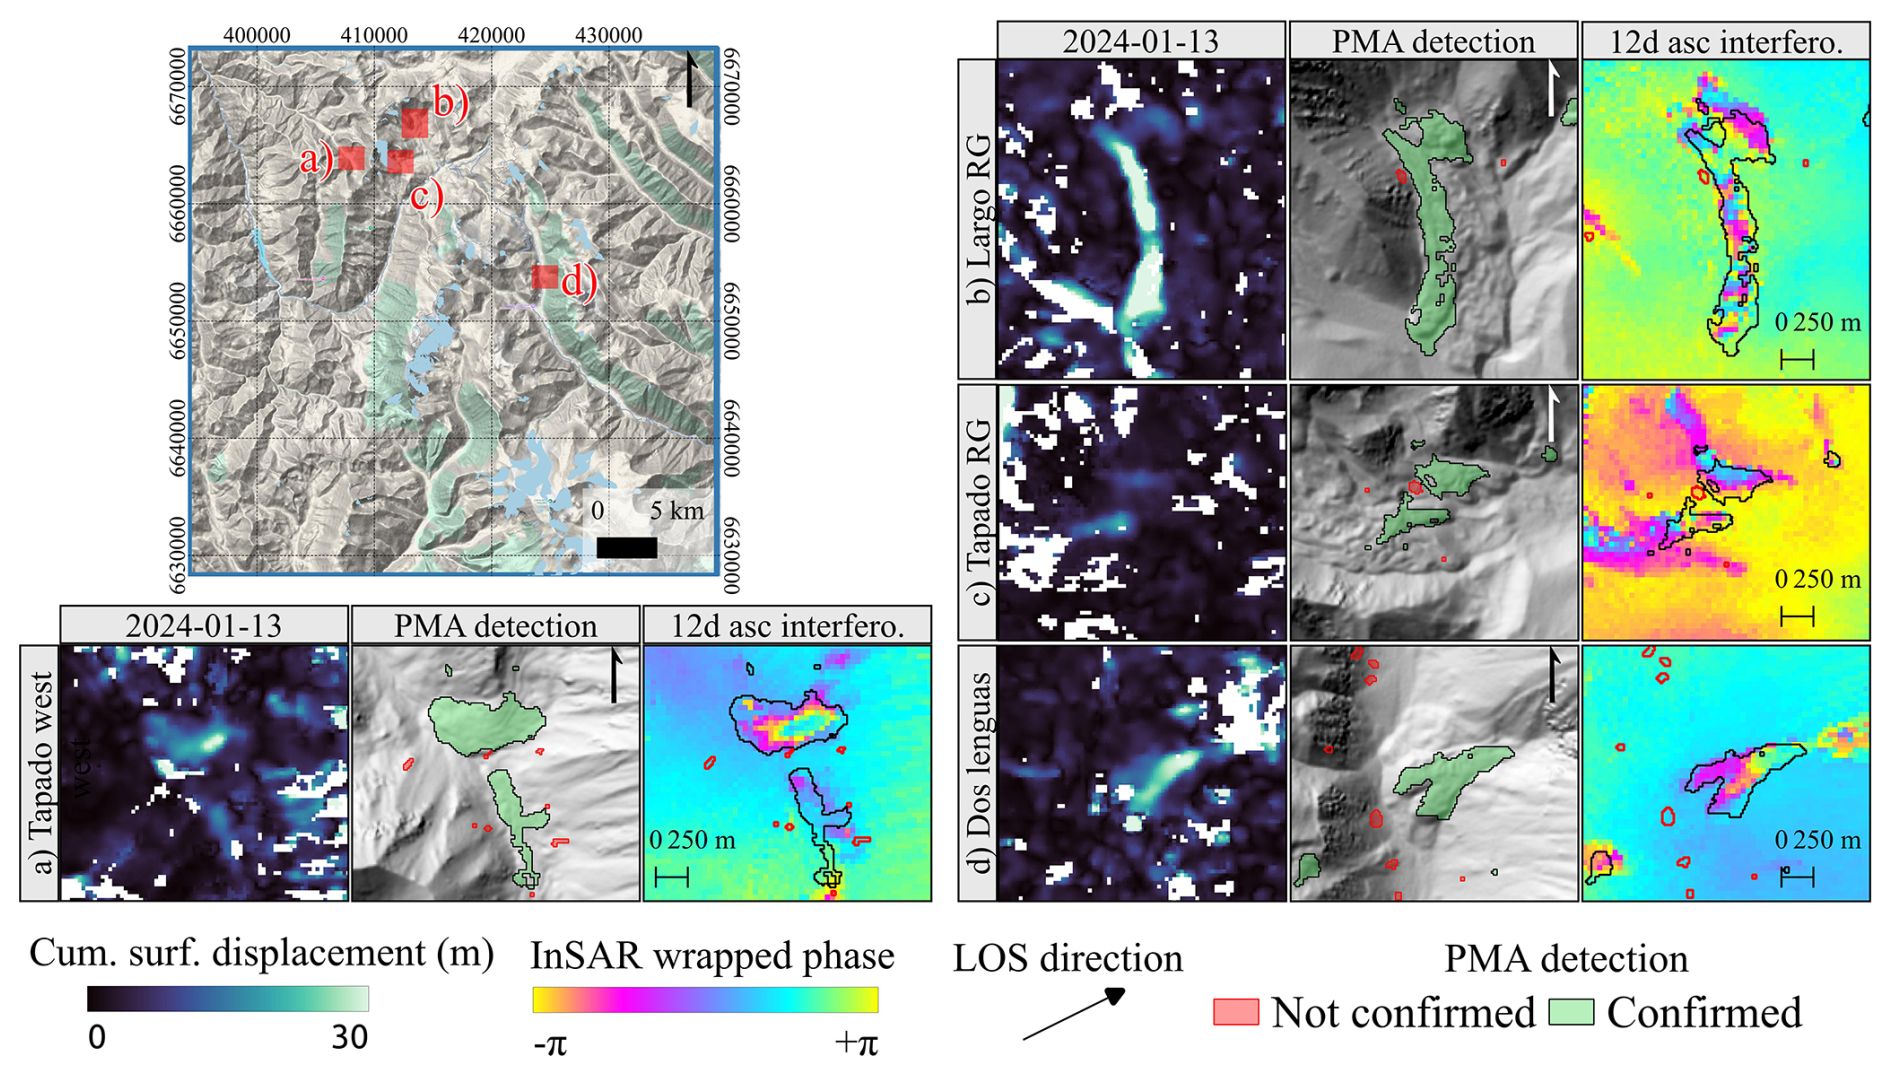
Figure 3Example of raw outputs from inversion time series, PMA detection and PMA validation using InSAR-wrapped interferograms. The upper-left map shows the locations of the small inner maps: (a) Tapado west, (b) Largo rock glacier, (c) Tapado complex and (d) Dos Lenguas. The image background corresponds to © Google Terrain. All inner maps show a cumulative surface displacement map (left) after time-series inversion (last date available), PMA detection after directional and magnitude filtering (middle), and 12 d ascending S1-wrapped interferograms (right). Red and green polygons represent raw “not confirmed” and “confirmed” PMAs, respectively.
4.4 Average spatial velocity and relative velocity changes
The average velocity fields were estimated using a linear fit of the cumulative surface displacements per pixel through time. The representative surface velocity was extracted for each confirmed PMA. The most common approach to obtain average representative surface velocity values is to use the most active portion, typically near the central profile (RGIK, 2023). This approach avoids the potential for lateral variability within the landform (Fig. 3). For instance, Kääb et al. (2021) selected small active sectors to represent the overall velocity of an entire rock glacier. Nevertheless, defining this “active” area remains somewhat subjective and may vary between users. Alternatively, Blöthe et al. (2021) proposed selecting pixels at the 95th percentile above the limit of detection (LoD) to reduce lateral effects. As shown in Fig. 3a to d, the pixels located in the borders often have values close to 0 m yr−1, due mainly to the natural behaviour of rock glaciers – increased friction and low/no ice content in lateral margins – and to the window sizes of the feature-tracking algorithms. Thus, the boundary effect for each PMA can bias the average velocity. To mitigate this bias, we propose a similar approach to Blöthe et al. (2021), retaining only the top 50 % of pixels within each PMA (hereafter referred to as the Top 50 % average velocity) to better represent spatial velocity (Sect. 6.3).
Uncertainties of surface displacement and velocity fields were computed using the normalized mean absolute deviation (NMAD; Höhle and Höhle, 2009) over stable areas, defined using the TanDEM-X DEM and slopes below 35°. Glacier outlines from the RGI consortium (2017) and surroundings (with a 500 m buffer) and all PMAs – both confirmed and unconfirmed – were excluded. Stable areas account for 53 % of the study area (i.e. 45×45 km2; Fig. S4).
In this study, relative velocity changes between two periods are considered and can be calculated using Eq. (1) by using the first period as the reference. The related uncertainties of the relative velocity change can be calculated using Eq. (2), assuming that the NMADs for both periods are similar and not correlated (σV; Sect. 5.4). Finally, from Eqs. (1) and (2), we estimate a pixel-based relative velocity change and the related uncertainty for each PMA:
5.1 Characterization of PMA extraction
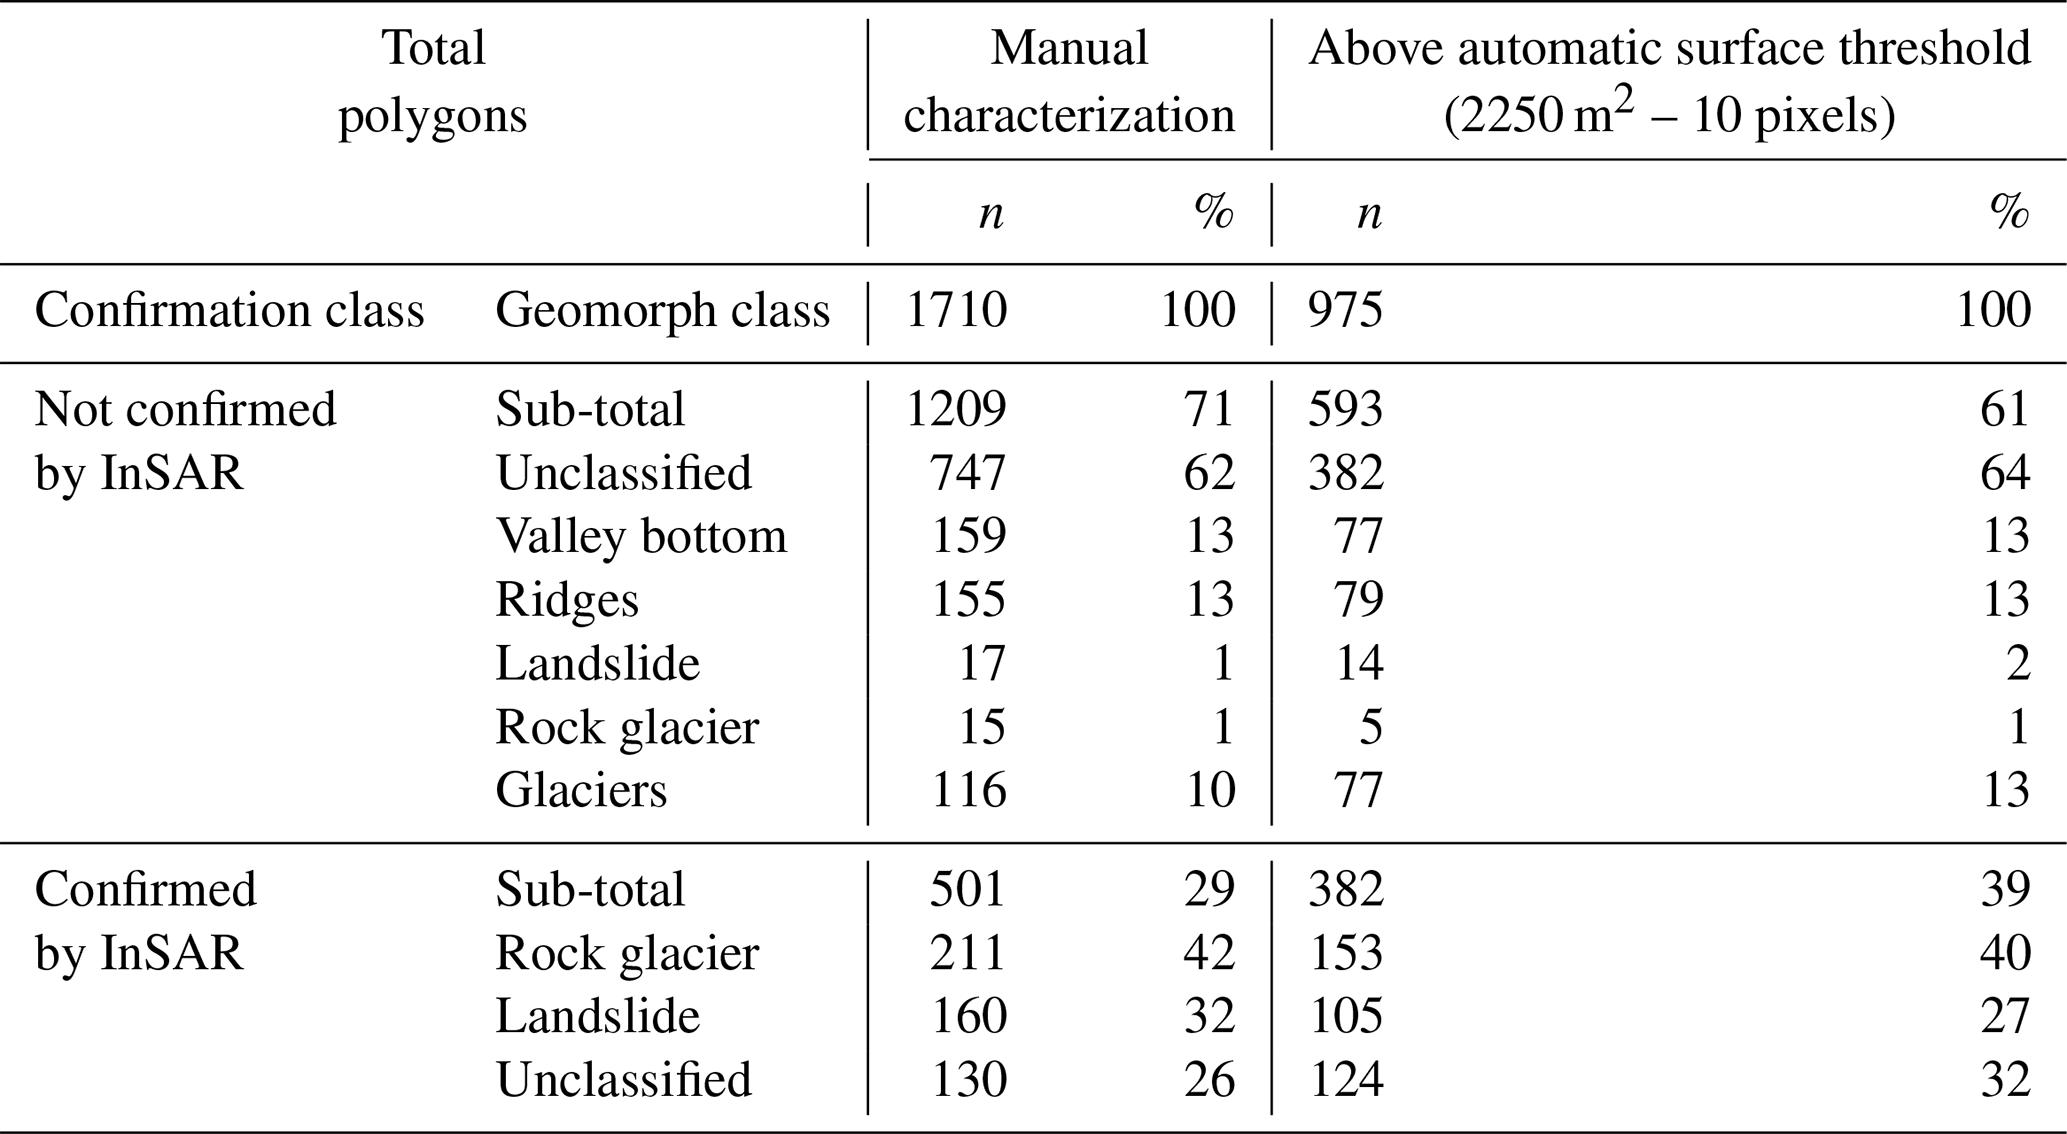
Within the L7/8 dataset coverage area, the automatic PMA detection produced 1710 polygons of moving objects. Raw PMAs range from 225 to ∼755 000 m2 (Fig. 4). All PMAs were verified using InSAR and optical cross-check validation (cf. Sect. 4.3). From this analysis, 29 % of PMAs were classified as “confirmed” (n=501). Among these, 42 % were identified as rock glaciers, 32 % as landslides and 26 % as “unclassified”. Among the rock glacier class, we identified six rock glaciers directly connected to a debris-covered glacier. These remained in the “rock glacier” class rather than creating a separate category, as PMA coverage was predominantly over the rock glacier component. Conversely, 71 % of PMAs (n=1209) were classified as “not confirmed” due to a lack of clear interpretation from Google Earth optical imagery and interferograms. Among the “not confirmed” PMAs, 10 % (n=116) correspond to the glacier class and were directly removed from the dataset. Table 1 summarizes all features and classes identified through the interpretation analysis.
Table 1Summary of raw PMA geomorphological characterization through cross-check verification using S1 InSAR and Google Earth optical imagery (cf. Sect. 4.3). Information about their statistical distribution is presented in Fig. S1.
During the manual characterization process, we noticed the presence of an important number of small and isolated polygons within the “not confirmed” class (Fig. 4), mostly near mountain ridges and the valley bottom (Fig. S3). As these tiny polygons could not be correctly interpreted, a surface threshold of 2250 m2 (i.e. 10 pixels) was applied to remove them automatically. This threshold was selected based on the PMA size and the corresponding InSAR fringe pattern (Sect. 3.3; Fig. 3), as interpretation became difficult below this threshold. Applying this threshold, 43 % (n=735) of all PMAs were removed from the analysis.
The selected surface threshold effectively removed noisy (smaller) PMAs while retaining coherent (larger) PMAs by compromising only 15 % of the confirmed PMAs (Fig. 4). After applying a surface threshold and removing PMAs classified as glaciers, the remaining filtered dataset contains 901 PMAs (47 % of the initial dataset), of which 39 % (n=382) of the PMAs are confirmed. These confirmed PMAs correspond to rock glaciers and mostly large landslides (Table 1), with a mean surface area of ∼30 000 m2 (Fig. S3). The remaining 61 % (n=519) of unconfirmed PMAs also represent a consistent group of pixels, potentially representing landslides, but could not be validated through the cross-check methodology (cf. Sect. 4.3). These unconfirmed PMAs have a mean area size of 8000 m2, equivalent to 35 pixels, and are often isolated near the mountain ridges or valley floors. From Fig. 4, we can state that the ratio of confirmed to unconfirmed PMAs increases with PMA size, suggesting that larger objects are more likely to be detected using the L7/8 dataset. Further discussion regarding the possible causes of these polygons can be found in Sect. 6.2. For the rest of the paper, only the 382 confirmed polygons will be considered.
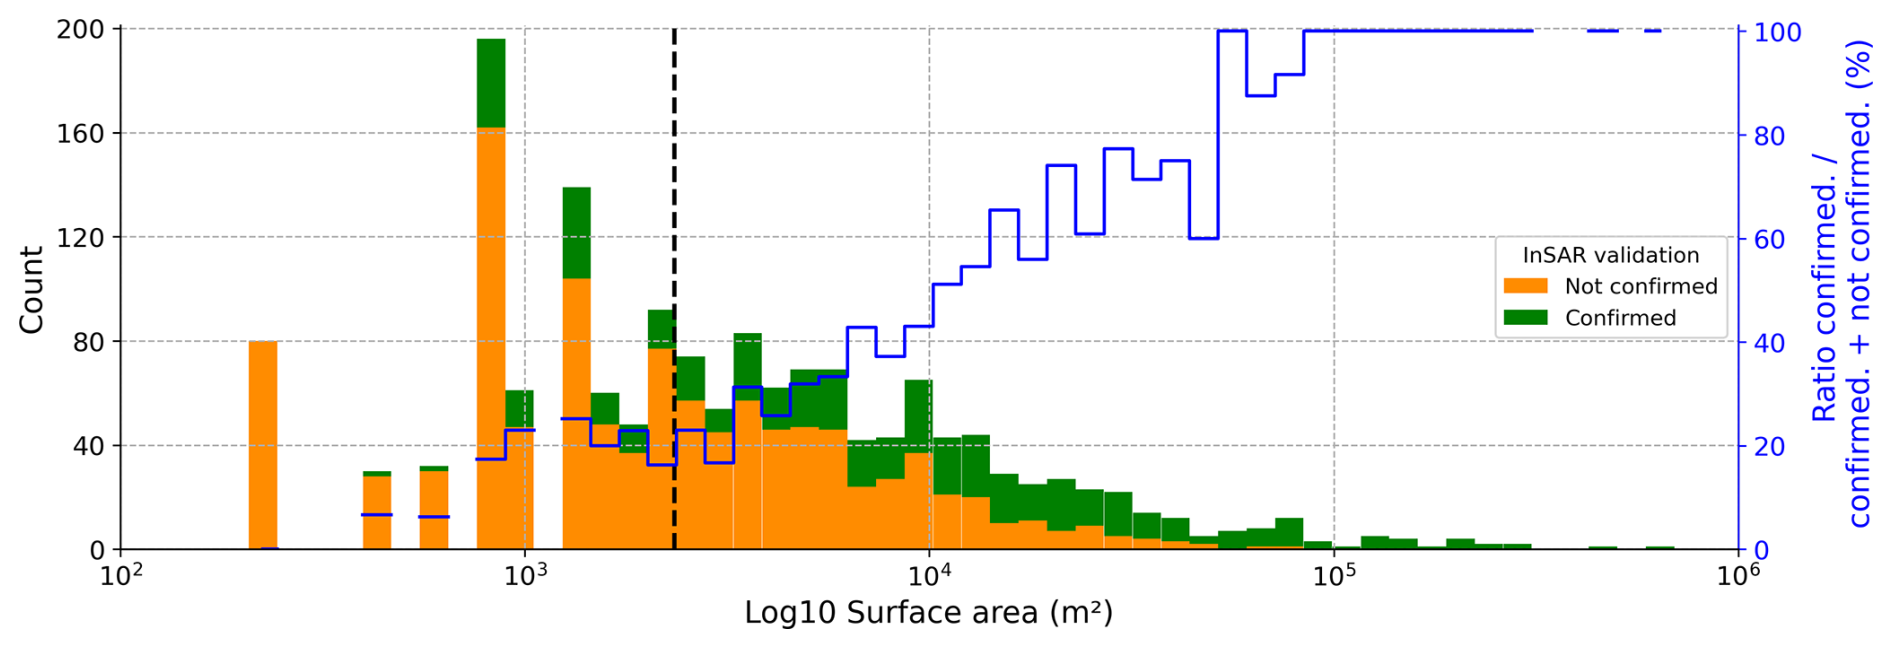
Figure 4Distribution of raw “confirmed” and “not confirmed” PMAs by surface area (bins = 50). The black vertical line represents the surface threshold, i.e. 2250 m2 (10 pixels), used as a filter to remove smaller PMAs. All polygons below the surface threshold were removed. The blue line represents the ratio between confirmed features and total features by bins. To access the PMA polygons we used for our own assessment, refer to the “Data availability” section.
5.2 Regional distribution of surface velocity
Figure 5a provides an overview of the 24-year average velocity across the central Andes region. For each PMA, a coherent downslope surface velocity field overlaps a sector of a rock glacier (cf. Sect. 6.3 for discussion). The Top 50 % average velocity corresponds to 0.30 m yr−1 over the 24-year period for all 382 PMAs. The NMAD computed over stable areas corresponds to ±0.07 m yr−1 over the same period (cf. Sect. 5.4 for a discussion about the uncertainties).
The Top 50 % average velocities for each geomorphological class – rock glaciers, landslides and unclassified – are 0.37, 0.20 and 0.18 m yr−1, respectively. Rock glaciers exhibit a median average velocity 23 % higher than the dataset-wide average (Fig. S9). Only three PMAs exceed Top 50 % average velocities greater than 2 m yr−1, namely, the Largo rock glacier (Figs. 2c, 5c), Olivares complex and Olivares west rock glaciers (Fig. 5f and g), and one landslide. Additionally, eight PMAs have velocities between 1 and 2 m yr−1, including five large rock glaciers and three landslides. The remaining 371 PMAs have average velocities below 1 m yr−1 over the 24-year period.
In addition to average velocity fields, cumulative displacement time series were obtained for all PMAs (Figs. 5, S9). These time series capture temporal variations such as accelerations or decelerations (Fig. 5e and f). Most of the rock glaciers with mean velocities <1 m yr−1 show a linear trend in cumulative surface displacement (Fig. 5b and d). Annual velocity fluctuations are difficult to assess due to the high uncertainties of individual displacement fields (NMAD between 1.21 and 3.07 m in Table 2).
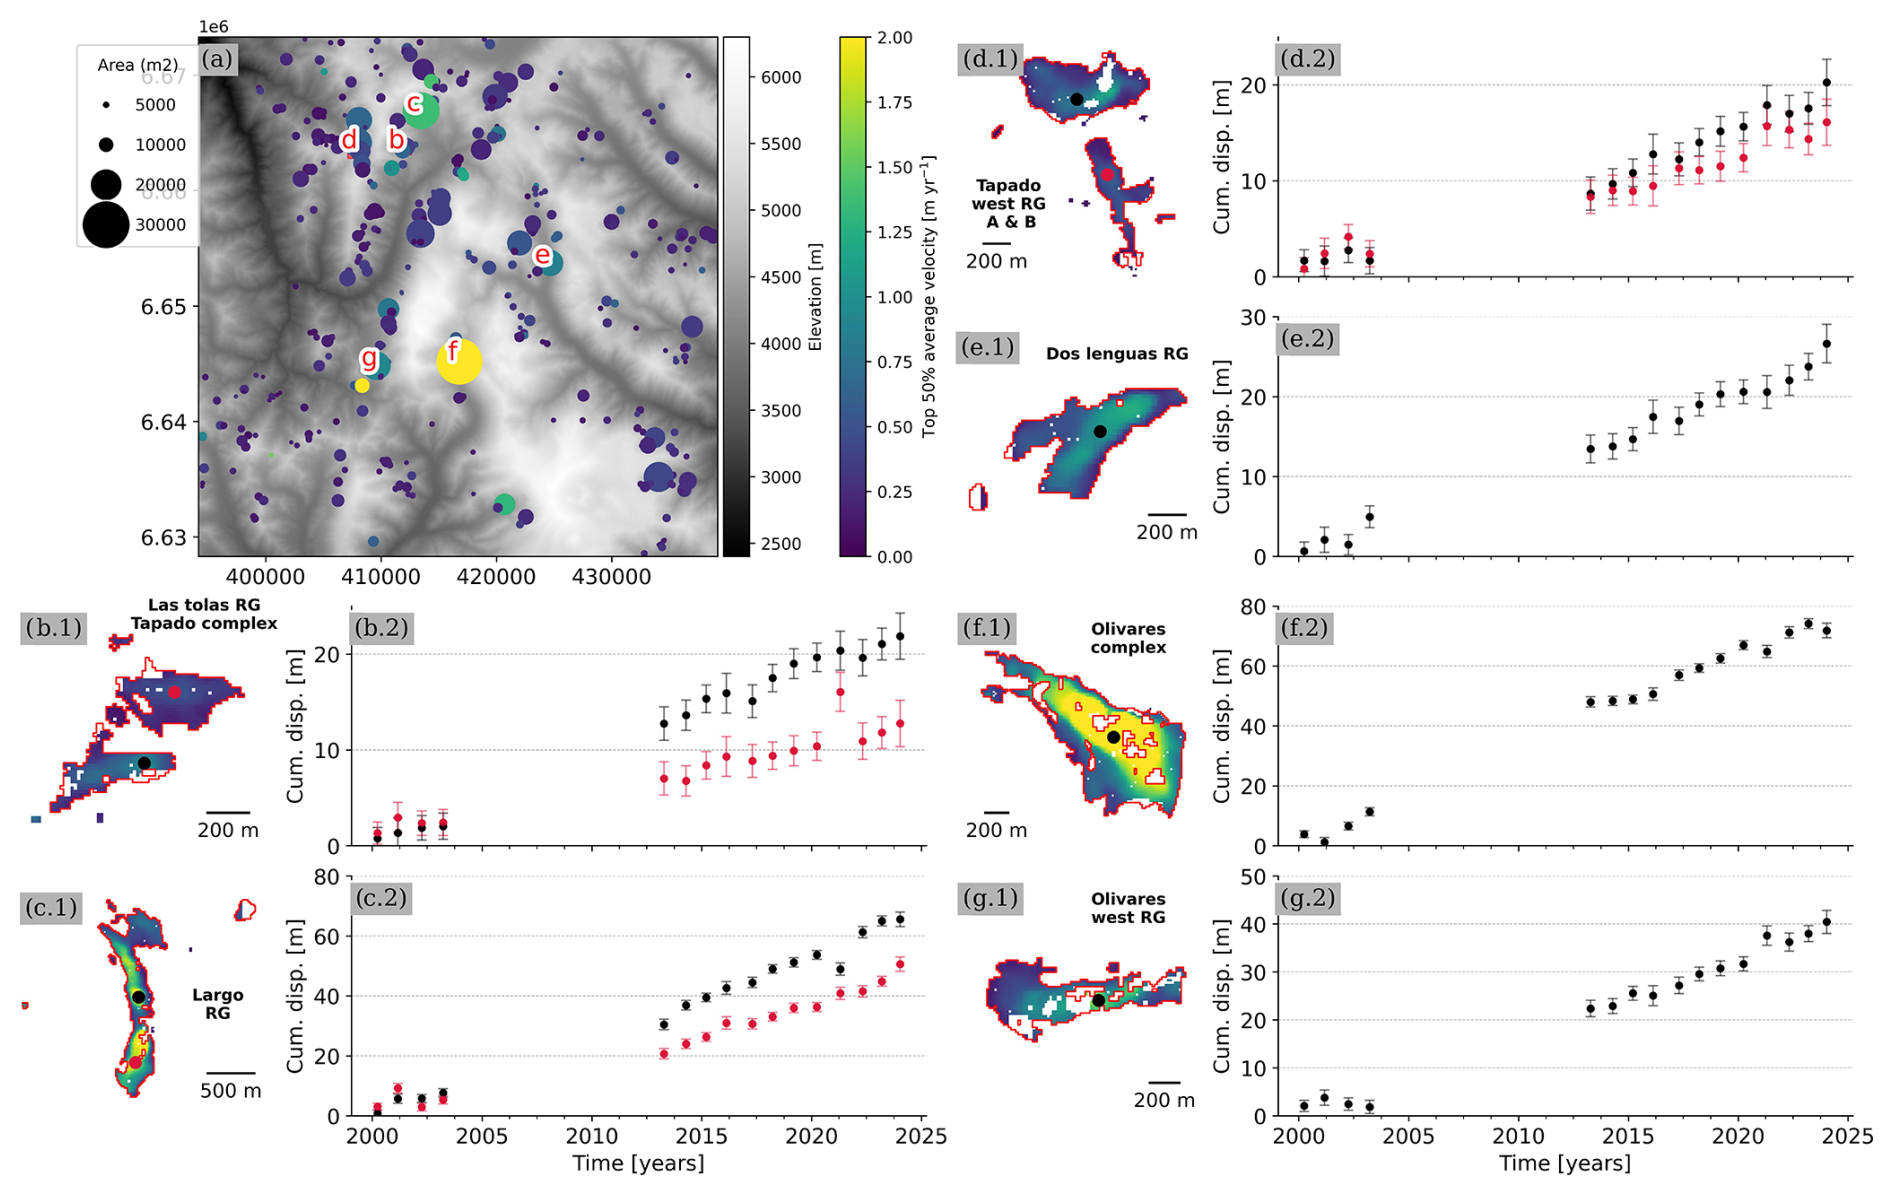
Figure 5Surface kinematic characterization for all PMAs in the central Andes region. (a) illustrates the spatial distribution of all valid PMAs (rock glacier = 153; landslide = 124; unclassified = 105), coloured by the “Top 50 % average velocity” surface velocity (Viridis colour bar) within the PMA surface. The size of the circle scales with the PMA surface. The red letters correspond to the study cases presented in the following subplots. The remaining subplots (b) to (g) (appended with “.1”) illustrate the mean annual velocity field over 24 years (2000–2024) for a specific landform (the name is displayed in bold), where the magnitude of the velocity is coloured using the Viridis colour bar from panel a). Subplots appended with “.2” represent the cumulative surface displacement time series in metres, extracted from the black (and red) point within the landform. Error bars show the NMAD on stable areas for each date (Sect. 5.4). Subplots (b) to (g) correspond to the following landforms: (b) Tapado complex and Las Tolas rock glacier; (c) Largo rock glacier; (d) Tapado west rock glacier; (e) Dos Lenguas rock glacier; (f) Olivares complex, (g) Olivares west rock glacier.
5.3 Velocity validation using GNSS and VHR datasets
We compare surface velocity fields for two selected sub-regions: Tapado complex (Fig. 2c) and Largo rock glacier (Fig. 2d). The first comparison involves GNSS points distributed along the main tongue of the Tapado complex and Largo rock glacier – located in the central flow line as well as the borders of the landform – and L7/8 and VHR surface average velocity fields (Fig. 6). This point-to-pixel comparison is shown in Fig. 7, where a good agreement between VHR, GNSS and pseudo-GCPs is observed. However, some differences – particularly an underestimation of the average velocity – are noticeable at points near the borders of the Tapado complex and the Largo rock glacier. In addition, some of the fastest points on the Largo rock glacier show important differences.
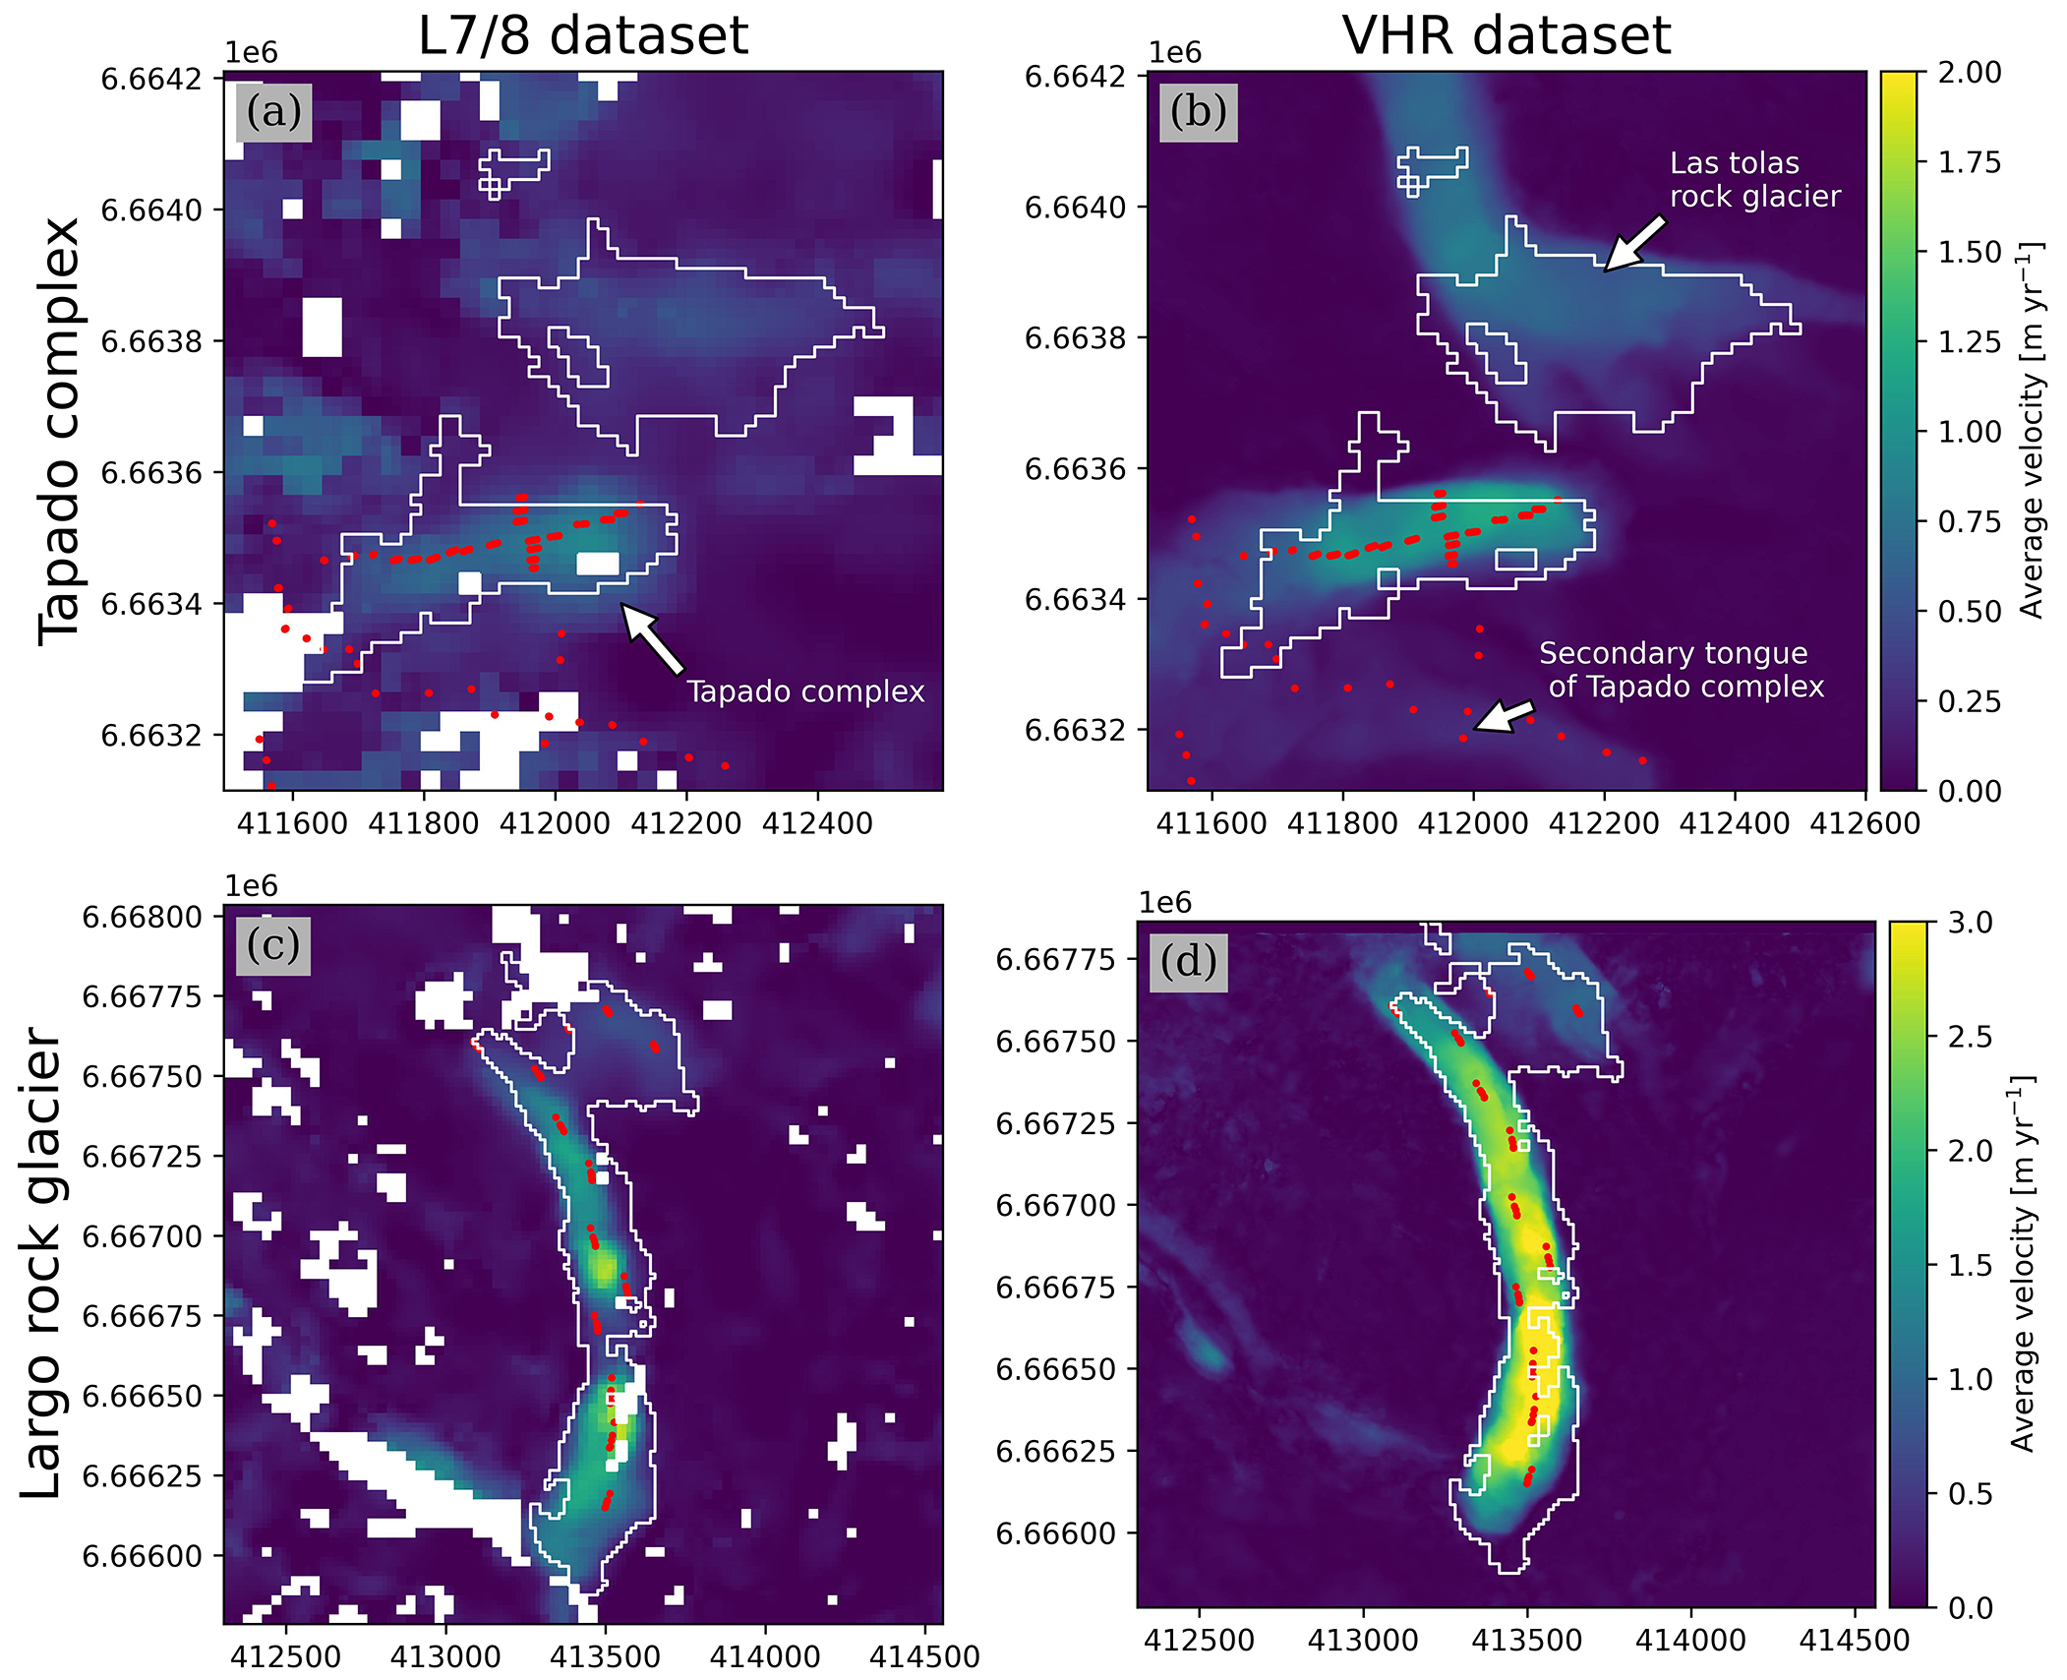
Figure 6Comparison of mean annual velocities over the 2000–2020 period for the Tapado complex (a, b) and Largo rock glacier (c, d) for both the L7/8 and VHR datasets, respectively. Red points show the location of GNSS for the Tapado complex (CEAZA, 2023) and the pseudo-GCP for the Largo rock glacier. White polygons correspond to their respective PMAs identified from the L7/8 dataset (Sect. 3.5).
Quantitatively, the average velocity differences between VHR and GNSS points are 0.01±0.05 m yr−1 (Tapado complex) and 0.38±0.3 m yr−1 (Largo rock glacier). Meanwhile, the average difference between the L7/8 and GNSS points is 0.18±0.24 m yr−1 (Tapado complex) and 1.35±0.84 m yr−1 (Largo rock glacier; Fig. 7). The good agreement on slow surface velocities for the Tapado complex could be explained by the homogeneous surface velocity field in both datasets (Fig. 6a). However, this consistency is not observed for the Largo rock glacier, where large differences are likely due to the heterogeneity of its surface velocity field. Figure 6c shows a single PMA that could be divided in two, splitting Largo rock glacier into two different units with likely independent dynamics. This is not the case for the VHR velocity field, showing rather a more homogeneous spatial distribution of velocities (Fig. 6d).
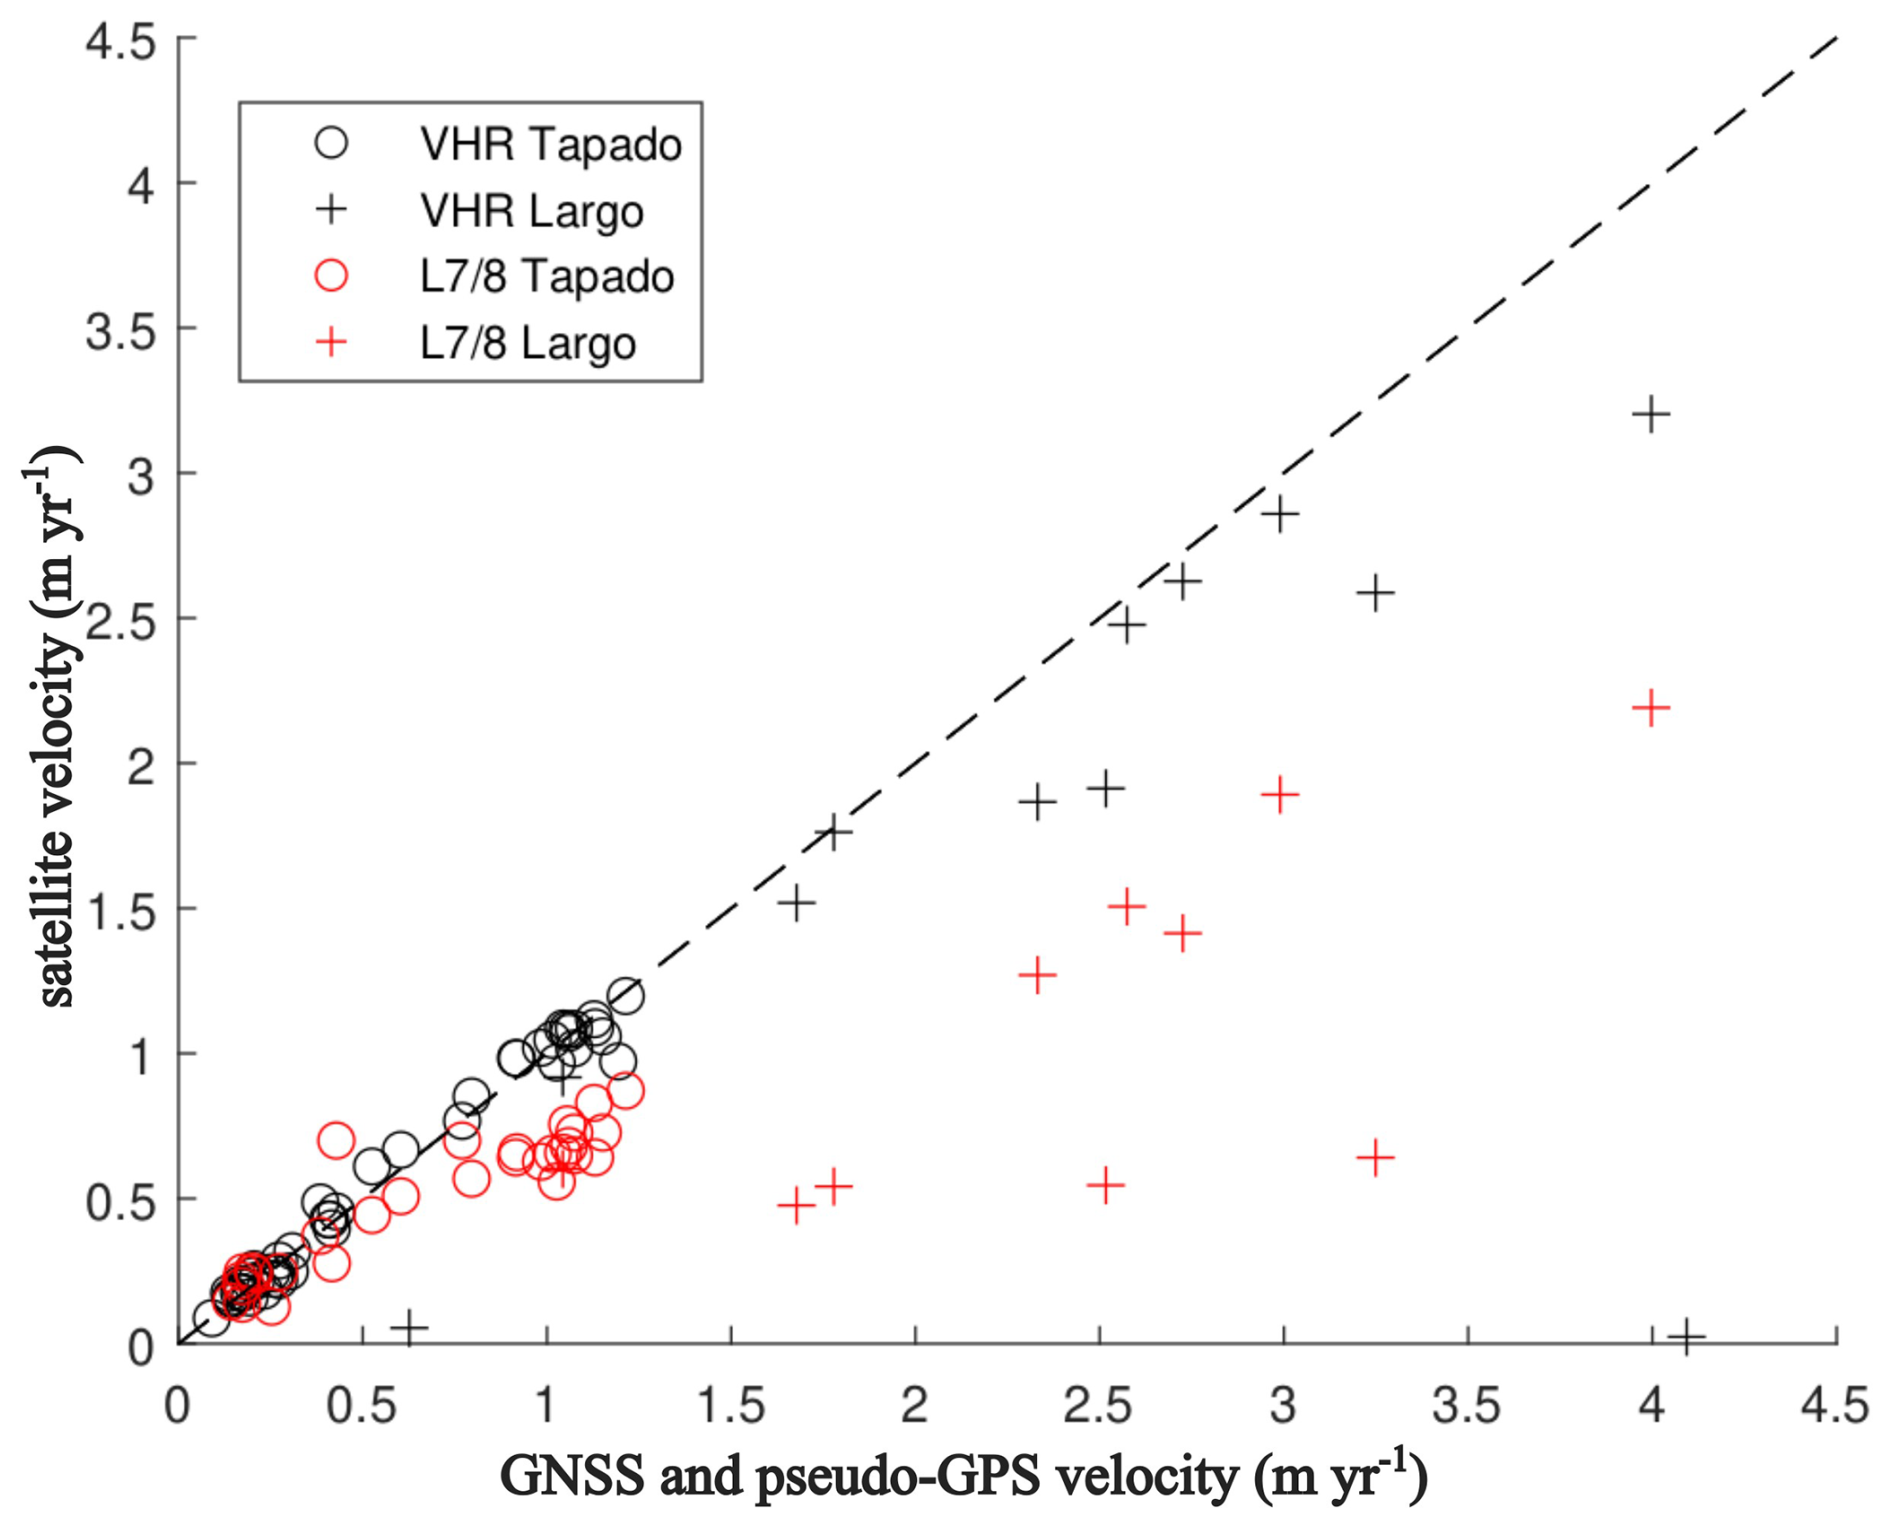
Figure 7Comparison between GNSS and pseudo-GCPs average velocity and average surface velocity fields from both the L7/8 (red) and VHR (black) datasets for the sub-regions of the Tapado complex and Largo rock glacier. The average surface velocities from the GNSS measurements and the L7/8 and VHR datasets were calculated according to the common time period, spanning from 2009 to 2020.
A detailed comparison with VHR optical imagery revealed a good agreement with the GNSS data. The correlation coefficient between the two datasets is 0.99 for the Tapado complex and 0.45 for the Largo rock glacier, with a linear fit coefficient of 0.99 and 0.44, respectively. The lower correlation at the Largo rock glacier is attributed to points situated near the rock glacier borders (Figs. 6, 7). The correlation between the L7/8 and GNSS data is also very good, especially for the Tapado complex (0.92 and 0.7 for Tapado and Largo, respectively). However, L7/8 tends to underestimate the velocities (coefficient of the linear fit of 0.69 and 0.45 for the Tapado and Largo rock glaciers; cf. Sect. 6.1 for further discussion).
5.4 Reported uncertainties
The horizontal accuracy assessment at annual and selected periods in this study is summarized in Table 2. For the L7/8 dataset, the average NMAD of surface displacement over stable areas obtained is 1.8 m in the EW and NS components (Table 2), which corresponds roughly to 1/10 of the L7/8 pixel size. Individual displacement fields have too high uncertainties to reliably detect significant annual scale velocity changes. However, at decadal timescales, uncertainties decrease significantly (Table 2). The NMAD is 0.21 and 0.19 m yr−1 for the 2000–2014 and 2013–2024 periods, respectively. Applying the average NMAD value for both periods as a filter of PMAs results in 150 PMAs that are above this threshold, being good candidates to depict velocity changes. The Top 50 % average velocity at decadal scale of all PMAs is 0.3 m yr−1, 1.5 times larger than the uncertainty.
Table 2Accuracy and uncertainty assessment of surface displacement and surface velocity at annual and decadal time spans. Spatial statistics were computed over a stable area of 53 % for L7/8 (n pix = 4 810 045) and 55 % (n pix = 10 593 874) and 47 % (n pix = 3 522 115) for the Tapado complex and Largo rock glacier VHR dataset, respectively.
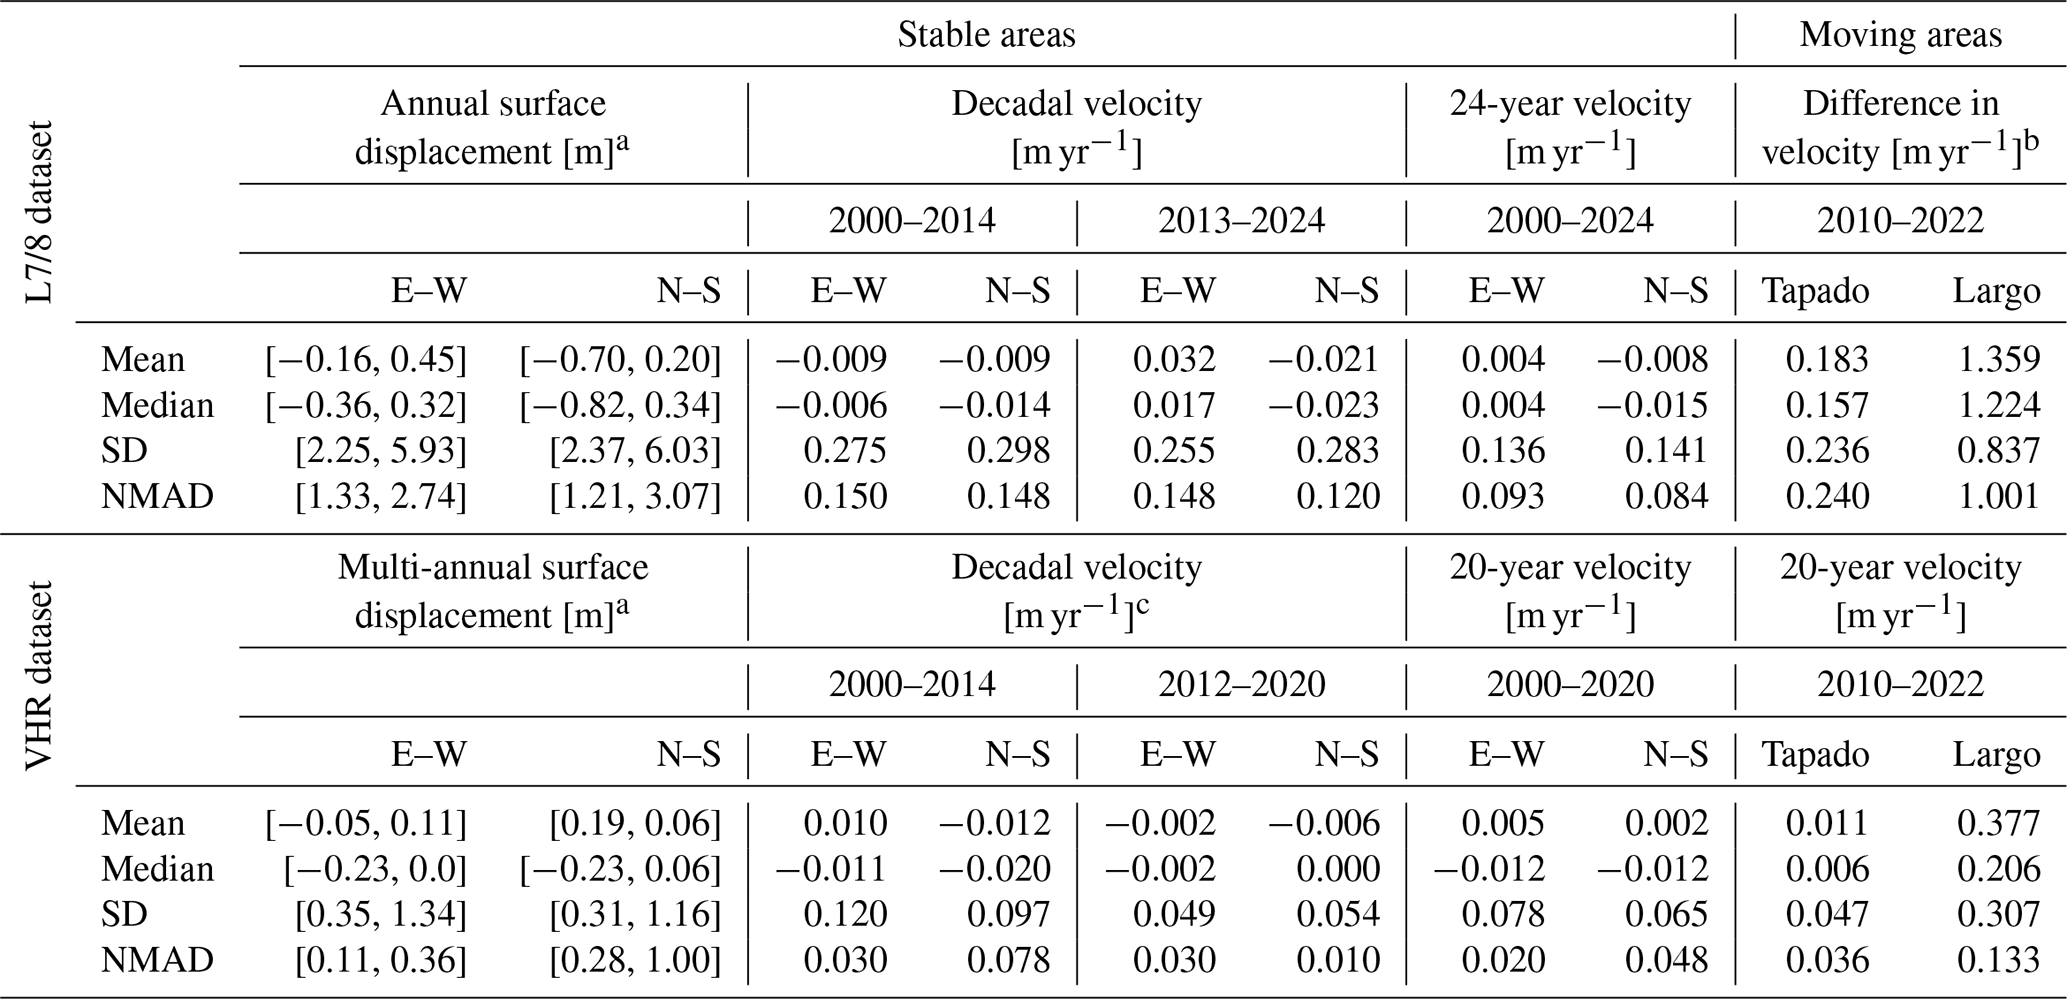
a Values between brackets represent the range (min and max) of values over a stable area for each component. b Difference velocity between GNSS and pseudo-GCPs vs. surface velocity fields, computed using the same time period. c The VHR dataset was split into two sub-periods in an attempt to fit the same time span as for the L7/8 dataset.
5.5 Velocity changes
Using the 24-year surface displacement dataset, decadal velocity changes (Eq. 1) and velocity change uncertainties (Eq. 2) were computed using the Top 50 % average velocity over two periods, i.e. 2000–2014 (V1) and 2013–2024 (V2), across all PMAs. However, because relative velocity changes depend on the initial velocity magnitude (Eq. 1), velocity changes on PMAs with smaller magnitudes (<0.3 m yr−1) exhibit higher uncertainties. According to our calculations, only 2 % (n=8) of the entire PMA dataset exhibits velocity changes greater than their respective uncertainties (σVchange; Fig. 8). Among these, three rock glaciers, two landslides and three unclassified PMAs were identified. These three rock glacier PMAs have an average size of 6075 m2 (∼27 pixels) with a Top 50 % average velocity of 0.59 m yr−1 . Two (one) of them accelerate (decelerates) with a mean value of 198 % (−46 %). Landslide PMAs have an average size of 15 412 m2 (∼69 pixels) and a Top 50 % average velocity of 2.5 m yr−1. However, only two cases exhibit acceleration with a mean of 214 %. PMAs in the “unclassified” class have an average size of 7050 m2 (∼31 pixels) and a Top 50 % average velocity of 0.44 m yr−1. One (two) accelerates (decelerate) with a mean value of 70 % (−42 %). Regarding the remaining 98 % of PMAs (n=374), velocity variations could not be confidently detected, as they remain within the uncertainty range (Fig. 8; Table 2).
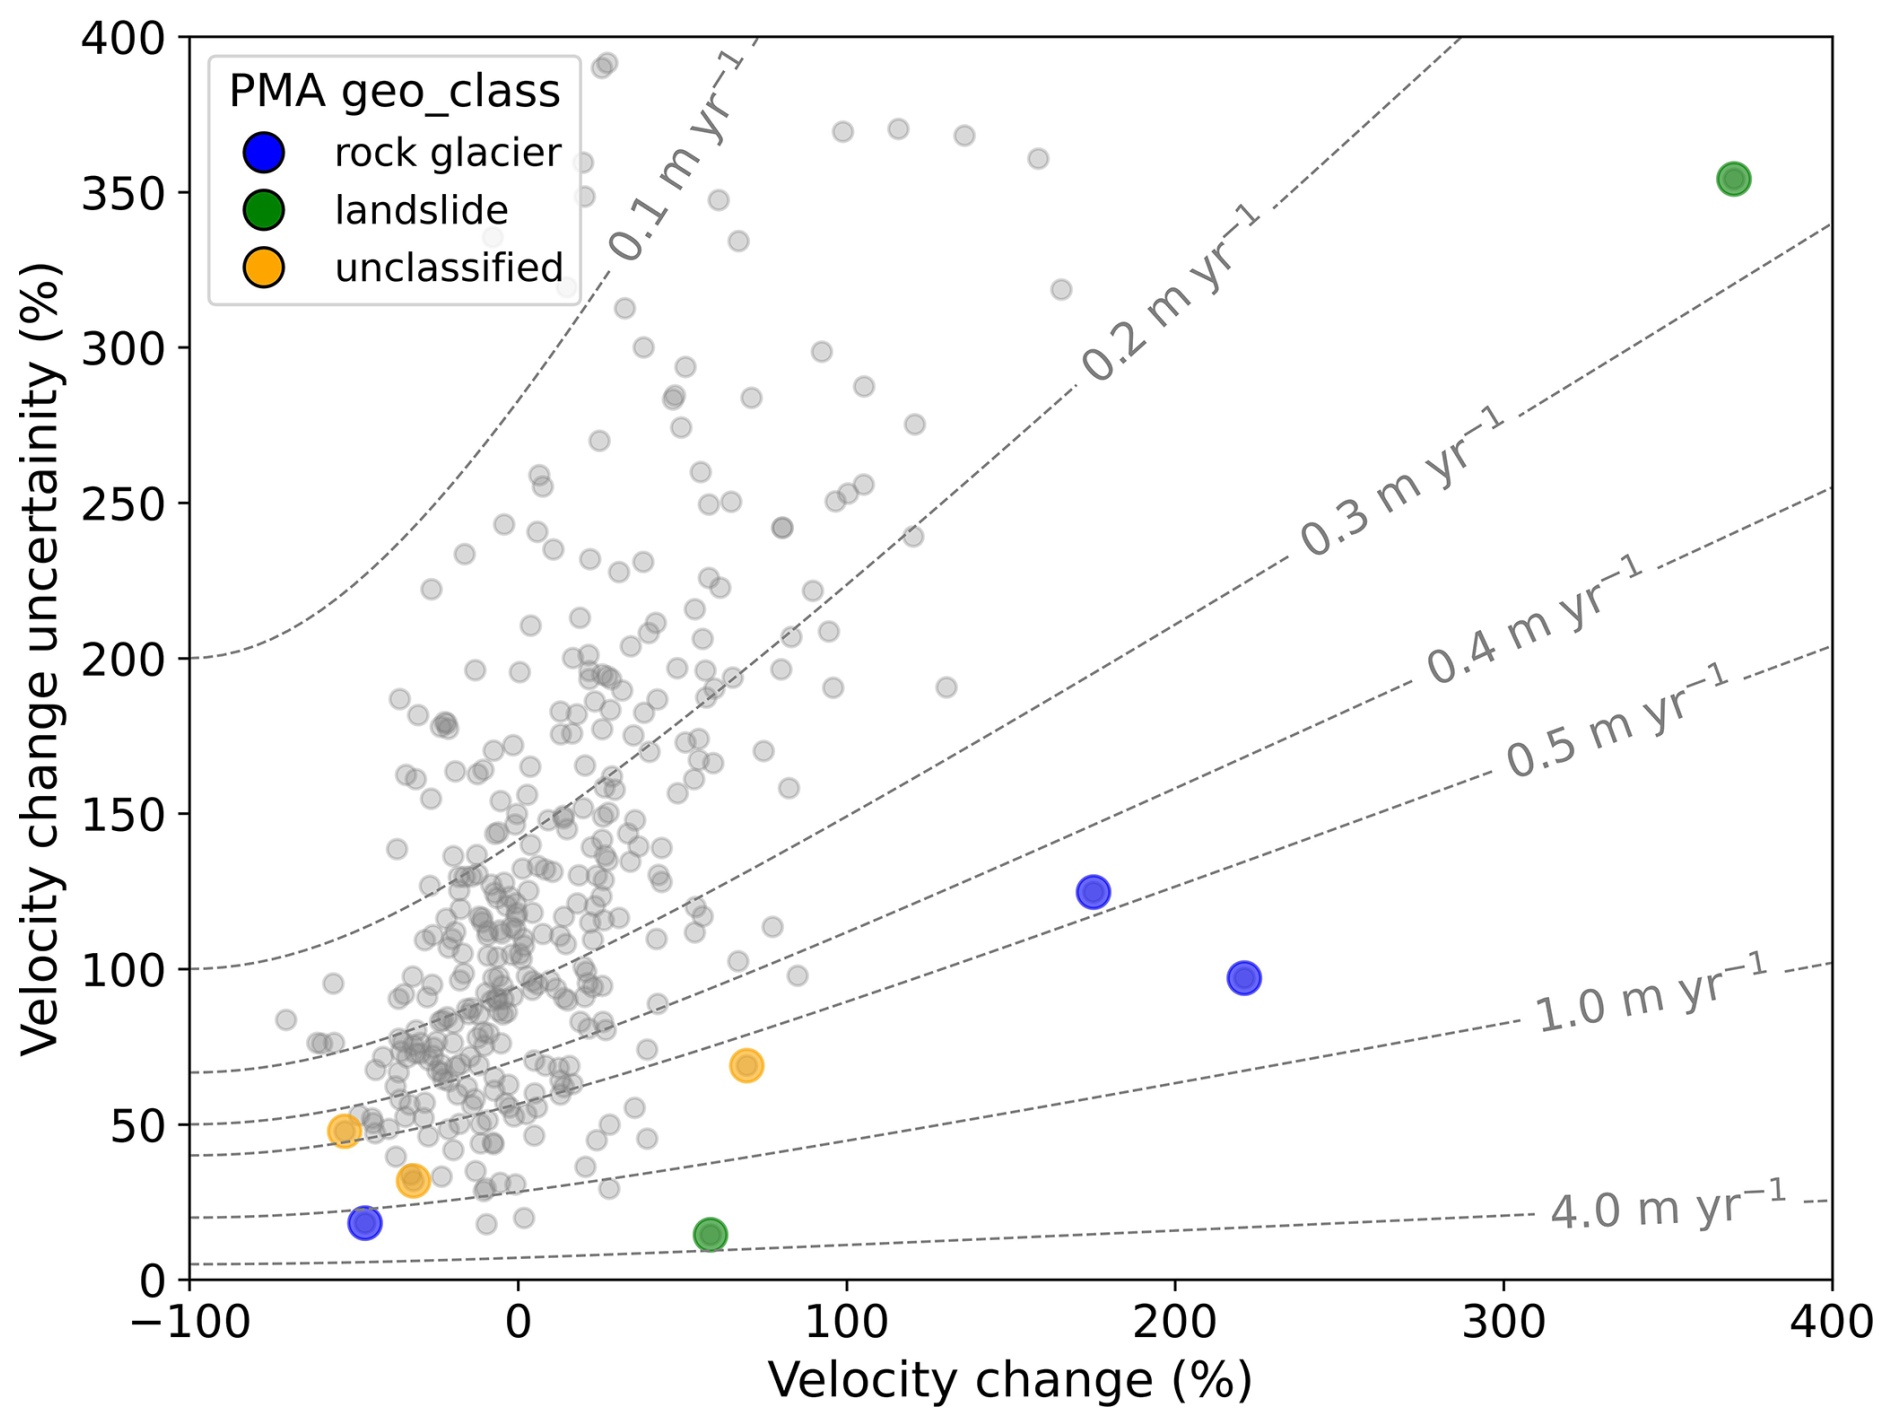
Figure 8Modelling of relative velocity changes (dashed lines; Eq. 1) and their respective uncertainties (Eq. 2) for various velocity magnitudes (0.1–4 m yr−1). Grey dots represent the entire PMA dataset. Blue, green and orange dots highlight PMAs where velocity changes exceed their uncertainties.
Rock glacier velocities are typically estimated using high-resolution optical data (e.g. Pellet et al., 2022) and SAR remote sensing imagery (Strozzi et al., 2020; Villarroel et al., 2018), but these datasets are prohibitively expensive for larger areas and/or relatively recent, covering only the past 20 years (Toth and Jóźków, 2016). In contrast, Landsat imagery (e.g. L4-5-7 or L8) extends back to the mid-1980s (Kooistra et al., 2024; Ustin and Middleton, 2021). In this context, freely accessible L7/8 imagery emerges as a valuable source for studying rock glacier kinematics over extensive spatial and temporal scales (Lacroix et al., 2020b). To the best of our knowledge, this is the first time that Landsat imagery is being employed to monitor rock glacier displacement time series and derive velocity changes. This analysis is enabled by combining robust methods, including information redundancy, time-series inversion and persistent moving area detection, which make the L7/8 data viable for rock glacier monitoring. Nonetheless, certain limitations and future perspectives regarding the use of Landsat imagery for rock glacier kinematics analysis must be addressed.
6.1 Intrinsic limitations on the remote sensing datasets
The primary technical consideration is the spatial resolution of the L7/8 dataset (15 m in the panchromatic band). This pixel size is coarse relative to the region's average surface velocity (i.e. ∼1 m yr−1; Vivero et al., 2021; Halla et al., 2021). This method is therefore best suited for fast-moving rock glaciers. In regions with large rock glaciers, such as the Andes or the High Mountains of Asia (Sun et al., 2024), medium-resolution L7/8 imagery can provide new insights into the temporal dynamics of rock glaciers. Here, a minimum surface threshold of 2250 m2 (10 pixels) proves effective for the Andes but may be less suitable for regions with smaller rock glaciers, such as the European Alps, where features may fall below the detection threshold. The 15 m spatial resolution also limits the ability to capture fine details and thus small-scale spatial variations in velocity. Figure 6 illustrates how pixel size affects boundary delineation: in the Tapado complex, the secondary tongue (Fig. 6a, b) – moving at 0.25–0.5 m yr−1 (Vivero et al., 2021) – appears indistinct, with gaps and noise in the displacement fields (Fig. 6a), as does the adjacent Las Tolas rock glacier. Despite this, the automatic PMA extraction (Sect. 3.4) successfully identifies a coherent PMA across much of Las Tolas' tongue (Fig. 6a), demonstrating this filter's potential for detecting active rock glaciers, even in high-altitude regions where snow and shadows introduce noise in image correlation (Cusicanqui et al., 2023).
Another key consideration is the surface roughness and texture of rock glaciers, for instance, features like ridges and furrows, which appear less detailed in L7/8 than in the VHR dataset (Fig. 2c). This can impact the feature tracking performance (Heid and Kääb, 2012). For example, on the main tongue of the Tapado complex (Fig. 6a), the L7/8-derived surface velocity is consistent with the GNSS data (0.01±0.05 m yr−1). Meanwhile, the 24-year average surface velocities align with Vivero et al. (2021), and a discrepancy of 0.1–0.2 m yr−1 is observed, likely due to L7/8's image resolution. Similar differences occur on the Dos Lenguas rock glacier, which has an average velocity of 1.5–2 m yr−1 (Halla et al., 2021; Strozzi et al., 2020), while L7/8 imagery shows average velocities of 1.1–1.5 m yr−1 (Fig. 5e). In contrast, the Largo rock glacier presents greater complexity. Despite its ridge-and-furrow morphology, its homogeneous texture (Fig. 2d) reduces contrast, potentially explaining observed discrepancies between the L7/8 and VHR results (3–4 m yr−1; Fig. 6c and d). Velocity estimates in landforms with high spatial heterogeneity are highly affected by the L7/8 resolution, which captures less surface details. Therefore, correlation parameters are key when performing image correlation (Heid and Kääb, 2012; Leprince et al., 2008; Rosu et al., 2015). As L7/8's smallest matching window (3×3 pixels, covering 2025 m2) differs substantially from the VHR window (7×7 pixels, covering 49 m2), an averaging effect occurs. This difference contributes to the observed variability in features such as the Largo rock glacier. Finally, solar illumination changes introduce shadow-induced noise in the image correlation (Dehecq et al., 2015), which was minimized by selecting L7/8 images mainly from March (with a few from January).
6.2 Validation of PMA using InSAR and local rock glacier inventories
The average velocity fields from the L7/8 optical satellite data align well with the Sentinel-1 interferograms and their interpretation (Fig. S16) when comparing the InSAR-wrapped interferograms and PMA characterization. However, this comparison is affected by different uncertainties: (i) while S1 interferograms show only LOS motion, limiting the discrimination of lateral and vertical movements (Barboux et al., 2014), optical imagery provides both horizontal components of surface kinematics. (ii) Unconfirmed PMAs, often located in low-relief areas, near riverbeds or close to ridges (Fig. S2), are likely due to the smoothed DEM used as the slope direction reference or shadows in the L7/8 images. Some PMAs also appear near human settlements, including mining sites, where InSAR did not indicate displacement. (iii) Interferograms reflect movements over short time intervals (e.g. 12 or 60 d) within a limited time period (2022–2023), potentially missing gravitational movements that were inactive at that time. (iv) InSAR velocity classes for PMAs followed RGIK (2023) recommendations, though FLATSIM interferograms have a coarser pixel size (30 m) than those in Strozzi et al. (2020) or Bertone et al. (2022), making fringe patterns difficult to discern, especially for small landforms.
Some PMAs cover complex landforms with diffuse boundaries and thus were assigned by requiring a general geomorphological classification without specific discriminations, including debris-covered glaciers and glacier–rock glacier transitions (Monnier and Kinnard, 2015, 2016). Additionally, PMAs categorized as “unclassified” lack clear geomorphological features for a complete interpretation. Rock glaciers are slightly better detected than landslides, likely due to the lower motion variability with time. Rock glaciers are viscous flows (Haeberli et al., 2006) undergoing activity changes over long periods (Kellerer-Pirklbauer et al., 2022; Lehmann et al., 2022, 2025). In contrast, landslides are influenced by seasonal and transient patterns (Lacroix et al., 2020b).
A comparison with existing rock glacier inventories for the Chilean (DGA, 2022) and Argentinian (IANIGLA, 2018) Andes was conducted, focusing on PMAs classified as rock glaciers only (n=153). Using the Ch–Arg rock glacier inventory as a reference, 68 % of the PMAs (n=104) intersect the existing inventory at an average of 30 % of their surface area (Fig. S12). However, only 20 % of the overlapping PMAs (n=20) coincide with more than 50 % of their surface. The remaining 32 % of the PMAs (n=49) are unmapped rock glaciers identified through L7/8 optical imagery and validated with InSAR (RGIK, 2023). This comparison relies on the accuracy of the Ch–Arg rock glacier inventories, which contain certain ambiguities. For instance, the Chilean inventory, released in 2013 and updated in 2022 (DGA, 2022), overrepresented rock glaciers by including headwall sections (Fig. S12), while the Argentinian inventory defines rock glacier boundaries more conservatively. Neither of the two inventories has yet been updated according to RGIK guidelines (RGIK, 2023). Finally, InSAR velocity data indicate that 69 % of the rock glacier PMAs (n=105) were detected using 12 d interferograms (Fig. S16), suggesting a velocity class between 30 and 100 cm yr−1 (RGIK, 2023), consistent with our results.
6.3 Average PMA surface velocity
Because our dataset provides a spatial representation of surface displacement for 382 PMAs – comprising 153 rock glaciers, 124 landslides and 105 non-classified landforms – we pose the following question: what is the most appropriate threshold for computing average surface velocity fields? Computing statistics per landform using the same threshold is challenging due to the large pixel size of L7/8 imagery and the varying PMA sizes. When velocities are computed using the Top 50 % average velocity, bias resulting from lateral variability is minimized, and only the central portion of the PMA is conserved, corresponding to the fastest area (see Fig. S15 for a comparison). This methodology, inspired by Blöthe et al. (2021), ensures that the fastest area is selected independently for each PMA based solely on the 24-year average velocity. However, using different thresholds can lead to overestimations of the average velocity. Figure 9 quantifies the impact of selecting the Top 50 %, 30 % and 10 % average velocities. The mean difference between the full-PMA average velocity and the Top 50 %, 30 % and 10 % velocities corresponds to 20 %, 31 % and 44 %, respectively. These differences underscore the significance of selecting an appropriate threshold. Here, we consider that the Top 50 % average velocity computed over a 24-year period represents an optimal compromise preserving the average velocity field while minimizing lateral effects and maintaining a sufficient number of pixels within the PMA. This approach also reduces the operator-induced ambiguity. Nevertheless, further studies should be conducted to evaluate this metric using different temporal intervals and with different remote sensing datasets.
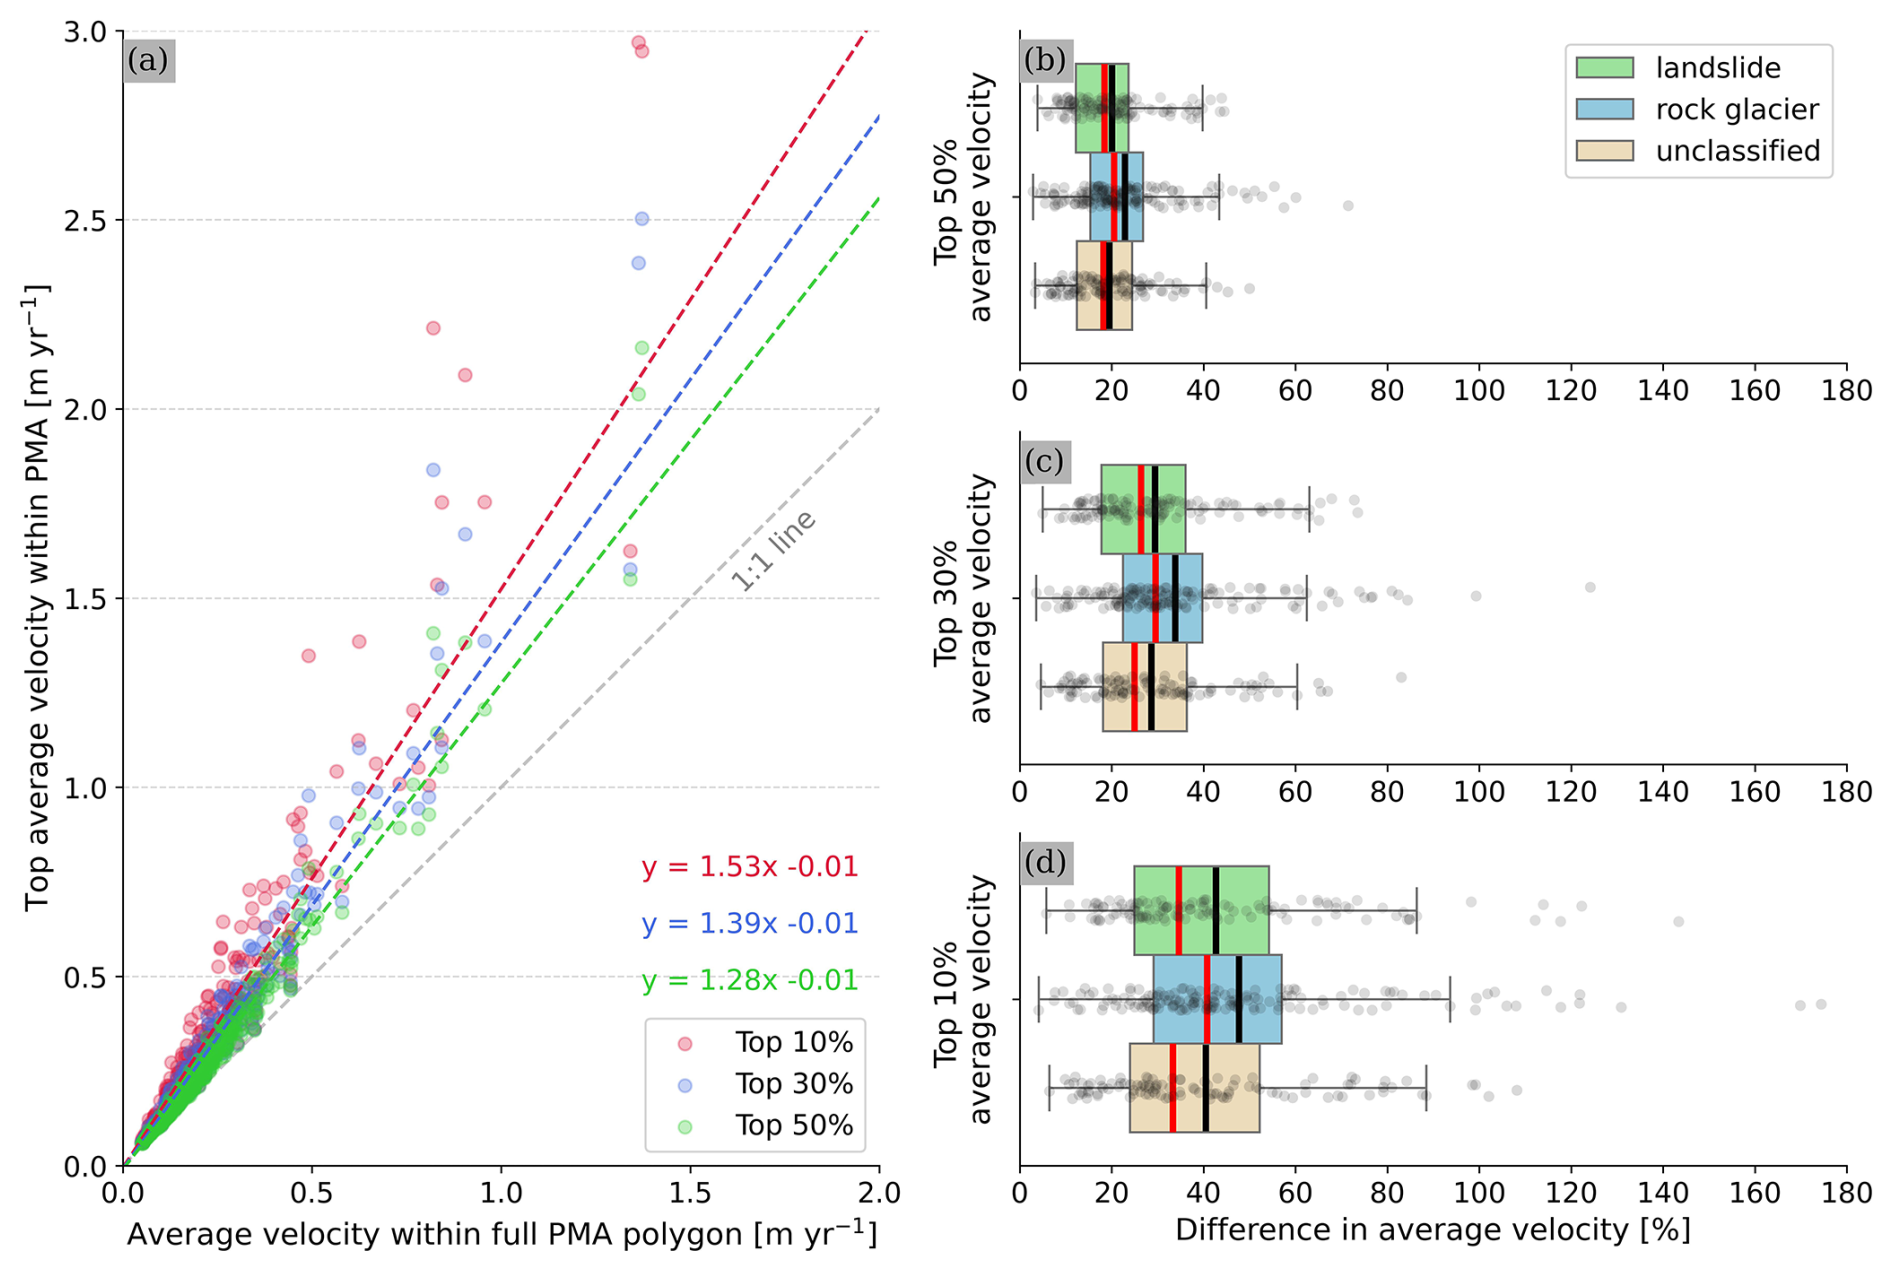
Figure 9(a) Comparison between the average velocity computed using the entire PMA surface and the Top 50 %, 30 % and 10 % average velocities within the PMA. Subplots (b), (c) and (d) show the difference between the average velocity and the Top 50 %, 30 % and 10 % average velocities with respect to the average velocity computed over the entire PMA surface.
6.4 Surface velocity variations and uncertainties
Regarding uncertainties in those PMAs with GNSS data – the Tapado and Largo rock glaciers – our approach generally underestimates surface velocities by 10 %–20 % on average (Fig. 7). Tapado velocities (1–2 m yr−1) align well with the GNSS data, whereas Largo velocities (2–4 m yr−1) are underestimated by 30 %–40 %, likely due to textural differences and the lack of contrast on the L7/8 dataset (Sect. 6.1). The overall underestimation of surface velocities in the L7/8 imagery could be attributed to the large pixel size (15 m), which reduces pixel counts per matching window. Calculations show an NMAD of surface velocities over 24 years on stable areas of 0.07 m yr (1σ), similar to uncertainties found by Kääb et al. (2021) in the Tien Shan region using high-resolution historical images with poor scan quality and by Wood et al. (2025) using a single pair of Landsat imagery in the same region. In contrast, Blöthe et al. (2021), using a limit of detection (LoD) method with high-resolution optical images, reported uncertainties from 0.28 to 0.5 m yr−1. The low uncertainties reported from L7/8 imagery over the 24-year period support the reliability of our interpretation.
However, annual velocity uncertainties are notably higher than those estimated over the entire period (Table 2). The NMAD of consecutive displacements over stable areas (Fig. S3) is 1.8±0.33 m, consistent with previous studies (Lacroix et al., 2019; Scherler et al., 2008) using L7/8 images. Only 2 % of PMAs (n=8) were retained by applying this NMAD as an LoD filter (Blöthe et al., 2021), corresponding to large and fast rock glaciers (Fig. 5c, f, and g). This analysis demonstrates that L7/8 imagery allows kinematic characterization of rock glaciers over large periods of time (10–20 years) but not for annual velocity variations.
Regarding uncertainties in decadal velocity changes between 2000–2014 and 2013–2024, three main factors contribute:
-
Observation discrepancies. The 2000–2014 period includes only six images due to a gap between 2003 and 2013, whereas 2013 to 2024 has 11 years of continuous observations. This imbalance may bias average velocity and conditioning-related uncertainties (Figs. 5, 8). Using ASTER or other medium-resolution imagery could help to fill this gap, despite its low radiometric resolution (Lacroix et al., 2022).
-
PMA size. L7/8 imagery performs better on larger landforms with more pixels. Velocity change uncertainties are higher at PMA borders due to the lower velocity magnitudes and the lateral discontinuity, which is less pronounced on larger PMAs. However, the larger PMAs obtained in this study are linked to complex processes (e.g. glacier–permafrost interactions) that may have influenced internal landform variability. The Largo rock glacier exhibits a velocity increase of +54 % and +29 % for the L7/8 and VHR datasets, respectively. Conversely, the Olivares ice-debris complex (debris-covered glacier connected) showed a −9 % velocity change in one decade when using the L7/8 data. Similar patterns were observed 100 km south of Elqui Valley (Monnier et al., 2014; Monnier and Kinnard, 2013, 2015), as well as in the Tien Shan region (Kääb et al., 2021) and the European Alps (Cusicanqui et al., 2023; Gärtner-Roer et al., 2022; Kunz and Kneisel, 2020). These observations suggest that complex interactions between glacier retreat and permafrost-related landforms influence surface velocities, highlighting the need for further research.
-
Andean velocity observations. Limited Andean studies report significant velocity changes in recent decades. Vivero et al. (2021) found a 7 % change in acceleration in the 2000–2020 decades. Our VHR data show limited changes, with a % slow-down in the Tapado complex and a % speed-up in the Largo rock glacier between 2000–2010 and 2010–2020. Over 40 years, Vivero et al. (2021) observed a 0.2 m yr−1 acceleration in the Tapado complex, representing a 25 % increase in velocity. Such a level of acceleration might not be detected by L7/8 imagery, mainly due to the high uncertainties (Fig. 8) and coarse spatial resolution (cf. Sect. 6.1). More recently, Blöthe et al. (2025) reported unchanged velocity change patterns across 175 rock glaciers over the past 50 years in the Valles Calchaquíes region (northwestern Argentina). Overall, our findings confirm limited rock glacier velocity changes in several regions of the Andes. Further studies could benefit from incorporating older datasets, like SPOT 1–4 up to the mid-1980s or Corona images from the 1960s, to extend the temporal coverage and improve trend detection (Dehecq et al., 2020; Kääb et al., 2021).
6.5 Wider geomorphic implications of PMAs
Understanding the broader geomorphic implications of PMAs is critical for interpreting their role in high mountain environments and their response to climatic and geomorphological processes. While this study primarily focuses on the kinematic and spatial characteristics of PMAs, this section contextualizes the observed patterns within a regional framework. By bridging findings with topographic and geomorphological contexts, we highlight the factors influencing PMA spatial distribution and surface dynamics. The PMAs in the study area show heterogeneous spatial distribution across topographic conditions (Fig. 5a). Analysis of the Top 50 % average velocity in relation to slope, aspect, elevation and surface area – derived from the TanDEM-X 12.5 m DEM – reveals several key patterns (Figs. 10, S7).
-
Rock glaciers predominantly occur uniformly on slopes of 10–35°, while “landslides” and “unclassified” features are concentrated on steeper slopes (>25°), peaking at 30 and 35°, respectively. This pattern aligns with the regional slope distribution, suggesting slope as a key control for landslides and unclassified landforms (Fig. 10a).
-
The slope aspect varies distinctly by landform type. Rock glaciers primarily face west to south and east, consistent with regional permafrost models (Gruber, 2012; Obu, 2021; Azóocar et al., 2017). In contrast, “landslides” and “unclassified” features predominantly occur on northwest to east-facing slopes (Fig. 10d). Similar findings from Blöthe et al. (2021) in the Cordon del Plata underscore slope orientation as a key controlling factor.
-
Most rock glaciers with velocities between 1 and 2 m yr−1 are located at 4500–5000 m a.s.l., although no strong correlation with altitude was found. Conversely, “landslide” and “unclassified” PMAs occur at lower elevations (∼3500 m a.s.l.), often where permafrost is heterogeneous or discontinuous (Gruber 2012; Azócar et al., 2017) (Fig. 10b).
-
In the Top 50 % average velocity category, larger rock glaciers exhibit higher surface velocities, unlike “landslide” and “unclassified” PMAs (Fig. 10c). This may reflect specific and local geomorphological conditions, such as the accumulation zone at the Largo rock glacier, where material influx likely drives (Janke and Frauenfelder, 2008) surface acceleration (+54 % in the L7/8 dataset) (Janke and Frauenfelder, 2008). By contrast, the Olivares ice-debris complex shows deceleration, potentially linked to ice-mass loss in adjacent debris-covered glaciers. Similar patterns have been observed in the Tien Shan region (Kääb et al., 2021) and more recently in the European Alps (Manchado et al., 2024). Further studies are necessary to understand the mechanics of these complex landforms.
Although this study focuses on monitoring rock glaciers on a regional scale, it also identifies other PMAs corresponding to landslides and some unclassified landforms. Our results suggest possible correlations between gravitational movements in high mountain areas (e.g. Haeberli et al., 2017; Patton et al., 2019) and permafrost degradation (i.e. freeze/thaw of permafrost) in recently deglaciated areas (Pánek et al., 2022). This study contributes to existing mass movement inventories in the region, highlighting areas for further research. While these findings provide valuable regional insights into surface kinematics and topographic relationships, they must be interpreted cautiously. The morphological statistics here are derived solely from PMA boundaries and may not fully represent entire landforms (Fig. S12). Additionally, PMAs exclude feeder basins, responsible for material and water supply to rock glaciers (Blöthe et al., 2021; Cusicanqui et al., 2021). Further studies should be conducted to look at the influences of feeder basins on the surface kinematics of rock glaciers.
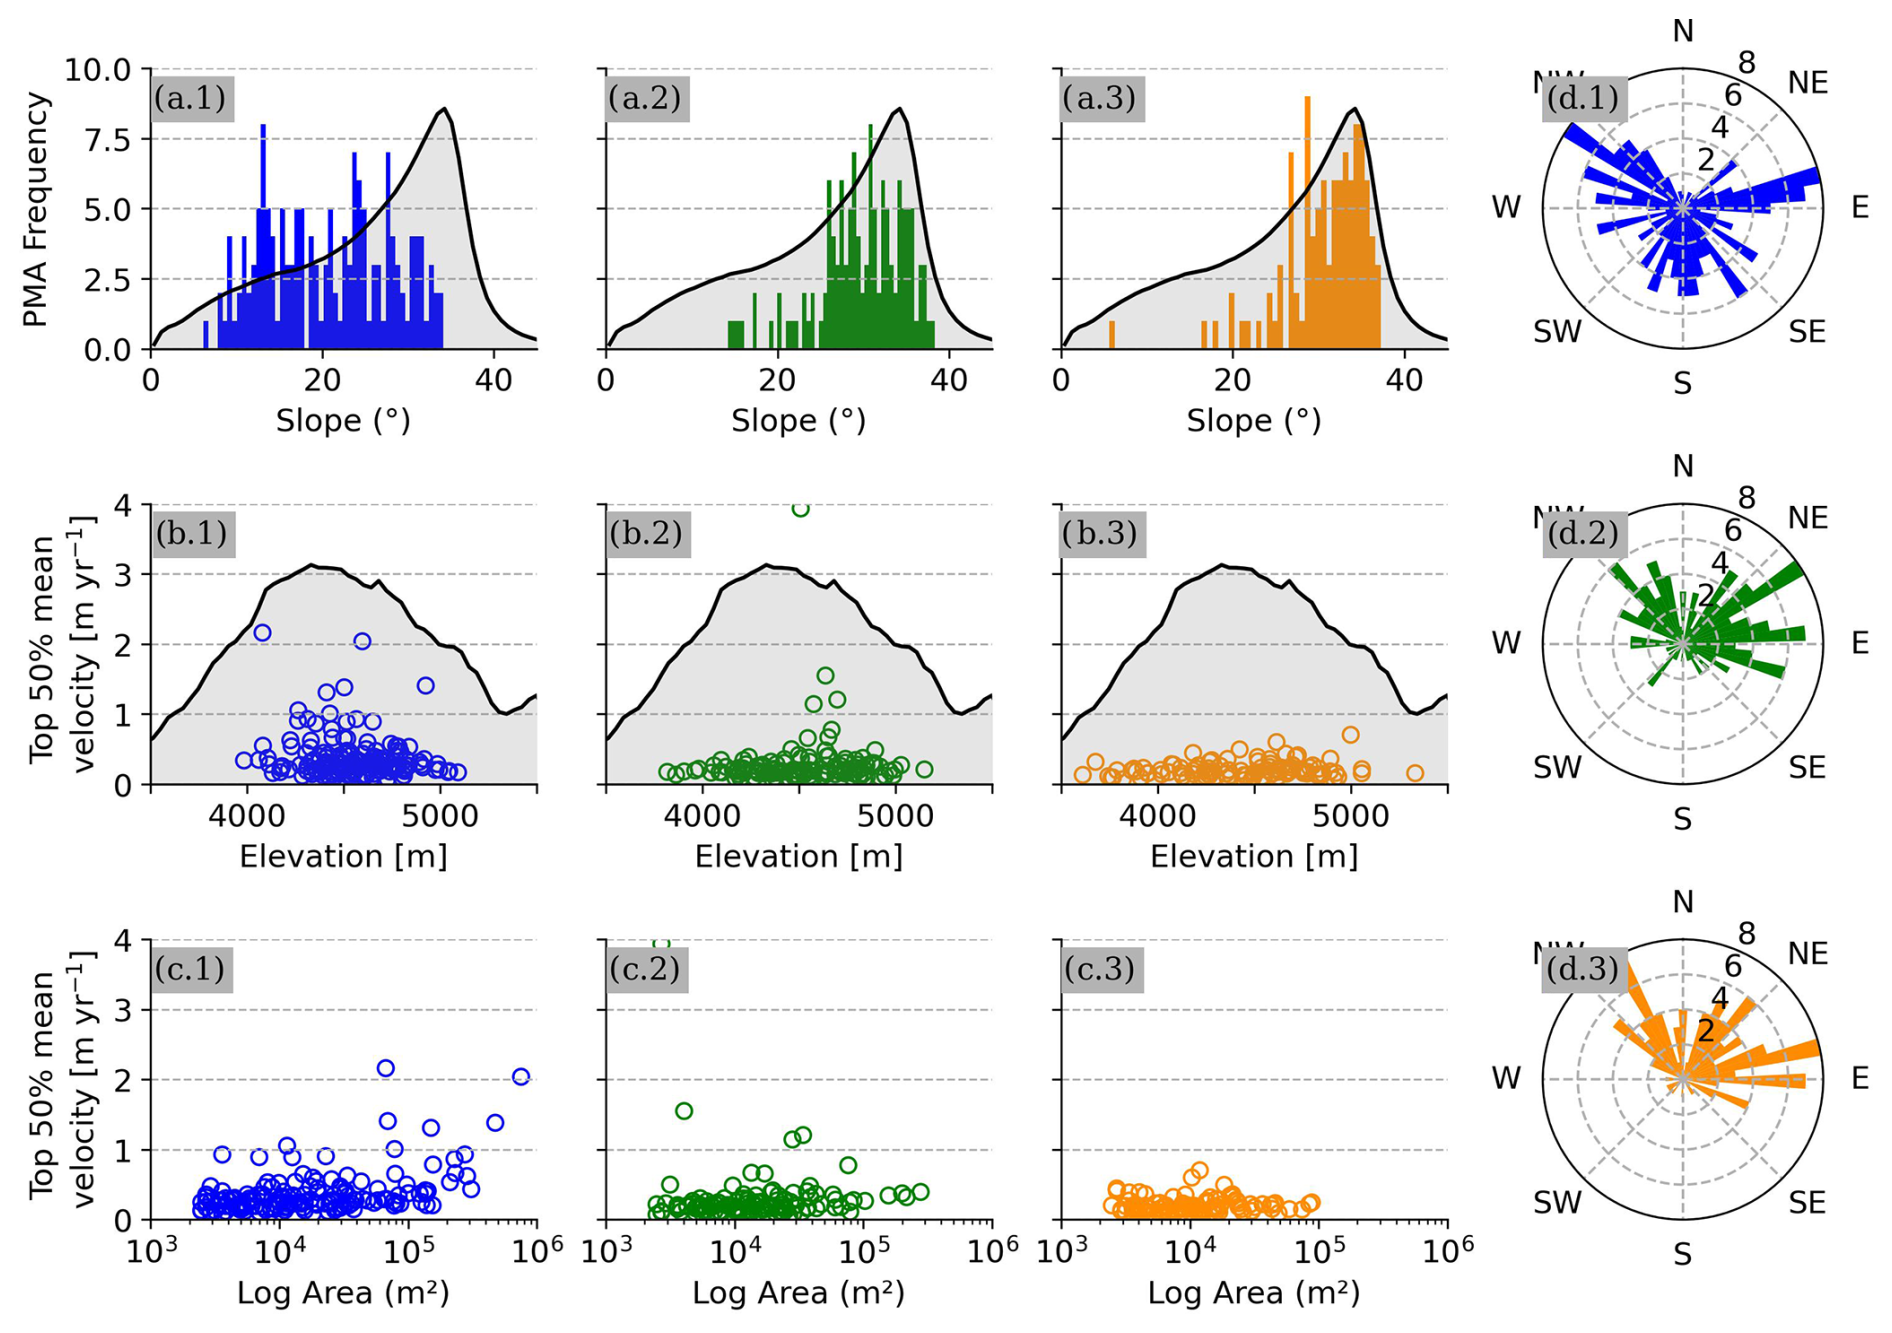
Figure 10Comparison of the PMA distribution for the “rock glacier” (blue values), “landslide” (green values) and “unclassified” (orange values) geomorphological classes vs. regional topographical context (computed using the average pixel frequency from the TanDEM-X 12 m DEM). (a) PMA mean slope; (b) distribution between Top 50 % average velocity PMA and PMA mean elevation; (c) distribution between Top 50 % average velocity and PMA surface; (d) PMA slope orientation. For (a) and (b), the grey background represents the general slope and elevation distributions of the study area, respectively.
This study develops a robust method to detect, quantify, and analyse the surface kinematics of rock glaciers and other gravitational mass movements using time series of Landsat 7/Landsat 8 imagery. By integrating feature tracking over 24 years with time-series inversion and automatic detection of persistent moving areas (PMAs), we successfully monitor 153 rock glaciers, 124 landslides and 105 unclassified landforms over a 45×45 km2 area in the semiarid Andes. The validation with satellite radar interferometry confirms the PMA classification and their velocity attributes, with 42 % also detected by Sentinel-1 interferograms at 12 d temporal baselines. The 24-year average velocity of PMAs is 0.3±0.07 m yr−1, with rock glaciers moving 23 % faster than the median velocity of all geomorphological landforms. Faster-moving landforms (2–4 m yr−1), primarily complex ice-debris landforms, were detected. Although some underestimations occur due to the coarse pixel size, temporal data gaps and velocity field heterogeneity, decadal velocity changes were detectable for 2 % of the PMA dataset (n=8). Among these PMAs, we find acceleration (deceleration) in two (one) rock glaciers, two landslides and one (two) unclassified PMA, all exceeding their respective uncertainties. According to our calculations, detecting decadal velocity changes below 0.4 m yr−1 (2 times the decadal NMAD values) using L7/8 data involves high uncertainty, depending on both velocity magnitude and the length of the reference period. The results of this study aligned well with existing research, highlighting the potential of combining radar and optical remote sensing to improve the detection and monitoring of slow and fast gravitational mass movements. These findings enhance rock glacier mapping and kinematic understanding, particularly in the context of permafrost warming and its impact on periglacial landforms. This study demonstrates the capability of medium-resolution L7/8 imagery for quantifying the kinematics of rock glaciers and ice-debris complex dynamics at a regional scale. It provides a methodological benchmark for assessing the dynamics of periglacial landforms using globally accessible, open-source optical imagery, addressing a key need within the scientific community.
The feature-tracking image correlation software used for this study are open source. Ames Stereo Pipeline (ASP) is available from https://doi.org/10.5281/zenodo.15877053 (Alexandrov et al., 2025; Beyer et al., 2018), and MicMac is available from https://micmac.ensg.eu/index.php/Accueil (Rupnik et al., 2017). Time-series inversion from optical imagery (TIO) is available from https://sourcesup.renater.fr/www/tio/ (Doin et al., 2011). Sentinel-1 interferograms were computed using the ForM@Ter LArge-scale multi-Temporal Sentinel-1 InterferoMetry processing chain (FLATSIM) based on the NSBAS pipeline. Both are available through the GDM-SAR service at https://www.poleterresolide.fr/le-service-gdm-sar-in/ (Thollard et al., 2021).
The Landsat 7/Landsat 8 archive is freely available at https://earthexplorer.usgs.gov/ (USGS Earth Explorer, 2024). The Sentinel-1 data used in our study are freely available from the ESA/EC Copernicus Sentinels Scientific Data Hub at https://dataspace.copernicus.eu/ (CDSE, 2025). The FLATSIM Sentinel-1 interferograms can be accessed upon request via Form@Ter pole (https://doi.org/10.24400/253171/FLATSIM2020, ForM@Ter, 2020). The TanDEM-X data are available from DLR through proposal application procedures. Data from Digital-Globe satellites (GeoEye, Ikonos, WorldView, Quickbird) and Pléiades are commercial, but programmes to facilitate academic access exist. The Pléiades dataset can be accessed upon request to Benjamin A. Robson (benjamin.robson@uib.no). The data described in this paper are available at https://doi.org/10.5281/zenodo.13119042 (Cusicanqui, 2024) or upon request from the corresponding author (diego.cusicanqui@univ-grenoble-alpes.fr).
The supplement related to this article is available online at https://doi.org/10.5194/tc-19-2559-2025-supplement.
DC, PL and XB designed the study. DC performed image correlation of the VHR data provided by BAR and XB. PL performed image correlation of the L7/8 data and implemented persistent moving area (PMA) detection. DC and PL filtered the GNSS dataset provided by SM and computed the GNSS surface velocity time series. DC wrote the paper with the supervision and contributions of PL. PL, XB, BAR, AK and SM contributed to the discussion and edited the paper.
The contact author has declared that none of the authors has any competing interests.
Publisher's note: Copernicus Publications remains neutral with regard to jurisdictional claims made in the text, published maps, institutional affiliations, or any other geographical representation in this paper. While Copernicus Publications makes every effort to include appropriate place names, the final responsibility lies with the authors.
Thanks are due to the reviewers for their careful review and comments. We are grateful to the providers of free data for this study: the European Space Agency (ESA)/European Commission (EC) Copernicus for the Sentinel-1 data, and the FLATSIM Form@TER team for their efforts in processing the Sentinel interferograms. Also, the German Aerospace Center (DLR) provided the TanDEM-X DEM. We are grateful to CNES/Airbus DS for the provision of the SPOT and Pléiades satellite to the restrained dataset project 41743. We would like to thank the U.S. Geological Survey for making the Landsat 7/Landsat 8 archive freely available. Thanks to the GLIMS database http://glims.org/RGI/ (last access: 25 March 2024) for glacier outlines (v.6). All (or most of) the computations presented in this paper were performed using the GRICAD infrastructure (https://gricad.univ-grenoble-alpes.fr, last access: 24 March 2024), which is supported by Grenoble research communities. Thanks to the glaciology group at CEAZA for collecting and providing the GNSS datasets and to the CHESS-funded (https://chess.w.uib.no/, last access: 10 December 2022) “Summer school on cryospheric monitoring and water resources” for the 2022 acquisition set.
This work has been supported by the postdoctoral programme from the National Centre for Space Studies (CNES) and partially by the National Center for Scientific Research (CNRS) through the programme Plan d'Action pour la Prévention des Risques d'Origine Glaciaire et périglaciaire (PAPROG). This work has also been partially supported by a grant from the Labex OSUG (Investissements d'avenir – ANR10 LABX56) PermANDES project. Data provided by CEAZA were supported by ANID-CENTROS REGIONALES (grant no. R20F0008). Diego Cusicanqui (CNES | ISTerre), Pascal Lacroix (IRD | ISTerre) and Xavier Bodin (EDYTEM | CNRS) are part of Labex OSUG (ANR10 LABX56). Andreas Kääb received financial support from the European Space Agency projects Permafrost_cci and EarthExplorer10 Harmony (grant nos. 4000123681/18/I-NB and 4000135083/21/NL/FF/ab).
This paper was edited by Christian Hauck and reviewed by Jan Henrik Blöthe and one anonymous referee.
Alexandrov, O., McMichael, S., Broxton, M., Lundy, M., Beyer, R., Husmann, K., Edwards, L., Nefian, A., SmithB, Shean, D., Smith, T., mstyer, Annex, A., Moratto, Z., drpeachboy, Dehecq, A., Nodjoumi, G., Aravkin, A., Bhushan, S., Purinton, B., Meyer, J., PicoJr, and Laura, J.: NeoGeographyToolkit/StereoPipeline: 2025-07-14-daily-build (2025-07-14-daily-build), Zenodo [code], https://doi.org/10.5281/zenodo.15877053, 2025.
Arenson, L., Colgan, W., and Marshall, H. P.: Chapter 2 - Physical, Thermal, and Mechanical Properties of Snow, Ice, and Permafrost, in: Snow and Ice-Related Hazards, Risks and Disasters, edited by: Shroder, J. F., Haeberli, W., and Whiteman, C., Academic Press, Boston, 35–75, https://doi.org/10.1016/B978-0-12-394849-6.00002-0, 2015.
Ayoub, F., Leprince, S., Binet, R., Lewis, K. W., Aharonson, O., and Avouac, J. P.: Influence of camera distortions on satellite image registration and change detection applications: 2008 IEEE International Geoscience and Remote Sensing Symposium - Proceedings, 2008 IEEE International Geoscience and Remote Sensing Symposium – Proceedings, II1072–II1075, https://doi.org/10.1109/IGARSS.2008.4779184, 2008.
Azócar, G. F. and Brenning, A.: Hydrological and geomorphological significance of rock glaciers in the dry Andes, Chile (27°–33° S): Rock Glaciers in the Dry Andes, Permafrost Periglac. Process., 21, 42–53, https://doi.org/10.1002/ppp.669, 2010.
Azócar, G. F., Brenning, A., and Bodin, X.: Permafrost distribution modelling in the semi-arid Chilean Andes, The Cryosphere, 11, 877–890, https://doi.org/10.5194/tc-11-877-2017, 2017.
Barboux, C., Delaloye, R., and Lambiel, C.: Inventorying slope movements in an Alpine environment using DInSAR, Earth Surf. Process. Landf., 39, 2087–2099, https://doi.org/10.1002/esp.3603, 2014.
Berthling, I.: Beyond confusion: Rock glaciers as cryo-conditioned landforms, Geomorphology, 131, 98–106, https://doi.org/10.1016/j.geomorph.2011.05.002, 2011.
Bertone, A., Barboux, C., Bodin, X., Bolch, T., Brardinoni, F., Caduff, R., Christiansen, H. H., Darrow, M. M., Delaloye, R., Etzelmüller, B., Humlum, O., Lambiel, C., Lilleøren, K. S., Mair, V., Pellegrinon, G., Rouyet, L., Ruiz, L., and Strozzi, T.: Incorporating InSAR kinematics into rock glacier inventories: insights from 11 regions worldwide, The Cryosphere, 16, 2769–2792, https://doi.org/10.5194/tc-16-2769-2022, 2022.
Beyer, R. A., Alexandrov, O., and McMichael, S.: The ames stereo pipeline: NASA's open source software for deriving and processing terrain data, Earth Space Sci., 5, 537–548, https://doi.org/10.1029/2018EA000409, 2018.
Blöthe, J. H., Halla, C., Schwalbe, E., Bottegal, E., Trombotto Liaudat, D., and Schrott, L.: Surface velocity fields of active rock glaciers and ice-debris complexes in the Central Andes of Argentina, Earth Surf. Process. Landf., 46, 504–522, https://doi.org/10.1002/esp.5042, 2021.
Blöthe, J. H., Falaschi, D., Vivero, S., and Tadono, T.: Rock Glacier Kinematics in the Valles Calchaquíes Region, Northwestern Argentina, From Multi-Temporal Aerial and Satellite Imagery (1968–2023), Permafrost Periglac. Process., 36, 123–136, https://doi.org/10.1002/ppp.2260, 2025.
Bolch, T., Shea, J. M., Liu, S., Azam, F. M., Gao, Y., Gruber, S., Immerzeel, W., Kulkarni, A., Li, H., Tahir, A., Zhang, G., Zhang, Y., Bannerjee, A., Berthier, E., Brun, F., Kääb, A., Kraaijenbrink, P., Moholdt, G., Nicholson, L., Pepin, N., and Racoviteanu, A.: Status and change of the cryosphere in the Extended Hindu Kush Himalaya Region, in: The Hindu Kush Himalaya Assessment, edited by: Wester, P., Mishra, A., Mukherji, A., and Shrestha, A. B., Springer, 209–255, https://doi.org/10.1007/978-3-319-92288-1_7, 2019.
Bontemps, N., Lacroix, P., and Doin, M.-P.: Inversion of deformation fields time-series from optical images, and application to the long term kinematics of slow-moving landslides in Peru, Remote Sens. Environ., 210, 144–158, https://doi.org/10.1016/j.rse.2018.02.023, 2018.
CDSE: Welcome to Copernicus Data Space Ecosystem, CDSE [data set], https://dataspace.copernicus.eu/ (last access: 20 January 2024), 2025.
CEAZA: Reporte anual 2012, http://www.ceazamet.cl (last access: 15 February 2024), 2012.
CEAZA: Reporte anual 2016, http://www.ceazamet.cl (last access: 15 February 2024), 2016.
CEAZA: Datos meteorologicos proveidos por el CEAZA. obtenidos desde, http://www.ceazamet.cl (last access: 15 February 2024), 2023.
Cicoira, A., Beutel, J., Faillettaz, J., and Vieli, A.: Water controls the seasonal rhythm of rock glacier flow, Earth Planet. Sc. Lett., 528, 115844, https://doi.org/10.1016/j.epsl.2019.115844, 2019.
Cusicanqui, D.: Supplementary material of: Detection and reconstruction of rock glaciers kinematic over 24 years (2000–2024) from Landsat imagery, Zenodo [data set], https://doi.org/10.5281/zenodo.13119042, 2024.
Cusicanqui, D., Rabatel, A., Vincent, C., Bodin, X., Thibert, E., and Francou, B.: Interpretation of Volume and Flux Changes of the Laurichard Rock Glacier Between 1952 and 2019, French Alps, J. Geophys. Res.-Earth Surf., 126, e2021JF006161, https://doi.org/10.1029/2021JF006161, 2021.
Cusicanqui, D., Bodin, X., Duvillard, P.-A., Schoeneich, P., Revil, A., Assier, A., Berthet, J., Peyron, M., Roudnitska, S., and Rabatel, A.: Glacier, permafrost and thermokarst interactions in Alpine terrain. Insights from seven decades of reconstructed dynamics of the Chauvet glacial and periglacial system (Southern French Alps), Earth Surf. Process. Landf., 48, 2595–2612, https://doi.org/10.1002/esp.5650, 2023.
Dehecq, A., Gourmelen, N., and Trouve, E.: Deriving large-scale glacier velocities from a complete satellite archive: Application to the Pamir–Karakoram–Himalaya, Remote Sens. Environ., 162, 55–66, https://doi.org/10.1016/j.rse.2015.01.031, 2015.
Dehecq, A., Gardner, A. S., Alexandrov, O., McMichael, S., Hugonnet, R., Shean, D., and Marty, M.: Automated Processing of Declassified KH-9 Hexagon Satellite Images for Global Elevation Change Analysis Since the 1970s, Front. Earth Sci., 8, 21, https://doi.org/10.3389/feart.2020.566802, 2020.
Delaloye, R., Lambiel, C., and Gärtner-Roer, I.: Overview of rock glacier kinematics research in the Swiss Alps, Geogr. Helv., 65, 135–145, https://doi.org/10.5194/gh-65-135-2010, 2010.
de Pasquale, G., Valois, R., Schaffer, N., and MacDonell, S.: Contrasting geophysical signatures of a relict and an intact Andean rock glacier, The Cryosphere, 16, 1579–1596, https://doi.org/10.5194/tc-16-1579-2022, 2022.
DGA: Dinámica de Glaciares Rocosos en el Chile Semiárido: Parte I, Plan de Monitoreo, Dirección General de Aguas, 2010.
DGA: INVENTARIO PÚBLICO DE GLACIARES, actualización 2022, edited by: Casassa, G., Espinoza, A., Segovia, A., and Huenante, J., SDT No. 447, Ministerio de Obras Públicas, Dirección General de Aguas Unidad de Glaciología y Nieves, 2022.
Doin, M.-P., Guillaso, S., Jolivet, R., Lasserre, C., Lodge, F., Ducret, G., and Grandin, R.: Presentation of the small baseline NSBAS processing chain on a case example: The Etna deformation monitoring from 2003 to 2010 using Envisat data, in: Proceedings of the Fringe symposium, 3434–3437, 2011 (code available at: https://sourcesup.renater.fr/www/tio/, last access: 8 July 2023).
Etzelmüller, B., Guglielmin, M., Hauck, C., Hilbich, C., Hoelzle, M., Isaksen, K., Noetzli, J., Oliva, M., and Ramos, M.: Twenty years of European mountain permafrost dynamics – the PACE legacy, Environ. Res. Lett., 15, 104070, https://doi.org/10.1088/1748-9326/abae9d, 2020.
Facciolo, G., De Franchis, C., and Meinhardt, E.: MGM: A significantly more global matching for stereovision, in: British Machine Vision Conference (BMVC), Proceedings of the British Machine Vision Conference (BMVC), 1, http://dev.ipol.im/~facciolo/mgm/mgm_abstract.pdf (last access: 4 April 2024), 2015.
ForM@Ter: FLATSIM Data Products, CNES [data set], https://doi.org/10.24400/253171/FLATSIM2020, 2020.
Garreaud, R. D., Boisier, J. P., Rondanelli, R., Montecinos, A., Sepúlveda, H. H., and Veloso-Aguila, D.: The central chile mega drought (2010–2018): A climate dynamics perspective, Int. J. Climatol., 40, 421–439, https://doi.org/10.1002/joc.6219, 2020.
Gärtner-Roer, I., Brunner, N., Delaloye, R., Haeberli, W., Kääb, A., and Thee, P.: Glacier–permafrost relations in a high-mountain environment: 5 decades of kinematic monitoring at the Gruben site, Swiss Alps, The Cryosphere, 16, 2083–2101, https://doi.org/10.5194/tc-16-2083-2022, 2022.
Global Climate Observation System (GCOS): Summary of the GCOS plan: version 1.0, World Meteorological Organization (WMO), Geneva, https://library.wmo.int/idurl/4/41295 (last access: 20 March 2024), 1995.
Grandin, R.: Interferometric processing of SLC sentinel-1 TOPS data, in: FRINGE'15: Advances in the science and applications of SAR interferometry and sentinel-1 InSAR workshop, Frascati, Italy, 23–27 March 2015, 2015.
Gruber, S.: Derivation and analysis of a high-resolution estimate of global permafrost zonation, The Cryosphere, 6, 221–233, https://doi.org/10.5194/tc-6-221-2012, 2012.
Haberkorn, A., Kenner, R., Noetzli, J., and Phillips, M.: Changes in ground temperature and dynamics in mountain permafrost in the swiss alps, Front. Earth Sci., 9, https://doi.org/10.3389/feart.2021.626686, 2021.
Haeberli, W., Hallet, B., Arenson, L., Elconin, R., Humlum, O., Kääb, A., Kaufmann, V., Ladanyi, B., Matsuoka, N., Springman, S., and Mühll, D. V.: Permafrost creep and rock glacier dynamics, Permafrost Periglac. Process., 17, 189–214, https://doi.org/10.1002/ppp.561, 2006.
Haeberli, W., Schaub, Y., and Huggel, C.: Increasing risks related to landslides from degrading permafrost into new lakes in de-glaciating mountain ranges, Geomorphology, 293, 405–417, https://doi.org/10.1016/j.geomorph.2016.02.009, 2017.
Halla, C., Blöthe, J. H., Tapia Baldis, C., Trombotto Liaudat, D., Hilbich, C., Hauck, C., and Schrott, L.: Ice content and interannual water storage changes of an active rock glacier in the dry Andes of Argentina, The Cryosphere, 15, 1187–1213, https://doi.org/10.5194/tc-15-1187-2021, 2021.
Hartl, L., Fischer, A., Stocker-waldhuber, M., and Abermann, J.: Recent speed-up of an alpine rock glacier: an updated chronology of the kinematics of outer hochebenkar rock glacier based on geodetic measurements, Geografiska Annaler: Series A, Physical Geography, 98, 129–141, https://doi.org/10.1111/geoa.12127, 2016.
Hartl, L., Zieher, T., Bremer, M., Stocker-Waldhuber, M., Zahs, V., Höfle, B., Klug, C., and Cicoira, A.: Multi-sensor monitoring and data integration reveal cyclical destabilization of the Äußeres Hochebenkar rock glacier, Earth Surf. Dynam., 11, 117–147, https://doi.org/10.5194/esurf-11-117-2023, 2023.
Heid, T. and Kääb, A.: Evaluation of existing image matching methods for deriving glacier surface displacements globally from optical satellite imagery, Remote Sens. Environ., 118, 339–355, https://doi.org/10.1016/j.rse.2011.11.024, 2012.
Hock, R., Rasul, G., Adler, C., Caceres, B., Gruber, S., Hirabayashi, Y., Jackson, M., Kääb, A., Kang, S., Kutuzov, S., Milner, Al., Molau, U., Morin, S., Orlove, B., and Steltzer, H.: High Mountain Areas, in: IPCC Special Report on the Ocean and Cryosphere in a Changing Climate, edited by: Pörtner, H.-O., Roberts, D. C., Masson-Delmotte, V., Zhai, P., Tignor, M., Poloczanska, E., Mintenbeck, K., Alegría, A., Nicolai, M., Okem, A., Petzold, J., Rama, B., and Weyer, N. M., Cambridge University Press, Cambridge, 131–202, https://doi.org/10.1017/9781009157964.004, 2019.
Höhle, J. and Höhle, M.: Accuracy assessment of digital elevation models by means of robust statistical methods, ISPRS J. Photogramm. Remote, 64, 398–406, https://doi.org/10.1016/j.isprsjprs.2009.02.003, 2009.
Hu, Y., Harrison, S., Liu, L., and Wood, J. L.: Modelling rock glacier ice content based on InSAR-derived velocity, Khumbu and Lhotse valleys, Nepal, The Cryosphere, 17, 2305–2321, https://doi.org/10.5194/tc-17-2305-2023, 2023.
Hu, Y., Arenson, L. U., Barboux, C., Bodin, X., Cicoira, A., Delaloye, R., Gärtner-Roer, I., Kääb, A., Kellerer-Pirklbauer, A., Lambiel, C., Liu, L., Pellet, C., Rouyet, L., Schoeneich, P., Seier, G., and Strozzi, T.: Rock Glacier Velocity: An Essential Climate Variable Quantity for Permafrost, Rev. Geophys., 63, e2024RG000847, https://doi.org/10.1029/2024RG000847, 2025.
Hugonnet, R., McNabb, R., Berthier, E., Menounos, B., Nuth, C., Girod, L., Farinotti, D., Huss, M., Dussaillant, I., Brun, F., and Kääb, A.: Accelerated global glacier mass loss in the early twenty-first century, Nature, 592, 726–731, https://doi.org/10.1038/s41586-021-03436-z, 2021.
IANIGLA: Inventario Nacional de Glaciares 2018. Resumen ejecutivo de los resultados del Inventario Nacional de Glaciares, IANIGLA-CONICET, Ministerio de Ambiente y Desarrollo Sustentable de la Nacion, 27, 2018.
Janke, J. and Frauenfelder, R.: The relationship between rock glacier and contributing area parameters in the Front Range of Colorado, J. Quaternary Sci., 23, 153–163, https://doi.org/10.1002/jqs.1133, 2008.
Janke, J., Bellisario, A., and Ferrando, F.: Classification of debris-covered glaciers and rock glaciers in the Andes of central Chile, Geomorphology, 241, 98–121, https://doi.org/10.1016/j.geomorph.2015.03.034, 2015.
Kääb, A. and Røste, J.: Rock glaciers across the United States predominantly accelerate coincident with rise in air temperatures, Nat. Commun., 15, 7581, https://doi.org/10.1038/s41467-024-52093-z, 2024.
Kääb, A., Frauenfelder, R., and Roer, I.: On the response of rockglacier creep to surface temperature increase, Global Planet. Change, 56, 172–187, https://doi.org/10.1016/j.gloplacha.2006.07.005, 2007.
Kääb, A., Strozzi, T., Bolch, T., Caduff, R., Trefall, H., Stoffel, M., and Kokarev, A.: Inventory and changes of rock glacier creep speeds in Ile Alatau and Kungöy Ala-Too, northern Tien Shan, since the 1950s, The Cryosphere, 15, 927–949, https://doi.org/10.5194/tc-15-927-2021, 2021.
Kalthoff, N., Bischoff-Gauß, I., Fiebig-Wittmaack, M., Fiedler, F., Thürauf, J., Novoa, E., Pizarro, C., Castillo, R., Gallardo, L., Rondanelli, R., and Kohler, M.: Mesoscale Wind Regimes in Chile at 30° S, J. Appl. Meteorol. Climatol., 41, 953–970, https://doi.org/10.1175/1520-0450(2002)041<0953:MWRICA>2.0.CO;2, 2002.
Kaufmann, V., Kellerer-Pirklbauer, A., and Seier, G.: Conventional and UAV-Based Aerial Surveys for Long-Term Monitoring (1954–2020) of a Highly Active Rock Glacier in Austria, Front. Remote Sens., 2, https://doi.org/10.3389/frsen.2021.732744, 2021.
Kellerer-Pirklbauer, A. and Kaufmann, V.: About the relationship between rock glacier velocity and climate parameters in central Austria, Aust. J. Earth Sci., 105, 94–112, 2012.
Kellerer-Pirklbauer, A., Lieb, G. K., and Kaufmann, V.: Rock Glaciers in the Austrian Alps: A General Overview with a Special Focus on Dösen Rock Glacier, Hohe Tauern Range, in: Landscapes and Landforms of Austria, edited by: Embleton-Hamann, C., Springer International Publishing, Cham, 393–406, https://doi.org/10.1007/978-3-030-92815-5_27, 2022.
Kellerer-Pirklbauer, A., Bodin, X., Delaloye, R., Lambiel, C., Gärtner-Roer, I., Bonnefoy-Demongeot, M., Carturan, L., Damm, B., Eulenstein, J., Fischer, A., Hartl, L., Ikeda, A., Kaufmann, V., Krainer, K., Matsuoka, N., Cella, U. M. D., Noetzli, J., Seppi, R., Scapozza, C., Schoeneich, P., Stocker-Waldhuber, M., Thibert, E., and Zumiani, M.: Acceleration and interannual variability of creep rates in mountain permafrost landforms (rock glacier velocities) in the European Alps in 1995–2022, Environ. Res. Lett., 19, 034022, https://doi.org/10.1088/1748-9326/ad25a4, 2024.
Kenner, R., Phillips, M., Beutel, J., Hiller, M., Limpach, P., Pointner, E., and Volken, M.: Factors Controlling Velocity Variations at Short-Term, Seasonal and Multiyear Time Scales, Ritigraben Rock Glacier, Western Swiss Alps, Permafrost Periglac. Process., 28, 675–684, https://doi.org/10.1002/ppp.1953, 2017.
Kenner, R., Pruessner, L., Beutel, J., Limpach, P., and Phillips, M.: Why rock glacier deformation velocities correlate with both ground temperatures and water supply at multiple temporal scales, EGU General Assembly 2020, Online, 4–8 May 2020, EGU2020-9534, https://doi.org/10.5194/egusphere-egu2020-9534, 2020.
Kooistra, L., Berger, K., Brede, B., Graf, L. V., Aasen, H., Roujean, J.-L., Machwitz, M., Schlerf, M., Atzberger, C., Prikaziuk, E., Ganeva, D., Tomelleri, E., Croft, H., Reyes Muñoz, P., Garcia Millan, V., Darvishzadeh, R., Koren, G., Herrmann, I., Rozenstein, O., Belda, S., Rautiainen, M., Rune Karlsen, S., Figueira Silva, C., Cerasoli, S., Pierre, J., Tanır Kayıkçı, E., Halabuk, A., Tunc Gormus, E., Fluit, F., Cai, Z., Kycko, M., Udelhoven, T., and Verrelst, J.: Reviews and syntheses: Remotely sensed optical time series for monitoring vegetation productivity, Biogeosciences, 21, 473–511, https://doi.org/10.5194/bg-21-473-2024, 2024.
Kunz, J. and Kneisel, C.: Glacier–Permafrost Interaction at a Thrust Moraine Complex in the Glacier Forefield Muragl, Swiss Alps, Geosciences, 10, 205, https://doi.org/10.3390/geosciences10060205, 2020.
Lacroix, P., Araujo, G., Hollingsworth, J., and Taipe, E.: Self-Entrainment Motion of a Slow-Moving Landslide Inferred From Landsat-8 Time Series, J. Geophys. Res.-Earth Surf., 124, 1201–1216, https://doi.org/10.1029/2018JF004920, 2019.
Lacroix, P., Dehecq, A., and Taipe, E.: Irrigation-triggered landslides in a Peruvian desert caused by modern intensive farming, Nat. Geosci., 13, 56–60, https://doi.org/10.1038/s41561-019-0500-x, 2020a.
Lacroix, P., Handwerger, A. L., and Bièvre, G.: Life and death of slow-moving landslides, Nat. Rev. Earth Environ., 1, 404–419, https://doi.org/10.1038/s43017-020-0072-8, 2020b.
Lacroix, P., Belart, J. M. C., Berthier, E., Sæmundsson, Þ., and Jónsdóttir, K.: Mechanisms of Landslide Destabilization Induced by Glacier-Retreat on Tungnakvíslarjökull Area, Iceland, Geophys. Res. Lett., 49, e2022GL098302, https://doi.org/10.1029/2022GL098302, 2022.
Lehmann, B., Anderson, R. S., Bodin, X., Cusicanqui, D., Valla, P. G., and Carcaillet, J.: Alpine rock glacier activity over Holocene to modern timescales (western French Alps), Earth Surf. Dynam., 10, 605–633, https://doi.org/10.5194/esurf-10-605-2022, 2022.
Lehmann, B., Anderson, R. S., Cusicanqui, D., Rossi, M. W., and Ochwat, N.: Exploring Holocene Climate History and Alpine Landscape Evolution From Rock Glacier Dynamics: Mt Sopris, CO, USA, J. Geophys. Res.-Earth Surf., 130, e2024JF007978, https://doi.org/10.1029/2024JF007978, 2025.
Leprince, S., Berthier, E., Ayoub, F., Delacourt, C., and Avouac, J.-P.: Monitoring Earth Surface Dynamics With Optical Imagery, Eos, Transactions American Geophysical Union, 89, 1–2, https://doi.org/10.1029/2008EO010001, 2008.
MacDonell, S., Farías, P. N., Aliste, V., Ayala, Á., Guzmán, C., Díaz, P. J., Schaffer, N., Schauwecker, S., Sproles, E. A., and Francisco, E. Y. S.: Snow and ice in the desert: reflections from a decade of connecting cryospheric science with communities in the semiarid Chilean Andes, Ann. Glaciol., 63, 158–164, https://doi.org/10.1017/aog.2023.51, 2022.
Magnin, F., Ravanel, L., Bodin, X., Deline, P., Malet, E., Krysiecki, J.-M., and Schoeneich, P.: Main results of permafrost monitoring in the French Alps through the PermaFrance network over the period 2010–2022, Permafrost Periglac. Process., 35, 3–23, https://doi.org/10.1002/ppp.2209, 2024.
Manchado, A. M.-T., Allen, S., Cicoira, A., Wiesmann, S., Haller, R., and Stoffel, M.: 100 years of monitoring in the Swiss National Park reveals overall decreasing rock glacier velocities, Commun. Earth Environ., 5, 1–17, https://doi.org/10.1038/s43247-024-01302-0, 2024.
Marcer, M., Cicoira, A., Cusicanqui, D., Bodin, X., Echelard, T., Obregon, R., and Schoeneich, P.: Rock glaciers throughout the French Alps accelerated and destabilised since 1990 as air temperatures increased, Commun. Earth Environ., 2, 1–11, https://doi.org/10.1038/s43247-021-00150-6, 2021.
Markham, B. L., Storey, J. C., Williams, D. L., and Irons, J. R.: Landsat sensor performance: history and current status, IEEE T. Geosci. Remote, 42, 2691–2694, https://doi.org/10.1109/TGRS.2004.840720, 2004.
Masiokas, M. H., Villalba, R., Luckman, B. H., Quesne, C. L., and Aravena, J. C.: Snowpack Variations in the Central Andes of Argentina and Chile, 1951–2005: Large-Scale Atmospheric Influences and Implications for Water Resources in the Region, J. Climate, 19, 6334–6352, https://doi.org/10.1175/JCLI3969.1, 2006.
Masiokas, M. H., Villalba, R., Luckman, B. H., and Mauget, S.: Intra- to Multidecadal Variations of Snowpack and Streamflow Records in the Andes of Chile and Argentina between 30° and 37° S, J. Hydrometeorol., 11, 822–831, https://doi.org/10.1175/2010JHM1191.1, 2010.
Monnier, S. and Kinnard, C.: Internal structure and composition of a rock glacier in the Andes (upper Choapa valley, Chile) using borehole information and ground-penetrating radar, Ann. Glaciol., 54, 61–72, https://doi.org/10.3189/2013AoG64A107, 2013.
Monnier, S. and Kinnard, C.: Reconsidering the glacier to rock glacier transformation problem: New insights from the central Andes of Chile, Geomorphology, 238, 47–55, https://doi.org/10.1016/j.geomorph.2015.02.025, 2015.
Monnier, S. and Kinnard, C.: Interrogating the time and processes of development of the Las Liebres rock glacier, central Chilean Andes, using a numerical flow model, Earth Surf. Process. Landf., 41, 1884–1893, https://doi.org/10.1002/esp.3956, 2016.
Monnier, S., Kinnard, C., Surazakov, A., and Bossy, W.: Geomorphology, internal structure, and successive development of a glacier foreland in the semiarid Chilean Andes (Cerro Tapado, upper Elqui Valley, 30°08′ S, 69°55′ W), Geomorphology, 207, 126–140, 2014.
Montecinos, A. and Aceituno, P.: Seasonality of the ENSO-Related rainfall variability in central chile and associated circulation anomalies, J. Climate, 16, 281–296, https://doi.org/10.1175/1520-0442(2003)016<0281:SOTERR>2.0.CO;2, 2003.
Müller, J., Vieli, A., and Gärtner-Roer, I.: Rock glaciers on the run – understanding rock glacier landform evolution and recent changes from numerical flow modeling, The Cryosphere, 10, 2865–2886, https://doi.org/10.5194/tc-10-2865-2016, 2016.
Navarro, G., MacDonell, S., and Valois, R.: A conceptual hydrological model of semiarid Andean headwater systems in Chile, Prog. Phys. Geogr.-Earth and Environment, 47, 668–686, https://doi.org/10.1177/03091333221147649, 2023a.
Navarro, G., Valois, R., MacDonell, S., de Pasquale, G., and Díaz, J. P.: Internal structure and water routing of an ice-debris landform assemblage using multiple geophysical methods in the semiarid Andes, Front. Earth Sci., 11, 14, https://doi.org/10.3389/feart.2023.1102620, 2023b.
Noetzli, J., Biskaborn, B. K., Christiansen, H. H., Isaksen, K., Schoeneich, P., Smith, P., Vieira, G., Zhao, L., and Streletskiy, D. A.: Permafrost thermal state, B. Am. Meteorol. Soc., 21–22, 2019.
Notarnicola, C.: Hotspots of snow cover changes in global mountain regions over 2000–2018, Remote Sens. Environ., 243, 111781, https://doi.org/10.1016/j.rse.2020.111781, 2020.
Nuth, C. and Kääb, A.: Co-registration and bias corrections of satellite elevation data sets for quantifying glacier thickness change, The Cryosphere, 5, 271–290, https://doi.org/10.5194/tc-5-271-2011, 2011.
Obu, J.: How Much of the Earth's Surface is Underlain by Permafrost?, J. Geophys. Res.-Earth Surf., 126, e2021JF006123, https://doi.org/10.1029/2021JF006123, 2021.
Pánek, T., Břežný, M., Harrison, S., Schönfeldt, E., and Winocur, D.: Large landslides cluster at the margin of a deglaciated mountain belt, Sci. Rep., 12, 5658, https://doi.org/10.1038/s41598-022-09357-9, 2022.
Patton, A. I., Rathburn, S. L., and Capps, D. M.: Landslide response to climate change in permafrost regions, Geomorphology, 340, 116–128, https://doi.org/10.1016/j.geomorph.2019.04.029, 2019.
Pei, Y., Qiu, H., Yang, D., Liu, Z., Ma, S., Li, J., Cao, M., and Wufuer, W.: Increasing landslide activity in the Taxkorgan River Basin (eastern Pamirs Plateau, China) driven by climate change, CATENA, 223, 106911, https://doi.org/10.1016/j.catena.2023.106911, 2023.
Pellet, C., Bodin, X., Cusicanqui, D., Delaloye, R., Kaab, A., Kaufmann, V., Noetzli, J., Thibert, E., Vivero, S., and Kellerer-Pirklbauer, A.: Rock glacier velocity, B. Am. Meteorol. Soc., 103, Si-S465, https://doi.org/10.1175/2022BAMSStateoftheClimate.1, 2022.
Poblete, A. G. and Minetti, J. L.: Influye el calentamiento global en la disminución de las nevadas en los Andes Áridos?, Revista Universitaria de Geografía, 26, 11–29, 2017.
Réveillet, M., MacDonell, S., Gascoin, S., Kinnard, C., Lhermitte, S., and Schaffer, N.: Impact of forcing on sublimation simulations for a high mountain catchment in the semiarid Andes, The Cryosphere, 14, 147–163, https://doi.org/10.5194/tc-14-147-2020, 2020.
RGI Consortium: Randolph Glacier Inventory – A Dataset of Global Glacier Outlines: Version 6.0: Technical Report, Global Land Ice Measurements from Space, https://doi.org/10.7265/N5-RGI-60, 2017.
RGIK: Guidelines for inventorying rock glaciers, https://doi.org/10.51363/unifr.srr.2023.002, 2023.
Robson, B. A., MacDonell, S., Ayala, Á., Bolch, T., Nielsen, P. R., and Vivero, S.: Glacier and rock glacier changes since the 1950s in the La Laguna catchment, Chile, The Cryosphere, 16, 647–665, https://doi.org/10.5194/tc-16-647-2022, 2022.
Rosu, A.-M., Pierrot-Deseilligny, M., Delorme, A., Binet, R., and Klinger, Y.: Measurement of ground displacement from optical satellite image correlation using the free open-source software MicMac, ISPRS J. Photogramm. Remote, 100, 48–59, https://doi.org/10.1016/j.isprsjprs.2014.03.002, 2015.
Rupnik, E., Daakir, M., and Pierrot Deseilligny, M.: MicMac – a free, open-source solution for photogrammetry, Open Geospatial Data, Software and Standards, 2, 14, https://doi.org/10.1186/s40965-017-0027-2, 2017 (code available at: https://micmac.ensg.eu/index.php/Accueil, last access: 6 January 2024).
Schaffer, N. and MacDonell, S.: Brief communication: A framework to classify glaciers for water resource evaluation and management in the Southern Andes, The Cryosphere, 16, 1779–1791, https://doi.org/10.5194/tc-16-1779-2022, 2022.
Schaffer, N., MacDonell, S., Réveillet, M., Yáñez, E., and Valois, R.: Rock glaciers as a water resource in a changing climate in the semiarid Chilean Andes, Reg. Environ. Change, 19, 1263–1279, https://doi.org/10.1007/s10113-018-01459-3, 2019.
Schauwecker, S., Palma, G., MacDonell, S., Ayala, Á., and Viale, M.: The Snowline and 0 °C Isotherm Altitudes During Precipitation Events in the Dry Subtropical Chilean Andes as Seen by Citizen Science, Surface Stations, and ERA5 Reanalysis Data, Front. Earth Sci., 10, 19, https://doi.org/10.3389/feart.2022.875795, 2022.
Scherler, D., Leprince, S., and Strecker, M. R.: Glacier-surface velocities in alpine terrain from optical satellite imagery – Accuracy improvement and quality assessment, Remote Sens. Environ., 112, 3806–3819, https://doi.org/10.1016/j.rse.2008.05.018, 2008.
Smith, M. J.: Chapter Eight – Digital Mapping: Visualisation, Interpretation and Quantification of Landforms, in: Developments in Earth Surface Processes, vol. 15, edited by: Smith, M. J., Paron, P., and Griffiths, J. S., Elsevier, 225–251, https://doi.org/10.1016/B978-0-444-53446-0.00008-2, 2011.
Sorg, A., Kääb, A., Roesch, A., Bigler, C., and Stoffel, M.: Contrasting responses of Central Asian rock glaciers to global warming, Sci. Rep., 5, 8228, https://doi.org/10.1038/srep08228, 2015.
Stammler, M., Cusicanqui, D., Bell, R., Robson, B., Bodin, X., Blöthe, J., and Schrott, L.: Vertical surface change signals of rock glaciers: combining UAV and Pléiades imagery (Agua Negra, Argentina), https://doi.org/10.52381/ICOP2024.138.1, 2024.
Strozzi, T., Caduff, R., Jones, N., Barboux, C., Delaloye, R., Bodin, X., Kääb, A., Mätzler, E., and Schrott, L.: Monitoring Rock Glacier Kinematics with Satellite Synthetic Aperture Radar, Remote Sens., 12, 559, https://doi.org/10.3390/rs12030559, 2020.
Stumpf, A., Malet, J.-P., and Delacourt, C.: Correlation of satellite image time-series for the detection and monitoring of slow-moving landslides, Remote Sens. Environ., 189, 40–55, https://doi.org/10.1016/j.rse.2016.11.007, 2017.
Sun, Z., Hu, Y., Racoviteanu, A., Liu, L., Harrison, S., Wang, X., Cai, J., Guo, X., He, Y., and Yuan, H.: TPRoGI: a comprehensive rock glacier inventory for the Tibetan Plateau using deep learning, Earth Syst. Sci. Data, 16, 5703–5721, https://doi.org/10.5194/essd-16-5703-2024, 2024.
Thibert, E. and Bodin, X.: Changes in surface velocities over four decades on the Laurichard rock glacier (French Alps), Permafrost Periglac. Process., 33, 323–335, https://doi.org/10.1002/ppp.2159, 2022.
Thollard, F., Clesse, D., Doin, M.-P., Donadieu, J., Durand, P., Grandin, R., Lasserre, C., Laurent, C., Deschamps-Ostanciaux, E., Pathier, E., Pointal, E., Proy, C., and Specht, B.: FLATSIM: The ForM@Ter LArge-Scale Multi-Temporal Sentinel-1 InterferoMetry Service, Remote Sens., 13, 3734, https://doi.org/10.3390/rs13183734, 2021 (code available at: https://www.poleterresolide.fr/le-service-gdm-sar-in/, last access: 17 November 2023).
Toth, C. and Jóźków, G.: Remote sensing platforms and sensors: A survey, ISPRS J. Photogramm. Remote, 115, 22–36, https://doi.org/10.1016/j.isprsjprs.2015.10.004, 2016.
USGS Earth Explorer: USGS Earth Explorer [data set], https://earthexplorer.usgs.gov/, last access: 30 January 2024.
Ustin, S. L. and Middleton, E. M.: Current and near-term advances in Earth observation for ecological applications, Ecol. Process., 10, 1, https://doi.org/10.1186/s13717-020-00255-4, 2021.
Villarroel, C., Tamburini Beliveau, G., Forte, A., Monserrat, O., Morvillo, M., Villarroel, C. D., Tamburini Beliveau, G., Forte, A. P., Monserrat, O., and Morvillo, M.: DInSAR for a Regional Inventory of Active Rock Glaciers in the Dry Andes Mountains of Argentina and Chile with Sentinel-1 Data, Remote Sens., 10, 1588, https://doi.org/10.3390/rs10101588, 2018.
Vivero, S., Bodin, X., Farías-Barahona, D., MacDonell, S., Schaffer, N., Robson, B. A., and Lambiel, C.: Combination of aerial, satellite, and UAV photogrammetry for quantifying rock glacier kinematics in the dry andes of chile (30° S) since the 1950s, Front. Remote Sens., 2, https://doi.org/10.3389/frsen.2021.784015, 2021.
Wirz, V., Geertsema, M., Gruber, S., and Purves, R. S.: Temporal variability of diverse mountain permafrost slope movements derived from multi-year daily GPS data, Mattertal, Switzerland, Landslides, 13, 67–83, https://doi.org/10.1007/s10346-014-0544-3, 2016.
Wood, E., Bolch, T., and Streeter, R.: Insights from feature tracking of optical satellite data for studying rock glacier kinematics in the Northern Tien Shan, Front. Earth Sci., 12, 17, https://doi.org/10.3389/feart.2024.1518390, 2025.