the Creative Commons Attribution 4.0 License.
the Creative Commons Attribution 4.0 License.
 | 06 May 2025
Impact of shrub branches on the shortwave vertical irradiance profile in snow
Mireille Quémener
Ludovick Bégin
Benjamin Bouchard
Valérie Dionne
Sébastien Jerczynski
Raphaël Larouche
Félix Lévesque-Desrosiers
Simon-Olivier Philibert
Marc-André Vigneault
Ghislain Picard
Daniel C. Côté
In the Arctic, shrubs are expanding and are covered by snow most of the year. Shrub branches buried in snow absorb solar radiation, reducing irradiance. This modifies the profile of radiative energy absorption in the snowpack and therefore its temperature gradient and metamorphism. Perhaps more importantly, it also reduces photochemical reaction rates and the emission of reactive and climatically active molecules to the atmosphere. No study is currently available to quantify the reduction in photochemical rates caused by shrubs buried in snow. Here, we monitor irradiance in the photochemically active range using a filter at 390 ± 125 nm in snow-covered Alnus incana (gray alders) shrubs in the boreal forest near Université Laval and on nearby grassland during a whole winter by placing light sensors at fixed heights in shrubs and on grassland and observed that irradiance in shrubs was greatly reduced. We performed radiative transfer simulations, testing the hypothesis that shrub branches behave as homogeneous absorbers such as soot. At 390 nm, dense shrub branches reduce irradiance similarly to about 140 ppb of soot. Since ice is much more absorbent at longer wavelengths, we also used a filter to monitor the 715–1000 nm wavelengths (effective 760 nm) to investigate the spectral dependence of shrub impacts on radiative energy absorption. Because of competing ice absorption at 760 nm, the effect of shrubs was much weaker than at 390 nm. We calculate that a high branch density will reduce photochemical reaction rates integrated over the whole snowpack by about a factor of 2. This may affect the composition of the lower-Arctic atmosphere in winter and spring in numerous ways, including a lower oxidative capacity, lower level of nitrogen oxides and modified secondary aerosol production. Climatic effects are expected from these compositional changes.
- Article
(4033 KB) - Full-text XML
-
Supplement
(1065 KB) - BibTeX
- EndNote


Quantifying the irradiance within the snowpack is of interest for numerous reasons, including photochemistry and metamorphism. Here, we focus on the former aspect and briefly discuss the latter. Chemical reactions in the snowpack lead to the production of numerous species which are released to snowpack interstitial air. Produced species include NO and NO2 (Honrath et al., 1999), formaldehyde (Sumner et al., 2002; Perrier et al., 2002), heavier carbonyl compounds and alcohols (Boudries et al., 2002; Houdier et al., 2002), carboxylic acids (Dibb and Arsenault, 2002), and haloalkanes (Swanson et al., 2002). The emission of these species to the atmosphere considerably affects the atmospheric oxidative capacity, ozone and aerosol formation (Domine and Shepson, 2002; Grannas et al., 2007; Finlayson-Pitts and Pitts, 1993), with potential climatic effects because ozone is an important greenhouse gas (Worden et al., 2008) and aerosols scatter light and act as cloud condensation nuclei (Farmer et al., 2015). Quantifying snowpack emissions to the atmosphere caused by photochemistry requires the knowledge of the irradiance profile in the snowpack (France et al., 2010).
Regarding snow metamorphism, a primary driver of this process is the temperature gradient in the snowpack (Colbeck, 1983), which is affected by radiative energy absorption in the top snow layers (Colbeck, 1989). How shrubs affect snow metamorphism therefore requires the understanding of their effect on the vertical distribution of solar radiation absorption.
Most snowpack photochemical reactions are triggered by radiation in the wavelength range from 300 to 450 nm (Grannas et al., 2007; Wang, 2021), so spectral data are required to investigate this topic. Vertical profiles of spectral irradiance have been measured in snow containing light-absorbing impurities in the form of deposited aerosols (King and Simpson, 2001; Simpson et al., 2002; France et al., 2011b, a; Picard et al., 2016). In the Arctic, shrubs are expanding (Sturm et al., 2001a; Ropars and Boudreau, 2012; Ju and Masek, 2016), and the thin Arctic snowpack usually does not extend above the top of shrubs, especially in the high Arctic, where shrubs rarely exceed 50 cm in height (Domine et al., 2016; Sturm et al., 2001b; Marsh et al., 2010) so that buried shrub branches affect light propagation there. The interest of understanding light propagation in snow with shrub branches therefore increases as climate warms for the climate-relevant reasons mentioned above. Vertical spectral irradiance profiles have been measured by Belke-Brea et al. (2021) in the low Arctic within shrubs and in snow without shrubs. The shrubs were dwarf birch (Betula glandulosa), whose branches are very supple and were bent far below the snow surface (Lamare et al., 2023), so their effect on irradiance did not extend over the whole snowpack. The impact of shrubs on photochemistry thus cannot be simply evaluated in this case.
To contribute to the understanding of shrub effects on irradiance profiles in snow and to deduce the resulting impact on photochemical reaction rates in the snowpack and their potential consequences on atmospheric chemistry, we have monitored visible light fluxes at wavelengths centered on 390 nm (blue) in snow with shrubs (Alnus incana) and at nearby sites without shrubs during the whole 2020–2021 winter. The 390 nm wavelength is within the most photoactive wavelength range, and the ice optical properties do not vary much within this range (Picard et al., 2016), so findings near 390 nm probably apply reasonably well to the whole photochemical range.
The vertical profile of solar radiation absorption by snow is highly wavelength-dependent, so studying irradiance around 390 nm is not sufficient for understanding the effect of shrubs on metamorphism. For example, ice is much more absorbing at red than at blue wavelengths, so the e-folding depth (the depth at which irradiance is reduced by a factor e) at 700 nm is 2 to 3 times shorter than at 400 nm in snow (France et al., 2011b, a). We have therefore also monitored light fluxes at wavelengths around 760 nm to obtain spectral information on irradiance profiles. At 760 nm, photochemistry is not known to be active for most molecules (Grannas et al., 2007; Wang, 2021). However, this wavelength range must also be investigated for energy budget and metamorphism applications.
We deployed custom-made 390 and 760 nm light sensors at fixed heights at regular intervals before snow onset. We thus obtained irradiance data in snow with and without shrubs. Using the data and radiative transfer simulations, we were able to quantify the impact of shrubs on light propagation and on depth-integrated light fluxes in the snowpack.
2.1 Optical sensors
Each optical sensor consists of a frosted spherical polystyrene sphere 7 mm in diameter (Cospheric). The sphere had been perforated to its center to insert two plastic optical fibers with a 1500 µm core diameter and 15 µm thick cladding (Toray Industries, PGR-FB1500). The two optical fibers were inserted into a stainless-steel tube of gauge 6G (Component Supply, HTX-06T) to provide rigidity and protect the interface of the fibers and the plastic sphere (Fig. 1). The tube was completely covered with Teflon up to the base of the sphere to mimic the snow reflectivity and to prevent water from seeping into the tube and damaging the optical fiber. The assembly, consisting of the sphere, the fibers, and the tube, was then inserted into a PVC mount, and the fibers were routed to a junction box on the ground (Fig. 1).
Inside the junction box, each fiber end was connected to a photodiode (Vishay, TEMD5080X01) which was mounted on a custom-designed printed circuit board (PCB). Blue and red optical filters (Hoya B390 and SCHOTT RG715) were glued with UV-light cure adhesive (Loca TP2500) directly to the photodiode sensors. The blue filter has a transmission band centered at 390 nm with a bandwidth of 125 nm. We refer to the radiation transmitted by this filter as 390 nm (or blue) radiation. The red long-pass filter transmits light above 715 nm up to the wavelength allowed by the photodiode, which is around 1000 nm. We refer to the radiation transmitted by this filter as 760 nm (or red) radiation because 760 nm is near the middle of the relevant range transmitted through snow at significant depths (Warren and Brandt, 2008), and this wavelength was found to be a valid effective wavelength for subsequent single-wavelength simulations. The signal received from the photodiodes was conditioned through an amplification and noise-filtering circuit before being transmitted to an Arduino Nano acquisition board. The schematic of the optical assembly is shown in Fig. 1.
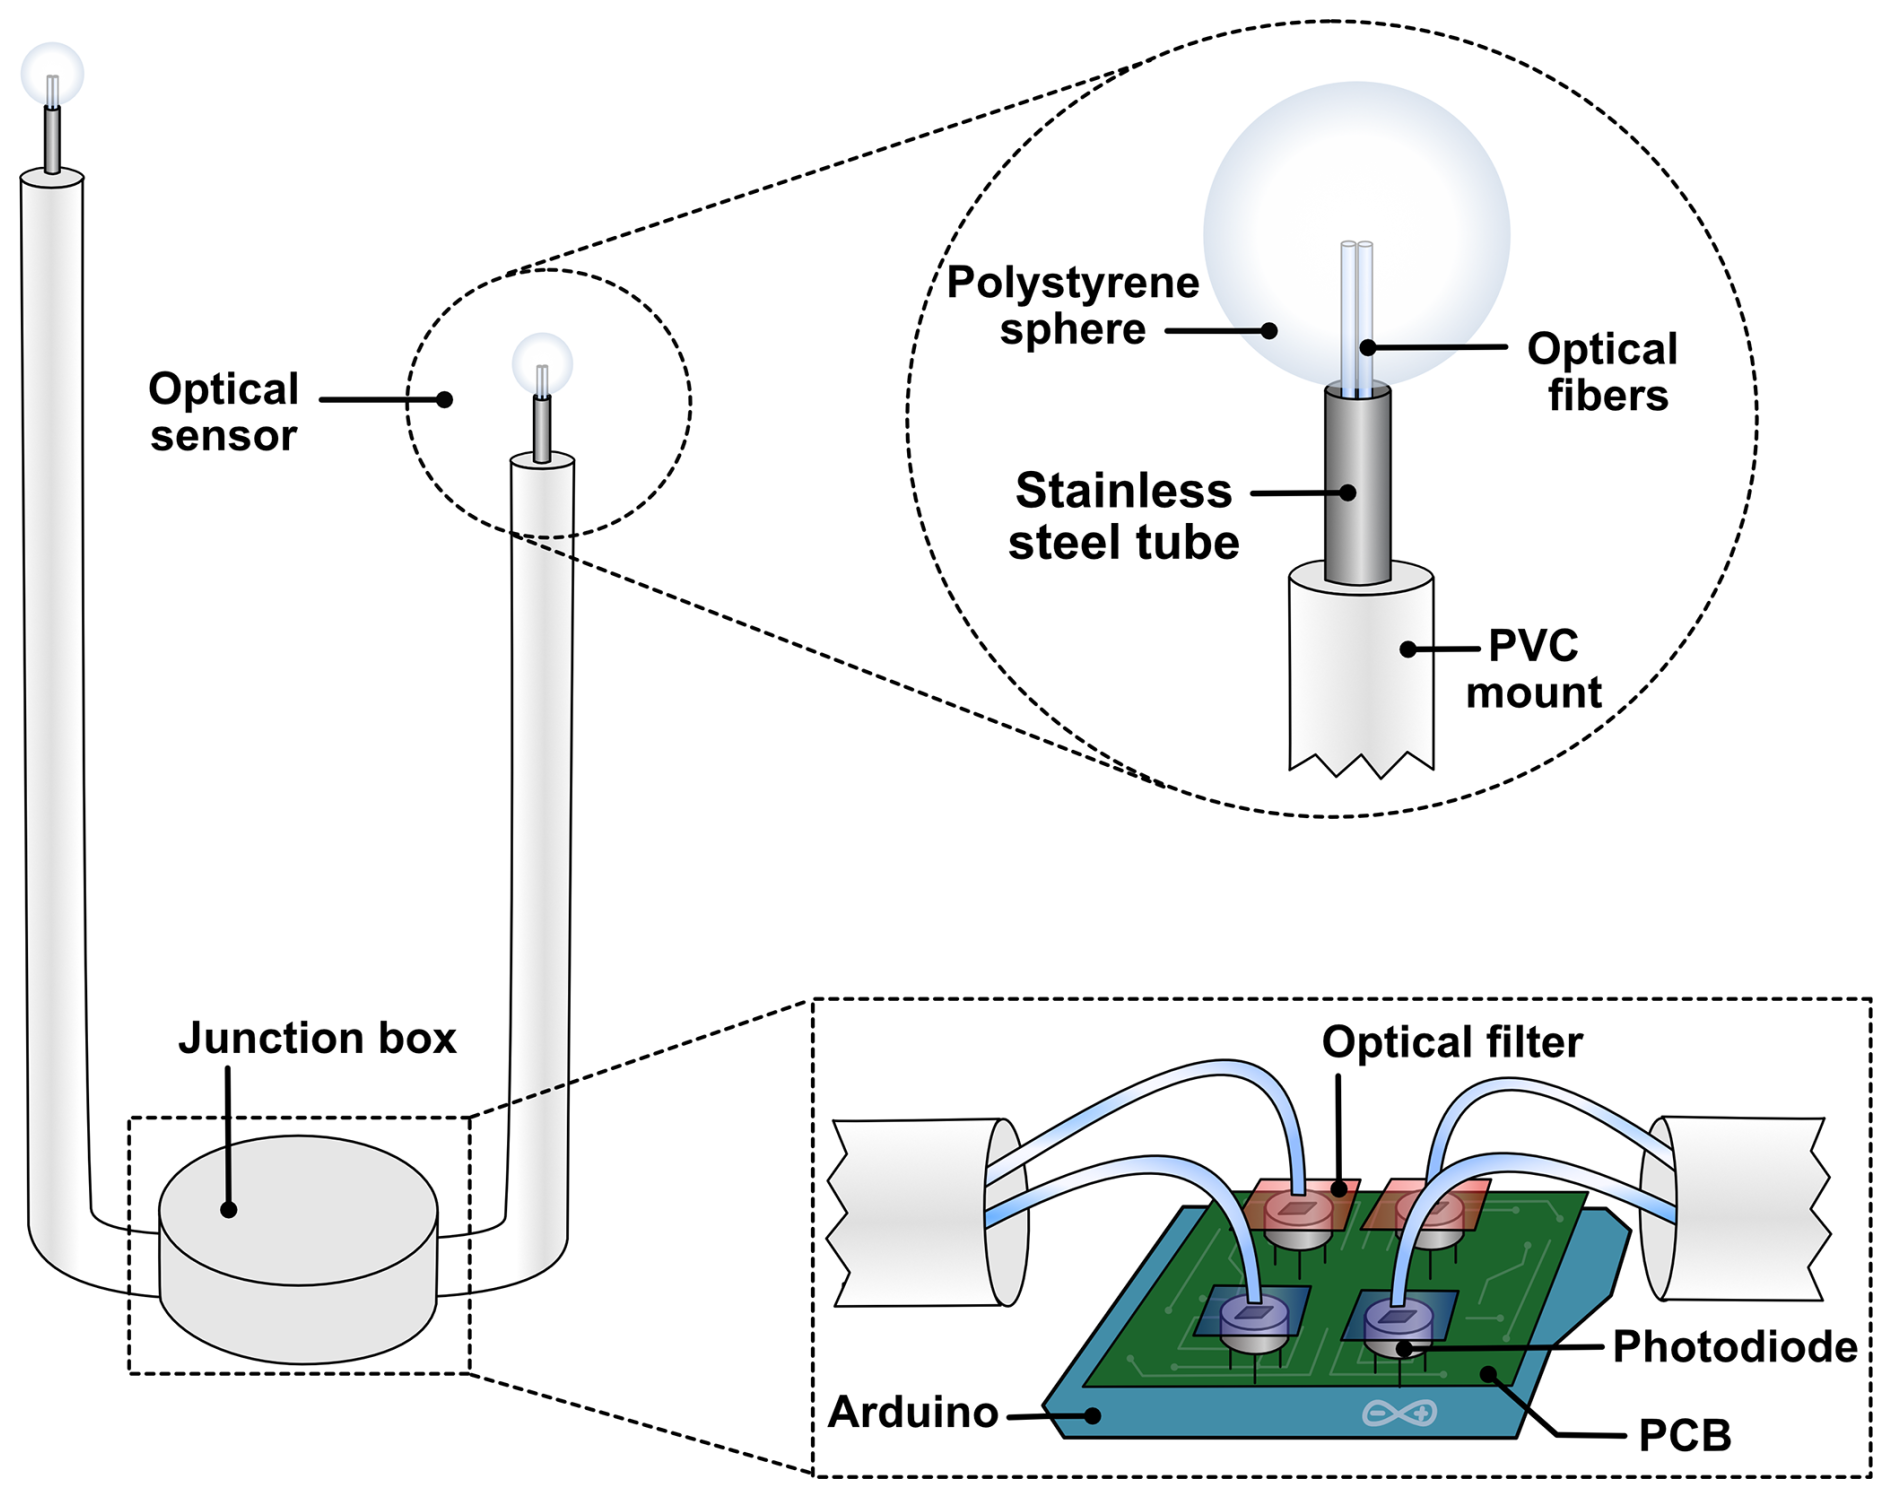
Figure 1Schematic of optical sensors. Each assembly consists of two frosted spheres, each housing two optical fibers that are directed to a custom-made printed circuit board (PCB) located in the junction box. Photodiodes collect the signal from the fibers which is filtered by either a blue or a red filter.
2.2 Sensor deployment and site description
The sensors, assembled in pairs, were deployed in the Montmorency Forest, the research forest of Université Laval, 60 km north of Québec. Ideally, an Arctic site would have been preferred. However, the logistical constraints linked to continuous monitoring and data transmission would have been enormous and the risk of instrument failure much greater. In any case, the Arctic was closed to travel at that time because of the COVID 19 pandemic, so a nearby site was mandatory. The study site (47.3352° N, 71.1375° W, 678 m elevation) featured alder shrubs (Alnus incana ssp. rugosa) 1.5 to 2 m high next to a large clearing without erect vegetation, so shading of the sun was minimal except for very high solar zenith angles (SZAs). A set of four sensor pairs located at the tip of PVC mounts of heights 32.5, 48.5, 65, 85, 100, 120, 137.5 and 155 cm above the ground were placed in the clearing (hereafter F sensors, in the FIELD spot). The heights were selected based on usual peak snow heights at the site, which are about 2 m according to the nearby NEIGE monitoring station 1.75 km to the southwest at an elevation of 665 m (Pierre et al., 2019). A similar set of eight sensors was placed in four similar shrubs (hereafter S sensors, in the SHRUB spot) about 5 m to the north of the FIELD site (Fig. 2). Several striped poles in view of an automatic time-lapse camera were placed in the shrubs and in the field to document snow height evolution. The NEIGE station is equipped with an ultrasonic snow height gauge and a CNR4 radiometer (Kipp & Zonen), which provides broadband (300–2800 nm) downwelling solar irradiance.
It is important to note that each SHRUB sensor had its own peculiar environment within shrub branches. The paired design also imposed constraints on placement. In particular, the 32.5 cm SHRUB sensor, called S325, was well in the middle of a shrub, with several large branches in its vicinity. The S485 and S650 sensors were closer to the edge of a shrub, with fewer and smaller branches in their vicinity (Fig. 2). These observations are important for data analysis. Figure S1 in the Supplement details the positions of the S325 and S485 sensors during installation.
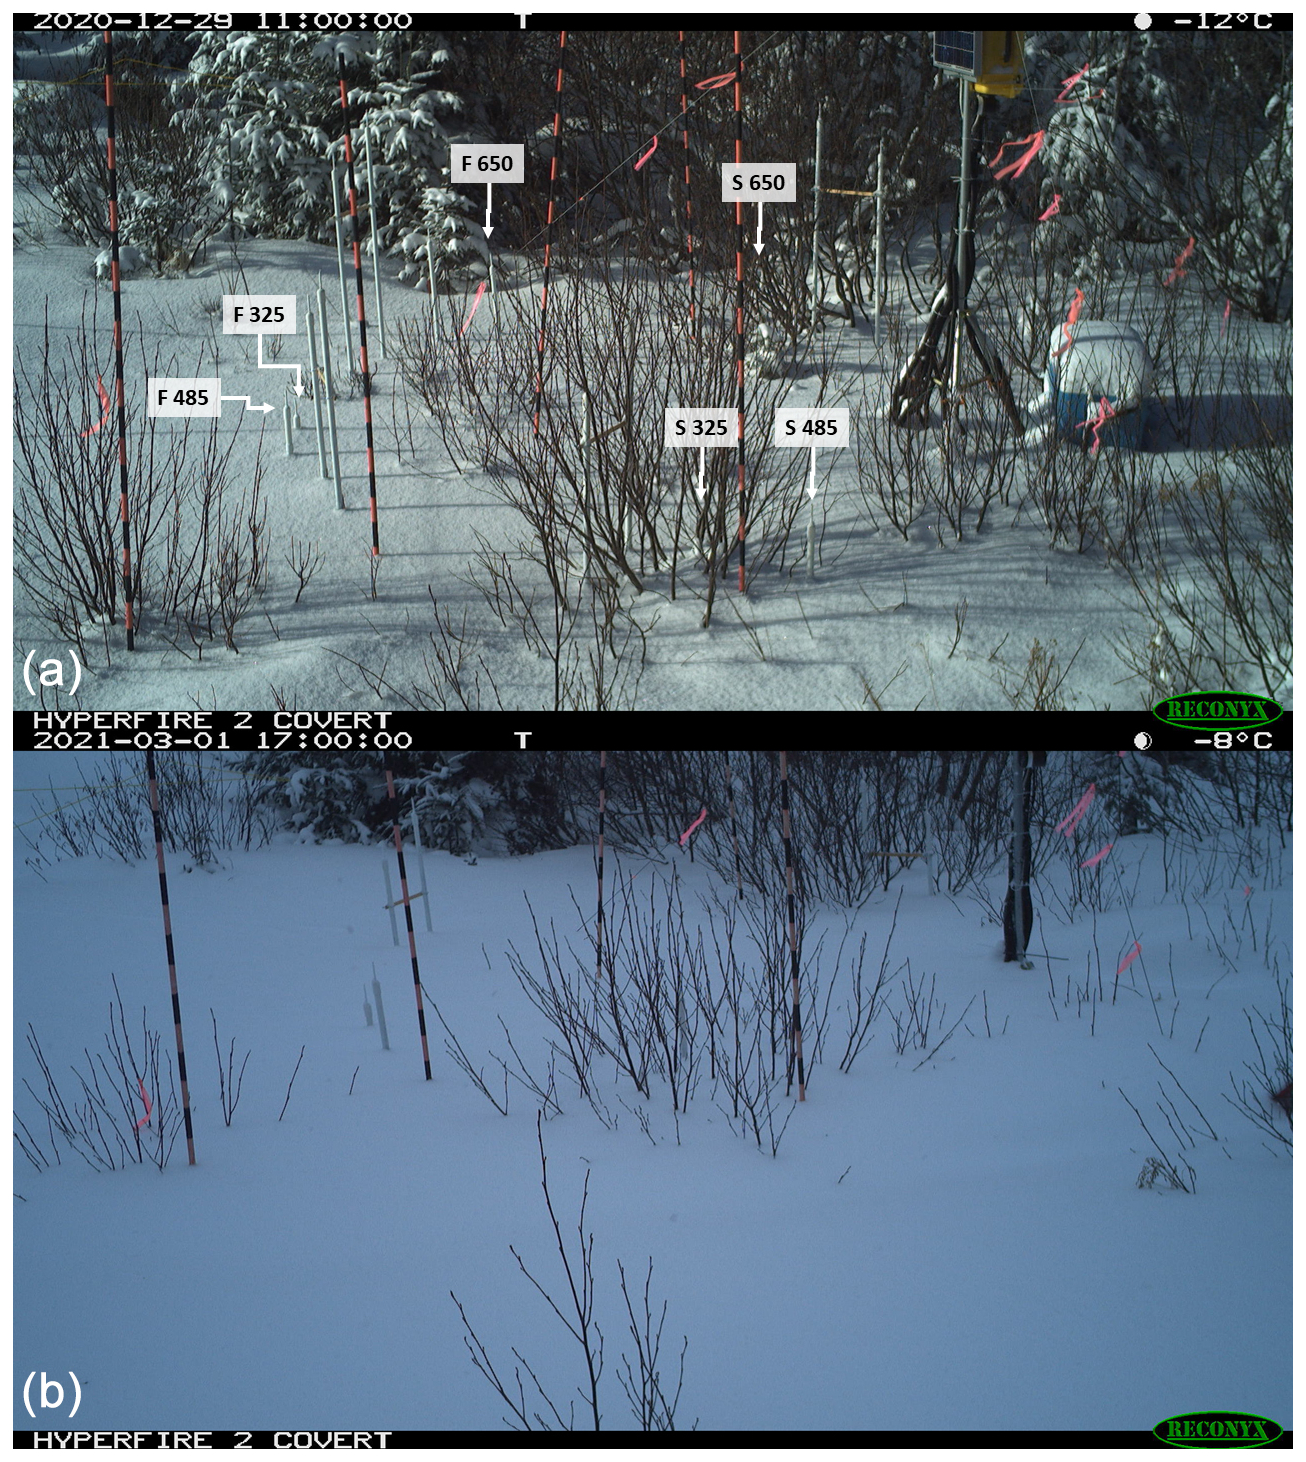
Figure 2Photographs of the site showing the positions of the sensors. (a) Photograph taken on 29 December 2020, when no sensor was covered by snow. The six sensors whose data were used here are indicated. S325, S485 and S650 are in the SHRUB spot at heights of 32.5, 48.5 and 65 cm. F325, F485 and F650 are in the FIELD site. (b) Same view at peak snow height on 1 March 2021, when the six sensors were buried. Note that the snow bent the branches, modifying the branch environment of the S sensors visible on top.
To help quantify branch characteristics, on 2 November 2022, the morphology of a representative shrub was investigated by measuring the number and diameters of the branches at the heights where our data analysis was focused: 32.5, 48.5 and 65 cm. These data can also be used for comparisons with shrubs elsewhere in past and future studies (e.g., Belke-Brea et al., 2020).
2.3 Electronics, data acquisition and transmission
The schematic of the electronics used for data acquisition and transmission is shown in Fig. 3. As the project involved the deployment of 16 optical sensors, a custom printed circuit board (PCB) was designed to provide a scalable, low-power and cost-effective solution. Each PCB included four photodiodes (Vishay, TEMD5080X01), four operational amplifier (op-amp) circuits (STMicroelectronics, TSZ124) and an Arduino Nano for signal acquisition. The op-amp included a variable gain control on each channel, enabling the adjustment of the output response for each photodiode independently. This adjustment was necessary to ensure that the signal from each photodiode covered the entire 5 V input range of the Arduino Nano analog-to-digital converter.
The Arduino Nano in each junction box was equipped with a DHT22 temperature sensor, which showed that the temperature at the ground level remained constant, near 0 °C throughout the winter. No correction for the op-amp temperature-dependent response was thus required. The Arduino Nanos were also connected and powered through USB serial communication with a primary Raspberry Pi (RP1). Each Arduino continuously transmitted raw data from all four photodiodes along with temperature and humidity readings. This RP1 was equipped with a Python acquisition script programmed to receive the data stream from each Arduino and to compute a single reading per sensor every 10 minutes. This strategy helped limit the size of the files which later needed to be transferred to the server over the internet.
A 3G communication module was added to transfer the data in real time to a server. However, due to the high-power consumption of the module, a secondary Raspberry Pi (RP2) was used for powering and communicating with this 3G module, while the RP1 managed and powered the eight Arduino Nanos. The RP2 was also tasked to monitor the field with a Raspberry Pi camera (v.1.3) to provide an overall perspective of the study site. These images were transferred to the server in real time.
To minimize the power consumption, a timer relay module (DS1307 real-time clock and SRD-12VDC-SL-C) controlled by an Arduino Nano was used to power both Raspberry Pis. The relay was programmed to keep the Pis powered on during the daytime hours (7:00 to 18:00 EST, UTC-5), with a 30 s power interruption every 10 min for rebooting and potential bug resolution.
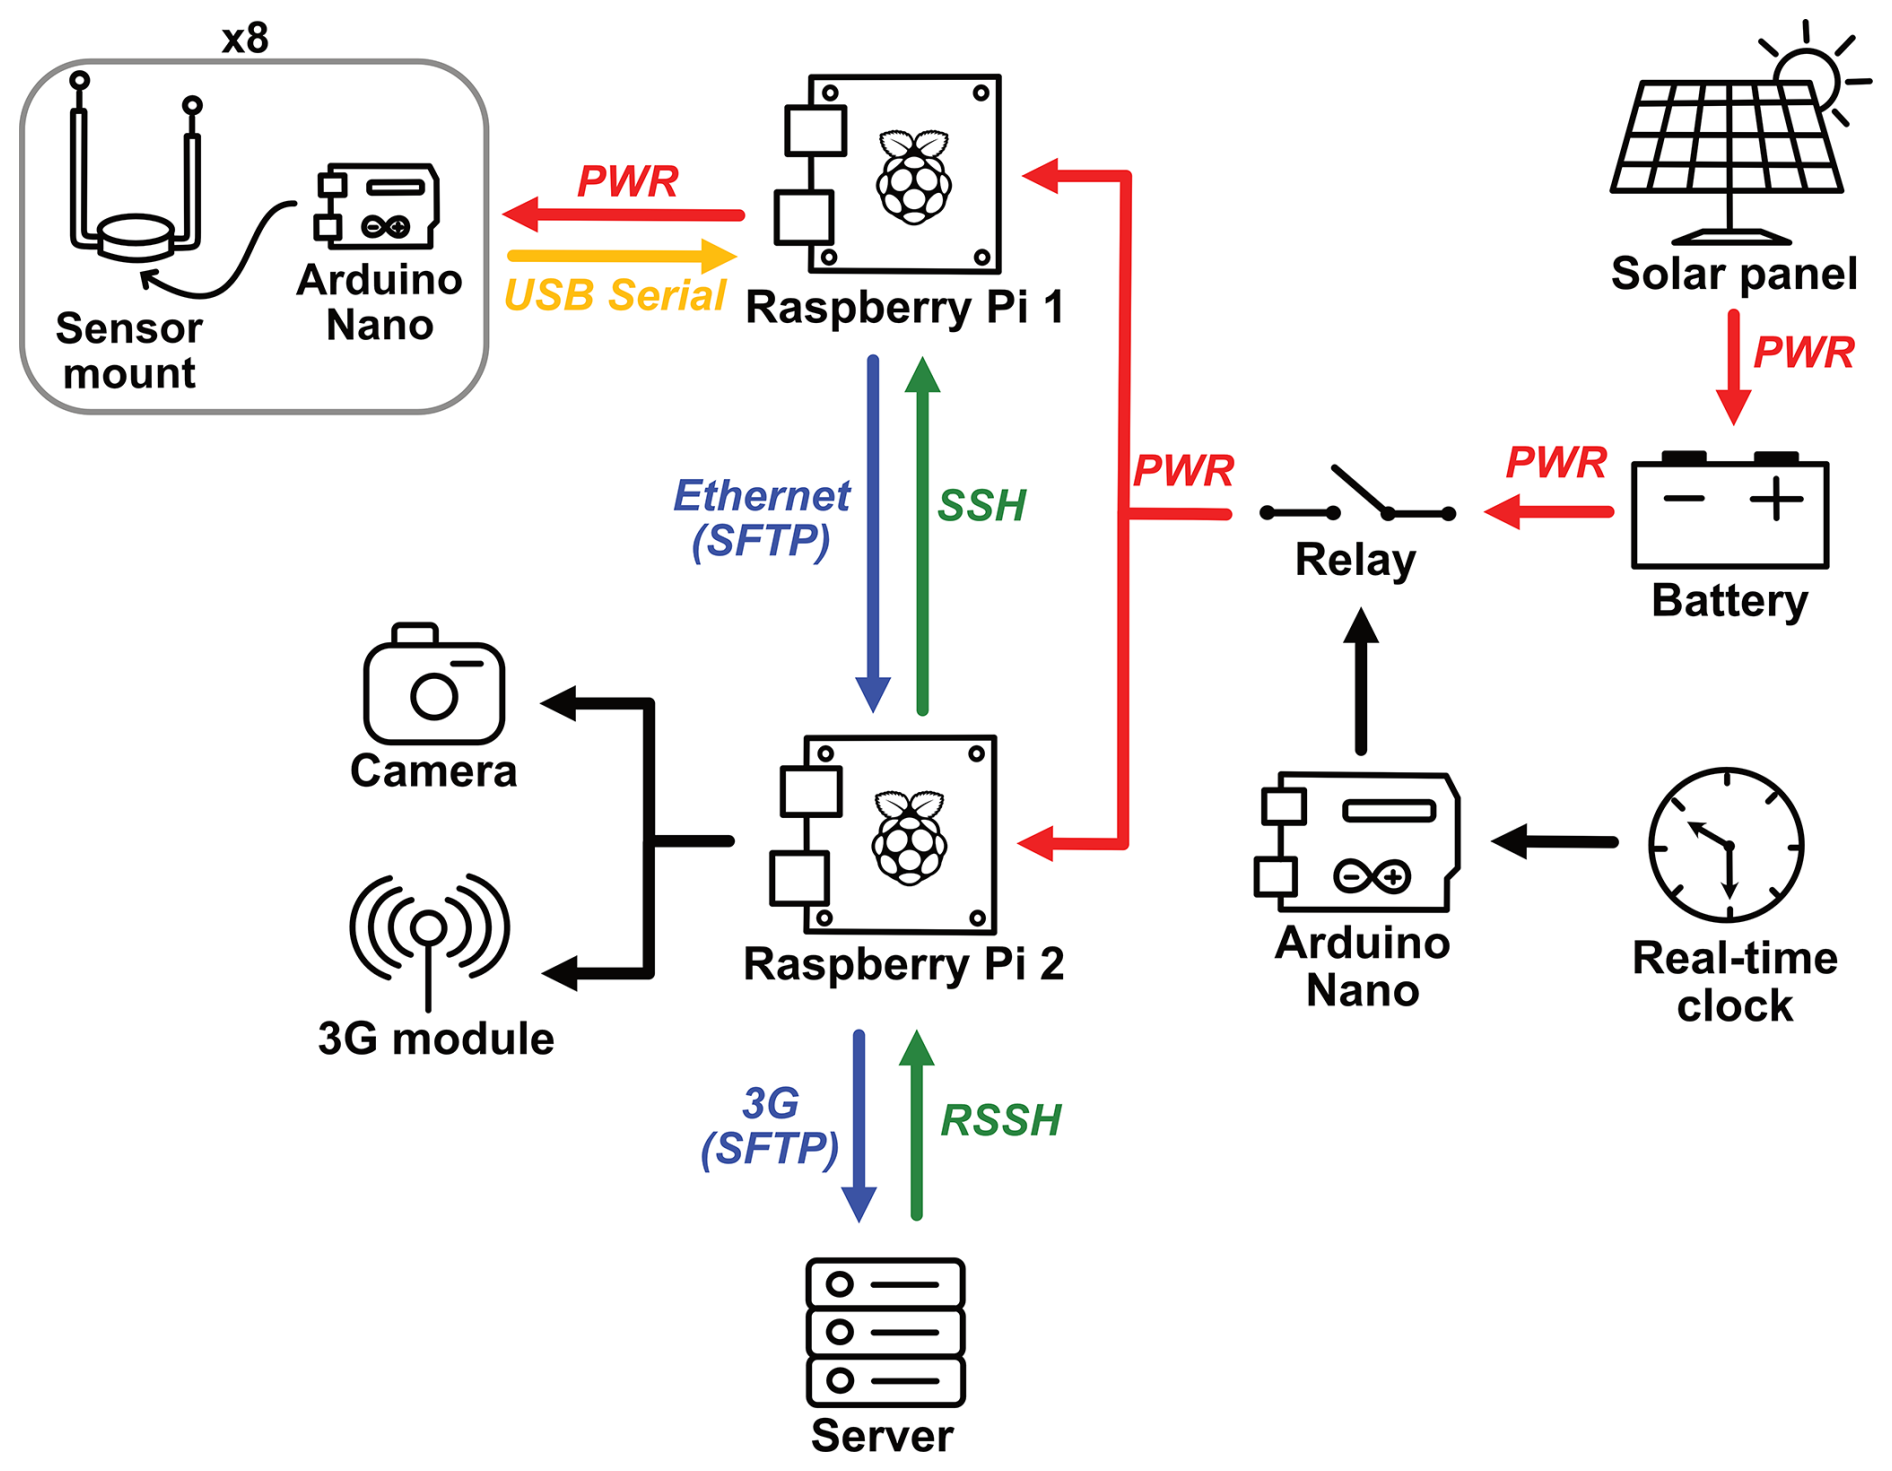
Figure 3Schematic of the signal acquisition and transmission system. The Raspberry Pi 1 received the data stream from each of the eight sensor pairs, while the Raspberry Pi 2 handled data transmission over the internet to the server. The whole system was operated exclusively during daytime hours (07:00–18:00 EST). PWR: power, SSH: secure shell protocol, RSSH: reverse SSH protocol, SFTP: SSH file transfer protocol.
2.4 Snow height determination
The image analysis software Fiji (https://imagej.net/software/fiji/, last access: 27 February 2025) was used to determine the snow level on the striped poles depicted in Fig. 1 from photographs taken by a time-lapse camera (four photos per day). To improve the time resolution, the two daily measurements were supplemented with snow height data from the NEIGE station, which provided hourly measurements. Spatial variations between the various striped poles indicate an uncertainty in snow height at the sensors of interest of 1.5 cm.
2.5 Field measurement of snow properties
To constrain inputs into radiative transfer models, vertical profiles of snow properties were measured on 2 and 23 February and 5 April 2021. Profiles of density and specific surface area (SSA) were measured at sites near and similar to FIELD and SHRUB. Methods were similar to those described in Domine et al. (2015). Briefly, a 100 cm3 density cutter and a field scale were used for density. SSA was determined using the DUFISSS instrument based on the measurement of the infrared reflectance of snow at 1310 nm using an integrating sphere (Gallet et al., 2009).
2.6 Analysis of irradiance data
Our interest is in understanding the irradiance in the snow as a function of depth below the snow surface and of incident solar radiation. The variable of actual interest is the fraction of light incident on the snow surface that reaches the buried sensor. The signal from sensor number i, Ii, was therefore normalized to the incident radiation I0, which was obtained from sensors that were not buried and whose signal was not saturated. For the blue radiation, we used the average of the Ii of the three FIELD sensors at heights of 100, 120 and 137.5 cm to obtain I0b. For the red radiation, the signal from these three FIELD sensors was saturated, so we used the SHRUB sensor at a height of 155 cm to obtain I0r. There were slight gain variations among sensors. The comparison of signals from all sensors when no sensor was buried and there was just a few centimeters of snow on the ground in December allowed the homogenization of all the gains. The gain correction factors range from 0.85 to 1.35. For comparisons with simulations, we therefore used gain-corrected data, (. The detection limit for was taken as the signal greater than 3 times the noise and found to be 0.002.
Under blue-sky conditions, most of incident radiation is direct, so the angular response of the sensors used as references must be known. This angular response was measured in the laboratory using a goniometer and was found to be different from a cosine response. Our laboratory measurements allowed for correcting for this angular response. However, it was simpler and probably less error-prone to limit our data analysis to overcast conditions when incident light was diffuse, similar to the conditions of the sensors buried in the snow. Subsequently, we therefore only consider ( without angular correction on overcast days. Limiting analysis to overcast conditions is not expected to affect our general conclusions because in snow, light becomes diffuse after a depth of generally a few millimeters (Simpson et al., 2002). Since our irradiance measurements are all below this depth, the nature of the light incident at the surface (direct vs. diffuse) has no impact on our irradiance analysis. Overcast conditions were determined from time-lapse images, which revealed the presence of clouds and the lack of shadows, and from the daily time series of solar irradiance, which deviated from the typical clear-sky plots. The normalized irradiance values were obtained by averaging data over several hours when overcast conditions were certain. We estimate the uncertainty in ( to be 15 %, except for values <0.005, when it is about 80 %.
The irradiance profiles were simulated using the TARTES Python module (Picard and Libois, 2024, available at https://snow.univ-grenoble-alpes.fr/snowtartes/, last access: 18 March 2025). In TARTES, input data are the thickness, density and SSA of each snow layer, as determined from observations. Additionally, absorption by impurities is considered. What TARTES uses is an absorption coefficient, which can be translated to a concentration of any impurity provided that the mass absorption coefficient of that impurity is known. It may also eventually be translated into a branch density. Here, we translate for simplicity the absorption coefficient used in TARTES into a soot concentration because soot is a common and highly absorbing impurity in snow (Hansen and Nazarenko, 2004; Chylek et al., 1983; Warren and Clarke, 1990). The soot optical properties used are those reported in Bond and Bergstrom (2006), i.e., the soot density is 1800 kg m−3 and its complex optical constant is 1.95–0.79i independent of wavelength. To analyze the effect of shrub branches with TARTES, we consider the soot equivalent of branches to simulate their absorption. This approach therefore makes the hypothesis that branches behave as a homogeneous absorber such as soot, even though they are discrete absorbers. With this approach, we determine the soot equivalent of shrub branches by comparing the concentrations of absorbing impurities between the FIELD and SHRUB simulations. At 390 nm, we calculate using TARTES that irradiance is reduced by a factor of 10 at a depth of 29 cm for typical snow encountered during this study (density = 200 kg m−3, SSA = 25 m2 kg−1, soot = 25 ng g−1). The sensors will therefore be sensitive to optical properties within a radius of ∼ 29 cm.
Figure 4 sums up the optical properties of the constituents considered here: ice, soot and bark. At 760 nm, ice absorbs 62 times more than at 390 nm (Picard et al., 2016; Warren and Brandt, 2008). Soot absorbs 0.51 times as much because of the inverse wavelength dependence of absorption on the imaginary optical index. Regarding bark optical properties, Juola et al. (2022a) report average reflectance values of several Alnus incana individuals and also provide numerical data between 397 and 1000 nm (Juola et al., 2022b). The reflectance is 0.18 at 397 nm and 0.53 at 760 nm (Fig. 4). In absorptivity terms, assuming bark is thick enough, this yields values of 0.82 at 390 nm and 0.47 at 760 nm, which is a decrease of a factor of 0.57 and not very different to the soot value.
Because of the greater ice absorption, at 760 nm, irradiance in snow decreases by a factor of 10 over a distance of 8.2 cm, much shorter than at 390 nm. The corresponding volume is 44 times smaller than at 390 nm. The sensor is therefore more sensitive to its immediate environment, such as the proximity of a thick branch.
Even though considering irradiance reduction by a factor of 10 is intuitively simple, the e-folding depth, as defined in the Introduction section, is often considered preferably (France et al., 2011b, 2010; Simpson et al., 2002). In the above case, the e-folding depths are 12.5 and 3.7 cm at 390 and 760 nm, respectively.
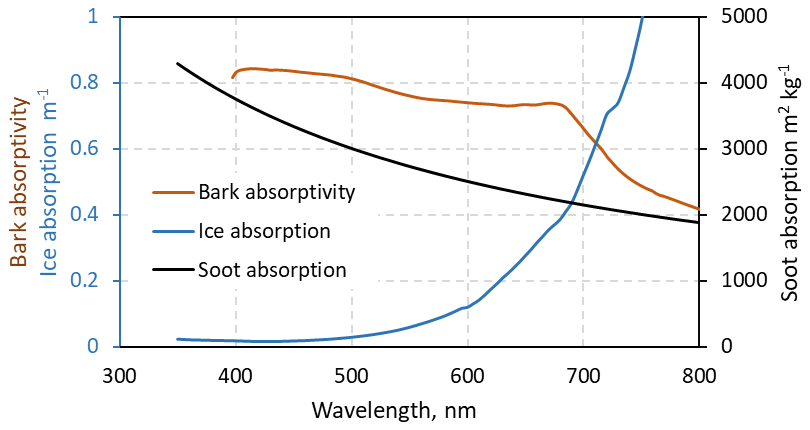
Figure 4Absorption coefficients of ice and soot used in this study. The absorptivity of Alnus incana bark is calculated as 1 – bark reflectivity (Juola et al., 2022b), assuming bark is thick enough to be fully opaque.
Here, we first present the field investigations of snow physical properties and the evolution of snow height. Examples of data are shown in the main text, with additional data in the Supplement. We then present examples of the optical data, which consist of irradiance data and downwelling shortwave irradiance. Measurements of shrub branch density are then reported, which are subsequently used in the discussion. The results of simulations using the TARTES code are finally presented and compared to measurements. Again, simulations are performed on overcast days, as determined from the solar irradiance data. A combination of snow physical properties and snow height are used as input data for the simulations.
3.1 Snow properties
Vertical profiles of snow density and SSA were obtained on 2 and 23 February and 5 April. As an example, the profiles measured on 23 February 2021 at spots similar to FIELD and SHRUB and within 50 m of those spots are shown in Fig. 5. The data obtained on the other two dates are shown in the Supplement, in Figs. S2 and S3.
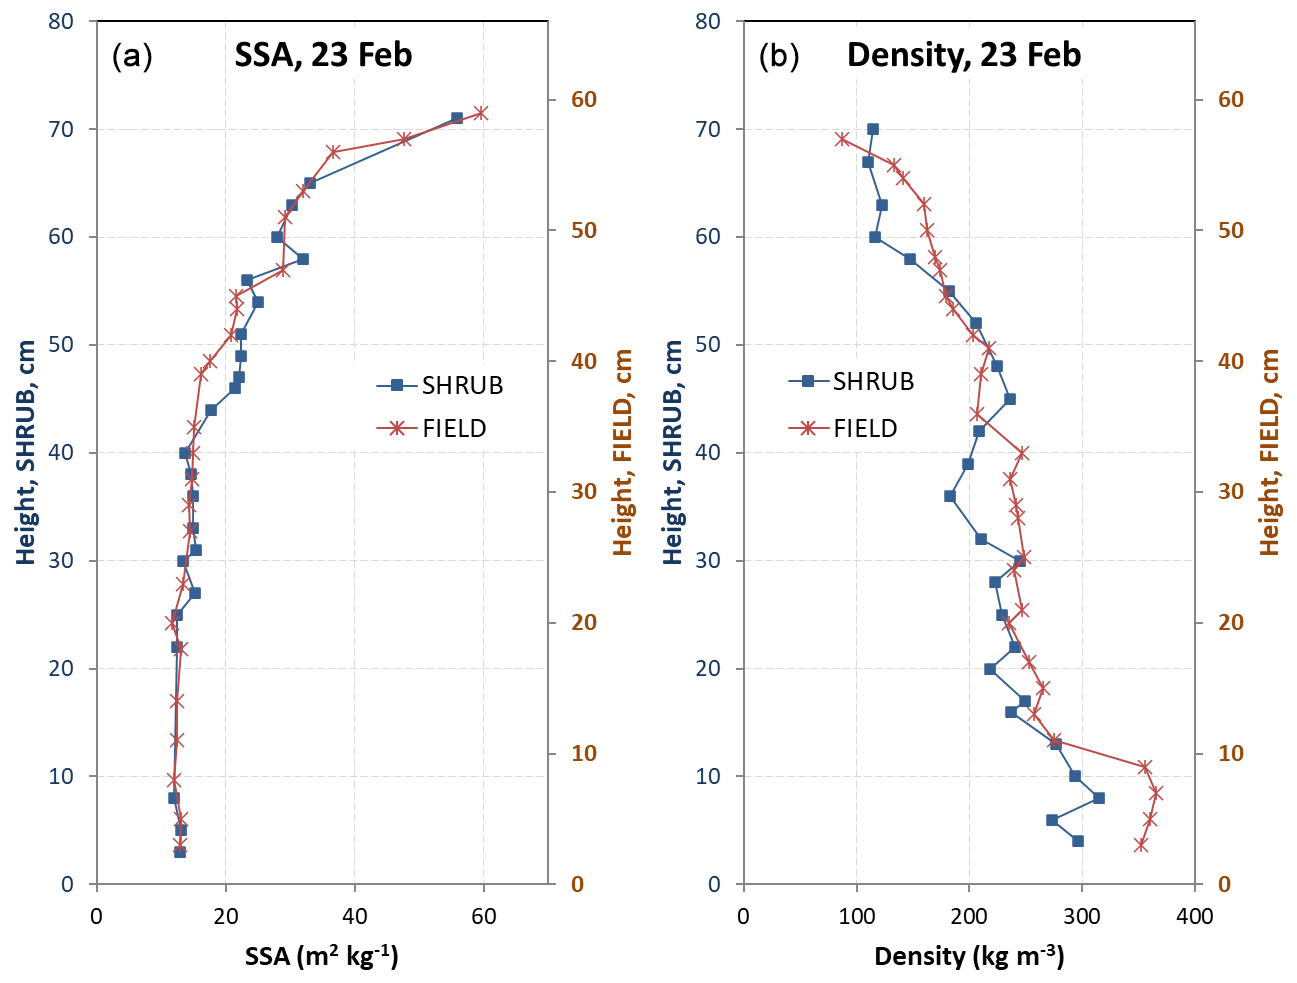
Figure 5Vertical profiles of snow specific surface area (SSA) and density measured at an open spot similar to FIELD and at a spot in shrubs similar to SHRUB on 23 February 2021. These profiles were used to determine SSA and density values for simulations.
The 2020–2021 winter was unusual in that the peak snow height was less than half the usual value (Bouchard et al., 2024a), so most of our sensors were not covered. Time series of snow height, as well as dates selected to perform irradiance simulations, are shown in Fig. 6.
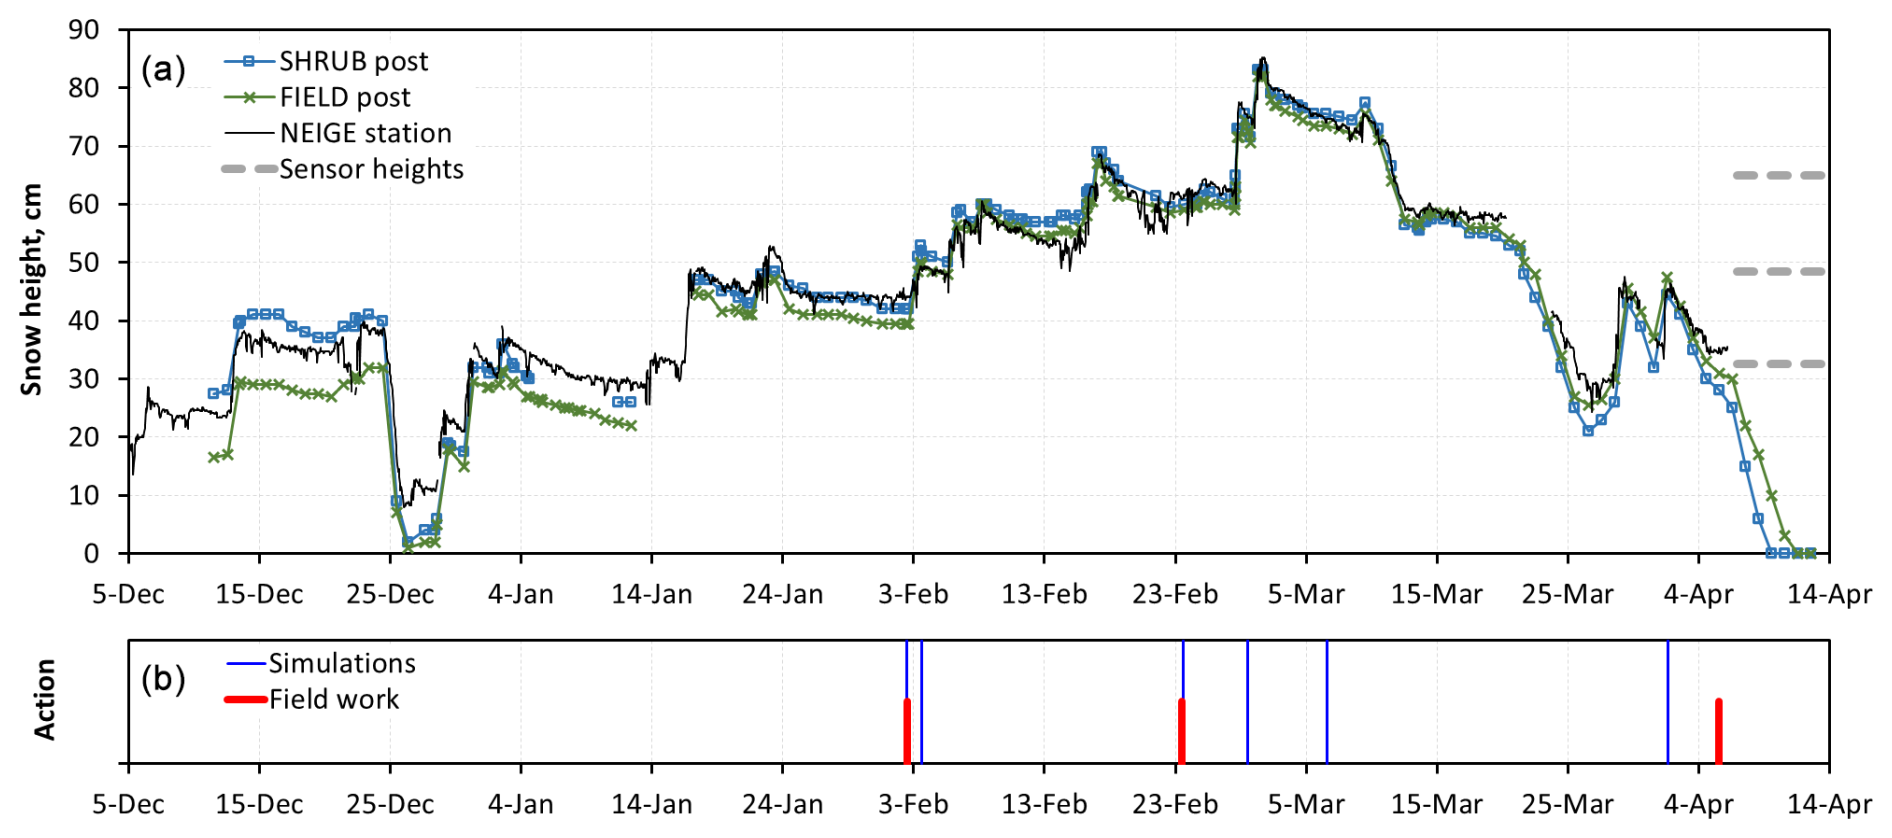
Figure 6Time series of snow height and actions relevant to snow investigations. (a) Snow height at the striped poles placed at the study site and snow height monitored by an ultrasonic gauge at the NEIGE station 1.75 km away. The heights of the three sensors that provided irradiance data are also shown. (b) Dates for which irradiance profiles were simulated and fieldwork dates when snow density and specific surface area profiles were measured.
3.2 Irradiance data
Time series of the irradiance measured by sensors at 32.5, 48.5 and 65 cm heights, which were covered by snow at some time during the season, were obtained between December and April. A fraction of those data was selected to reach our objective of quantifying the impact of shrubs on irradiance. The first step in this selection was to detect days with adequate snow height to cover sensors and when snow physical properties were measured or could be estimated with reasonable confidence. The second step was choosing overcast days, during which diffuse lighting conditions facilitated simulations. Here, we show the selection process and how data differed at 390 and 760 nm. For illustration, we show data for the period from 28 February to 7 March because this was the only time when three sensors were buried. We first show data at 390 nm and then at 760 nm.
Figure 7 shows plots of normalized irradiance data for i = 32.5, 48.5 and 65 cm for both FIELD and SHRUB during the this period. The downwelling solar shortwave irradiance measured by the CNR4 radiometer is also shown, which reveals that 3 March had perfect clear-sky conditions, whereas 2 March had clear-sky conditions with just a few clouds. The reduced solar radiation on 28 February, and time-lapse images show this day was totally overcast. On 6 March, conditions were mostly overcast with rather thin clouds and occasional breaks in the clouds. Periods with direct radiation were removed from the analysis. Therefore, within the period shown in Fig. 7, both 28 February and 6 March were chosen to perform radiative transfer simulations.
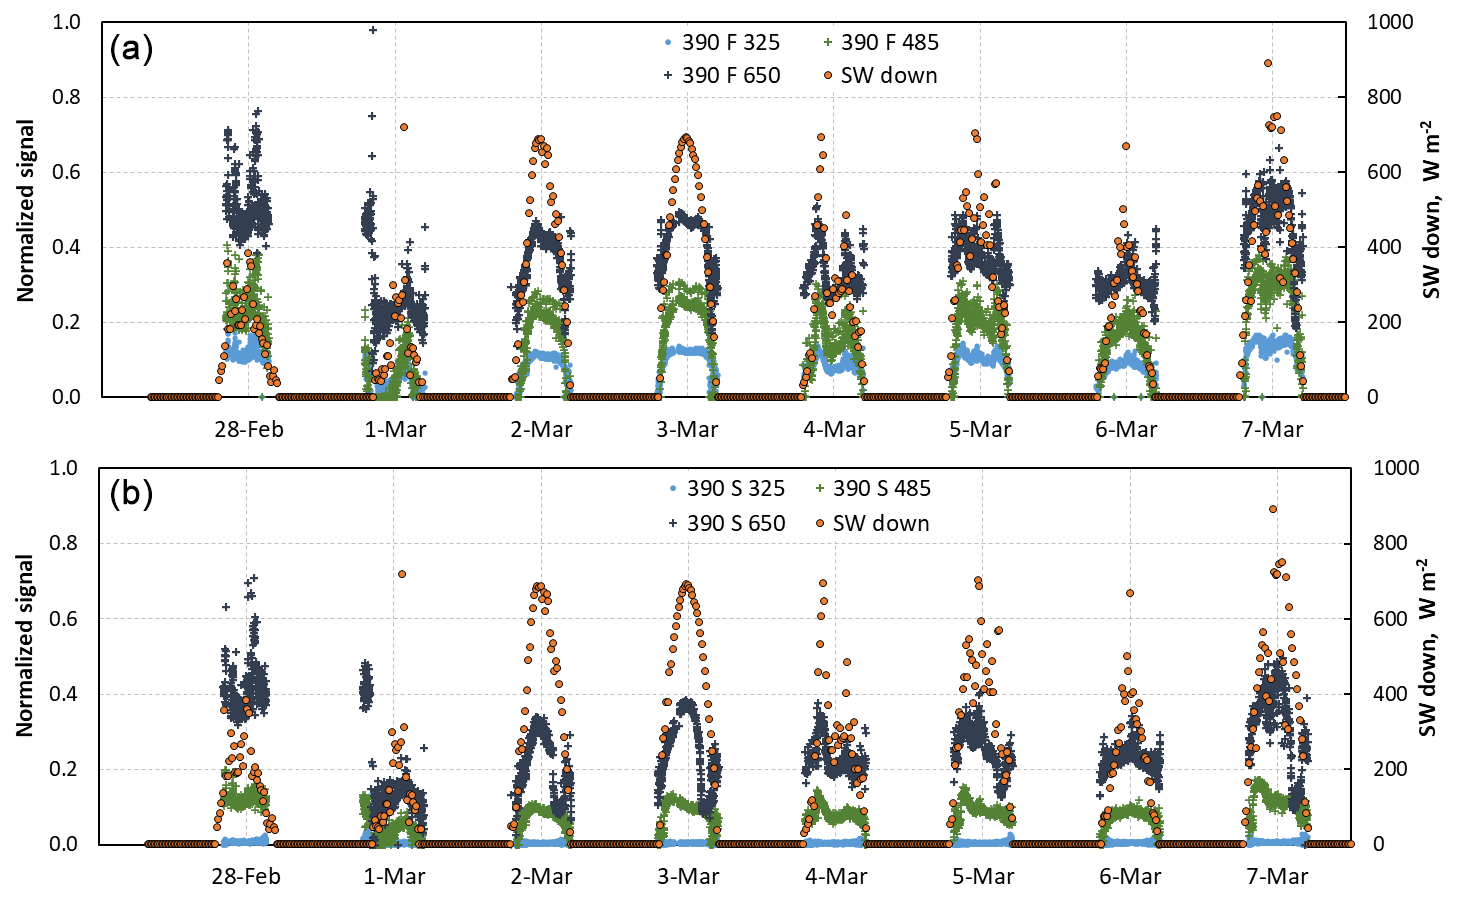
Figure 7Time series of normalized irradiance at 390 nm for the three sensors at 32.5, 48.5 and 65 cm heights when these three sensors were buried. The downwelling solar irradiance (SW down) from the CNR4 radiometer is also shown. (a) FIELD. (b) SHRUB. The signal for the 390 nm (blue) wavelength of the FIELD sensor at the 32.5 cm level is 390 F 325. For the SHRUB sensor, it is 390 S 325. SW down is the downwelling shortwave radiation measured by the CNR4.
The signals during both days were determined by selecting periods when conditions were overcast with thick clouds, as shown in Fig. 8. For example, on 28 February at FIELD (Fig. 8a), the signal was determined based on data between 10:30 and 12:30 EST. As expected, irradiance signals are lower at SHRUB than at FIELD because of light absorption by shrub branches.
The other days selected for simulations were 2, 3 and 23 February and 1 April because conditions were overcast. Only one to two sensors were then buried, as visible in Fig. 6. The normalized and gain-corrected experimental irradiance data ( and ( used are reported in the Supplement, in Tables S1 and S2.
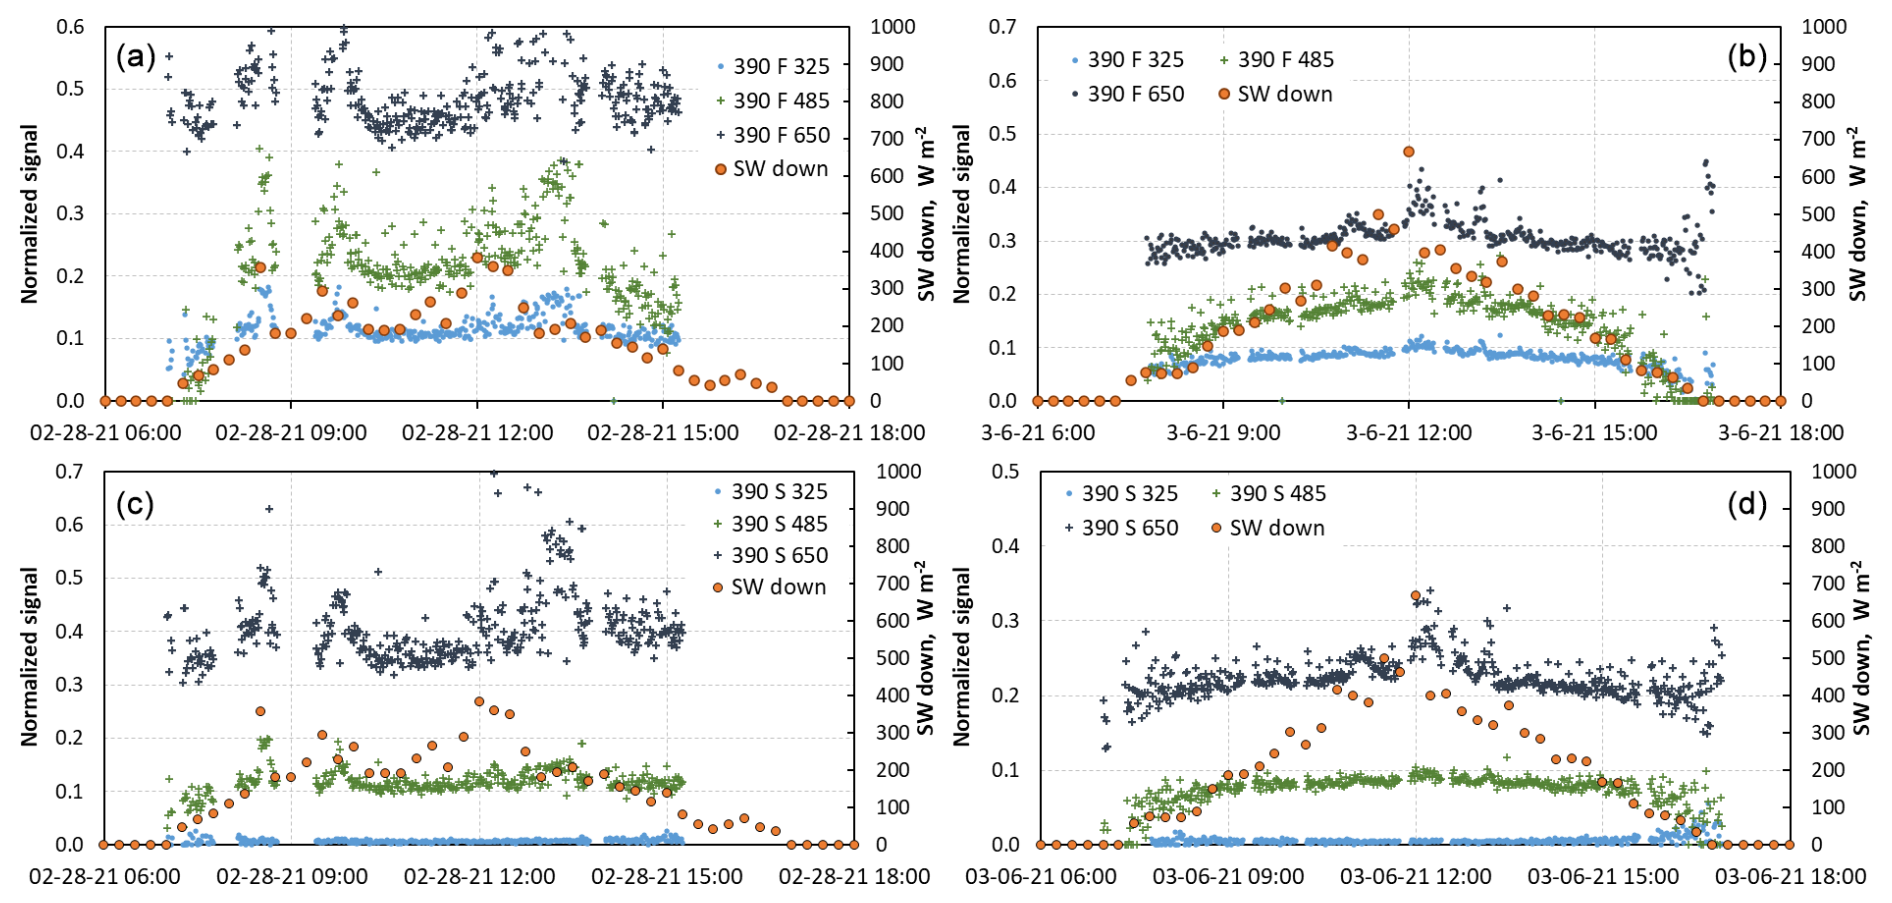
Figure 8Daily evolution of the normalized irradiance under mostly overcast conditions. (a) FIELD, 28 February (b) FIELD, 6 March (c) SHRUB, 28 February (d) SHRUB, 6 March. For the 28 February data, the time range 10:30 to 12:30 EST was used. For the 6 March data, the time range 07:00 to 16:00 EST was used, with the exclusion of the 11:30–13:00 EST time range.
Because of the greater ice absorption at 760 nm than at 390 nm (Warren and Brandt, 2008), radiation penetration is much shallower at 760 than at 390 nm, and a signal was detected only for the topmost sensor at the red wavelength. data at 760 nm obtained from 28 February to 7 March for the F650 and S650 sensors are shown in Fig. 9.
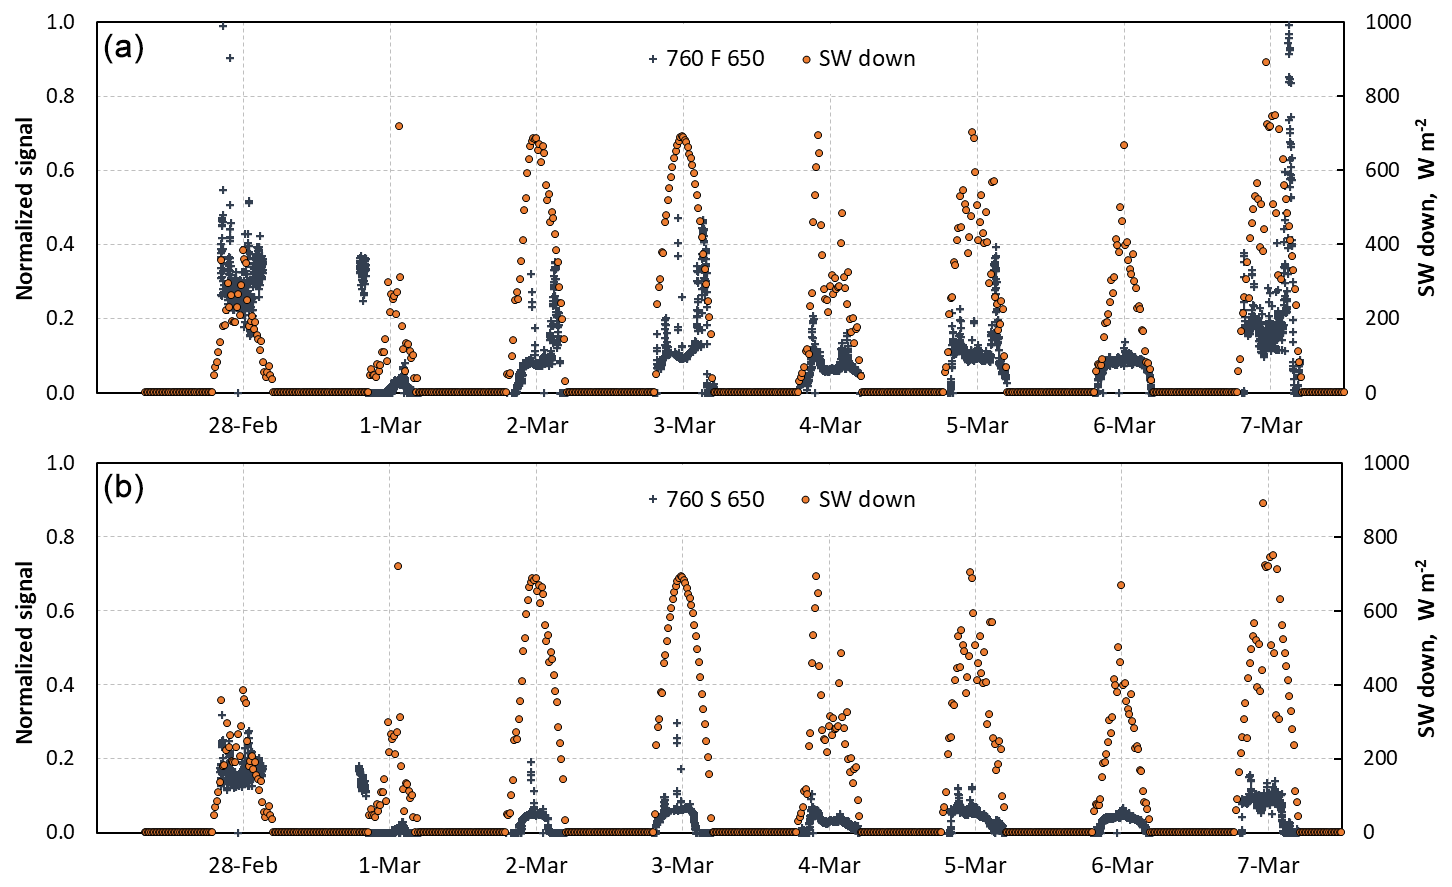
Figure 9Time series of normalized irradiance at 760 nm for the sensor at 65 cm. The downwelling solar irradiance (SW down) from the CNR4 radiometer is also shown. (a) FIELD. (b) SHRUB. The signals from the sensors at 32.5 and 48.5 cm are too low for detection and are not shown.
3.3 Shrub morphology
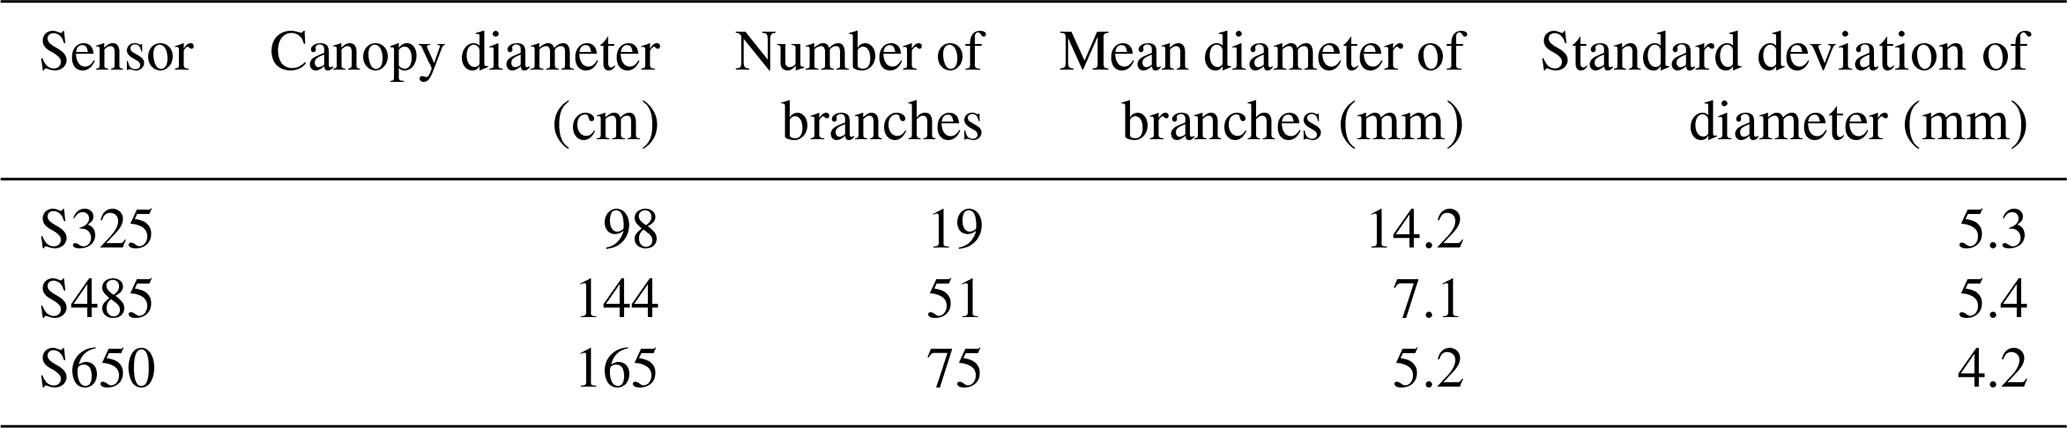
The mean diameter and number of branches of the shrub canopy in a representative shrub at heights of 32.5, 48.5 and 65 cm, which correspond to the heights of S325, S485 and S650 sensors are reported in Table 1. The distribution of branch diameters at these three heights is shown in Fig. S4. The average canopy diameters at those heights were 75, 110 and 135 cm.
Table 1Canopy and branch characteristics at heights of 32.5, 48.5 and 65 cm heights, corresponding to the level of the three sensors S325, S485 and S650 in SHRUB that were buried in snow.
3.4 Radiative transfer simulations
Irradiance profiles were simulated on 2, 3, 23 and 28 February; 6 March; and 1 April. An irradiance profile can be simulated if the physical properties (SSA and density) and impurity concentrations of the snow layers are known. For 2 and 23 February, we used the snow density and specific surface area values obtained on those very days during our snow pit measurements (Figs. 5 and S2). For the other days, snow physical properties were estimated from the snow pit data; the literature (Domine et al., 2007; Taillandier et al., 2007), which helps in estimating the time evolution of snow physical properties and the SSA–density correlation; and, above all, from our experience of snow physical properties and their evolution at the Montmorency Forest (Bouchard et al., 2022, 2024a). The concentration of impurities in the snow, treated as a soot equivalent, was not measured and was used as an adjustable variable to optimize the agreement between measured and simulated irradiance profiles. The main objective of these simulations is to compare the impurity concentrations between FIELD and SHRUB in order to deduce a soot equivalent for the absorption by shrub branches.
Physical and chemical snow variables used for simulations at 390 nm are reported in Table 2. Layer numbers and boundaries were determined so that density and SSA showed limited variations within a layer (see Figs. 4, S2 and S3). Soot concentrations were determined for each layer on each simulation day. However, the soot concentration of a given layer is not expected to vary significantly over time because soot is not significantly affected by snow metamorphism and by snow chemistry and soot particles are hydrophobic and little affected by melting events (Festi et al., 2021; Meyer and Wania, 2011). Adjusted soot concentrations were therefore only slightly modified to limit variations in a given layer over time. Variations can indeed occur because of experimental error and can also occur naturally. For example, recrystallization during metamorphism may free an impurity particle embedded into a crystal so that its location is then on the surface of a crystal, where its absorbing effect is reduced (Kokhanovsky, 2013). Freed particles may also drop to a lower level. The snow physical properties at the sensors' location are also probably slightly different to those at the measurement spots. The values of Table 2 allow for a reasonable agreement between simulations and data at 390 nm, as shown in Fig. 10, except on 1 April. Using lower soot values on that last date would allow for a perfect fit, but decreasing soot values during melt would not make physical sense. We reflect on this situation in the Discussion section.
Table 2Snow density, specific surface area and soot profile values used in radiative transfer simulations using the TARTES model at 390 nm. Snow layers are listed from the top down. Soot values are in part per billion by mass (ppb, ng g−1).
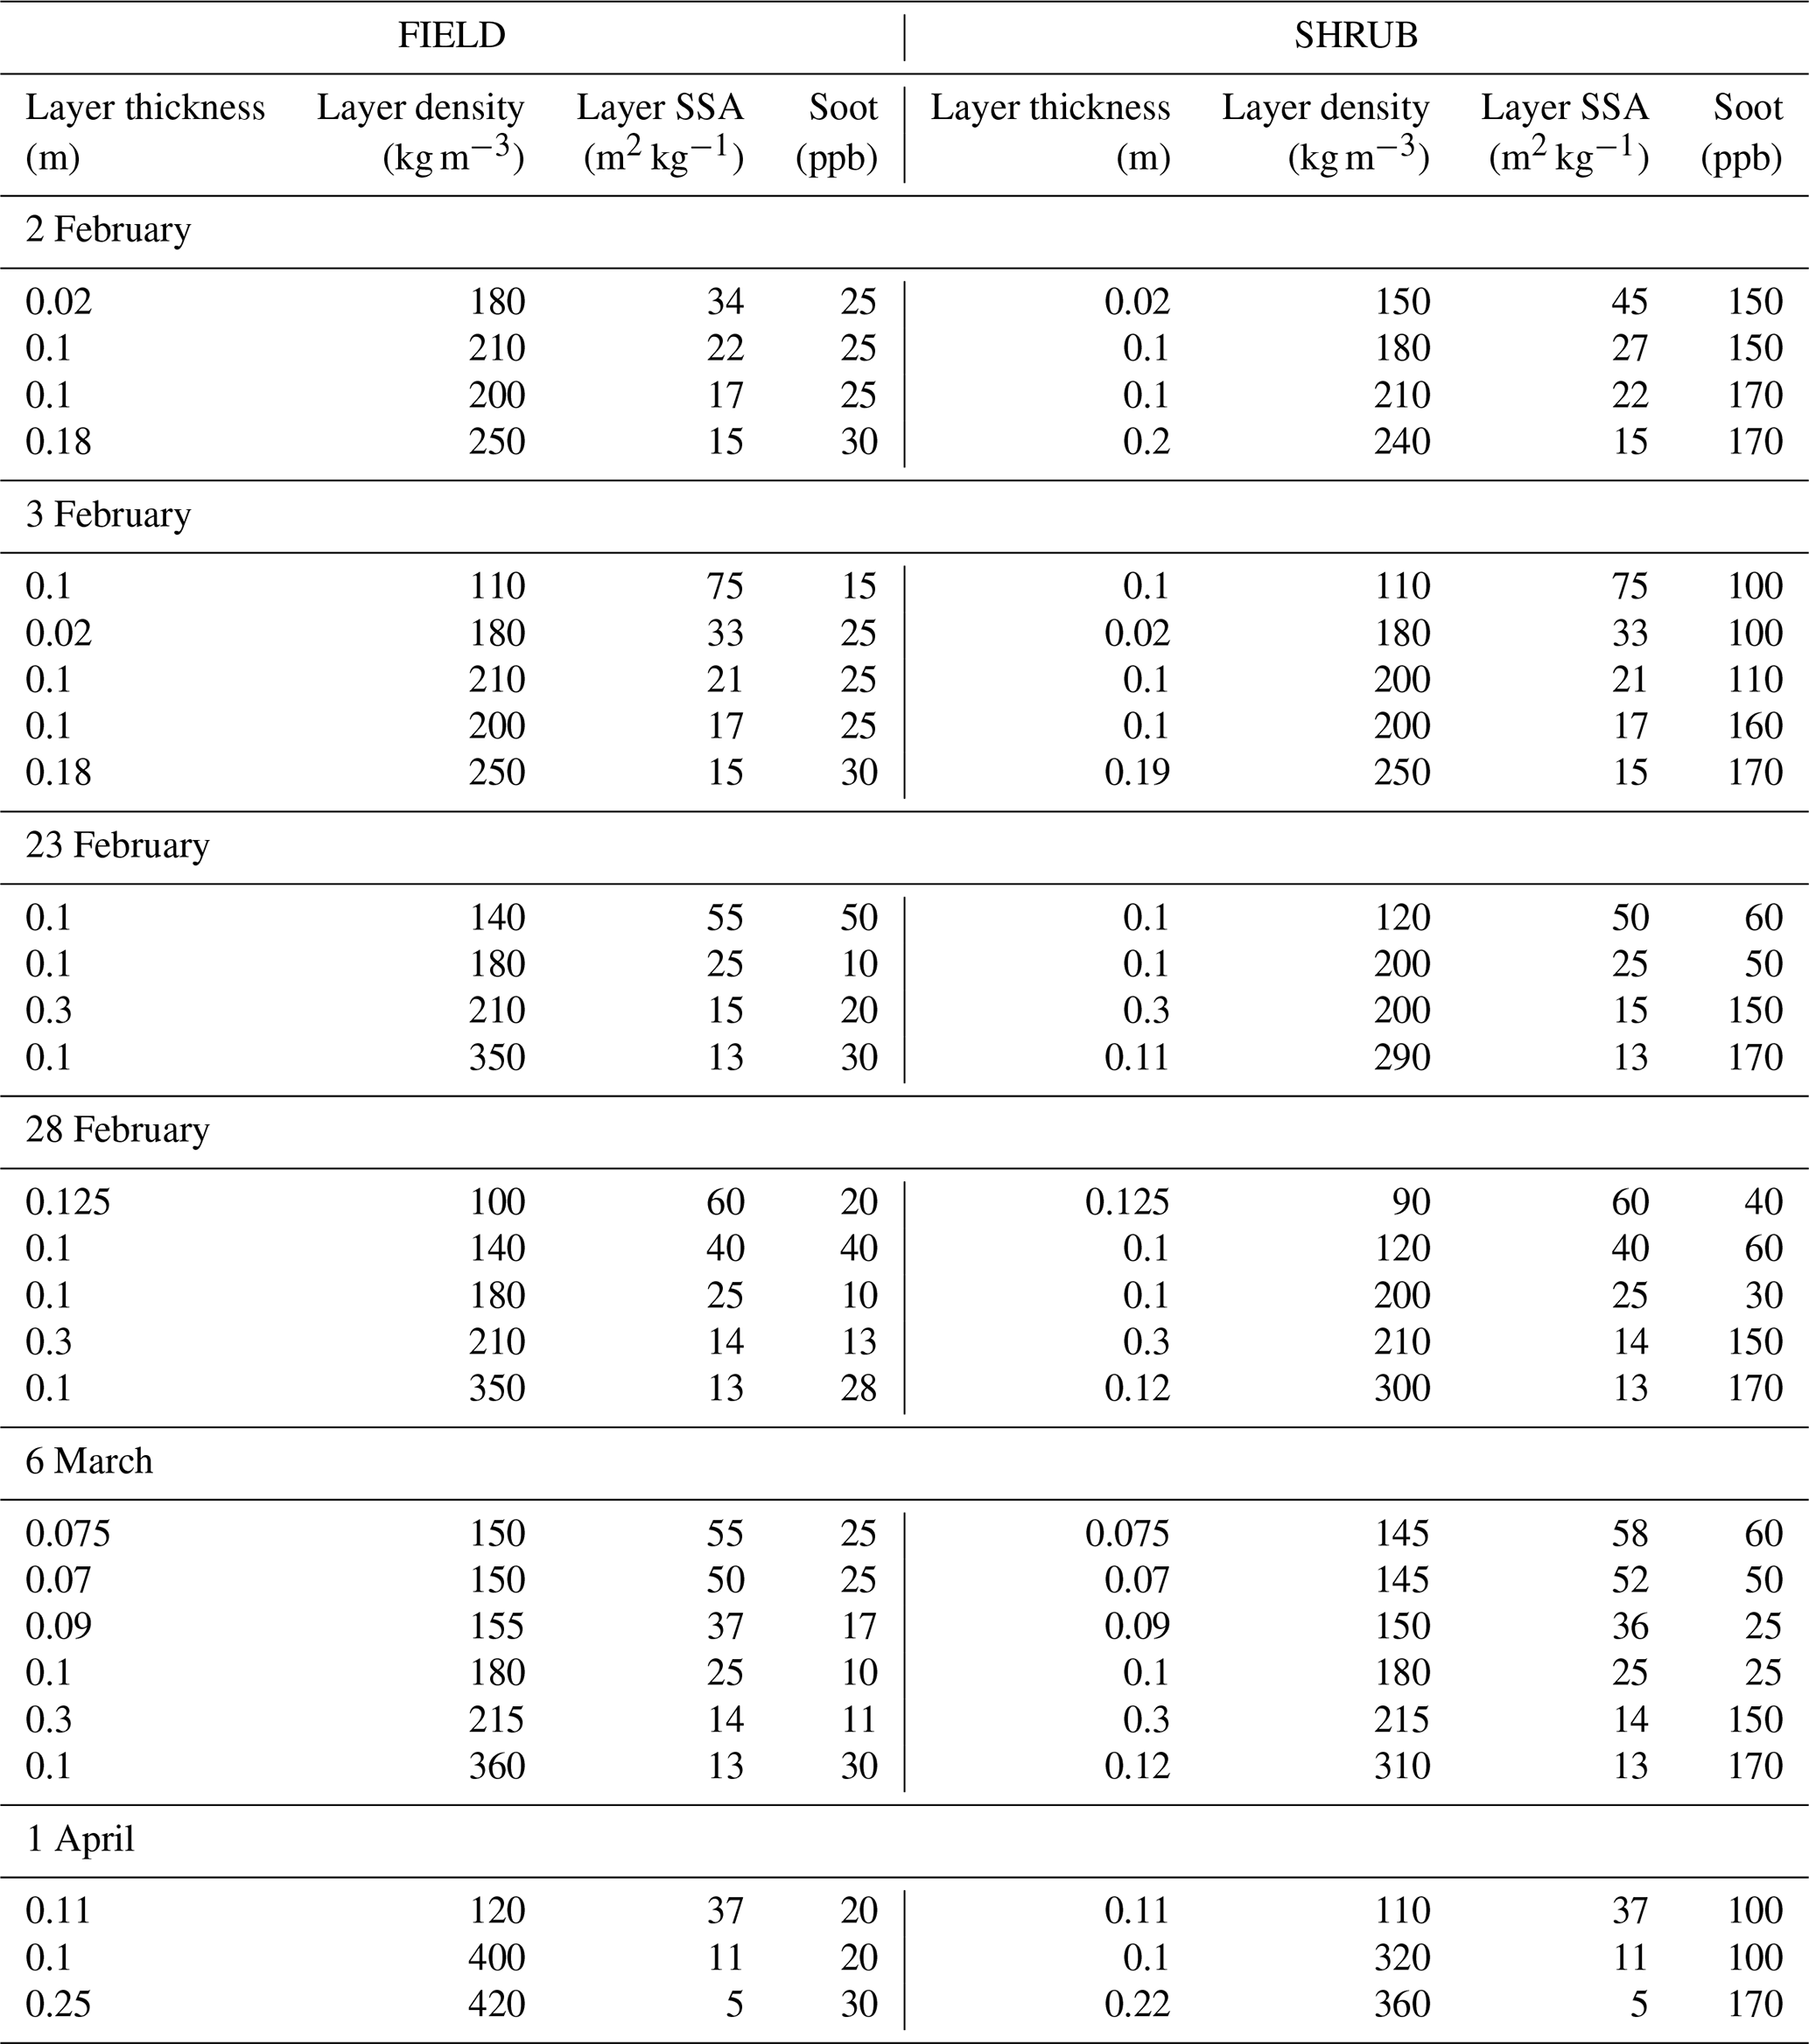
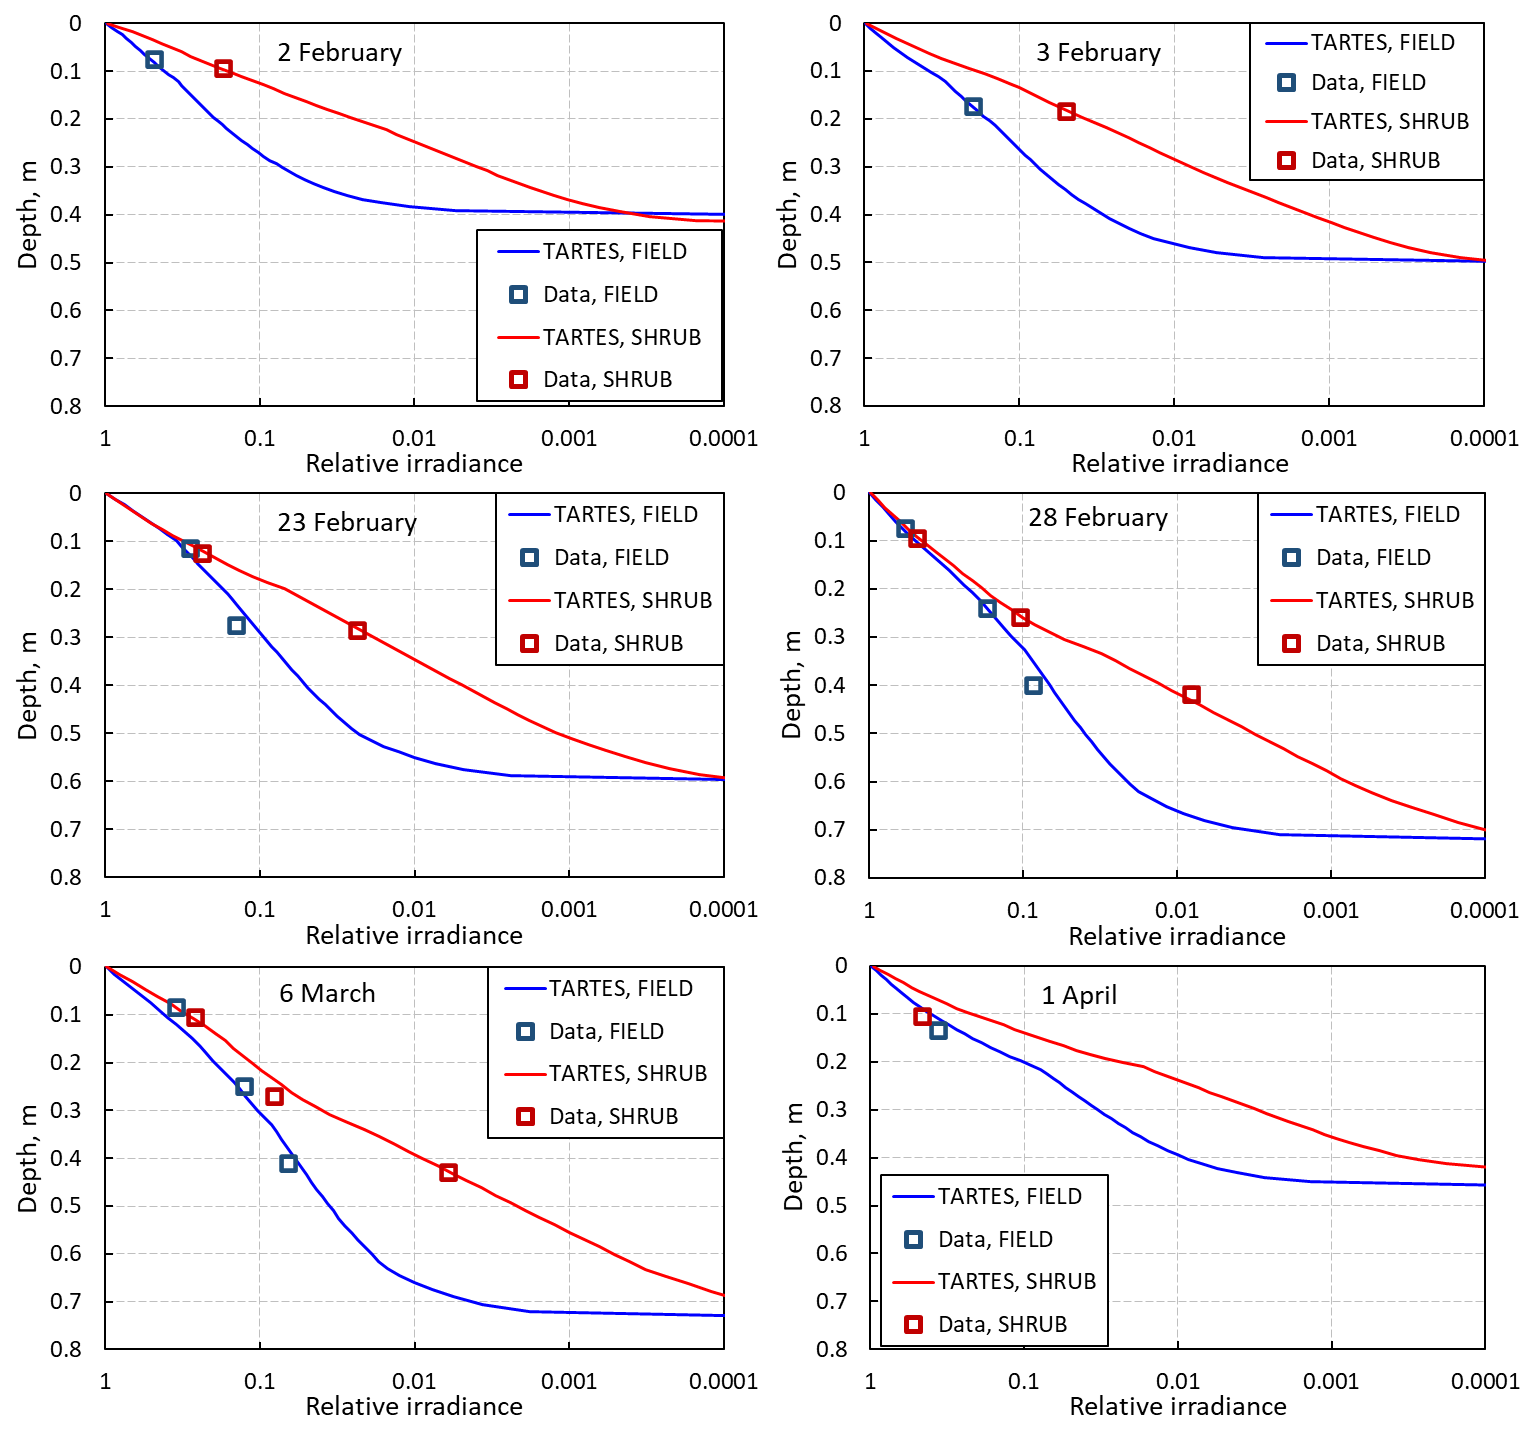
Figure 10Profiles of irradiance in the snowpack at FIELD and SHRUB at 390 nm simulated by the TARTES software. Experimental data points are also shown. One to three data points were obtained, depending on the number of sensors buried. The x axis scale has been inverted to start at the snow surface. The size of the data points represents the error bars.
For the red radiation, our filter transmits all wavelengths >715 nm. In this range, the absorption coefficient increases with increasing wavelength (Warren and Brandt, 2008): it is 0.52 m−1 at 700 nm and 2.1 m−1 at 800 nm. Performing simulations over a wavelength range that accounts for dispersion is difficult without knowing the incident spectral irradiance, and we rather took the option of choosing an effective wavelength. Simulations with TARTES showed that for wavelengths >850 nm, the signal at 10 cm depth, typical of the position of the topmost sensor, was negligible. The incident irradiance is also depleted in those wavelengths under cloudy conditions. TARTES simulations using a range of snow physical and chemical properties indicated that 760 nm was a suitable estimate of an effective wavelength for the conditions encountered. TARTES simulations were therefore performed using the 760 nm wavelength optical properties of ice and soot.
For the 760 nm simulations, the same snow physical properties were used as for the 390 nm wavelength. Regarding impurity concentrations, the absorption spectrum of the impurities present here may be different from that of Bond and Bergstrom (2006), so a constant multiplicative factor may have to be used to adjust all soot concentrations at 760 nm. For FIELD data, it was found that this factor was 1, suggesting that most impurities present in the snow were probably soot with optical properties similar to those of Bond and Bergstrom (2006). Figure 4 indicates that bark absorptivity decreases by a factor of 0.57 between 397 and 760 nm, making it not very different to the factor for soot in this same wavelength range, which is 0.53. Given the variability in bark properties of individual trees, however (Juola et al., 2022a), the bark factor may be different in our specific case.
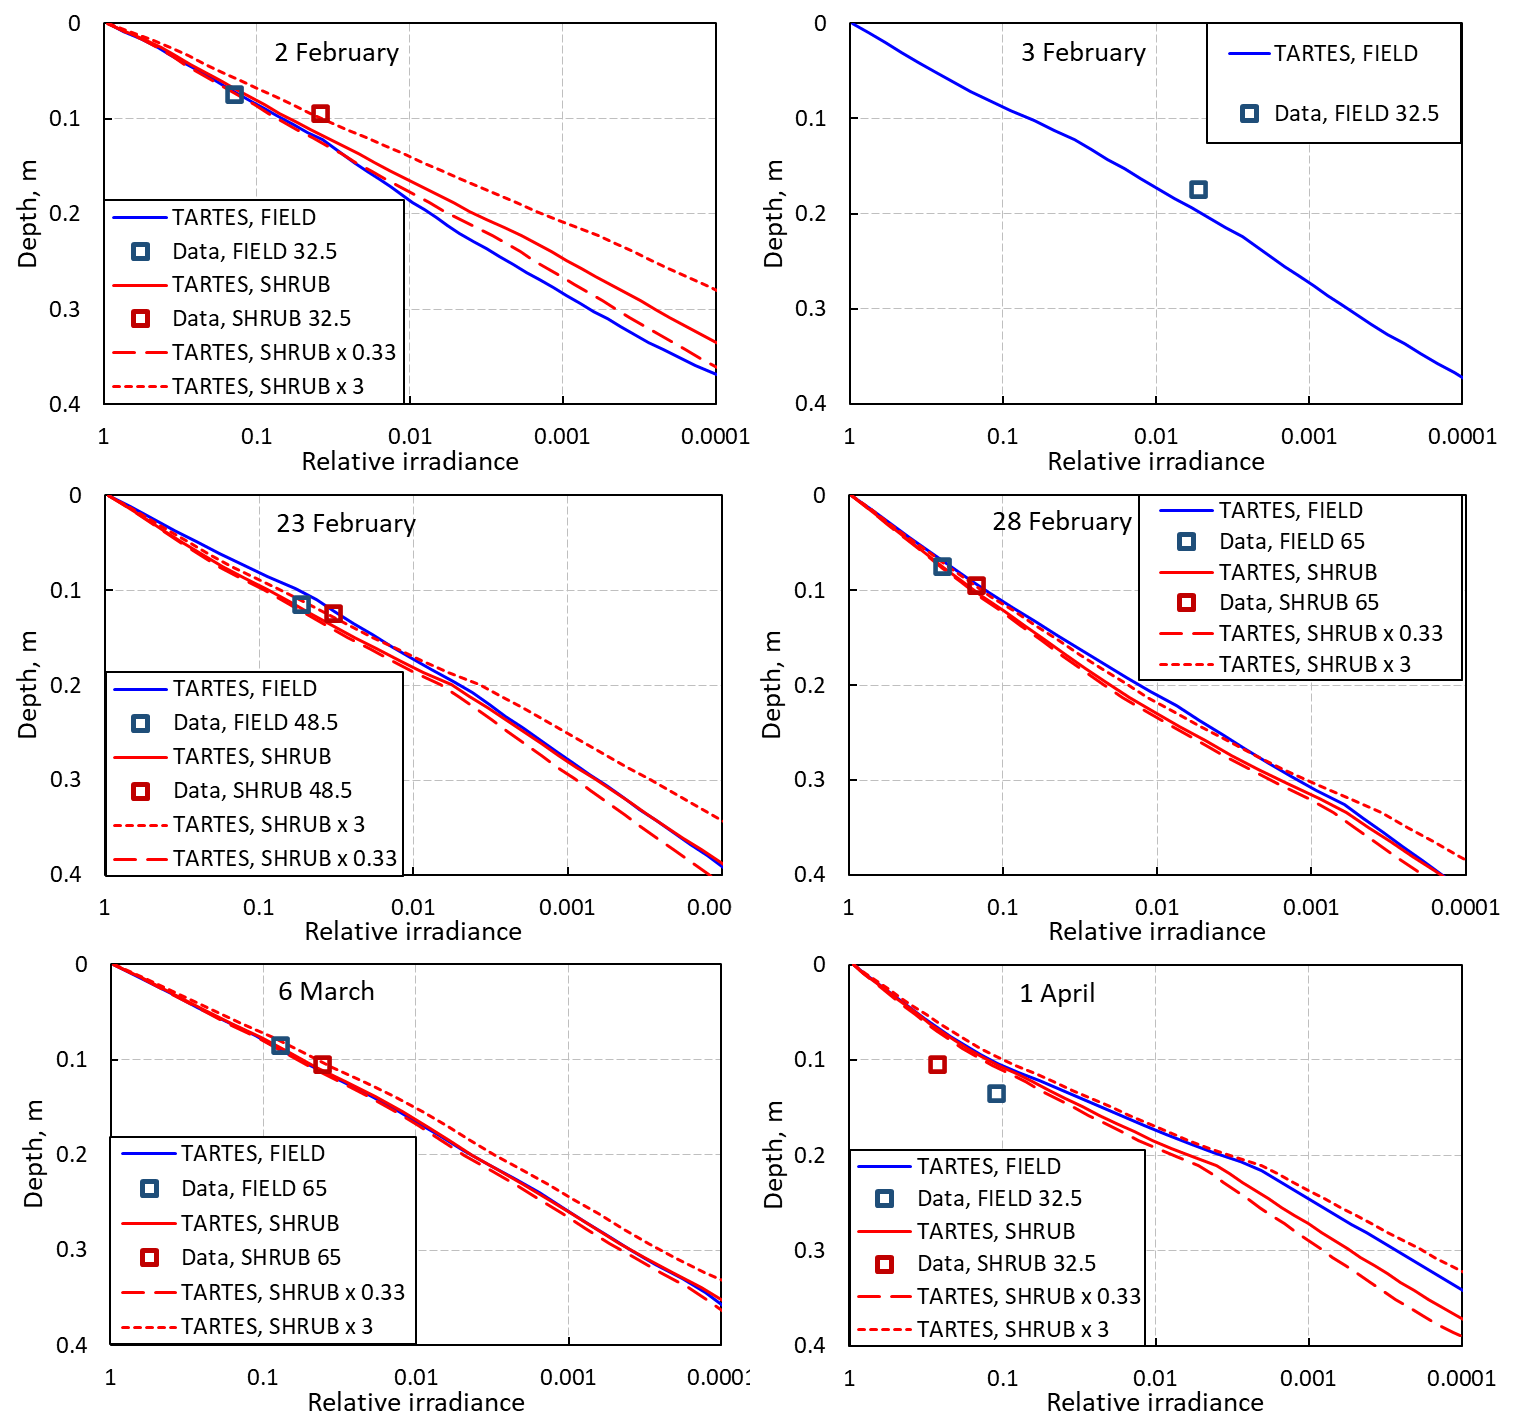
Figure 11Profiles of irradiance in the snowpack at FIELD and SHRUB at 760 nm. Experimental data points are also shown. Only the topmost sensor produced a detectable signal. Sensors levels in centimeters are indicated in the legend of each panel. For SHRUB, simulations with impurity concentrations multiplied by 0.33 and 3 are also shown.
We therefore performed simulations at 760 nm using the same soot concentrations for SHRUB as at 390 nm. To investigate the impact of bark optical properties that would vary with wavelength differently to soot, we also performed simulations with concentration multiplied by 0.33 and by 3. Results of simulations at 760 nm are shown in Fig. 11 for sensors for which there was a detectable signal. For the 3 February data, the 32.5 cm sensor was 18.5 cm below the snow surface, and its signal was below the detection limit. The corresponding curve is therefore not shown.
4.1 Snow modification by melting on 1 April
The 1 April data do not show any effect of shrub branches on irradiance, and simulations do not agree with data, while the agreement is good for all other dates. We hypothesize that the intense melting events that occurred between 9 and 26 March and on 31 March (see the rapid snow height decreases in Fig. 6) led to the formation of percolation channels that perturbed radiative transfer differently at FIELD and SHRUB. These channels form ice fingers made up of highly clustered large grains (see, e.g., Fig. 6 of Bouchard et al., 2024b), which scatter light much less than the snow used in the simulations, therefore increasing irradiance at depth. Radiative transfer then cannot be simulated using plane-parallel snow layer geometry as done here. We therefore exclude the 1 April data from subsequent analysis.
4.2 Soot equivalent of shrub branches at 390 nm
The extra extinction at SHRUB relative to FIELD is mostly due to absorption by branches and, to a much lesser extent, by different snow physical properties. By subtracting the FIELD soot values to those of SHRUB in Table 2, it appears that the soot equivalent of shrub branches at 390 nm is 125 to 145 ppb for the lower 40 cm of the snowpack. It is 10 to 85 ppb for the upper layers, with most values being in the lower part of this range. This is consistent with the positions of the sensors. The 32.5 cm sensor is in the middle of a shrub and is affected by a greater number of branches than both upper sensors, which are closer to the edge of a shrub, as illustrated in Figs. 1 and S1.
4.3 Soot equivalent of shrub branches at 760 nm
It is noteworthy that the 760 nm simulations for FIELD reproduce the data well using the values used at 390 nm without any adjustment. This supports the validity of our approach and the choice of the 760 nm wavelength as an effective wavelength. At SHRUB, Fig. 11 shows that on 23 and 28 February and on 6 March, branches affect irradiance profiles in a negligible manner and that changing the impurity concentrations by a factor of 3 has a negligible impact on irradiance at the sensors' depths. Data from those dates are from the S485 and S650 sensors, which are in low-branch-density spots. Given the short e-folding depth at 760 nm, the sensors are not affected by branches further away. Since ice is a significant absorber at 760 nm, the main absorber under these conditions is ice, and it is therefore not possible to quantify precisely the weak extra extinction caused by branches. On 2 February, on the contrary, the S325 sensor is in a high-branch-density area, and the branch impact on the absorption profile is clearly visible. The fit that best reproduces the data is that with a soot concentration multiplied by 3 (Fig. 11). This could be interpreted by a stronger absorption of bark at 760 nm than at 390 nm, contrary to the data of Fig. 4. An alternative explanation is to note that, as shown in Fig. S1, the S325 sensor has several branches within an e-folding depth at 390 nm (12.7 cm), so here branches have an important contribution to extinction. At 760 nm, the short e-folding depth (3.7 cm) implies that the signal is very sensitive to the immediate environment. It is likely that the extinction must be interpreted in terms of nearby branch density rather than just in terms of bark optical properties. In other words, while at 390 nm, data appear consistent with our hypothesis that branches can be treated as a homogeneous absorber with well-defined optical properties because the sensor then probes a large volume, this does not seem to be the case at 760 nm, where the immediate proximity of branches determines extinction more strongly than bark optical properties.
4.4 Impact of shrubs on irradiance in snow
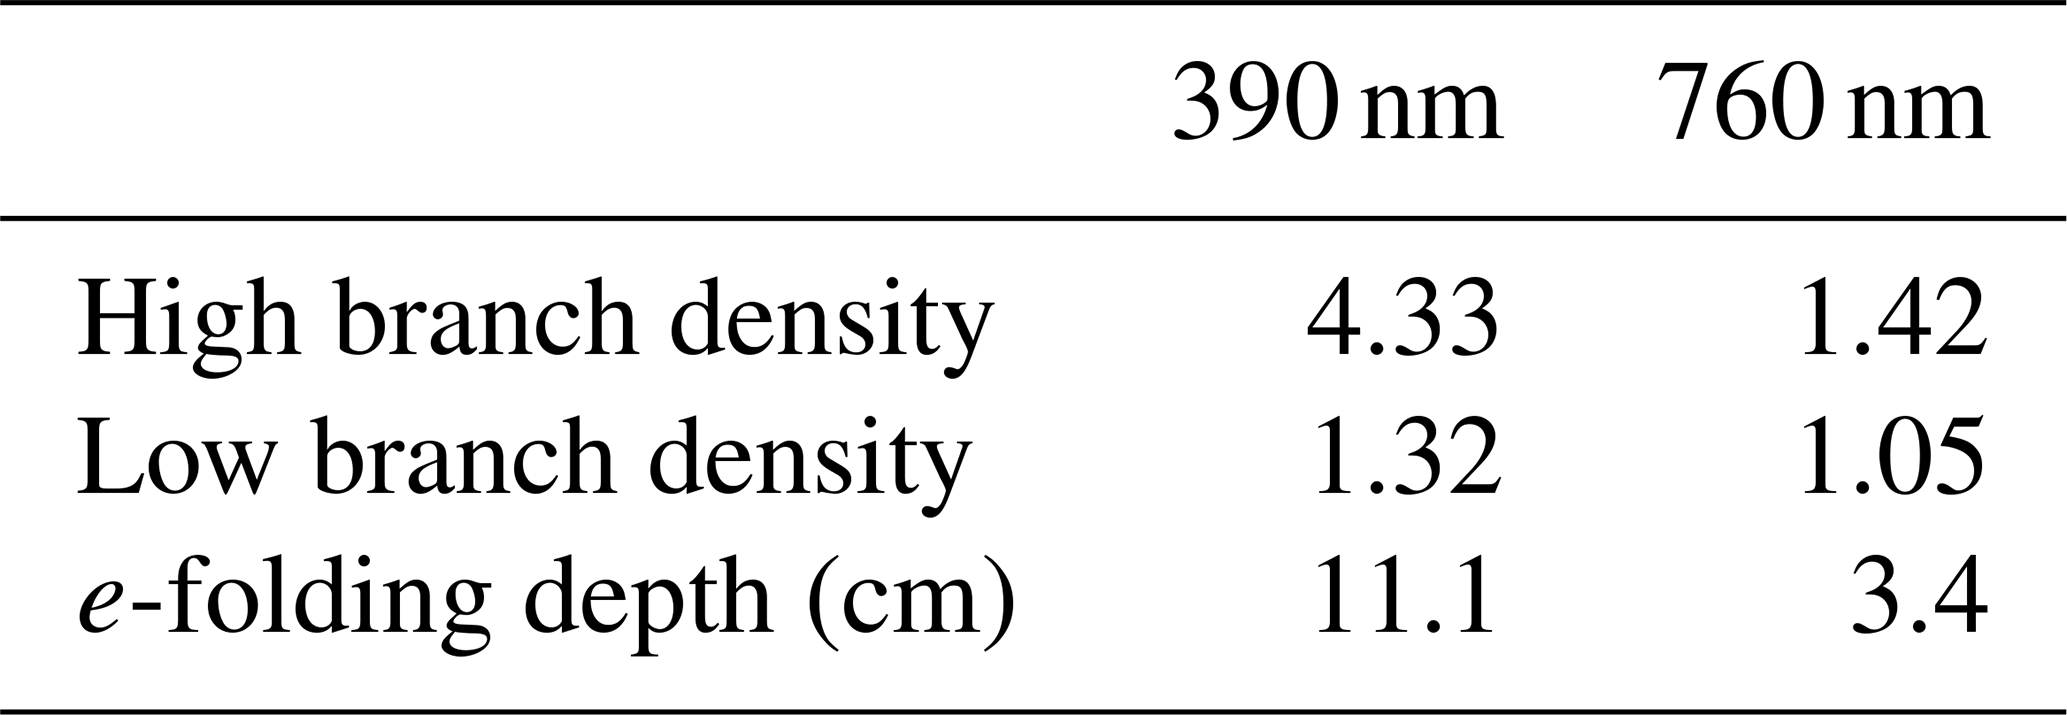
Figures 10 and 11 illustrate that irradiance decreases faster with depth at SHRUB than at FIELD. This effect is mostly due to the presence of branches but also, to a lesser extent, due to different snow physical properties. To isolate the contribution of branches, we calculate irradiance profiles at SHRUB with the same snow physical properties as at FIELD, but with the SHRUB equivalent-soot concentration. This allows us to determine the extinction caused by branches at 15 cm depth. The extinction factor for the case of high branch density was calculated with the 2 February data, while the case of low branch density was calculated with the 28 February data. Results are summed up in Table 3. The 760 nm factors were calculated assuming that the spectral dependence of bark absorption was similar to that of soot. Table 3 shows that the radiative impact of a low branch density is very limited, while a high branch density reduces irradiance at 15 cm depth by a factor a 4.33 at 390 nm, which is a high value.
Table 3Radiation attenuation factor caused in snow by branches of low (28 February data) and high (2 February data) densities at 15 cm depth. The radiation e-folding depth for the snowpack of 2 February is also indicated.
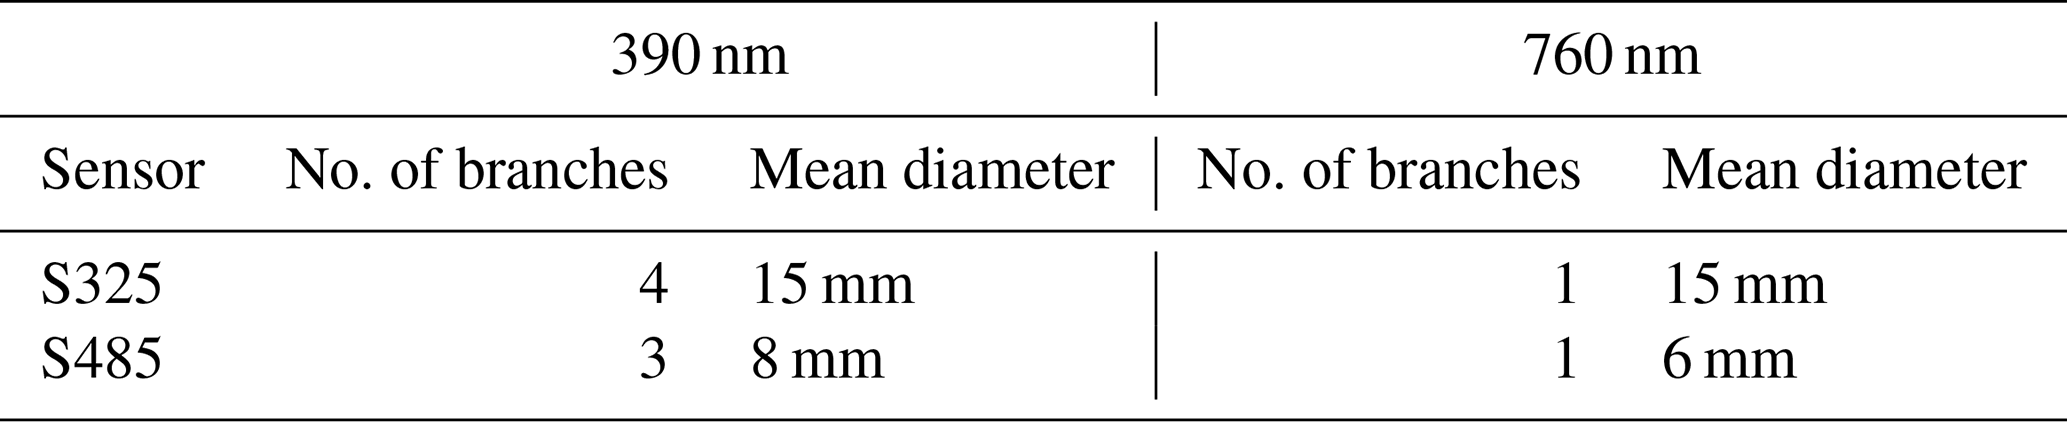
Based on photographs of the S325 and S485 sensors taken during installation (Fig. S1) and also on the data of Fig. S4, we attempt to estimate the number and mean diameter of branches within two e-folding depths of each sensor for both wavelengths studied. These estimates are reported in Table 4. A strict proportionality between branch surface area within the distance of two e-folding depths and the attenuation factors of Table 3 is not expected because a full analysis would require three-dimensional radiative transfer modeling. However, it is clear that there is a reasonable correlation between Tables 3 and 4. We can even tentatively estimate that four branches of 15 mm diameter within a distance of 22 cm from the sensor is roughly equivalent to 140 ppb of soot for the 390 nm radiation. The 760 nm data show that branches only have a local effect and that only high branch densities detectably affect 760 nm irradiance in snow.
Table 4Number of branches and their mean diameter within a radius of two e-folding depths for the S325 and S485 sensors for both wavelengths studied.
4.5 Impact of branches on snowpack photochemistry
In the Arctic, the snow height usually does not extend beyond shrub height, as often observed (Lafleur and Humphreys, 2018; Domine et al., 2016) and illustrated in Fig. S5 in the Supplement, because the trapping of wind-blown snow stops when most branches are buried. Therefore, the incident flux onto the snow surface is similar on snow with and without shrubs. Photochemical reaction rates in any medium depend on irradiance. For species of atmospheric interest, the most active spectral region is the near-UV range, where many molecules have absorption bands (Finlayson-Pitts and Pitts, 2000). The ice absorption coefficient varies little between 350 and 450 nm (Picard et al., 2016), so the data obtained here at 390 nm may be used to obtain a first estimate of the impact of shrub branches on photochemical reaction rates. By integrating the irradiance over the depth of the snowpacks, the ratios of the rates of SHRUB and FIELD have been calculated for the various snowpacks studied here. In this case, we used the different snowpack physical properties for FIELD and SHRUB of Table 2 because this difference is caused by the presence of shrubs (Domine et al., 2016). Results are shown in Table 5.
Table 5SHRUB/FIELD photolysis ratio in the snowpacks studied on five dates. Similar incident flux values are used for SHRUB and FIELD.
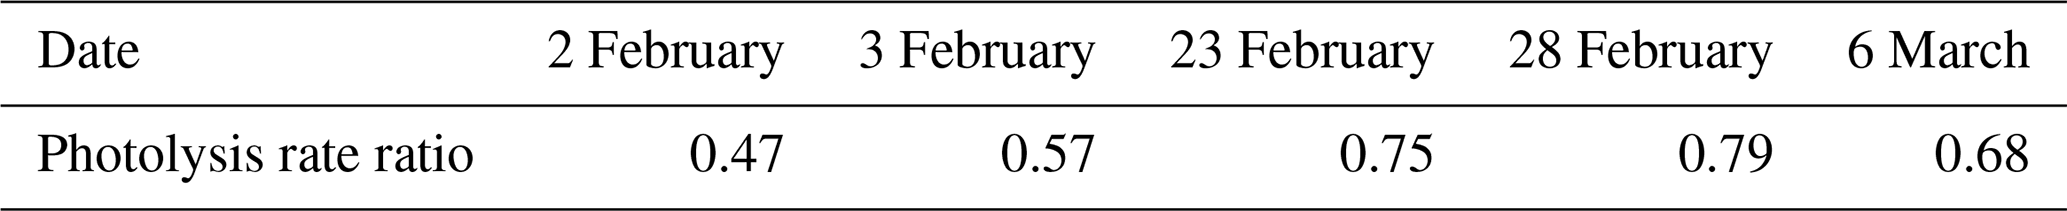
For low branch density, typical of the environment of the top sensors on 28 February, the integrated flux is reduced by just 21 %. For high branch density (2 February), the flux is reduced by a factor greater than 2. These estimates assume that branches have a radiative effect similar to homogeneous impurities such as soot, which is an assumption that requires confirmation. In the high Arctic (Domine et al., 2022) and even in the low Arctic (Belke-Brea et al., 2020), shrubs are comparatively shorter than in this study and have thinner but more numerous branches. Furthermore, shrubs there often form dense bushes whose branches overlap, increasing branch densities, while in this study, shrubs were isolated. It is therefore likely that the effect of branches on irradiance evidenced here would be at least as important, or possibly more so, in the Arctic. We therefore speculate that photolysis rates in shrub-covered areas in the Arctic may be reduced by at least 25 % to 50 %, as in Table 5, and possibly even 75 %. Furthermore, since branches are thinner and more numerous, the soot-equivalent approach used here, based on a homogeneous medium approximation, may have an improved validity. We thus suggest that irradiance in shrubs in the Arctic may be less spatially variable than observed here and that a simple large-scale treatment may be valid.
The composition of the atmospheric boundary layer in polar regions is strongly affected by snowpack photochemistry. For example, concentrations of nitrogen oxides can be up to 100 times greater than expected by models that neglect snowpack photochemistry (Davis et al., 2001; Honrath et al., 1999) because they are produced by the photolysis of the nitrate ion contained in the snowpack. These high nitrogen oxide concentrations, together with snowpack photolysis of H2O2, (France et al., 2007), increase atmospheric concentrations of the OH radical (Mauldin et al., 2004), which is the main atmospheric oxidant. Decreased integrated irradiance fluxes in the snowpack caused by shrub expansion therefore has the potential to generate major perturbations in the photochemistry of Arctic regions, in particular, by increasing the lifetime of numerous species such as organic molecules. Furthermore, changes in this chemistry may impact ozone concentrations, which are strongly affected by the concentrations of both nitrogen oxides and organic compounds (Finlayson-Pitts and Pitts, 1993). Ozone is both a potent greenhouse gas and a strong oxidant, so the impact of shrub growth on atmospheric gaseous composition is manyfold and complex, with processes contributing to ozone decrease and others to its increase. Besides gaseous concentrations, reduced snowpack photochemistry is also expected to affect the formation of secondary organic aerosols from the atmospheric oxidation of organic compounds (Hallquist et al., 2009). This will impact the number of cloud condensation nuclei (Farmer et al., 2015), cloud droplet size and thus cloud albedo (Twomey, 1977). The reduction in snow photochemical rates by shrub expansion may thus lead to numerous chemical and climatic effects that may deserve further quantification using coupled models of snow and atmospheric chemistry (Toyota et al., 2014; Zatko et al., 2016).
4.6 Impact of branches on snow metamorphism
If branches are considered a homogeneous absorber, such as soot, then branches lead to the heating of top snow layers by increasing radiation absorption. Following Colbeck (1989), this is expected to lead to the rapid growth of faceted crystals below the surface and possibly to melting. Heating is, however, localized in the vicinity of branches. Contrary to photochemistry, where the impact of shrubs can be reasonably estimated by averaging radiative effects, localized heating leads to increased local temperature gradients around branches. These can produce enhanced depth hoar formation or, if the ice melting temperature is reached, to ice formation around the branches. This has been described in Belke-Brea et al. (2021) and their Fig. 8 illustrates both depth hoar and ice formation around branches. Radiation absorption by branches may therefore significantly affect snowpack structure, and these modifications probably cannot be explained solely in terms of homogeneous radiation absorption similar to soot. Three-dimensional modeling is required to fully detail these effects on metamorphism. The results obtained here nevertheless show that since ice is much more transparent in the blue than in the red (Fig. 4), the impact of shrubs on the radiation budget will be much greater at shorter wavelengths (Table 3), so processes at these wavelengths probably deserve initial three-dimensional modeling studies.
The comparative measurements of irradiance in snow with and without shrub branches show that when a high branch density is present, shrub branches produce an irradiance attenuating effect equivalent to about 140 ppb of soot at 390 nm, with the hypothesis that branches behave as a homogeneous absorber such as soot. Such soot concentrations are those of moderately to highly polluted snow (Wang et al., 2013; Dang et al., 2017). This reduces the rate of snowpack photochemistry by about a factor of 2. This reduction in snowpack photochemistry is expected to alter the oxidative capacity of the Arctic boundary layer and influence the formation of secondary aerosols. Given the ongoing expansion of shrubs in the Arctic, this topic deserves further exploration, and coupled snow–atmosphere models may be useful for predicting shifts in Arctic atmospheric chemistry and regional climate dynamics in a warming world.
Regarding metamorphism, this study and the previous work of Belke-Brea et al. (2021) indicate that the homogeneous absorber hypothesis is probably not valid for this application. Effects of branches on metamorphism are rather caused by radiation absorption at the branch level, with local effects such as depth hoar formation or ice formation due to melting and refreezing. Shorter radiation wavelengths of around 400 nm are expected to have a stronger effect than longer wavelengths of around 700 nm because at these longer wavelengths, a significant fraction of radiation is already absorbed by ice. Further exploration of these effects requires three-dimensional modeling to accurately assess the impact of shrubs on snowpack structure.
The data used in the simulations have been reported in Table 1, Table S1 and Table S2. The TARTES web app is available at https://snow.univ-grenoble-alpes.fr/snowtartes/index (last access: 29 April 2025, Picard and Libois, 2024). The TARTES v2.0 code is available at https://doi.org/10.5281/zenodo.13950598 (Picard, 2024).
The Supplement contains Tables S1 and S2 and Figs. S1 to S5. The supplement related to this article is available online at https://doi.org/10.5194/tc-19-1757-2025-supplement.
FD and MQ designed research with input from GP. DCC and FD obtained funding. MQ, LB, BB, SJ, RL, FLD and MAV built the experimental apparatus. GP wrote the radiative transfer simulation code. BB and FLD performed the snow field measurements. SOP measured the sensors optical properties. VD performed preliminary data analysis. FD and MQ analyzed the data and wrote the paper with input from GP. LB, BB, RL, FLD, MAV and DCC commented on the paper.
At least one of the (co-)authors is a member of the editorial board of The Cryosphere. The peer-review process was guided by an independent editor, and the authors also have no other competing interests to declare.
Publisher’s note: Copernicus Publications remains neutral with regard to jurisdictional claims made in the text, published maps, institutional affiliations, or any other geographical representation in this paper. While Copernicus Publications makes every effort to include appropriate place names, the final responsibility lies with the authors.
Marie-France Gévry at Université Laval managed the Sentinel North support and provided continuous encouragements. Stéphane Boudreau kindly performed the species identification of the shrubs used in this study.
This research has been supported by the Natural Sciences and Engineering Research Council of Canada (Canada first Sentinel North program and CREATE 497040).
This paper was edited by S. McKenzie Skiles and reviewed by two anonymous referees.
Belke-Brea, M., Domine, F., Boudreau, S., Picard, G., Barrere, M., Arnaud, L., and Paradis, M.: New Allometric Equations for Arctic Shrubs and Their Application for Calculating the Albedo of Surfaces with Snow and Protruding Branches, J. Hydrometeorol., 21, 2581–2594, https://doi.org/10.1175/jhm-d-20-0012.1, 2020.
Belke-Brea, M., Domine, F., Picard, G., Barrere, M., and Arnaud, L.: On the influence of erect shrubs on the irradiance profile in snow, Biogeosciences, 18, 5851–5869, https://doi.org/10.5194/bg-18-5851-2021, 2021.
Bond, T. C. and Bergstrom, R. W.: Light absorption by carbonaceous particles: An investigative review, Aerosol Sci. Technol., 40, 27–67, https://doi.org/10.1080/02786820500421521, 2006.
Bouchard, B., Nadeau, D. F., and Domine, F.: Comparison of snowpack structure in gaps and under the canopy in a humid boreal forest, Hydrol. Process., 36, e14681, https://doi.org/10.1002/hyp.14681, 2022.
Bouchard, B., Nadeau, D. F., Domine, F., Anctil, F., Jonas, T., and Tremblay, É.: How does a warm and low-snow winter impact the snow cover dynamics in a humid and discontinuous boreal forest? Insights from observations and modeling in eastern Canada, Hydrol. Earth Syst. Sci., 28, 2745–2765, https://doi.org/10.5194/hess-28-2745-2024, 2024a.
Bouchard, B., Nadeau, D. F., Domine, F., Wever, N., Michel, A., Lehning, M., and Isabelle, P.-E.: Impact of intercepted and sub-canopy snow microstructure on snowpack response to rain-on-snow events under a boreal canopy, The Cryosphere, 18, 2783–2807, https://doi.org/10.5194/tc-18-2783-2024, 2024b.
Boudries, H., Bottenheim, J. W., Guimbaud, C., Grannas, A. M., Shepson, P. B., Houdier, S., Perrier, S., and Domine, F.: Distribution and trends of oxygenated hydrocarbons in the high Arctic derived from measurements in the atmospheric boundary layer and interstitial snow air during the ALERT2000 field campaign, Atmos. Environ., 36, 2573–2583, https://doi.org/10.1016/S1352-2310(02)00122-X, 2002.
Chylek, P., Ramaswamy, V., and Srivastava, V.: Albedo of soot-contaminated snow, J. Geophys. Res., 88, 837–843, https://doi.org/10.1029/JC088iC15p10837, 1983.
Colbeck, S. C.: Theory of metamorphism of dry snow, J. Geophys. Res., 88, 5475–5482, https://doi.org/10.1029/JC088iC09p05475, 1983.
Colbeck, S. C.: Snow-crystal growth with varying surface temperatures and radiation penetration, J. Glaciol., 35, 23–29, https://doi.org/10.3189/002214389793701536, 1989.
Dang, C., Warren, S. G., Fu, Q., Doherty, S. J., Sturm, M., and Su, J.: Measurements of light-absorbing particles in snow across the Arctic, North America, and China: Effects on surface albedo, J. Geophys. Res., 122, 10149–10168, https://doi.org/10.1002/2017jd027070, 2017.
Davis, D., Nowak, J. B., Chen, G., Buhr, M., Arimoto, R., Hogan, A., Eisele, F., Mauldin, L., Tanner, D., Shetter, R., Lefer, B., and McMurry, P.: Unexpected high levels of NO observed at South Pole, Geophys. Res. Lett., 28, 3625–3628, https://doi.org/10.1029/2000GL012584, 2001.
Dibb, J. E. and Arsenault, M.: Shouldn't snowpacks be sources of monocarboxylic acids?, Atmos. Environ., 36, 2513–2522, https://doi.org/10.1016/S1352-2310(02)00131-0, 2002.
Domine, F. and Shepson, P. B.: Air-snow interactions and atmospheric chemistry, Science, 297, 1506–1510, https://doi.org/10.1126/science.1074610, 2002.
Domine, F., Taillandier, A. S., and Simpson, W. R.: A parameterization of the specific surface area of seasonal snow for field use and for models of snowpack evolution, J. Geophys. Res., 112, F02031, https://doi.org/10.1029/2006jf000512, 2007.
Domine, F., Barrere, M., Sarrazin, D., Morin, S., and Arnaud, L.: Automatic monitoring of the effective thermal conductivity of snow in a low-Arctic shrub tundra, The Cryosphere, 9, 1265–1276, https://doi.org/10.5194/tc-9-1265-2015, 2015.
Domine, F., Barrere, M., and Morin, S.: The growth of shrubs on high Arctic tundra at Bylot Island: impact on snow physical properties and permafrost thermal regime, Biogeosciences, 13, 6471–6486, https://doi.org/10.5194/bg-13-6471-2016, 2016.
Domine, F., Fourteau, K., Picard, G., Lackner, G., Sarrazin, D., and Poirier, M.: Permafrost cooled in winter by thermal bridging through snow-covered shrub branches, Nat. Geosci., 15, 5540–5560, https://doi.org/10.1038/s41561-022-00979-2, 2022.
Farmer, D. K., Cappa, C. D., and Kreidenweis, S. M.: Atmospheric Processes and Their Controlling Influence on Cloud Condensation Nuclei Activity, Chem. Rev., 115, 4199–4217, https://doi.org/10.1021/cr5006292, 2015.
Festi, D., Schwikowski, M., Maggi, V., Oeggl, K., and Jenk, T. M.: Significant mass loss in the accumulation area of the Adamello glacier indicated by the chronology of a 46 m ice core, The Cryosphere, 15, 4135–4143, https://doi.org/10.5194/tc-15-4135-2021, 2021.
Finlayson-Pitts, B. J. and Pitts, J. N.: Atmospheric chemistry of tropospheric ozone formation – scientific and regulatory implications, J. Air Waste Manage., 43, 1091–1100, https://doi.org/10.1080/1073161X.1993.10467187, 1993.
Finlayson-Pitts, B. J. and Pitts, J. N.: CHAPTER 3 – Spectroscopy and Photochemistry: Fundamentals, in: Chemistry of the Upper and Lower Atmosphere, edited by: Finlayson-Pitts, B. J., and Pitts, J. N., Academic Press, San Diego, 43–85, https://doi.org/10.1016/B978-012257060-5/50005-8, 2000.
France, J. L., King, M. D., and Lee-Taylor, J.: Hydroxyl (OH) radical production rates in snowpacks from photolysis of hydrogen peroxide (H2O2) and nitrate (NO), Atmos. Environ., 41, 5502–5509, https://doi.org/10.1016/j.atmosenv.2007.03.056, 2007.
France, J. L., King, M. D., and Lee-Taylor, J.: The importance of considering depth-resolved photochemistry in snow: a radiative-transfer study of NO2 and OH production in Ny-Alesund (Svalbard) snowpacks, J. Glaciol., 56, 655–663, https://doi.org/10.3189/002214310793146250, 2010.
France, J. L., King, M. D., Lee-Taylor, J., Beine, H. J., Ianniello, A., Domine, F., and MacArthur, A.: Calculations of in-snow NO2 and OH radical photochemical production and photolysis rates: A field and radiative-transfer study of the optical properties of Arctic (Ny-Ålesund, Svalbard) snow, J. Geophys. Res., 116, F04013, https://doi.org/10.1029/2011jf002019, 2011a.
France, J. L., King, M. D., Frey, M. M., Erbland, J., Picard, G., Preunkert, S., MacArthur, A., and Savarino, J.: Snow optical properties at Dome C (Concordia), Antarctica; implications for snow emissions and snow chemistry of reactive nitrogen, Atmos. Chem. Phys., 11, 9787–9801, https://doi.org/10.5194/acp-11-9787-2011, 2011b.
Gallet, J.-C., Domine, F., Zender, C. S., and Picard, G.: Measurement of the specific surface area of snow using infrared reflectance in an integrating sphere at 1310 and 1550 nm, The Cryosphere, 3, 167–182, https://doi.org/10.5194/tc-3-167-2009, 2009.
Grannas, A. M., Jones, A. E., Dibb, J., Ammann, M., Anastasio, C., Beine, H. J., Bergin, M., Bottenheim, J., Boxe, C. S., Carver, G., Chen, G., Crawford, J. H., Dominé, F., Frey, M. M., Guzmán, M. I., Heard, D. E., Helmig, D., Hoffmann, M. R., Honrath, R. E., Huey, L. G., Hutterli, M., Jacobi, H. W., Klán, P., Lefer, B., McConnell, J., Plane, J., Sander, R., Savarino, J., Shepson, P. B., Simpson, W. R., Sodeau, J. R., von Glasow, R., Weller, R., Wolff, E. W., and Zhu, T.: An overview of snow photochemistry: evidence, mechanisms and impacts, Atmos. Chem. Phys., 7, 4329–4373, https://doi.org/10.5194/acp-7-4329-2007, 2007.
Hallquist, M., Wenger, J. C., Baltensperger, U., Rudich, Y., Simpson, D., Claeys, M., Dommen, J., Donahue, N. M., George, C., Goldstein, A. H., Hamilton, J. F., Herrmann, H., Hoffmann, T., Iinuma, Y., Jang, M., Jenkin, M. E., Jimenez, J. L., Kiendler-Scharr, A., Maenhaut, W., McFiggans, G., Mentel, Th. F., Monod, A., Prévôt, A. S. H., Seinfeld, J. H., Surratt, J. D., Szmigielski, R., and Wildt, J.: The formation, properties and impact of secondary organic aerosol: current and emerging issues, Atmos. Chem. Phys., 9, 5155–5236, https://doi.org/10.5194/acp-9-5155-2009, 2009.
Hansen, J. and Nazarenko, L.: Soot climate forcing via snow and ice albedos, P. Natl. Acad. Sci. USA, 101, 423–428, https://doi.org/10.1073/pnas.2237157100, 2004.
Honrath, R. E., Peterson, M. C., Guo, S., Dibb, J. E., Shepson, P. B., and Campbell, B.: Evidence of NOx production within or upon ice particles in the Greenland snowpack, Geophys. Res. Lett., 26, 695–698, https://doi.org/10.1029/1999GL900077, 1999.
Houdier, S., Perrier, S., Domine, F., Cabanes, A., Legagneux, L., Grannas, A. M., Guimbaud, C., Shepson, P. B., Boudries, H., and Bottenheim, J. W.: Acetaldehyde and acetone in the Arctic snowpack during the ALERT2000 campaign. Snowpack composition, incorporation processes and atmospheric impact, Atmos. Environ., 36, 2609–2618, https://doi.org/10.1016/S1352-2310(02)00109-7, 2002.
Ju, J. C. and Masek, J. G.: The vegetation greenness trend in Canada and US Alaska from 1984–2012 Landsat data, Remote Sens. Environ., 176, 1–16, https://doi.org/10.1016/j.rse.2016.01.001, 2016.
Juola, J., Hovi, A., and Rautiainen, M.: A spectral analysis of stem bark for boreal and temperate tree species, Ecol. Evol., 12, e8718, https://doi.org/10.1002/ece3.8718, 2022a.
Juola, J., Hovi, A., and Rautiainen, M.: A dataset of stem bark reflectance spectra for boreal and temperate tree species, V2, Mendeley Data [data set], https://doi.org/10.17632/pwfxgzz5fj.2, 2022b.
King, M. D. and Simpson, W. R.: Extinction of UV radiation in Arctic snow at Alert, Canada (82° N), J. Geophys. Res., 106, 12499–12507, https://doi.org/10.1029/2001JD900006, 2001.
Kokhanovsky, A.: Spectral reflectance of solar light from dirty snow: a simple theoretical model and its validation, The Cryosphere, 7, 1325–1331, https://doi.org/10.5194/tc-7-1325-2013, 2013.
Lafleur, P. M. and Humphreys, E. R.: Tundra shrub effects on growing season energy and carbon dioxide exchange, Environ. Res. Lett., 13, 055001, https://doi.org/10.1088/1748-9326/aab863, 2018.
Lamare, M., Domine, F., Revuelto, J., Pelletier, M., Arnaud, L., and Picard, G.: Investigating the Role of Shrub Height and Topography in Snow Accumulation on Low-Arctic Tundra using UAV-Borne Lidar, J. Hydrometeorol., 24, 835–853, https://doi.org/10.1175/JHM-D-22-0067.1, 2023.
Marsh, P., Bartlett, P., MacKay, M., Pohl, S., and Lantz, T.: Snowmelt energetics at a shrub tundra site in the western Canadian Arctic, Hydrol. Processes, 24, 3603–3620, https://doi.org/10.1002/hyp.7786, 2010.
Mauldin, R. L., Kosciuch, E., Henry, B., Eisele, F. L., Shetter, R., Lefer, B., Chen, G., Davis, D., Huey, G., and Tanner, D.: Measurements of OH, HO2 + RO2, H2SO4, and MSA at the south pole during ISCAT 2000, Atmos. Environ., 38, 5423–5437, https://doi.org/10.1016/j.atmosenv.2004.06.031, 2004.
Meyer, T. and Wania, F.: Modeling the elution of organic chemicals from a melting homogeneous snow pack, Water Res., 45, 3627–3637, https://doi.org/10.1016/j.watres.2011.04.011, 2011.
Perrier, S., Houdier, S., Domine, F., Cabanes, A., Legagneux, L., Sumner, A. L., and Shepson, P. B.: Formaldehyde in Arctic snow. Incorporation into ice particles and evolution in the snowpack, Atmos. Environ., 36, 2695–2705, https://doi.org/10.1016/S1352-2310(02)00110-3, 2002.
Picard, G.: ghislainp/tartes: v2.0 (v2.0), Zenodo [code], https://doi.org/10.5281/zenodo.13950598, 2024.
Picard, G. and Libois, Q.: Simulation of snow albedo and solar irradiance profile with the Two-streAm Radiative TransfEr in Snow (TARTES) v2.0 model, Geosci. Model Dev., 17, 8927–8953, https://doi.org/10.5194/gmd-17-8927-2024, 2024.
Picard, G., Libois, Q., and Arnaud, L.: Refinement of the ice absorption spectrum in the visible using radiance profile measurements in Antarctic snow, The Cryosphere, 10, 2655–2672, https://doi.org/10.5194/tc-10-2655-2016, 2016.
Pierre, A., Jutras, S., Smith, C., Kochendorfer, J., Fortin, V., and Anctil, F.: Evaluation of Catch Efficiency Transfer Functions for Unshielded and Single-Alter-Shielded Solid Precipitation Measurements, J. Atmos. Ocean. Tech., 36, 865–881, https://doi.org/10.1175/jtech-d-18-0112.1, 2019.
Ropars, P. and Boudreau, S.: Shrub expansion at the forest-tundra ecotone: spatial heterogeneity linked to local topography, Environ. Res. Lett., 7, 015501, https://doi.org/10.1088/1748-9326/7/1/015501, 2012.
Simpson, W. R., King, M. D., Beine, H. J., Honrath, R. E., and Zhou, X. L.: Radiation-transfer modeling of snow-pack photochemical processes during ALERT 2000, Atmos. Environ., 36, 2663–2670, https://doi.org/10.1016/s1352-2310(02)00124-3, 2002.
Sturm, M., Racine, C., and Tape, K.: Climate change – Increasing shrub abundance in the Arctic, Nature, 411, 546–547, https://doi.org/10.1038/35079180, 2001a.
Sturm, M., McFadden, J. P., Liston, G. E., Chapin, F. S., Racine, C. H., and Holmgren, J.: Snow-shrub interactions in Arctic tundra: A hypothesis with climatic implications, J. Climate, 14, 336–344, https://doi.org/10.1175/1520-0442(2001)014<0336:ssiiat>2.0.co;2, 2001b.
Sumner, A. L., Shepson, P. B., Grannas, A. M., Bottenheim, J. W., Anlauf, K. G., Worthy, D., Schroeder, W. H., Steffen, A., Domine, F., Perrier, S., and Houdier, S.: Atmospheric chemistry of formaldehyde in the Arctic troposphere at Polar Sunrise, and the influence of the snowpack, Atmos. Environ., 36, 2553–2562, 2002.
Swanson, A. L., Blake, N. J., Dibb, J. E., Albert, M. R., Blake, D. R., and Rowland, F. S.: Photochemically induced production of CH3Br, CH3I, C2H5I, ethene, and propene within surface snow at Summit, Greenland, Atmos. Environ., 36, 2671–2682, https://doi.org/10.1016/s1352-2310(02)00127-9, 2002.
Taillandier, A. S., Domine, F., Simpson, W. R., Sturm, M., and Douglas, T. A.: Rate of decrease of the specific surface area of dry snow: Isothermal and temperature gradient conditions, J. Geophys. Res., 112, F03003, https://doi.org/10.1029/2006jf000514, 2007.
Toyota, K., McConnell, J. C., Staebler, R. M., and Dastoor, A. P.: Air–snowpack exchange of bromine, ozone and mercury in the springtime Arctic simulated by the 1-D model PHANTAS – Part 1: In-snow bromine activation and its impact on ozone, Atmos. Chem. Phys., 14, 4101–4133, https://doi.org/10.5194/acp-14-4101-2014, 2014.
Twomey, S.: Influence of pollution on shortwave albedo of clouds, J. Atmos. Sci., 34, 1149–1152, https://doi.org/10.1175/1520-0469(1977)034<1149:Tiopot>2.0.Co;2, 1977.
Wang, S.: Chemistry in snow and ice: what have we learned and what can we do, in: Chemistry in the Cryosphere, edited by: Shepson, P. B. and Domine, F., World Scientific, Singapore, 291–364, https://doi.org/10.1142/12095, 2021.
Wang, X., Doherty, S. J., and Huang, J. P.: Black carbon and other light-absorbing impurities in snow across Northern China, J. Geophys. Res., 118, 1471–1492, https://doi.org/10.1029/2012jd018291, 2013.
Warren, S. G. and Brandt, R. E.: Optical constants of ice from the ultraviolet to the microwave: A revised compilation, J. Geophys. Res., 113, D14220, https://doi.org/10.1029/2007jd009744, 2008.
Warren, S. G. and Clarke, A. D.: Soot in the atmosphere and snow surface of Antarctica, J. Geophys. Res., 95, 1811–1816, 1990.
Worden, H. M., Bowman, K. W., Worden, J. R., Eldering, A., and Beer, R.: Satellite measurements of the clear-sky greenhouse effect from tropospheric ozone, Nat. Geosci., 1, 305–308, https://doi.org/10.1038/ngeo182, 2008.
Zatko, M., Erbland, J., Savarino, J., Geng, L., Easley, L., Schauer, A., Bates, T., Quinn, P. K., Light, B., Morison, D., Osthoff, H. D., Lyman, S., Neff, W., Yuan, B., and Alexander, B.: The magnitude of the snow-sourced reactive nitrogen flux to the boundary layer in the Uintah Basin, Utah, USA, Atmos. Chem. Phys., 16, 13837–13851, https://doi.org/10.5194/acp-16-13837-2016, 2016.