the Creative Commons Attribution 4.0 License.
the Creative Commons Attribution 4.0 License.
 | 06 Mar 2025
A comparison of supraglacial meltwater features throughout contrasting melt seasons: southwest Greenland
Emily Glen
Amber Leeson
Alison F. Banwell
Jennifer Maddalena
Diarmuid Corr
Olivia Atkins
Brice Noël
Malcolm McMillan
Over recent decades, the Greenland Ice Sheet (GrIS) has lost mass through increased melting and solid ice discharge into the ocean. Surface meltwater features such as supraglacial lakes (SGLs), channels and slush are becoming more abundant as a result of the former and are implicated as a control on the latter when they drain. It is not yet clear, however, how these different surface hydrological features will respond to future climate changes, and it is likely that GrIS surface melting will continue to increase as the Arctic warms. Here, we use Sentinel-2 and Landsat 8 optical satellite imagery to compare the distribution and evolution of meltwater features (SGLs, channels, slush) in the Russell–Leverett glacier catchment, southwest Greenland, in relatively high (2019) and low (2018) melt years. We show that (1) supraglacial meltwater covers a greater area and extends further inland to higher elevations in 2019 than in 2018; (2) slush – generally disregarded in previous Greenland surface hydrology studies – is far more widespread in 2019 than in 2018; (3) the supraglacial channel system is more interconnected in 2019 than in 2018; (4) a greater number and larger total area of SGLs drained in 2019, although draining SGLs were, on average, deeper and more voluminous in 2018; (5) small SGLs (≤0.0495 km2) – typically disregarded in previous studies – form and drain in both melt years, although this behaviour is more prevalent in 2019; and (6) a greater proportion of SGLs refroze in 2018 compared to 2019. This analysis provides new insight into how the ice sheet responds to significant melt events, and how a changing climate may impact meltwater feature characteristics, SGL behaviour and ice dynamics in the future.
- Article
(5002 KB) - Full-text XML
-
Supplement
(8136 KB) - BibTeX
- EndNote


Over recent decades, the Greenland Ice Sheet (GrIS) has undergone substantial mass loss, totalling 4 892 ± 457 Gt of ice from 1992 to 2020 (Otosaka et al., 2023). This mass loss has arisen through a reduction in surface mass balance (SMB), as well as dynamic factors, with meltwater runoff now being the main contributor to ice loss (Mouginot et al., 2019; van den Broeke et al., 2016; The IMBIE Team, 2020; Hanna et al., 2024). Increased surface melt, driven by atmospheric warming, causes a direct reduction in mass through surface runoff. Since the early 1990s, the GrIS has experienced a total mean summer temperature increase of ∼1.7 °C (Hanna et al., 2021), with a commensurate increase in surface meltwater production through an increase in melt extent as well as enhanced local melt rates (van As et al., 2012; Hall et al., 2013), and surface runoff has risen by 33 %–50 % since the early 2000s (Trusel et al., 2018). Surface melting on the GrIS has migrated to higher elevations since 2000 (Gledhill and Williamson, 2018), and meltwater features, including supraglacial lakes (SGLs), channels and slush, have also migrated inland (Howat et al., 2013; Tedstone and Machguth, 2022). This trend is expected to continue as the climate warms further – temperatures are predicted to increase by up to 6.6 °C by 2100 (Hanna et al., 2021) – with models suggesting that, relative to the period 2000–2010, meltwater features on the GrIS will extend 110 km further inland by 2060 under extreme warming and emission scenarios (Leeson et al., 2015).
Supraglacial melt on the GrIS can create meltwater features by ponding in SGLs, flowing in channels, and saturating snow and firn to create supraglacial slush. SGLs generally form in late spring or early summer, enlarging in area and depth throughout the melt season as they accumulate water (McMillan et al., 2007; Sneed and Hamilton, 2007; Selmes et al., 2011). SGLs can drain rapidly in hours by hydrofracture (Das et al., 2008; Doyle et al., 2013; Williamson et al., 2018a), slowly in days to weeks via channel incision and overflow (Hoffman et al., 2011; Tedesco et al., 2013), become buried in snow and then persist into winter (Benedek and Willis, 2021; Dunmire et al., 2021), or refreeze at the end of the melt season (Selmes et al., 2013). Moulins, often created by SGL hydrofracture events (e.g. Das et al., 2008; Tedesco et al., 2013), allow supraglacial meltwater to access the ice sheet base, where the location and timing of meltwater injection can modulate ice flow (Zwally et al., 2002; Bartholomew et al., 2010, 2012; Hoffman et al., 2011; Sole et al., 2011; Nienow et al., 2017). Once moulins have opened, they may act as surface–bed connections for the remainder of the melt season, enabling meltwater to impact ice dynamics over monthly-to-seasonal timescales (Joughin et al., 2008; Banwell et al., 2013, 2016; Hoffman et al., 2018). Supraglacial channel systems are the main way in which surface meltwater is transported as runoff across the southwest GrIS (Yang et al., 2015). Supraglacial channels may direct meltwater towards moulins and crevasses, where meltwater can access the ice sheet base and influence ice velocity (Bartholomew et al., 2010, 2012; Nienow et al., 2017), or channels can transport meltwater directly off the ice sheet and into the ocean (Yang et al., 2019a). Meltwater can also travel laterally across the ice sheet surface through slush fields, which are features that have been identified on the ice sheet as early as the 1950s (Holmes, 1955). Slush fields can initiate or reopen supraglacial channel routes (Miller et al., 2018, 2020; Clerx et al., 2022; Machguth et al., 2023). Refrozen slush and SGLs can create low-permeability ice slabs, which inhibits water storage in the underlying firn and, in turn, increases ice-surface runoff and ultimately contributes to global sea level rise (MacFerrin et al., 2019; Tedstone and Machguth, 2022).
As meltwater runoff is the main contributor to GrIS mass loss (The IMBIE Team, 2020; Otosaka et al., 2023), the distribution of supraglacial meltwater on Greenland has been the focus of several modelling (e.g. Banwell et al., 2012; Leeson et al., 2012; Arnold et al., 2014) and remote-sensing (e.g. Yang and Smith, 2013; McMillan et al., 2007; Selmes et al., 2011; Williamson et al., 2017, 2018a; Miles et al., 2017; Yang et al., 2021; Lu et al., 2021; Turton et al., 2021; Rawlins et al., 2023; Zhang et al., 2023) studies. Previously, the characteristics and behaviour of medium to large SGLs (defined as >0.0495 km2, where this value was inferred to correspond to the minimum lake size required to fracture to the ice-sheet bed; Krawczynski et al., 2009) have been studied in single melt seasons (e.g. Williamson et al., 2017, 2018a; Miles et al., 2017). Although several multi-seasonal studies have been conducted, they have often been limited by coarse-spatial-resolution data and hence have ignored small SGLs (≤0.0495 km2) (e.g. Selmes et al., 2013; Fitzpatrick et al., 2014). This approach has often been justified by the understanding that larger volumes of water are needed to hydrofracture through ice a kilometre or so thick (Krawczynski et al., 2009). However, since small SGLs tend to form at the ice margin where the ice is thinner, it is possible that small SGLs may trigger hydrofractures and perturb ice dynamics in marginal areas (Williamson et al., 2018a).
Supraglacial meltwater on the GrIS exists in different forms, and previous remote-sensing studies have predominantly focussed on SGLs, channels and slush as separate entities (e.g. Box and Ski, 2007; Selmes et al., 2011; Williamson et al., 2017; Yang and Smith, 2012; Sundal et al., 2009; Smith et al., 2015; Greuell and Knap, 2000; Machguth et al., 2023; Tedstone and Machguth, 2022). Although there have been a handful of studies that have focussed on mapping and analysing the supraglacial hydrological system as a whole (e.g. Rawlins et al., 2023; Zhang et al., 2023; Yang et al., 2021), the vertical drainage of meltwater features through the ice sheet via hydrofracture was not considered. Likewise, some studies included buried lakes (e.g. Dunmire et al., 2021; Miles et al., 2017), although supraglacial slush features were ignored. Despite recent research, little is known about how the distribution of all forms of supraglacial meltwater features, including SGLs, slush and channels, differs as a whole system across fine spatial and temporal scales, as well as how this varies between high and low melt years.
Since the distribution and dynamics of supraglacial meltwater has a profound influence on the mechanisms contributing to mass loss from the GrIS, it is important to understand its evolution and distribution, especially since high melt years – presumably more conducive to surface melt and meltwater ponding – are becoming more frequent as the climate warms. In this study, we compare the distribution, evolution and morphology of all supraglacial meltwater features in the Russell–Leverett glacier catchment, southwest Greenland, in the low melt year of 2018 to the relatively high melt year of 2019. We delineate SGL, slush and channel features using a variety of normalised difference water index (NDWI) thresholding methods tailored to each meltwater feature and applied to both Landsat 8 and Sentinel-2 optical satellite imagery. Our dataset includes small (i.e. SGLs >0.0018 and ≤0.0495 km2) and shallow (i.e. slush) meltwater features, which are important but have been overlooked in previous mapping studies, as well as the previously more commonly included large SGLs (i.e. >0.0495 km2) and channels (i.e. linear meltwater features >1000 m long). We also compare the drainage dynamics and hypsometry of SGLs and partition SGLs into those that drain versus those that refreeze in the low and high melt seasons. Together, these data provide new insights into how a warming climate – where high melt years become the norm – may influence the spatial and temporal distribution of supraglacial meltwater features and the drainage dynamics of SGLs.
2.1 Study area
We focus on a ∼5800 km2 area of southwest Greenland: the Russell and Leverett glacier catchment (Fig. 1, orange star). The surface drainage catchment is derived from the digital elevation model, ArcticDEM version 3 (Porter et al., 2018), at 1 km resolution. The catchment is land-terminating, and meltwater is transported from the ice sheet margin oceanward by both Watson and Isortoq proglacial rivers. The study area is well-known for prevalent supraglacial hydrology features including SGLs, channels and moulins (e.g. Bartholomew et al., 2010; Sundal et al., 2009; Smith et al., 2015; Fitzpatrick et al., 2014; Yang et al., 2021).
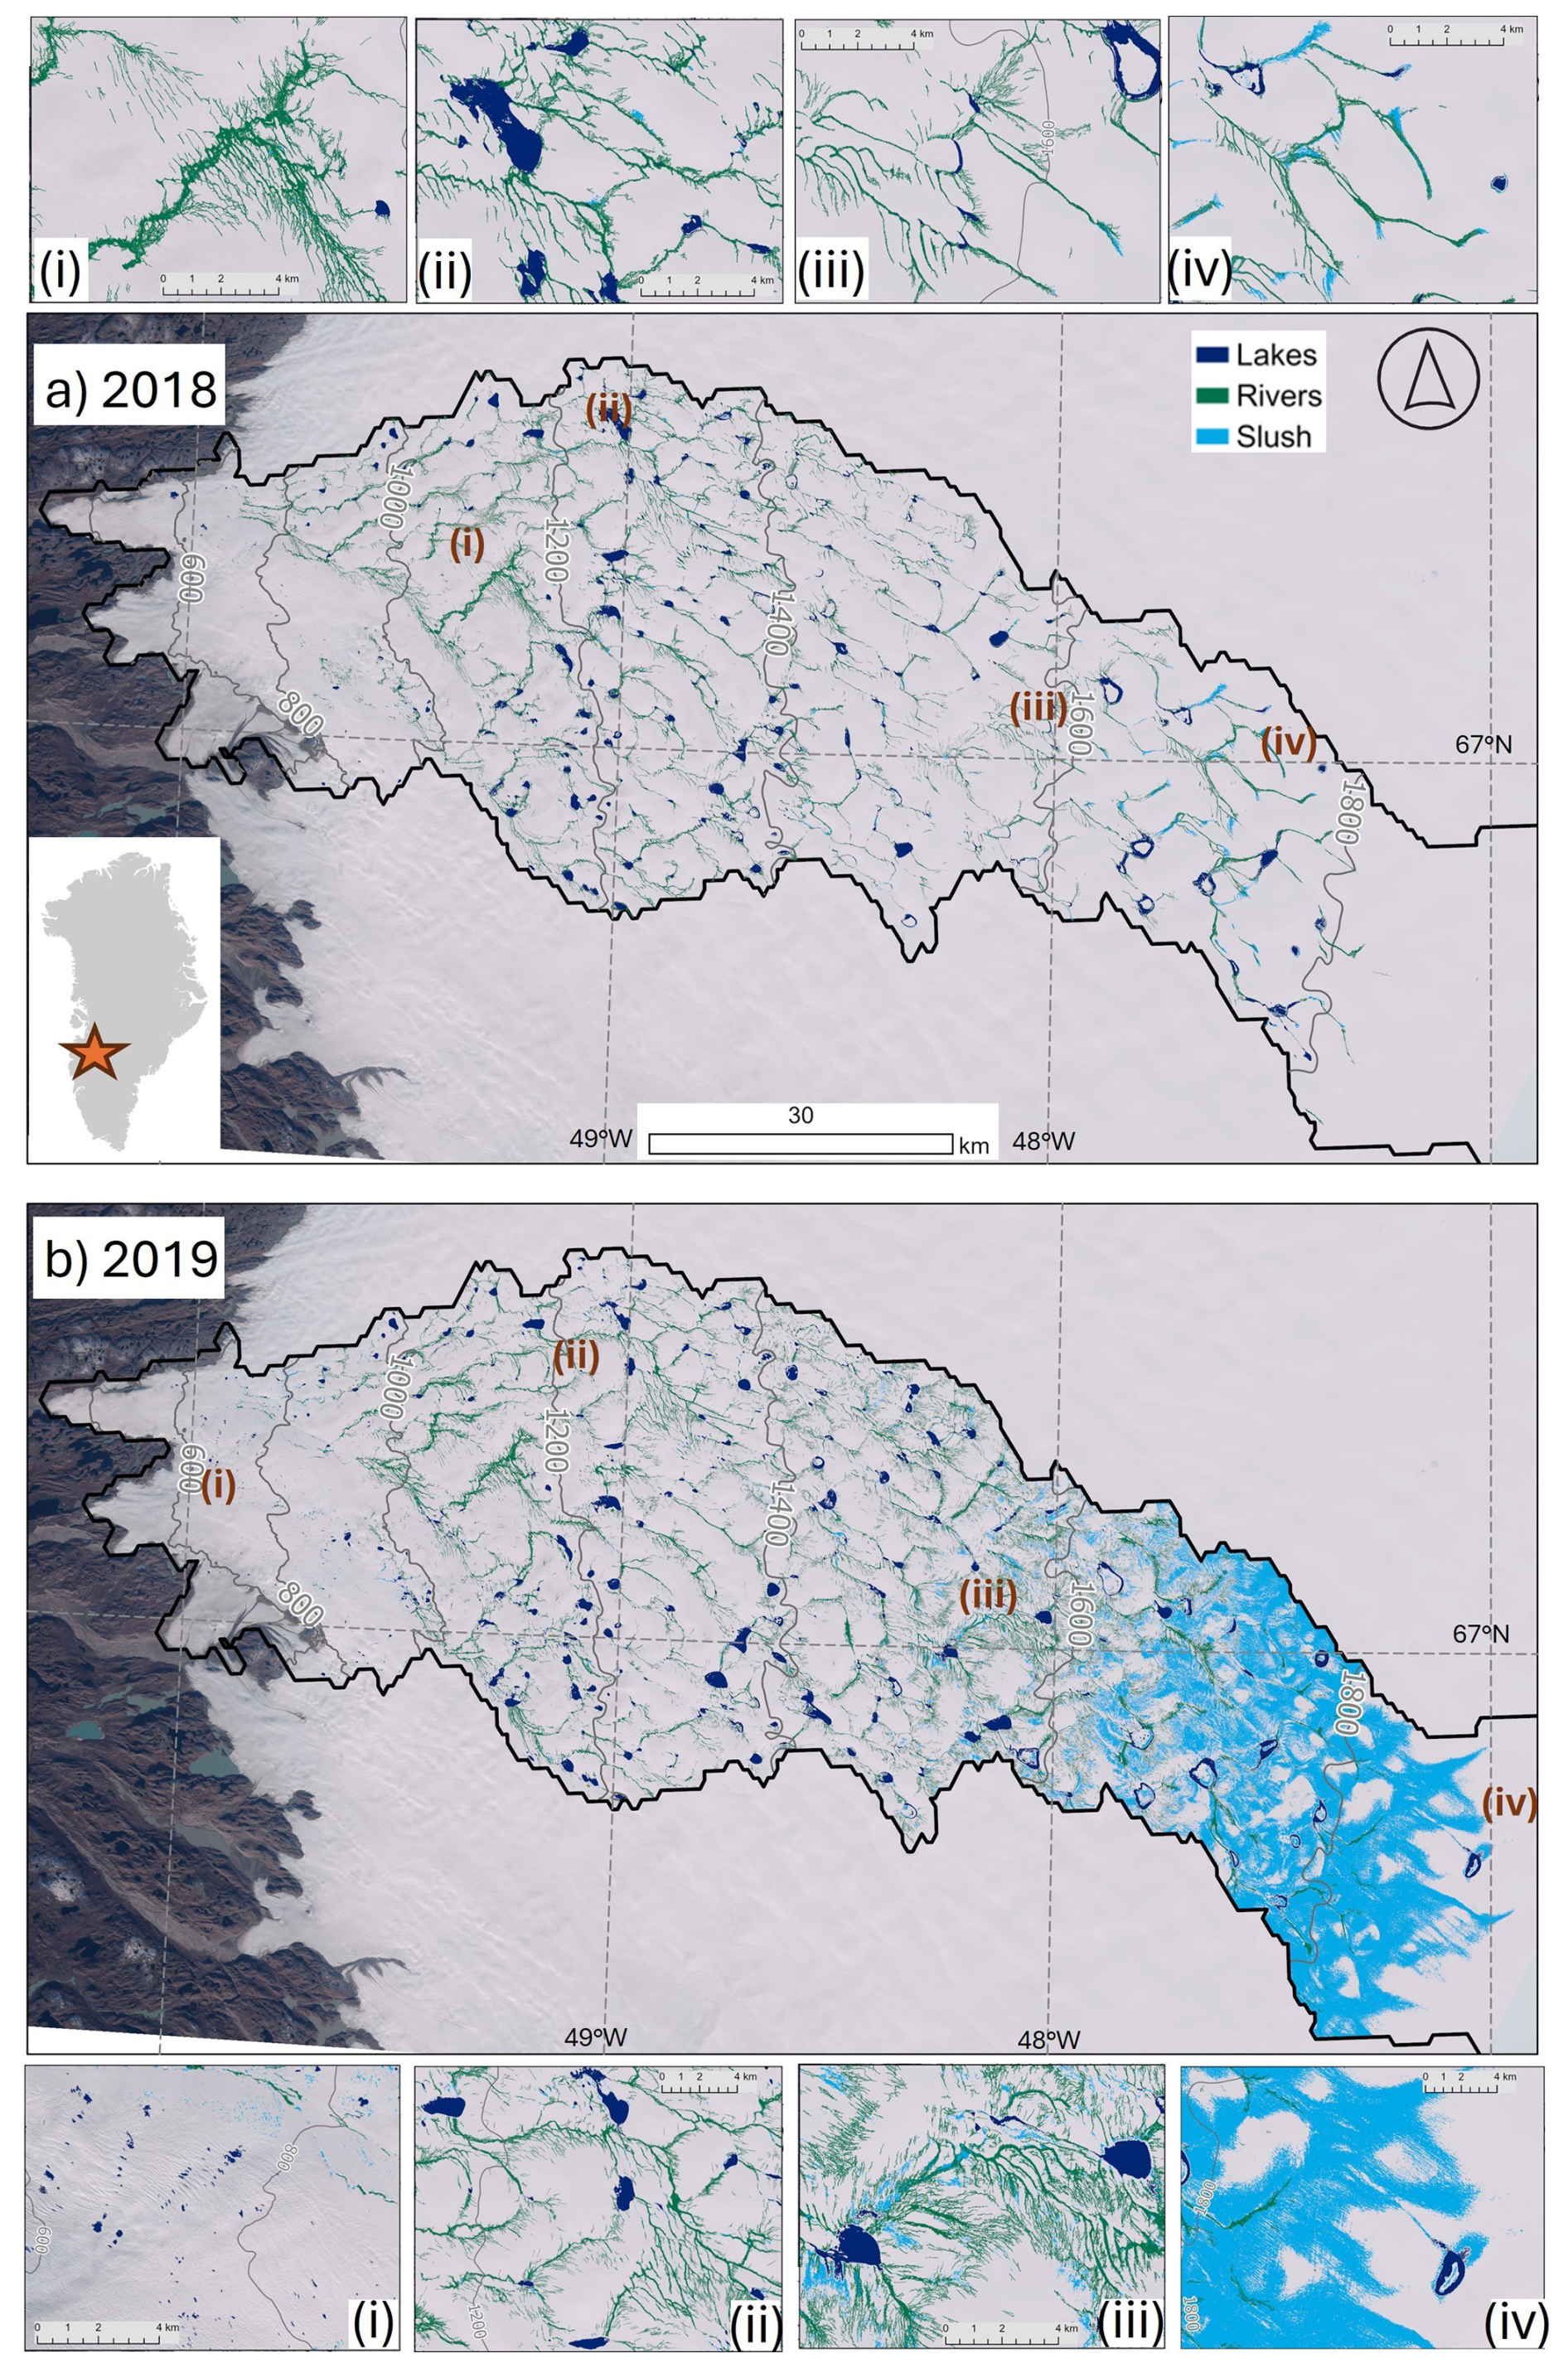
Figure 1Maximum areal extent of all supraglacial meltwater features in (a) 2018 and (b) 2019 within the Russell–Leverett glacier catchment derived from ArcticDEM (black outline). Slush is light blue, channels are green, and SGLs are dark blue. Elevation contours from ArcticDEM are shown in grey (m a.s.l.). Background is a true-colour Sentinel-2 image acquired on 26 September 2019. The inset depicts the location of the catchment within the southwest GrIS. Panel (ai) depicts a supraglacial channel system, (aii) shows SGLs linked with channels, (aiii) is an example of underdeveloped SGLs in the ∼1600 m a.s.l. region of the catchment, and (aiv) depicts slush and channels in the percolation zone (∼1700 m a.s.l.). Panel (bi) shows small SGLs close to the margins of the catchment; (bii) highlights interconnected channels and SGLs; (biii) shows interconnected SGLs, channel and slush; and (biv) depicts high-elevation (∼1900 m) slush and channels and the highest-elevation SGL (1880 m) in our 2019 dataset.
2.2 Study years
We focus on two GrIS melt seasons: the relatively low melt year of 2018 and the relatively high melt year of 2019. The 2018 melt season was anomalously cold ice-sheet-wide, with a summer temperature anomaly of −1.5 °C relative to the 2002–2016 mean (Sasgen et al., 2020; Tedesco and Fettweis, 2020). The maximum daily extent of supraglacial melt in 2018 reached 44 % of the total ice sheet area, only slightly above the 1981–2010 mean of 40 % (Tedesco et al., 2019). In contrast to the 2018 melt season, the 2019 melt season was exceptionally warm, with some regions on the ice sheet reaching a summer mean temperature anomaly of +1.5 °C relative to 2002–2016 (Sasgen et al., 2020; Tedesco and Fettweis, 2020). The maximum daily extent of supraglacial melt in 2019 reached 60 % of the total ice sheet area, greatly exceeding the 1981–2010 mean of 40 % (Tedesco et al., 2018).
2.3 Satellite imagery and pre-processing
All available imagery from both the Landsat 8 Operational Land Imager (hereafter “L8”) and the Sentinel-2 MultiSpectral Instrument (hereafter “S2”) sensors was acquired from 1 May to 30 September for both 2018 and 2019 melt seasons (Table S1 in the Supplement). We initially limited the cloud cover to <50 % based on the image metadata. However, after manual inspection, it appeared that some white ice and/or snow was misclassified as cloud. Therefore, we manually checked all available images and included misclassified images (labelled with >50 % cloud cover) in our dataset. Images with a sun angle <20° were discarded due to difficulties in accurately differentiating meltwater features from adjacent features under these conditions (Halberstadt et al., 2020). A total of 10 L8 images and 18 S2 images were used for 2018, and 16 L8 and 63 S2 images were used for 2019, corresponding to a mean temporal sampling of ∼5 and ∼2 d in 2018 and 2019, respectively.
L8 data were downloaded as Level-1T geometrically and radiometrically calibrated images in the form of digital numbers. The L8 Level-1T data were converted to top-of-atmosphere (TOA) reflectance using individual image metadata and equations provided in the Landsat 8 Data Users Handbook (USGS, 2019). L8 bands 2 (blue), 3 (green), 4 (red) and 5 (NIR), which have a spatial resolution of 30 m, were pan-sharpened to a 15 m resolution using intensity hue saturation methods (Rahmani et al., 2010) to better match the 10 m resolution of S2 data. L8's bands 6 (SWIR, short-wave infrared) and 10 (thermal infrared), which have a spatial resolution of 30 and 100 m, respectively, were resampled using nearest-neighbour interpolation. S2 data were downloaded as Level-1C orthorectified TOA reflectance products with sub-pixel multispectral registration. S2 bands 1 (coastal aerosol) and 11 (SWIR) have a spatial resolution of 60 and 20 m, respectively, and so were resampled using nearest-neighbour interpolation to match the finer (10 m) resolution of bands 2 (blue), 3 (green), 4 (red) and 8 (NIR).
2.4 Image masking
Prior to meltwater delineation, rock and cloud masks are created and applied to each L8 and S2 image to reduce classification errors using methods by Corr et al. (2022), which are summarised here and in Fig. 2, where all threshold values are also stated. The addition of masks allowed for better separation between deep meltwater features, rocks, clouds and shaded snow areas. For L8 images, rock masks were created using the thermal infrared band, blue band and red band. For S2 imagery, rock masks were created by applying the normalised difference snow index (NDSI), created by Hall et al. (1995), as well as additional blue and green filters, which were applied separately, to remove snow and clouds. Clouds were masked from L8 imagery using the NDSI, short-wave infrared (SWIR) band and blue band. Clouds were masked in S2 imagery using the SWIR band, SWIR–cirrus band and blue band. We took the threshold values for these masks directly from Corr et al. (2022; Fig. 2).
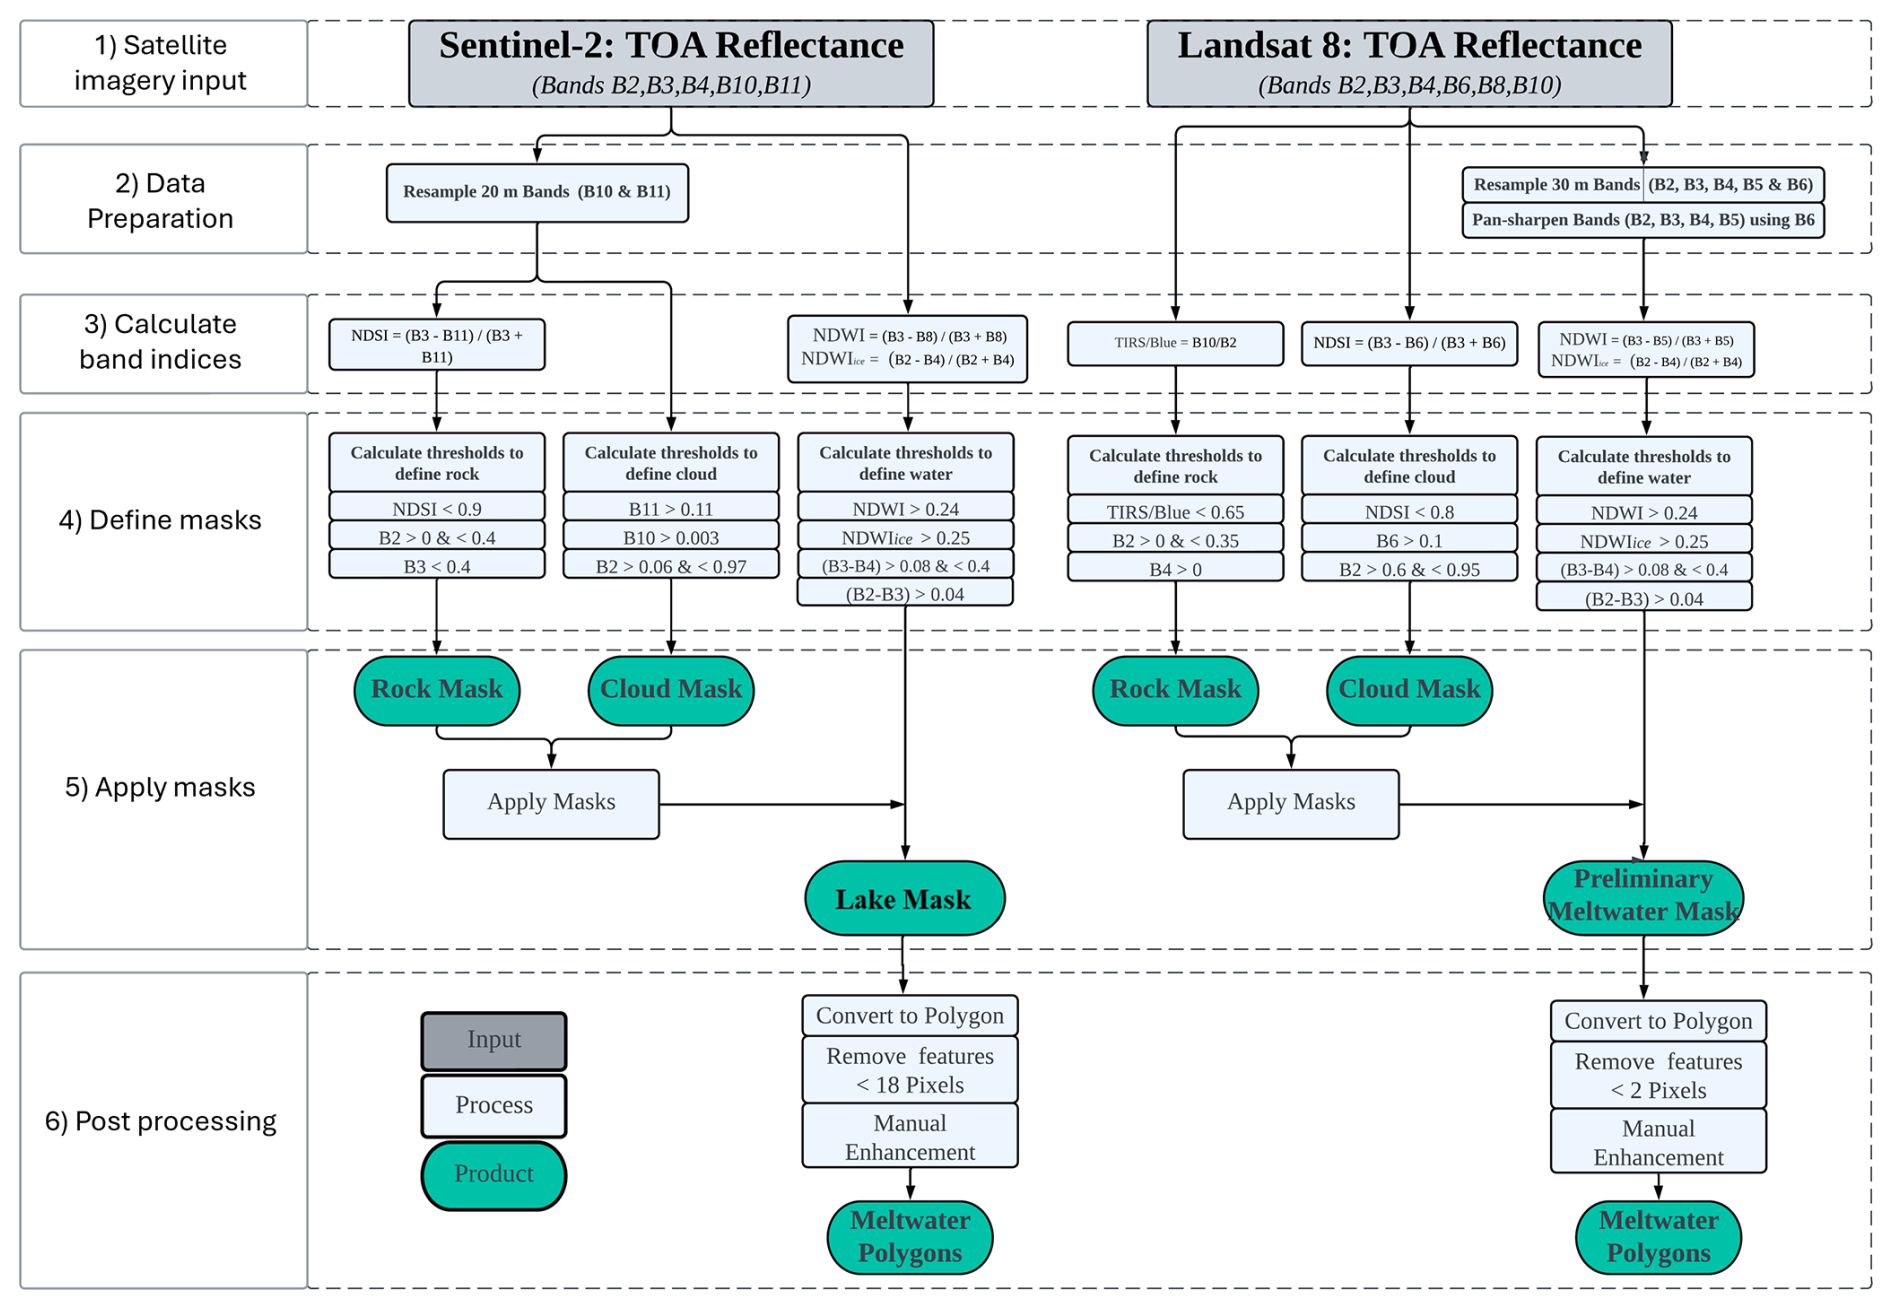
Figure 2Workflow of SGL delineation by NDWI thresholding and additional filtering on Sentinel-2 (left) and Landsat 8 (right) image scenes, following methods adapted from Corr et al. (2022). Top-of-atmosphere (TOA) reflectance values are used as input. Normalised difference snow index (NDSI), normalised difference water index (NDWI), NDWI adapted for ice (NDWI_ice) and additional band (B) combinations are used to mask imagery and define meltwater. The wavelengths of each numbered band are taken from the Sentinel-2 User Handbook and Landsat 8 Data User Handbook (see “Data availability” section).
2.5 Supraglacial lake delineation
We delineate SGLs from the masked L8 and S2 imagery following Corr et al. (2022) (Fig. 2). We apply the NDWI calculated from the ratio of green and NIR wavelengths (McFeeters, 1996), in addition to the NDWI adapted for ice (NDWI_ice), which utilises the ratio of blue and red wavelengths and better accounts for the supraglacial conditions of the GrIS (Yang and Smith, 2013). For both L8 and S2 imagery, NDWI values >0.24 and NDWI_ice values >0.25 were classified as water pixels, with all other pixels designated as not water (Fig. 2). Our chosen threshold values are in line with those from previous studies, which typically lie between 0.15 and 0.30 (e.g. Williamson et al., 2018a, b; Miles et al., 2017; Bell et al., 2017; Stokes et al., 2019; Yang and Smith, 2013). For both L8 and S2 imagery, after application of the NDWI and NDWI_ice, we implemented two further threshold values to better distinguish meltwater features from surrounding ice and/or snow: the green band subtracted by the red band, and the green band subtracted by the blue band, again using the values from Corr et al. (2022) (Fig. 2).
After SGLs had been delineated, binary lake/non-lake masks were created from all L8 and S2 scenes. In line with similar studies undertaken in Antarctica (Stokes et al., 2019; Dell et al., 2020; Langley et al., 2016), SGLs ≤0.0018 km2 (≤2 L8 and ≤18 S2 image pixels) were removed from the binary meltwater images to reduce misclassification errors. The same area threshold was used for both L8 and S2, despite these sensors' different resolutions, in order to maintain consistency in the processing of data from both sensors. In our study, “small lakes” are defined as SGLs >0.0018 and ≤0.0495 km2. The final stage of SGL delineation was to convert binary meltwater images to polygon features.
2.6 Supraglacial slush delineation
Before delineating slush, we first applied rock, cloud and SGL masks to each individual L8 and S2 image. As our preliminary analysis indicated that crevasses were often confused as slush, in line with findings of Rawlins et al. (2023), we applied a crevasse mask (Chudley et al., 2021). Having applied this mask, we delineated slush using methods adapted from Bell et al. (2017) and Yang and Smith (2013). Whereas Bell et al. (2017) and Yang and Smith (2013) used just a single NDWI threshold, we used two separate NDWI and NDWI_ice thresholds to identify shallow water and slush, which is consistent with our SGL identification method (Corr et al., 2022) (Sect. 2.5). In our study, we found that using these two separate thresholds (>0.14 and >0.15 for the NDWI and NDWI_ice, respectively) optimised slush identification while minimising misclassifications with other meltwater features. These thresholds were determined through iterative testing against true-colour images, evaluating a range of potential values (from 0.1 to 0.2 in increments of 0.01). The iterative process involved visually comparing the classified slush areas with their appearance in true-colour images, allowing us to identify thresholds that best matched the observed spatial extent of slush. Binary slush masks were then created and converted to polygon features for analysis.
2.7 Supraglacial channel delineation
Supraglacial channels have different physical and spectral characteristics from SGLs, and thus we delineated channels using channel-specific methods developed by Yang et al. (2015). We extracted channels based on their Gaussian-like cross-sections and longitudinal open-channel morphometry. All meltwater features were first enhanced by calculating the NDWI for the image. A bandpass filter, which is ramped between and m−1 (Yang et al., 2015), was then applied to remove low-frequency background and high-frequency noise. This was followed by applying Gabor filtering to amplify the cross-section of small channels with widths <2 pixels. A path-opening operator (with a minimum length of 20 pixels) was then implemented to produce better channel connectivity. We then removed any features <1000 m in length to reduce classification uncertainties. To account for variations in environmental conditions across the different tiles, a pixel brightness threshold of 5 for lower-elevation (“_T22WEV_”) S2 tiles and all L8 tiles and 10 for higher-elevation (“_T22WFV_”) S2 tiles (Table S1) out of 255 was then used to extract the channels (Lu et al., 2021; Rawlins et al., 2023). We again tested threshold values in our study against true-colour images to optimise channel delineation in select tiles, a process consistent with approaches in other studies where thresholds are manually adjusted to ensure consistent feature extraction (e.g. Zhang et al., 2023). Masks were then applied to remove all features (rock, cloud, SGL, slush, crevasse) not related to channels before delineated channel features were polygonised.
2.8 Post-processing meltwater feature polygons
To account for the detection of false positives and/or negatives in the polygon features, manual enhancement was undertaken for all image acquisitions used in the study by comparing the appearance of supraglacial meltwater on true-colour composite images. Polygons which incorrectly identified supraglacial meltwater were manually removed, and undetected meltwater features such as deep SGL centres and narrow channels were manually added.
To calculate meltwater feature statistics from each meltwater feature polygon, the mean elevation of each individual waterbody polygon was extracted from ArcticDEM at a 100 m spatial resolution (Porter et al., 2018). Mean ice thickness values for every meltwater feature were extracted from BedMachine Greenland v4 at a 150 m spatial resolution (Morlighem et al., 2017, 2022).
To evaluate meltwater channel interconnectivity, we calculated the channel drainage density of the catchment (e.g. Yang et al., 2019a). For each day of available imagery, we calculated the total channel length of each channel centreline and divided this value by the area of the catchment (5800 km2).
2.9 Uncertainty analysis of meltwater feature area
The uncertainty associated with using a dual sensor (L8 and S2 imagery) approach is generally low in our study. We calculate that the greatest uncertainties between meltwater features delineated from the two different sensors are observed during peak season (3 July), with an R2 of 0.93 and RMSE=0.1 km2 at this time (Sect. Methods 1 and Fig. S1 in the Supplement).
In the absence of extensive ground truth data, it is very difficult to assess the accuracy of calculated meltwater feature areas, and this is an acknowledged challenge in the literature (e.g. McMillan et al., 2007; Sundal et al., 2009; Leeson et al., 2012; Corr et al., 2022). To provide an indicative estimate of the confidence in our meltwater delineation methods, we therefore compare our dataset to a fully manually delineated dataset, in line with the methods employed by other meltwater mapping studies (e.g. Corr et al., 2022; Arthur et al., 2020). Two “experts” (i.e. glaciologists with extensive expertise in Greenland surface hydrology mapping) manually digitised meltwater features (categorised as SGLs, streams and slush based on physical appearance) from eight true-colour composite S2 images spanning the 2018 and 2019 melt seasons. In comparing the areas of the manually and automatically derived datasets, we find that the mean difference between meltwater feature area manually derived by experts and area automatically delineated in our dataset is 0.06 km2. This reflects both the uncertainty in the automated and manual mapping procedures and the challenges of mapping small lakes and slush.
2.10 Calculating supraglacial lake depth and volume
Water depth for each SGL pixel was determined using the physically based radiative transfer model used in a variety of prior studies (e.g. Sneed and Hamilton, 2007; Banwell et al., 2014; Pope et al., 2016; Williamson et al., 2018a; Macdonald et al., 2018). This algorithm calculates meltwater feature depth assuming that light penetrating a water column is attenuated with depth (Philpot, 1989). An assumption is made that the optical properties of the meltwater features are not altered by wind-driven surface roughness or column-integrated particulate matter. The lake bottom albedo is taken to be homogenous (Sneed and Hamilton, 2007, 2011). Depth, z, is calculated using Eq. (1):
where Ad is lake bed reflectance, R∞ is the reflectance of optically deep water, Rw is the satellite-measured reflectance value of a water pixel, and g is the attenuation coefficient rate associated with losses in upward and downward directions through the waterbody.
For L8 data, depths were determined by an average of both red and panchromatic TOA reflectance values (after Williamson et al., 2018a; Macdonald et al., 2018; and Pope et al., 2016). Ad was obtained from the average reflectance of the first non-water pixel surrounding each feature, determined by a single pixel (30 m) buffer around meltwater features. R∞ was determined in each individual image as the darkest open-ocean pixel, and if deep water was not present in an image, R∞ was taken to be 0 (Sneed and Hamilton, 2007; Banwell et al., 2019; Dell et al., 2020). Following Williamson et al. (2018a) the value of g was taken to be 0.3817 for the panchromatic band and 0.7504 for the red band (after Pope et al., 2016).
For S2 data, depths were determined by using the red TOA reflectance value, after Williamson et al. (2018a). Due to S2's finer spatial resolution compared to L8, Ad was determined by the average reflectance of the first three pixels surrounding the waterbody, as opposed to just one surrounding pixel for L8. R∞ was taken to be 0, like for L8 (see above), and a g value of 0.8304 was taken from Williamson et al. (2018a).
For both the L8 and S2 imagery, meltwater feature volumes were then calculated by taking the sum of depths multiplied by the pixel area. We assume an uncertainty of 21.2 % on these volume estimates, after Melling et al. (2024), who compared meltwater feature depth and volume determined by the same radiative transfer algorithm to those determined from ArcticDEM for five SGLs in the Russell–Leverett catchment. It should also be noted that this method may be less accurate in higher-elevation regions due to the prevalence of slush that may alter the reflectance of surrounding pixels (Melling et al., 2024).
2.11 Tracking lakes through time
The seasonal evolution and drainage dynamics of SGLs within the catchment were tracked using the Fully Automated Supraglacial lake Tracking at Enhanced Resolution (FASTER) algorithm developed by Williamson et al. (2018a). Using this algorithm, we created maximum meltwater extent array masks for both the 2018 and 2019 melt seasons by superimposing individual SGL masks derived from each image. We then applied FASTER to these SGL masks and used it to track changes in SGL area and volume between images, which also enabled us to detect SGL drainage events.
In addition to simply detecting SGL drainage, Williamson et al. (2018a) also used the FASTER algorithm to partition between rapid and slow SGL drainage events based on a 4 d sampling period. However, given the paucity of our data in 2018 relative to 2019, we performed an assessment of the temporal sampling that would be required in order to robustly determine whether a meltwater feature drained rapidly or slowly (Sect. Methods 2 and Fig. S2 in the Supplement). Our findings show that data with a temporal sampling of 2–3 d are required for such partitioning, while the typical temporal sampling of data in 2018 is only 5 d. As such, in this study, we restrict our analysis to assessing drainage of any kind, regardless of time frame.
An SGL was determined to have drained when >20 % of its liquid volume appeared to have been lost over any time period and if it did not gain volume in any subsequent image through the melt season. An SGL was determined to have refrozen if (1) it lost >20 % of its volume with no volume regain in subsequent imagery; (2) the mean air temperature was ≤0 ± 1 °C during, and over the 2 d before, the volume loss event; and (3) the volume loss period lasted at least 72 h. Mean air temperature was extracted from the Regional Atmospheric Climate Model (RACMO) 2 m air temperature data (see Sect. 2.12) at the centroid of each meltwater feature during, and over the 2 d preceding, the volume loss event. The >72 h event threshold duration reflects the fact that SGL refreezing does not happen instantaneously after the onset of negative temperatures. To provide some validation for our approach, we have cross referenced a subset of our refreezing lakes with two independent datasets of buried lakes acquired from SAR imagery in both years (Dunmire et al., 2021; Zheng et al., 2023) (Sect. Methods 3 and Fig. S3 in the Supplement).
In addition to the “drain” and “refreeze” SGL behaviour classes, we also included an “unknown” behaviour class. An SGL was classified as having “unknown” behaviour if the patterns of area and volume decline are not in accordance with that of a draining or refreezing SGL, as described above.
2.12 Regional air temperature and surface melt
To calculate temperature anomalies for the Russell–Leverett glacier catchment for our melt seasons of interest (i.e. 2018 and 2019), we used mean daily values of 2 m air temperature from 1958 to 2019 from the Regional Atmospheric Climate Model (RACMO2.3p2, hereafter “RACMO”) at 5.5 km spatial resolution and further statistically downscaled to a 1 km grid (Noël et al., 2018, 2019). We additionally used the air temperature data to partition between SGL drainage and refreezing (Sect. 2.11 above).
We also extracted daily mean values of total melt (ice and snow) from RACMO throughout both 2018 and 2019 melt seasons for the catchment. Previous studies have shown that RACMO performs well compared to automatic weather station data along the K transect (e.g. Noël et al., 2018).
3.1 Meltwater feature distribution in each melt season
Our detailed mapping shows that the distribution of meltwater features differs between the 2018 and 2019 melt seasons. We compute the maximum meltwater areal coverage as a percentage of the catchment area (i.e. the total area where liquid water is observed to be present on at least 1 d of the melt season) to be 6.3 % in 2018 and 20.8 % for 2019 (Fig. 1). In 2018, channels make up the largest proportion of meltwater features by area, with a cumulative maximum areal coverage of 4.5 % of the catchment area, followed by SGLs (1.5 %) and slush (0.3 %) (Fig. 1a; Table S2 in the Supplement). In comparison, in 2019, slush covers the largest area of the catchment, with a cumulative maximum areal coverage of 12.3 % of the catchment area, followed by channels (6.4 %) and SGLs (2.1 %) (Fig. 1b).
Meltwater extends from the margin to 265 km (1815 m a.s.l.) and 315 km (1920 m a.s.l.) inland in 2018 and 2019, respectively. SGLs and channels have a similar median elevation of ∼1350 m a.s.l. in the 2018 melt season (Fig. 3). In comparison, in 2019, the median elevation of SGLs and channels is 1250 and 1500 m a.s.l. (∼100 m lower and 150 m higher than 2018), respectively. Slush is concentrated over higher elevations in 2019 than in 2018 (Fig. 3). The elevation range of slush in 2018 is 800–1700 m a.s.l., whereas in 2019, slush is concentrated over a smaller range and at higher elevations of 1200–2000 m a.s.l. Slush features are situated at the higher elevations compared to the other meltwater features, with a maximum elevation of ∼1600 m a.s.l. in 2018 and a higher maximum elevation of ∼1700 m a.s.l. in 2019. In both years, SGLs also tend to have larger areas at higher elevations, coincident with lower surface slopes at these elevations (Figs. 1 and S4 in the Supplement).
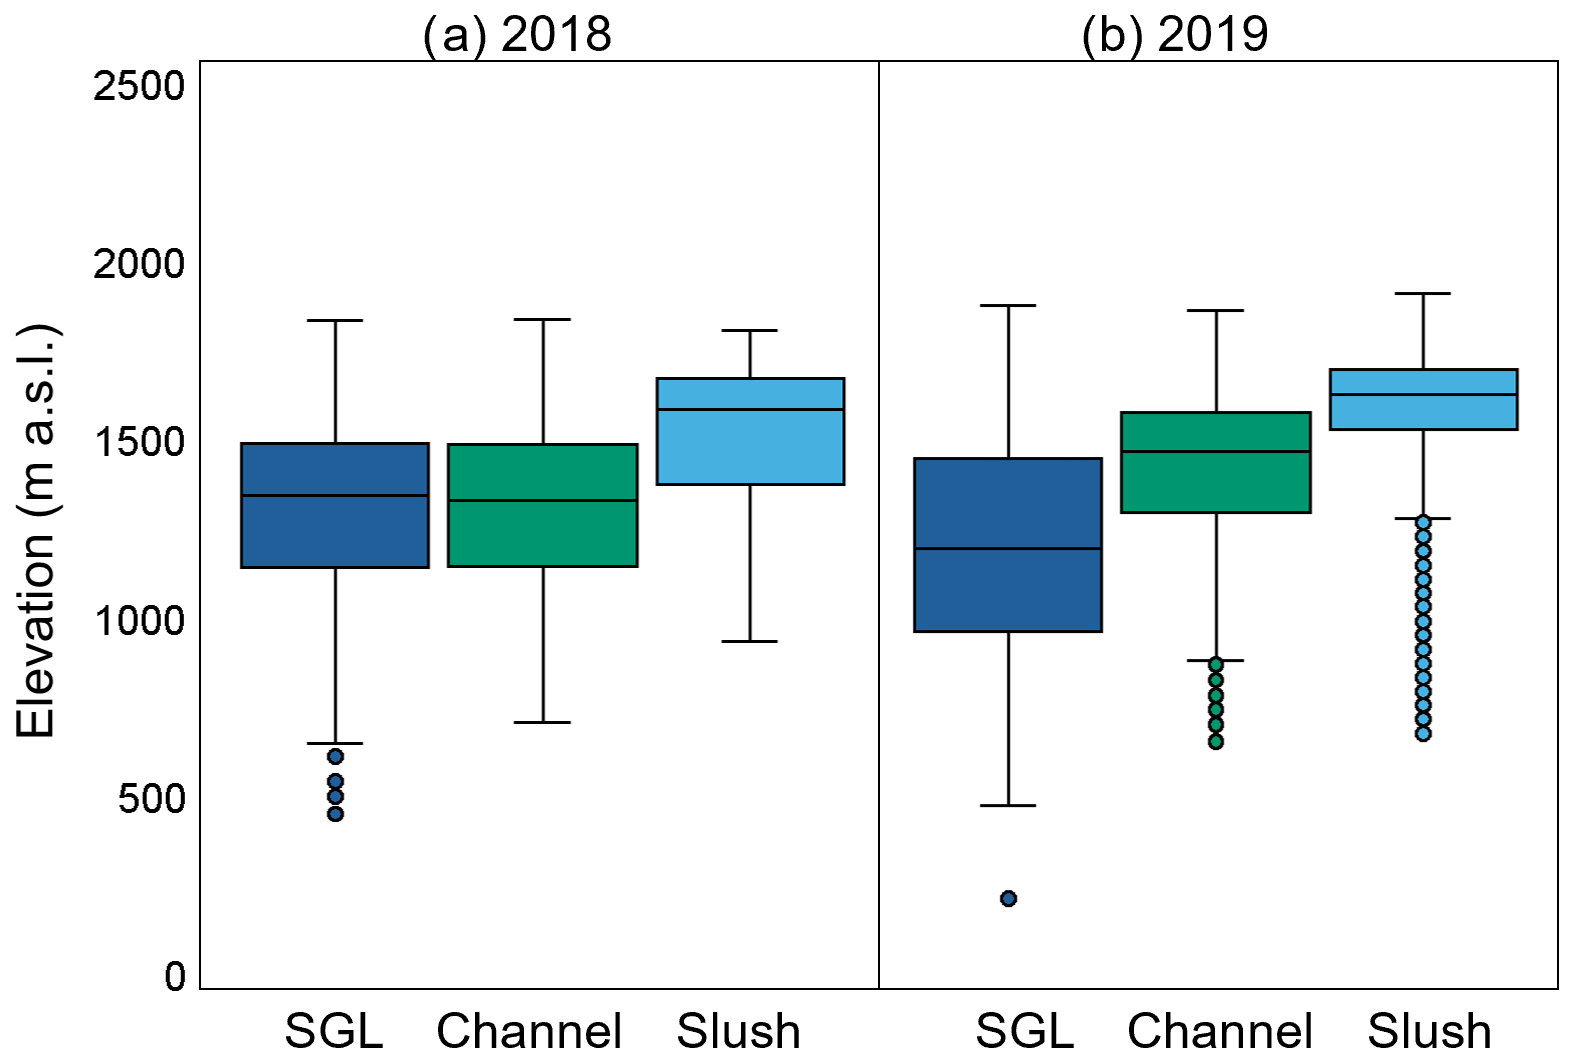
Figure 3Boxplots showing the hypsometry of supraglacial lakes, channels and slush features in 2018 (a) and 2019 (b). The horizontal black line represents the median, the edges of the box indicate the 25th and 75th percentiles, the whiskers are equal to the 5th and 95th percentiles, and outliers represent the full elevation distribution.
3.2 Meltwater feature evolution through each melt season
3.2.1 Supraglacial lakes
SGLs appear earlier in the 2019 melt season than in 2018. In 2018, SGLs first appear on 5 June (Fig. 4a), whereas in 2019, they first appear approximately 1 month earlier on 9 May, following a °C temperature anomaly in early May 2019 (Fig. 4b). In 2018, total SGL area and volume gradually increase from 5 June by 1.9 km2 d−1 and 0.002 km3 d−1, respectively, until 18 June. Both total SGL area and volume then remain relatively steady until 13 July, when both peak at 40 km2 and 0.05 km3, respectively (Fig. 4a). Both SGL area and volume abruptly decrease by 4.3 km2 d−1 and 0.004 km3 d−1, respectively, from 19 to 24 August 2018, coinciding with lower surface air temperatures and melt rates.
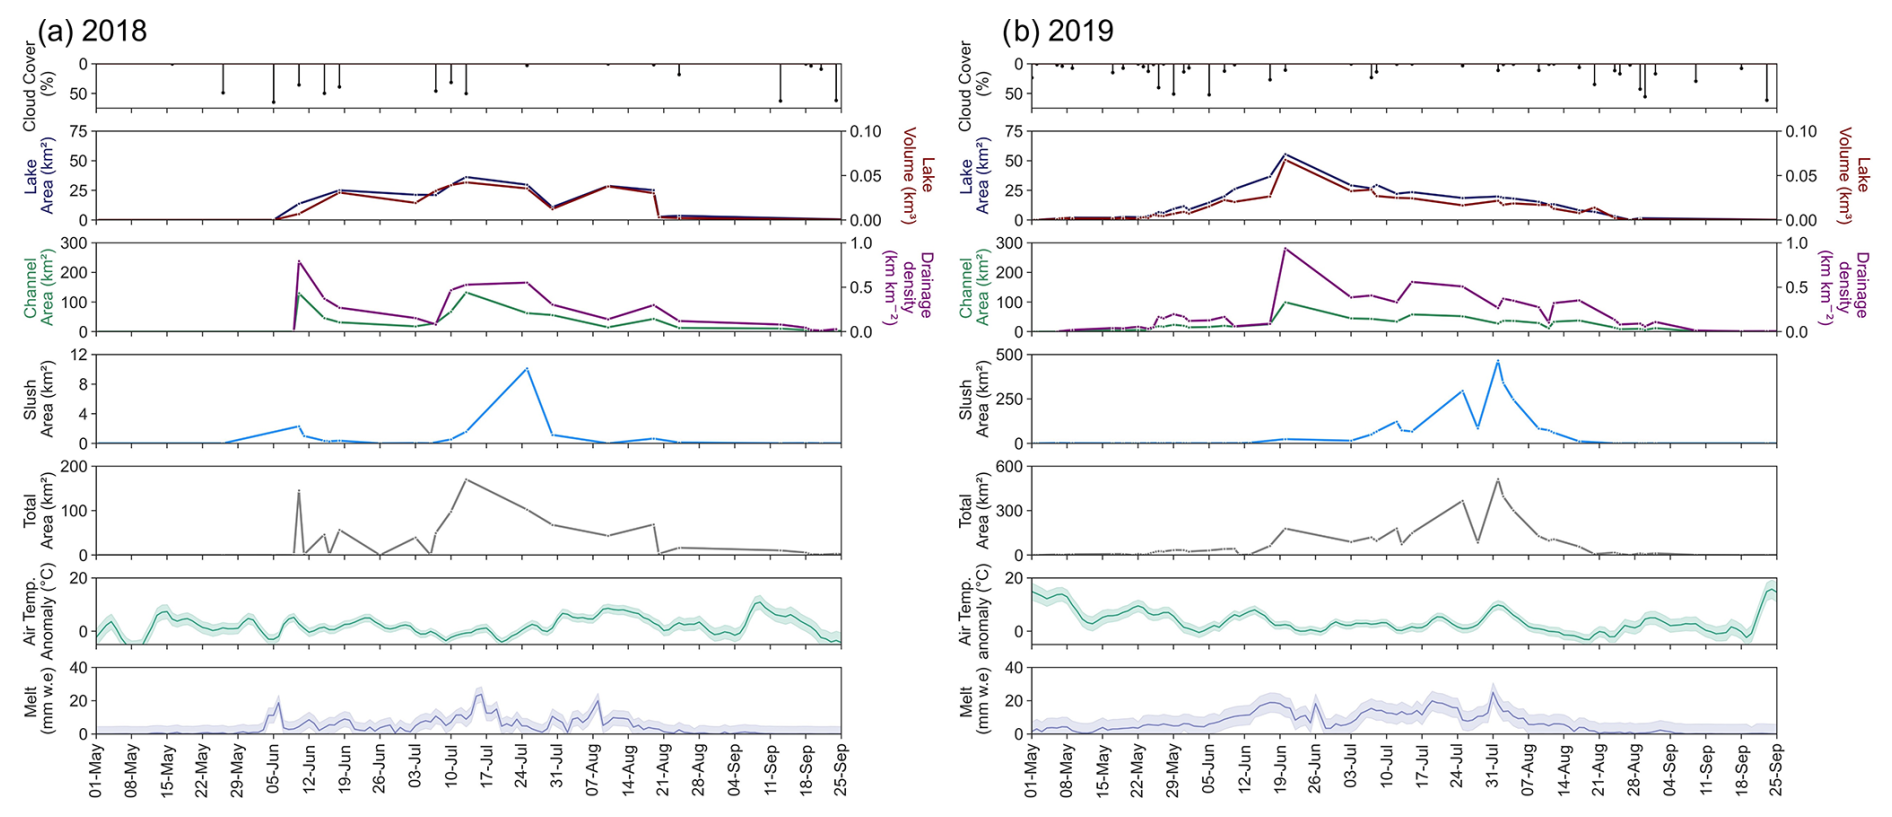
Figure 4Time series of total areas of SGLs (dark blue), channels (green), slush (light blue) and all meltwater features (grey) in (a) 2018 and (b) 2019 from L8 and S2 imagery. SGL volume is given in red, and channel drainage density is given in purple. Also shown are cloud cover percentages (black bars), RACMO 2 m air temperature anomaly (light green line) from the 1958–2019 catchment average with the spatial standard deviation (light green shading) and RACMO total daily melt (mm w.e.; light blue line) with the spatial standard deviation (light blue shading). Note that the y axis ranges are different for the slush and total areas between (a) and (b).
Rates of increase in area and volume are slightly lower in 2019 (1.1 km2 d−1 and 0.001 km3 d−1, respectively) than in 2018. However, these rates are sustained over a longer period of time in 2019, throughout May and June, resulting in a peak area and volume that is higher in 2019 than in 2018, at 56 km2 and 0.07 km3, respectively. The 2019 peak also occurs earlier in the melt season, on 20 June (Fig. 4b). From then onwards through the remainder of the 2019 melt season, SGL area and volume decrease at an average rate of 1.1 km2 d−1 and 0.001 km3 d−1, respectively, which represents a more gradual decline than in 2018. The disappearance of all SGLs occurs only slightly later in 2019 (on 26 August) than in 2018 (on 21 August). In both melt seasons, SGLs initially form at low elevations (∼1000 m a.s.l.), migrating inland to higher elevations as the melt seasons progress.
Small SGLs (i.e. >0.0018 and ≤0.0495 km2) are more abundant in 2019 than in 2018 (Fig. 5). In both years, small SGLs are most prevalent at the start of the melt season at low elevations (Fig. 1ai). In 2018, small SGLs make up 86 % of all SGLs that form within the first month (June) and are situated at a mean elevation of 1040 m a.s.l. In 2019, small SGLs make up 89 % of all SGLs that form within the first month (May) and are situated at a lower mean elevation of 950 m a.s.l.

Figure 5The total number of SGLs observed throughout the 2018 (a) and 2019 (b) melt seasons, partitioned into large (>0.0495 km2; teal green) and small (>0.0018 and ≤0.0495 km2; aqua blue) SGLs. The solid black circles indicate the days on which measurements were acquired.
3.2.2 Supraglacial channels
In both 2018 and 2019, dense, dendritic drainage networks of supraglacial channels form, allowing for meltwater connectivity across the majority of the catchment towards the ice-sheet margin and proglacial area (Fig. 1). In both years, channels are observed to expand up-glacier from lower elevations (∼800 m a.s.l.) to higher elevations (∼1800 m a.s.l.) as the melt seasons progress (Fig. S5 in the Supplement; Animations 1 and 2 in the Supplement).
In 2018, a large channel network (∼125 km2) abruptly appears on 10 June after a spike in melt before reducing by 4.9 km2 d−1 until 3 July (Fig. 4a). Total channel area then increases by 11.5 km2 d−1 and peaks at ∼130 km2 on 13 July 2018, coinciding with peak melt. Channel area in 2018 then gradually reduces by 4.2 km2 d−1 to ∼15 km2 by 10 August. We then observe a small 3.2 km2 d−1 increase in total channel area to ∼45 km2 on 19 August 2018, followed by a 1.1 km2 d−1 reduction in total channel area by 30 September.
In 2019, supraglacial channels appear earlier in the melt season compared to 2018, mirroring the observed behaviour of SGLs (Sect. 3.2.1). Total channel area remains low throughout most of May (∼4 km2) but then increases at a rate of 3.6 km2 d−1 to reach a peak of 100 km2 on 20 June (coinciding with maximum SGL areal extent) (Fig. 4b). This peak is lower than in 2018 (130 km2) and earlier in the melt season by 23 d. After the peak, total channel area in 2019 then decreases by 4.2 km2 d−1 to 45 km2 on 3 July, where it remains mostly steady until it begins to taper off on 24 August, reducing by 0.4 km2 d−1 until channel features are no longer visible by 28 September.
The drainage density of the supraglacial channel network throughout both 2018 and 2019 follows a similar pattern to the total channel area (Fig. 4). In 2018, the drainage density peaks in mid-June at 0.8 km km−2 (Fig. 4a). In 2019, the drainage density also peaks in mid-June, although at a greater value of 1 km km−2 (Fig. 4b). The density of the drainage network is consistently higher on average in 2019 compared to 2018, where it experiences distinct peaks and troughs.
3.2.3 Supraglacial slush
The evolution of supraglacial slush also differs throughout each melt year. In 2018, the total area of slush within the catchment follows a similar trend to channels and is mostly observed as extensions of channel features in the percolation zone (∼1500 m a.s.l.) in mid-July (Fig. 1aiv). The areal extent of slush remains low for most of the 2018 season, ranging from 0.02 km2 on 6 July (by 0.53 km2 d−1) to a peak of ∼10 km2 on 25 July, which is when it reaches its maximum elevation of 1800 m a.s.l. (Fig. 4a). Following this peak, total slush area reduces by 0.4 km2 d−1 until it reaches 0.65 km2 on 19 August and then remains low until the end of the 2018 melt season.
Conversely, in 2019, slush is the most dominant meltwater feature in terms of areal coverage, and, unlike in 2018 where it looks like extended channels, in 2019 it is characterised as patches of dense, light blue meltwater with poorly defined boundaries (Fig. 1biv). In 2019, slush first develops at ∼1500 m a.s.l. in mid-June and migrates up-glacier through July by occupying topographic lows, before stabilising in early August at a maximum elevation of ∼2000 m a.s.l. (i.e. 200 m higher than 2018) (Fig. S5 and Animations 1 and 2 in the Supplement). The total area of slush remains low until it becomes established in late June, when it increases from 14.9 km2 on 3 July by 15.6 km2 d−1 to peak at 466 km2 on 1 August, which is 47 times larger than in 2018 (Fig. 4b). The total area of slush then reduces in area by 19.4 km2 d−1 until it ceases to be observed on 24 August 2019.
3.3 Modes of supraglacial lake evolution
3.3.1 Supraglacial lake drainage
Of the 1011 and 1495 SGLs that form in 2018 and 2019, respectively, 43 % (432) and 44 % (650) are observed to drain (either rapidly or slowly) (Table 1). In both melt seasons, drainage of SGLs occurs at increasing elevations and distances inland from the ice margin as the melt seasons progress (Fig. 6a and b). The total meltwater volume drained from SGLs is similar in each year (0.54 km3 and 0.50 km2 for 2018 and 2019, respectively), but the total drained meltwater area in 2019 is nearly double that in 2018 (59 and 99 km2, respectively) (Table 1). However, the mean SGL drainage volume is greater in 2018 than in 2019 ( and km2, respectively). In both years, the SGLs that drain early in the melt season are typically small lakes (Figs. 6 and S6 in the Supplement). For example, in 2018 and 2019, respectively, 83 % and 87 % of SGLs that drain in the first month of each season are classed as small SGLs (Fig. 4). We also find that in 2018 and 2019 47 % and 67 %, respectively, of small SGL drainage events occur where the ice sheet is <1 km thick.
Table 1Statistics of SGLs that drain, refreeze or have unknown behaviour in 2018 and 2019. DOY is the “day of year” in 2018 and 2019. DOY sampling is calculated by averaging the start-drainage DOY and the end-drainage DOY. Percentage values are proportions of the sum of the total meltwater areas or volumes over each melt season.
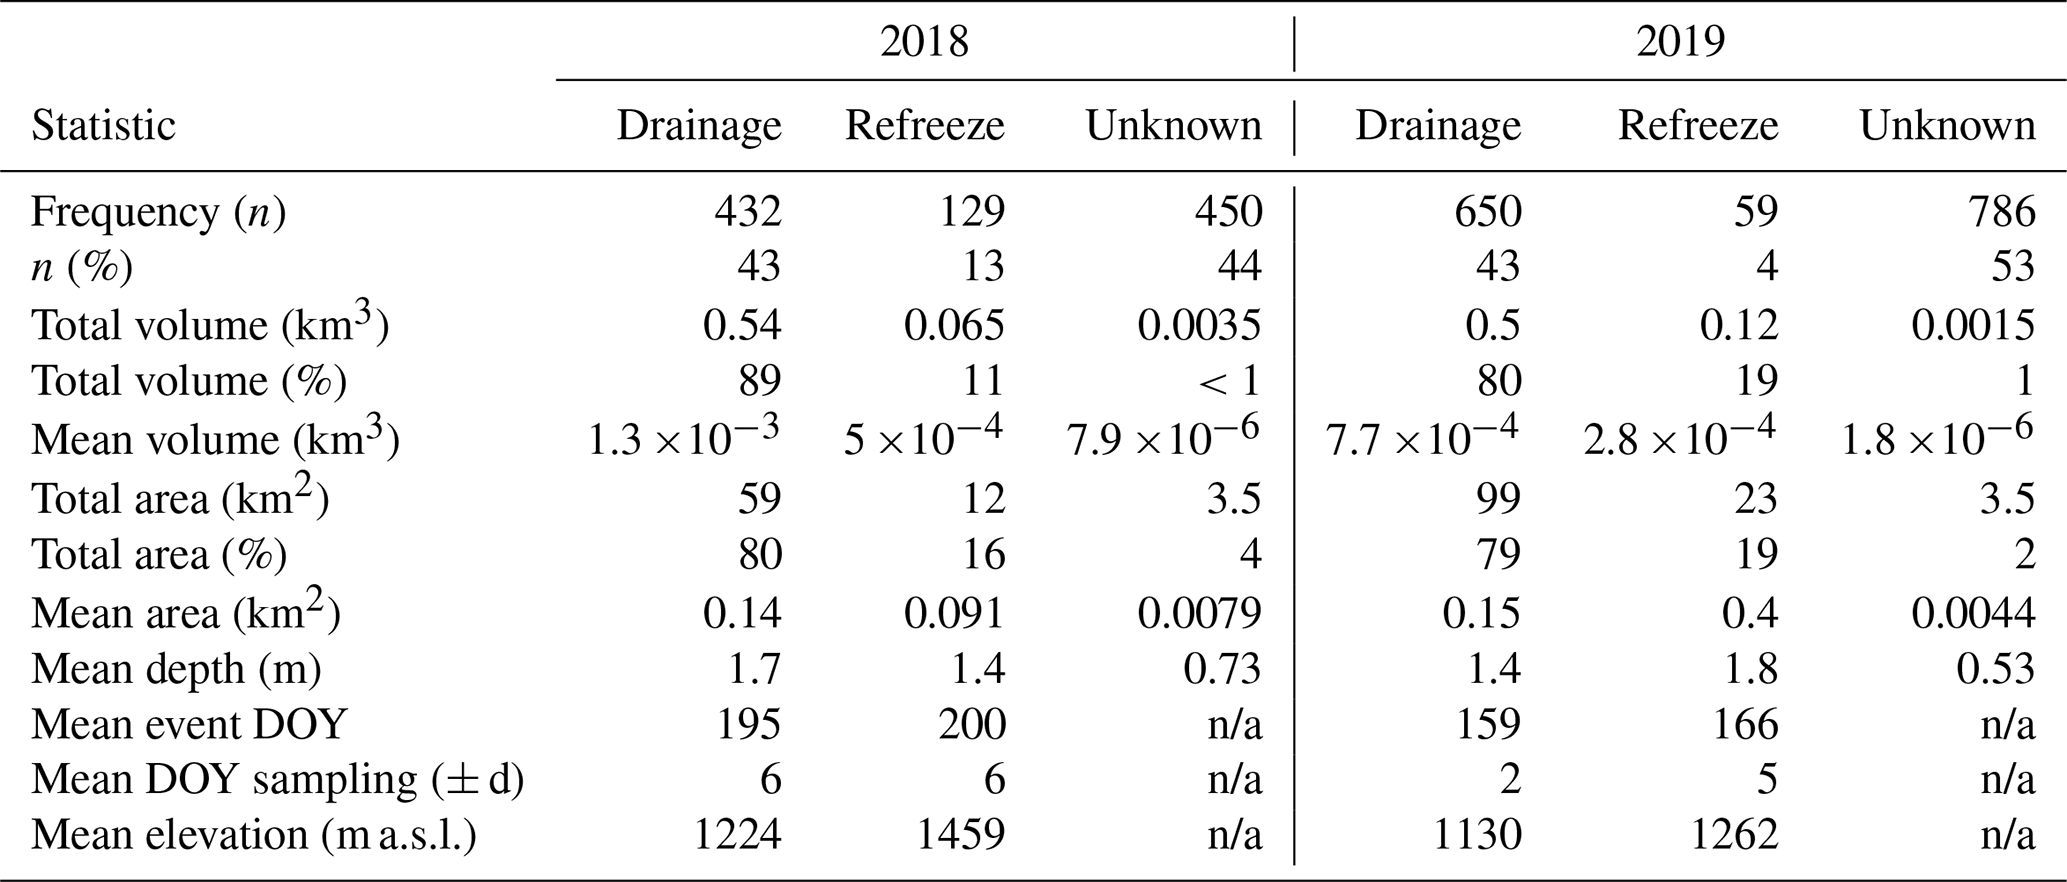
n/a: not applicable.
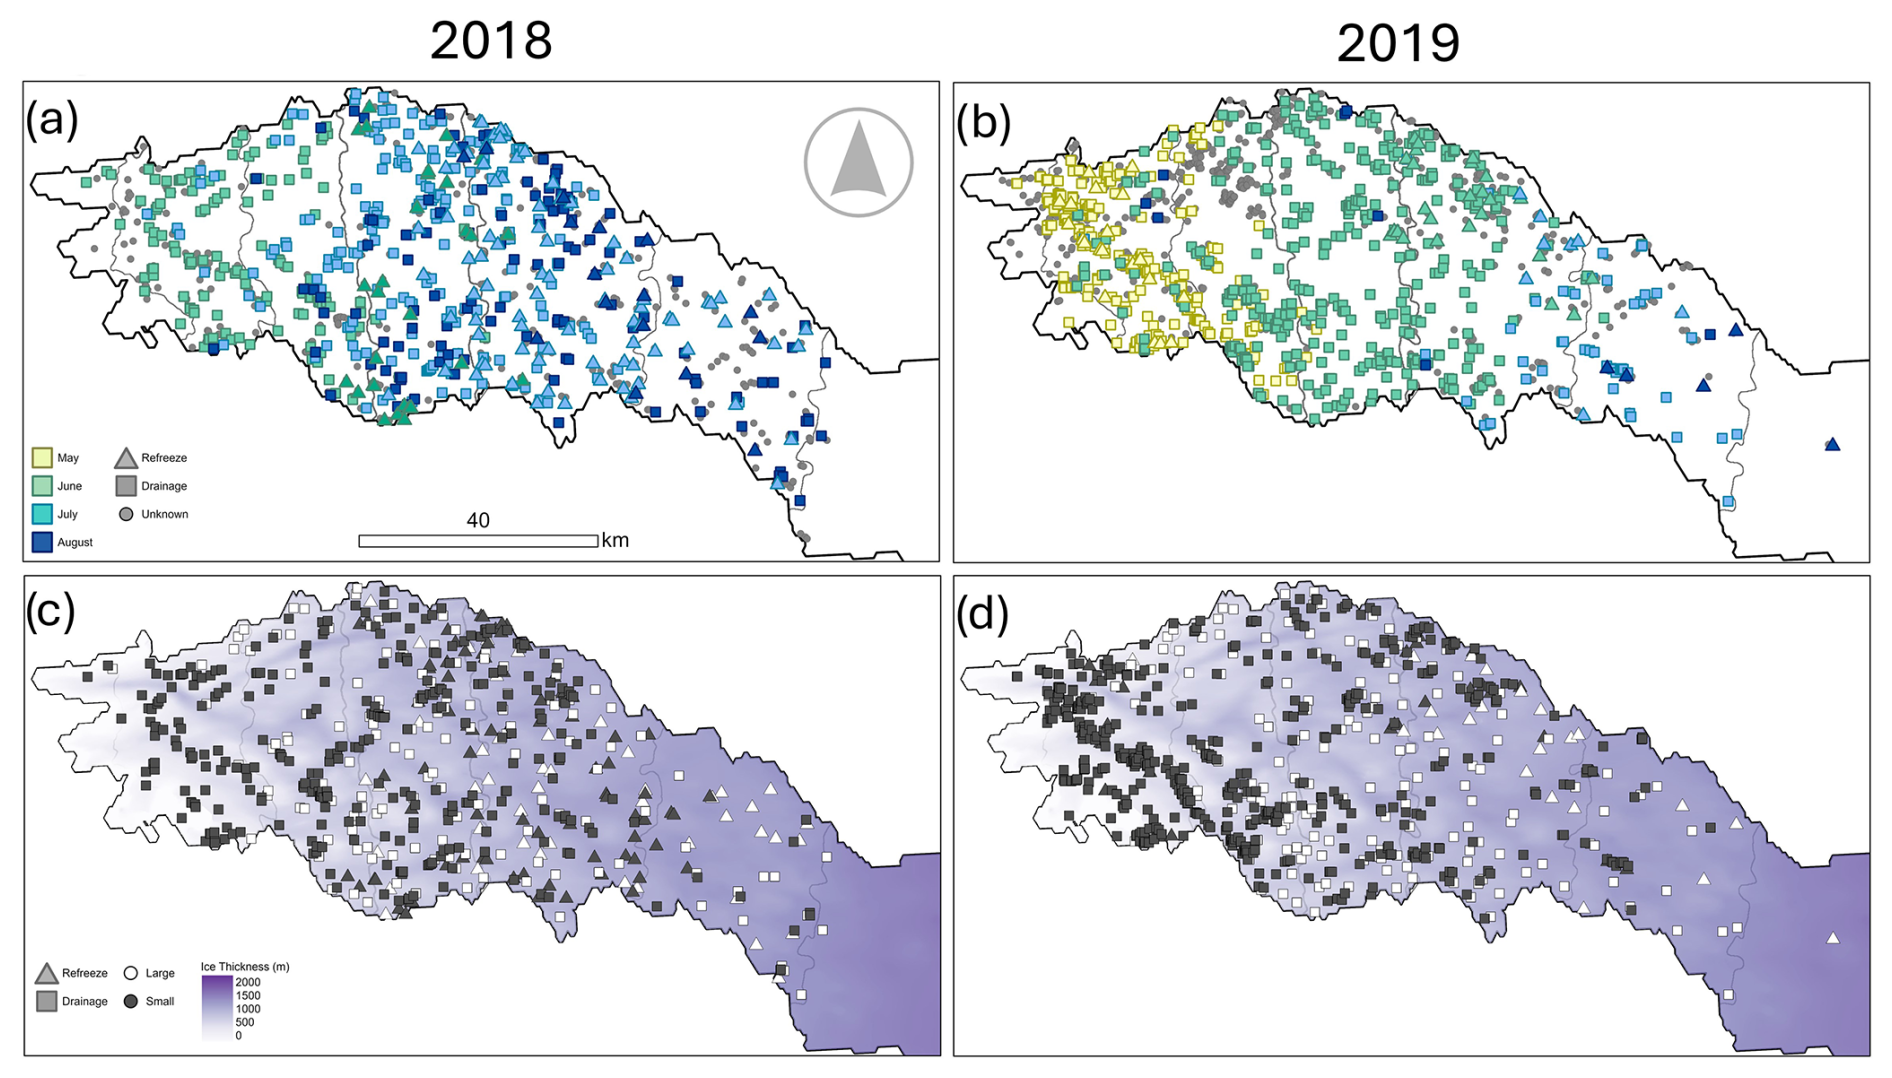
Figure 6SGLs that drain, refreeze or have unknown behaviour in the Russell–Leverett glacier catchment in 2018 (a, c) and 2019 (b, d). Panels (a) and (b) depict the timing of SGL drainage (square) and SGL refreezing (triangle) events in 2018 and 2019, respectively. SGLs of unknown behaviour are represented by small grey circles. Panels (c) and (d) depict small (≥0.0018 and ≤0.0495 km2; black) and large (>0.0495 km2; white) SGL drainage (square) and SGL refreezing (triangle) events in 2018 and 2019, respectively. The light to dark purple gradient represents ice sheet thickness in metres. SGLs of unknown drainage/refreezing behaviour are not shown in panels (c) and (d).
Drainage events in 2018 are sporadic and spread over time throughout the melt season, with most drainage occurring in July and August (Fig. 7a). The greatest number of drainage events in 2018 occurs between elevations of 1200 and 1600 m a.s.l. We identify fewer SGL drainage events at the highest elevations in the catchment, with two notable exceptions being large events that occurred on 6 and 19 August 2018 (between 1600–2000 m a.s.l.). In comparison, in 2019, drainage events are more frequent and concentrated in time, occurring ∼ a month earlier in the season and predominantly in June and early July (Fig. 7b). Similar to 2018, the drainage frequency is greatest between 1200 and 1600 m a.s.l.; however, there is a notably lower volume of water that drains at the highest elevations in 2019. We identify more drainage events at low elevations in 2019 compared to 2018.
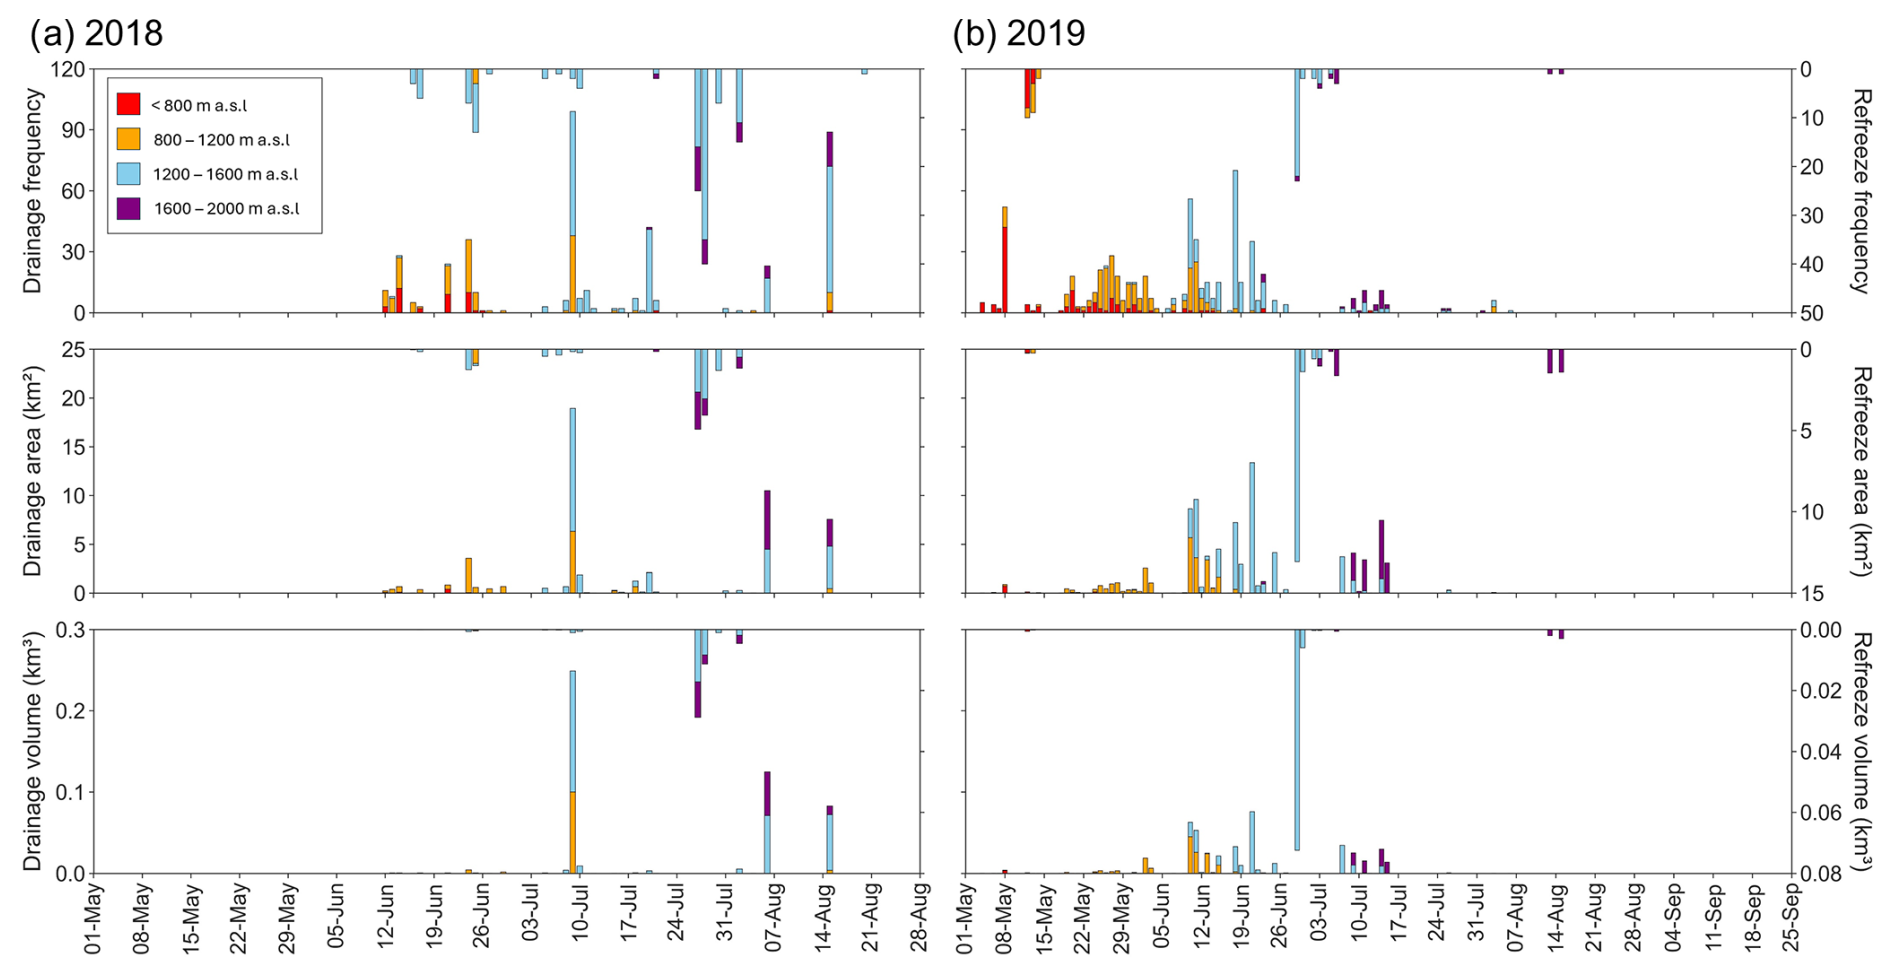
Figure 7Time series of SGL drainage and refreeze within the Russell–Leverett catchment in (a) 2018 and (b) 2019, partitioned into elevation bands. From top to bottom: frequency of drainage/refreeze events (i.e. the number of features that drained or refroze), total daily area loss and total daily volume loss. Bars extending upward correspond to drainage events (left y axis), while bars extending downward correspond to refreezing events (right y axis). The data are colour-coded based on elevation: <800 m a.s.l. (red), 800–1200 m a.s.l. (orange), 1200–1600 m a.s.l. (blue) and 1600–2000 m a.s.l. (purple).
3.3.2 Supraglacial lake refreezing
In 2018, 13 % (129) of SGLs refreeze, corresponding to 31 % of total SGL area (12 km2) and 11 % of total SGL volume (0.065 km3) (Table 1). In 2019, 4 % (59) of SGLs refreeze, corresponding to 14 % of total SGL area (23 km2) and 19 % of total SGL volume (0.12 km3). On average, SGLs refreeze at higher elevations in 2018 (∼1460 m a.s.l.) than in 2019 (∼1260 m a.s.l.) (Table 1). The mean SGL refreezing elevation in 2018 is ∼200 m higher than the mean drainage elevation, and the mean SGL refreezing elevation in 2019 is ∼100 m higher than the corresponding mean drainage elevation. In 2018, refreezing tends to occur at higher elevations (>1200 m a.s.l.) where ice is thicker (Figs. 6c and 7). In 2019, refreezing typically occurs at elevations <1000 m a.s.l. across the catchment, as well as in the northern area of the catchment between 1600 and 2000 m a.s.l. (Figs. 6d and 7). We observe that ∼12 SGLs appear to refreeze at lower elevations in May 2019, but limitations in temporal sampling prevent full characterisation of their subsequent dynamics.
By comparing meltwater features within the Russell–Leverett glacier catchment between the high melt season of 2019 and the relatively lower melt season of 2018, we identify a clear contrast in supraglacial meltwater distribution, evolution and SGL behaviour. As Greenland's climate warms, exacerbated by Arctic amplification and climate–ice-sheet feedback processes, the frequency of high melt years like 2019 will likely increase (e.g. Hanna et al., 2024). By examining supraglacial meltwater behaviour during 2019 – a year with warmer-than-average temperatures – we gain insight into how the ice sheet responds to large amounts of melt, contributing to our understanding of its future evolution in a changing climate. Our study also provides an assessment of the extent to which previously poorly mapped and understudied supraglacial hydrological features (such as small SGLs and slush) may play a role in the broader en- and subglacial systems, particularly in the context of a warmer climate.
4.1 Meltwater features at high elevations
We observe that meltwater features tend to extend further inland to higher elevations in the high melt year of 2019 than in the lower melt year of 2018 (Fig. 3). This is in keeping with previous studies that found meltwater features tend to reach increasingly higher elevations during more intense melt years (e.g. Sundal et al., 2009; Liang et al., 2012; Lüthje et al., 2006). While these studies primarily focused on SGLs, our results indicate that channels and slush can typically coexist with SGLs across similar elevation bands, although slush is more commonly observed at higher elevations compared to SGLs and channels. The formation of channel, slush and SGL features at higher elevations in more intense melt seasons is indicative of the substantial surface runoff present in these regions during these periods. It has been previously reported that moulins are present at higher-elevation regions in our study area (>1600 m a.s.l.; e.g. Yang et al., 2021). As such, it is possible that meltwater produced at high elevations may be routed to the bed through these moulins, in turn reaching areas where the subglacial hydrological system is relatively inefficient, which may cause temporary and localised speed-up events (Leeson et al., 2015). The formation of meltwater features within the high-elevation percolation zone may result in the densification of firn and possibly ice slabs (e.g. MacFerrin et al., 2019; Jullien et al., 2023), reducing the firn's meltwater storage capability and leading to enhanced supraglacial meltwater runoff in subsequent years (Machguth et al., 2016; Nienow et al., 2017).
4.2 Slush
We identify that the maximum spatial extent of peak slush area in 2019 is an order of magnitude greater and extends to higher elevations, relative to 2018 (Figs. 3 and 4). This is likely due to higher surface melt rates in 2019, especially above the equilibrium-line altitude. In previous work, the “slush limit” has been used as an indicator of the visible runoff limit, representing the upper boundary where meltwater runoff is directed to the ocean and contributes to mass loss (Gruell and Knap, 2000; Tedstone and Machguth, 2022; Machguth et al., 2023; Clerx et al., 2022). Our study therefore suggests that the upper visible runoff limit is higher in the 2019 melt season compared to the 2018 melt season. Tedstone and Machguth (2022) found that the visible runoff area of the entire GrIS increased by 29 % from 1985 and 2020 and it is likely that projected warming may drive this limit upwards. We note that while our study – and indeed others that have used optical satellite imagery – can only detect slush on the ice surface, slush may also exist within the subsurface snowpack (Clerx et al., 2022). As such, our methodology of mapping slush from optical imagery provides a minimum bound for slush extent because the total slush area may be even greater than what we can observe from optical imagery alone.
The refreezing of slush at high elevations may have a long-term influence on the runoff from the GrIS by forming near-surface ice slabs, which act as aquitards, restricting meltwater percolation into the firn and reducing retention capacity (Machguth et al., 2016; MacFerrin et al., 2019; Miller et al., 2022; Jullien et al., 2023). As high melt years like 2019 become more frequent, it is likely that slush will become more prevalent, leading to the formation and expansion of low-permeability ice slabs, preconditioning the ice sheet surface for greater ponding and surface runoff in future years. This is potentially already occurring at Humboldt Glacier in North Greenland, where a previous study identified the earlier activation of the supraglacial hydrologic system and longer melt seasons in years following widespread slush events (Rawlins et al., 2023).
Most prior mapping studies of Greenland's supraglacial hydrology, such as those by McMillan et al. (2007), Selmes et al. (2011), Williamson et al. (2017, 2018a), Miles et al. (2017) and Otto et al. (2022), have focused on SGLs, while others, including Smith et al. (2015), Yang et al. (2021), Lu et al. (2021), and Turton et al. (2021), examined meltwater channels and drainage patterns. However, these studies largely overlooked slush, which our findings show accounts for a significant proportion of the total meltwater area. In our study, slush accounts for ∼59 % of total meltwater area in our study area of southwest Greenland in 2019. The exclusion of slush in these previous studies likely led to underestimations of meltwater extent.
The presence of widespread slush is likely to lower the surface albedo and hence increase solar absorption relative to ice or snow, thus influencing the surface energy balance. In Antarctica, Dell et al. (2024) found that slush accounted for ∼50 % of total meltwater area across 57 ice shelves around the continent. As variations in surface albedo due to slush (and ponded water) are not currently accounted for within surface energy balance routines in regional climate models, Dell et al. (2024) went on to calculate that modifying the surface albedo in a regional climate model to reflect the lower albedo of surface meltwater caused snowmelt to increase by 2.8 times across a subset of five ice shelves. That finding, combined with our observations in southwest Greenland, highlights the importance of including slush when mapping supraglacial meltwater across both of Earth's ice sheets. We further advocate for the refinement of regional climate models to account for slush's impact on albedo, which will likely enhance the accuracy of modelled surface meltwater production.
4.3 Interconnectivity
The density and area of the supraglacial channel network provide an indication of meltwater interconnectivity across the catchment (Fig. 4). Overall, we observe that the channel interconnectivity is more developed in the higher melt year of 2019 than in the relatively low melt year of 2018. The configuration of the supraglacial channel network has implications for both the routing of supraglacial meltwater and the magnitude, location and timing of meltwater delivery to the en- and subglacial environment (e.g. Banwell et al., 2013, 2016; Smith et al., 2021). At lower elevations, meltwater routing is more efficient than at higher elevations (e.g. Smith et al., 2015) due to steeper gradients, crevassing and minimal surface snow cover. Nonetheless, as air temperatures increase, as observed in 2019, so may the density and extent of the drainage network, with channel formation also extending to higher elevations (e.g. Yang et al., 2021), even in flatter, snow-covered regions, as demonstrated in our study.
A future increase in channel drainage density may also allow for amplified interactions between supraglacial channels and thin fractures, potentially leading to a slow mode of stream-driven hydrofracture via reactivation of existing fractures, with potential implications for cryo-hydrological warming at depth and decreased ice viscosity (Chandler and Hubbard, 2023).
4.4 Modes of supraglacial lake evolution
We show that previously understudied small SGLs (≥0.0018 and ≤0.0495 km2) form and drain in both melt years, although these features are more abundant in the high melt year of 2019 (Fig. 5). Small SGLs tend to form and drain earlier in each melt season and at lower elevations than larger SGLs. This is likely because crevassing is more prevalent at lower elevations (Das et al., 2008) and smaller surface topographic undulations in these regions (Johansson et al., 2013) limit SGL growth. This allows small SGLs to reach their maximum volumes earlier in the melt season, when they may drain earlier via overflow. Although we do not differentiate between slow and rapid SGL drainage in this study, it is reasonable to assume that moulins are created when small SGLs drain rapidly, which may then modulate ice dynamics on intra-seasonal timescales by providing access points for meltwater runoff to reach the ice sheet base throughout the remainder of the melt season (Banwell et al., 2016). While small SGLs contribute a relatively small proportion to the overall drainage flux across the melt season (3.5 % in 2018 and 3.1 % in 2019), their importance lies in the timing of their drainage. These events typically occur early in the season, when the subglacial hydrological system is inefficient due to limited preceding meltwater input (e.g. Bartholomew et al., 2010), and may accelerate the transition to a more efficient subglacial configuration. The drainage of small SGLs dominates the first month of each melt season (e.g. June 2018 and May 2019), accounting for the majority (>80 %) of drainage events. This early-season activity may contribute to the initial development of the subglacial hydrological system, potentially affecting when and where an efficient drainage network is established.
Furthermore, in both melt years studied, over a third of small SGLs drained in areas where ice thickness is less than 1 km, making it plausible that their drainage pathways extended to the bed, if they drained rapidly via hydrofracture. If so, moulin density at these lower elevations may be higher than previously reported (Banwell et al., 2016; Hoffman et al., 2018). This challenges the previous assumption that smaller lakes are unlikely to trigger hydrofractures through 1–1.5 km thick ice (Krawczynski et al., 2009), which was stated as the reason for why studies such as Miles et al. (2017) and Williamson et al. (2018a) restricted analyses to SGLs larger than 0.0495 km2. Our observations suggest that small SGLs may play a more significant role in meltwater routing than previously recognised, particularly during high melt years such as 2019, when small lakes were approximately 15 % more abundant, formed earlier in the melt season and occurred at lower elevations compared to 2018. We suggest that including SGLs smaller than 0.0495 km2 in future remote-sensing and modelling-based studies is important for better understanding from where, when and how much supraglacial meltwater is routed to the ice sheet bed and the associated implications for ice dynamics.
We have identified that a greater number, and larger total area, of SGLs drained in 2019 compared to 2018; however, our observations show that in both years a similar total volume of water drained. Interestingly, we find that SGLs which drained in the low melt year of 2018 were typically deeper and greater in volume than those that drained in the high melt year of 2019 – a finding that is in line with those of Dunmire et al. (2025). It is possible that SGLs in 2019 were unable to reach greater depths due to increased ice speeds in 2019, perhaps resulting from rapid lake drainage events in the spring, which in turn temporarily increased local ice velocity and hence tensile stress, triggering additional rapid SGL drainages (e.g. Christoffersen et al., 2018) relatively early in the melt season and thereby preventing SGLs in 2019 from achieving their 2018 depths (Dunmire et al., 2025). Also, the increased supraglacial channel network interconnectivity that we observe in 2019 relative to 2018 may have provided a mechanism for meltwater to overflow out of SGLs via basin-side incision, thus preventing deeper SGLs from forming in 2019.
We find that a greater proportion of SGLs refreeze in 2018 (13 %) compared to 2019 (4 %), likely due to the reduced number of lakes that drain in 2018, compounded by the cooler surface air temperatures in 2018. If SGL refreezing on the GrIS becomes less common in the future, then a greater proportion of liquid meltwater will be available to drain to the ice sheet's base and/or be routed as supraglacial runoff towards the ocean. Additionally, open water in SGLs has a lower albedo than frozen SGLs, thereby resulting in increased melting through the positive melt–albedo feedback.
In both melt years, we find that SGLs more commonly drain than refreeze and that refreezing typically occurs at higher elevations than drainage. This is in keeping with the findings of Johansson et al. (2013), Selmes et al. (2013), and Dunmire et al. (2025). The majority of the SGLs that we observe to refreeze do so at relatively high elevations (1250 to 1450 m a.s.l.), which is to be expected due to lower air temperatures; shallow surface slopes making SGL drainage via lateral surface overflow less likely (e.g. Raymond and Nolan, 2000); and thicker ice inhibiting rapid, vertical drainage through hydrofracture (e.g. Krawczynski et al., 2009). We acknowledge that, given the temporal sampling of our dataset, it is difficult to unequivocally distinguish between SGLs that drain and refreeze and that consequently our partitioning method has several limitations. Our method only accounts for lake surface refreezing (i.e. lakes that form a cap of ice on their surface) and not full-thickness freeze-through, and it is therefore possible that liquid meltwater may still persist under the refrozen surface. This may lead to the drainage of meltwater outside of the melt season when the subglacial drainage system is more likely to be inefficient and ice flow is more sensitive to meltwater input (e.g. Benedek and Willis, 2021). Dunmire et al. (2021) found that, in southwest Greenland in the 2018 and 2019 melt seasons, 87 and 80 buried lakes were identified, respectively, and we assume that these features were likely classified as refreezing events in our study. Finally, we note that some uncertainty in our study may exist because SGLs can lose volume through multiple mechanisms in a single melt season, for example, by undergoing both partial drainage and refreezing (e.g. Gantayat et al., 2023).
4.5 Limitations of using the 2019 melt season as a proxy for future warming
Using the relatively high melt season of 2019 to investigate how the GrIS responds to intensified warming offers valuable insights into the impact that future changes in climate may have on the ice sheet's hydrology and dynamics. Nonetheless, it is clear that using a single high melt year like 2019 to directly infer future conditions has inherent limitations due to the fact that surface properties are dependent upon changes that occur over multiple seasonal cycles (e.g. Hanna et al., 2024). Beyond melt intensity and duration, for example, surface and near-surface properties such as snowpack thickness, firn air content and the presence of ice slabs partially control supraglacial meltwater and slush field extents. Ice slabs, for example, act as aquitards that prevent the vertical percolation of meltwater down into the firn and instead facilitate supraglacial runoff (MacFerrin et al., 2019; Jullien et al., 2023), while a thinner snowpack leads to faster saturation and slush expansion (Harper et al., 2012; Machguth et al., 2016). Therefore, while the 2019 melt season provides a snapshot of potential future melt and supraglacial hydrological conditions, it is essential to consider the broader context of multi-year climatic trends and the development of features such as ice slabs when fully assessing the GrIS's response to ongoing climate change.
In this study, we have undertaken a detailed mapping and intercomparison of the distribution and dynamics of supraglacial meltwater features across the Russell–Leverett glacier catchment in the high melt year of 2019 and the comparatively low melt year of 2018. Through this, we have aimed to establish deeper insights into how the GrIS's hydrological system responds to variations in atmospheric temperature forcing. As such, this work contributes to an improved understanding of how rising air temperatures and more intense melt events may impact the hydrology of the GrIS in the future. This research provides detailed observations of GrIS hydrology, offering new insights that can help to inform us about the representation of hydrological processes in the physical models that are used to make projections of future mass balance and sea level rise.
As high melt years like 2019 become more common in the future, our study suggests that the GrIS may experience increased surface meltwater ponding and transport, with more interconnected and efficient supraglacial channel systems at higher elevations on the ice sheet, potentially leading to increased meltwater flow to the ice sheet base via moulins. Additionally, greater slush extents in these high melt years, which lowers surface albedo and reduces surface permeability when it refreezes, may further increase ice sheet surface runoff and hence decrease mass balance. Moreover, the formation and drainage of smaller SGLs during higher melt years like 2019 may enhance surface–bed connections early in the melt season, which has implications for the representation of subglacial hydrology and hence ice flow velocities in models. Furthermore, the complex relationship between meltwater drainage and melt intensity, highlighted by deeper SGLs in the low melt year as well as similar total drainage volumes in both high and low melt years, also demonstrates the need for nuanced representation of surface hydrology when coupling climate and ice sheet models.
Two of the most novel aspects highlighted in our study are the widespread presence of slush and small SGLs. We suggest that these previously poorly mapped and/or under-studied supraglacial hydrological features may exert a significant impact on glacio-hydrological systems, especially in future warmer melt years. Future work should therefore focus on understanding the longer-term distribution and evolution of slush on the GrIS. To better estimate melt on the GrIS, we recommend that slush, and crucially its effect on albedo, should be incorporated into regional climate models to improve projections of the future behaviour of the GrIS. Additionally, the better identification and representation of small SGLs in future remote-sensing and modelling studies will improve understanding of meltwater routing under climate change, which is vital for understanding the complex processes that will influence the response of the GrIS to a warming climate.
Meltwater feature shapefiles are available from https://doi.org/10.5281/zenodo.11645884 (Glen, 2024). S2 data were sourced from the Copernicus Open Access Hub (https://scihub.copernicus.eu/, ESA, 2024), and L8 data were obtained from the United States Geological Survey (USGS) Earth Resources Observation Science (EROS) Center (https://eros.usgs.gov, USGS, 2024). The Sentinel-2 User Handbook is available from https://sentinels.copernicus.eu/web/sentinel/user-guides/sentinel-2-msi (ESA, 2015), and the Landsat 8 Data Users Handbook is available from https://www.usgs.gov/media/files/landsat-8-data-users-handbook (USGS, 2019). The meltwater delineation code adapted from Corr et al. (2022) is available from https://doi.org/10.5194/essd-14-209-2022. The full MATLAB source code for the FASTER algorithm is available for download from https://doi.org/10.17863/CAM.25769 (Williamson, 2018b). The MATLAB river delineation code is available from https://github.com/njuRS/River_detection (Yang et al., 2015, 2019b). RACMO2.3p2 data are freely available from the authors of Noel et al. (2019).
The supplement related to this article is available online at https://doi.org/10.5194/tc-19-1047-2025-supplement.
EG, AL and AFB conceptualised the research. AL, AFB, JM and MM contributed to the scientific content, technical details and overall structure of this paper. DC developed the code to automatically delineate meltwater features. OA provided manually digitised meltwater features. BN provided RACMO2.3p2 data. EG carried out the main body of work and drafted the manuscript. All co-authors contributed to the discussion of results and editing of the manuscript.
At least one of the (co-)authors is a member of the editorial board of The Cryosphere. The peer-review process was guided by an independent editor, and the authors also have no other competing interests to declare.
Publisher's note: Copernicus Publications remains neutral with regard to jurisdictional claims made in the text, published maps, institutional affiliations, or any other geographical representation in this paper. While Copernicus Publications makes every effort to include appropriate place names, the final responsibility lies with the authors.
Emily Glen and Amber Leeson received support from the Natural Environment Research Council (NERC) MII Greenland project under award NE/S011390/1 and from the European Space Agency under the POLAR+ 4DGreenland project, ESA contract no. 4000132139/20/I-EF. Alison F. Banwell received support from the U.S. National Science Foundation (NSF) awarded under 1841607 to the University of Colorado Boulder. Malcolm McMillan was supported by the UK NERC Centre for Polar Observation and Modelling and the Lancaster University–UKCEH Centre of Excellence in Environmental Data Science. Brice Noël was funded by the Fonds de la Recherche Scientifique de Belgique (F.R.S.-FNRS).
This research has been supported by the Natural Environment Research Council (grant no. NE/S011390/1), the European Space Agency (grant no. 4000132139/20/I-EF), the National Science Foundation (grant no. 1841607).
This paper was edited by Horst Machguth and reviewed by Andrew Tedstone and one anonymous referee.
Arnold, N. S., Banwell, A. F., and Willis, I. C.: High-resolution modelling of the seasonal evolution of surface water storage on the Greenland Ice Sheet, The Cryosphere, 8, 1149–1160, https://doi.org/10.5194/tc-8-1149-2014, 2014.
Arthur, J. F., Stokes, C. R., Jamieson, S. S. R., Carr, J. R., and Leeson, A. A.: Distribution and seasonal evolution of supraglacial lakes on Shackleton Ice Shelf, East Antarctica, The Cryosphere, 14, 4103–4120, https://doi.org/10.5194/tc-14-4103-2020, 2020.
Banwell, A. F., Arnold, N. S., Willis, I. C., Tedesco, M., and Ahlstrøm, A. P.: Modeling supraglacial water routing and lake filling on the Greenland Ice Sheet, J. Geophys. Res., 117, F04012, https://doi.org/10.1029/2012JF002393, 2012.
Banwell, A. F., Willis, I. C., and Arnold N. S.: Modeling subglacial water routing at Paakitsoq, W Greenland, J. Geophys. Res.-Earth, 118, 1282–1295, https://doi.org/10.1002/jgrf.20093, 2013.
Banwell, A. F., Caballero, M., Arnold, N., Glasser, N., Mac Cathles, L., and MacAyeal, D.: Supraglacial lakes on the Larsen B ice shelf, Antarctica, and at Paakitsoq, West Greenland: A comparative study, Ann. Glaciol., 55, 1–8, https://doi.org/10.3189/2014AoG66A049, 2014.
Banwell, A. F., Hewitt, I., Willis, I. C., and Arnold, N.: Moulin density controls drainage development beneath the Greenland ice sheet, J. Geophys. Res.-Earth, 121, 2248–2269, https://doi.org/10.1002/2015JF003801, 2016.
Banwell, A. F., Willis, I. C., Macdonald, G. J., Goodsell, B., and MacAyeal, D. R.: Direct measurements of ice-shelf flexure caused by surface meltwater ponding and drainage, Nat. Commun., 10, 730, https://doi.org/10.1038/s41467-019-08522-5, 2019.
Bartholomew, I., Nienow, P., Mair, D., Hubbard, A., King, M. A., and Sole, A.: Seasonal evolution of subglacial drainage and acceleration in a Greenland outlet glacier, Nat. Geosci., 3, 408–411, https://doi.org/10.1038/ngeo863, 2010.
Bartholomew, I., Nienow, P., Sole, A., Mair, D., Cowton, T., and King, M. A.: Short-term variability in Greenland Ice Sheet motion forced by time-varying meltwater drainage: Implications for the relationship between subglacial drainage system behavior and ice velocity, J. Geophys. Res., 117, F03002, https://doi.org/10.1029/2011JF002220, 2012.
Bell, R., Chu, W., Kingslake, J., Das, I., Tedesco, M., Tinto, K. J., Zappa, C. J., Frezzotti, M., Boghosian, A., and Lee, W. S.: Antarctic ice shelf potentially stabilized by export of meltwater in surface river, Nature, 544, 344–348, https://doi.org/10.1038/nature22048, 2017.
Benedek, C. L. and Willis, I. C.: Winter drainage of surface lakes on the Greenland Ice Sheet from Sentinel-1 SAR imagery, The Cryosphere, 15, 1587–1606, https://doi.org/10.5194/tc-15-1587-2021, 2021.
Box, J. E. and Ski, K.: Remote sounding of Greenland supra-glacial melt lakes: Implications for subglacial hydraulics, J. Glaciol., 53, 257–264, https://doi.org/10.3189/172756507782202883, 2007.
Chandler, D. M. and Hubbard, A.: Widespread partial-depth hydrofractures in ice sheets driven by supraglacial streams, Nat. Geosci., 16, 605–611, https://doi.org/10.1038/s41561-023-01208-0, 2023.
Christoffersen, P., Bougamont, M., Hubbard, A., Doyle, S. H., Grigsby, S., and Pettersson, R.: Cascading lake drainage on the Greenland Ice Sheet triggered by tensile shock and fracture, Nat. Commun., 9, 1064, https://doi.org/10.1038/s41467-018-03420-8, 2018.
Chudley, T. R., Christoffersen, P., Doyle, S. H., Dowling, T. P. F., Law, R., and Schoonman, C. M.: Controls on water storage and drainage in crevasses on the Greenland Ice Sheet, J. Geophys. Res.-Earth, 126, e2021JF006287, https://doi.org/10.1029/2021JF006287, 2021.
Clerx, N., Machguth, H., Tedstone, A., Jullien, N., Wever, N., Weingartner, R., and Roessler, O.: In situ measurements of meltwater flow through snow and firn in the accumulation zone of the SW Greenland Ice Sheet, The Cryosphere, 16, 4379–4401, https://doi.org/10.5194/tc-16-4379-2022, 2022.
Corr, D., Leeson, A., McMillan, M., Zhang, C., and Barnes, T.: An inventory of supraglacial lakes and channels across the West Antarctic Ice Sheet, Earth Syst. Sci. Data, 14, 209–228, https://doi.org/10.5194/essd-14-209-2022, 2022.
Das, S. B., Joughin, I., Behn, M. D., Howat, I. M., King, M. A., Lizarralde, D., and Bhatia, M. P.: Fracture propagation to the base of the Greenland Ice Sheet during supraglacial lake drainage, Science, 320, 778–781, https://doi.org/10.1126/science.1153360, 2008.
Dell, R., Arnold, N., Willis, I., Banwell, A., Williamson, A., Pritchard, H., and Orr, A.: Lateral meltwater transfer across an Antarctic ice shelf, The Cryosphere, 14, 2313–2330, https://doi.org/10.5194/tc-14-2313-2020, 2020.
Dell, R. L., Willis, I. C., Arnold, N. S., Banwell, A., and de Roda Husman, S.: Substantial contribution of slush to meltwater area across Antarctic ice shelves, Nat. Geosci., 17, 624–630, https://doi.org/10.1038/s41561-024-01466-6, 2024.
Doyle, S. H., Hubbard, A. L., Dow, C. F., Jones, G. A., Fitzpatrick, A., Gusmeroli, A., Kulessa, B., Lindback, K., Pettersson, R., and Box, J. E.: Ice tectonic deformation during the rapid in situ drainage of a supraglacial lake on the Greenland Ice Sheet, The Cryosphere, 7, 129–140, https://doi.org/10.5194/tc-7-129-2013, 2013.
Dunmire, D., Banwell, A. F., Wever, N., Lenaerts, J. T. M., and Datta, R. T.: Contrasting regional variability of buried meltwater extent over 2 years across the Greenland Ice Sheet, The Cryosphere, 15, 2983–3005, https://doi.org/10.5194/tc-15-2983-2021, 2021.
Dunmire, D., Subramanian, A., Hossain, E., Gani, M., Banwell, A., Younas, H., and Myers, B.: Greenland Ice Sheet wide supraglacial lake evolution and dynamics: insights from the 2018 and 2019 melt seasons, Earth Space Sci., 12, e2024EA003793, https://doi.org/10.1029/2024EA003793, 2025.
ESA: Sentinel-2 User Handbook, Issue 1, Rev. 2, European Space Agency [data set], 1–64, https://sentinel.esa.int/documents/247904/685211/Sentinel-2_User_Handbook (last access: 10 April 2024), 2015.
ESA: Sentinel-2 data, Copernicus Open Access Hub [data set], https://scihub.copernicus.eu (last access: 23 August 2024), 2024.
Fitzpatrick, A. A. W., Hubbard, A. L., Box, J. E., Quincey, D. J., van As, D., Mikkelsen, A. P. B., Doyle, S. H., Dow, C. F., Hasholt, B., and Jones, G. A.: A decade (2002–2012) of supraglacial lake volume estimates across Russell Glacier, West Greenland, The Cryosphere, 8, 107–121, https://doi.org/10.5194/tc-8-107-2014, 2014.
Gantayat, P., Banwell, A. F., Leeson, A. A., Lea, J. M., Petersen, D., Gourmelen, N., and Fettweis, X.: A new model for supraglacial hydrology evolution and drainage for the Greenland Ice Sheet (SHED v1.0), Geosci. Model Dev., 16, 5803–5823, https://doi.org/10.5194/gmd-16-5803-2023, 2023.
Gledhill, L. and Williamson, A.: Inland advance of supraglacial lakes in north-west Greenland under recent climatic warming, Ann. Glaciol., 59, 66–82, https://doi.org/10.1017/aog.2017.31, 2018.
Glen, E.: Dataset for: A comparison of supraglacial meltwater features throughout contrasting melt seasons: Southwest Greenland, Zenodo [data set], https://doi.org/10.5281/zenodo.11645884, 2024.
Greuell, W. and Knap, W. H.: Remote sensing of the albedo and detection of the slush line on the Greenland ice sheet, J. Geophys. Res.-Atmos., 105, 15567–15576, 2000.
Halberstadt, A. R. W., Gleason, C. J., Moussavi, M. S., Pope, A., Trusel, L. D., and DeConto, R. M.: Antarctic Supraglacial Lake Identification Using Landsat-8 Image Classification, Remote Sens.-Basel, 12, 1327, https://doi.org/10.3390/rs12081327, 2020.
Hall, D. K., Salomonson, V. V., and Riggs, G. A.: Development of methods for mapping global snow cover using moderate resolution imaging spectroradiometer data, Remote Sens. Environ., 54, 127–140, https://doi.org/10.1016/0034-4257(95)00137-P, 1995.
Hall, D. K., Comiso, J. C., DiGirolamo, N. E., Shuman, C. A., Box, J. E., and Koenig, L. S.: Variability in the surface temperature and melt extent of the Greenland ice sheet from MODIS, Geophys. Res. Lett., 40, 2114–2120, https://doi.org/10.1002/grl.50240, 2013.
Hanna, E., Cappelen, J., Fettweis, X., Mernild, S. H., Mote, T. L., Mottram, R., Steffen, K., Ballinger, T. J., and Hall, R. J.: Greenland surface air temperature changes from 1981 to 2019 and implications for ice-sheet melt and mass-balance change, Int. J. Climatol., 41, E1336–E1352, https://doi.org/10.1002/joc.6771, 2021.
Hanna, E., Topál, D., Box, J. E., Buzzard, S., Christie, F. D. W., Hvidberg, C., Morlighem, M., De Santis, L., Silvano, A., Colleoni, F., Sasgen, I., Banwell, A. F., van den Broeke, M. R., DeConto, R., De Rydt, J., Goelzer, H., Gossart, A., Gudmundsson, G. H., Lindbäck, K., Miles, B., Mottram, R., Pattyn, F., Reese, R., Rignot, E., Srivastava, A., Sun, S., Toller, J., Tuckett, P. A., and Ultee, L.: Short- and long-term variability of the Antarctic and Greenland ice sheets, Nat. Rev. Earth Environ., 5, 193–210, https://doi.org/10.1038/s43017-023-00509-7, 2024.
Harper, J., Humphrey, N., Pfeffer, W. T., Brown, J., and Fettweis, X.: Greenland ice-sheet contribution to sea-level rise buffered by meltwater storage in firn, Nature, 491, 240–243, https://doi.org/10.1038/nature11566, 2012.
Hoffman, M. J., Catania, G. A., Neumann, T. A., Andrews, L. C., and Rumrill, J. A.: Links between acceleration, melting, and supraglacial lake drainage of the western Greenland Ice Sheet, J. Geophys. Res.-Earth Surf., 116, F04035, https://doi.org/10.1029/2010JF001934, 2011.
Hoffman, M., Perego, M., Andrews, L., Price, S., Neumann, T., Johnson, J., Catania, G., and Lüthi, M.: Widespread moulin formation during supraglacial lake drainages in Greenland, Geophys. Res. Lett., 45, 778–788, https://doi.org/10.1002/2017GL075659, 2018.
Holmes, C. W.: Morphology and Hydrology of the Mint Julep Area, Southwest Greenland, in: Project Mint Julep Investigation of Smooth Ice Areas of the Greenland Ice Cap, 1953. Part II Special Scientific Reports, Arctic, Desert, Tropic Information Center, Research Studies Institute, Air University, 1955.
Howat, I. M., de la Peña, S., van Angelen, J. H., Lenaerts, J. T. M., and van den Broeke, M. R.: Brief Communication “Expansion of meltwater lakes on the Greenland Ice Sheet”, The Cryosphere, 7, 201–204, https://doi.org/10.5194/tc-7-201-2013, 2013.
Johansson, A. M., Jansson, P., and Brown, I. A.: Spatial and temporal variations in lakes on the Greenland Ice Sheet, J. Hydrol. 476, 314–320, https://doi.org/10.1016/j.jhydrol.2012.10.045, 2013.
Joughin, I., Howat, I. M., Fahnestock, M., Smith, B., Krabill, W., Alley, R. B., Stern, H., and Truffer, M.: Continued evolution of Jakobshavn Isbræ following its rapid speedup, J. Geophys. Res., 113, F04006, https://doi.org/10.1029/2008JF001023, 2008.
Jullien, N., Tedstone, A. J., Machguth, H., Karlsson, N. B., and Helm, V.: Greenland Ice Sheet ice slab expansion and thickening, Geophys. Res. Lett., 50, e2022GL100911, https://doi.org/10.1029/2022GL100911, 2023.
Krawczynski, M., Behn, M., Das, S., and Joughin, I.: Constraints on the lake volume required for hydro-fracture through ice sheets, Geophys. Res. Lett., 36, L10501, https://doi.org/10.1029/2008gl036765, 2009.
Langley, E. S., Leeson, A. A., Stokes, C. R., and Jamieson, S. S. R.: Seasonal evolution of supraglacial lakes on an East Antarctic outlet glacier, Geophys. Res. Lett., 43, 8563–8571, https://doi.org/10.1002/2016GL069511, 2016.
Leeson, A. A., Shepherd, A., Palmer, S., Sundal, A., and Fettweis, X.: Simulating the growth of supraglacial lakes at the western margin of the Greenland ice sheet, The Cryosphere, 6, 1077–1086, https://doi.org/10.5194/tc-6-1077-2012, 2012.
Leeson, A. A., Shepherd, A., Briggs, K., Howat, I., Fettweis, X., Morlighem, M., and Rignot, E.: Supraglacial lakes on the Greenland ice sheet advance inland under warming climate, Nat. Clim. Change, 5, 51–55, https://doi.org/10.1038/nclimate2463, 2015.
Liang, Y.-L., Colgan, W., Lv, Q., Steffen, K., Abdalati, W., Stroeve, J., Gallaher, D., and Bayou, N.: A decadal investigation of supraglacial lakes in West Greenland using a fully automatic detection and tracking algorithm, Remote Sens. Environ., 123, 127–138, https://doi.org/10.1016/j.rse.2012.03.020, 2012.
Lu, Y., Yang, K., Lu, X., Li, Y., Gao, S., Mao, W., and Li, M.: Response of supraglacial rivers and lakes to ice flow and surface melt on the Northeast Greenland ice sheet during the 2017 melt season, J. Hydrol., 602, 126750, https://doi.org/10.1016/j.jhydrol.2021.126750, 2021.
Lüthje, M., Pedersen, L. T., Reeh, N., and Greuell, W.: Modelling the evolution of supraglacial lakes on the West Greenland ice-sheet margin, J. Glaciol., 52, 608–618, https://doi.org/10.3189/172756506781828386, 2006.
Macdonald, G., Banwell, A., and MacAyeal, D.: Seasonal evolution of supraglacial lakes on a floating ice tongue, Petermann Glacier, Greenland, Ann. Glaciol., 59, 56–65, https://doi.org/10.1017/aog.2018.9, 2018.
MacFerrin, M., Machguth, H., van As, D., Charalampidis, C., Stevens, C. M., Heilig, A., Vandecrux, B., Langen, P. L., Mottram, R., Fettweis, X., van den Broeke, M. R., Pfeffer, W. T., Moussavi, M. S., and Abdalati, W.: Rapid expansion of Greenland's low-permeability ice slabs, Nature, 573, 403–407, https://doi.org/10.1038/s41586-019-1550-3, 2019.
Machguth, H., MacFerrin, M., van As, D., Box, J. E., Charalampidis, C., Colgan, W., Fausto, R. S., Meijer, H. A. J., Mosley-Thompson, E., and van de Wal, R. S. W.: Greenland meltwater storage in firn limited by near-surface ice formation, Nat. Clim. Change, 6, 390–393, https://doi.org/10.1038/nclimate2899, 2016.
Machguth, H., Tedstone, A., and Mattea, E.: Daily variations in Western Greenland slush limits, 2000–2021, J. Glaciol., 69, 191–203, https://doi.org/10.1017/jog.2022.65, 2023.
McFeeters, S. K.: The use of the Normalized Difference Water Index (NDWI) in the delineation of open water features, Int. J. Remote Sens., 17, 1425–1432, https://doi.org/10.1080/01431169608948714, 1996.
McMillan, M., Nienow, P., Shepherd, A., Benham, T., and Sole, A.: Seasonal evolution of supra-glacial lakes on the Greenland Ice Sheet, Earth Planet. Sc. Lett., 262, 484–492, https://doi.org/10.1016/j.epsl.2007.08.002, 2007.
Melling, L., Leeson, A., McMillan, M., Maddalena, J., Bowling, J., Glen, E., Sandberg Sørensen, L., Winstrup, M., and Lørup Arildsen, R.: Evaluation of satellite methods for estimating supraglacial lake depth in southwest Greenland, The Cryosphere, 18, 543–558, https://doi.org/10.5194/tc-18-543-2024, 2024.
Miles K. E., Willis I. C., Benedek, C. L., Williamson, A. G., and Tedesco, M.: Toward Monitoring Surface and Subsurface Lakes on the Greenland Ice Sheet Using Sentinel-1 SAR and Landsat-8 OLI Imagery, Front. Earth Sci., 5, 58, https://doi.org/10.3389/feart.2017.00058, 2017.
Miller, O., Solomon, D. K., Miège, C., Koenig, L., Forster, R., Schmerr, N., Ligtenberg, S. R. M., and Montgomery, L.: Direct evidence of meltwater flow within a firn aquifer in southeast Greenland, Geophys. Res. Lett., 45, 207–215, https://doi.org/10.1002/2017GL075707, 2018.
Miller, O., Solomon, D. K., Miège, C., Koenig, L., Forster, R., Schmerr, N., Ligtenberg, S. R. M., Legchenko, A., Voss, C. I., Montgomery, L., and McConnell, J. R.: Hydrology of a perennial firn aquifer in southeast Greenland: an overview driven by field data, Water Resour. Res., 56, 4–8, https://doi.org/10.1029/2019WR026348, 2020.
Miller, J. Z., Culberg, R., Long, D. G., Shuman, C. A., Schroeder, D. M., and Brodzik, M. J.: An empirical algorithm to map perennial firn aquifers and ice slabs within the Greenland Ice Sheet using satellite L-band microwave radiometry, The Cryosphere, 16, 103–125, https://doi.org/10.5194/tc-16-103-2022, 2022.
Morlighem, M., Williams, C., Rignot, E., An, L., Arndt, J. E., Bamber, J., Catania, G., Chauché, N., Dowdeswell, J. A., Dorschel, B., Fenty, I., Hogan, K., Howat, I., Hubbard, A., Jakobsson, M., Jordan, T. M., Kjeldsen, K. K., Millan, R., Mayer, L., Mouginot, J., Noël, B., O'Cofaigh, C., Palmer, S. J., Rysgaard, S., Seroussi, H., Siegert, M. J., Slabon, P., Straneo, F., van den Broeke, M. R., Weinrebe, W., Wood, M., and Zinglersen, K.: BedMachine v3: Complete bed topography and ocean bathymetry mapping of Greenland from multi-beam echo sounding combined with mass conservation, Geophys. Res. Lett., 44, 11051–11061, https://doi.org/10.1002/2017GL074954, 2017.
Morlighem, M., Williams, C., Rignot, E., An, L., Arndt, J. E., Bamber, J., Catania, G., Chauché, N., Dowdeswell, J. A., Dorschel, B., Fenty, I., Hogan, K., Howat, I., Hubbard, A., Jakobsson, M., Jordan, T. M., Kjeldsen, K. K., Millan, R., Mayer, L., Mouginot, J., Noël, B., O'Cofaigh, C., Palmer, S. J., Rysgaard, S., Seroussi, H., Siegert, M. J., Slabon, P., Straneo, F., van den Broeke, M. R., Weinrebe, W., Wood, M., and Zinglersen, K.: IceBridge BedMachine Greenland, Version 5, NASA National Snow and Ice Data Center Distributed Active Archive Center [data set], https://doi.org/10.5067/GMEVBWFLWA7X, 2022.
Mouginot, J., Rignot, E., Bjørk, A. A., van den Broeke, M., Millan, R., Morlighem, M., Noël, B., Scheuchl, B., and Wood, M.: Forty-six years of Greenland Ice Sheet mass balance from 1972 to 2018, P. Natl. Acad. Sci. USA, 116, 9239–9244, https://doi.org/10.1073/pnas.1904242116, 2019.
Nienow, P. W., Sole, A. J., Slater, D. A., and Cowton, T. R.: Recent advances in our understanding of the role of meltwater in the Greenland Ice Sheet system, Current Climate Change Reports, 3, 330–344, https://doi.org/10.1007/s40641-017-0083-9 2017.
Noël, B., van de Berg, W. J., van Wessem, J. M., van Meijgaard, E., van As, D., Lenaerts, J. T. M., Lhermitte, S., Kuipers Munneke, P., Smeets, C. J. P. P., van Ulft, L. H., van de Wal, R. S. W., and van den Broeke, M. R.: Modelling the climate and surface mass balance of polar ice sheets using RACMO2 – Part 1: Greenland (1958–2016), The Cryosphere, 12, 811–831, https://doi.org/10.5194/tc-12-811-2018, 2018.
Noël, B., van de Berg, W. J., Lhermitte, S., and van den Broeke, M. R.: Rapid ablation zone expansion amplifies North Greenland mass loss, Science Advances, 5, 2–11, https://doi.org/10.1126/sciadv.aaw0123, 2019.
Otosaka, I. N., Shepherd, A., Ivins, E. R., Schlegel, N.-J., Amory, C., van den Broeke, M. R., Horwath, M., Joughin, I., King, M. D., Krinner, G., Nowicki, S., Payne, A. J., Rignot, E., Scambos, T., Simon, K. M., Smith, B. E., Sørensen, L. S., Velicogna, I., Whitehouse, P. L., A, G., Agosta, C., Ahlstrøm, A. P., Blazquez, A., Colgan, W., Engdahl, M. E., Fettweis, X., Forsberg, R., Gallée, H., Gardner, A., Gilbert, L., Gourmelen, N., Groh, A., Gunter, B. C., Harig, C., Helm, V., Khan, S. A., Kittel, C., Konrad, H., Langen, P. L., Lecavalier, B. S., Liang, C.-C., Loomis, B. D., McMillan, M., Melini, D., Mernild, S. H., Mottram, R., Mouginot, J., Nilsson, J., Noël, B., Pattle, M. E., Peltier, W. R., Pie, N., Roca, M., Sasgen, I., Save, H. V., Seo, K.-W., Scheuchl, B., Schrama, E. J. O., Schröder, L., Simonsen, S. B., Slater, T., Spada, G., Sutterley, T. C., Vishwakarma, B. D., van Wessem, J. M., Wiese, D., van der Wal, W., and Wouters, B.: Mass balance of the Greenland and Antarctic ice sheets from 1992 to 2020, Earth Syst. Sci. Data, 15, 1597–1616, https://doi.org/10.5194/essd-15-1597-2023, 2023.
Otto, J., Holmes, F. A., and Kirchner, N.: Supraglacial lake expansion, intensified lake drainage frequency, and first observation of coupled lake drainage, during 1985–2020 at Ryder Glacier, Northern Greenland, Front. Earth Sci., 10, 978137, https://doi.org/10.3389/feart.2022.978137, 2022.
Philpot, W. D.: Bathymetric mapping with passive multispectral imagery, Appl. Optics, 28, 1569–1578, https://doi.org/10.1364/AO.28.001569, 1989.
Pope, A., Scambos, T. A., Moussavi, M., Tedesco, M., Willis, M., Shean, D., and Grigsby, S.: Estimating supraglacial lake depth in West Greenland using Landsat 8 and comparison with other multispectral methods, The Cryosphere, 10, 15–27, https://doi.org/10.5194/tc-10-15-2016, 2016.
Porter, C., Morin, P., Howat, I., Noh, M.-J., Bates, B., Peterman, K., Keesey, S., Schlenk, M., Gardiner, J., Tomko, K., Willis, M., Kelleher, C., Cloutier, M., Husby, E., Foga, S., Nakamura, H., Platson, M., Wethington Jr., M., Williamson, C., Bauer, G., Enos, J., Arnold, G., Kramer, W., Becker, P., Doshi, A., D'Souza, C., Cummens, P., Laurier, F., and Bojesen, M.: ArcticDEM, v3.0, Harvard Dataverse [data set], https://doi.org/10.7910/DVN/OHHUKH, 2018.
Rahmani, S., Strait, M., Merkurjev, D., Moeller, M., and Wittman, T.: An Adaptive IHS Pan-Sharpening Method, IEEE Geosci. Remote S., 7, 746–750, https://doi.org/10.1109/LGRS.2010.2046715, 2010.
Rawlins, L. D., Rippin, D. M., Sole, A. J., Livingstone, S. J., and Yang, K.: Seasonal evolution of the supraglacial drainage network at Humboldt Glacier, northern Greenland, between 2016 and 2020, The Cryosphere, 17, 4729–4750, https://doi.org/10.5194/tc-17-4729-2023, 2023.
Raymond, C. and Nolan, M.: Drainage of a glacial lake through an ice spillway, Int. Assoc. Hydrol. Sci. Publ., 264, 199–210, http://iahs.info/uploads/dms/iahs_264_0199.pdf (last access: 17 June 2024), 2000.
Sasgen, I., Wouters, B., Gardner, A. S., King, M. D., Tedesco, M., Landerer, F. W., Dahle, C., Save, H., and Fettweis, X.: Return to rapid ice loss in Greenland and record loss in 2019 detected by the GRACE-FO satellites, Commun. Earth Environ., 1, 8, https://doi.org/10.1038/s43247-020-0010-1, 2020.
Selmes, N., Murray, T., and James, T. D.: Fast draining lakes on the Greenland ice sheet, Geophys. Res. Lett., 38, L15501, https://doi.org/10.1029/2011GL047872, 2011.
Selmes, N., Murray, T., and James, T. D.: Characterizing supraglacial lake drainage and freezing on the Greenland Ice Sheet, The Cryosphere Discuss., 7, 475–505, https://doi.org/10.5194/tcd-7-475-2013, 2013.
Smith, L. C., Chu, V. W., Yang, K., Gleason, C. J., Pitcher, L. H., Rennermalm, A. K., Legleiter, C. J., Behar, A. E., Overstreet, B. T., Moustafa, S. E., Tedesco, M., Forster, R. R., LeWinter, A. L., Finnegan, D. C., Sheng, Y., and Balog, J.: Efficient meltwater drainage through supraglacial streams and rivers on the southwest Greenland ice sheet, P. Natl. Acad. Sci. USA, 112, 1001–1006, https://doi.org/10.1073/pnas.1413024112, 2015.
Smith, L. C., Andrews, L. C., Pitcher, L. H., Overstreet, B. T., Rennermalm, Å. K., and Cooper, M. G.: Supraglacial river forcing of subglacial water storage and diurnal ice sheet motion, Geophys. Res. Lett., 48, e2020GL091418, https://doi.org/10.1029/2020GL091418, 2021.
Sneed, W. and Hamilton, G.: Validation of a method for determining the depth of glacial melt ponds using satellite imagery, Ann. Glaciol., 52, 15–22, https://doi.org/10.3189/172756411799096240, 2011.
Sneed, W. A. and Hamilton, G. S.: Evolution of melt pond volume on the surface of the Greenland Ice Sheet, Geophys. Res. Lett., 34, L03501, https://doi.org/10.1029/2006GL028697, 2007.
Sole, A., Mair, D. W. F., Nienow, P. W., Bartholomew, I. D., King, M. A., Burke, M. J., and Joughin, I.: Seasonal speedup of a Greenland marine-terminating outlet glacier forced by surface melt-induced changes in subglacial hydrology, J. Geophys. Res.-Earth, 116, F03014, https://doi.org/10.1029/2010JF001948, 2011.
Stokes, C. R., Sanderson, J. E., Miles, B. W. J., Jamieson, S. S. R., and Leeson, A. A.: Widespread distribution of supraglacial lakes around the margin of the East Antarctic Ice Sheet, Sci. Rep.-UK, 9, 13823, https://doi.org/10.1038/s41598-019-50343-5, 2019.
Sundal, A. V., Shepherd, A., Nienow, P., Hanna, E., Palmer, S., and Huybrechts, P.: Evolution of supra-glacial lakes across the Greenland ice sheet, Remote Sens. Environ., 113, 2164–2171, https://doi.org/10.1016/j.rse.2009.05.018, 2009.
Tedesco, M. and Fettweis, X.: Unprecedented atmospheric conditions (1948–2019) drive the 2019 exceptional melting season over the Greenland ice sheet, The Cryosphere, 14, 1209–1223, https://doi.org/10.5194/tc-14-1209-2020, 2020.
Tedstone, A. and Machguth, H.: Increasing surface runoff from Greenland's firn areas, Nat. Clim. Change, 12, 672–676, https://doi.org/10.1038/s41558-022-01371-z, 2022.
Tedesco, M., Willis, I. C., Hoffman, M. J., Banwell, A. F., Alexander, P., and Arnold, N. S.: Ice dynamic response to two modes of surface lake drainage on the Greenland ice sheet, Environ. Res. Lett., 8, 034007, https://doi.org/10.1088/1748-9326/8/3/034007, 2013.
Tedesco, M., Box, J. E., Cappelen, J., Fausto, R. S., Fettweis, X., Anderson, J. K., Mote, T., Smeets, C. J. P. P., van As, D., and van de Wal, R. S. W.: NOAA Arctic Report Card 2018: Greenland Ice Sheet in Arctic Report Card 2018, https://arctic.noaa.gov/Report-Card/Report-Card-2018 (last access: 13 April 2023), 2018.
Tedesco, M., Moon, T., Anderson, J. K., Box, J. E., Cappelen, J., Fausto, R. S., Fettweis, X., Loomis, B., Mankoff, K. D., Mote, T., Smeets, C. J. P. P., van As, D., and van de Wal, R. S. W.: Greenland Ice Sheet in Arctic Report Card 2019, https://arctic.noaa.gov/Report-Card/Report-Card-2019 (last access: 13 April 2023), 2019.
The IMBIE Team: Mass balance of the Greenland Ice Sheet from 1992 to 2018, Nature, 579, 233–239, https://doi.org/10.1038/s41586-019-1855-2, 2020.
Trusel, L. D., Das, S. B., Osman, M. B., Evans, M. J., Smith, B. E., Fettweis, X., McConnell, J. R., Noël, B. P., and van den Broeke, M. R.: Nonlinear rise in Greenland runoff in response to post-industrial Arctic warming, Nature, 564, 104–108, https://doi.org/10.1038/s41586-018-0752-4, 2018.
Turton, J. V., Hochreuther, P., Reimann, N., and Blau, M. T.: The distribution and evolution of supraglacial lakes on 79° N Glacier (north-eastern Greenland) and interannual climatic controls, The Cryosphere, 15, 3877–3896, https://doi.org/10.5194/tc-15-3877-2021, 2021.
USGS: Landsat 8 Data Users Handbook, Version 5.0, U.S. Geological Survey [data set], 1–105, https://www.usgs.gov/media/files/lsds-1574l8datausershandbook-v50pdf (last access: 20 May 2024), 2019.
USGS: Landsat 8 data, Earth Resources Observation Science (EROS) Center [data set], https://eros.usgs.gov (last access: 18 August 2024), 2024.
van As, D., Hubbard, A. L., Hasholt, B., Mikkelsen, A. B., van den Broeke, M. R., and Fausto, R. S.: Large surface meltwater discharge from the Kangerlussuaq sector of the Greenland ice sheet during the record-warm year 2010 explained by detailed energy balance observations, The Cryosphere, 6, 199–209, https://doi.org/10.5194/tc-6-199-2012, 2012.
van den Broeke, M. R., Enderlin, E. M., Howat, I. M., Kuipers Munneke, P., Noël, B. P. Y., van de Berg, W. J., van Meijgaard, E., and Wouters, B.: On the recent contribution of the Greenland ice sheet to sea level change, The Cryosphere, 10, 1933–1946, https://doi.org/10.5194/tc-10-1933-2016, 2016.
Williamson, A.: Full source code for the Fully Automated Supraglacial lake Tracking at Enhanced Resolution (“FASTER”) algorithm, version 1 [software], https://doi.org/10.17863/CAM.25769, 2018.
Williamson, A., Arnold, N., Banwell, A., and Willis, I.: A Fully Automated Supraglacial lake area and volume Tracking (“FAST”) algorithm: Development and application using MODIS imagery of West Greenland, Remote Sens. Environ., 196, 113–133, https://doi.org/10.1016/j.rse.2017.04.032, 2017.
Williamson, A. G., Banwell, A. F., Willis, I. C., and Arnold, N. S.: Dual-satellite (Sentinel-2 and Landsat 8) remote sensing of supraglacial lakes in Greenland, The Cryosphere, 12, 3045–3065, https://doi.org/10.5194/tc-12-3045-2018, 2018a.
Williamson, A. G., Willis, I. C., Arnold, N. S., and Banwell, A. F.: Controls on rapid supraglacial lake drainage in West Greenland: An Exploratory Data Analysis approach, J. Glaciol., 64, 208–226, https://doi.org/10.1017/jog.2018.8 2018b.
Yang, K. and Smith, L. C.: Supraglacial Streams on the Greenland Ice Sheet Delineated From Combined Spectral–Shape Information in High-Resolution Satellite Imagery, IEEE Geosci. Remote Sens. Lett., 10, 801–805, https://doi.org/10.1109/LGRS.2012.2224316, 2012.
Yang, K. and Smith, L. C.: Supraglacial Streams on the Greenland Ice Sheet Delineated From Combined Spectral–Shape Information in High-Resolution Satellite Imagery, IEEE Geosci. Remote S., 10, 801–805, https://doi.org/10.1109/LGRS.2012.2224316, 2013.
Yang, K., Smith, L. C., Chu, V. W., Gleason, C. J., and Li, M.: A caution on the use of surface digital elevation models to simulate supraglacial hydrology of the Greenland Ice Sheet, IEEE J. Sel. Top. Appl., 8, 5212–5224, https://doi.org/10.1109/JSTARS.2015.2483483, 2015.
Yang, K., Smith, L. C., Chu, V. W., Pitcher, L. H., Gleason, C. J., Rennermalm, A. K., and Li, M.: Fluvial morphometry of supraglacial river networks on the southwest Greenland Ice Sheet, GISci. Remote Sens., 53, 459–482, https://doi.org/10.1080/15481603.2016.1162345, 2016.
Yang, K., Smith, L. C., Sole, A., Livingstone, S. J., Cheng, X., Chen, Z., and Li, M.: Supraglacial rivers on the northwest Greenland Ice Sheet, Devon Ice Cap, and Barnes Ice Cap mapped using Sentinel-2 imagery, Int. J. Appl. Earth Obs., 78, 1–13, https://doi.org/10.1016/j.jag.2019.01.008, 2019a.
Yang, K., Lu, X., and Lu, Y.: River Detection Code, GitHub [code],https://github.com/njuRS/River_detection (last access: 6 March 2024), 2019b.
Yang, K., Smith, L. C., Cooper, M. G., Pitcher, L. H., Van As, D., Lu, Y., Lu, X., and Li, M.: Seasonal evolution of supraglacial lakes and rivers on the southwest Greenland Ice Sheet, J. Glaciol., 67, 592–602, https://doi.org/10.1017/jog.2021.10, 2021.
Zhang, W., Yang, K., Smith, L. C., Wang, Y., van As, D., Noël, B., Lu, Y., and Liu, J.: Pan-Greenland mapping of supraglacial rivers, lakes, and water-filled crevasses in a cool summer (2018) and a warm summer (2019), Remote Sens. Environ., 297, 113781, https://doi.org/10.1016/j.rse.2023.113781, 2023.
Zheng, L., Li, L., Chen, Z., He, Y., Mo, L., Chen, D., Hu, Q., Wang, L., Liang, Q., and Cheng, X.: Multi-sensor imaging of winter buried lakes in the Greenland Ice Sheet, Remote Sens. Environ., 295, 113688, https://doi.org/10.1016/j.rse.2023.113688, 2023.
Zwally, H. J., Abdalati, W., Herring, T., Larson, K., Saba, J., and Steffen, K.: Surface melt-induced acceleration of Greenland ice-sheet flow, Science, 297, 218–222, https://doi.org/10.1126/science.1072708, 2002.