the Creative Commons Attribution 4.0 License.
the Creative Commons Attribution 4.0 License.
 | 27 Feb 2024
Brief communication: Recent estimates of glacier mass loss for western North America from laser altimetry
Alex Gardner
Caitlyn Florentine
Andrew Fountain
Glaciers in western North American outside of Alaska are often overlooked in global studies because their potential to contribute to changes in sea level is small. Nonetheless, these glaciers represent important sources of freshwater, especially during times of drought. Differencing recent ICESat-2 data from a digital elevation model derived from a combination of synthetic aperture radar data (TerraSAR-X/TanDEM-X), we find that over the period 2013–2020, glaciers in western North America lost mass at a rate of Gt yr−1. This rate is comparable to the rate of mass loss ( Gt yr−1) for the period 2018–2022 calculated through trend analysis using ICESat-2 and Global Ecosystems Dynamics Investigation (GEDI) data.
- Article
(2103 KB) - Full-text XML
-
Supplement
(474 KB) - BibTeX
- EndNote


Western North American glaciers outside of Alaska cover 14 384 km2 of mountainous terrain (Pfeffer et al., 2014). Although the global sea level equivalent of these glaciers is only 2.6±0.7 mm (Farinotti et al., 2019), these glaciers provide important thermal buffering capacity during late summer or during times of drought (Moore et al., 2009). Early attempts to define regional estimates of glacier mass change suffered from sparse in situ glaciological observations, non-uniform distribution of geodetic measurements, and uncertainties in gravimetric assessments due to changes in seasonal water storage (Jacob et al., 2012; Gardner et al., 2013; Zemp et al., 2019). Two recent studies combined publicly available geodetic datasets and statistical methods to yield mass change estimates with much less spatial bias and lower overall uncertainties (Menounos et al., 2019; Hugonnet et al., 2021). Both of these studies rely on digital elevation models (DEMs) generated from NASA's Advanced Spaceborne Thermal Emission and Reflection Radiometer (ASTER) sensor aboard the Terra satellite. Unfortunately, Terra's orbit is degrading and will reach the end of its lifespan within the next 3–4 years (https://terra.nasa.gov/, last access: December 2023). Additional datasets are thus required to quantify glacier mass loss in mountain environments where glacier loss is accelerating (Hugonnet et al., 2021), but the glaciers of western North America have so far been excluded from global altimetry assessments (Jakob and Gourmelen, 2023). Eight of the 19 regions of the globally complete Randolph Glacier Inventory (RGI) are sparsely glacierized, including western North America. Models and current ice volume estimates suggest that these regions will each contribute ≤2 mm to sea level by 2100 under a +2 °C global mean temperature warming scenario (Rounce et al., 2023). Several of these regions were not assessed by Jakob and Gourmelen (2023) due to the small size of the glaciers within these regions and complex topography that make CryoSat-2 processing challenging, due in part to the larger beam diameter of CryoSat-2 (∼380 m) compared to ICESat-2 (∼12 m). Here we provide new estimates of recent glacier mass loss based on laser altimetry data for the western United States and Canada, which is region 02 of the Randolph Glacier Inventory (Pfeffer et al., 2014).
2.1 Altimetric data (ICESat-2 and GEDI)
Altimetric data include observations made by NASA's Advanced Topographic Laser Altimeter System (ATLAS), which is a 532 nm photon-counting laser system aboard the Ice, Cloud and land Elevation Satellite (ICESat-2) satellite that operates in latitudes between 88° N, 88° S (Markus et al., 2017). We use version 5 of the ATL06 (land–ice surface heights) dataset that includes laser shots from 13 October 2018 to 12 October 2022. We also used Global Ecosystem Dynamics Investigation (GEDI) laser data (Liu et al., 2021) acquired between 1 January 2018 and 1 January 2022 (GEDI02_A release 2). GEDI is a 1064 nm, full-waveform laser that, because of its operation aboard the International Space Station, operates in latitudes between 51.6° N, 51.6° S.
2.2 Digital elevation model
The mass change estimate for approximately the last decade (2013 to 2020), herein referred to as the decadal estimate, uses the global, 30 m Copernicus DEM elevation data derived from the TanDEM-X Synthetic Aperture Radar (SAR) mission (Rizzoli et al., 2017) and made publicly available as the Glo30 product, herein referred to as COP-30 (https://spacedata.copernicus.eu/collections/copernicus-digital-elevation-model, last access: September 2023). Acquisition of the data used in COP-30 DEM occurred between 2010 and early 2015, and the coverage represented about five individual SAR tiles in our study region. Because no gridded acquisition date exists for COP-30, we use an acquisition date of 2013, which coincides with the midpoint for the majority of DEM acquisitions (Rizzoli et al., 2017). As described below, we use the ambiguity of DEM acquisition dates as one source of uncertainty in our mass change estimate. Another source of uncertainty is penetration of the TanDEM-X radar signal into high-elevation firn and snow surfaces (Abdullahi et al., 2019). As described in the discussion section of our paper, we consider the magnitude of this bias to be small.
For each subregion, we reprojected the COP-30 into the respective Universal Transverse Mercator (UTM) zone of a given subregion. The COP-30 vertical datum is EGM96, which we converted to match the vertical datum of ICESat-2 (WGS84). We clipped ICESat-2 data for a given acquisition date to a region of interest and extracted the closest grid point of the COP-30 data for a given laser shot. Retained data include the elevation of both COP-30 and ICESat-2, derived elevation change (m), and rates of elevation change (m yr−1). We also include other original attributes present with the ICESat-2 data (e.g., track number, effective laser shot radius, and slope) to maintain metadata continuity. Excluded elevation change values exceeded elevation change rates of −20 or 20 m yr−1, since we assumed that these signals exceed the range of what is physically attributable to glacier processes. To our knowledge, we know of no glaciers in western North America that have experienced surging or advance over the past 2 decades (Bevington and Menounos, 2022; Fountain et al., 2023).
For the decadal estimate of mass change, we buffered each glacier polygon (RGI 6.0) within the study region by 1 km and then masked from the original glacier polygon to capture areas adjacent to glaciers that we considered to be areas of stable terrain. This stable terrain might include vegetated terrain, landslides, or standing water, however. Due to the buffer, we expect the results to be robust to glacier polygon updates. Note that the recently released RGI 7.0 has no changes from RGI 6.0 in our study area. An inspection of the elevation change over stable terrain for all ICESat-2 laser shots (2.24×10⁶) reveals a positive bias for almost every subregion, typically on the order of 0.1–0.5 m yr−1 (ICESat-2 minus COP-30); this bias, however, did not substantially vary with elevation for a given region. Visual inspection of elevation change maps and review of acquisition dates of ICESat-2 data suggests this positive bias arises by laser shots over snow-covered terrain (cf. Enderlin et al., 2022). We therefore limit our analysis to the ablation season when the positive bias associated with snow-covered terrain is minimized. Confirmation of the source of this bias is revealed when the analysis of rates of elevation change is limited to ICESat-2 laser shots acquired between 1 August and 1 October. For these late-summer laser shots, we, respectively, observe a mean bias and uncertainty (±1σ) over stable terrain of 0.038 and 1.53 m yr−1.
2.3 Recent rate of elevation change from ICESat-2 and GEDI
For the period 2018–2022, herein referred to as the recent period, we first create altimetry anomalies by differencing ICESat-2 and GEDI laser shots to the COP-30 DEM. A least squares regression that includes an offset, trend, and seasonal sinusoidal terms is fit to anomalies within a 250 m radius search window. The y intercept of the regression is set to the year 2020. We exclude any ICESat-2 or GEDI laser shots if they deviate more than 250 m from the COP-30 DEM or if they deviate by more than 150 m from the median anomaly within the 250 m search radius. The search radius and median anomaly threshold were selected to omit elevation change signals that were not physically realistic. Regression fits were excluded from further analysis if (i) there were fewer than five data point for given search window; (ii) the temporal span of observations is shorter than 3 years; (iii) the root mean squared error (RMSE) of the fit residuals exceed 5.0 m yr−1; and (iv) the seasonal amplitude of the least squares fit exceeds 10 m yr−1. We use the trend obtained from the regression to the 250 m radius to represent elevation change. This filtering yielded an unbiased sample across elevation bins of ice in study area (i.e., the area distributions of sampled vs. observed ice were similar).
2.4 Mass change uncertainty
Uncertainty in mass change originates from errors in rates of elevation change and volume-to-mass conversion factor. We use 850 kg m−3 and its associated uncertainty term (±60 kg m−3) for mass conversion (Huss, 2013). We generate bootstrapped errors in total volume change using a Monte Carlo method. We first temporally randomize the laser altimetric data, randomly choose the acquisition date of the COP-30 DEM (2012, 2013, and 2014), and sample 5 % of the data with the replacement 1000 times. Total volume change over glacierized terrain is calculated for each synthetic dataset by multiplying the rate of elevation change by the area of glaciers within a given elevation bin (100 m bins). We then take 5 % and 95 % modeled volume change as our uncertainty.
Uncertainty in mass change is then calculated from
where dVσ is the uncertainty about the volume change generated from the Monte Carlo method; ρ is material density (850 kg m−3); ρσ is uncertainty about the density (60 kg m−3); and dV is the change in volume.
To minimize the impact of the seasonal snow signal, we limit the presentation of our analysis to mass change using ICESat-2 and COP-30 elevation changes to ICESat-2 data acquired during the latter half of the ablation season (1 August–1 October). Glaciers throughout the western United States and Canada thinned both during the decadal and recent period, with prominent thinning within the southern Coast Mountains, a region that contains nearly one-half of the total ice cover of the study region (Fig. 2). For the period 2013–2020 (median date of ICESat-2 data is 26 August 2020), we estimate a rate of mass change of Gt yr−1 (Fig. 1). This measurement agrees within the rate of mass change ( Gt yr−1) reported for the period 2009–2018 (Menounos et al., 2019) and the estimate ( Gt yr−1) for the period 2015–2019, based primarily on ASTER data (Hugonnet et al., 2021). Comparable estimates of mass loss exist for western North America for the period 1961–2016 ( Gt yr−1) and for the period 2002–2009 ( Gt yr−1), respectively, from Zemp et al. (2019) and Gardner et al. (2013). Using only ICESat-2 and GEDI laser shots and rates of elevation change determined through least squares fitting (i.e., the recent period), glaciers lost Gt yr−1 of mass for the period 2018–2022 (Fig. 2). Mass change rates per subregions (Fig. 1) are summarized in the Supplement (Table S1). The effect of a small sample size is evident in the larger uncertainty about the elevation change at highest and lowest elevations (Fig. 2), but the contribution of this error to total mass change is small, since little total glacierized area exists at these elevations.
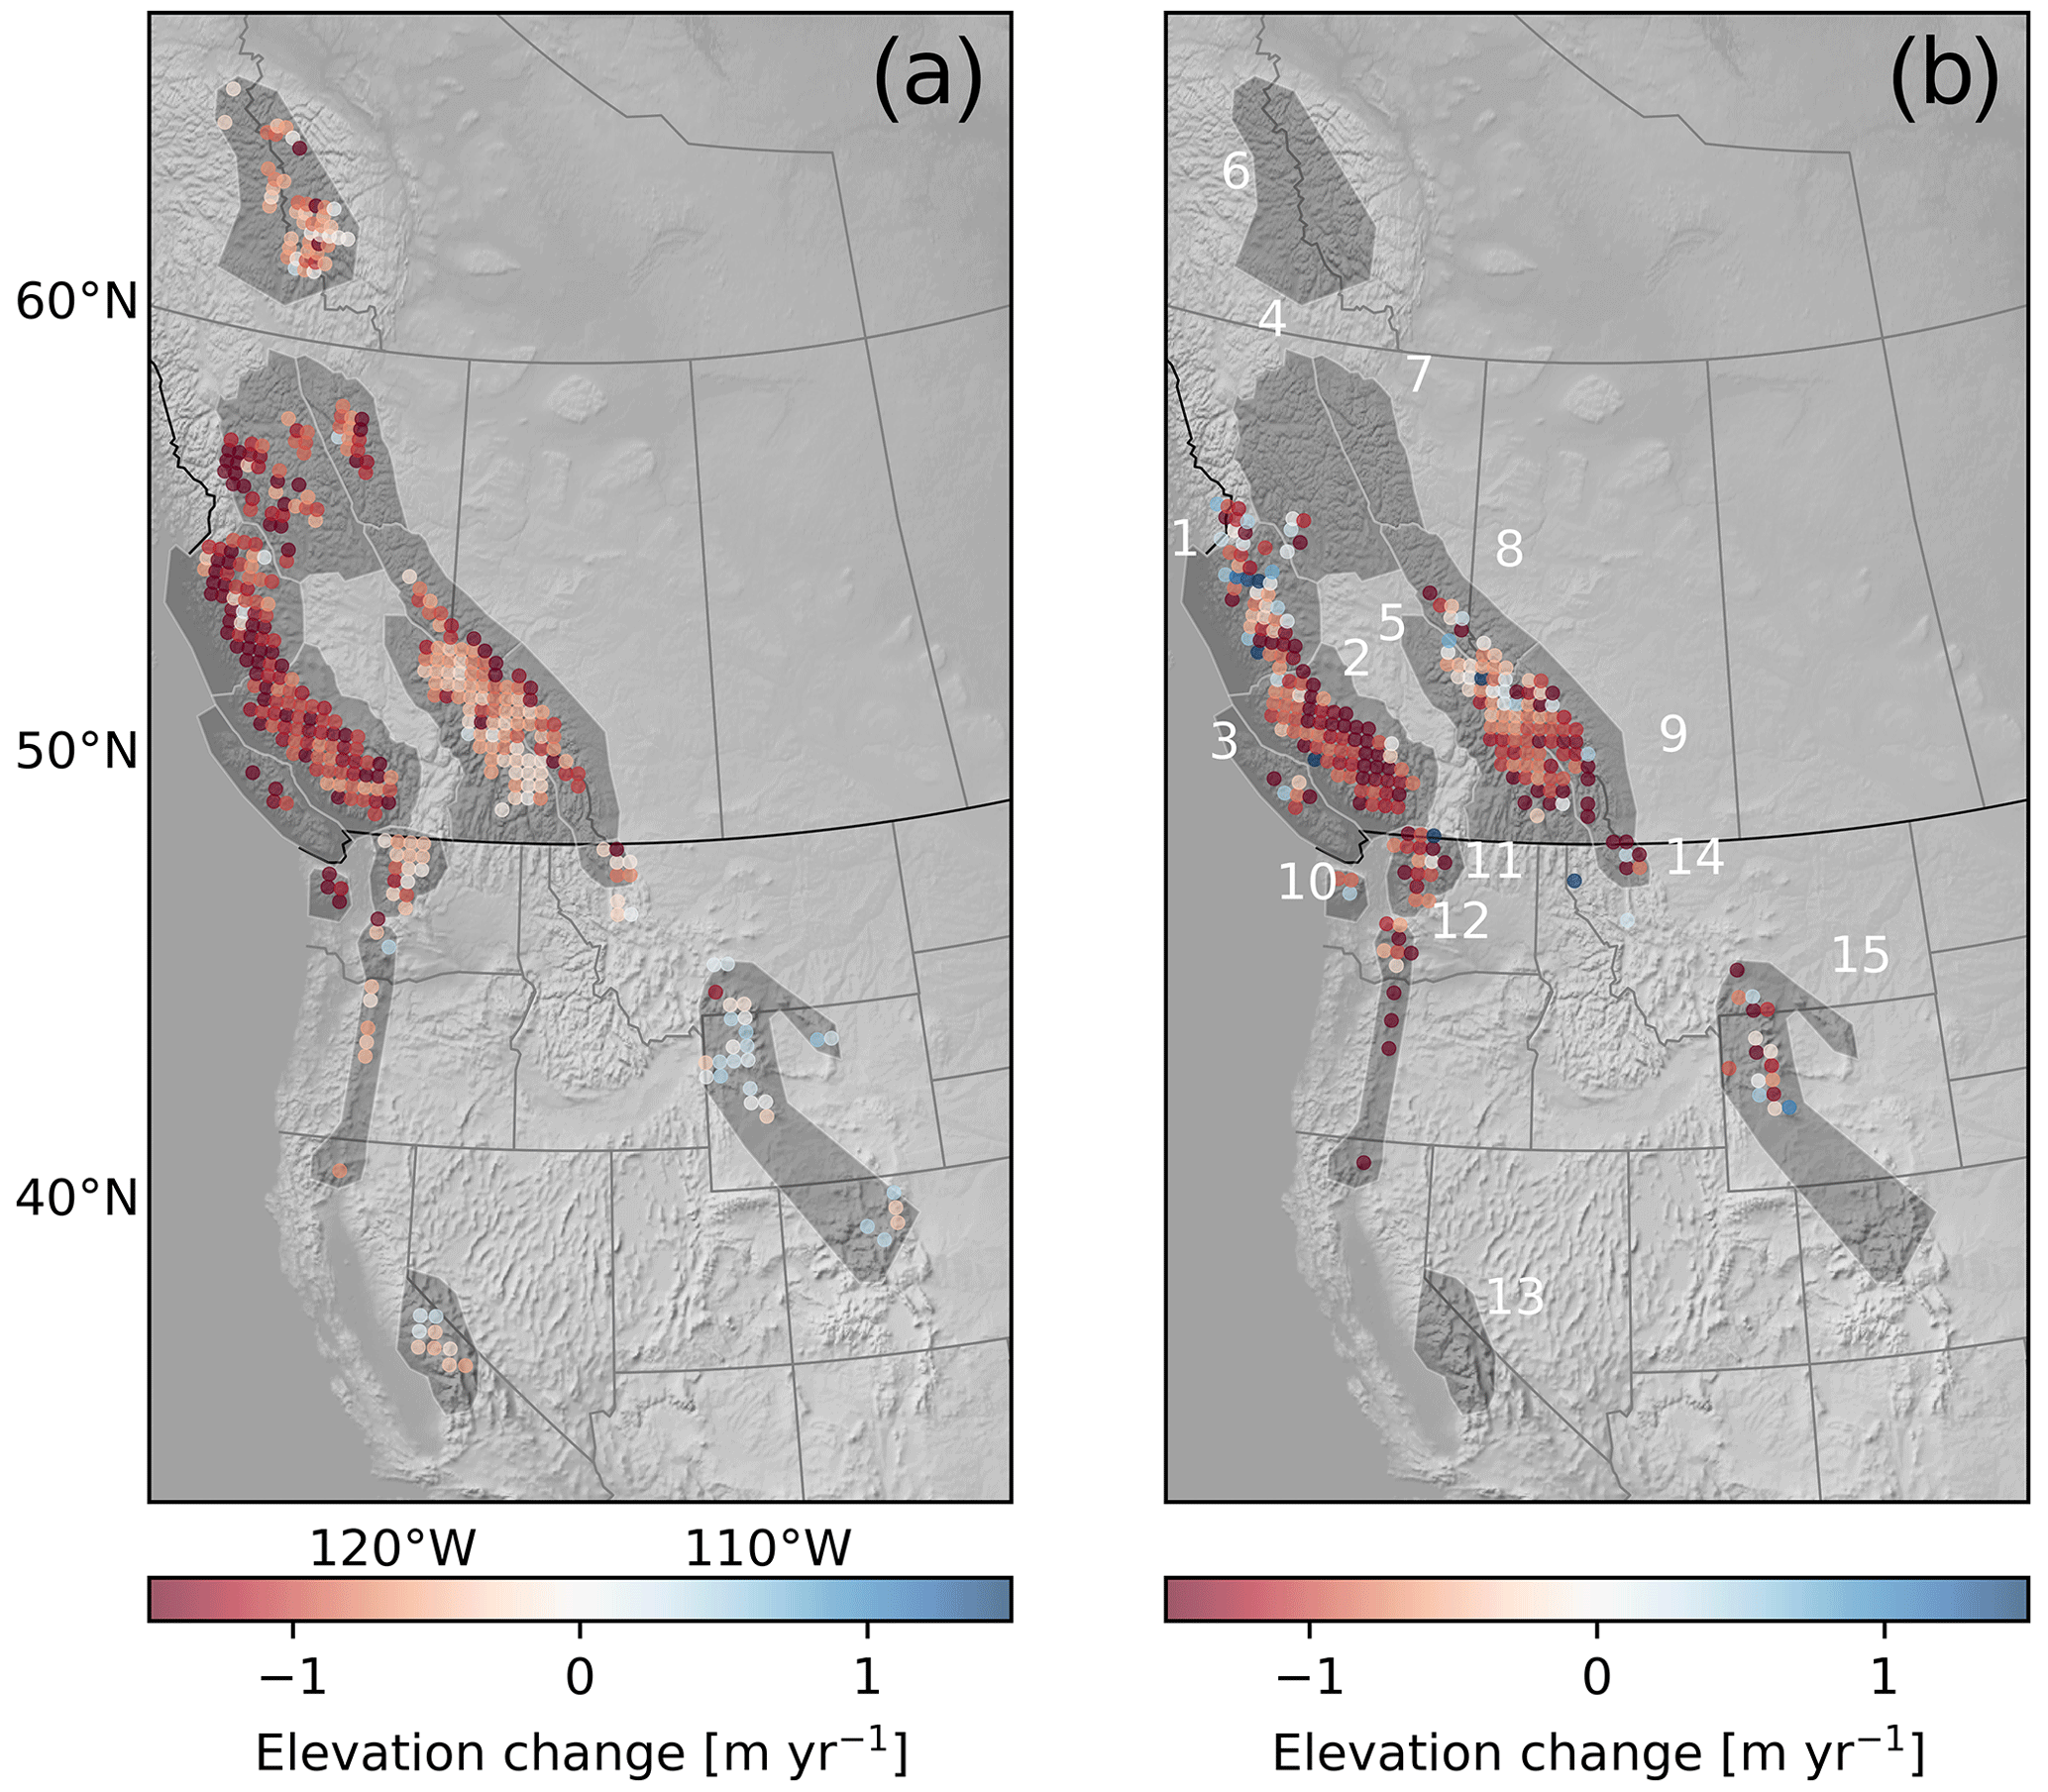
Figure 1Elevation change (m yr−1) for western North American glaciers. Data are aggregated to points with 50 km spacing. (a) Elevation change (m yr−1) determined from ICESat-2 and COP-30 data (2020–2013). (b) Elevation change (m yr−1) from trend analysis over the period 2022—2018 from ICESat-2 and GEDI laser altimetric data. Numbers refer to glacierized regions of western North America (RGI region 02). The regions include (1) Central Coast Mountains (1692 km2); (2) Southern Coast Mountains (7181 km2); (3) Vancouver Island (15 km2); (4) northern interior (572 km2); (5) southern interior (1959 km2); (6) Nahanni (657 km2); (7) northern Rocky Mountains (415 km2); (8) central Rocky Mountains (422 km2); (9) southern Rocky Mountains (1350 km2); (10) Olympics (30 km2); (11) north Cascades (250 km2); (12) south Cascades (153 km2); (13) Sierra Nevada (11 km2); (14) Glacier National Park (11 km2); and (15) Wind River (60 km2).
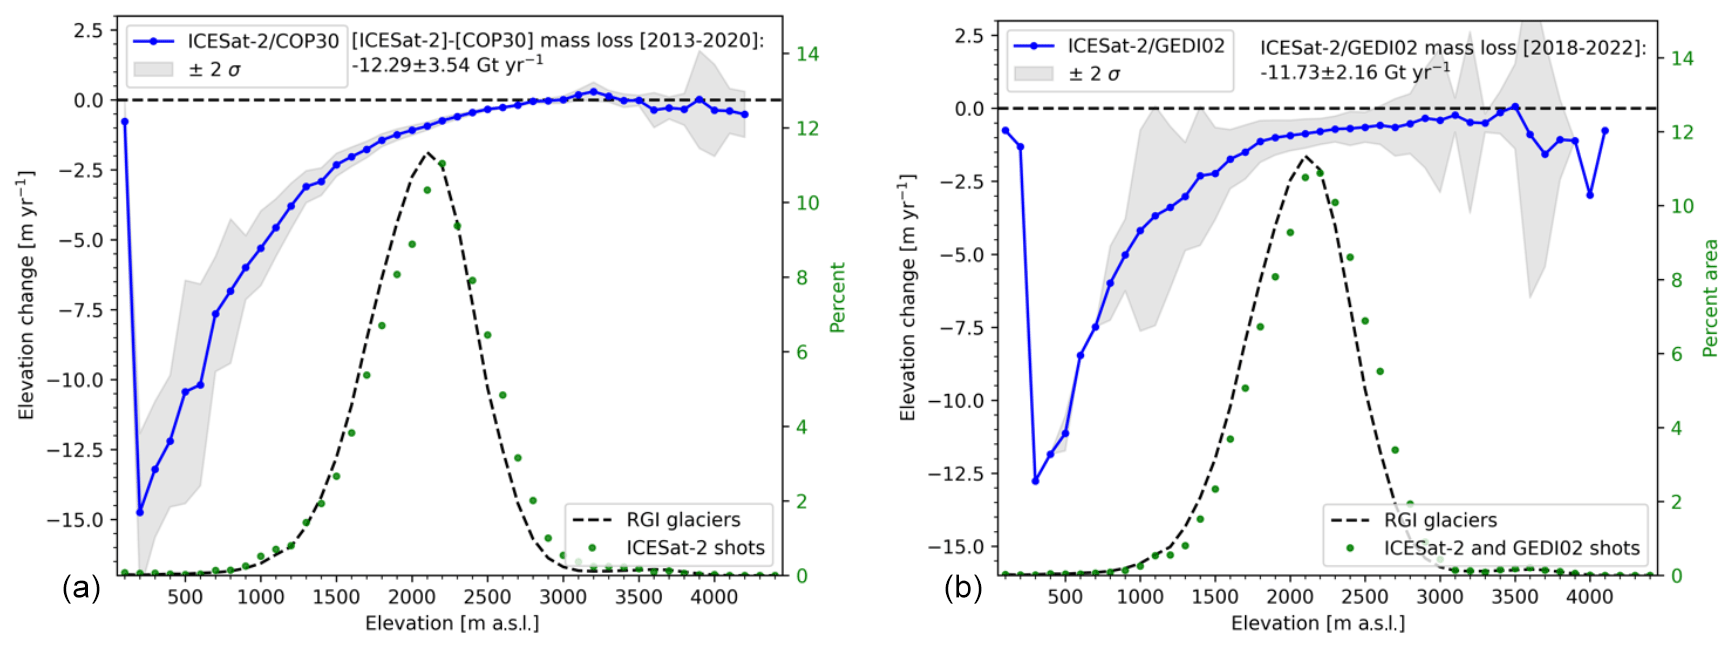
Figure 2In both panels, light gray shading denotes the uncertainty (5 %–95 %) of elevation change. Dashed black line and green dots, respectively, indicate percent area of RGI ice and percentage of ICESat-2 laser shots within a given elevation bin. (a) Rates of elevation change (m yr−1) versus elevation for the period 2013–2020. Only laser shots from 1 August–1 October (n=347 630) are used in the analysis. (b) Rates of elevation change (m yr−1) versus elevation for the period 2018–2022 from ICESat-2 and GEDI laser shots from a least squares trend analysis (n=66 201).
Our geodetic balance obtained from laser altimetry using least squares fitting provides the most recent mass change update for western North America, a region excluded in a recent global assessment of glacier mass loss, using laser altimetry from CryoSat-2 data (Jakob and Gourmelen, 2023). While our trend analysis provides a robust estimate of recent glacier mass change, insufficient sampling precludes our assessment of mass loss for regions where laser altimetry data are sparse. This sparseness is especially pronounced in regions north of GEDI data coverage (51.6° N), e.g., Nahanni, and regions characterized by very small glaciers, e.g., Sierra Nevada (Fig. 2). Our decadal estimates of glacier mass loss provide insight into sub-regional patterns of glacier mass loss, but this insight is offset by the additional uncertainty about the radar penetration at highest elevation and the ambiguity of the acquisition data for the COP-30 DEM. Others report on the penetration of the TanDEM-X radar signal into high-elevation firn and snow surfaces (Abdullahi et al., 2019). The potential of this penetration bias to greatly affect our results is limited, since it is spatially limited to highest-elevation zones containing dry snow and firn (Millan et al., 2015); these zones typically represent <1 %–2 % of the total glacierized area within a given region of this study.
The regional pattern of elevation change obtained for the recent period shows areas of neutral or slight elevation gain (e.g., regions 1 and 5) that are not apparent in the map of decadal elevation change (Fig. 1). The most parsimonious explanation for these differences is the influence of spatially variable snow accumulation in these regions, though we cannot rule out the possibility of changing balance between ice dynamics and mass balance to explain the observed elevation changes. In addition, the decadal pattern largely accords with the notable zonal difference in elevation change observed by Menounos et al. (2019). A key finding of Hugonnet et al. (2021) was the notable accelerated mass loss in western North America during the period 2015–2019 relative to the start of the 21st century. Our decadal results are consistent in both magnitude and uncertainty to previous estimates using instruments (i.e., ASTER) that will soon be unavailable, and so our approach assures mass change estimates can be obtained using much sparser observations from laser altimetry. Our recent and decadal estimates of glacier mass loss using independent datasets confirms the magnitude of recent mass change for a comparably recent period (2018 to 2022), corroborating the finding of accelerated mass loss from this previous study.
Glaciers in western North America provide cold meltwater that buffers hot and dry conditions (Anderson and Radić, 2020; Moore et al., 2009), sustains alpine stream ecosystems (e.g., Muhlfeld et al., 2020), and supports downstream communities via agricultural irrigation and hydroelectric power generation (e.g., Frans et al., 2018). Thus, our study provides relevant, detailed information to land managers who are responsible for understanding and responding to the local consequences of rapid glacier change. Sparsely glacierized regions in western North America and Europe contribute minimally to sea level change (Rounce et al., 2023) but coincide with river basins, where mountain water supply and downstream demand are highest (Immerzeel et al., 2019). This justifies the need to surmount technical and data limitations that impede quantifying glacier mass change in sparsely glacierized regions. The projected continued loss of glacier ice (Rounce et al., 2023) furthermore suggests that this technical challenge will only become more widespread.
All code and data are available upon request from the authors.
The supplement related to this article is available online at: https://doi.org/10.5194/tc-18-889-2024-supplement.
BM proposed the study. BM and AG analyzed the data and wrote the original draft. All authors provided feedback on the initial draft and contributed to the final writing and editing of the paper.
The contact author has declared that none of the authors has any competing interests.
Any use of trade, firm, or product names is for descriptive purposes only and does not imply endorsement by the U.S. Government.
Publisher's note: Copernicus Publications remains neutral with regard to jurisdictional claims made in the text, published maps, institutional affiliations, or any other geographical representation in this paper. While Copernicus Publications makes every effort to include appropriate place names, the final responsibility lies with the authors.
The authors acknowledge constructive input from Rainey Aberle, Albin Wells, Erik Mannerfelt, and an anonymous referee, which improved the quality and clarity of this paper.
This research has been supported by the Tula Foundation, the Natural Sciences and Engineering Research Council of Canada, the Canada Research Chairs Program, Government of Canada, and the U.S. Geological Survey Ecosystem Mission Area Climate Research and Development Program.
This paper was edited by Ben Marzeion and reviewed by Erik Mannerfelt and one anonymous referee.
Abdullahi, S., Wessel, B., Huber, M., Wendleder, A., Roth, A., and Kuenzer, C.: Estimating Penetration-Related X-Band InSAR Elevation Bias: A Study over the Greenland Ice Sheet, Remote Sens., 11, 2903, https://doi.org/10.3390/rs11242903, 2019.
Anderson, S. and Radić, V.: Identification of local water resource vulnerability to rapid deglaciation in Alberta, Nat. Clim. Chang., 10, 933–938, 2020.
Bevington, A. and Menounos, B.: Accelerated change in the glaciated environments of western Canada revealed through trend analysis of optical satellite imagery, Remote Sens. Environ., 270, 112862, https://doi.org/10.1016/j.rse.2021.112862, 2022.
Enderlin, E. M., Elkin, C. M., Gendreau, M., Marshall, H. P., O'Neel, S., McNeil, C., Florentine, C., and Sass, L.: Uncertainty of ICESat-2 ATL06- and ATL08-derived snow depths for glacierized and vegetated mountain regions, Remote Sens. Environ., 283, 113307, https://doi.org/10.1016/j.rse.2022.113307, 2022.
Farinotti, D., Huss, M., Fürst, J. J., Landmann, J., Machguth, H., Maussion, F., and Pandit, A.: A consensus estimate for the ice thickness distribution of all glaciers on Earth, Nat. Geosci., 12, 168–173, 2019.
Fountain, A. G., Glenn, B., and Mcneil, C.: Inventory of glaciers and perennial snowfields of the conterminous USA, Earth Syst. Sci. Data, 15, 4077–4104, https://doi.org/10.5194/essd-15-4077-2023, 2023.
Frans, C., Istanbulluoglu, E., Lettenmaier, D. P., Fountain, A. G., and Riedel, J.: Glacier Recession and the Response of Summer Streamflow in the Pacific Northwest United States, 1960–2099, Water Resour. Res., 54, 6202–6225, 2018.
Gardner, A. S., Moholdt, G., Cogley, J. G., Wouters, B., Arendt, A. A., Wahr, J., Berthier, E., Hock, R., Pfeffer, W. T., Kaser, G., Ligtenberg, S. R. M., Bolch, T., Sharp, M. J., Hagen, J. O., van den Broeke, M. R., and Paul, F.: A reconciled estimate of glacier contributions to sea level rise: 2003 to 2009, Science, 340, 852–857, 2013.
Hugonnet, R., McNabb, R., Berthier, E., Menounos, B., Nuth, C., Girod, L., Farinotti, D., Huss, M., Dussaillant, I., Brun, F., and Kääb, A.: Accelerated global glacier mass loss in the early twenty-first century, Nature, 592, 726–731, 2021.
Huss, M.: Density assumptions for converting geodetic glacier volume change to mass change, The Cryosphere, 7, 877–887, https://doi.org/10.5194/tc-7-877-2013, 2013.
Immerzeel, W. W., Lutz, A. F., Andrade, M., Bahl, A., Biemans, H., Bolch, T., Hyde, S., Brumby, S., Davies, B. J., Elmore, A. C., Emmer, A., Feng, M., Fernández, A., Haritashya, U., Kargel, J. S., Koppes, M., Kraaijenbrink, P. D. A., Kulkarni, A. V., Mayewski, P. A., Nepal, S., Pacheco, P., Painter, T. H., Pellicciotti, F., Rajaram, H., Rupper, S., Sinisalo, A., Shrestha, A. B., Viviroli, D., Wada, Y., Xiao, C., Yao, T., and Baillie, J. E. M.: Importance and vulnerability of the world's water towers, Nature, 577, 364–369, 2019.
Jacob, T., Wahr, J., Pfeffer, W. T., and Swenson, S.: Recent contributions of glaciers and ice caps to sea level rise, Nature, 482, 514–518, 2012.
Jakob, L. and Gourmelen, N.: Glacier mass loss between 2010 and 2020 dominated by atmospheric forcing, Geophys. Res. Lett., 50, e2023GL102954, https://doi.org/10.1029/2023gl102954, 2023.
Liu, A., Cheng, X., and Chen, Z.: Performance evaluation of GEDI and ICESat-2 laser altimeter data for terrain and canopy height retrievals, Remote Sens. Environ., 264, 112571, https://doi.org/10.1016/j.rse.2021.112571, 2021.
Markus, T., Neumann, T., Martino, A., Abdalati, W., Brunt, K., Csatho, B., Farrell, S., Fricker, H., Gardner, A., Harding, D., Jasinski, M., Kwok, R., Magruder, L., Lubin, D., Luthcke, S., Morison, J., Nelson, R., Neuenschwander, A., Palm, S., Popescu, S., Shum, C. K., Schutz, B. E., Smith, B., Yang, Y., and Zwally, J.: The Ice, Cloud, and land Elevation Satellite-2 (ICESat-2): Science requirements, concept, and implementation, Remote Sens. Environ., 190, 260–273, 2017.
Menounos, B., Hugonnet, R., Shean, D., Gardner, A., Howat, I., Berthier, E., Pelto, B., Tennant, C., Shea, J., Noh, M.-J., Brun, F., and Dehecq, A.: Heterogeneous Changes in Western North American Glaciers Linked to Decadal Variability in Zonal Wind Strength, Geophys. Res. Lett., 46, 200–209, 2019.
Millan, R., Dehecq, A., Trouvé, E., Gourmelen, N., and Berthier, E.: Elevation changes and X-band ice and snow penetration inferred from TanDEM-X data of the Mont-Blanc area, 2015 8th International Workshop on the Analysis of Multitemporal Remote Sensing Images (Multi-Temp), Annecy, France, 1–4, https://doi.org/10.1109/Multi-Temp.2015.7245753, 2015.
Moore, R. D., Fleming, S. W., Menounos, B., Wheate, R., Fountain, A., Stahl, K., Holm, K., and Jakob, M.: Glacier change in western North America: influences on hydrology, geomorphic hazards and water quality, Hydrol. Process., 23, 42–61, 2009.
Muhlfeld, C. C., Cline, T. J., Giersch, J. J., Peitzsch, E., Florentine, C., Jacobsen, D., and Hotaling, S.: Specialized meltwater biodiversity persists despite widespread deglaciation, P. Natl. Acad. Sci. USA, 117, 2020, https://doi.org/10.1073/pnas.2001697117, 2020.
Pfeffer, W. T., Arendt, A. A., Bliss, A., Bolch, T., Cogley, J. G., Gardner, A. S., Hagen, J.-O., Hock, R., Kaser, G., Kienholz, C., and Others: The Randolph Glacier Inventory: a globally complete inventory of glaciers, J. Glaciol., 60, 537–552, 2014.
Rizzoli, P., Martone, M., Gonzalez, C., Wecklich, C., Borla Tridon, D., Bräutigam, B., Bachmann, M., Schulze, D., Fritz, T., Huber, M., Wessel, B., Krieger, G., Zink, M., and Moreira, A.: Generation and performance assessment of the global TanDEM-X digital elevation model, ISPRS J. Photogramm. Remote Sens., 132, 119–139, 2017.
Rounce, D. R., Hock, R., Maussion, F., Hugonnet, R., Kochtitzky, W., Huss, M., Berthier, E., Brinkerhoff, D., Compagno, L., Copland, L., Farinotti, D., Menounos, B., and McNabb, R.: Global glacier change in the 21st century: Every increase in temperature matters, Science, 379, 78–83, 2023.
Zemp, M., Huss, M., Thibert, E., Eckert, N., McNabb, R., Huber, J., Barandun, M., Machguth, H., Nussbaumer, S. U., Gärtner-Roer, I., Thomson, L., Paul, F., Maussion, F., Kutuzov, S., and Cogley, J. G.: Global glacier mass changes and their contributions to sea-level rise from 1961 to 2016, 568, 382–386, https://doi.org/10.1038/s41586-019-1071-0, 2019.