the Creative Commons Attribution 4.0 License.
the Creative Commons Attribution 4.0 License.
 | 21 Feb 2024
Ice plate deformation and cracking revealed by an in situ-distributed acoustic sensing array
Chao Liang
Sidao Ni
Risheng Chu
Feng Bao
Rongbing Lin
Benxin Chi
Studying seismic sources and wave propagation in ice plates can provide valuable insights into understanding various processes, such as ice structure dynamics, migration, fracture mechanics and mass balance. However, the harsh environment makes it difficult to conduct in situ dense seismic observations. Consequently, our understanding of the dynamic changes within the ice sheet remains insufficient. We conducted a seismic experiment using a distributed acoustic sensing (DAS) array on a frozen lake, exciting water vibrations through underwater airgun shots. By employing an artificial intelligence method, we were able to detect seismic events that include both high-frequency icequakes and low-frequency events. The icequakes clustered along ice fractures and their activity correlated with local temperature variations. The waveforms of low-frequency events exhibit characteristics of flexural-gravity waves, which offers insights into the properties of the ice plate. Our study demonstrates the effectiveness of an DAS array as an in situ dense seismic network for investigating the internal failure process and dynamic deformation of ice plates such as the ice shelf, which may contribute to an enhanced comprehension and prediction of ice shelf disintegration.
- Article
(5591 KB) - Full-text XML
-
Supplement
(2381 KB) - BibTeX
- EndNote


Cryo-seismology, thanks to its high-temporal-resolution capabilities, has attracted the attention of scientists in the fields of seismology, cryosphere and climatology. It is regarded as an effective approach for studying glacier dynamics and understanding complex intricate processes (Aster and Winberry, 2017; Podolskiy and Walter, 2016). Seismological records of the cryosphere can be utilized to study the dynamic process occurring on the surface or within glaciers, aiding in the identification of the ice shelf damage, environmental changes and so on. Large glacial earthquakes can be detected by global seismic networks (e.g., Global Seismographic Network), and their mechanisms have been extensively studied, which were associated with iceberg calving and capsizing (Ekström et al., 2003; Sergeant et al., 2019; Veitch and Nettles, 2017). Besides, local microseismicities (such as surface crevasses and basal slip events) can provide more insights into the dynamic change process of glaciers and facilitate the study of glacier disintegration (Helmstetter et al., 2015; Lombardi et al., 2019; Romeyn et al., 2021; Walter et al., 2013). Due to lower released seismic energy and stronger attenuation for higher-frequency signal excited by these events, it is crucial to have closely spaced seismic stations (e.g., on the ice surface or in shallow boreholes) in order to capture signal and analyze the data (Röösli et al., 2014; West et al., 2010). However, the harsh environment and logistical challenges of glaciers make it difficult to deploy dense seismic array for comprehensive long-term monitoring. As a result, researchers even explored the potential of utilizing single seismometer to study icequakes (e.g., Köhler et al., 2019).
In recent years, distributed acoustic sensing (DAS) has shown its potential in many applications (Zhan, 2019), such as microseismic monitoring, seismic imaging and earthquake early warning (e.g., Farghal et al., 2022). DAS arrays have also been deployed in glacier environments. The benefits of their large aperture and dense observation have been demonstrated in the study of glacial structures and the monitoring of icequakes (Booth et al., 2020; Brisbourne et al., 2021; Castongia et al., 2017; Fichtner et al., 2022; Hudson et al., 2021; Walter et al., 2020). Hudson et al. (2021) conducted a study on the use of DAS to monitor basal icequakes at Rutford Ice Stream. They compared the performance of DAS with a geophone array in terms of icequake detection and location. The study found the DAS is outperformed by the geophone array in monitoring. Their methodology and findings are useful for applying of DAS in glacial environment. Walter et al. (2020) deployed a DAS array in Alpine terrain, and they successfully detected glacier stick–slip events which are associated with glacier flow and nearby rock falls. Their work demonstrated the significant potential of DAS for the monitoring of glacier dynamics and natural hazards in the mountainous regions. These studies demonstrated the logistical feasibility of installing large-aperture, high-quality DAS arrays in glacial environments. However, the use of DAS to study the interaction between water and ice on ice shelves has been limited.
In this study, we deployed a DAS array on the Xiliushui Reservoir, a frozen freshwater lake in Gansu Province, China, to explore the effectiveness of using DAS for monitoring the cracking and dynamic flexure of the ice plate (Fig. 1). Seismicities have been observed on frozen lakes similar to icequakes in the ice shelf (e.g., Dobretsov et al., 2013; Kavanaugh et al., 2018; Ruzhich et al., 2009). Nziengui-Bâ et al. (2022) obtained the thickness and Young's modulus of the ice pack of a lake with DAS records of hammer tests. Fichtner et al. (2022) deployed fiber-optic cable on a frozen lake of a volcano and detected volcanic tremors. In this study, we employed an underwater AirGun Excitation (AGE) to generate water waves and recorded the resulting ice plate vibrations. Using an AI-based method, we successively detected and classified various seismic events, including both icequakes and low-frequency events (LFEs). Subsequently, we conducted an analysis of the seismic signals, examining their characteristics, event occurrence rates and locations. One of the key aspects of our analysis involved estimating Young's modulus of the ice plate by studying the dispersion of flexural-gravity waves excited by LFEs. Finally, we discussed implications of our experiments for understanding the dynamics of ice shelves in natural settings.
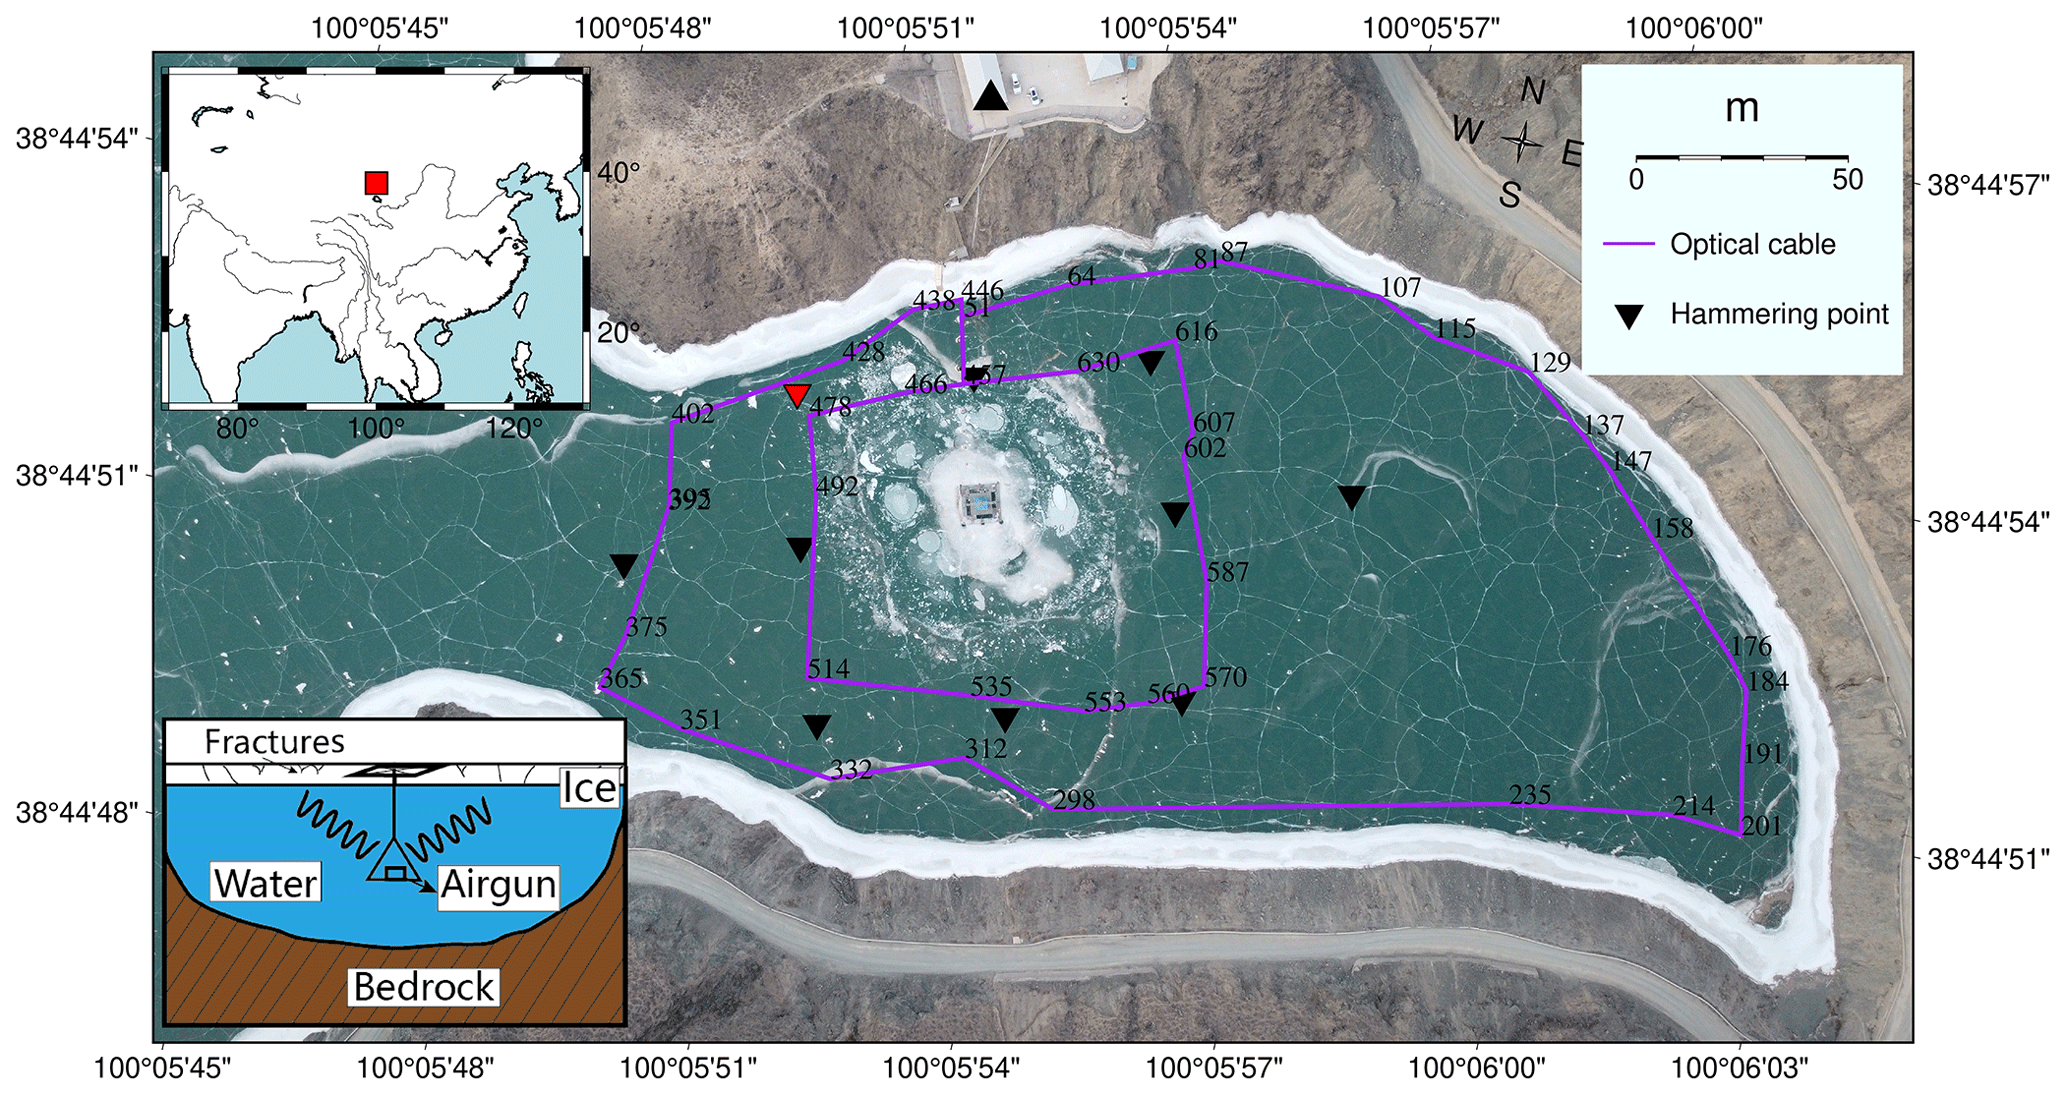
Figure 1The experimental setting. The instrumented frozen lake is at Xiliushui Reservoir in Gansu Province, China (red rectangle in the inset). The optical fiber is marked with purple lines with channel numbers between 51–645, with a gauge length of 10 m and a sampling rate of 1000 Hz. The airgun floating platform is at the center of the lake. A reference broadband seismic station is marked with a triangle. Hammering points are marked with inverted triangles. The red triangle shows the one we use to measure the dispersion curve of flexural-gravity waves.
The experimental site for our study was the Zhangye airgun active source platform, located in Xiliushui Reservoir, in Qilian mountains, Zhangye, Gansu Province, China (Fig. 1). The average elevation of the Zhangye airgun active source platform is approximately 1900 m. The water depth of the Xiliushui Reservoir ranges from 45 to 65 m. The ice thickness in the reservoir reaches around 0.5 m during boreal winter. The active airgun source used in this study was positioned at the center of the lake, submerged at a depth of 15 m beneath the water surface (Wei et al., 2018). It has been observed that the bubbles generated by the airgun can induce waterbody vibration (de Graaf et al., 2014). The generated waterbody vibrations closely mimic the characteristics of natural ocean waves, enabling realistic and controlled experiments in the study of ice and wave interaction and related phenomena.
In our experiment, a 1.2 km long standard single-mode fiber-optic cable was installed on the surface of the ice. To ensure proper coupling between the fiber-optic cable and the ice surface, we poured water over the fiber-optic cable, which, when frozen, formed a solid bond with the ice and effectively coupled the fiber-optic cable to the ice surface. The fiber-optic cable was laid in two circular patterns around the airgun floating platform. The inner circle is about 340 m long, spanning channels 470 to 645, and the outer circle is nearly 800 m long, encompassing channels 51–457 (Fig. 1). The interrogator is an Ovlink DAS unit, which measured longitudinal dynamic strain rates of the fiber-optic cable. In this experiment, we employed a gauge length of 2 m, which refers to the length of the section of the fiber-optic cable used for measurements. The spatial sampling interval was set at 2 m, and the temporal sampling rate was set at 1000 Hz. The experiment started at 21:00 on 6 January (Beijing time) and finished at 17:00 on 9 January. Unfortunately, some instrument failures occurred during the afternoon of 8 January, resulting in an incomplete record between 23:00 and 13:00 LT. During the entire duration of the experiment, a total of 65 h of data, amounting to nearly 600 GB, was recorded. Additionally, a CMG-40T three-component short-period seismometer, equipped with a RefTek 130B data logger, was positioned on the shore to capture ground motion. This seismometer recorded data at a sampling rate of 50 Hz, providing complementary information to the DAS records.
Throughout the experiment, a total of 239 AGEs were conducted. However, due to an instrumental issue, only 223 AGEs were successively recorded. Previous studies indicated that the near-field AGE waveform mainly comprises two components: the main pulse and low-frequency bubble signal (de Graaf et al., 2014). However, our observations with DAS revealed that the near-field AGE signal exhibits a distinct main pulse (Fig. S1 in the Supplement). Additionally, we observed that the similarity among different AGE waveforms was below 20 % (Fig. S2 in the Supplement). The main reason for this phenomenon is likely related to the short observation distance between the DAS array and the airgun source. This proximity may have caused the signal recorded by DAS to be clipped, resulting in the absence of a recognizable main pulse.
In addition to the AGE experiments, we also conducted 10 hammering experiments to measure the velocity of seismic waves propagating in the ice plate. The hammering signal primarily contained energy above 100 Hz (Fig. S1 in the Supplement). In the hammering signal, a relatively weak P-wave signal can be observed. By analyzing the DAS record along a line aligned with the hammering point, we estimated the P-wave velocity in the ice plate to be approximately 3200 m s−1 (Fig. S3 in the Supplement). This estimation is consistent with previous research findings. For instance, Ewing et al. (1934) indicated that the P wave velocity in thick solid ice ranges from 3432 to 3698 m s−1. Similarly, Wen et al. (1991) reported that the P wave velocity in thinner ice layers ranges from 2000 to 3040 m s−1.
Apart from the AGE and hammering signals, our observations revealed two types of passive source signals (Fig. 2). The first type corresponds to icequakes that occur within the ice plate and are characterized by a dominant energy at high frequencies ranging from over 10 to 100 Hz (Fig. 2). These signals are associated with longitudinal waves propagating through the ice plate that cause elongation along the fiber direction (Moreau et al., 2020). During the occurrence of some icequakes, the staff also reported hearing cracking sounds, which aligns with previous observations reported by Kavanaugh et al. (2018). The other type is characterized by energy primarily in the lower-frequency range (1–10 Hz) and has a duration of about 1 s (Fig. 2). Considering their lower-frequency signal, we termed them low-frequency events (LFEs). They typically emerged after AGEs and exhibit remarkably similar waveforms and moveouts to those shown in Fig. S4 in the Supplement.
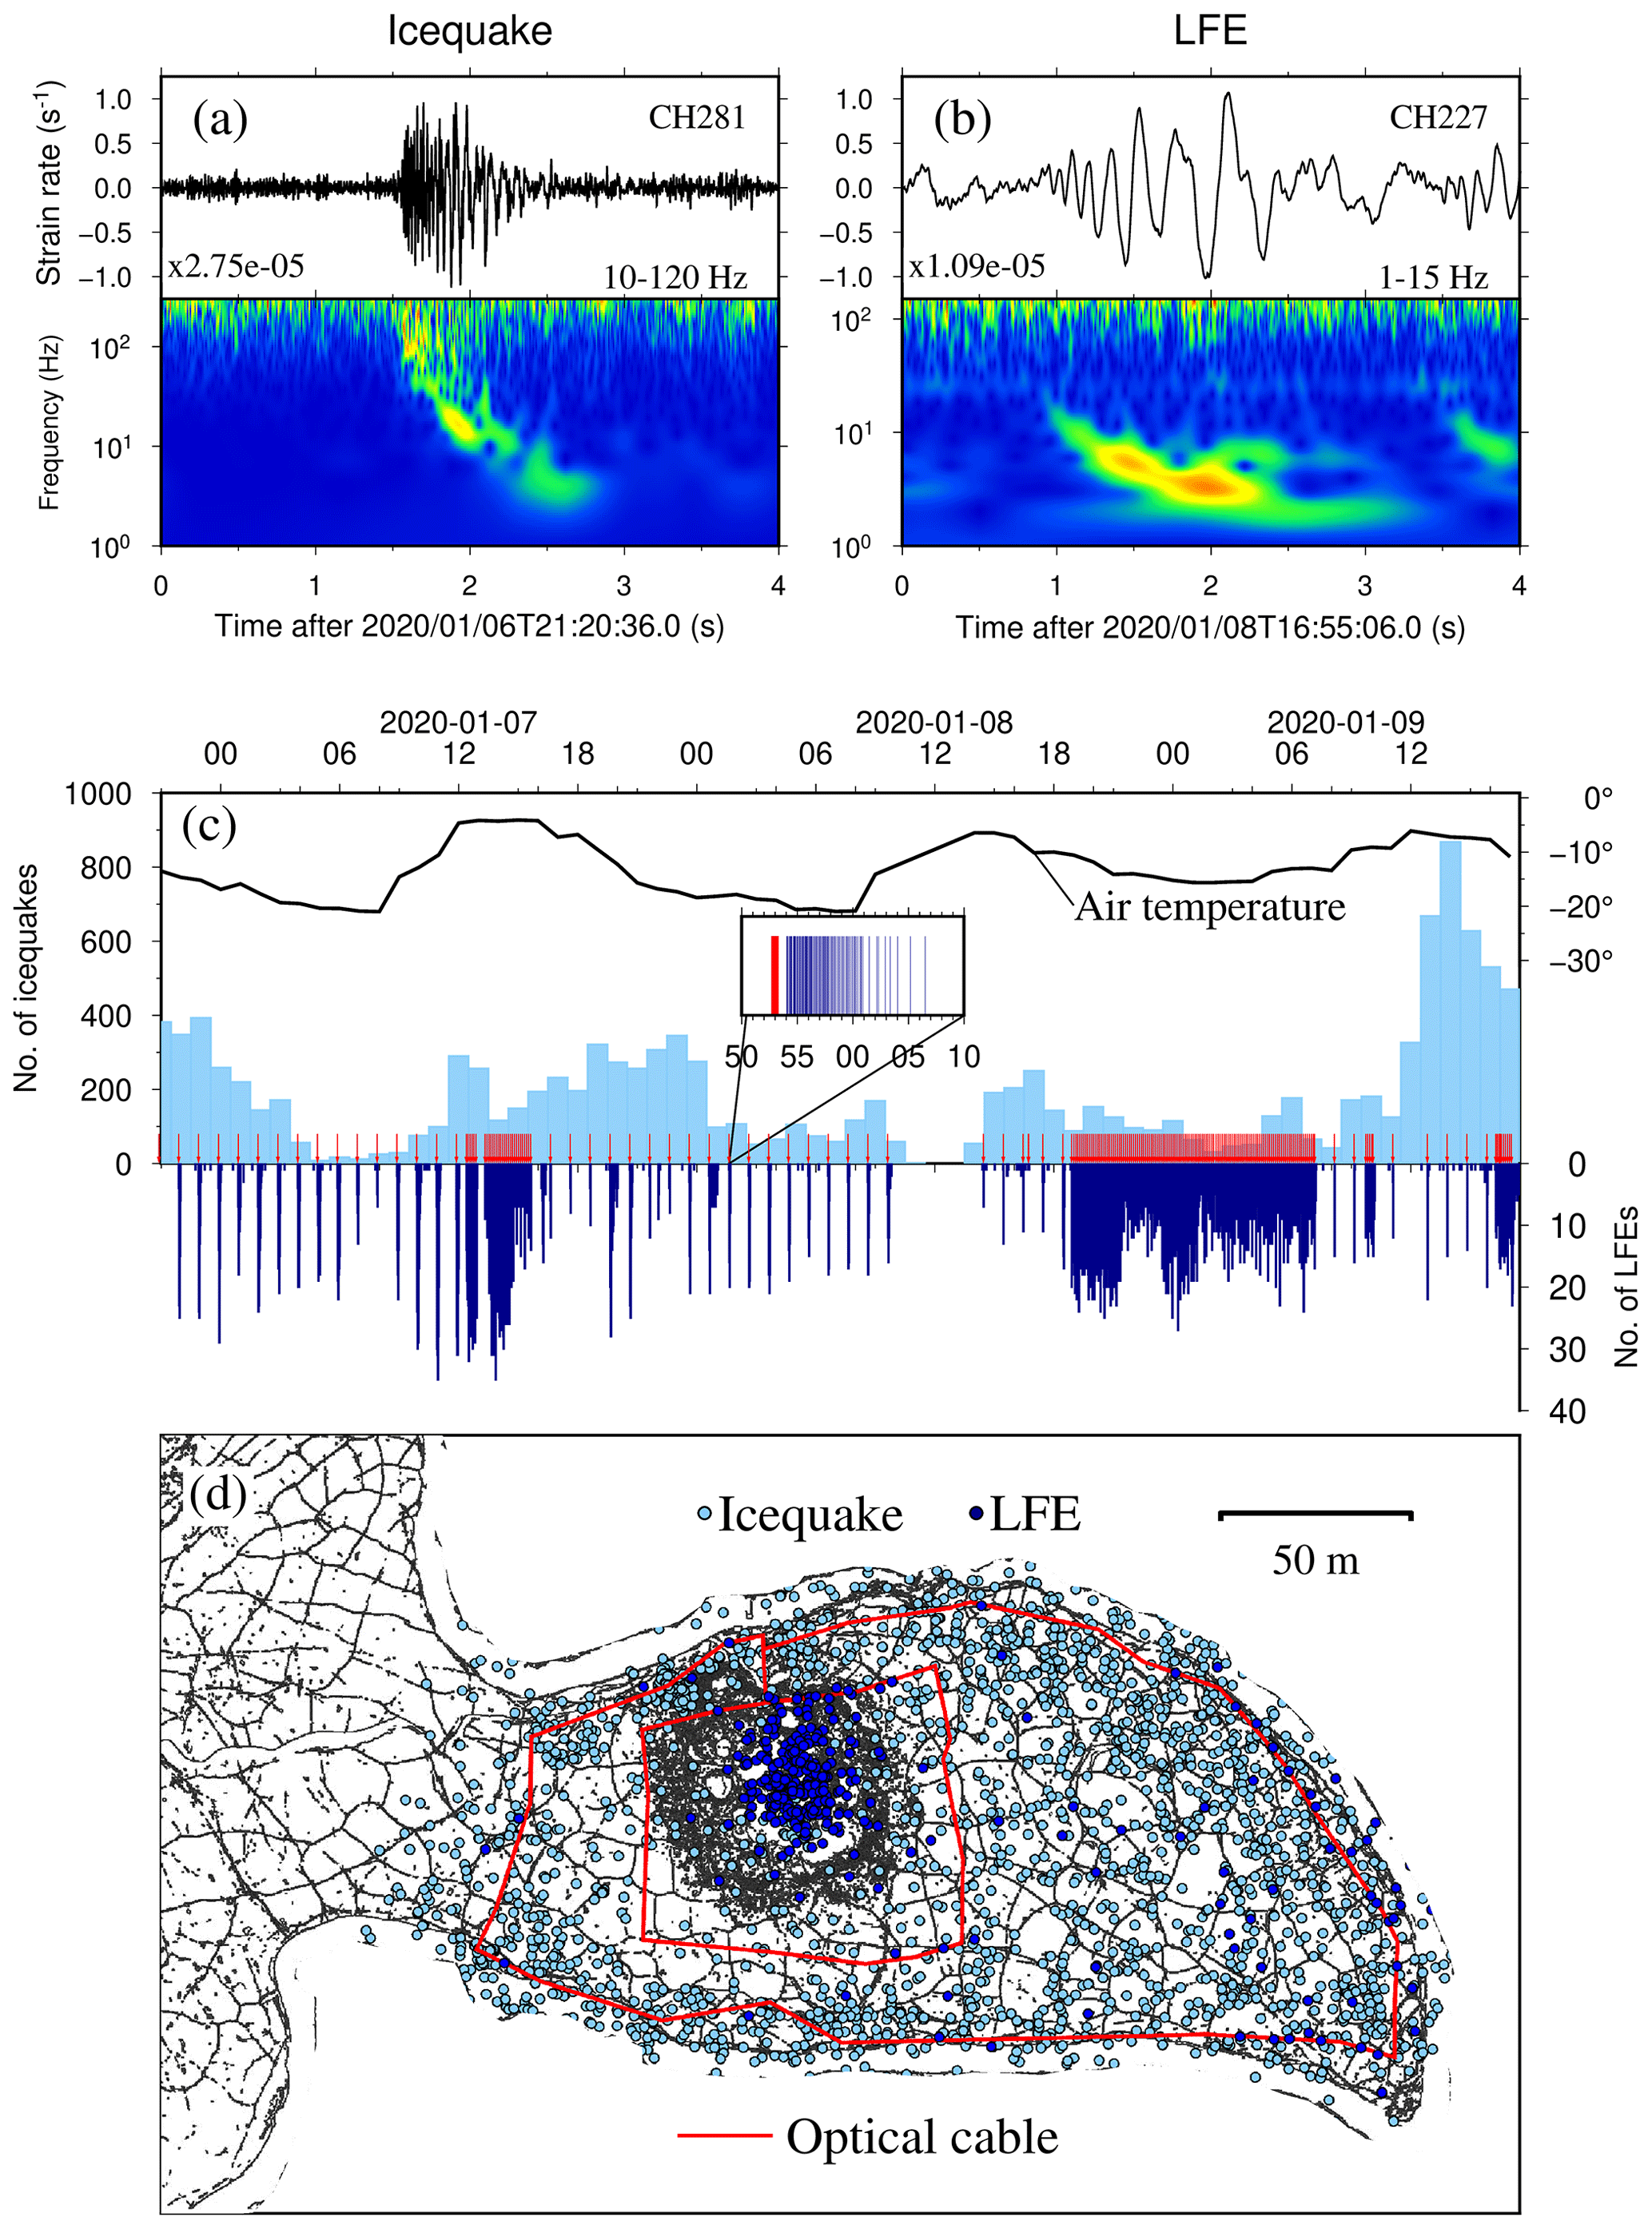
Figure 2Typical passive signal waveforms and temporal and spatial distributions. (a) Icequake wave recorded by channel 281. The waveform is bandpass filtered in the frequency band of 10–120 Hz. (b) LFE waveform by channel 227. The waveform is bandpass filtered in the frequency band of 1–15 Hz. (c) Temporal distributions for icequakes (light blue) per hour and LFEs (dark blue) per minute and the local air temperature (black curve). The temperature data are from European Centre for Medium-Range Weather Forecasts (https://www.ecmwf.int/, last access: 13 February 2024). The time of AGE is marked with a red arrow. The inset picture shows a window of 20 min with an AGE (red line) and following LFEs (black lines). The air temperature is denoted with a black curve. (d) Spatial distribution for icequakes (light blue) and LFEs (dark blue).
The application of machine learning in seismology has experienced a significant growth in recent years. Machine learning techniques have been primarily focused on earthquake detection and phase-picking, often applied to regional and global earthquake datasets that rely on conventional seismic arrays (Zhu and Beroza, 2019; Zhou et al., 2019; Ross et al., 2018). In this study, we applied a convolutional neural network (CNN) known as You Only Look Once (YOLO, version 5) (Redmon and Farhadi, 2018) to efficiently scan through the DAS dataset for seismic events and categorize them into three groups: AGEs, LFEs and icequakes. This CNN is designed for accurate real-time object detection in video files (Redmon and Farhadi, 2018) and has been successfully utilized for micro-seismic event detection in DAS records (Stork et al., 2020). We converted the record sections of DAS dataset to images. To enhance the signal-to-noise ratio (SNR), the DAS data are bandpass filtered within the range of 5–50 Hz and normalized based on the maximum amplitude of the entire record section. We assembled 6 s of data from all channels (51–645) into an image, ensuring a 50 % overlap to prevent misdetection. We then downsampled the image into a size of 600 by 600 pixels, resulting in each image being approximately 980 KB in size.
To train the AI model, we manually inspected the seismic data from the first 12 h and labeled 60 AGEs, 122 LFEs and 360 icequakes. This labeled dataset was then split this into training, validation, and test sets using a ratio. Since the AGE catalogue was well-established, it was used to evaluate the performance of the trained model. To accelerate the training process, we utilized a GPU, which reduced the training time to approximately 3 h. The performance of the model on the test set is depicted in Fig. S5 in the Supplement. The confusion rate was found to be low, indicating accurate classification results. For instance, no AGEs were misclassified as icequakes. The recall rate is calculated by dividing the number of true positives (TPs) by the total number of actual positives. A TP represents the correct prediction, such as detecting icequake as icequake. The recall rates for AGEs, LFEs and icequakes are 100.0 %, 100.0 % and 91.0 %, respectively, while the precision for the three groups is 73.0 %, 93.0 % and 62.8 %, respectively. Finally, we applied the trained AI model to scan through the rest of the dataset (39 280 images). In total, we detected 14 498 icequakes and 9391 LFEs.
To gain deeper insights into the mechanism of the seismic sources, we located the identified icequakes and LFEs. Here, we utilized an absolute location method based on the neighborhood algorithm (Sambridge, 1999). We assumed that the propagation velocity of seismic waves in the ice sheet is isotropic and set it as an inversion parameter. Since the ice plate is thin, we assume the focal depth to be zero. We used the short-time-average through long-time-average (STA/LTA) method (Stevenson, 1976) to pick the arrival. The short and long time windows are set to 0.05 and 0.25 s for icequakes and 0.5 and 2.5 s for LFEs, respectively. During the location inversion, the travel-time misfit of each pick is weighted with the maximum amplitude of each waveform. To assess the error of our location setting, we located those 10 hammering events and compared with their ground truth locations. The results showed that the minimum, maximum and average location errors of hammering events are 5, 20 and 10.2 m, respectively (Fig. S6 in the Supplement). It is important to note that most of the location results exhibited a bias towards the north direction. This systematic deviation of the location results could be attributed to the systematic bias in the position of fiber-optic cable. We conducted a synthetic test using the theoretical travel times. To calculate the theoretical travel times, we assumed the DAS cable was shifted southward by 10 m and added a random error of 0.01 s to each travel time. The location results deviated northward from the true location (Fig. S7 in the Supplement). This illustrated the systematic bias caused by the misalignment of the fiber-optic cable. Overall, the accuracy of the location in this study is acceptable.
We detected 14 498 icequakes, exhibiting a clear diurnal cycle (Fig. 2c) and primarily clustered along the promising fractures (Fig. 2d). The number of icequakes does not seem to be associated with AGEs but is rather correlated with the local temperature variation (Fig. 2c). This phenomenon has also been reported by previous studies; for instance, Goto et al. (1980) observed that there was a strong correlation between the occurrence of icequake and the temporal variation of temperature differences within the ice plate. This reveals the nature of icequakes in our experiments as brittle failure of the ice plate caused by uneven thermal expansion. The icequake interevent distribution follows a Poisson distribution (Fig. S8 in the Supplement), suggesting that the occurrence of icequake is random, similar to tectonic earthquakes (Rydelek and Sacks, 1989). This implies that there is no specific temporal or spatial pattern governing the occurrence of icequake, and they occur independently of each other. This information is important for understanding the behavior of icequake and its relationship to other geophysical phenomena. It is worth noting the surge of icequake activity since the afternoon of 9 January probably indicates a heightened development of cracks within the ice plate. There also seems to be a slight delay between the icequake activity and the temperature, which is probably due to lag from thermal diffusion. A similar delay was reported in Goto et al. (1980), in which the time lag is about 2 h. In this study, we did not directly measure the ice temperature but instead relied on the air temperature data. Future work should consider incorporating a combined approach using distributed temperate sensing (DTS) (e.g., Selker et al., 2006) as well as in situ DAS observations to establish a more accurate correlation between temperature variation and icequake activity. Besides, a longer observation period in real glacial environments is required to gain a more comprehensive understanding of the relationship.
Among all the detected events, a total of 9391 were classified as LFEs. These LFEs exhibit a tendency to cluster primarily in the central region of the lake, as well as in close proximity to the airgun floating platform (Fig. 2d). The analysis reveals a close association between LFEs and AGEs, with LFEs generally following AGEs closely in time. However, the detectability of LFEs may vary for different AGEs due to varying noise levels. LFEs are predominantly detected within the first 5 min following AGE but become challenging to observe thereafter (Fig. 2c and further supported by Fig. S9 in the Supplement). In the meantime, the occurrence interval of LFE does not follow the Poisson distribution (Fig. S10 in the Supplement). These observations suggest that there may be a temporal relationship or dependency between AGEs and LFEs, indicating potential interactions or triggering mechanisms between these seismic events and LFEs are likely the waterbody vibrations following the AGEs.
Extracting the dispersion relation from the waveforms of LFEs is a valuable approach to gaining deeper understanding of LFE mechanism and signal propagation. Since the LFE waveforms share a similar moveout patterns (Fig. S4 in the Supplement), we stacked similar waveforms from a series of LFEs to improve SNR. By selecting a master LFE event, we aligned waveforms of other LFEs with time shifts obtained from moving cross-correlation analysis. Stacking aligned waveforms effectively increases the amplitude of the coherent LFE signals, while the random noise is reduced. As a quality control, we applied a threshold for the cross-correlation coefficient to retain only the waveforms that correlated well with the master waveform. Specifically, we considered waveforms with a cross-correlation coefficient greater than 0.7 as indicative of a significant correlation. The resulting stacked waveforms, which are shown in Fig. 3, exhibit a clear inverse dispersion pattern. This pattern implies that the LFE signals with higher frequencies arrive earlier than those with lower frequencies.
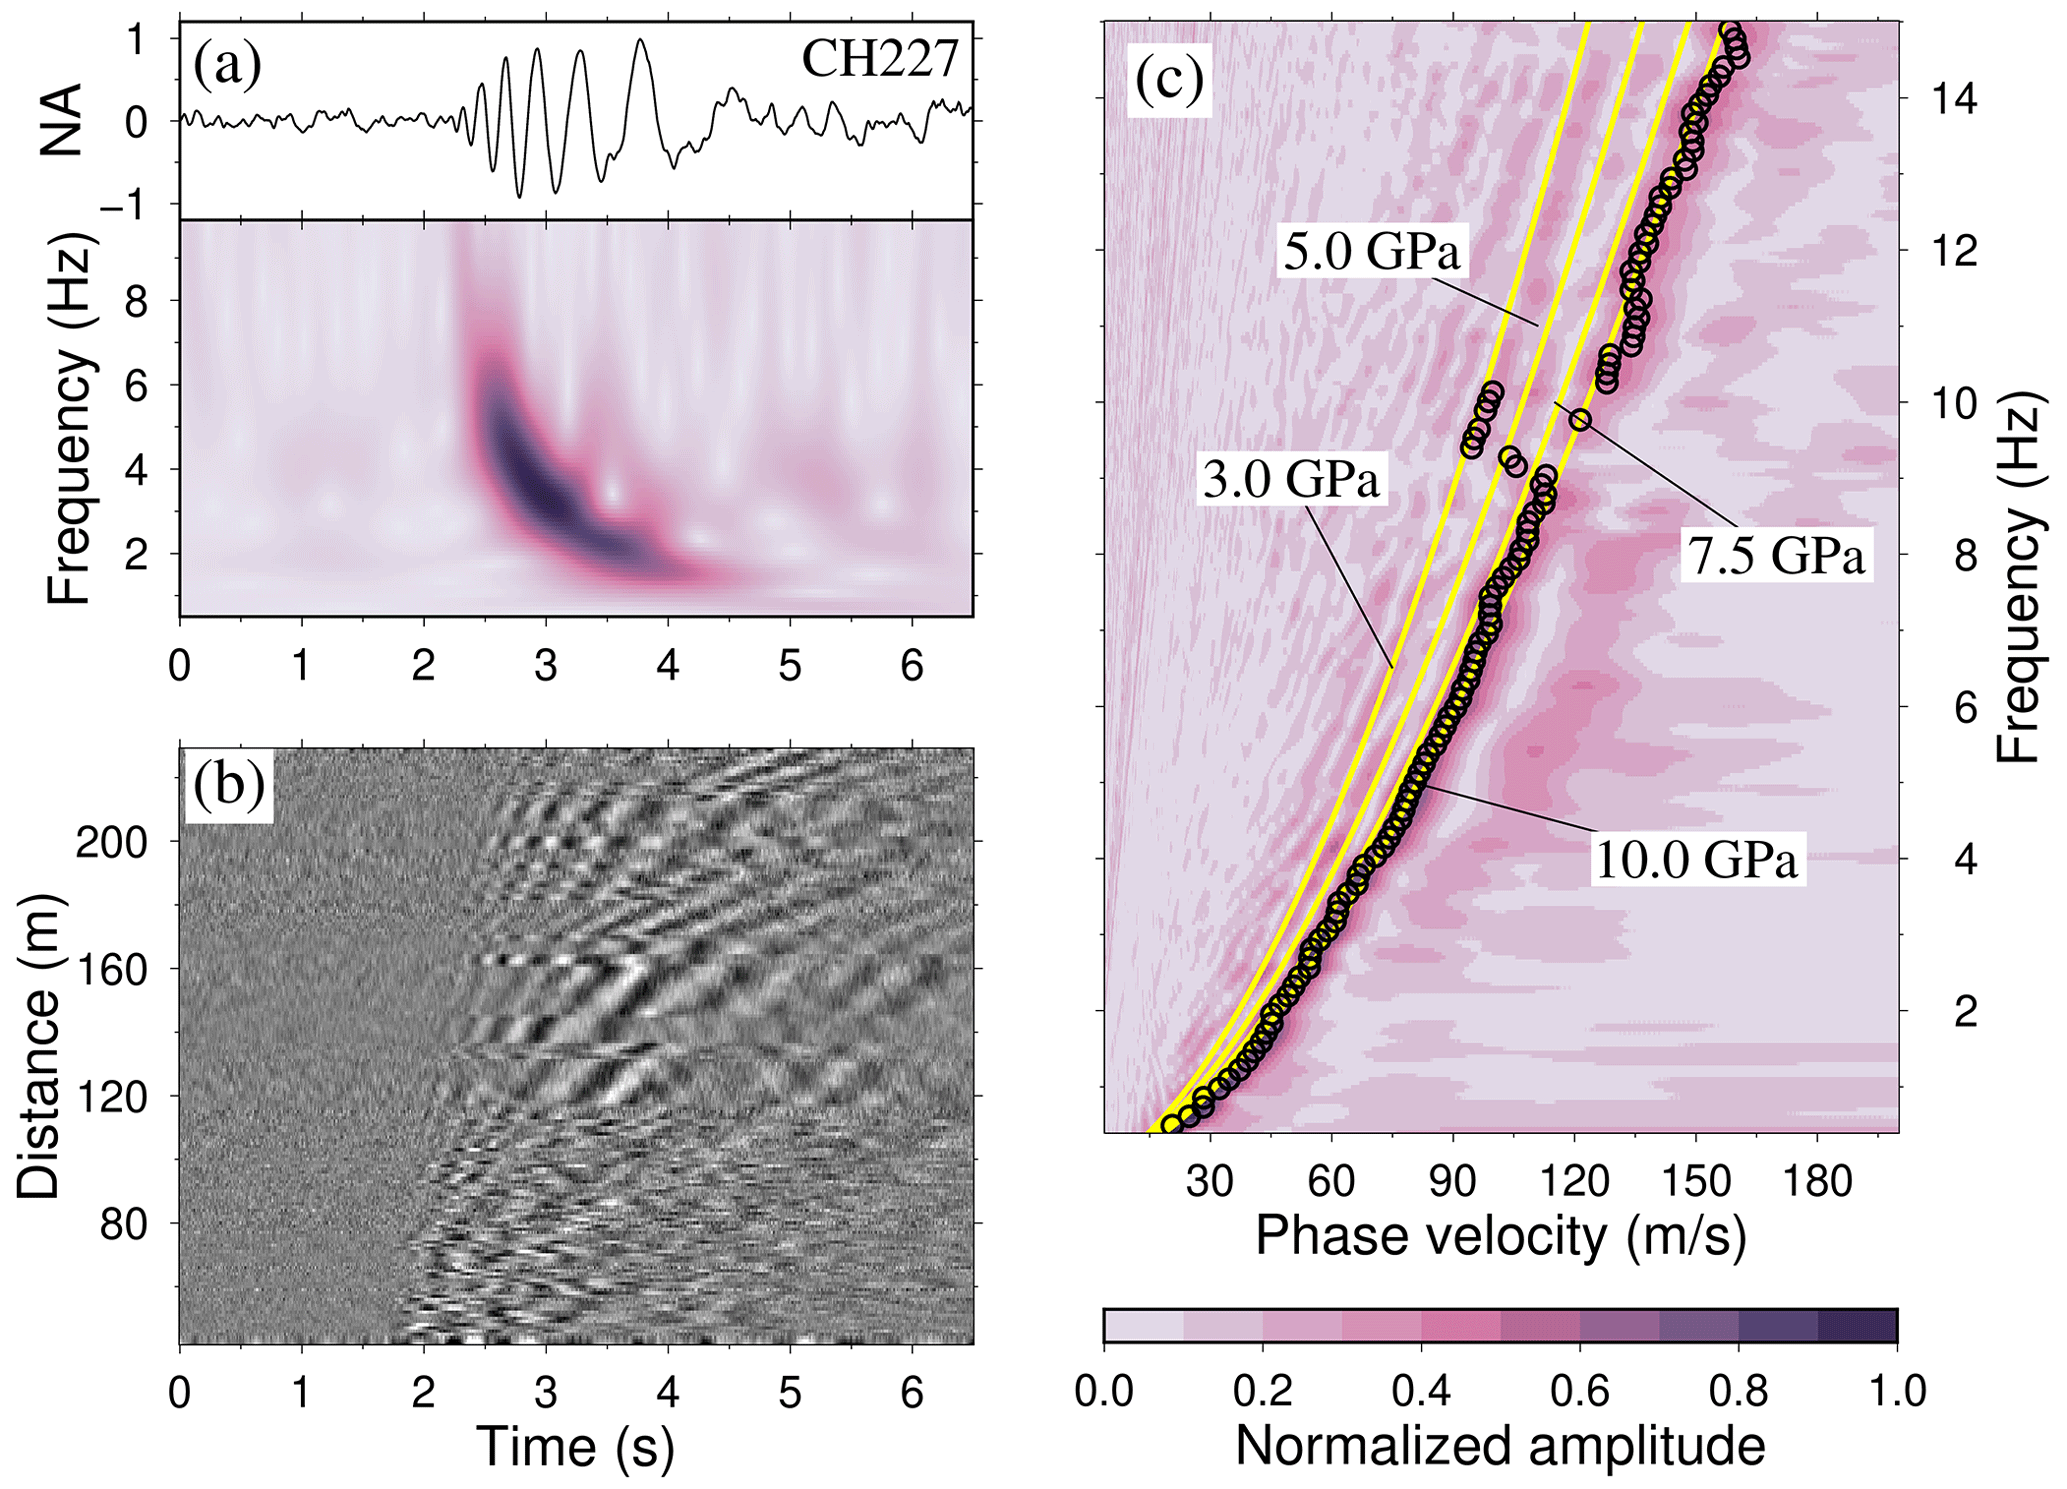
Figure 3Dispersion analysis of LFEs. (a) Stacked LFE waveform and spectrogram of channel 227. The black curve is the stacked waveform with 272 LFE traces. It is bandpass filtered in the frequency band 1–15 Hz. The color denotes the normalized amplitude. (b) The record section of stacked waveform of all LFE events assuming all LFEs are originated at the AGE platform. (c) The measured phase velocity (circles) and predicted velocities (yellow curves) with different Young's modulus (3–10 GPa). The color means the dispersion spectra of stacked LFE traces in (c).
After obtaining the stacked LFE waveforms, we applied the multi-channel surface wave analysis method developed by Park et al. (1999) to extract the phase velocity dispersion curve. This method allows the surface wave signals present in the stacked LFE waveforms to be analyzed and the variation of phase velocity to be determined with respect to frequency. In the frequency range of 1 to 15 Hz, the phase velocity varies from 20 to 160 m s−1. This range is significantly lower than the typical shear wave velocity of ice, which is around 1400 m s−1, as reported by Hudson et al. (2021). This dispersion curve displays the distinctive characteristic of the flexural-gravity wave (FGW) (Williams and Robinson, 1981), which is a special guided wave driven by restoring forces from ice plate flexure and gravity. It corresponds to the quasi-Scholte mode (QS) seismic wavefield of a thin floating ice plate (Moreau et al., 2020; Nziengui-Bâ et al., 2022).
The phase velocity dispersion curve of FGW can be written as (Liu and Mollo-Christensen, 1988)
where g is the gravity acceleration; k is wavenumber; H is the water depth, which is 60 m in this study; D is the bending modulus, which is a function of ice properties; and , where E is Young's modulus, υ is the Poisson ratio, h is the ice thickness which is 0.5 m in this study and ρw is the density of water. Q is ice compression, , where ρi is the density of ice. M is mass loading, . M and Q are much smaller than gravity and flexural terms and can be neglected (Sutherland and Rabault, 2016). The dispersion equation can be rewritten as
Young's modulus can also be determined with compressional wave velocity VP, , assuming v=0.33, according to the results from Fig. S3, E is 9.12 GPa.
The dispersion of the FGW is largely controlled by the ice plate thickness and Young's modulus (Chen et al., 2018; Sergienko, 2017; Sutherland and Rabault, 2016; Timco and Frederking, 1983; Yang and Yates, 1995). Given a roughly known ice plate thickness (∼0.5 m), we successfully explained the observed dispersion curve using the theoretical prediction of FGW (Eq. 1) with Young's modulus (E) of ice around 10 GPa, which is very close to the one for fresh water ice (Timco and Weeks, 2010). However, Young's modulus and ice thickness are strongly correlated. Thus, a large uncertainty in one of the two parameters will have the same effect on the other. Therefore a joint inversion method that combines the quasi-Scholte mode and quasi-symmetric mode (corresponds to compressional waves) following a Bayesian scheme should be used to simultaneously invert the thickness and Young's modulus and can obtain more accurate results (Nziengui-Bâ et al., 2022). Since the frequency thickness is much less than 50 Hz m, the thin plate model (Eq. 1) is still valid in this study. In other cases with a thick ice plate, a full elastic model (e.g., Mindlin, 1951) could be used.
The effective modulus of ice reflects its elastic and viscous deformation characteristics, which can be influenced by various factors, including strain rate, temperature, density, ice type, purity and existence of cracks. (Sinha, 1989). Considering the complex nature of ice and its sensitivity to various factors, understanding the effective modulus provides valuable insights into the deformation behavior and mechanical properties of ice under different conditions. Researchers study these relationships to improve our understanding of ice mechanics and its applications in various fields, such as glaciology, geophysics and engineering. In the study of Nziengui-Bâ et al. (2022), Young's modulus is below 5 GPa. They suspected that this value is underestimated due to snow covering the ice surface or heterogeneity/porosity of the solid columnar ice layer. In the study by Gold (1988), Young's modulus falls into the range of 4.7–10.4 GPa. Northwood (1947) estimated Young's modulus of ice to be 9.8 GPa. This value falls within the range reported by Gold (1988) and provides additional support for Young's modulus of ice. Another study by Petrovic (2003) reported a slightly wider range for Young's modulus of ice, between 9.7 and 11.2 GPa.
Deformations caused by ocean waves, such as FGW, play a significant role in the stability of ice shelves and can potentially result in their fragmentation or trigger calving events (Collins et al., 2015; Liu and Mollo-Christensen, 1988). However, direct observation of the dispersion of the FGW is limited in previous studies (e.g., Sutherland and Rabault, 2016). In this study, we successfully obtained clear records of the FGW. The dispersion of FGW can be used to estimate thickness of the ice plate, which is of significant importance, especially in situations where ice thickness determination is not well resolved, as commonly encountered on ice shelves. Therefore, the accurate recording of FGW on DAS provides a valuable means for inferring both the ice shelf thickness and Young's modulus. In cracked ice plates, it is commonly observed that the strength usually decreases compared to the individual grains, which is typically around 12 GPa. This suggests that the thickness of the grain boundaries could potentially be estimated using the effective modulus (Wang et al., 2008). Renshaw et al. (2020) also reported that Young's modulus initially is around 9.5 GPa but starts to decrease once the ice is compressed uniaxially and saturates at about 8.5 GPa along the loading direction and 7 GPa along two other directions perpendicular to the loading direction. In our case, the presence of the AGE resulted in severe fracturing of the ice plate near the AirGun floating platform (Fig. 1). The dispersion curves of FGW for the inner circle corroborate our speculation (Fig. S11 in the Supplement), which also provides an explanation for the observed lower phase velocity of FGW around 10 Hz in Fig. 3c. The dispersion curve of FGW obtained from the hammer signal (red triangle in Fig. 1) also reveals a smaller Young's modulus (Fig. S12 in the Supplement). While our experiment was conducted over a 3 d period on a frozen lake spanning a few hundred meters, we acknowledged its limitations in terms of duration and spatial coverage. However, it is possible to monitor the temporal variations in Young's modulus or thickness of the ice shelf plate with longer continuous observations. Additionally, deploying a longer DAS cable holds the potential to capture the attenuation effect of the ice plate, as highlighted by previous studies (e.g., Yang and Yates, 1995). This would not only enhance our understanding of wave propagation characteristics but also provide valuable insights into the dynamic changes occurring within the ice plate and its response to environmental changes.
Previous studies have shown that FGW has the potential to induce icequakes on ice shelves. The interaction between ocean waves and the ice shelf can lead to dynamic stress and strain variations, which can trigger seismic activities such as icequakes. Studies such as Chen et al. (2019) have shown that icequakes exhibit spatial and seasonal correlations with ocean gravity waves. This association between icequakes and ocean waves suggests that the interaction between the two can have significant implications for the stability and integrity of ice shelves (Zhao et al., 2019). The energy transferred from the ocean waves to the ice shelf through processes like flexure and wave-induced vibrations can contribute to the fracturing and weakening of the ice, ultimately increasing the risk of ice shelf disintegration. Olinger et al. (2019) found thermal and tidal stresses are important in generating icequakes on the ice shelf. In our experiment, we observed that the number of icequakes did not show a significant change after the AGE (Fig. S13 in the Supplement). This suggests that there may not be a strong correlation between the airgun shot or FGW and the occurrence of icequakes. It is important to note that the absence of a clear correlation in our experiment does not necessarily rule out the possibility of interactions between icequakes and these external factors in other contexts or under different conditions. We even observed a slight decrease in the number of icequakes after the AGE, which could be attributed to the reduced detection capability caused by strong AGE coda. This discrepancy highlights the potential structural difference between the ice plate on a frozen lake and a real ice shelf. It emphasizes the importance of conducting more on-site seismic observations on real ice shelves to gain a deeper understanding of their dynamics and behavior. Future studies incorporating comprehensive field observations on actual ice shelves will provide valuable insights into the response and behavior of icequakes, leading to a better understanding of the factors influencing icequake occurrence and the potential impacts on ice shelf stability. Moreover, a DAS array on the seafloor is necessary to monitor the ocean wave and study the response of the ice shelf to the ocean waves (Lindsey et al., 2019).
Our study highlights the potential of DAS in monitoring the formation and progression of ice cracks using passive source signals recorded in similar ice shelf studies. This approach is particularly useful in cases where there is a firn layer on the ice and remote sensing methods are challenging to employ. Furthermore, the variations of FGW can offer valuable information about the heterogeneity of ice plate, which can potentially help infer the size and distribution of the ice plate fragments. It is important to note that our experiment was conducted on an ice-covered lake, and to extend the applicability of these findings to ice shelves, spatial sampling and optimization of the array layout should be considered. For example, by deploying fiber-optic cable spanning hundreds of meters, we can accurately locate icequakes with a precision of meters, and we can also measure longer-wavelength FGW. However, measuring FGW induced by an ocean wave on the ice shelf becomes a challenge, since a longer wavelength (up to 10 km) requires a larger aperture array, and the dominant frequency is down to 0.1 Hz (Zhao et al., 2018). By extending the length of the fiber-optic cable to several kilometers, we can probably capture FGW with larger wavelengths. However, there are other limitations that need to be addressed in future studies; for example, the coupling of fiber-optic cables with the ice on real ice shelves presents a significant challenge in practical applications due to harsh environmental conditions. Moreover, the conventional DAS fiber only measures a single strain component along the cable and does not provide polarization information, which increases the difficulty of identifying seismic phases (Hudson et al., 2021), and the absence of horizontal shear mode introduces additional uncertainty in estimating ice properties (Nziengui-Bâ et al., 2022). One potential remedy to address this is using helically wound fiber (Ning and Sava, 2018).
In this study, we analyzed data of a dense DAS array deployed on a frozen lake, which enables the observation of a substantial number of seismicities associated with ice dynamics. Utilizing a machine learning method, we identified two types of seismic events, namely, icequakes and LFEs. Icequakes exhibited good correlations with ice fractures and local air temperature. The precise location of icequake provided a depiction of the ice fracture map. The icequake frequency showed a positive correlation with air temperature; that is, higher temperature results in more icequakes. The LFEs were identified as dynamic flexure of the ice plate. The dispersion curve of LFE signal was used to investigate Young's modulus of ice, which is close to 9 GPa in this study. The methods used in this study can be applied to glaciers and ice shelves for monitoring microseismicity and icebody itself. In particular, deploying a DAS array with a larger aperture on the ice shelf is possible to capture a longer-period LFE signal, providing constraints on physical properties such as thickness and Young's modulus of ice shelf. Moreover, DAS-based seismic activity observations combined with remote sensing techniques can provide us with more in-depth monitoring and research on dynamic changes and disintegration processes.
Data and code used to produce this research can be shared upon request to the authors.
The supplement related to this article is available online at: https://doi.org/10.5194/tc-18-837-2024-supplement.
XZ planned the campaign; RL performed the measurements; JX, XZ, CL, FB, and HL analyzed the data; JX wrote the manuscript draft; and JX, XZ, CL, SN, RC, BC, and FB reviewed and edited the manuscript.
The contact author has declared that none of the authors has any competing interests.
Publisher's note: Copernicus Publications remains neutral with regard to jurisdictional claims made in the text, published maps, institutional affiliations, or any other geographical representation in this paper. While Copernicus Publications makes every effort to include appropriate place names, the final responsibility lies with the authors.
The authors thank Baoshan Wang, Rui Zou and Yahong Wang for their help with the experiment setup and data requisition. We thank Herb Wang (UW-Madison) and Daoyuan Sun (USTC) for their insightful suggestions. The authors thank the anonymous reviewers and the editor, Petra Heil, for their constructive comments.
This work was supported by the National Natural Science Foundation of China (grant nos. 42274076, 42325401 and 42030311), the Youth Innovation Promotion Association of the Chinese Academy of Sciences (grant no. 2022335) and the Innovation Group Project of the Natural Science Foundation of Hubei Province (2023AFA040).
This paper was edited by Petra Heil and reviewed by four anonymous referees.
Aster, R. C. and Winberry, J. P.: Glacial seismology, Rep. Prog. Phys., 80, 126801, https://doi.org/10.1088/1361-6633/aa8473, 2017.
Booth, A. D., Christoffersen, P., Schoonman, C., Clarke, A., Hubbard, B., Law, R., Doyle, S. H., Chudley, T. R., and Chalari, A.: Distributed Acoustic Sensing of Seismic Properties in a Borehole Drilled on a Fast-Flowing Greenlandic Outlet Glacier, Geophys. Res. Lett., 47, e2020GL088148, https://doi.org/10.1029/2020GL088148, 2020.
Brisbourne, A. M., Kendall, M., Kufner, S.-K., Hudson, T. S., and Smith, A. M.: Downhole distributed acoustic seismic profiling at Skytrain Ice Rise, West Antarctica, The Cryosphere, 15, 3443–3458, https://doi.org/10.5194/tc-15-3443-2021, 2021.
Castongia, E., Wang, H. F., Lord, N., Fratta, D., Mondanos, M., and Chalari, A.: An Experimental Investigation of Distributed Acoustic Sensing (DAS) on Lake Ice, J. Environ. Eng. Geophys., 22, 167–176, https://doi.org/10.2113/JEEG22.2.167, 2017.
Chen, Z., Bromirski, P. D., Gerstoft, P., Stephen, R. A., Wiens, D. A., Aster, R. C., and Nyblade, A. A.: Ocean-excited plate waves in the Ross and Pine Island Glacier ice shelves, J. Glaciol., 64, 730–744, https://doi.org/10.1017/jog.2018.66, 2018.
Chen, Z., Bromirski, P. D., Gerstoft, P., Stephen, R. A., Lee, W. S., Yun, S., Olinger, S. D., Aster, R. C., Wiens, D. A., and Nyblade, A. A.: Ross Ice Shelf Icequakes Associated With Ocean Gravity Wave Activity, Geophys. Res. Lett., 46, 8893–8902, https://doi.org/10.1029/2019GL084123, 2019.
Collins III, C. O., Rogers, W. E., Marchenko, A., and Babanin, A. V.: In situ measurements of an energetic wave event in the Arctic marginal ice zone, Geophys. Res. Lett., 42, 1863–1870, https://doi.org/10.1002/2015GL063063, 2015.
de Graaf, K. L., Brandner, P. A., and Penesis, I.: The pressure field generated by a seismic airgun, Exp. Therm. Fluid Sci., 55, 239–249, https://doi.org/10.1016/j.expthermflusci.2014.02.025, 2014.
Dobretsov, N. L., Ruzhich, V. V., Psakhie, S. G., Chernykh, E. N., Shilko, E. V., Levina, E. A., and Ponomareva, E. I.: Advance in earthquake prediction by physical simulation on the baikal ice cover, Phys. Mesomech., 16, 52–61, https://doi.org/10.1134/S1029959913010062, 2013.
Ekström, G., Nettles, M., and Abers, G. A.: Glacial Earthquakes, Science, 302, 622–624, https://doi.org/10.1126/science.1088057, 2003.
Ewing, M., Crary, A. P., and Thorne Jr., A. M.: Propagation of Elastic Waves in Ice, Part I, Physics, 5, 165–168, https://doi.org/10.1063/1.1745245, 1934.
Farghal, N. S., Saunders, J. K., and Parker, G. A.: The Potential of Using Fiber Optic Distributed Acoustic Sensing (DAS) in Earthquake Early Warning Applications, B. Seismol. Soc. Am., 112, 1416–1435, https://doi.org/10.1785/0120210214, 2022.
Fichtner, A., Klaasen, S., Thrastarson, S., Çubuk-Sabuncu, Y., Paitz, P., and Jónsdóttir, K.: Fiber-Optic Observation of Volcanic Tremor through Floating Ice Sheet Resonance, The Seismic Record, 2, 148–155, https://doi.org/10.1785/0320220010, 2022.
Gold, L. W.: On the elasticity of ice plates, Can. J. Civil. Eng., 15, 1080–1084, https://doi.org/10.1139/l88-140, 1988.
Goto, K., Hamaguchi, H., and Wada, Y.: A study on ice faulting and icequake activity in the lake Suwa, (3) icequake activity and thermal stress in ice plate, Tohoku Geophys. J., 27, 27–37, 1980.
Helmstetter, A., Nicolas, B., Comon, P., and Gay, M.: Basal icequakes recorded beneath an Alpine glacier (Glacier d'Argentière, Mont Blanc, France): Evidence for stick-slip motion?, J. Geophys. Res.-Earth, 120, 379–401, https://doi.org/10.1002/2014JF003288, 2015.
Hudson, T. S., Baird, A. F., Kendall, J. M., Kufner, S. K., Brisbourne, A. M., Smith, A. M., Butcher, A., Chalari, A., and Clarke, A.: Distributed Acoustic Sensing (DAS) for Natural Microseismicity Studies: A Case Study From Antarctica, J. Geophys. Res.-Sol. Ea., 126, e2020JB021493, https://doi.org/10.1029/2020JB021493, 2021.
Kavanaugh, J., Schultz, R., Andriashek, L. D., van der Baan, M., Ghofrani, H., Atkinson, G., and Utting, D. J.: A New Year's Day icebreaker: icequakes on lakes in Alberta, Canada, Can. J. Earth Sci., 56, 183–200, https://doi.org/10.1139/cjes-2018-0196, 2018.
Köhler, A., Maupin, V., Nuth, C., and van Pelt, W.: Characterization of seasonal glacial seismicity from a single-station on-ice record at Holtedahlfonna, Svalbard, Ann. Glaciol., 60, 23–36, https://doi.org/10.1017/aog.2019.15, 2019.
Lindsey, N. J., Dawe, T. C., and Ajo-Franklin, J. B.: Illuminating seafloor faults and ocean dynamics with dark fiber distributed acoustic sensing, Science, 366, 1103–1107, https://doi.org/10.1126/science.aay5881, 2019.
Liu, A. K. and Mollo-Christensen, E.: Wave Propagation in a Solid Ice Pack, J. Phys. Oceanogr., 18, 1702–1712, https://doi.org/10.1175/1520-0485(1988)018<1702:WPIASI>2.0.CO;2, 1988.
Lombardi, D., Gorodetskaya, I., Barruol, G., and Camelbeeck, T.: Thermally induced icequakes detected on blue ice areas of the East Antarctic ice sheet, Ann. Glaciol., 60, 45–56, https://doi.org/10.1017/aog.2019.26, 2019.
Mindlin, R. D.: Influence of Rotatory Inertia and Shear on Flexural Motions of Isotropic, Elastic Plates, J. Appl. Mech., 18, 31–38, https://doi.org/10.1115/1.4010217, 1951.
Moreau, L., Boué, P., Serripierri, A., Weiss, J., Hollis, D., Pondaven, I., Vial, B., Garambois, S., Larose, É., Helmstetter, A., Stehly, L., Hillers, G., and Gilbert, O.: Sea Ice Thickness and Elastic Properties From the Analysis of Multimodal Guided Wave Propagation Measured With a Passive Seismic Array, J. Geophys. Res.-Oceans, 125, e2019JC015709, https://doi.org/10.1029/2019JC015709, 2020.
Ning, I. L. C. and Sava, P.: High-resolution multi-component distributed acoustic sensing, Geophys. Prospect., 66, 1111–1122, https://doi.org/10.1111/1365-2478.12634, 2018.
Northwood, T. D.: Sonic determination of the elastic properties of ice, Can. J. Res. A, 25, 88–95, https://doi.org/10.1139/cjr47a-011, 1947.
Nziengui-Bâ, D., Coutant, O., Moreau, L., and Boué, P.: Measuring the thickness and Young's modulus of the ice pack with DAS, a test case on a frozen mountain lake, Geophys. J. Int., 233, 1166–1177, https://doi.org/10.1093/gji/ggac504, 2022.
Olinger, S. D., Lipovsky, B. P., Wiens, D. A., Aster, R. C., Bromirski, P. D., Chen, Z., Gerstoft, P., Nyblade, A. A., and Stephen, R. A.: Tidal and Thermal Stresses Drive Seismicity Along a Major Ross Ice Shelf Rift, Geophys. Res. Lett., 46, 6644–6652, https://doi.org/10.1029/2019GL082842, 2019.
Park, C. B., Miller, R. D., and Xia, J.: Multichannel analysis of surface waves, GEOPHYSICS, 64, 800–808, https://doi.org/10.1190/1.1444590, 1999.
Petrovic, J. J.: Review Mechanical properties of ice and snow, J. Mater. Sci., 38, 1–6, https://doi.org/10.1023/A:1021134128038, 2003.
Podolskiy, E. A. and Walter, F.: Cryoseismology, Rev. Geophys., 54, 708–758, https://doi.org/10.1002/2016RG000526, 2016.
Redmon, J. and Farhadi, A.: YOLOv3: An incremental improvement, arXiv [preprint], https://doi.org/10.48550/arXiv.1804.02767, 2018.
Renshaw, C. E., Schulson, E. M., Iliescu, D., and Murzda, A.: Increased Fractured Rock Permeability After Percolation Despite Limited Crack Growth, J. Geophys. Res.-Sol. Ea., 125, e2019JB019240, https://doi.org/10.1029/2019JB019240, 2020.
Romeyn, R., Hanssen, A., Ruud, B. O., Stemland, H. M., and Johansen, T. A.: Passive seismic recording of cryoseisms in Adventdalen, Svalbard, The Cryosphere, 15, 283–302, https://doi.org/10.5194/tc-15-283-2021, 2021.
Röösli, C., Walter, F., Husen, S., Andrews, L. C., Lüthi, M. P., Catania, G. A., and Kissling, E.: Sustained seismic tremors and icequakes detected in the ablation zone of the Greenland ice sheet, J. Glaciol., 60, 563–575, https://doi.org/10.3189/2014JoG13J210, 2014.
Ross, Z. E., Meier, M.-A., and Hauksson, E.: P Wave Arrival Picking and First-Motion Polarity Determination With Deep Learning, J. Geophys. Res.-Sol. Ea., 123, 5120–5129, https://doi.org/10.1029/2017JB015251, 2018.
Ruzhich, V. V., Psakhie, S. G., Chernykh, E. N., Bornyakov, S. A., and Granin, N. G.: Deformation and seismic effects in the ice cover of Lake Baikal, Russ. Geol. Geophys.+, 50, 214–221, https://doi.org/10.1016/j.rgg.2008.08.005, 2009.
Rydelek, P. A. and Sacks, I. S.: Testing the completeness of earthquake catalogues and the hypothesis of self-similarity, Nature, 337, 251–253, https://doi.org/10.1038/337251a0, 1989.
Sambridge, M.: Geophysical inversion with a neighbourhood algorithm – I. Searching a parameter space, Geophys. J. Int., 138, 479–494, https://doi.org/10.1046/j.1365-246X.1999.00876.x, 1999.
Selker, J., van de Giesen, N., Westhoff, M., Luxemburg, W., and Parlange, M. B.: Fiber optics opens window on stream dynamics, Geophys. Res. Lett., 33, L24401, https://doi.org/10.1029/2006GL027979, 2006.
Sergeant, A., Mangeney, A., Yastrebov, V. A., Walter, F., Montagner, J.-P., Castelnau, O., Stutzmann, E., Bonnet, P., Ralaiarisoa, V. J.-L., Bevan, S., and Luckman, A.: Monitoring Greenland ice sheet buoyancy-driven calving discharge using glacial earthquakes, Ann. Glaciol., 60, 75–95, https://doi.org/10.1017/aog.2019.7, 2019.
Sergienko, O. V.: Behavior of flexural gravity waves on ice shelves: Application to the Ross Ice Shelf, J. Geophys. Res.-Oceans, 122, 6147–6164, https://doi.org/10.1002/2017JC012947, 2017.
Sinha, N. K.: Elasticity of natural types of polycrystalline ice, Cold Reg. Sci. Technol., 17, 127–135, https://doi.org/10.1016/S0165-232X(89)80003-5, 1989.
Stevenson, P. R.: Microearthquakes at Flathead Lake, Montana: A study using automatic earthquake processing, B. Seismol. Soc. Am., 66, 61–80, https://doi.org/10.1785/BSSA0660010061, 1976.
Stork, A. L., Baird, A. F., Horne, S. A., Naldrett, G., Lapins, S., Kendall, J.-M., Wookey, J., Verdon, J. P., Clarke, A., and Williams, A.: Application of machine learning to microseismic event detection in distributed acoustic sensing data, Geophysics, 85, KS149–KS160, https://doi.org/10.1190/geo2019-0774.1, 2020.
Sutherland, G. and Rabault, J.: Observations of wave dispersion and attenuation in landfast ice, J. Geophys. Res.-Oceans, 121, 1984–1997, https://doi.org/10.1002/2015JC011446, 2016.
Timco, G. W. and Frederking, R. M. W.: Flexural strength and fracture toughness of sea ice, Cold Reg. Sci. Technol., 8, 35–41, https://doi.org/10.1016/0165-232X(83)90015-0, 1983.
Timco, G. W. and Weeks, W. F.: A review of the engineering properties of sea ice, Cold Reg. Sci. Technol., 60, 107–129, https://doi.org/10.1016/j.coldregions.2009.10.003, 2010.
Veitch, S. A. and Nettles, M.: Assessment of glacial-earthquake source parameters, J. Glaciol., 63, 867–876, https://doi.org/10.1017/jog.2017.52, 2017.
Walter, F., Dalban Canassy, P., Husen, S., and Clinton, J. F.: Deep icequakes: What happens at the base of Alpine glaciers?, J. Geophys. Res.-Earth, 118, 1720–1728, https://doi.org/10.1002/jgrf.20124, 2013.
Walter, F., Gräff, D., Lindner, F., Paitz, P., Köpfli, M., Chmiel, M., and Fichtner, A.: Distributed acoustic sensing of microseismic sources and wave propagation in glaciated terrain, Nat. Commun., 11, 2436, https://doi.org/10.1038/s41467-020-15824-6, 2020.
Wang, Y., Ballarini, R., and Rodin, G. J.: Crack-Tip Parameters in Polycrystalline Plates with Soft Grain Boundaries, J. Eng. Mech., 134, 100–109, https://doi.org/10.1061/(ASCE)0733-9399(2008)134:1(100), 2008.
Wei, C., Qin, M., Zhang, Y., Zou, R., Wang, L., Guo, X., Liu, X., Wang, Y., and Sun, D.: Airgun Excitation Experiments at Different Placement Depths in the Qilian Mountain of Gansu Province, China, Seismol. Res. Lett., 89, 974–982, https://doi.org/10.1785/0220170253, 2018.
Wen, T., Garrison, G. R., Francois, R. E., Stein, R. P., and Felton, W. J.: Sound speed, reflectivity, and absorption measurements in arctic ice in 1988, Technical Report, Appl. Phys. Lab. Rep. APL-UW TR 9005, 1991.
West, M. E., Larsen, C. F., Truffer, M., O'Neel, S., and LeBlanc, L.: Glacier microseismicity, Geology, 38, 319–322, https://doi.org/10.1130/G30606.1, 2010.
Williams, R. T. and Robinson, E. S.: Flexural waves in the Ross Ice Shelf, J. Geophys. Res.-Oceans, 86, 6643–6648, https://doi.org/10.1029/JC086iC07p06643, 1981.
Yang, T. C. and Yates, T. W.: Flexural waves in a floating ice sheet: Modeling and comparison with data, J. Acoust. Soc. Am., 97, 971–977, https://doi.org/10.1121/1.412076, 1995.
Zhan, Z.: Distributed Acoustic Sensing Turns Fiber-Optic Cables into Sensitive Seismic Antennas, Seismol. Res. Lett., 91, 1–15, https://doi.org/10.1785/0220190112, 2019.
Zhou, Y., Yue, H., Kong, Q., and Zhou, S.: Hybrid Event Detection and Phase-Picking Algorithm Using Convolutional and Recurrent Neural Networks, Seismol. Res. Lett., 90, 1079–1087, https://doi.org/10.1785/0220180319, 2019.
Zhu, W. and Beroza, G. C.: PhaseNet: a deep-neural-network-based seismic arrival-time picking method, Geophys. J. Int., 216, 261–273, https://doi.org/10.1093/gji/ggy423, 2019.