the Creative Commons Attribution 4.0 License.
the Creative Commons Attribution 4.0 License.
The Pléiades Glacier Observatory: high-resolution digital elevation models and ortho-imagery to monitor glacier change
Etienne Berthier
Jérôme Lebreton
Delphine Fontannaz
Steven Hosford
Joaquín Muñoz-Cobo Belart
Fanny Brun
Liss M. Andreassen
Brian Menounos
Charlotte Blondel
Spaceborne digital elevation models (DEMs) of glaciers are essential to describe their health and their contribution to river runoff and sea level rise. Publicly available DEMs derived from sub-meter satellite stereo imagery were, up to now, mainly available in the polar regions and High Mountain Asia. Here, we present the Pléiades Glacier Observatory (PGO), a scientific program acquiring Pléiades 0.7 m satellite stereo pairs for 140 sites from Earth's glacierized areas. The PGO product consists of freely available DEMs at 2 and 20 m ground sampling distance together with 0.5 m (panchromatic) and 2 m (multispectral) ortho-images. PGO stereo acquisitions began in July 2016 in the Northern Hemisphere and February 2017 in the Southern Hemisphere. Each site is revisited every 5 years (cloud permitting), close to the end of the melt season, to measure glacier elevation change with an average uncertainty of 0.49 m (95 % confidence level, for a glacierized area of 1 km2), i.e., 0.1 m yr−1. PGO samples over 20 000 km2 of glacierized terrain, which represents about 3 % of the Earth's glacier area. This small sample, however, provides a first-order estimate (within 0.07 ) of the global glacier mass change and its decadal evolution.
- Article
(11858 KB) - Full-text XML
- BibTeX
- EndNote
Over the last 2 decades, the increase in spaceborne satellite imagery archives has accelerated our ability to quantify glacier change (Pope et al., 2014; Berthier et al., 2023). Distribution of medium-resolution (10–30 m) satellite archives (e.g., from Landsat and the Advanced Spaceborne Thermal Emission and Reflection Radiometer – ASTER) and the open nature of new missions (e.g., the Sentinels from Copernicus) have provided imagery to construct improved glacier inventories (Pfeffer et al., 2014; RGI 7.0 Consortium, 2023), spatiotemporal analysis of glacier velocity (Millan et al., 2022), and elevation change (Hugonnet et al., 2021). These global observational products of glacier change are important calibration data to improve projections of future glacier mass change (Rounce et al., 2023).
Glaciology has also benefited from the use of very high-resolution (VHR; i.e., sub-meter) optical sensors. Contrary to medium-resolution satellite missions, present-day very high-resolution satellite missions do not allow a frequent and continuous global survey of the Earth's glaciers, but these missions are advantageous in a number of ways. The ability to quickly task these satellites provides a means for rapid response following natural disasters (Shugar et al., 2021; Kääb et al., 2021). Their sub-meter resolution translates into superior derived products (e.g., glacier outline, velocity, elevation, snow-line elevation) compared to those obtained from medium-resolution imagery. This improved quality is needed to study fine-scale processes (Sato et al., 2021; Brun et al., 2016; Loriaux and Ruiz, 2021), monitor small glaciers (Małecki, 2022), validate similar products derived from coarser images (Andreassen et al., 2022), and also calibrate glaciological mass balance measured in the field (Zemp et al., 2013; Wagnon et al., 2021; Andreassen et al., 2016). With the notable exceptions of the polar regions (Howat et al., 2019; Porter et al., 2018) and High Mountain Asia (Shean et al., 2020), however, access to this very high-resolution data has remained limited for the glaciological community.
This article presents the Pléiades Glacier Observatory (PGO), an initiative by the French Space Agency (CNES) and the Laboratoire d'Etudes en Géophysique et Océanographie Spatiales (LEGOS) to facilitate access to very high-resolution data (digital elevation models (DEMs) and ortho-imagery) from the Pléiades satellites. We present the coverage achieved since 2016 for 140 PGO glacierized sites and describe how the freely available products are derived from Pléiades stereo images. We also assess the quality of the PGO DEMs using near-contemporaneous accurate airborne laser-scanning data in Norway and western Canada and evaluate the precision of the elevation change maps that are derived every 5 years. We conclude by considering how representative the geodetic mass balance derived for these PGO sites is for Earth's glaciers.
2.1 Pléiades 1A and 1B satellites for glacier monitoring
CNES and Airbus Defence and Space respectively designed and operates the optical satellites Pléiades 1A and 1B (Gleyzes et al., 2012). Pléiades 1A was launched on 17 December 2011, and Pléiades 1B was launched on 2 December 2012. The image resolutions of the panchromatic and multispectral bands are initially 0.7 and 2.8 m, respectively, then resampled by the ground segment to 0.5 and 2 m. Pléiades images have an ∼20 km swath, relatively large compared to other VHR satellites (e.g., 13 km for WorldView-3). In order to derive DEMs, stereo images can be acquired in an along-track pair about 40 s apart. Compared to earlier stereo sensors (SPOT5-HRS, ALOS-PRISM, and TERRA-ASTER visible and near-infrared – VNIR), a clear advantage for snow and ice monitoring is the 12-bit encoding of the sensor (4096 gray levels), which significantly increases the image contrast (Berthier et al., 2023).
Early results on several glaciers showed the usefulness of Pléiades data for measuring their topography and their change with time (Berthier et al., 2014; Holzer et al., 2015). The 1σ uncertainty of these Pléiades DEMs is about 1 m over gently sloping areas (Błaszczyk et al., 2019; Berthier et al., 2014). This level of uncertainty is adequate to measure elevation changes, often exceeding several meters, at seasonal (Belart et al., 2017; Beraud et al., 2023; Falaschi et al., 2023b) to inter-annual (Bhattacharya et al., 2021) timescales.
Airbus operates Pléiades 1A and 1B commercially, which does not include building a comprehensive archive of images, at least not for glaciers. Furthermore, access to the data is difficult and cost-prohibitive, especially for users outside of the European Union. These challenges led us to initiate the PGO program in 2016 as a way to monitor a selection of glacier sites around the globe and facilitate access for the international glaciological community.
Despite the 12-bit encoding of the images, we observed saturated pixels for early Pléiades images (2011–2015) on illuminated slopes (facing toward the Equator) at the time of image acquisition (10:30 to 11:00 LT). No saturation was observed in the polar regions due to the lower sun incidence angles. To avoid this saturation in the tropics and mid-latitudes, a request is systematically made to Airbus DS to lower the gain within the 60° N–60° S latitude bands. Technically, this consists of requesting to lower the number of time delay and integration (TDI) stages from the default value of 13 to a value of 10. Finally, in an earlier study, we found moderate added value using tri-stereo compared to a standard stereo coverage (Berthier et al., 2014), likely because most of the imaged glaciers are moderately sloped. Tri-stereo coverage is 50 % more expensive for the project, and hence PGO acquisitions are all performed in standard stereo mode.
2.2 Selected glacier targets and acquisition campaigns
Given the funding available for the PGO, an exhaustive survey of the ∼700 000 km2 glaciers on Earth is not feasible. Our strategy is instead to focus on a discrete number of sites and propose some tailored acquisitions. In particular, we are careful to task the Pléiades satellites during a time window prescribed by experts in glacier research, in most cases at the end of the summer when the snow cover is the lowest on and off glaciers. This is important because, when snow is present, the risk of image saturation is higher, and, if the snow layer is thick off glacier, the coregistration of the DEMs is more uncertain. Late summer acquisition also means that the images and DEMs will often be acquired close in time to the glaciological field measurements or airborne campaigns which facilitate comparisons. Reduced snow cover also means that most PGO ortho-images should be suitable to update glacier inventories (Andreassen et al., 2022; Paul et al., 2011) and to delineate the snowline, a proxy for the equilibrium line if observed close to the end of melt season (Pelto, 2010; Rabatel et al., 2013). Images in the PGO database are almost cloud-free because images acquired with more than 10 % of clouds are not validated and the tasking continues. If a cloud-free stereo pair is not obtained during the user-defined time period, the tasking is first extended by a few weeks (if relevant) and/or postponed to the following year.
A PGO site, based on a user-defined polygon, typically covers 100 to 500 km2 and generally includes dozens of glaciers. Site selection was performed following a call to the community through the World Glacier Monitoring Service (WGMS; Zurich), the agency in charge of compiling and disseminating standardized datasets on glacier fluctuations. The reason to go through the WGMS was that Pléiades repeat DEMs have a high potential to calibrate (field) glaciological mass balance estimates (Zemp et al., 2013) and also help to assess the regional representativeness of the glaciers monitored in the field. The PGO covers several WGMS benchmark glaciers. We also included iconic glaciers (e.g., Perito Moreno Glacier in Argentina and Mount Kilimanjaro in Tanzania), and, as much as possible, we attempted to ensure that the PGO sampled all main glacierized regions on Earth. The PGO only samples a few sites in the Arctic regions (including Alaska) because these glaciers are regularly imaged by the ArcticDEM project (Porter et al., 2018). Among the 19 first-order glacier regions defined by the global terrestrial network for glaciers (GTN-G, 2023), only the Russian Arctic is not sampled by the PGO, as no request came from the research community for this region. Overall, the PGO acquires imagery of over 140 targets (Fig. 1, Table 1).
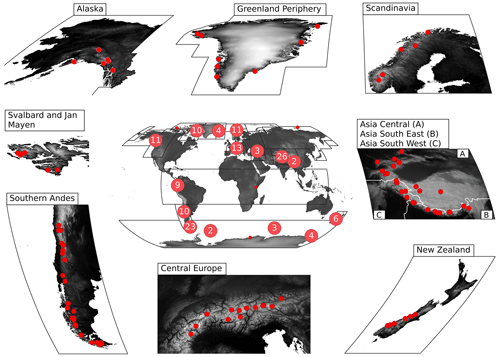
Figure 1Map of the distribution of the 140 PGO sites. The central panel shows the number of sites in the main glacier regions, and the peripheral panels highlight the distribution of the sites for a few regions of dense spatial coverage.
Table 1Summary of the areas and number of glaciers covered during the first 10 original PGO campaigns. NH stands for Northern Hemisphere, and SH stands for Southern Hemisphere. See also Table 4 for the distribution of sites among the 19 GTN-G first-order glacier regions. The columns “Total area” and “Glacier area” correspond to the full coverage. The real area coverage by PGO is in fact slightly lower due to data gaps in the DEMs.
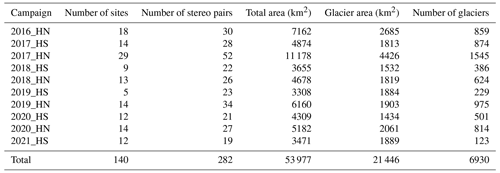
For funding reasons, not all 140 sites could be observed the same year. We thus designed an acquisition program made of 10 original campaigns, with 5 in each hemisphere. These campaigns occurred during the summer and early fall (i.e., from July to October in the Northern Hemisphere and from January to May in the Southern Hemisphere). During each of these campaigns, the Pléiades satellites attempted to acquire images over 10 to 30 glacier sites. The first PGO campaign took place in summer 2016 in the Northern Hemisphere, and the last one took place in summer 2021 in the Southern Hemisphere.
Since July 2021 in the Northern Hemisphere (and February 2022 in the Southern Hemisphere), the PGO has entered into “repeat mode”; i.e., stereo coverage is repeated 5 years after previous acquisitions (cloud permitting). The choice of this 5-year time lag between acquisitions was driven by (i) the wish to have a high signal-to-noise ratio on the measurement of the rate of elevation change and (ii) the consideration that the volume-to-mass conversion factor is not well constrained for periods shorter than 5 years (Huss, 2013).
2.3 The PGO products
The PGO products consist of the DEMs and related ortho-images derived automatically from the stereo image pair and of the 5-year maps of elevation difference calculated once a PGO site has been observed again by the Pléiades satellites.
2.3.1 DEMs and ortho-images
Airbus Defence and Space provides Pléiades stereo pairs at the “primary” processing level. We then generate DEMs and ortho-images using the Ames Stereo Pipeline (ASP) (Beyer et al., 2018; Shean et al., 2016), version 3.0.0, release 2021-10-05 (https://github.com/NeoGeographyToolkit/StereoPipeline, last access: 6 November 2024). ASP is a suite of free and open-source tools designed for processing stereo images captured from satellites and other platforms. It is extensively used in glaciology to generate DEMs from Maxar WorldView/GeoEye (Shean et al., 2016; Willis et al., 2015), ASTER VNIR on board TERRA (Brun et al., 2017; Shean et al., 2020), Pléiades (Marti et al., 2016; Deschamps-Berger et al., 2020), and Planet SkySat-C (Bhushan et al., 2021) images.
A key step for the generation of a DEM is the correlation between the two images of the stereo pair. Several algorithms are available in ASP that can lead to different results. Deschamps-Berger et al. (2020) showed that the choice of the photogrammetric options, and, in particular, the correlator, has an impact on the precision and completeness of the elevation difference over stable terrain and snow-covered areas. We used their preferred set of photogrammetric options, based on the semi-global matching (SGM) correlator (Hirschmuller, 2008). SGM has the advantage of providing enhanced DEM detail/quality and fewer data gaps. However, we observed that, in some cases (Fig. 2), SGM tended to fill the DEM with noisy data in textureless areas of the images (cast shadows, areas covered with fresh snow, and in the case of Fedchenko Glacier in the Fig. 2 image saturation). For this reason, we also processed the stereo pairs using the block-matching (BM) correlator with a set of processing parameters taken from Willis et al. (2015) and Marti et al., 2016). We provide both versions (SGM and BM) and leave it to the user with their local knowledge of the study area to decide which version of the DEM (or a combination of both) is the most appropriate for a given study. We produced 2 and 20 m DEMs from the native point clouds generated by ASP. The 20 m DEM is a smoother version that can be useful for testing some methodologies on smaller files and for generating more complete ortho-images, as it contains fewer data gaps.
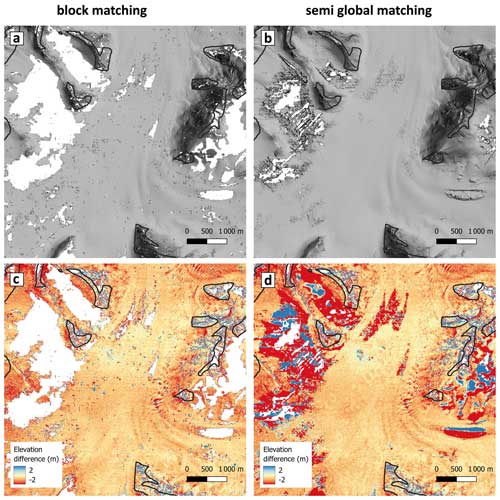
Figure 2Comparison of the Pléiades 2 m DEMs derived using the block-matching (a, c) and semi-global matching (b, d) algorithms of the Ames Stereo Pipeline (ASP) for the upper accumulation area of Fedchenko Glacier (Pamir, central Asia). Panels (a) and (b) show shaded relief images of the 1 August 2019 DEMs. Panels (c) and (d) show the elevation differences between the 1 August 2019 and the 22 September 2019 Pléiades DEMs. Note that the locations where data gaps are present in the block-matching DEMs (white areas in panels (a) and (c)) correspond to unrealistically high/low values in the semi-global matching elevation difference map (d). These gaps result mostly from saturation in the images.
In our workflow, 0.5 m panchromatic and 2 m multispectral ortho-images are generated using the 20 m DEM. Pansharpened images (i.e., multispectral images at 0.5 m resolution) are not calculated and archived due to file storage limitations. These pansharpened images, however, could easily be generated by the user with freely available tools such as pansharp in ASP or otbcli_Pansharpening in the Orfeo ToolBox (https://www.orfeo-toolbox.org/, last access: 6 November 2024).
The official absolute geolocation accuracy is 8.5 m (CE90, circular error at a confidence level of 90 %) for Pléiades 1A and 4.5 m for Pléiades 1B (Lebègue et al., 2015) without ground control points (GCPs). Furthermore, Pléiades DEMs derived without GCPs can be biased in height by as much as 10 to 20 m. To avoid such horizontal and vertical shifts and to ensure an improved consistency of the PGO database, all DEMs were coregistered to the Copernicus GLO-30 DEM (GLO-30) using a publicly available implementation of the Nuth and Kääb (2011) algorithm (Shean et al., 2023). GLO-30, an edited version of the TanDEM-X DEM, has a 30 m ground sampling distance and was chosen as a reference DEM because it is currently the best global void-free DEM publicly available (Franks and Rengarajan, 2023). According to ESA and AIRBUS (2022), its absolute vertical accuracy is better than 4 m (90 % linear error) and its absolute horizontal accuracy is better than 6 m (90 % circular error). Given the time lag between the radar images used to produce the TanDEM-X DEM (2011 to 2015; Rizzoli et al., 2017) and the PGO acquisitions, coregistration was performed on stable terrain, masking out glaciers as inventoried in the RGI v6.0 (RGI Consortium, 2017). For a few test sites, we found that the 3D translation vector were almost unchanged when using the 20 m instead of the 2 m DEM. Hence, the 3D translation vectors were computed using the 20 m DEMs only (a ground sampling distance closer to the one of GLO-30) and the shifts were applied to all PGO products (2 and 20 m DEMs and all ortho-images). Coregistration to GLO-30 was performed separately for BM and SGM DEMs.
Figure 3 shows one of the PGO products (DEM and ortho-images) and the elevation difference to GLO-30 before and after coregistration for a portion of the Purogangri ice cap over the Tibetan Plateau. An example of the product metadata report that accompanies each PGO product is available in Appendix A1.
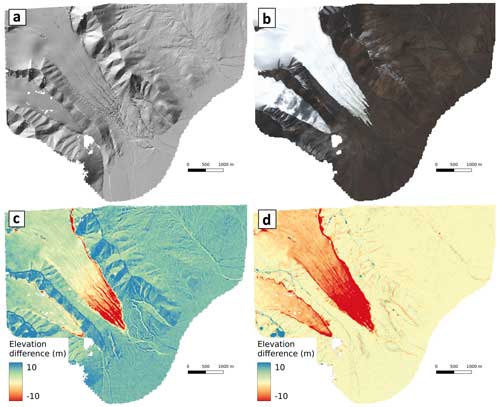
Figure 3A sample PGO product for the Purogangri ice cap over the Tibetan Plateau (PGO ID: 2018-10-03_0458515_Purogangri_ASC). (a) Shaded relief image of the block-matching DEM, (b) multispectral 2 m ortho-image (© CNES 2018, Distribution Airbus DS), and (c) elevation difference in the Pléiades DEMs with the Copernicus 30 DEM prior (c) and after (d) coregistration. For this specific case, the shift vectors of the PGO DEMs to GLO-30 were m, dNorth=4.8 m, and m. Coregistration reduced the normalized median absolute deviation (NMAD) off glacier from 0.81 to 0.48 m.
2.3.2 Maps of elevation changes
Once Pléiades acquisitions are repeated over a site, we generate DEMs from the most recent Pléiades imagery and compare these to the older DEMs to map 5 (sometimes 6 or more) years of glacier elevation change (Fig. 4). This is achieved in two steps: firstly, the most recent Pléiades DEM is coregistered to the older one (derived at the same ground sampling distance and using the same correlator) on the stable terrain, as described above. Next, remaining spatially coherent elevation biases are corrected by fitting first a fifth-order polynomial in the across-track direction (Gardelle et al., 2013) and then a spline fit along track (Falaschi et al., 2023a; xDEM contributors, 2023). The latter is needed to correct low-frequency undulating biases due to the unmodeled attitude error (“jitter”) of the Pléiades satellite platform at a frequency of about 1 Hz (Deschamps-Berger et al., 2020). These along-track biases are not systematic and have a typical amplitude of 1–2 m and a wavelength of about 4 km. We note that the order of these corrections (first across-track then along-track) was taken from Gardelle et al. (2013) but was not studied further and could be the topic of future analysis. We also emphasize that the quality of these bias corrections depends on the availability of sufficient and well-distributed stable terrain. We therefore strongly encourage users to check the relevance of these automatic corrections using the plots associated with each elevation difference map and, if necessary, generate themselves the elevation change map using the PGO DEMs.
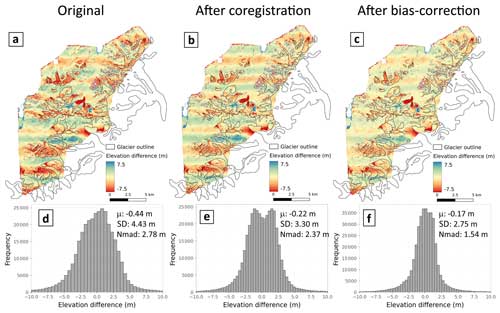
Figure 4PGO elevation difference map before and after two corrections on the Tuyuksu (central Asia) site in Kazakhstan. The upper panels (a–c) show the elevation difference maps from August 2016 to August 2021, and the lower panels (d–f) show the distribution of the elevation differences off glaciers. Maps and histograms are shown before coregistration (a, d), after coregistration (b, e), and after bias correction (c, f). (PGO ID: 2016-08-27_0545099_Tuyuksu_ASC and 2021-08-21_0546043_Tuyuksu_ASC, both derived from Pléiades 1B images).
The jitter is especially strong for Pléiades 1B since the year 2021 due to an issue with the satellite platform. These across-track and along-track corrections are only efficient if there is a sufficient amount of well-distributed stable terrain around the glaciers. In the case of the Tuyuksu site (Fig. 4), successive corrections allow one to reduce the dispersion of the residuals by almost a factor of 2; e.g., the normalized median absolute deviation (NMAD) is lowered from 2.8 to 1.5 m. The along-track undulations are not entirely removed (Fig. 4c), however. Thus, we invite the users to check statistics and perform visual inspection of the difference maps on stable terrain to assess the quality of the corrections (see also Fig. A3 in Berthier et al., 2023).
Two or three (and sometimes more) stereo pairs are often needed to entirely cover a single PGO site in a campaign year. After 5 years, we thus generate the elevation change maps for all possible pairs of overlapping DEMs, at 2 and 20 m ground sampling distance and for the two algorithms (SGM and BM; Fig. 2). Hence, numerous elevation change maps are computed, and we leave it to the users to decide which combination works best for their needs. Basic statistics are provided for each elevation change map (e.g., standard deviation and NMAD off glacier, as in Fig. 4) to guide the users in their choice.
3.1 Evaluation of the DEMs
3.1.1 Quality of the coregistration to GLO-30
We assess the quality of the coregistration of 259 PGO DEMs to GLO-30 (Fig. 5) off glacier. The spread of the residuals is similar in both easting and northing directions, with standard deviations of 5 to 6 m, and the standard deviation is slightly larger than 7 m in the vertical direction. The median shift is almost 0 m in easting direction, whereas the PGO DEMs are slightly shifted (4.5 m) toward the north compared to GLO-30. This northward shift is larger for DEMs derived from Pléiades 1A images (5.8 m) than from Pléiades 1B images (3.2 m) and is especially strong at high (north and south) latitudes, reaching up to 20 m at 80° N in Svalbard. We have no explanation for this small systematic northward shift, which is under investigation at the French Space Agency (CNES). PGO DEMs are, on average, 2.4 m lower than GLO-30. This vertical shift could be due to winter snow affecting the GLO-30 (derived from individual Tandem-X DEMs acquired year-round) but not affecting the PGO DEMs, acquired only in summer. This vertical offset is larger for DEMs derived from Pléiades 1B images (3.9 m) than from Pléiades 1A images (1.1 m) We note that these horizontal and vertical shift values (mean/standard deviation) do not represent the absolute geolocation performance of the Pléiades DEMs, as they are also influenced by any misregistration of GLO-30 itself.

Figure 5Distributions of the shifts in the easting (a), northing (b), and vertical (c) directions between 259 PGO DEMs acquired between 2016 and 2021 (first 10 campaigns) and GLO-30 off glacier. “μ” stands for the mean, and “SD” stands for the standard deviation. The figure shows translation components for the block-matching DEMs, as the mean and standard deviation for the semi-global matching DEMs were nearly identical.
Coregistration to GLO-30 failed or led to unreliable horizontal shifts (>30 m) for about 10 % of the sites. Examples of problematic sites include Livingstone Island (Subantarctic and Antarctic Islands), where GLO-30 displays large artifacts, possibly due to errors during the unwrapping of the TanDEM-X interferograms. Hence, for seven DEMs out of nine on this island, we applied no coregistration. Coregistration also failed in a few cases where very limited stable terrain was available (e.g., on the Balleny Islands around Antarctica). When coregistration failed or was judged unreliable, the Pléiades DEMs were left unchanged (i.e., not shifted) and the unsuccessful coregistration was identified on the metadata sheet accompanying each PGO product.
3.1.2 Comparison of close-in-time PGO DEMs in their overlapping areas
As several Pléiades DEMs are sometimes needed to cover a PGO site, they include overlapping areas where the DEMs acquired a few days/weeks apart can be compared. These overlapping areas provide an opportunity to assess the performance of the coregistration, the so-called “triangulation” in Nuth and Kääb (2011). Indeed, after coregistration to GLO-30, we expect two overlapping Pléiades DEMs to be well coregistered, and residual shifts between the DEMs can be interpreted as residual coregistration errors (Fig. 6).
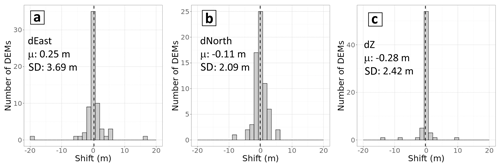
Figure 6Distributions of the shifts in the easting (a), northing (b), and vertical (c) directions between PGO DEMs over their overlapping portions (n=64). We only show the results for the 2 m block-matching DEMs. Results are similar for the semi-global matching DEMs and at both resolutions (2 and 20 m).
The mean residuals are very close to 0 m in all directions, and the standard deviations range from 2 to 4 m. This reflects the quality of the PGO DEM coregistration with the reference GLO-30 product. We note that a few PGO DEMs show relative coregistration errors of over 10 m. They correspond to sites in areas of high relief (e.g., Fedchenko Glacier in Tadjikistan or Makalu in Nepal) where GLO-30 is subjected to large errors.
3.1.3 Evaluation of the PGO DEMs using near-contemporaneous lidar data
In Norway and western Canada, three independent airborne lidar campaigns acquired data within less than 1 d of a Pléiades stereo acquisition (Table 2). This ideal situation allows us to evaluate the performance of the PGO DEMs because of negligible elevation change on all surfaces (glacier, snow, permafrost). The simultaneity of the surveys allows comparison of the uncertainties in the PGO DEMs on and off glacier, an important aspect, as, in general, one has to assume that the off-glacier terrain is representative of the glacier terrain (Hugonnet et al., 2022). Uncertainties based on repeated lidar acquisitions over stable terrain typically yield errors (∼0.1 m) that are almost 1 order of magnitude smaller than those of the PGO DEMs. Hence, the elevation difference mainly reflects the uncertainties of the PGO DEMs, although ALS errors can be higher that 0.1 m in steep terrain. Details about the western Canada lidar surveys can be found in Pelto et al. (2019), and details on the Norway surveys can be found in TerraTec AS (2018, 2019a, b) and in Andreassen et al. (2023).
Table 2Characteristics of the lidar surveys used to evaluate the PGO DEMs.

∗ Langfjordjøkelen was surveyed by the PGO 1 year earlier, 8 September 2017. This 2018 Pléiades stereo pair was not acquired as part of the PGO; this is why we only provide the ID of the Pléiades stereo pair in the Geostore Airbus D&S catalogue. The processing used for this non-PGO DEM was identical to that of PGO DEMs.
The lidar point clouds were interpolated into 1 m gridded DEMs using ASP's routine point2dem. For the comparison, we coregistered each PGO DEM (i.e., BM and SGM) with each synchronous lidar. The DEM coregistration was done using the RGI v6.0 (RGI Consortium, 2017) glacier inventory as a mask to define the stable terrain because this is the only inventory available for coregistration on all PGO sites. Observed elevation differences (Fig. 7) are in general near 0, but there are also some artifacts and differences between BM vs. SGM products.
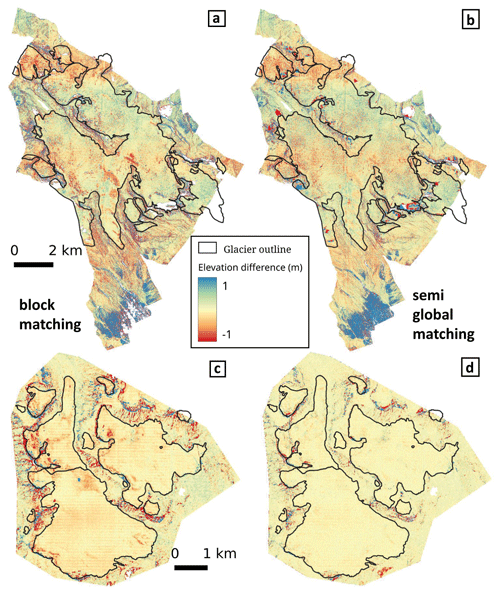
Figure 7Map of elevation differences between PGO and lidar DEMs acquired the same day over Peyto Glacier (13 September 2016, Canada, panels (a) and (b)) and 1 d apart over Hellstugubreen (26 and 27 August 2019, Norway, panels (c) and (d)). The left column (a, c) shows the two block-matching DEMs, and the right column (b, d) shows the semi-global matching DEMs. We do not show the map of elevation difference for other glaciers in Norway (Langfjordjøkelen, Gråsubreen) because the patterns are highly similar.
Furthermore, we calculated different statistics to characterize DEM uncertainties, based on the maps of elevation difference between Pléiades and lidar (Fig. 7): NMAD off glacier and on glacier; median off glacier and on glacier (Table 3). For these statistics, on- and off-glacier terrain was classified using high-resolution glacier outlines manually digitized on the Pléiades ortho-images and a hillshade representation of the lidar DEMs. This improved glacier inventory was needed, as RGI outlines were outdated and we wanted to have the best possible separation between glacier and stable terrain.
Table 3Statistics on the elevation differences (m) between the PGO 2 m DEMs and the lidar DEMs acquired the same day. BM: block-matching. SGM: semi-global matching. “Hellstugubreen” stands for “Hellstugubreen, Gråsubreen, Vestre Memurubreen, and Austre Memurubreen”.

As a result of the coregistration process, the median elevation differences off glaciers are very close to 0 m. Over glacierized terrain, biases are also modest. Almost null for Peyto Glacier, they are slightly negative for the Norwegian sites but always within 0.2 m. Conversely, the dispersion of the residuals is slightly larger for the Canadian site, with an NMAD of about 0.4 m (a result of uncorrected jitter), while it ranges between 0.12 and 0.21 m for the glaciers in Norway. We note that the NMAD is systematically larger off glaciers than on glaciers, which confirms that using the off-glacier terrain to infer the uncertainty on glaciers is a conservative approach. Interestingly, the choice of the correlation algorithm (BM or SGM) has a different influence on and off glaciers. SGM results in lower NMAD off glaciers, whereas using BM leads to reduced NMAD on glaciers.
The median elevation difference and its spread (quantified using the NMAD) are rather constant with elevation (Fig. 8; only shown for the Peyto site, Canada). Off glacier, the positive elevation differences at low elevations are explained by the presence of vegetation (see also the southernmost portion of the map in Fig. 7a and b). The Pléiades summer DEMs map the height of the canopy (Piermattei et al., 2019), while the lidar maps the bare ground below the vegetation. The bias and the NMAD are constant up to slopes of 50°. Above, the dispersion of the elevation difference increases rapidly (on and off glacier) and the median difference departs from 0. These results indicate that a good practice is to exclude areas of high relief (e.g., slopes larger than 50°) during coregistration and when computing the glacier-wide mean elevation changes.
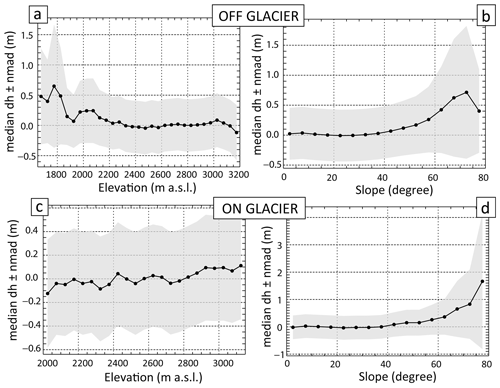
Figure 8Median elevation differences (dh) between the Pléiades semi-global matching 2 m DEMs and the lidar DEMs for the Peyto Glacier site (Canada). Points show the median, and the shaded area shows the NMAD of dh values (PGO DEM minus lidar DEM) within each 50 m elevation bin (a, c) and each 5° slope bin (b, d) off glaciers (a, b) and on glaciers (c, d).
Overall, these evaluations using lidar data suggest that glacier elevation changes can be measured from Pléiades DEMs with a sub-meter accuracy, with a minor influence of the processing algorithm. We note that these evaluations are performed on relatively small glaciers with abundant nearby stable terrain, which is required for the coregistration and the bias corrections. Therefore, these results may not be readily transferable to larger glaciers.
3.2 Uncertainty of the PGO glacier elevation changes
Uncertainties in the elevation difference from repeat Pléiades DEMs have previously been quantified with differential GNSS measurements with centimeter accuracy. In the Mont Blanc massif, such measurements are repeated each year in early September along four transverse profiles on the Mer de Glace and Argentière glaciers. For the 2021–2022 mass balance year, the mean bias of the elevation difference was lower than 0.3 m, and its standard deviation was lower than 0.4 m (Berthier et al., 2023). Similar values were found for elevation difference of Mera Glacier in Nepal from 2012 to 2018, with a mean bias of −0.24 m and a standard deviation of 0.52 m (Wagnon et al., 2021).
Here, we quantified the uncertainty of the elevation changes systematically, taking advantage of the depth of the PGO archive. We used the elevation difference off glacier (as mapped in RGI v6.0) as a proxy of the uncertainty on glaciers, with the assumption that the elevation difference should be 0 over “stable” terrain and that any observed residual is regarded as an error. This is a conservative choice, as the errors of the DEMs tend to increase with slope (Toutin, 2002; Lacroix, 2016; Hugonnet et al., 2022) and the average slopes are often gentler on glaciers than on nearby ice-free terrain (see also Sect. 3.1.3). This is also conservative because, during the 5-year time span separating the PGO DEMs, the off-glacier terrain has evolved due to, for example, vegetation changes and the destabilization of recently deglaciated slopes. We calculated uncertainties (at the 95 % confidence level) on the mean elevation change over a given area (ranging from 0.01 to 10 km2) using the patch method (Miles et al., 2018; Dussaillant et al., 2018). For a given patch size, we extract the 95th percentile of the absolute mean elevation difference. We analyzed 58 PGO elevation difference maps for which the off-glacier terrain covered at least 50 km2 (Fig. 9).

Figure 9(a) Uncertainties (dh) at the 95 % confidence level (2σ) for 58 PGO maps of elevation changes as a function of the averaging area. The dashed lines correspond to individual maps of elevation changes obtained from the 2 m BM DEMs and for which the stable terrain occupies more than 50 km2. The thick black line corresponds to the mean of all these individual lines, and its equation is provided. (b) Example of the uncertainty (at the 95 % confidence interval) as a function of the patch size for one of the PGO repeat surveys on Langfjordjøkelen in Norway. (c) Distribution of the uncertainties for the 58 elevation difference maps and a patch size of 1 km2.
We observe a relatively large spread of the uncertainties on the elevation differences despite the fact that they are all derived from repeat Pléiades DEMs. For example, the 2σ uncertainties for a 1 km2 patch size range from 0.15 up to 1.5 m. The largest uncertainties (between 1.2 and 1.5 m, n=6) correspond to maps of elevation difference affected by a larger jitter in the Pléiades DEMs and only partly corrected by our along-track spline correction. This is, for example, the case for the Tuyuksu (central Asia) 2016–2021 elevation difference maps shown in Fig. 4. Excluding these anomalous six maps, the remaining uncertainties (95 % confidence level) are on average 0.38 m for a 1 km2 patch size with a limited spread (n=52, min=0.15 m, max=0.83 m, standard deviation=0.15 m). The variance in the mean slope off glacier only explains a small fraction (13 %) of the variance in these uncertainties. These mean uncertainties are in agreement with the one derived from same-day lidar surveys (Sect. 3.1.3).
ASTER VNIR, on board the TERRA platform, is the only sensor in orbit providing publicly available global coverage using optical stereoscopic images. Recently, it was used to generate maps of elevation changes and hence to calculate glacier-wide mass balances for almost all the Earth's glaciers from 2000 to 2019 (Hugonnet et al., 2021). However, ASTER will stop acquiring images in 2026 (or 2027), and no satellite mission is scheduled to provide publicly available global coverage with stereo images. Very high-resolution sensors like Pléiades are not fully dedicated to science applications and currently do not have the capability to replace ASTER. It is useful, however, to assess whether the 140 glacier sites surveyed by the PGO provide a reasonable assessment of global glacier mass change.
To determine the representativeness of the PGO sampling, we extracted from the Hugonnet et al. (2021) database the glacier-wide mass balance of glaciers intersecting the PGO sites (named “PGO glaciers” hereafter). For glaciers only partly covered in a PGO site, we retained those with at least 50 % coverage. There are about 6800 PGO glaciers, and, in area, they cover 2.5 % of the world's glaciers (Table 4). By region, the coverage is highly heterogeneous and varies from 0 % in the Russian Arctic to almost 47 % in New Zealand. We clarify here that, in this entire analysis, none of the mass balances were derived from PGO elevation change maps. All mass balances are from the Hugonnet et al. (2021) database.
Table 4Fraction of the Earth's glaciers sampled by the PGO. The number and area of glaciers refer to the RGI v6.0 inventory except in region 12 (Caucasus and Middle East), where the Global Land Ice Measurements from Space (GLIMS) outlines are used, as in Hugonnet et al. (2021).
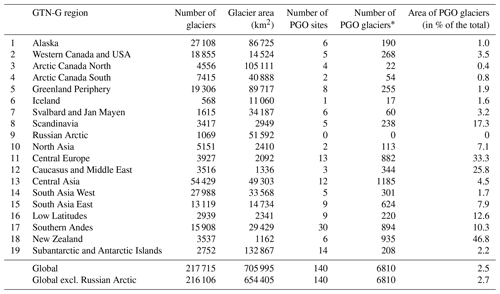
∗ We only count glaciers for which at least 50 % of the area is covered, which explains why the area of PGO glaciers (2.5 % of the global area) is smaller than the total area in Table 1 (3 % of the global area).
For each GTN-G first-order glacier region, we then computed the region-wide mass balances as the area-weighted sum of the PGO glacier-wide mass balances and compared these regionally aggregated values with corresponding values using the full sample from Hugonnet et al. (2021). Three periods were considered, 2000–2019, i.e., the full period for which the uncertainties are the smallest in the Hugonnet et al. (2021) database, and also two sub-periods, 2000–2009 and 2010–2019, to test the ability of PGO glaciers to capture the change in mass balance from one decade to another (Fig. 10).
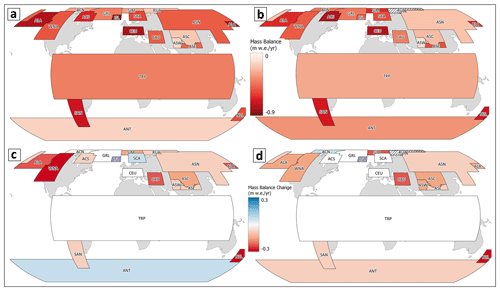
Figure 10Comparison of the 2000–2019 region-wide mass balance calculated using the entire Hugonnet et al. (2021) dataset (a) and using only the glaciers sampled by the PGO (b). The lower panels show the changes in region-wide mass balance between 2000–2009 and 2010–2019 for (c) all glaciers and for (d) the subset of glaciers sampled by the PGO. All mass balances are from the Hugonnet et al. (2021) database (i.e., none were derived from PGO elevation change maps).
At global scale, excluding the unsampled Russian Arctic, the global mass balance during 2000–2019 was −0.39 ± 0.02 (Hugonnet et al., 2021). Using only the values for PGO glaciers (Table 5), the global mass balance is more negative (−0.46 ). PGO glaciers capture rather well the acceleration in the mass loss that occurred from 2000–2009 to 2010–2019. The full sample indicates a drop in the mass balance of 0.05 between the two periods, and PGO glaciers see an almost identical drop of 0.07 .
Table 5Regional and global mass balance (in ) from the entire RGI sample (Hugonnet et al., 2021) and from the PGO glaciers (this study). MB stands for mass balance. Delta_MB corresponds to the change in region-wide mass balance from 2000–2009 to 2010–2019. All mass balances are from the Hugonnet et al. (2021) database (i.e., none were derived from PGO elevation change maps).
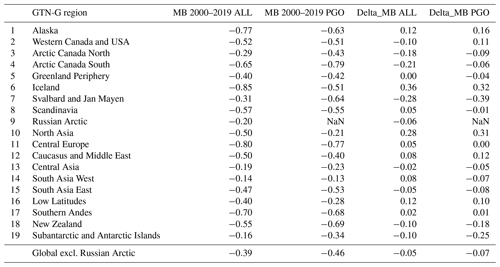
At the scale of the 18 individual GTN-G first-order regions (Fig. 10, Table 5; Russian Arctic excluded), the mass balance differences between the full sample and PGO glaciers are larger. When the 20-year period is considered, the differences in region-wide mass balance can be as large as 0.34 (region: Iceland) with a standard deviation of 0.16 (n=18). Again, PGO glaciers perform better at capturing the change in mass balance between the two 10-year periods: the maximum difference is 0.21 (region: Western Canada and USA), and the minimum difference is −0.15 (regions: South Asia West and Subantarctic and Antarctic Islands), the standard deviation being 0.09 . For 10 out of 18 RGI regions, the change in region-wide mass balance is observed by PGO glaciers with an error of less than 0.05 .
Hence, even if the PGO sites were not chosen to represent the world's glaciers, they still provide a reasonable estimate of their mass balance, and this sample is able to capture their temporal changes. However, one strong complication of using these glaciers for a global mass change analysis would be related to the fact that the Pléiades acquisitions on the 140 PGO glacier sites are not performed simultaneously but use a moving temporal window (Table 1).
It should be noted that there are uncertainties in the Hugonnet et al. (2021) data and that they are not necessarily representative for smaller samples of glaciers or shorter periods (e.g., Andreassen et al., 2023; Berthier et al., 2023). At local scale and for periods of a few months or years, repeated lidar or other high-resolution DEMs (e.g., PGO) give more accurate results.
The Pléiades Glacier Observatory is an initiative by the French Space Agency (CNES) and LEGOS to facilitate access to very high-resolution digital elevation models, elevation change maps, and, after signing a license, ortho-images of glaciers. Such data are useful to calculate glacier geodetic mass balances but also to support other glaciology-oriented applications, such as updating glacier outlines, extracting glacier hypsometry, or qualitatively documenting glacier changes. The PGO aims at managing the Pléiades acquisitions and distributing products that are tailored for glaciological applications in as user friendly a way as possible. The acquisitions started in 2016 and, during the first 5 years, acquired stereo pairs over 140 target sites around the globe, selected through a call to the glaciological community. Since 2021, these acquisitions have been progressively repeated to produce maps of elevation change over 5 years. At the time of writing, 31 publications have already used PGO data to examine glacier changes.
We quantified the uncertainties of the DEMs (after coregistration to the Copernicus GLO-30 DEM) and elevation change maps derived from repeat Pléiades DEMs. This was done with two methods: (1) comparison to near-contemporaneous accurate lidar surveys and (2) using residual elevation difference values on nearby stable terrain to estimate corresponding uncertainty on glacier surfaces. Both methods agree broadly on the uncertainties, and, as a rule of thumb, the mean glacier-wide elevation differences have a 2σ uncertainty of about 0.5 m for a glacier of 1 km2 or larger.
Pléiades satellites are planned to orbit until 2026. Access to data from their successors (Pléiades Neo) is not yet secured for the scientific community, and the cost may be prohibitive. It should be a priority for the space agencies to continue to provide high-resolution stereo imagery to scientists to observe the imprint of climate change on the Earth's surface and in particular on glaciers.
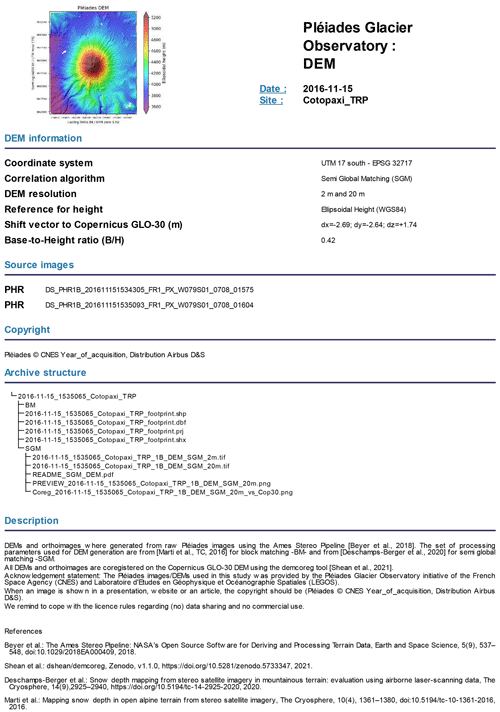
Figure A1Example of the fact sheet accompanying each PGO product, here the semi-global matching (SGM) DEMs over the Cotopaxi area acquired 15 November 2016.
Table A1The 140 sites of the Pléiades Glacier Observatory. The list is ordered chronologically by campaign (HN for Northern Hemisphere; HS for Southern Hemisphere). The name of each site is followed by the three letters of the GTN-G first-order region it belongs to. The table also lists the latitude and longitude of each site, the number of TDI stages that were used during the image acquisitions, and the number of stereo pairs needed to cover the entire site.

Pléiades Glacier Observatory DEMs and elevation change products are under CC-BY-NC license and freely available at https://doi.org/10.25577/313a-a978 (LEGOS & OMP, 2024).
Licensing issues prevent open distribution of primary Pléiades products and ortho-images. These images are available after signing the Pléiades institutional scientific license to be requested from the French Space Agency (CNES) (dinamis@cnes.fr).
The scripts used to generate the DEMs and ortho-images and to coregister them with GLO-30 are available at https://doi.org/10.5281/zenodo.12909586 (Berthier and Lebreton, 2024).
EB designed the PGO program with contributions from DF and SH. JL and EB generated the DEMs and elevation change maps. JMCB, LMA, and BM provided Lidar data and all related analysis. CB worked on the regional representativity of the PGO sites. All authors contributed to the discussion of the results. EB prepared the article with contributions from all co-authors.
At least one of the (co-)authors is a member of the editorial board of The Cryosphere. The peer-review process was guided by an independent editor, and the authors also have no other competing interests to declare.
Publisher's note: Copernicus Publications remains neutral with regard to jurisdictional claims made in the text, published maps, institutional affiliations, or any other geographical representation in this paper. While Copernicus Publications makes every effort to include appropriate place names, the final responsibility lies with the authors.
We thank David Shean, the other anonymous reviewers, and Kang Yang (scientific editor) for their constructive comments. We thank Anne Guyez (LEGOS) for providing revised values for Table 1. This is also a contribution to the International Association of Cryospheric Sciences (IACS) working group on Regional Assessments of Glacier Mass Change (RAGMAC).
Etienne Berthier and Jérôme Lebreton received support from the French Space Agency (CNES). Brian Menounos received funding from the Natural Sciences and Engineering Research Council of Canada and the Tula Foundation. Liss M. Andreassen received funding from the internal NVE project “N80524 Regionalt massebalanseestimat av norske breer”.
This paper was edited by Kang Yang and reviewed by David Shean and one anonymous referee.
Andreassen, L. M., Elvehøy, H., Kjøllmoen, B., and Engeset, R. V.: Reanalysis of long-term series of glaciological and geodetic mass balance for 10 Norwegian glaciers, The Cryosphere, 10, 535–552, https://doi.org/10.5194/tc-10-535-2016, 2016.
Andreassen, L. M., Nagy, T., Kjøllmoen, B., and Leigh, J. R.: An inventory of Norway's glaciers and ice-marginal lakes from 2018–19 Sentinel-2 data, J. Glaciol., 68, 1085–1106, https://doi.org/10.1017/jog.2022.20, 2022.
Andreassen, L. M., Robson, B. A., Sjursen, K. H., Elvehøy, H., Kjøllmoen, B., and Carrivick, J. L.: Spatio-temporal variability in geometry and geodetic mass balance of Jostedalsbreen ice cap, Norway, Ann. Glaciol., 64, 26–43, https://doi.org/10.1017/aog.2023.70, 2023.
Belart, J. M. C., Berthier, E., Magnússon, E., Anderson, L. S., Pálsson, F., Thorsteinsson, T., Howat, I. M., Aðalgeirsdóttir, G., Jóhannesson, T., and Jarosch, A. H.: Winter mass balance of Drangajökull ice cap (NW Iceland) derived from satellite sub-meter stereo images, The Cryosphere, 11, 1501–1517, https://doi.org/10.5194/tc-11-1501-2017, 2017.
Beraud, L., Cusicanqui, D., Rabatel, A., Brun, F., Vincent, C., and Six, D.: Glacier-wide seasonal and annual geodetic mass balances from Pléiades stereo images: application to the Glacier d'Argentière, French Alps, J. Glaciol., 69, 525–537, https://doi.org/10.1017/jog.2022.79, 2023.
Berthier, E. and Lebreton, J.: Pléiades Glacier Observatory – production of DEMs and orthoimages, Zenodo [code], https://doi.org/10.5281/zenodo.12909586, 2024.
Berthier, E., Vincent, C., Magnússon, E., Gunnlaugsson, Á. Þ., Pitte, P., Le Meur, E., Masiokas, M., Ruiz, L., Pálsson, F., Belart, J. M. C., and Wagnon, P.: Glacier topography and elevation changes derived from Pléiades sub-meter stereo images, The Cryosphere, 8, 2275–2291, https://doi.org/10.5194/tc-8-2275-2014, 2014.
Berthier, E., Floriciou, D., Gardner, A. S., Gourmelen, N., Jakob, L., Paul, F., Treichler, D., Wouters, B., Belart, J. M. C., Dehecq, A., Dussaillant, I., Hugonnet, R., Kääb, A., Krieger, L., Pálsson, F., and Zemp, M.: Measuring glacier mass changes from space – a review, Rep. Prog. Phys., 86, 036801, https://doi.org/10.1088/1361-6633/acaf8e, 2023.
Berthier, E., Vincent, C., and Six, D.: Exceptional thinning through the entire altitudinal range of Mont-Blanc glaciers during the 2021/22 mass balance year, J. Glaciol., https://doi.org/10.1017/jog.2023.100, online first, 2023.
Beyer, R. A., Alexandrov, O., and McMichael, S.: The Ames Stereo Pipeline: NASA’s Open Source Software for Deriving and Processing Terrain Data, Earth Space Sci., 5, 537–548, https://doi.org/10.1029/2018EA000409, 2018.
Bhattacharya, A., Bolch, T., Mukherjee, K., King, O., Menounos, B., Kapitsa, V., Neckel, N., Yang, W., and Yao, T.: High Mountain Asian glacier response to climate revealed by multi-temporal satellite observations since the 1960s, Nat. Commun., 12, 4133, https://doi.org/10.1038/s41467-021-24180-y, 2021.
Bhushan, S., Shean, D., Alexandrov, O., and Henderson, S.: Automated digital elevation model (DEM) generation from very-high-resolution Planet SkySat triplet stereo and video imagery, ISPRS J. Photogramm., 173, 151–165, https://doi.org/10.1016/j.isprsjprs.2020.12.012, 2021.
Błaszczyk, M., Ignatiuk, D., Grabiec, M., Kolondra, L., Laska, M., Decaux, L., Jania, J., Berthier, E., Luks, B., Barzycka, B., and Czapla, M.: Quality Assessment and Glaciological Applications of Digital Elevation Models Derived from Space-Borne and Aerial Images over Two Tidewater Glaciers of Southern Spitsbergen, Remote Sens.-Basel, 11, 1121, https://doi.org/10.3390/rs11091121, 2019.
Brun, F., Buri, P., Miles, E. S., Wagnon, P., Steiner, J., Berthier, E., Ragettli, S., Kraaijenbrink, P., Immerzeel, W. W., and Pellicciotti, F.: Quantifying volume loss from ice cliffs on debris-covered glaciers using high resolution terrestrial and aerial photogrammetry, J. Glaciol., 62, 684–695, https://doi.org/10.1017/jog.2016.54, 2016.
Brun, F., Berthier, E., Wagnon, P., Kääb, A., and Treichler, D.: A spatially resolved estimate of High Mountain Asia glacier mass balances from 2000 to 2016, Nat. Geosci., 10, 668–673, https://doi.org/10.1038/ngeo2999, 2017.
Deschamps-Berger, C., Gascoin, S., Berthier, E., Deems, J., Gutmann, E., Dehecq, A., Shean, D., and Dumont, M.: Snow depth mapping from stereo satellite imagery in mountainous terrain: evaluation using airborne laser-scanning data, The Cryosphere, 14, 2925–2940, https://doi.org/10.5194/tc-14-2925-2020, 2020.
Dussaillant, I., Berthier, E., and Brun, F.: Geodetic Mass Balance of the Northern Patagonian Icefield from 2000 to 2012 Using Two Independent Methods, Front. Earth Sci., 6, 8, https://doi.org/10.3389/feart.2018.00008, 2018.
ESA and Airbus: Copernicus DEM – Global and European Digital Elevation Model (COP-DEM), ESA, Copernicus [data set], https://doi.org/10.5270/ESA-c5d3d65, 2022.
Falaschi, D., Berthier, E., Belart, J. M. C., Bravo, C., Castro, M., Durand, M., and Villalba, R.: Increased mass loss of glaciers in Volcán Domuyo (Argentinian Andes) between 1962 and 2020, revealed by aerial photos and satellite stereo imagery, J. Glaciol., 69, 40–56, https://doi.org/10.1017/jog.2022.43, 2023a.
Falaschi, D., Bhattacharya, A., Guillet, G., Huang, L., King, O., Mukherjee, K., Rastner, P., Yao, T., and Bolch, T.: Annual to seasonal glacier mass balance in High Mountain Asia derived from Pléiades stereo images: examples from the Pamir and the Tibetan Plateau, The Cryosphere, 17, 5435–5458, https://doi.org/10.5194/tc-17-5435-2023, 2023b.
Franks, S. and Rengarajan, R.: Evaluation of Copernicus DEM and Comparison to the DEM Used for Landsat Collection-2 Processing, Remote Sens., 15, 2509, https://doi.org/10.3390/rs15102509, 2023.
Gardelle, J., Berthier, E., Arnaud, Y., and Kääb, A.: Region-wide glacier mass balances over the Pamir-Karakoram-Himalaya during 1999–2011, The Cryosphere, 7, 1263–1286, https://doi.org/10.5194/tc-7-1263-2013, 2013.
Gleyzes, M. A., Perret, L., and Kubik, P.: Pléiades system architecture and main performances, Int. Arch. Photogramm., 39, 537–542, 2012.
GTN-G: GTN-G Glacier Regions. Global Terrestrial Network for Glaciers, https://doi.org/10.5904/gtng-glacreg-2023-07, 2023.
Hirschmuller, H.: Stereo Processing by Semiglobal Matching and Mutual Information, IEEE T. Pattern Anal., 30, 328–341, 2008.
Holzer, N., Vijay, S., Yao, T., Xu, B., Buchroithner, M., and Bolch, T.: Four decades of glacier variations at Muztagh Ata (eastern Pamir): a multi-sensor study including Hexagon KH-9 and Pléiades data, The Cryosphere, 9, 2071–2088, https://doi.org/10.5194/tc-9-2071-2015, 2015.
Howat, I. M., Porter, C., Smith, B. E., Noh, M.-J., and Morin, P.: The Reference Elevation Model of Antarctica, The Cryosphere, 13, 665–674, https://doi.org/10.5194/tc-13-665-2019, 2019.
Hugonnet, R., McNabb, R., Berthier, E., Menounos, B., Nuth, C., Girod, L., Farinotti, D., Huss, M., Dussaillant, I., Brun, F., and Kääb, A.: Accelerated global glacier mass loss in the early twenty-first century, Nature, 592, 726–731, https://doi.org/10.1038/s41586-021-03436-z, 2021.
Hugonnet, R., Brun, F., Berthier, E., Dehecq, A., Mannerfelt, E. S., Eckert, N., and Farinotti, D.: Uncertainty analysis of digital elevation models by spatial inference from stable terrain, IEEE J. Sel. Top. Appl., 15, 6456–6472, https://doi.org/10.1109/JSTARS.2022.3188922, 2022.
Huss, M.: Density assumptions for converting geodetic glacier volume change to mass change, The Cryosphere, 7, 877–887, https://doi.org/10.5194/tc-7-877-2013, 2013.
Kääb, A., Jacquemart, M., Gilbert, A., Leinss, S., Girod, L., Huggel, C., Falaschi, D., Ugalde, F., Petrakov, D., Chernomorets, S., Dokukin, M., Paul, F., Gascoin, S., Berthier, E., and Kargel, J. S.: Sudden large-volume detachments of low-angle mountain glaciers – more frequent than thought?, The Cryosphere, 15, 1751–1785, https://doi.org/10.5194/tc-15-1751-2021, 2021.
Lacroix, P.: Landslides triggered by the Gorkha earthquake in the Langtang valley, volumes and initiation processes, Earth Planets Space, 68, 1–10, https://doi.org/10.1186/s40623-016-0423-3, 2016.
Lebègue, L., Greslou, D., Blanchet, G., Lussy, F., Fourest, S., Martin, V., Latry, C., Kubik, P., Delvit, J.-M., Dechoz, C., and Amberg, V.: Pléiades-HR satellites image quality commissioning, Rev. Fr. Photogrammétrie Télédétection, 209, 5–10, https://doi.org/10.52638/rfpt.2015.137, 2015.
LEGOS & OMP: Pléiades Glacier Observatory Data Products, EOST (Collection) [data set], https://doi.org/10.25577/313a-a978, 2024.
Loriaux, T. and Ruiz, L.: Spatio-Temporal Distribution of Supra-Glacial Ponds and Ice Cliffs on Verde Glacier, Chile, Front. Earth Sci., 9, 448, https://doi.org/10.3389/feart.2021.681071, 2021.
Małecki, J.: Recent contrasting behaviour of mountain glaciers across the European High Arctic revealed by ArcticDEM data, The Cryosphere, 16, 2067–2082, https://doi.org/10.5194/tc-16-2067-2022, 2022.
Marti, R., Gascoin, S., Berthier, E., de Pinel, M., Houet, T., and Laffly, D.: Mapping snow depth in open alpine terrain from stereo satellite imagery, The Cryosphere, 10, 1361–1380, https://doi.org/10.5194/tc-10-1361-2016, 2016.
Miles, E. S., Watson, C. S., Brun, F., Berthier, E., Esteves, M., Quincey, D. J., Miles, K. E., Hubbard, B., and Wagnon, P.: Glacial and geomorphic effects of a supraglacial lake drainage and outburst event, Everest region, Nepal Himalaya, The Cryosphere, 12, 3891–3905, https://doi.org/10.5194/tc-12-3891-2018, 2018.
Millan, R., Mouginot, J., Rabatel, A., and Morlighem, M.: Ice velocity and thickness of the world's glaciers, Nat. Geosci., 15, 124–129, https://doi.org/10.1038/s41561-021-00885-z, 2022.
Nuth, C. and Kääb, A.: Co-registration and bias corrections of satellite elevation data sets for quantifying glacier thickness change, The Cryosphere, 5, 271–290, https://doi.org/10.5194/tc-5-271-2011, 2011.
Paul, F., Frey, H., and Le Bris, R.: A new glacier inventory for the European Alps from Landsat TM scenes of 2003: Challenges and results, Ann. Glaciol., 52, 144–152, 2011.
Pelto, B. M., Menounos, B., and Marshall, S. J.: Multi-year evaluation of airborne geodetic surveys to estimate seasonal mass balance, Columbia and Rocky Mountains, Canada, The Cryosphere, 13, 1709–1727, https://doi.org/10.5194/tc-13-1709-2019, 2019.
Pelto, M. S.: Forecasting temperate alpine glacier survival from accumulation zone observations, The Cryosphere, 4, 67–75, https://doi.org/10.5194/tc-4-67-2010, 2010.
Pfeffer, W. T., Arendt, A. A., Bliss, A., Bolch, T., Cogley, J. G., Gardner, A. S., Hagen, J.-O., Hock, R., Kaser, G., Kienholz, C., Miles, E. S., Moholdt, G., Moelg, N., Paul, F., Radic, V., Rastner, P., Raup, B. H., Rich, J., Sharp, M. J., Andeassen, L. M., Bajracharya, S., Barrand, N. E., Beedle, M. J., Berthier, E., Bhambri, R., Brown, I., Burgess, D. O., Burgess, E. W., Cawkwell, F., Chinn, T., Copland, L., Cullen, N. J., Davies, B., De Angelis, H., Fountain, A. G., Frey, H., Giffen, B. A., Glasser, N. F., Gurney, S. D., Hagg, W., Hall, D. K., Haritashya, U. K., Hartmann, G., Herreid, S., Howat, I., Jiskoot, H., Khromova, T. E., Klein, A., Kohler, J., Konig, M., Kriegel, D., Kutuzov, S., Lavrentiev, I., Le Bris, R., Li, X., Manley, W. F., Mayer, C., Menounos, B., Mercer, A., Mool, P., Negrete, A., Nosenko, G., Nuth, C., Osmonov, A., Pettersson, R., Racoviteanu, A., Ranzi, R., Sarikaya, M. A., Schneider, C., Sigurdsson, O., Sirguey, P., Stokes, C. R., Wheate, R., Wolken, G. J., Wu, L. Z., and Wyatt, F. R.: The Randolph Glacier Inventory: a globally complete inventory of glaciers, J. Glaciol., 60, 537–552, https://doi.org/10.3189/2014JoG13J176, 2014.
Piermattei, L., Marty, M., Ginzler, C., Pöchtrager, M., Karel, W., Ressl, C., Pfeifer, N., and Hollaus, M.: Pléiades satellite images for deriving forest metrics in the Alpine region, Int. J. Appl. Earth Obs., 80, 240–256, https://doi.org/10.1016/j.jag.2019.04.008, 2019.
Pope, A., Rees, W. G., Fox, A. J., and Fleming, A.: Open Access Data in Polar and Cryospheric Remote Sensing, Remote Sens.-Basel, 6, 6183–6220, https://doi.org/10.3390/rs6076183, 2014.
Porter, C., Morin, P., Howat, I., Noh, M.-J., Bates, B., Peterman, K., Keesey, S., Schlenk, M., Gardiner, J., Tomko, K., Willis, M., Kelleher, C., Cloutier, M., Husby, E., Foga, S., Nakamura, H., Platson, M., Wethington Jr., M., Williamson, C., Bauer, G., Enos, J., Arnold, G., Kramer, W., Becker, P., Doshi, A., D'Souza, C., Cummens, P., Laurier, F., and Bojesen, M.: ArcticDEM, https://doi.org/10.7910/DVN/OHHUKH, 2018.
Rabatel, A., Letréguilly, A., Dedieu, J.-P., and Eckert, N.: Changes in glacier equilibrium-line altitude in the western Alps from 1984 to 2010: evaluation by remote sensing and modeling of the morpho-topographic and climate controls, The Cryosphere, 7, 1455–1471, https://doi.org/10.5194/tc-7-1455-2013, 2013.
RGI 7.0 Consortium: Randolph Glacier Inventory – A Dataset of Global Glacier Outlines, Version 7.0, 2023.
RGI Consortium: Randolph Glacier Inventory (RGI) – A Dataset of Global Glacier Outlines: Version 6.0. Technical Report, Global Land Ice Measurements from Space, Boulder, Colorado, USA, Digital Media, https://doi.org/10.7265/N5-RGI-60, 2017.
Rizzoli, P., Martone, M., Gonzalez, C., Wecklich, C., Borla Tridon, D., Bräutigam, B., Bachmann, M., Schulze, D., Fritz, T., Huber, M., Wessel, B., Krieger, G., Zink, M., and Moreira, A.: Generation and performance assessment of the global TanDEM-X digital elevation model, ISPRS J. Photogramm., 132, 119–139, https://doi.org/10.1016/j.isprsjprs.2017.08.008, 2017.
Rounce, D. R., Hock, R., Maussion, F., Hugonnet, R., Kochtitzky, W., Huss, M., Berthier, E., Brinkerhoff, D., Compagno, L., Copland, L., Farinotti, D., Menounos, B., and McNabb, R. W.: Global glacier change in the 21st century: Every increase in temperature matters, Science, 379, 78–83, https://doi.org/10.1126/science.abo1324, 2023.
Sato, Y., Fujita, K., Inoue, H., Sunako, S., Sakai, A., Tsushima, A., Podolskiy, E. A., Kayastha, R., and Kayastha, R. B.: Ice Cliff Dynamics of Debris-Covered Trakarding Glacier in the Rolwaling Region, Nepal Himalaya, Front. Earth Sci., 9, 623623, https://doi.org/10.3389/feart.2021.623623, 2021.
Shean, D. E., Alexandrov, O., Moratto, Z. M., Smith, B. E., Joughin, I. R., Porter, C., and Morin, P.: An automated, open-source pipeline for mass production of digital elevation models (DEMs) from very-high-resolution commercial stereo satellite imagery, ISPRS J. Photogramm., 116, 101–117, https://doi.org/10.1016/j.isprsjprs.2016.03.012, 2016.
Shean, D. E., Bhushan, S., Montesano, P., Rounce, D. R., Arendt, A., and Osmanoglu, B.: A Systematic, Regional Assessment of High Mountain Asia Glacier Mass Balance, Front. Earth Sci., 7, 363, https://doi.org/10.3389/feart.2019.00363, 2020.
Shean, D., Bhushan, S., Lilien, D., Knuth, F., Schwat, E., Meyer, J., Sharp, M., and Hu, M.: dshean/demcoreg: v1.1.1 Compatibility and doc improvements, https://doi.org/10.5281/zenodo.7730376, 2023.
Shugar, D. H., Jacquemart, M., Shean, D., Bhushan, S., Upadhyay, K., Sattar, A., Schwanghart, W., McBride, S., de Vries, M. V. W., Mergili, M., Emmer, A., Deschamps-Berger, C., McDonnell, M., Bhambri, R., Allen, S., Berthier, E., Carrivick, J. L., Clague, J. J., Dokukin, M., Dunning, S. A., Frey, H., Gascoin, S., Haritashya, U. K., Huggel, C., Kääb, A., Kargel, J. S., Kavanaugh, J. L., Lacroix, P., Petley, D., Rupper, S., Azam, M. F., Cook, S. J., Dimri, A. P., Eriksson, M., Farinotti, D., Fiddes, J., Gnyawali, K. R., Harrison, S., Jha, M., Koppes, M., Kumar, A., Leinss, S., Majeed, U., Mal, S., Muhuri, A., Noetzli, J., Paul, F., Rashid, I., Sain, K., Steiner, J., Ugalde, F., Watson, C. S., and Westoby, M. J.: A massive rock and ice avalanche caused the 2021 disaster at Chamoli, Indian Himalaya, Science, 373, 300, https://doi.org/10.1126/science.abh4455, 2021.
Terratec AS: Rapport for luftbåren laserskanning. Langfjordjøkelen 2018, 14 pp., 2018.
Terratec AS: Rapport for luftbåren laserskanning. Gråsubreen 2019, 14 pp., 2019a.
Terratec AS: Rapport for luftbåren laserskanning. Hellstugubreen-Memurubreen 2019, 14 pp., 2019b.
Toutin, T.: Three-dimensional topographic mapping with ASTER stereo data in rugged topography, IEEE T. Geosci. Remote, 40, 2241–2247, https://doi.org/10.1109/TGRS.2002.802878, 2002.
Wagnon, P., Brun, F., Khadka, A., Berthier, E., Shrestha, D., Vincent, C., Arnaud, Y., Six, D., Dehecq, A., Ménégoz, M., and Jomelli, V.: Reanalysing the 2007–19 glaciological mass-balance series of Mera Glacier, Nepal, Central Himalaya, using geodetic mass balance, J. Glaciol., 67, 117–125, https://doi.org/10.1017/jog.2020.88, 2021.
Willis, M. J., Herried, B. G., Bevis, M. G., and Bell, R. E.: Recharge of a subglacial lake by surface meltwater in northeast Greenland, Nature, 518, 223–227, 2015.
xDEM contributors: xDEM (0.0.18), Zenodo [code], https://doi.org/10.5281/zenodo.11204531, 2023.
Zemp, M., Thibert, E., Huss, M., Stumm, D., Rolstad Denby, C., Nuth, C., Nussbaumer, S. U., Moholdt, G., Mercer, A., Mayer, C., Joerg, P. C., Jansson, P., Hynek, B., Fischer, A., Escher-Vetter, H., Elvehøy, H., and Andreassen, L. M.: Reanalysing glacier mass balance measurement series, The Cryosphere, 7, 1227–1245, https://doi.org/10.5194/tc-7-1227-2013, 2013.


